Embed Size (px)
Citation preview

GENERATION CONNECTION
CAPACITY ASSESSMENT
OF THE 2022
TRANSMISSION NETWORK
(GCCA-2022)
June 2015

GCCA-2022 Disclaimer June 2015
DISCLAIMER
The publication of the Generation Connection Capacity Assessment of the 2022
Transmission Network (GCCA-2022) is to inform stakeholders of the potential
capacity available on the Eskom transmission network to facilitate connection of
generation projects. The Generation Connection Capacity Assessment is based on
the information currently available and is subject to change. The information
contained in this document does not constitute advice. It is a guideline to assist
stakeholders. Eskom Holdings SOC Limited makes no representations regarding the
suitability of the information to be used for any other purpose. All information is
provided “AS IS” without warranty of any kind and is subject to change without notice.
The entire risk arising out of its use remains with the recipient. In no event shall
Eskom Holdings SOC Limited be liable for any direct, consequential, incidental,
special, punitive, or any other damages whatsoever.
While the Generation Connection Assessment of the 2022 Transmission Network
(GCCA-2022) will be updated periodically, Eskom Holdings SOC Limited makes no
representation or warranty as to the accuracy, reliability, validity, or completeness of
the information in this document. Eskom does, however, endeavour to release the
Generation Connection Capacity Assessment based on the best available
information at its disposal at all times to ensure that the stakeholders are kept
informed about the developments in the transmission network. Thus, the information
contained in this document represents the most up-to-date information that was
available at the time it was released.
Eskom Transmission Division
Megawatt Park, Maxwell Drive, Sunninghill, Sandton
PO Box 1091, Johannesburg, 2000, South Africa
www.eskom.co.za
Eskom Holdings SOC Limited, Reg. No. 2002/015527/06

GCCA-2022 Page i June 2015
EXECUTIVE SUMMARY
The Generation Connection Capacity Assessment (GCCA) document was created in
response to the call from government to connect independent power producers
(IPPs) to the national electricity grid as part of the implementation of the Integrated
Resource Plan (IRP) 2010-2030, in particular, renewable energy. The IRP allocated
17 800 MW of solar and wind generation projects in line with the government’s
commitment to reduce emissions.
Two previous versions of the GCCA have been issued: one for the 2012
transmission network (GCCA-2012) and one for the 2016 network (GCCA-2016).
These provided the expected connection capacity at the busbars of the main
transmission system (MTS) substations based on the completion of approved
transmission projects by the respective years.
This version of the GCCA report takes a longer view of what potential generation
connection capacity could be available by 2022 (GCCA-2022). This is in response to
the success of the first four windows of the REIPPP, which already extend to
connections up to 2020. The next bid windows and other IPP procurement
programmes need to have an indication of what the capacities will be beyond 2020.
A number of other changes and improvements have also been made for this GCCA.
The GCCA-2022 now includes all the projects expected to be completed by 2022 as
contained in the TDP for the period 2015 to 2024 (issued October 2014). This is to
provide developers and investors with an indication of the potential available capacity
for the connection of new generation at or within the supply areas of the MTS
substations on the Eskom transmission network by 2022 based on the current TDP.
The status of the reinforcement projects at each MTS substation is indicated as
either approved or proposed, which must be taken into consideration when reviewing
the values of a specific MTS substation.
There is a significant change in the capacity calculation in that connection at the
distribution-level voltages does not require an N-1 connection. Thus, the full installed
transformer MVA capacity at an MTS substation is available for providing generation
connection capacity at the LV busbar. The HV busbar connection capacity and the

GCCA-2022 Page ii June 2015
connection capacity of the overall transmission supply area are still calculated taking
the N-1 criterion into account as before.
The generation connection capacity of the transmission supply areas that could be
available by 2022, assuming that the TDP is fully implemented, is shown in Figure A,
which indicates the relative connection capacity. The darker the shade of green, the
more connection capacity is available.
Figure A: The GCCA-2022 transmission supply area generation connection capacities
The biggest improvement in the GCCA-2022 is the creation of an interactive spatial
map in PDF format to accompany this document. This interactive PDF document
contains a number of different levels of information, which can be toggled on and off
on the map, to be displayed spatially. These levels include the existing and planned
transmission network, the location of the successful IPP bidders for all the REIPPP
rounds, the MTS substation supply areas, and the transmission supply areas. Also
included are the GCCA-2022 connection capacity values and other relevant
information, which can be accessed in tabular form on the PDF map.
GCCA-2022 Page iii June 2015
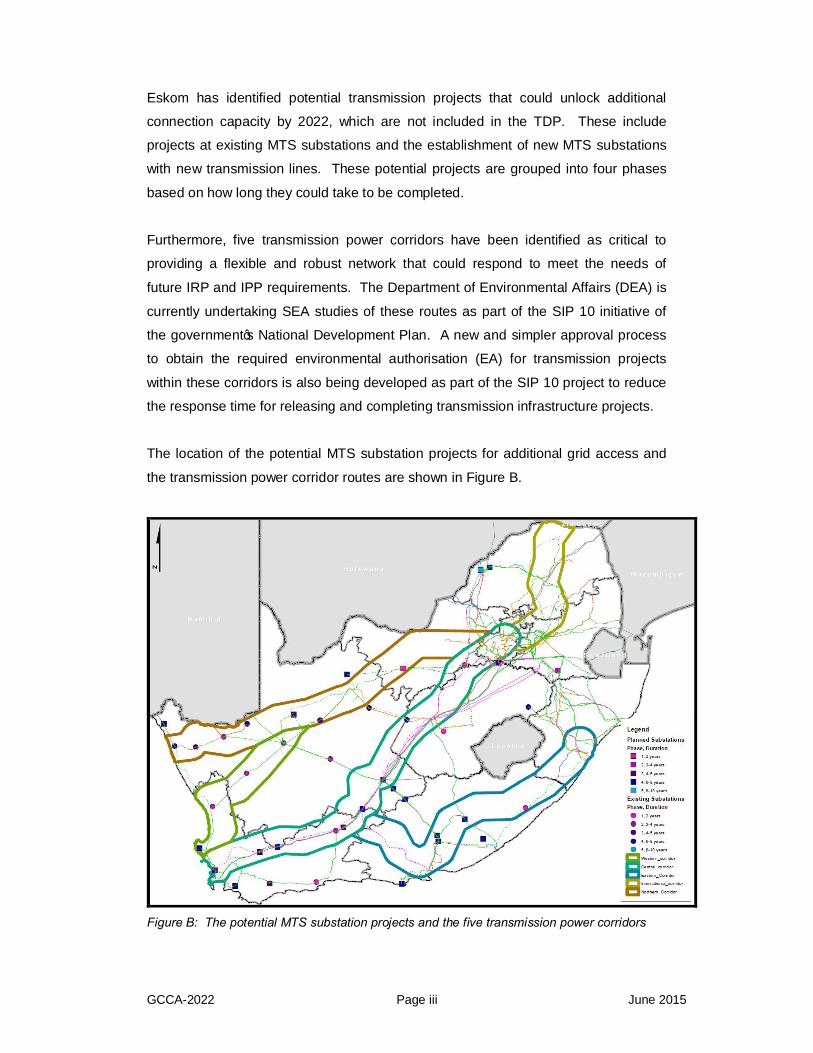
Eskom has identified potential transmission projects that could unlock additional
connection capacity by 2022, which are not included in the TDP. These include
projects at existing MTS substations and the establishment of new MTS substations
with new transmission lines. These potential projects are grouped into four phases
based on how long they could take to be completed.
Furthermore, five transmission power corridors have been identified as critical to
providing a flexible and robust network that could respond to meet the needs of
future IRP and IPP requirements. The Department of Environmental Affairs (DEA) is
currently undertaking SEA studies of these routes as part of the SIP 10 initiative of
the government’s National Development Plan. A new and simpler approval process
to obtain the required environmental authorisation (EA) for transmission projects
within these corridors is also being developed as part of the SIP 10 project to reduce
the response time for releasing and completing transmission infrastructure projects.
The location of the potential MTS substation projects for additional grid access and
the transmission power corridor routes are shown in Figure B.
Figure B: The potential MTS substation projects and the five transmission power corridors

GCCA-2022 Page iv June 2015
LIST OF ABBREVIATIONS
CSP Concentrating solar power
DEA Department of Environmental Affairs (Government of South Africa)
DoE Department of Energy (Government of South Africa)
GCCA Grid Connection Capacity Assessment
HV busbar High-voltage busbar of a substation (> 132 kV at transmission level)
IPP Independent power producer
IRP Integrated Resource Plan
LV busbar Low-voltage busbar of a substation (≤ 132 kV at transmission level)
MTS Main transmission system
MVAR Megavolt-ampere-reactive (power)
MW Megawatt (power)
N-0 System healthy condition of the network
N-1 Single contingency event on the network
NTC National Transmission Company
RE Renewable energy
TDP Transmission Development Plan
TNSP Transmission network service provider

GCCA-2022 Page v June 2015
CONTENTS EXECUTIVE SUMMARY
1 INTRODUCTION........................................................................................ 1
1.1 Context of the Generation Connection Capacity document ........................ 1
1.2 Structure of the document .......................................................................... 2
2 BACKGROUND ......................................................................................... 3
3 CHANGES AND IMPROVEMENTS IN THE GCCA-2022 ......................... 4
3.1 Inclusion of proposed transmission projects ............................................... 4
3.2 Calculation of the connection capacity ....................................................... 5
3.3 Interactive spatial PDF map ....................................................................... 5
3.4 Increase in connection capacity from 2016 to 2022 .................................... 6
4 METHODOLOGY AND INTERPRETATION ............................................. 8
4.1 Methodology of calculation ......................................................................... 8
4.2 Interpretation of the connection capacity value ........................................ 11
5 SUPPLY AREA CONNECTION CAPACITY ........................................... 13
5.1 The southern block .................................................................................. 15
5.2 The northern block ................................................................................... 19
5.3 The central block...................................................................................... 24
6 UNLOCKING OF ADDITIONAL GRID CONNECTION CAPACITY ........ 27
6.1 Additional transmission infrastructure projects ......................................... 27
6.2 SEA study of future transmission power corridors .................................... 28
7 THE INTERACTIVE SPATIAL PDF MAP ................................................ 31
8 DEFINITION OF A TRANSMISSION CONNECTION .............................. 34
APPENDIX A: MTS substations – transformer and generation connection capacity
APPENDIX B: MTS substations – potential transmission projects for additional grid access

GCCA-2022 Page 1 June 2015
1 INTRODUCTION
1.1 Context of the Generation Connection Capacity document
Eskom Holdings is the biggest producer of electricity in South Africa; it is also the
sole transmitter of electricity via a transmission network, which supplies electricity at
high voltages to a number of key customers and distributors. Eskom is a vertically
integrated company licensed to generate, transmit, and distribute electricity. The
transmission licence is held by Eskom Transmission, the transmission network
service provider (TNSP). Planning the transmission network is the responsibility of
the Grid Planning Department in the Transmission Division.
The intention of this document is to provide an indication of the available capacity for
the connection of new generation at the main transmission system (MTS) substations
on the Eskom transmission network that may be in service by 2022 based on both
approved and proposed new transmission infrastructure projects.
The capacity specifies both the MTS substation limits and the transmission backbone
limit for accumulated generation connection at the high-voltage (HV) busbars of the
MTS substations within a specific area. The grid is divided into 27 load supply areas,
and these supply areas are used as generation connection areas to assess how
much generation can be connected within each area. The capacities specified are
for steady-state power system conditions, as the expected 2022 grid configuration is
not known with enough confidence to undertake realistic transient stability studies.
However, the steady-state study values are considered to be appropriate for the
purposes of this report.
The provided values are not intended to be fixed specific connection capacities, as
each connection is unique, but rather to be used as a guideline to indicate the
potential for connecting to a specific point or area in the transmission network and
also to identify where network strengthening is required to unlock the network
capacity to integrate more IPPs in areas with high generation resource availability.
The steady-state results provide the projected available capacity at the MTS
substations and at an area level based on the approved and proposed transmission
projects contained in the Transmission Development Plan (TDP) for the period 2015
to 2024, as issued in 2014. The MTS substation results of this study can be used to

GCCA-2022 Page 2 June 2015
assess the MW capacity that can be connected at each MTS substation under
system healthy conditions (N-0 condition) and the total capacity that a supply area
can handle without violating the Grid Code N-1 (single contingency) reliability limits.
There is a companion interactive PDF map document, entitled GCCA-2022 Spatial
Map, that can be downloaded, which provides the generation connection capacity
assessment results and other network information in a spatial format. The geospatial
database file, GCCA-2022_Spatial_Map_Database, can also be downloaded for use
with GIS software by interested parties.
1.2 Structure of the document
The GCCA-2022 document is structured as follows:
Chapter 2 provides the background to the study and the scope of the study.
Chapter 3 highlights the changes and improvements from the GCCA-2016 report
and shows the potential increase in connection capacity by 2022.
Chapter 4 outlines the methodology employed in the study and how the results are
presented and should be interpreted.
Chapter 5 provides an overview of the generation connection capacity and lists the
MTS substations with their respective transmission supply areas.
Chapter 6 describes how additional grid connection capacity could be unlocked,
including the development of major transmission power corridors.
Chapter 7 explains how to use the interactive spatial PDF map document that can be
downloaded separately, entitled GCCA-2022 Spatial Map.pdf.
Chapter 8 gives the definition of the transmission connection to an MTS substation.
Appendix A contains the tables with the generation connection capacity results at
each MTS substation per supply area, giving both the current 2015 installed
transformer capacity and the planned 2022 installed transformer capacity, as well as
the HV busbar steady-state limits, at the MTS substation and supply area.
Appendix B provides the list of potential transmission projects that could provide
additional grid access capacity outside of the TDP projects.

GCCA-2022 Page 3 June 2015
2 BACKGROUND
The Generation Connection Capacity Assessment (GCCA) document was created in
response to the call from government to connect independent power producers
(IPPs) to the national electricity grid as part of the implementation of the Integrated
Resource Plan of 2010 (IRP2010), in particular, renewable energy.
The first GCCA document released was in early 2011 for the 2012 transmission grid
(GCCA-2012) to assist with the first bid window of the REBID programme. This
document initially only covered the Cape provinces due to time constraints and
prioritisation of the locations from which enquiries had been directed. The focus was
on what could be connected to the low-voltage (LV) busbars of the main transmission
system (MTS) substations.
A second version was released in 2013 for the transmission grid expected to be in
place by 2016 (GCCA-2016), but the entire country was now included. The focus
was on what generation could be connected to the high-voltage (HV) busbars at the
MTS substations without the limitations of the transformers. The requirement was
that the transmission grid had to still meet the single contingency condition (N-1)
criteria of the Grid Code.
This version of the GCCA report now takes a longer view of what potential generation
connection capacity could be available by 2022 (GCCA-2022). This is in response to
the success of the first four windows of the REIPPP, which already extend to
connections up to 2020. The next bid windows need to have an indication of what
the capacities will be beyond 2020; thus, not only confirmed and approved new
projects, but also proposed new projects need to be indicated.
A number of other changes and improvements have been made from the previous
GCCA document to provide better information regarding the potential for increased
generation connection capacity in the future to meet the needs of the IRP and the
electricity power industry. These include an interactive spatial PDF map and the
identification of potential transmission projects to increase grid access that are not
currently included in any development plans.
GCCA-2022 Page 4 June 2015
3 CHANGES AND IMPROVEMENTS IN THE GCCA-2022
This chapter deals with the changes and improvements that have been made from
the previous GCCA document, GCCA-2016, to produce this new GCCA document,
the GCCA-2022 report. The main differences are as follows:
• Future proposed projects are now also taken into consideration, in addition to
approved projects.
• The calculation of the connection capacity at the LV busbar uses the full
installed transformer capacity and not the single contingency (N-1) value.
• The N-1 criterion is only applied to the HV busbar to determine what power
can be evacuated from the MTS substation at transmission level.
• An interactive PDF map, which shows all the information and results in a
spatial format, is included as a companion document to this report.
The potential improvement in overall connection capacity from 2016 to 2022 is
illustrated, and a list of other projects not yet included in the TDP that could further
increase grid connection capacity is described.
3.1 Inclusion of proposed transmission projects
The GCCA-2022 now includes all the projects expected to be completed by 2022 as
contained in the TDP for the period 2015 to 2024, which was issued in October 2014.
The status of the reinforcement projects at each MTS substation is indicated as
either approved or proposed, which must be taken into consideration when reviewing
the values of a specific MTS substation.
The objective is to provide developers and investors with an indication of the
potential available capacity for the connection of new generation at or within the
supply areas of the MTS substations on the Eskom transmission network by 2022
based on the current TDP.
Furthermore, there have been discussions between Eskom and the DoE regarding
the creation of additional grid access for new RE and other IPP plants for future IPP
procurement programmes. Eskom Grid Planning has identified a number of potential
transmission projects, which could unlock additional connection capacity by 2022,

GCCA-2022 Page 5 June 2015
that are not included in the TDP, as their requirement has not yet been confirmed or
agreed to. These projects include works at existing MTS substations as well as the
establishment of new MTS substations with new transmission lines. These potential
projects can be undertaken in phases, which are also discussed and identified in
Chapter 6 of this GCCA report. The objective of including this information is to
indicate to IPP developers what possibilities exist outside of the TDP list of projects.
3.2 Calculation of the connection capacity
The most significant change in the capacity calculation is that connection at the lower
distribution-level voltages does not require an N-1 connection. Thus, the full installed
transformer MVA capacity at an MTS substation is available for providing generation
connection capacity.
Previously, the outputs of the connecting IPP generation plants were assumed to be
at a unity power factor; however, to give a more realistic view, a power factor of 0.98
will be applied to make allowance for actual output of the connecting IPP plants. This
means that a power factor of 0.98 will be applied to the installed transformer MVA
values to provide a MW connection capacity value at the MTS substation.
This MW connection value is at the LV busbar of the MTS substation, which, in this
report, refers to the distribution-level voltages. These include voltage levels of 66 kV,
88 kV, and 132 kV (in some cases, 220 kV is also included) and are not to be
confused with the lower LV connection voltage levels of 11 kV, 22 kV, and 33 kV.
The calculation of the HV busbar MW connection capacity at the MTS substations
and the overall transmission supply area connection capacity is done taking the N-1
criterion into account, the same way as in the previous GCCA-2016 document.
However, only the steady-state connection values are calculated, as explained in
more detail in Chapter 4.
3.3 Interactive spatial PDF map
The biggest improvement in the GCCA-2022 is the creation of an interactive spatial
map in PDF format to accompany this report. This interactive PDF document
contains a number of different levels of information, which can be toggled on and off

GCCA-2022 Page 6 June 2015
on the map, to be displayed spatially. These levels include the existing transmission
network, the planned transmission projects, the location of the successful IPP
bidders for all the REIPPP rounds, the MTS substation supply areas, and the
transmission supply areas, among others.
Also included are the GCCA-2022 capacity values and other relevant information in
tabular form, which can be accessed under the model tree function of the PDF map.
Further explanation of what information is contained and how to access it is provided
in Chapter 6.
This interactive PDF map will allow potential developers and investors considering
IPP projects to interrogate the map spatially to address their own particular issues
when investigating their options.
3.4 Increase in connection capacity from 2016 to 2022
The calculation of the connection capacity for the transmission supply areas at the
HV busbar MTS level was undertaken using the same methodology in both the
GCCA-2016 and GCCA-2022 documents. Therefore, it is possible to compare the
expected 2016 capacities with the potential 2022 capacities. This will show the
increase in the overall transmission supply area capacities that could be realised with
the full implementation of the TDP.
This comparison will show the IPP developers where the future increased capacity is
likely to be as well as identify areas where there is insufficient future transmission
capacity, which should be unlocked. Analysis of the 2022 results can indicate where
proposed transmission projects should be actively supported and where new
transmission projects should be seriously considered.
The maps of the generation connection capacity of the transmission supply areas for
the 2016 and 2022 networks are shown in Figures 3.1 and 3.2, respectively. The
shading of the transmission supply areas indicates the relative connection capacity.
The darker the green shade, the more connection capacity is available.

GCCA-2022 Page 7 June 2015
Figure 3.1: GCCA-2016 transmission supply area generation connection capacities
Figure 3.2: GCCA-2022 transmission supply area generation connection capacities

GCCA-2022 Page 8 June 2015
4 METHODOLOGY AND INTERPRETATION
This chapter explains how the generation connection capacities were calculated for
the MTS substations and how these values can be interpreted.
4.1 Methodology of calculation
Connection capacity is determined by the available transmission infrastructure in
service for a proposed generation project to connect to, and then transport the
generated power to, the loads. The document considers the connection capacity that
could be available on the transmission grid for the year 2022, taking into account the
transmission infrastructure that is expected to be in service in 2022 based on the
approved TDP for the period 2015 to 2024.
The distribution infrastructure is not considered in this document due to the sheer
volume of infrastructure and rapid changes that can be implemented at the lower
voltages. All generation integration requirements will have to be considered at a
local level, and the direct connections can, in general, be implemented relatively
quickly. The real issue is how much generation can be integrated and transported to
where it is required at the transmission level, which this document addresses.
What the Transmission Connection Capacity document provides is the overall
capacity that can be absorbed at a specific MTS connection point without any
additional reinforcement required (that is, projects not included in the TDP), either
directly connected to the MTS substation or via the distribution network supplied by
the MTS substation – in other words, the indicative capacity for connecting new
generation within the geographical supply area of that particular MTS substation.
To determine the connection capacity at the MTS substations, certain assumptions
were made regarding the potential allocation of the downstream load. Essentially,
any new generation will first supply the local load within the supply area of the MTS
substation, and the excess will be sent into the transmission network via the MTS
substation transformers.

GCCA-2022 Page 9 June 2015
Based on the total MVA of the installed transformers at an MTS substation, the MW
installed capacity is calculated by applying the 0.98 power factor. This is done for
each LV busbar at the MTS substation, that is, for each set of transformation if there
are multiple voltage levels, for example, 400/132 kV and 400/88 kV. If each LV
busbar is supplied separately from the HV busbar, the total MW capacities are added
to provide the overall installed MW capacity value. Should the LV busbars be
connected cascading, for example, 400/132 kV and 132/66 kV, then only the LV
capacity directly connected to the HV busbar is considered as the installed MW
capacity.
The available capacity is calculated on a conservative basis by first adding the
expected MW low load at the MTS substation to the installed MW capacity value and
then subtracting the MW value of any successful IPP generation projects from the
REIPPP programmes allocated within the supply area of this substation. This
includes all the IPP projects from Bid Windows 1, 2, 3, and 3.5, as well the IPP
projects of the preferred bidders for Bid Window 4, up to and including the extended
Bid Window 4B list released on 7 June 2015.
This MW value is referred to as the “LV busbar connection capacity” of the MTS
substation. Two values are provided in the results tables: one for existing 2015
installed transformer capacity and one for the expected installed transformer capacity
by 2022.
In the case where the LV voltage is a transmission-level voltage of 400 kV or 275 kV,
for example, 765/400 kV and 400/275 kV transformers, the connection capacity is
specified as zero, as these are main system substations with no local load
connected. Connection of IPPs at these voltage levels requires specialised
considerations unique to each MTS site. Similarly, the LV busbar connection
capacity at an existing Eskom power station is shown as zero, as it is preferred to not
connect new generation at the LV busbar of these sites, but connection to the HV
busbar is not excluded.
In keeping with the Grid Code requirement of when a generation plant of more than
1 000 MW is integrated, it being necessary to confirm that the network will remain
stable for the loss of a second transmission line after an N-1 transmission line
contingency, the maximum connection at an MTS substation has been limited to
1 000 MW for the GCCA-2022. The potential and viability of connecting an

GCCA-2022 Page 10 June 2015
accumulated generation total of more than a 1 000 MW at a single substation would
require a detailed network study with a high certainty of generation configuration and
is beyond the scope of this report.
The potential of increasing the connection capacity beyond the 2022 installed
transformer value was also investigated. In this case, it is dependent on how much
power can be evacuated from the MTS substation HV busbar or at the transmission
level, and thus, the N-1 criteria must be applied. This provides the expected firm
connection capacity in 2022 at the HV busbar of the MTS substation, which generally
exceeds the 2022 MV connection capacity, but, in many cases, is lower. Thus, an
individual “HV busbar connection capacity value” was determined for each MTS
substation.
However, the MTS substation is connected within a Transmission load supply area
system, 27 in total, and the limit of the supply area dictates the potential limit at the
individual MTS substation. The limit at each MTS substation within a supply area
provides an indication of the proportional allocation of the supply area limit to the
substations. The studies were then rerun, increasing the generation of the supply
area with each substation at its relative proportional contribution until the area N-1
limit was reached. This provided an area “HV busbar connection capacity value” for
each MTS substation in the supply area. This area value was compared with the
individual value and the lower value selected as the applicable generation connection
capacity for the HV busbar at that MTS substation. In all cases, the individual value
was the lower.
This MW value is referred to as the “HV busbar connection capacity” of the MTS
substation. It is only provided for the 2022 year in the results tables.
As the individual HV busbar connection capacity values for each MTS substation
were the lower values, the actual area connection capacity value for a specific supply
area is determined by the sum of the MTS substation individual limits within the
supply area. This value is the HV busbar steady-state limit for the supply area.
The expected 2022 grid and generation configuration is not known with enough
confidence to undertake realistic transient stability studies. It must be noted that the
transient stability studies could reduce the overall connection capacity limit for a

GCCA-2022 Page 11 June 2015
Transmission supply area. However, the steady-state study values are considered to
be appropriate as a guideline for the purposes of this report.
This MW value is referred to as the “supply area HV busbar steady-state limit” of
the specific supply area. It is only provided for the 2022 year in the results tables.
It must be noted that the cumulative impact of the Transmission supply areas will
result in further limitations on the steady-state limits when considering a grouping of
adjacent Transmission supply areas. The actual reduction in connection capacity is
very dependent on the spread of the new generation and the actual configuration of
the transmission networks within and between these supply areas. This is beyond the
scope of this document due to the high number of possible configuration
combinations. However, the issue can be resolved by the further strengthening of
the backbone transmission network within the future power corridors which are
addressed in Chapter 6 of this document.
4.2 Interpretation of the connection capacity value
Based on the connection capacity of a specific MTS substation, a developer should
be able to make a high-level assessment of what is likely to be required to connect its
generation project to this point on the Eskom transmission network.
This would be done by first identifying in which MTS substation supply area the
generation project would be located and relating it to the approximate distance to that
MTS substation or the nearest distribution substation within that supply area. The
maps indicating the supply areas and the list of MTS substation names within each
supply area are provided in Chapter 5 as well as on the interactive spatial PDF map.
Then, using the proposed total MW output of the generation plant, the connection
requirements and timing assessment can be done as follows:
Project MW output less than MTS connection capacity The generation project should be able to connect to the transmission network without
any additional deep transformation reinforcement required. Only shallow connection
works should be required, either via the distribution network or connecting directly to
the HV or MV busbar of the MTS substation.

GCCA-2022 Page 12 June 2015
Project MW output around MTS connection capacity If the generation project MW output is of the same order as the MTS substation
connection capacity, around ± 10% variation, then the project may be able to be
connected without any additional deep reinforcement required and with only shallow
connection works required.
Project MW output greater than MTS connection capacity The generation project will not be able to connect without some form of additional
deep transmission reinforcement (for example, transmission line, transformer)
required in addition to the shallow connection works. The deep reinforcement is
likely to place a time constraint for connecting the generation plant project,
depending on the nature and size of the transmission reinforcement works required.

GCCA-2022 Page 13 June 2015
5 SUPPLY AREA CONNECTION CAPACITY
The transmission grid is divided into 27 supply areas that are used to conduct the
load forecast, and those areas have a certain number of MTS substations supplied
by them. The supply areas cross provincial boundaries in some cases because
these areas are related to the networks from which they are supplied.
In Figure 5.1, the grid layout with all the transmission supply areas shaded is given,
and the internal borders between the MTS substation supply areas are indicated.
The supply areas and MTS substations are not labelled on this map, but rather
labelled on maps of large blocks of supply areas discussed in the subsections
following. To make it easier to identify the relevant MTS substation, the transmission
grid map is broken down into three large blocks, namely, a southern block, a northern
block, and a central block encompassing the greater Gauteng area.
Figure 5.1: Main transmission system grid with transmission supply areas shaded
The MTS substation names and their allocated supply areas are indicated on the
maps of the three blocks to make it easier to identify them. Each map block is shown

GCCA-2022 Page 14 June 2015
separately below with a table listing the MTS substation names along with the name
of the relevant transmission supply area, province, and voltage levels.
A developer can locate the site of its potential IPP plant on the map, identify the
relevant MTS substation supply area, and from the table determine the associated
transmission supply area. In Appendix A, there are tables with detailed information
on the MTS substations, which are grouped by transmission supply area. The MTS
substation groupings are presented in alphabetical order of the transmission supply
areas.
The MTS substation tables in Appendix A provide the following information:
Supply Area The name of the supply area
Province The name of the province in which the MTS substation is located
Substation The name of the MTS substation
Transformer Voltages The transformer voltage levels in the MTS substation
2015 No. of Trfrs The number of transformers of a specific voltage level and size in the MTS substation at the end of the year 2015
2015 Trfr Size (MVA) The MVA unit size of transformers of a specific voltage level in the MTS substation at the end of the year 2015
2015 Installed Transformer MVA
The total installed transformer MVA of a specific voltage level and size in the MTS substation at the end of the year 2015
Year of Trfr Upgrade Year when new transformers are expected to be installed in the MTS substation
Upgrade Status The project status of the upgrade, either approved with funding or proposed as in the TDP for 2015 to 2024
2022 No. of Trfrs The number of transformers of a specific voltage level and size in the MTS substation at the end of the year 2022
2022 Trfr Size (MVA) The MVA unit size of transformers of a specific voltage level in the MTS substation at the end of the year 2022
2022 Installed Transformer MVA
The total installed transformer MVA of a specific voltage level and size in the MTS substation at the end of the year 2022
2022 LV Busbar Connection Capacity (MW)
The available generation connection capacity at the LV busbar (132 kV or 88 kV or 66 kV) at the MTS at the end of the year 2022
2022 HV Busbar Connection Capacity (MW)
The generation connection capacity limit at the HV busbar (275 kV or 400 kV) at the MTS at the end of the year 2022
2022 Supply Area HV Busbar Steady-state Limit (MW)
The overall generation connection capacity limit of all the MTS substations within the supply area at the end of the year 2022
GCCA-2022 Page 15 June 2015
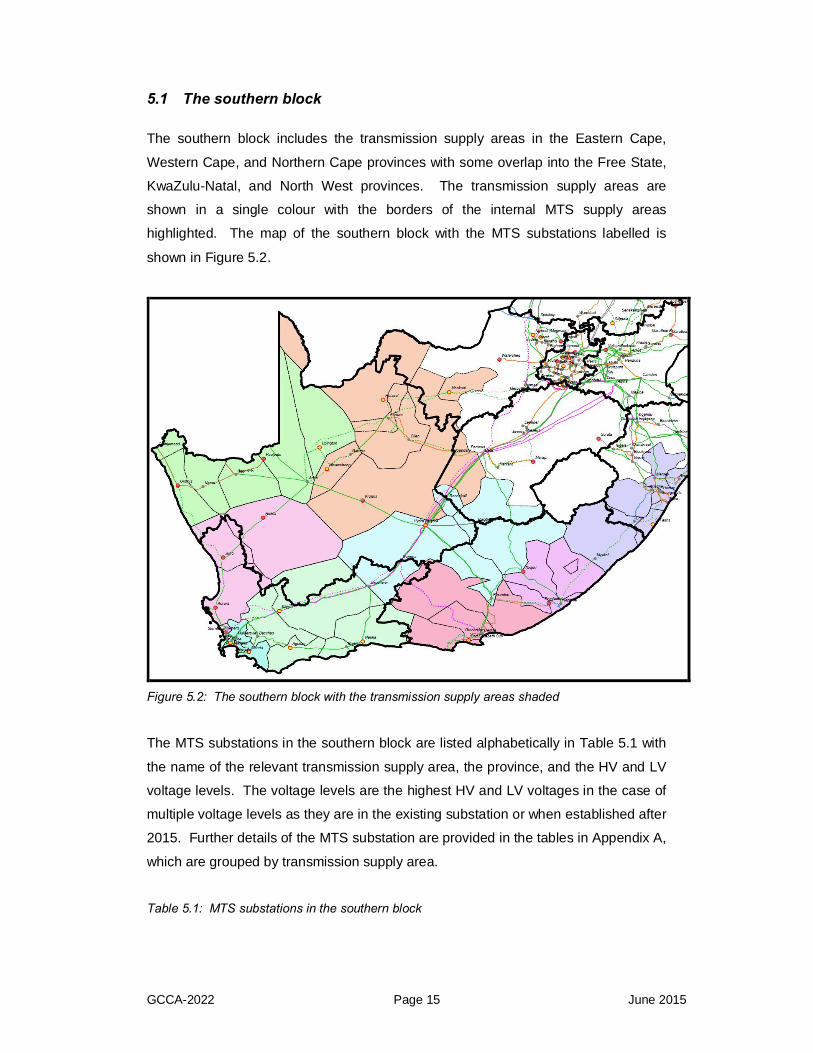
5.1 The southern block
The southern block includes the transmission supply areas in the Eastern Cape,
Western Cape, and Northern Cape provinces with some overlap into the Free State,
KwaZulu-Natal, and North West provinces. The transmission supply areas are
shown in a single colour with the borders of the internal MTS supply areas
highlighted. The map of the southern block with the MTS substations labelled is
shown in Figure 5.2.
Figure 5.2: The southern block with the transmission supply areas shaded
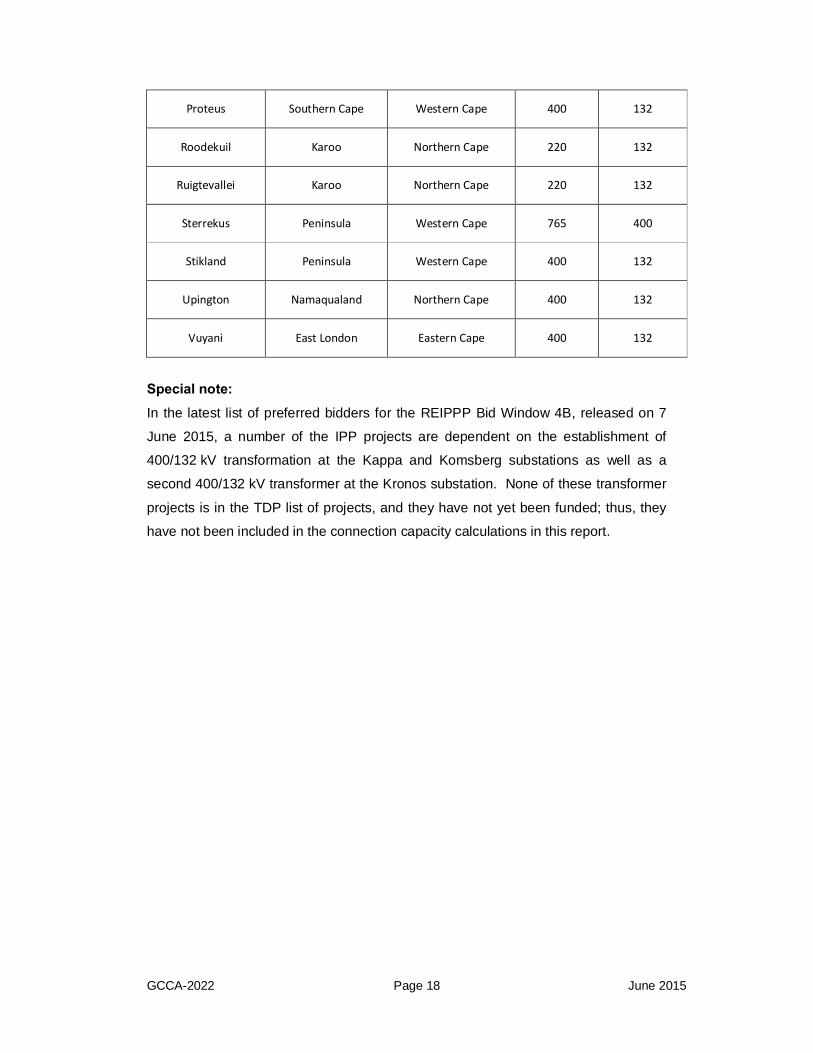
The MTS substations in the southern block are listed alphabetically in Table 5.1 with
the name of the relevant transmission supply area, the province, and the HV and LV
voltage levels. The voltage levels are the highest HV and LV voltages in the case of
multiple voltage levels as they are in the existing substation or when established after
2015. Further details of the MTS substation are provided in the tables in Appendix A,
which are grouped by transmission supply area.
Table 5.1: MTS substations in the southern block

GCCA-2022 Page 16 June 2015
Substation name Transmission supply area Province HV busbar
voltage (kV) LV busbar
voltage (kV)
Acacia Peninsula Western Cape 400 132
Aggeneis Namaqualand Northern Cape 400 220
Agulhas Southern Cape Western Cape 400 132
Aries Namaqualand Northern Cape 400 22
Asteria Peninsula Western Cape 400 132
Aurora West Coast Western Cape 400 132
Bacchus Southern Cape Western Cape 400 132
Beta Bloemfontein Free State 765 400
Boundary Kimberley Northern Cape 275 132
Dedisa Port Elizabeth Eastern Cape 400 132
Delphi East London Eastern Cape 400 132
Droërivier Southern Cape Western Cape 400 132
Erica Peninsula Western Cape 400 132
Ferrum Kimberley Northern Cape 400 132
Gamma Karoo Northern Cape 400 132
Garona Kimberley Northern Cape 275 132
Grassridge Port Elizabeth Eastern Cape 400 132
Gromis Namaqualand Northern Cape 400 220
Harvard Bloemfontein Free State 275 132
Helios West Coast Northern Cape 400 132
Hotazel Kimberley Northern Cape 400 132

GCCA-2022 Page 17 June 2015
Hydra Karoo Northern Cape 400 132
Hydra B Karoo Northern Cape 400 132
Juno West Coast Western Cape 400 132
Kappa Southern Cape Western Cape 765 400
Koeberg West Coast Western Cape 400 132
Kronos Karoo Northern Cape 400 132
Merapi Bloemfontein Free State 275 132
Mookodi Kimberley Northern Cape 400 132
Muldersvlei Peninsula Western Cape 400 132
Nama Namaqualand Northern Cape 220 66
Narina Southern Cape Western Cape 400 132
Neptune East London Eastern Cape 400 132
Nieuwehoop Namaqualand Northern Cape 400 132
Olien Kimberley Northern Cape 275 132
Oranjemond Namaqualand Northern Cape 220 66
Paulputs Namaqualand Northern Cape 220 132
Pembroke East London Eastern Cape 220 132
Perseus Bloemfontein Free State 400 275
Philippi Peninsula Western Cape 400 132
Pinotage Peninsula Western Cape 400 132
Port Elizabeth Sub Port Elizabeth Eastern Cape 400 132
Poseidon Port Elizabeth Eastern Cape 400 132
GCCA-2022 Page 18 June 2015
Proteus Southern Cape Western Cape 400 132
Roodekuil Karoo Northern Cape 220 132
Ruigtevallei Karoo Northern Cape 220 132
Sterrekus Peninsula Western Cape 765 400
Stikland Peninsula Western Cape 400 132
Upington Namaqualand Northern Cape 400 132
Vuyani East London Eastern Cape 400 132
Special note: In the latest list of preferred bidders for the REIPPP Bid Window 4B, released on 7
June 2015, a number of the IPP projects are dependent on the establishment of
400/132 kV transformation at the Kappa and Komsberg substations as well as a
second 400/132 kV transformer at the Kronos substation. None of these transformer
projects is in the TDP list of projects, and they have not yet been funded; thus, they
have not been included in the connection capacity calculations in this report.
GCCA-2022 Page 19 June 2015
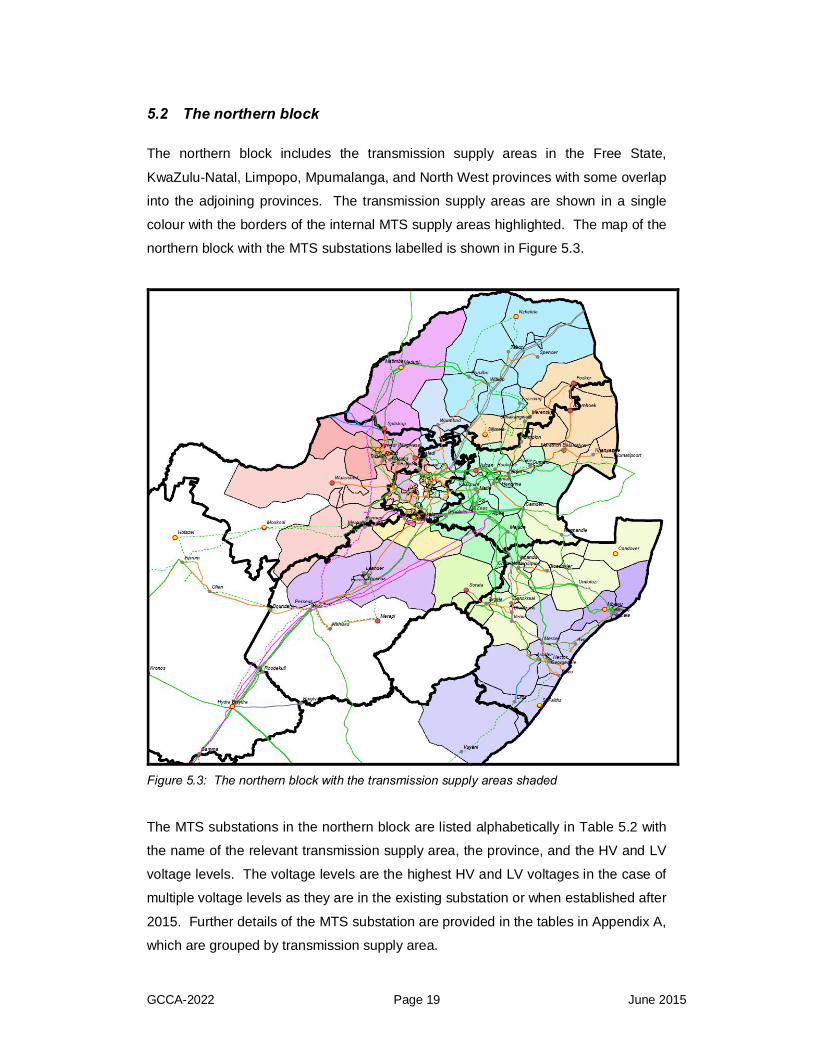
5.2 The northern block
The northern block includes the transmission supply areas in the Free State,
KwaZulu-Natal, Limpopo, Mpumalanga, and North West provinces with some overlap
into the adjoining provinces. The transmission supply areas are shown in a single
colour with the borders of the internal MTS supply areas highlighted. The map of the
northern block with the MTS substations labelled is shown in Figure 5.3.
Figure 5.3: The northern block with the transmission supply areas shaded
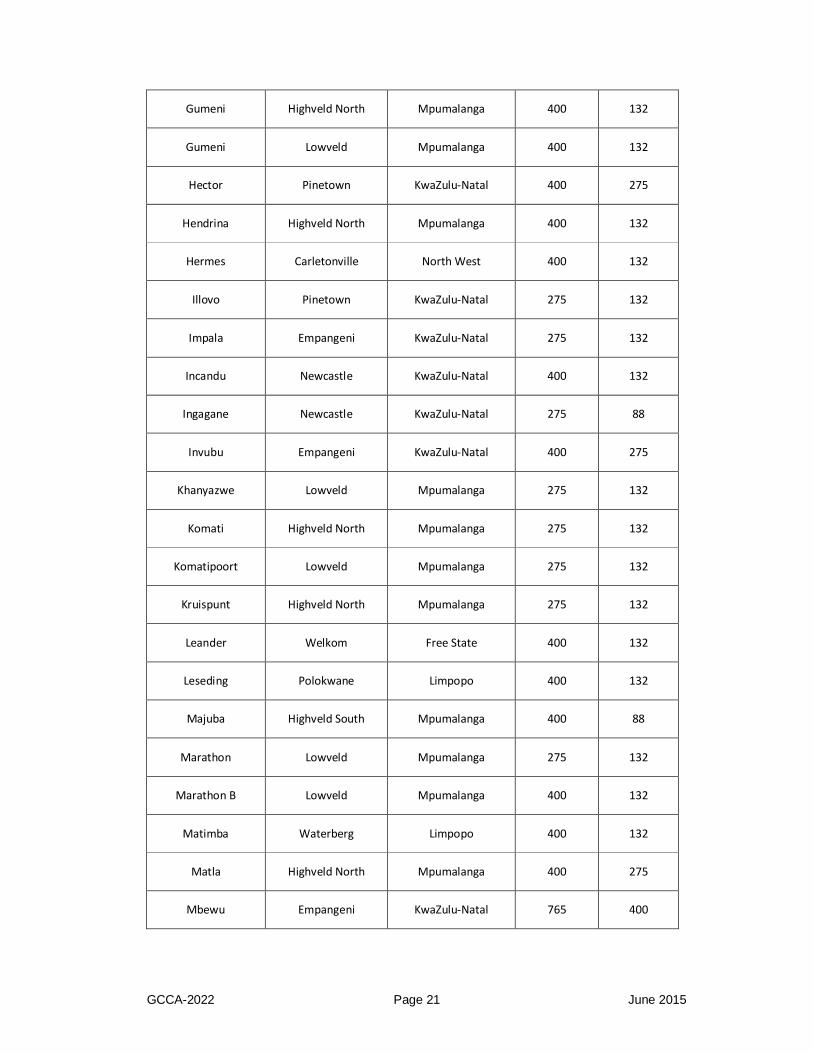
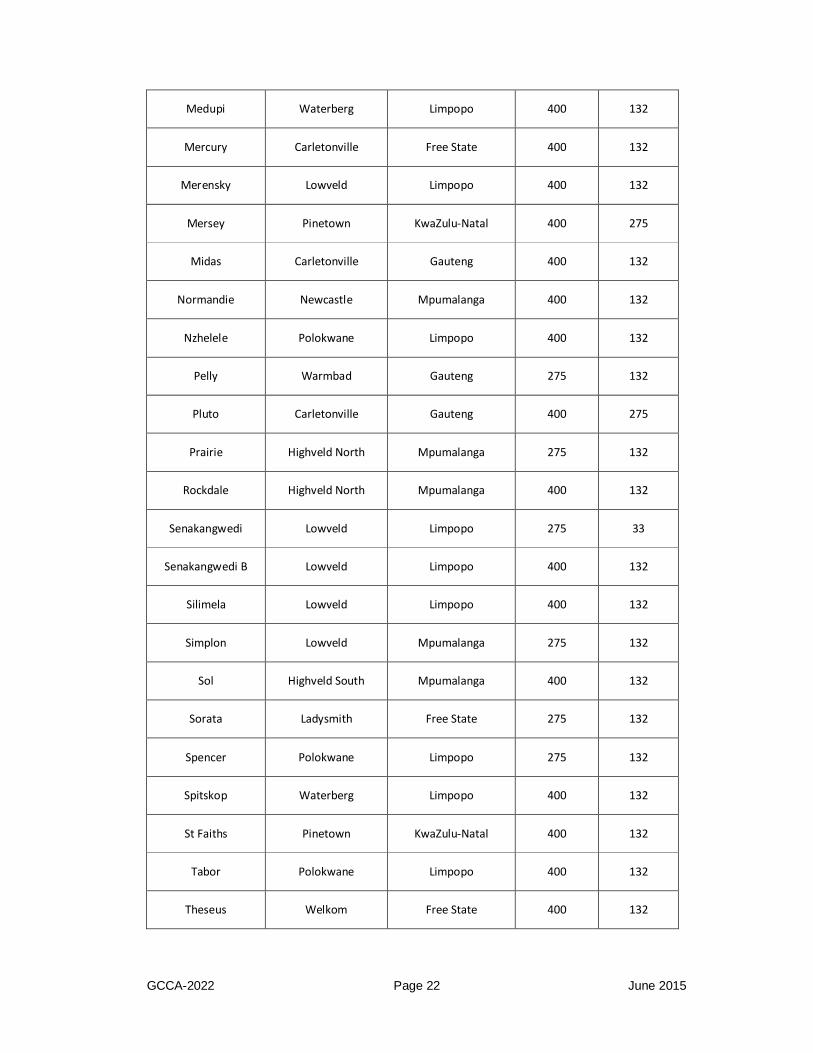
The MTS substations in the northern block are listed alphabetically in Table 5.2 with
the name of the relevant transmission supply area, the province, and the HV and LV
voltage levels. The voltage levels are the highest HV and LV voltages in the case of
multiple voltage levels as they are in the existing substation or when established after
2015. Further details of the MTS substation are provided in the tables in Appendix A,
which are grouped by transmission supply area.

GCCA-2022 Page 20 June 2015
Table 5.2: MTS substations in the northern block
Substation name Transmission supply area Province HV busbar
voltage (kV) LV busbar
voltage (kV)
Acornhoek Lowveld Limpopo 275 132
Alpha Highveld South Mpumalanga 765 400
Ariadne Pinetown KwaZulu-Natal 400 132
Arnot Highveld North Mpumalanga 400 275
Athene Empangeni KwaZulu-Natal 400 132
Avon Pinetown KwaZulu-Natal 275 132
Bloedrivier Newcastle KwaZulu-Natal 275 88
Bloukrans Ladysmith KwaZulu-Natal 275 132
Borutho Polokwane Limpopo 400 132
Camden Highveld South Mpumalanga 400 275
Candover Newcastle KwaZulu-Natal 400 132
Carmel Carletonville Gauteng 275 132
Chivelston Newcastle KwaZulu-Natal 400 275
Danskraal Ladysmith KwaZulu-Natal 275 132
Eros Pinetown KwaZulu-Natal 400 132
Everest Welkom Free State 275 132
Foskor Lowveld Limpopo 275 132
Georgedale Empangeni KwaZulu-Natal 132 88
Georgedale Pinetown KwaZulu-Natal 275 132
Grootvlei Highveld South Mpumalanga 400 88
GCCA-2022 Page 21 June 2015
Gumeni Highveld North Mpumalanga 400 132
Gumeni Lowveld Mpumalanga 400 132
Hector Pinetown KwaZulu-Natal 400 275
Hendrina Highveld North Mpumalanga 400 132
Hermes Carletonville North West 400 132
Illovo Pinetown KwaZulu-Natal 275 132
Impala Empangeni KwaZulu-Natal 275 132
Incandu Newcastle KwaZulu-Natal 400 132
Ingagane Newcastle KwaZulu-Natal 275 88
Invubu Empangeni KwaZulu-Natal 400 275
Khanyazwe Lowveld Mpumalanga 275 132
Komati Highveld North Mpumalanga 275 132
Komatipoort Lowveld Mpumalanga 275 132
Kruispunt Highveld North Mpumalanga 275 132
Leander Welkom Free State 400 132
Leseding Polokwane Limpopo 400 132
Majuba Highveld South Mpumalanga 400 88
Marathon Lowveld Mpumalanga 275 132
Marathon B Lowveld Mpumalanga 400 132
Matimba Waterberg Limpopo 400 132
Matla Highveld North Mpumalanga 400 275
Mbewu Empangeni KwaZulu-Natal 765 400
GCCA-2022 Page 22 June 2015
Medupi Waterberg Limpopo 400 132
Mercury Carletonville Free State 400 132
Merensky Lowveld Limpopo 400 132
Mersey Pinetown KwaZulu-Natal 400 275
Midas Carletonville Gauteng 400 132
Normandie Newcastle Mpumalanga 400 132
Nzhelele Polokwane Limpopo 400 132
Pelly Warmbad Gauteng 275 132
Pluto Carletonville Gauteng 400 275
Prairie Highveld North Mpumalanga 275 132
Rockdale Highveld North Mpumalanga 400 132
Senakangwedi Lowveld Limpopo 275 33
Senakangwedi B Lowveld Limpopo 400 132
Silimela Lowveld Limpopo 400 132
Simplon Lowveld Mpumalanga 275 132
Sol Highveld South Mpumalanga 400 132
Sorata Ladysmith Free State 275 132
Spencer Polokwane Limpopo 275 132
Spitskop Waterberg Limpopo 400 132
St Faiths Pinetown KwaZulu-Natal 400 132
Tabor Polokwane Limpopo 400 132
Theseus Welkom Free State 400 132

GCCA-2022 Page 23 June 2015
Tugela Ladysmith KwaZulu-Natal 275 132
Umfolozi Newcastle KwaZulu-Natal 400 88
Venus Ladysmith KwaZulu-Natal 400 275
Vulcan Highveld North Mpumalanga 400 132
Warmbad Warmbad Limpopo 275 132
Watershed Carletonville North West 275 132
Witkop Polokwane Limpopo 400 132
Zeus Highveld South Mpumalanga 765 400

GCCA-2022 Page 24 June 2015
5.3 The central block
The central block is all the transmission supply areas in the Gauteng province with
their overlap into the adjoining provinces. The transmission supply areas are shown
in a single colour with the borders of the internal MTS supply areas highlighted. The
map of the central block with the MTS substations labelled is shown in Figure 5.4.
Figure 5.4: The central block with the transmission supply areas shaded
The MTS substations in the central block are listed alphabetically in Table 5.3 with
the name of the relevant transmission supply area, the province, and the HV and LV
voltage levels. The voltage levels are the highest HV and LV voltages in the case of
multiple voltage levels as they are in the existing substation or when established after
2015. Further details of the MTS substation are provided in the tables in Appendix A,
which are grouped by transmission supply area.

GCCA-2022 Page 25 June 2015
Table 5.3: MTS substations in the central block
Substation name Transmission supply area Province HV busbar
voltage (kV) LV busbar
voltage (kV)
Apollo Pretoria Gauteng 400 275
Ararat Rustenburg North West 275 88
Benburg Nigel Gauteng 275 132
Bernina West Rand Gauteng 275 132
Bighorn Rustenburg North West 400 132
Brenner Nigel Gauteng 275 88
Craighall Johannesburg Gauteng 275 88
Croydon Johannesburg Gauteng 275 132
Demeter West Rand Gauteng 400 88
Dinaledi Pretoria North West 400 132
Eiger Johannesburg Gauteng 275 88
Esselen Johannesburg Gauteng 275 132
Etna West Rand Gauteng 275 88
Glockner Vaal Triangle Gauteng 400 275
Hera West Rand Gauteng 400 275
Jupiter Johannesburg Gauteng 275 88
Kookfontein Vaal Triangle Gauteng 275 88
Kyalami Johannesburg Gauteng 400 132
Lepini Johannesburg Gauteng 275 88
Lomond Pretoria North West 275 88

GCCA-2022 Page 26 June 2015
Lulamisa Johannesburg Gauteng 400 88
Makalu Vaal Triangle Free State 275 88
Makalu B Vaal Triangle Free State 275 88
Marang Rustenburg North West 400 88
Marang B Rustenburg North West 400 132
Minerva Pretoria Gauteng 400 275
Nevis Nigel Gauteng 275 132
Ngwedi (Mogwase) Rustenburg North West 400 132
North Rand Johannesburg Gauteng 275 132
Olympus Vaal Triangle Gauteng 275 132
Pieterboth Nigel Gauteng 275 132
Princess West Rand Gauteng 275 88
Quattro West Rand Gauteng 275 132
Rigi Vaal Triangle Gauteng 275 88
Scafell Vaal Triangle Free State 275 132
Simmerpan Johannesburg Gauteng 275 88
Snowdon Nigel Gauteng 275 88
Taunus West Rand Gauteng 275 132
Trident Rustenburg North West 275 88
Verwoerdburg Pretoria Gauteng 400 132
Westgate West Rand Gauteng 400 132

GCCA-2022 Page 27 June 2015
6 UNLOCKING OF ADDITIONAL GRID CONNECTION CAPACITY
This chapter presents the possibilities and options for the creation of additional grid
connection capacity beyond what has been calculated for this report. The objective
of including this information is to indicate to IPP developers what possibilities exist
outside of the TDP list of projects.
The MTS substation tables regarding installed transformer capacity and generation
connection capacity contained in Appendix A are all based on only the transmission
projects proposed in the TDP for the period 2015 to 2024. Discussions between
Eskom and the DoE have been held over the past year regarding the creation of
additional grid access for new RE and other IPP plants for future IPP procurement
programmes. Other initiatives between Eskom and the DEA have also been
undertaken to develop a more flexible and faster process of acquiring the necessary
authorisations for transmission infrastructure projects to enable the more rapid
creation of new grid access capacity.
6.1 Additional transmission infrastructure projects
Eskom Grid Planning has identified a number of potential transmission projects,
which could unlock additional connection capacity by 2022, that are not included in
the TDP, as their requirement has not yet been confirmed or agreed to. These
projects include works at existing MTS substations as well as the establishment of
new MTS substations with new transmission lines.
These potential projects can be grouped into four phases based on how long they
would take to be completed, assuming that funding were made available, allowing
time for the necessary approvals and scope of work involved.
The phases are as follows:
Phase 1: 2 years: Limited work at existing MTS substations
Phase 2: 3-4 years: Limited work at existing MTS substation with limited
transmission line work
Phase 3: 4-5 years: Existing or new MTS substation project that requires
more transmission line work with full EIA study

GCCA-2022 Page 28 June 2015
Phase 4: 6-8 years: Existing or new MTS substation project that requires
backbone transmission line work with longer lead times
The list of these potential transmission projects is provided in a table in Appendix B.
The table groups the projects into their respective phases in MTS substation
alphabetical order and provides the following information:
• How much new connection capacity could be added in MW
• A brief description of the network strengthening scope of work
• The province
• Expected duration of project development to completion if funded
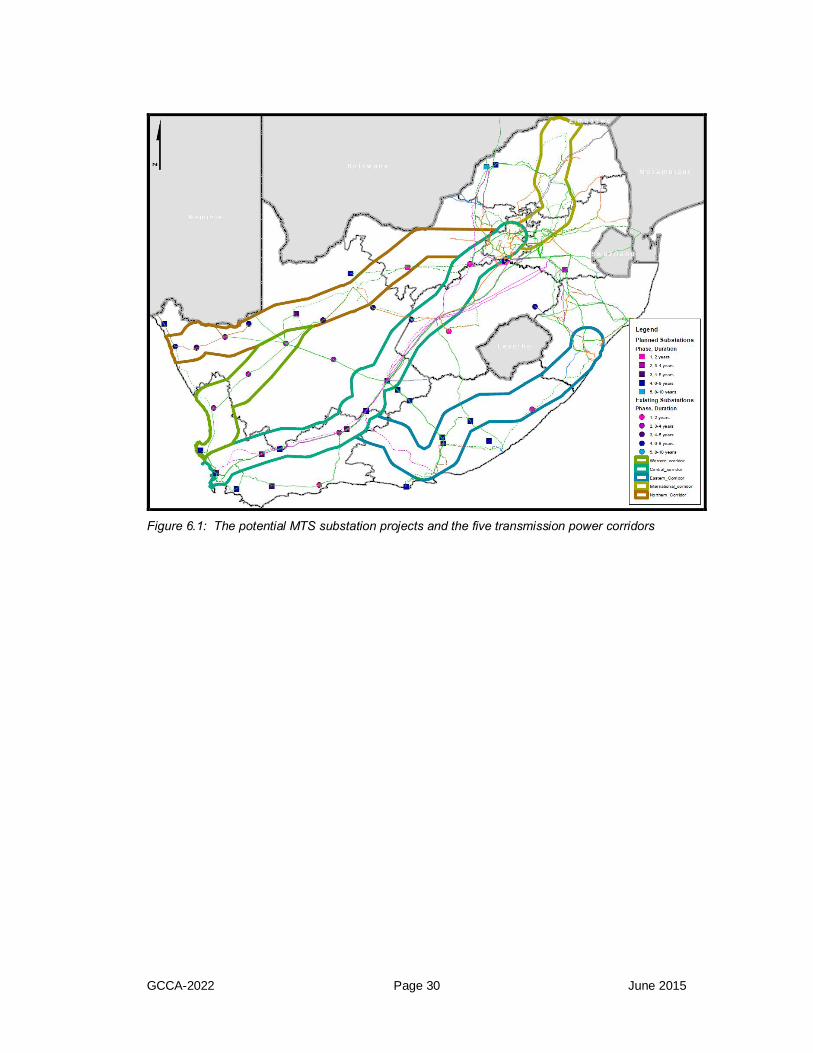
The location of these potential transmission projects is shown on the map in Figure
6.1 with the different phases highlighted in different colours. The circle symbols
indicate projects at existing MTS substations, while the square symbols indicate
projects at new MTS substation sites, planned or proposed. This information is also
included on the accompanying interactive spatial PDF map.
6.2 SEA study of future transmission power corridors
To understand the future transmission grid needs, Eskom Grid Planning completed a
long-term strategic study, entitled the “2040 Transmission Network Study”. This
study identified five major transmission power corridors that would need to be
developed, regardless of which future generation scenario unfolded. Securing these
power corridors for transmission development would provide a flexible and robust
network that could respond to meet the needs of future IRP and IPP requirements.
One of the challenges to providing new grid access in time is the uncertainty in
obtaining all the necessary authorisations before construction of transmission
projects can start. New IPP generation plant can be completed long before new
transmission infrastructure can be put in place based on the current planning and
approval processes. There is a large discontinuity between when IPP and
transmission projects can be started and completed, posing severe risk to future IPP
procurement programmes.
Discussions were held with the DEA regarding this issue, and it was agreed that a
new and much simpler approval process to obtain the required environmental

GCCA-2022 Page 29 June 2015
authorisation (EA) from the DEA for transmission and distribution lines and
substations had to be created. The DEA undertook to use the five transmission
power corridors as a basis for a strategic environmental assessment (SEA) study of
these corridors as part of the Strategic Integrated Projects (SIP) programme
introduced by the 2012 National Infrastructure Development Plan, namely SIP 10.
The objective of this SIP is to enable the transmission and distribution infrastructure
to serve the needs of the country.
In parallel, as part of SIP 10, the DEA, with its appointed consultant, the CSIR, is
developing a new authorisation process that will include all the necessary
environmental studies and licence approvals required to obtain a final EA being put in
place for projects within these corridors. The EIA study results and EAs granted for
specific transmission lines are proposed to be valid for extended periods to allow for
strategic acquisition of servitudes long before actually required. This, in turn, will
enable the preparation and design work for transmission projects, especially lines, to
commence early and be in place for final approval for release when required by the
REIPPP and other IPP programmes, providing grid access within the same time
frames as the IPP projects.
The power corridors for the SEA studies will be 100 km wide for most of their length
to allow for flexibility of final transmission line route options. The corridor routes have
taken into account the SIP 8 (“green energy in support of the South African economy)
project to identify suitable corridors and zones that would be “high-potential areas for
wind and solar PV energy”. The eight “RE focus zones” that have been identified are
either crossed by, or close to, the five power corridor routes.
The public participation process has already finalised the power corridor boundaries,
and the required environmental studies are under way. It is anticipated that all the
necessary work will be completed to present the final proposal of corridor routes and
the new EA process to government by the end of 2015.
The five transmission power corridor routes are indicated on the map in Figure 6.1 as
well as on the accompanying interactive spatial PDF map. The five corridor routes
are colour-coded and labelled. The “international corridor” is primarily for unlocking
grid access to IPPs and the supply of new load demand in this area, despite the
name, and the potential for future interconnections via Zimbabwe.
GCCA-2022 Page 30 June 2015
Figure 6.1: The potential MTS substation projects and the five transmission power corridors

GCCA-2022 Page 31 June 2015
7 THE INTERACTIVE SPATIAL PDF MAP
A new interactive spatial map in PDF format has been created to accompany this
GCCA-2022 document, which is the biggest improvement from the previous GCCA.
This interactive PDF map contains a number of different layers of information, which
can be toggled on and off on the map, to be displayed spatially. These layers include
the existing transmission network, the planned transmission projects, the location of
the successful IPP bidders for all the REIPPP rounds, the MTS substation supply
areas, and the transmission supply areas, among others.
The list of available layers of information is shown in Figure 7.1. On the left side of
the PDF map, the “two squares” button must be clicked to open up the available
layers. In order to activate or disable a layer on the map, the cursor must be placed
on the “eye” button and clicked. When opened, the PDF map has all the layers
activated. The PDF map contains an insert map of the greater Gauteng area to
provide better clarity in the congested network diagram and the layers must be
selected separately under the “Insert” layer option. The main map is under the “South
Africa” layer option.
On the map, the MTS network information is indicated as follows:
Existing MTS substation Black circle
Existing MTS substation with upgrade Black circle with red outline
New MTS substation Yellow circle with red outline
Transmission line voltages 765 kV purple, 400 kV green,
275 kV and 220 kV red
Existing transmission lines Solid lines
New transmission lines Dashed lines
Phasing of potential MTS upgrade projects Phase 1 pink, Phase 2 maroon,
Phase 3 dark purple, Phase 4
dark blue, Phase 5 light blue
Potential upgrade at existing MTS substation Circle in colour of phase
Potential upgrade at new MTS substation Square in colour of phase
Transmission power corridors Colour-coded by name
The transmission supply areas are shaded in one colour with the internal borders of
the MTS substation supply areas indicated.

GCCA-2022 Page 32 June 2015
The steady-state limit levels indicate the overall generation connection capacity of
the transmission supply areas for 2016 and 2022, shaded in green relative to their
connection capacity.
Figure 7.1: The available layers of spatial information on the PDF map
Included in the PDF map document are the GCCA-2022 connection capacity values
and other relevant information in tabular form, which can be accessed under the
model tree function. This is activated by clicking on the button that looks like the
letter “E”.
The level of the information available is shown in Figure 7.2. The required level must
be selected, and a drop-down list of the infrastructure will appear. The MYS

GCCA-2022 Page 33 June 2015
substations are grouped into their respective provinces. Clicking on a particular MTS
substation will display the available information in tabular form in the window below
the list. A red square will highlight the selected MTS substation on the map.
If the location of the MTS substation is not known then after highlighting the name
and right clicking an option list will appear. Selecting the “Zoom to Selection” option
will jump directly to the location on the map.
This interactive PDF map can be interrogated spatially as desired by potential
developers and investors to address their own particular issues regarding their
specific IPP projects under consideration.
Figure 7.2: The available levels of tabular information in the PDF map document

GCCA-2022 Page 34 June 2015
8 DEFINITION OF A TRANSMISSION CONNECTION
A “transmission connection” is defined, for the purposes of this document, as the
direct or indirect connection to an MTS substation at either the LV or the HV busbar.
A direct connection at the HV busbar would require the construction of a transmission
voltage-level line (400 kV, 275 kV, or 220 kV) from the generation plant directly to the
MTS substation. The connection to the MTS substation LV busbar can be done in a
number of ways, namely:
• direct connection from the generation plant substation to the MTS substation
via a dedicated transmission line;
• looping in an existing distribution line, which is connected to the MTS
substation, into the generation plant substation; and
• direct connection from the generation plant substation to a distribution
substation, which is supplied by the MTS substation.
The three LV busbar connection options are shown diagrammatically in Figure 8.1.
Gen Plant
Gen Plant
Gen
Pl
ant
400 kV (HV)
132 kV (LV)
132 kV (HV)
22 kV (LV)
Distribution Substation
132
kV (H
V)
22 k
V (L
V)
Dis
trib
utio
n Su
bsta
tion
MTS Substation
Direct Connectionto a MTS Substation Direct Connection
to a Distribution Substation
Loop-in Connection to anexisting transmission line
Gen Plant
Gen Plant
Gen
Pl
ant
400 kV (HV)
132 kV (LV)
132 kV (HV)
22 kV (LV)
Distribution Substation
132
kV (H
V)
22 k
V (L
V)
Dis
trib
utio
n Su
bsta
tion
MTS Substation
Direct Connectionto a MTS Substation Direct Connection
to a Distribution Substation
Loop-in Connection to anexisting transmission line
Gen PlantGen Plant
Gen PlantGen Plant
Gen
Pl
ant
Gen
Pl
ant
400 kV (HV)
132 kV (LV)
132 kV (HV)
22 kV (LV)
Distribution Substation
132 kV (HV)
22 kV (LV)
Distribution Substation
132
kV (H
V)
22 k
V (L
V)
Dis
trib
utio
n Su
bsta
tion
132
kV (H
V)
22 k
V (L
V)
Dis
trib
utio
n Su
bsta
tion
MTS Substation
Direct Connectionto a MTS Substation Direct Connection
to a Distribution Substation
Loop-in Connection to anexisting transmission line
Figure 8.1: Generation plant connection to the LV busbar options

GCCA-2022 Page 35 June 2015
APPENDIX A MTS SUBSTATIONS
TRANSFORMER AND GENERATION CONNECTION CAPACITY
CONTENTS
Table A-1: Transmission supply area of Bloemfontein
Table A-2: Transmission supply area of Carletonville
Table A-3: Transmission supply area of East London
Table A-4: Transmission supply area of Empangeni
Table A-5: Transmission supply area of Highveld North
Table A-6: Transmission supply area of Highveld South
Table A-7: Transmission supply area of Johannesburg
Table A-8: Transmission supply area of Karoo
Table A-9: Transmission supply area of Kimberley
Table A-10: Transmission supply area of Ladysmith
Table A-11: Transmission supply area of Lowveld
Table A-12: Transmission supply area of Namaqualand
Table A-13: Transmission supply area of Newcastle
Table A-14: Transmission supply area of Nigel
Table A-15: Transmission supply area of Peninsula
Table A-16: Transmission supply area of Pinetown
Table A-17: Transmission supply area of Polokwane
Table A-18: Transmission supply area of Port Elizabeth
Table A-19: Transmission supply area of Pretoria
Table A-20: Transmission supply area of Rustenburg
Table A-21: Transmission supply area of Southern Cape
Table A-22: Transmission supply area of Vaal Triangle
Table A-23: Transmission supply area of Warmbad
Table A-24: Transmission supply area of Waterberg
Table A-25: Transmission supply area of Welkom
Table A-26: Transmission supply area of West Coast
Table A-27: Transmission supply area of West Rand

GCCA-2022 Page 36 June 2015
The MTS substations are grouped into their transmission supply areas, which are
listed alphabetically. The installed transformer capacity and the calculated
generation connection capacity for each MTS substation are provided in the
transmission supply area tables as listed above.
Each transmission supply area table provides the following information:
Supply Area The name of the supply area
Province The name of the province in which the MTS substation is located
Substation The name of the MTS substation
Transformer Voltages The transformer voltage levels in the MTS substation
2015 No. of Trfrs The number of transformers of a specific voltage level and size in the MTS substation at the end of the year 2015
2015 Trfr Size (MVA) The MVA unit size of transformers of a specific voltage level in the MTS substation at the end of the year 2015
2015 Installed Transformer MVA
The total installed transformer MVA of a specific voltage level and size in the MTS substation at the end of the year 2015
Year of Trfr Upgrade Year when new transformers are expected to be installed in the MTS substation
Upgrade Status The project status of the upgrade, either approved with funding or proposed as in the TDP for 2015 to 2024
2022 No. of Trfrs The number of transformers of a specific voltage level and size in the MTS substation at the end of the year 2022
2022 Trfr Size (MVA) The MVA unit size of transformers of a specific voltage level in the MTS substation at the end of the year 2022
2022 Installed Transformer MVA
The total installed transformer MVA of a specific voltage level and size in the MTS substation at the end of the year 2022
2022 LV Busbar Connection Capacity (MW)
The available generation connection capacity at the LV busbar (132 kV or 88 kV or 66 kV) at the MTS at the end of the year 2022
2022 HV Busbar Connection Capacity (MW)
The generation connection capacity limit at the HV busbar (275 kV or 400 kV) at the MTS at the end of the year 2022
2022 Supply Area HV Busbar Steady-state Limit (MW)
The overall generation connection capacity limit of all the MTS substations within the supply area at the end of the year 2022
Note: The cumulative impact of the grouping of adjacent Transmission supply areas will result in further limitations on the steady-state limits which will require additional transmission backbone network to accommodate the total of all the affected Transmission supply areas.

GCCA-2022 Page 37 June 2015
Table A-1: Transmission supply area of Bloemfontein
2015 2022 2022 2022 2022
Substation Transformer Voltages
No. of Trfrs
Trfr Size (MVA)
Installed Transformer
(MVA)
Year of Trfr Upgrade
Upgrade Status
No. of Trfrs
Trfr Size (MVA)
Installed Transformer
(MVA)
REIPPP Gen Allocated
(MW)
LV Busbar Connection
Capacity (MW)
HV Busbar Connection
Capacity (MW)
Supply Area HV Busbar steady-state
limit (MW)
Beta 765/400 2 2000 4000 - - 2 2000 4000 0 2142
Harvard 275/132 2 500 1000 - - 2 500 1000 64 917 670
Merapi 275/132 1 250 250 2016 Approved 2 250 500 490 912
400/275 2 400 800 - - 2 400 800 60 725
400/275 1 800 800 - - 1 800 800 0
3845
2263Perseus
Table A-2: Transmission supply area of Carletonville
2015 2022 2022 2022 2022
Substation Transformer Voltages
No. of Trfrs
Trfr Size (MVA)
Installed Transformer
(MVA)
Year of Trfr Upgrade
Upgrade Status
No. of Trfrs
Trfr Size (MVA)
Installed Transformer
(MVA)
REIPPP Gen Allocated
(MW)
LV Busbar Connection
Capacity (MW)
HV Busbar Connection
Capacity (MW)
Supply Area HV Busbar steady-state
limit (MW)
Carmel 275/132 2 500 1000 - - 2 500 1000 980 92
132/88 3 180 540 - - 3 180 540 529
400/132 3 500 1500 - - 3 500 1500 980
Mercury 400/132 2 500 1000 - - 2 500 1000 67.9 913 284
Midas 400/132 2 500 1000 - - 2 500 1000 980 172
Pluto 400/275 2 750 1500 - - 2 750 1500 980 311
132/88 2 180 360 - - 2 180 360 353
275/132 0 0 0 2016 Approved 1 250 250 75 172
275/88 2 315 630 - - 2 315 630 617
1302
291
172
Hermes
Watershed
Table A-3: Transmission supply area of East London
2015 2022 2022 2022 2022
Substation Transformer Voltages
No. of Trfrs
Trfr Size (MVA)
Installed Transformer
(MVA)
Year of Trfr Upgrade
Upgrade Status
No. of Trfrs
Trfr Size (MVA)
Installed Transformer
(MVA)
REIPPP Gen Allocated
(MW)
LV Busbar Connection
Capacity (MW)
HV Busbar Connection
Capacity (MW)
Supply Area HV Busbar steady-state
limit (MW)
Delphi 400/132 2 120 240 2020 Proposed 3 120 360 97 258 1228
Neptune 400/132 2 500 1000 - - 2 500 1000 980 852
132/66 0 0 0 2022 Proposed 2 250 500 490
220/132 2 250 500 2022 Proposed 0 0 0 0
220/66 2 90 180 - - 0 0 0 0
400/132 0 0 0 2022 Proposed 2 500 1000 53.3 928
Vuyani 400/132 2 250 500 - - 2 250 500 490 984
3844780Pembroke

GCCA-2022 Page 38 June 2015
Table A-4: Transmission supply area of Empangeni
2015 2022 2022 2022 2022
Substation Transformer Voltages
No. of Trfrs
Trfr Size (MVA)
Installed Transformer
(MVA)
Year of Trfr Upgrade
Upgrade Status
No. of Trfrs
Trfr Size (MVA)
Installed Transformer
(MVA)
REIPPP Gen Allocated
(MW)
LV Busbar Connection
Capacity (MW)
HV Busbar Connection
Capacity (MW)
Supply Area HV Busbar steady-state
limit (MW)
Athene 400/132 4 500 2000 - - 4 500 2000 980 517
Georgedale 132/88 2 45 90 - - 2 45 90 88 0
Impala 275/132 4 250 1000 - - 4 250 1000 16.5 964 528
Invubu 400/275 3 800 2400 - - 3 800 2400 0 540
Mbewu 765/400 1 2000 2000 - - 1 2000 2000 0 0
1585
Table A-5: Transmission supply area of Highveld North
2015 2022 2022 2022 2022
Substation Transformer Voltages
No. of Trfrs
Trfr Size (MVA)
Installed Transformer
(MVA)
Year of Trfr Upgrade
Upgrade Status
No. of Trfrs
Trfr Size (MVA)
Installed Transformer
(MVA)
REIPPP Gen Allocated
(MW)
LV Busbar Connection
Capacity (MW)
HV Busbar Connection
Capacity (MW)
Supply Area HV Busbar steady-state
limit (MW)
Arnot 400/275 2 400 800 - - 2 400 800 0 0
Gumeni 400/132 1 500 500 - - 1 500 500 490 921
Hendrina 400/132 2 250 500 - - 2 250 500 0 0
Komati 275/132 2 250 500 - - 2 250 500 0 0
Kruispunt 275/132 4 250 1000 - - 4 250 1000 980 592
Matla 400/275 1 800 800 - - 1 800 800 0 0
Prairie 275/132 2 500 480 - - 2 240 480 6.76 464 921
132/88 2 90 180 - - 2 90 180 0
275/132 2 500 1000 - - 2 500 1000 980
400/132 2 500 1000 - - 2 500 1000 980
400/132 2 500 1000 2022 Proposed 4 500 2000 980
400/132 2 300 600 2022 Proposed 0 300 0 0
400/132 1 250 250 2022 Proposed 0 250 0 0
4228
873
921Vuclan
Rockdale
Table A-6: Transmission supply area of Highveld South
2015 2022 2022 2022 2022
Substation Transformer Voltages
No. of Trfrs
Trfr Size (MVA)
Installed Transformer
(MVA)
Year of Trfr Upgrade
Upgrade Status
No. of Trfrs
Trfr Size (MVA)
Installed Transformer
(MVA)
REIPPP Gen Allocated
(MW)
LV Busbar Connection
Capacity (MW)
HV Busbar Connection
Capacity (MW)
Supply Area HV Busbar steady-state
limit (MW)
Alpha 765/400 3 2000 6000 - - 3 2000 6000 0 1216
275/88 2 160 320 - - 2 160 320 0
400/275 2 400 800 - - 2 400 800 0
Grootvlei 400/88 2 160 320 - - 2 160 320 0 0
Majuba 400/88 2 160 320 - - 2 160 320 0 0
Sol 400/132 4 500 2000 - - 4 500 2000 980 374
Zeus 765/400 2 2000 4000 - - 3 2000 6000 0 7325
1574
1200Camden

GCCA-2022 Page 39 June 2015
Table A-7: Transmission supply area of Johannesburg
2015 2022 2022 2022 2022
Substation Transformer Voltages
No. of Trfrs
Trfr Size (MVA)
Installed Transformer
(MVA)
Year of Trfr Upgrade
Upgrade Status
No. of Trfrs
Trfr Size (MVA)
Installed Transformer
(MVA)
REIPPP Gen Allocated
(MW)
LV Busbar Connection
Capacity (MW)
HV Busbar Connection
Capacity (MW)
Supply Area HV Busbar steady-state
limit (MW)
Craighall 275/88 3 315 945 - - 3 315 945 926 418
Croydon 275/132 3 250 750 - - 3 250 750 735 187
Eiger 275/88 3 315 945 - - 3 315 945 926 440
132/88 1 160 160 - - 1 160 160 0
275/132 2 180 360 - - 2 180 360 353
275/132 1 250 250 - - 1 250 250 245
275/88 2 315 630 - - 2 315 630 617
Jupiter 275/88 3 180 540 - - 3 180 540 529 496
Kyalami 400/132 0 0 0 2022 Proposed 2 500 1000 980 780
Lepini 275/88 4 315 1260 - - 4 315 1260 3.2 980 531
Lulamisa 400/88 3 315 945 - - 3 315 945 926 475
North Rand 275/132 0 0 0 2022 Proposed 2 500 1000 980 530
Simmerpan 275/88 0 0 0 2021 Proposed 2 160 320 314 530
4932
545Esselen
Table A-8: Transmission supply area of Karoo
2015 2022 2022 2022 2022
Substation Transformer Voltages
No. of Trfrs
Trfr Size (MVA)
Installed Transformer
(MVA)
Year of Trfr Upgrade
Upgrade Status
No. of Trfrs
Trfr Size (MVA)
Installed Transformer
(MVA)
REIPPP Gen Allocated
(MW)
LV Busbar Connection
Capacity (MW)
HV Busbar Connection
Capacity (MW)
Supply Area HV Busbar steady-state
limit (MW)
400/132 1 250 250 - - 1 250 250 245
765/400 1 2000 2000 - - 1 2000 2000 0
400/132 2 500 1000 2018 Approved 3 500 1500 235.5 980
400/220 2 315 630 - - 2 315 630 617
765/400 1 2000 2000 - - 1 2000 2000 0
Hydra B 400/132 0 0 0 2021 Proposed 2 500 1000 980 780
Kronos 400/132 0 0 0 2016 Approved 1 250 250 462.83 -209 915
Roodekuil 220/132 1 125 625 - - 1 125 125 0 83
132/66 2 20 40 - - 2 20 40 0
220/132 2 250 500 - - 2 250 500 69.9 0
3669
1722
169
0Gamma
Hydra
Ruigtvallei

GCCA-2022 Page 40 June 2015
Table A-9: Transmission supply area of Kimberley
2015 2022 2022 2022 2022
Substation Transformer Voltages
No. of Trfrs
Trfr Size (MVA)
Installed Transformer
(MVA)
Year of Trfr Upgrade
Upgrade Status
No. of Trfrs
Trfr Size (MVA)
Installed Transformer
(MVA)
REIPPP Gen Allocated
(MW)
LV Busbar Connection
Capacity (MW)
HV Busbar Connection
Capacity (MW)
Supply Area HV Busbar steady-state
limit (MW)
Boundary 275/132 2 250 500 - - 2 250 500 228.15 266 1422
132/66 3 80 240 - - 3 80 240 0
275/132 2 250 500 - - 2 250 500 224 270
400/132 2 500 1000 - - 2 500 1000 100 882
Garona 275/132 1 125 125 - - 1 125 125 50 74 241
Hotazel 400/132 0 0 0 2020 Proposed 2 500 1000 980 780
Mookodi 400/132 2 500 1000 - - 2 500 1000 75 907 924
Olien 275/132 2 150 300 - - 2 150 300 239 60 403
4744
974Ferrum
Table A-10: Transmission supply area of Ladysmith
2015 2022 2022 2022 2022
Substation Transformer Voltages
No. of Trfrs
Trfr Size (MVA)
Installed Transformer
(MVA)
Year of Trfr Upgrade
Upgrade Status
No. of Trfrs
Trfr Size (MVA)
Installed Transformer
(MVA)
REIPPP Gen Allocated
(MW)
LV Busbar Connection
Capacity (MW)
HV Busbar Connection
Capacity (MW)
Supply Area HV Busbar steady-state
limit (MW)
Bloukrans 275/132 2 250 500 - - 2 250 500 490 530
Danskraal 275/132 2 125 250 - - 2 125 250 245 344
Sorata 275/132 0 0 0 2021 Proposed 1 250 250 245 380
Tugela 275/132 2 180 360 - - 2 180 360 9 344 437
Venus 400/275 2 800 1600 - - 2 800 1600 980 0
1691
Table A-11: Transmission supply area of Lowveld
2015 2022 2022 2022 2022
Substation Transformer Voltages
No. of Trfrs
Trfr Size (MVA)
Installed Transformer
(MVA)
Year of Trfr Upgrade
Upgrade Status
No. of Trfrs
Trfr Size (MVA)
Installed Transformer
(MVA)
REIPPP Gen Allocated
(MW)
LV Busbar Connection
Capacity (MW)
HV Busbar Connection
Capacity (MW)
Supply Area HV Busbar steady-state
limit (MW)
Acornhoek 275/132 2 75 150 2017 Approved 2 125 250 245 472
Foskor 275/132 2 250 500 2017 Approved 3 250 750 735 373
Gumeni 400/132 0 0 0 2018 Proposed 2 500 1000 980 690
Khanyazwe 275/132 1 250 250 - - 1 250 250 245 350
Komatipoort 275/132 2 125 250 - - 2 125 250 245 275
132/66 2 30 60 - - 2 30 60 59
275/132 2 500 1000 - - 2 500 1000 25 956
MarathonB 400/132 1 800 0 2020 Proposed 1 800 800 784 66
275/132 2 250 500 - - 2 250 500 490
400/132 1 500 500 - - 1 500 500 490
400/275 2 400 800 - - 2 400 800 0
Senakangwedi 275/33 2 180 360 - - 2 180 360 353 143
400/132 0 0 0 2020 Proposed 2 500 1000 980 720
B400/275 0 0 0 2020 Proposed 1 800 800 0 0
Silimela 400/132 0 0 0 2020 Proposed 2 500 1000 980 680
Simplon 275/132 2 250 500 - - 2 250 500 490 177
5698
619
882
Marathon
Merensky
Senakangwedi B

GCCA-2022 Page 41 June 2015
Table A-12: Transmission supply area of Namaqualand
2015 2022 2022 2022 2022
Substation Transformer Voltages
No. of Trfrs
Trfr Size (MVA)
Installed Transformer
(MVA)
Year of Trfr Upgrade
Upgrade Status
No. of Trfrs
Trfr Size (MVA)
Installed Transformer
(MVA)
REIPPP Gen Allocated
(MW)
LV Busbar Connection
Capacity (MW)
HV Busbar Connection
Capacity (MW)
Supply Area HV Busbar steady-state
limit (MW)
220/66 2 40 80 - - 2 40 80 40 39
400/220 2 315 630 - - 2 315 630 471.35 155
Aries 400/22 1 40 40 - - 1 40 40 9.65 30 116
220/66 2 40 80 - - 2 40 80 78
400/220 0 0 0 2020 Proposed 1 315 315 0
Nama 220/66 2 80 160 - - 2 80 160 157 150
Nieuwehoop 400/132 0 0 0 2016 Approved 1 250 250 245 750
Oranjemond 220/66 2 80 160 - - 2 80 160 157 100
132/33 1 10 10 - - 1 10 10 10 0
220/132 1 125 125 2019 Proposed 2 250 500 119.65 373
Upington 400/132 1 500 500 2022 Proposed 2 500 1000 383.9 604 680
2348
180
120
121
Paulputs
Aggeneis
Gromis
Table A-13: Transmission supply area of Newcastle
2015 2022 2022 2022 2022
Substation Transformer Voltages
No. of Trfrs
Trfr Size (MVA)
Installed Transformer
(MVA)
Year of Trfr Upgrade
Upgrade Status
No. of Trfrs
Trfr Size (MVA)
Installed Transformer
(MVA)
REIPPP Gen Allocated
(MW)
LV Busbar Connection
Capacity (MW)
HV Busbar Connection
Capacity (MW)
Supply Area HV Busbar steady-state
limit (MW)
Bloedrivier 275/88 2 160 320 - - 2 160 320 314 155
Candover 400/132 0 0 0 2021 Proposed 2 500 1000 980 780
Chivelston 400/275 1 800 800 - - 1 800 800 0 238
400/132 2 315 630 - - 2 315 630 617
400/132 0 0 0 2017 Approved 1 500 500 490
Ingagane 275/88 2 160 320 - - 2 160 320 314 192
132/88 1 160 160 - - 1 160 160 157
400/132 2 250 500 - - 2 250 500 490
400/88 2 160 320 - - 2 160 320 314
Umfolozi 400/88 2 160 320 - - 2 160 320 314 291
1787
207
162
Incandu
Normandie
Table A-14: Transmission supply area of Nigel
2015 2022 2022 2022 2022
Substation Transformer Voltages
No. of Trfrs
Trfr Size (MVA)
Installed Transformer
(MVA)
Year of Trfr Upgrade
Upgrade Status
No. of Trfrs
Trfr Size (MVA)
Installed Transformer
(MVA)
REIPPP Gen Allocated
(MW)
LV Busbar Connection
Capacity (MW)
HV Busbar Connection
Capacity (MW)
Supply Area HV Busbar steady-state
limit (MW)
Benburg 275/132 3 250 750 - - 3 250 750 735 252
Brenner 275/88 3 315 945 - - 3 315 945 926 677
Nevis 275/132 2 500 1000 - - 2 500 1000 980 485
Pieterboth 275/132 2 315 630 - - 2 315 630 617 334
Snowdon 275/88 3 160 480 - - 3 160 480 470 677
2425

GCCA-2022 Page 42 June 2015
Table A-15: Transmission supply area of Peninsula
2015 2022 2022 2022 2022
Substation Transformer Voltages
No. of Trfrs
Trfr Size (MVA)
Installed Transformer
(MVA)
Year of Trfr Upgrade
Upgrade Status
No. of Trfrs
Trfr Size (MVA)
Installed Transformer
(MVA)
REIPPP Gen Allocated
(MW)
LV Busbar Connection
Capacity (MW)
HV Busbar Connection
Capacity (MW)
Supply Area HV Busbar steady-state
limit (MW)
132/66 2 120 240 - - 2 120 240 0
400/132 3 500 1500 - - 3 500 1500 980
Asteria 400/132 0 0 0 2022 Proposed 2 500 1000 980 590
Erica 400/132 0 0 0 2021 Proposed 0 0 580
132/66 2 80 160 - - 2 80 160 157
400/132 3 500 480 - - 3 500 1500 980
Philippi 400/132 2 500 1000 - - 2 500 1000 980 729
Pinotage 400/132 0 0 0 2017 Approved 2 500 1000 980 605
Sterrekus 765/400 0 0 0 2016 Approved 1 2000 2000 0 562
Stikland 400/132 3 500 1000 - - 3 500 1500 980 528
5052
729
729
Acacia
Muldersvlei
Table A-16: Transmission supply area of Pinetown
2015 2022 2022 2022 2022
Substation Transformer Voltages
No. of Trfrs
Trfr Size (MVA)
Installed Transformer
(MVA)
Year of Trfr Upgrade
Upgrade Status
No. of Trfrs
Trfr Size (MVA)
Installed Transformer
(MVA)
REIPPP Gen Allocated
(MW)
LV Busbar Connection
Capacity (MW)
HV Busbar Connection
Capacity (MW)
Supply Area HV Busbar steady-state
limit (MW)
Ariadne 400/132 2 500 1000 - - 2 500 1000 980 279
Avon 275/132 3 250 750 - - 3 250 750 735 522
Eros 400/132 2 500 1000 - - 2 500 1000 980 688
Georgedale 275/132 3 250 750 - - 3 250 750 735 445
Hector 400/275 3 800 2400 - - 3 800 2400 0 663
132/88 1 80 80 - - 1 80 80 78
275/132 2 250 500 - - 2 250 500 490
275/132 2 250 500 - - 2 250 500 490
400/275 3 800 2400 - - 3 800 2400 0
St Faiths 400/132 0 0 0 2021 Proposed 2 500 1000 980 680
4296
484
1071
Illovo
Mersey
Table A-17: Transmission supply area of Polokwane
2015 2022 2022 2022 2022
Substation Transformer Voltages
No. of Trfrs
Trfr Size (MVA)
Installed Transformer
(MVA)
Year of Trfr Upgrade
Upgrade Status
No. of Trfrs
Trfr Size (MVA)
Installed Transformer
(MVA)
REIPPP Gen Allocated
(MW)
LV Busbar Connection
Capacity (MW)
HV Busbar Connection
Capacity (MW)
Supply Area HV Busbar steady-state
limit (MW)
Borutho 400/132 2 500 1500 - - 2 500 1000 980 348
Leseding 400/132 2 500 1000 - - 2 500 1000 980 785
Nzhelele 400/132 0 0 0 2022 Proposed 2 250 500 490 395
Spencer 275/132 2 250 500 - - 2 250 500 490 306
275/132 2 250 500 - - 2 250 500 28 463
400/132 1 500 500 - - 1 500 500 490
400/132 3 500 1500 - - 3 500 1500 30 980
400/275 2 400 800 - - 2 400 800 0
3018
296
602
Tabor
Witkop

GCCA-2022 Page 43 June 2015
Table A-18: Transmission supply area of Port Elizabeth
2015 2022 2022 2022 2022
Substation Transformer Voltages
No. of Trfrs
Trfr Size (MVA)
Installed Transformer
(MVA)
Year of Trfr Upgrade
Upgrade Status
No. of Trfrs
Trfr Size (MVA)
Installed Transformer
(MVA)
REIPPP Gen Allocated
(MW)
LV Busbar Connection
Capacity (MW)
HV Busbar Connection
Capacity (MW)
Supply Area HV Busbar steady-state
limit (MW)
Dedisa 400/132 3 500 1500 - - 3 500 1500 980 524
220/132 2 360 720 - - 2 360 720 26.19 680
400/132 4 500 2000 - - 4 500 2000 616.06 980
PE Sub 400/132 0 0 0 2022 Proposed 2 500 1000 980 390
220/132 2 125 250 - - 2 125 250 158.4 90
220/66 1 40 120 - - 1 40 40 39
400/132 0 0 0 2016 Approved 1 500 500 481.12 19
400/220 2 500 1000 - - 2 500 1000 980
4300
1260
1362Grassridge
Poseidon
Table A-19: Transmission supply area of Pretoria
2015 2022 2022 2022 2022
Substation Transformer Voltages
No. of Trfrs
Trfr Size (MVA)
Installed Transformer
(MVA)
Year of Trfr Upgrade
Upgrade Status
No. of Trfrs
Trfr Size (MVA)
Installed Transformer
(MVA)
REIPPP Gen Allocated
(MW)
LV Busbar Connection
Capacity (MW)
HV Busbar Connection
Capacity (MW)
Supply Area HV Busbar steady-state
limit (MW)
400/275 1 800 800 - - 1 800 800 0
400/275 2 1000 2000 - - 2 1000 2000 0
Dinaledi 400/132 2 500 1000 2016 Approved 3 500 1500 980 567
Lomond 275/88 2 315 630 - - 2 315 630 50 568 228
Minerva 400/275 4 800 3200 - - 4 800 3200 0 1227
Verwoedburg 400/132 2 250 500 2021 Proposed 3 250 750 0 500
1295
1353Apollo
Table A-20: Transmission supply area of Rustenburg
2015 2022 2022 2022 2022
Substation Transformer Voltages
No. of Trfrs
Trfr Size (MVA)
Installed Transformer
(MVA)
Year of Trfr Upgrade
Upgrade Status
No. of Trfrs
Trfr Size (MVA)
Installed Transformer
(MVA)
REIPPP Gen Allocated
(MW)
LV Busbar Connection
Capacity (MW)
HV Busbar Connection
Capacity (MW)
Supply Area HV Busbar steady-state
limit (MW)
Ararat 275/88 3 315 945 - - 3 315 945 926 143
275/88 3 315 945 - - 3 315 945 926
400/132 2 500 1000 - - 2 500 1000 6.76 973
400/275 2 800 1600 - - 2 800 1600 0
Marang 400/88 4 315 1260 - - 4 315 1260 980 205
Marang B 400/132 0 0 0 2022 Proposed 2 500 1000 980 640
Ngwedi (Mogwase) 400/132 2 500 1000 2021 Proposed 3 500 1500 980 350
Trident 275/88 2 315 630 - - 2 315 630 617 149
1929
299Bighorn

GCCA-2022 Page 44 June 2015
Table A-21: Transmission supply area of Southern Cape
2015 2022 2022 2022 2022
Substation Transformer Voltages
No. of Trfrs
Trfr Size (MVA)
Installed Transformer
(MVA)
Year of Trfr Upgrade
Upgrade Status
No. of Trfrs
Trfr Size (MVA)
Installed Transformer
(MVA)
REIPPP Gen Allocated
(MW)
LV Busbar Connection
Capacity (MW)
HV Busbar Connection
Capacity (MW)
Supply Area HV Busbar steady-state
limit (MW)
Agullas 400/132 0 0 0 2021 Proposed 2 500 1000 980 550
Bacchus 400/132 2 500 1000 - - 2 500 1000 94.09 888 924
Droerivier 400/132 2 120 240 - - 2 120 240 235 951
Kappa 765/400 1 2000 2000 - - 1 2000 2000 0 910
Narina 400/132 0 0 0 2022 Proposed 2 500 1000 980 550
132/66 2 80 160 - - 2 80 160 157
400/132 2 500 1000 - - 2 500 1000 980
3460
485Proteus
Table A-22: Transmission supply area of Vaal Triangle
2015 2022 2022 2022 2022
Substation Transformer Voltages
No. of Trfrs
Trfr Size (MVA)
Installed Transformer
(MVA)
Year of Trfr Upgrade
Upgrade Status
No. of Trfrs
Trfr Size (MVA)
Installed Transformer
(MVA)
REIPPP Gen Allocated
(MW)
LV Busbar Connection
Capacity (MW)
HV Busbar Connection
Capacity (MW)
Supply Area HV Busbar steady-state
limit (MW)
Glockner 400/275 3 800 2400 - - 3 800 2400 0 1024
Kookfontein 275/88 3 315 945 - - 3 315 945 926 240
Makalu 275/88 4 160 640 - - 4 160 640 627 326
Makalu B 275/88 0 0 0 2022 Proposed 2 315 630 617 350
Olympus 275/132 2 250 500 - - 2 250 500 490 559
Rigi 275/88 3 315 945 - - 3 315 945 926 337
Scafell 275/132 2 135 270 - - 2 135 270 265 303
3139
Table A-23: Transmission supply area of Warmbad
2015 2022 2022 2022 2022
Substation Transformer Voltages
No. of Trfrs
Trfr Size (MVA)
Installed Transformer
(MVA)
Year of Trfr Upgrade
Upgrade Status
No. of Trfrs
Trfr Size (MVA)
Installed Transformer
(MVA)
REIPPP Gen Allocated
(MW)
LV Busbar Connection
Capacity (MW)
HV Busbar Connection
Capacity (MW)
Supply Area HV Busbar steady-state
limit (MW)
Pelly 275/132 2 250 500 - - 2 250 500 490 474
132/66 2 40 80 - - 2 40 80 78
275/132 2 125 250 - - 2 125 250 245
860386Warmbad
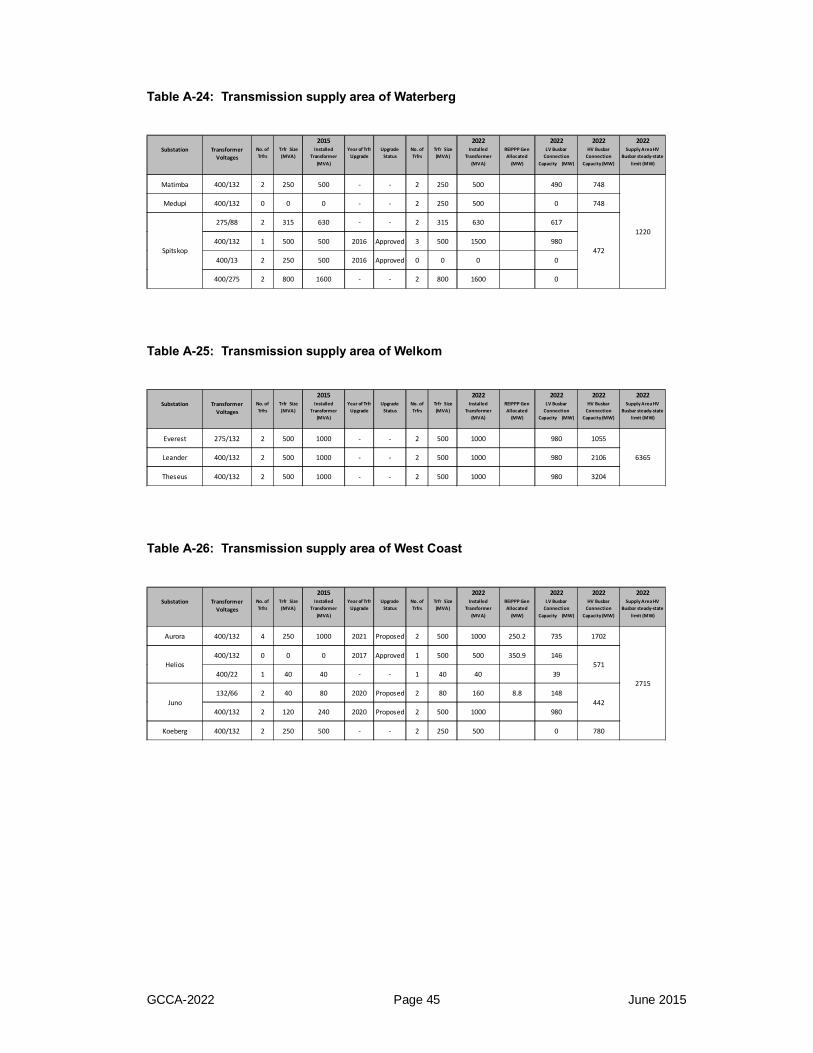
GCCA-2022 Page 45 June 2015
Table A-24: Transmission supply area of Waterberg
2015 2022 2022 2022 2022
Substation Transformer Voltages
No. of Trfrs
Trfr Size (MVA)
Installed Transformer
(MVA)
Year of Trfr Upgrade
Upgrade Status
No. of Trfrs
Trfr Size (MVA)
Installed Transformer
(MVA)
REIPPP Gen Allocated
(MW)
LV Busbar Connection
Capacity (MW)
HV Busbar Connection
Capacity (MW)
Supply Area HV Busbar steady-state
limit (MW)
Matimba 400/132 2 250 500 - - 2 250 500 490 748
Medupi 400/132 0 0 0 - - 2 250 500 0 748
275/88 2 315 630 - - 2 315 630 617
400/132 1 500 500 2016 Approved 3 500 1500 980
400/13 2 250 500 2016 Approved 0 0 0 0
400/275 2 800 1600 - - 2 800 1600 0
1220
472Spitskop
Table A-25: Transmission supply area of Welkom
2015 2022 2022 2022 2022
Substation Transformer Voltages
No. of Trfrs
Trfr Size (MVA)
Installed Transformer
(MVA)
Year of Trfr Upgrade
Upgrade Status
No. of Trfrs
Trfr Size (MVA)
Installed Transformer
(MVA)
REIPPP Gen Allocated
(MW)
LV Busbar Connection
Capacity (MW)
HV Busbar Connection
Capacity (MW)
Supply Area HV Busbar steady-state
limit (MW)
Everest 275/132 2 500 1000 - - 2 500 1000 980 1055
Leander 400/132 2 500 1000 - - 2 500 1000 980 2106
Theseus 400/132 2 500 1000 - - 2 500 1000 980 3204
6365
Table A-26: Transmission supply area of West Coast
2015 2022 2022 2022 2022
Substation Transformer Voltages
No. of Trfrs
Trfr Size (MVA)
Installed Transformer
(MVA)
Year of Trfr Upgrade
Upgrade Status
No. of Trfrs
Trfr Size (MVA)
Installed Transformer
(MVA)
REIPPP Gen Allocated
(MW)
LV Busbar Connection
Capacity (MW)
HV Busbar Connection
Capacity (MW)
Supply Area HV Busbar steady-state
limit (MW)
Aurora 400/132 4 250 1000 2021 Proposed 2 500 1000 250.2 735 1702
400/132 0 0 0 2017 Approved 1 500 500 350.9 146
400/22 1 40 40 - - 1 40 40 39
132/66 2 40 80 2020 Proposed 2 80 160 8.8 148
400/132 2 120 240 2020 Proposed 2 500 1000 980
Koeberg 400/132 2 250 500 - - 2 250 500 0 780
2715
442
571Helios
Juno

GCCA-2022 Page 46 June 2015
Table A-27: Transmission supply area of West Rand
2015 2022 2022 2022 2022
Substation Transformer Voltages
No. of Trfrs
Trfr Size (MVA)
Installed Transformer
(MVA)
Year of Trfr Upgrade
Upgrade Status
No. of Trfrs
Trfr Size (MVA)
Installed Transformer
(MVA)
REIPPP Gen Allocated
(MW)
LV Busbar Connection
Capacity (MW)
HV Busbar Connection
Capacity (MW)
Supply Area HV Busbar steady-state
limit (MW)
Bernina 275/132 4 240 1000 - - 4 240 960 941 699
Demeter 400/88 0 0 0 2022 Proposed 3 315 945 926 780
Etna 275/88 2 315 630 - - 2 315 630 1 616 746
Hera 400/275 2 800 1600 - - 2 800 1600 0 508
Princess 275/88 3 315 945 - - 3 315 945 926 183
Quattro 275/132 0 0 0 2021 Proposed 2 500 1000 980 550
Taunus 275/132 3 500 1500 - - 3 500 1500 4.8 980 555
275/132 2 500 1000 2 500 1000 980
400/132 0 0 0 2021 Proposed 1 500 500 0
4242
221Westgate

GCCA-2022 Page 47 June 2015
APPENDIX B MTS SUBSTATIONS
POTENTIAL PROJECTS FOR ADDITIONAL GRID ACCESS
The table with the potential transmission projects to provide additional grid access is
grouped into the phases based on the time frame in which they could be completed
as discussed in Chapter 6, that is, the time for final design, construction, and
commissioning, assuming all authorisations and funding are in place.
Within each phase, the MTS substation sites where the projects would provide new
connection capacity are listed in alphabetical order.
The table provides the following information:
Tx project phase The phase of the project from 1 to 5
Substation site The name of the MTS substation at which the transmission infrastructure works will be located
Unlocking (MW) The MW amount of connection capacity that could be unlocked
Network strengthening
Brief description of the scope of work of the proposed project
Note: an item shown as “500 MVA 400/132 kV” refers to a transformer
Province The province in which the project is located
Duration for project development
The estimated time required to prepare, construct, and commission the project (assuming all authorisations and funding are in place)
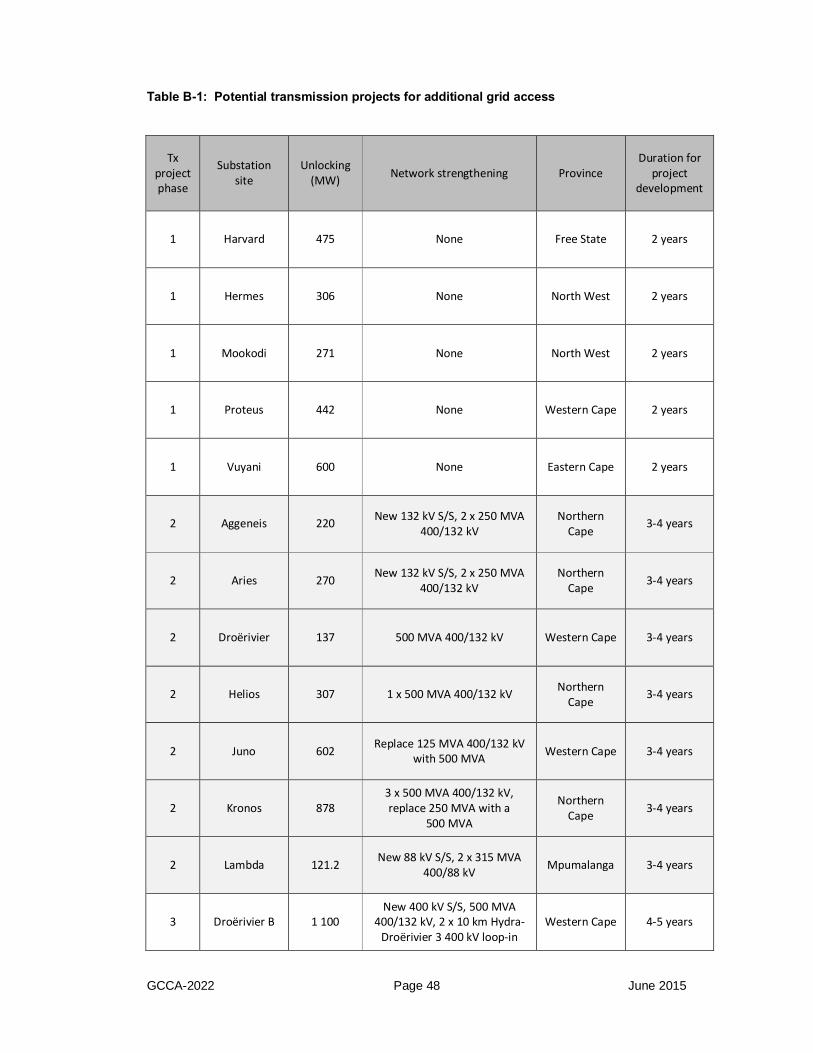
GCCA-2022 Page 48 June 2015
Table B-1: Potential transmission projects for additional grid access
Tx project phase
Substation site
Unlocking (MW) Network strengthening Province
Duration for project
development
1 Harvard 475 None Free State 2 years
1 Hermes 306 None North West 2 years
1 Mookodi 271 None North West 2 years
1 Proteus 442 None Western Cape 2 years
1 Vuyani 600 None Eastern Cape 2 years
2 Aggeneis 220 New 132 kV S/S, 2 x 250 MVA 400/132 kV
Northern Cape 3-4 years
2 Aries 270 New 132 kV S/S, 2 x 250 MVA 400/132 kV
Northern Cape 3-4 years
2 Droërivier 137 500 MVA 400/132 kV Western Cape 3-4 years
2 Helios 307 1 x 500 MVA 400/132 kV Northern Cape 3-4 years
2 Juno 602 Replace 125 MVA 400/132 kV with 500 MVA Western Cape 3-4 years
2 Kronos 878 3 x 500 MVA 400/132 kV, replace 250 MVA with a
500 MVA
Northern Cape 3-4 years
2 Lambda 121.2 New 88 kV S/S, 2 x 315 MVA 400/88 kV Mpumalanga 3-4 years
3 Droërivier B 1 100 New 400 kV S/S, 500 MVA
400/132 kV, 2 x 10 km Hydra-Droërivier 3 400 kV loop-in
Western Cape 4-5 years

GCCA-2022 Page 49 June 2015
3 Gamma 974 400 kV S/S, 3 x 500 MVA
400/132 kV, 2 x 4 km Hydra-Droërivier 2 400 kV loop-in
Northern Cape 4-5 years
3 Garona 624
400 kV S/S, 2 x 500 MVA 400/132 kV, 2 x 5 km Ferrum-Nieuwehoop 400 kV line loop-
in
Northern Cape 4-5 years
3 Koruson (Kappa) 276 132 kV S/S, 2 x 250 MVA
400/132 kV Western Cape 4-5 years
3 Nama 263 2 x 250 220/132 kV Northern Cape 4-5 years
3 Sterrekus 400 132 kV S/S, 2 x 500 MVA 400/132 kV Western Cape 4-5 years
3 Upington Solar Park 1 000
3 x 500 MVA 400/132 kV, 2 x 150 km Upington-Aries 1 and 2 plus 200 km Upington-Ferrum
400 kV line
Northern Cape 4-5 years
3 Vryheid 220 400 kV S/S, 2 x 250 MVA
400/132 kV, loop-in of Proteus-Bacchus 400 kV line
Western Cape 4-5 years
4 Blouwater/ Aurora B 1 325
New 400 kV S/S, 4 x 500 MVA 400/132 kV, 2 x 30 km Aurora-
Blouwater 400 kV line Western Cape 6-8 years
4 Boundary 690 New Ulco S/S, 2 x 500 MVA
400/132 kV, 170 km Beta-Ulco 400 kV line
Northern Cape 6-8 years
4 Delphi B 780
New 400 kV S/S, 3 x 500 MVA 400/132 kV, 2 x 50 km
Poseidon-Delphi 400 kV line loop-in
Eastern Cape 6-8 years
4 Gromis 440
New 400 kV busbar, 2 x 500 MVA 400/132 kV, 2 x 400 MVA 400/220 kV,
260 km 400 kV line and 130 km 400 kV line
Northern Cape 6-8 years
4 Hotazel 200
2 x 500 MVA 400/132 kV, 100 km Ferrum-Hotazel 400 kV line, 125 km Hotazel-Mookodi,
Mookodi-Hermes 190 km 400 kV line
North West 6-8 years
4 Houhoek 189.22 New 400 kV S/S, 2 x 500 MVA
400/132 kV, loop-in of the Bacchus-Palmiet 400 kV line
Western Cape 6-8 years
4 Hydra B 1 355 400 kV S/S, 4 x 500 MVA
400/132 kV, 2 x 10 km 400 kV Hydra-Poseidon line loop-in
Northern Cape 6-8 years

GCCA-2022 Page 50 June 2015
4 Hydra C 990 400 kV S/S, 4 x 500 MVA
400/132 kV, 2 x 10 km 400 kV Hydra-Perseus 1 line loop-in
Northern Cape 6-8 years
4 Hydra D 780 400 kV S/S, 4 x 400/132 kV 500 MVA, 2 x 10 km 400 kV Hydra-Perseus 1 line loop-in
Northern Cape 6-8 years
4 Komsberg B 1 300
4 x 400/132 kV 500 MVA, 2 x 10 km Droërivier-Bacchus 400 kV line loop-in, Komsberg
series cap de-rating
Western Cape 6-8 years
4 Makalu B 140 2 x 315 MVA 275/88 kV and 2 x 10 km 275 kV Lethabo-
Makalu line loop-in Free State 6-8 years
4 Matimba B 600
400 kV S/S, 3 x 500 MVA 400/132 kV and 2 x 10 km
Matimba-Witkop 400 kV line loop-in
Limpopo 6-8 years
4 Olien 1 100
400 kV S/S, 3 x 500 MVA 400/132 kV, 70 km Olien-Ulco 400 kV line, 107 km Ferrum-
Olien 400 kV line
Northern Cape 6-8 years
4 Oranjemond B 150
220 kV S/S, 250 MVA 220/132 kV and 5 km
Oranjemond-Gromis 220 kV loop-in
Northern Cape 6-8 years
4 Paulputs 250
400 kV S/S, replace 220/132 kV 125 MVA with 250 MVA
400/132 kV and 100 km 400 kV line
Northern Cape 6-8 years
4 Pembroke B 575
New 400 kV S/S, 3 x 500 MVA 400/132 kV, 150 km Poseidon-
Pembroke B 400 kV line and 150 km Pembroke B-Neptune
400 kV line
Eastern Cape 6-8 years
4 Poseidon B 883 New 400 kV S/S, 3 x 500 MVA
400/132 kV, 2 x 1.5 km Poseidon-Dedisa 400 kV line
Eastern Cape 6-8 years
4 Poseidon C 1 000
New 400 kV S/S, 3 x 500 MVA 400/132 kV, 2 x 60 km
Poseidon-Poseidon C 400 kV line
Eastern Cape 6-8 years
4 Sorata 307 400 kV S/S, 2 x 500 MVA
400/132 kV, 2 x 70 km Sorata-Ingula 400 kV line
Free State 6-8 years
4 Thyspunt 230 New 400 kV S/S, 2 x 250 MVA
400/132 kV, 2 x 90 km Thyspunt-Dedisa 400 kV line
Eastern Cape 6-8 years
4 Victoria B 750
400 kV S/S, 3 x 500 MVA 400/132 kV, 2 x 50 km Hydra-Droërivier 3 400 kV loop-in, Victoria series cap de-rating
Northern Cape 6-8 years
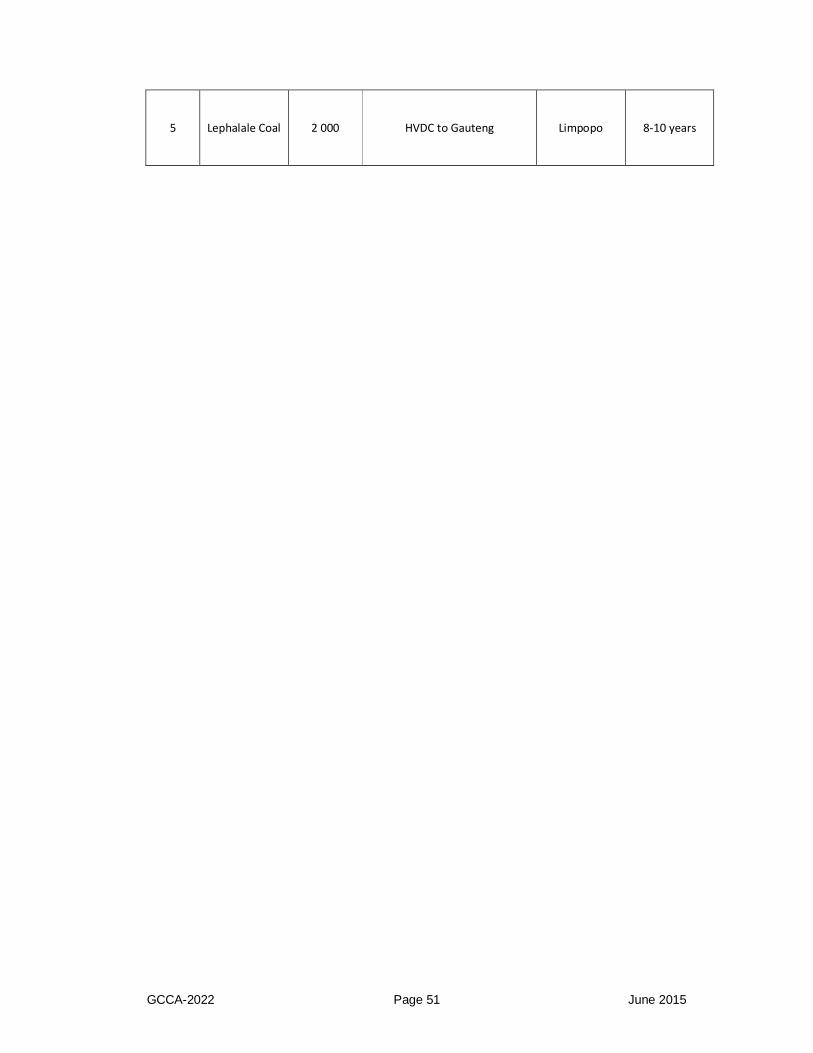
GCCA-2022 Page 51 June 2015
5 Lephalale Coal 2 000 HVDC to Gauteng Limpopo 8-10 years