Embed Size (px)
Citation preview

* Corresponding author: [email protected]
Generation and Proportion Assessment of Hospitals Infectious Waste in Bandung Region Indonesia
Novi Fitria1,2*, Enri Damanhuri1, Indah Rachmatiah Siti Salami1 , Venny Ulya Bunga1 and Yati Supriatin2
1Doctoral Program of Environmental Engineering, Bandung Institute of Technology (ITB), Bandung - Indonesia 2 Department of Chemistry, Higher Education School of Analyst Bakti Asih, Bandung - Indonesia
Abstract. The accurate information about generation quantities of waste generated is a
fundamental prerequisite for the successful implementation of any infectious waste
management plan. The objectives of this study were to determine the quantity of
generation rate and proportion of hospital infectious waste at Bandung region, Indonesia.
The generation and proportion of infectious waste data were collected by using direct
sampling method from 7 hospitals, which was completed for three days continuously in
hospitals inpatient installation. Afterwards, average generation and proportion were
determined in comparison to certain important organizational and functional factors, such
as the number of beds, bed coverage, the value of infectious waste management and
handling, accreditation status, waste handler status, ownership status, the different of type
and the class of hospital. The way that source of infectious wastes, generated from
hospitals, vary by functional factors, was also illustrated and the most important influenced
factors were identified. Generated infectious hospital wastes vary from 0.22 to 1.26
kg/patient/day. Proportion infectious hospital wastes also vary from 8, 88% to 47, 37%..
Keywords: Inpatient room; medical waste; generation rate; waste handling; waste
management.
1 Introduction
Based on World Health Organization (WHO), 85% of all
waste generated by healthcare facilities (hospital, clinic,
and laboratory) is general waste or domestic waste, 15%
others are include hazardous waste with proportion 10%
infectious hazardous health care waste and 5%
chemical/radioactive hazardous health care waste [1].
The hazardous proportion only 15%, but it may contain
such pathogens material which can caused infectivity and
other toxic, radioactive, carcinogenic, mutagenic or
teratogenicity materials therefore a healthcare facilities
requiring a safe management for their hazardous waste.
In 2015, Indonesian Ministry of Environment and
Forestry, issues the law that established the policy to
make some strategy of waste management that focus on
preventing the generating of hazardous waste from
healthcare facilities. Since its establishment, the
healthcare facilities still attempted to adopt the law in
their internal policy. Hospital is one of type from
healthcare facilities. Hospitals are required to provide
good services not only to the patients but also to ensure
the safety of workers and the environment. Hospital
waste based on Indonesian law regulation “PP 104/2014”
about the management of hazardous and toxic wastes
mention that hospital waste is a special waste, which is
highly hazardous due to its infection and/or toxic
capability. Workers and all member of public from
hospital can directly exposed by infectious and/or toxic
waste. All healthcare units had the same stages of
problem in waste management plans, those stages are
start from segregation, collection, packaging, storage,
transport, treatment and disposal [2].
Waste management especially infectious waste
management has become a critical issue as it poses
potential health risk to the patient, worker, society and
damage to the environment. In Indonesia, according to
Indonesia Hospital Community the data show the
estimation generation of medical waste ± 366 Ton/day
from 2.813 unit hospital all around Indonesia [3].
Furthermore to monitor the quantity and proportion of the
waste must be done related to their infectious and/or toxic
character. All steps of waste management system were
monitored and evaluated. The issue areas of each steps
will be presented here with influenced factors analysis in
order to maintain and improve the existing conditions,
and also to achieve a more effective, and more safety
management of infectious waste. Looking into the
existing condition of hospital infectious waste
management in Bandung Region it was thought to
https://doi.org/10.1051/e3sconf/2018730 , 0 (2018)E3S Web of Conferences 73ICENIS 2018
70 701818
© The Authors, published by EDP Sciences. This is an open access article distributed under the terms of the Creative Commons Attribution License 4.0 (http://creativecommons.org/licenses/by/4.0/).
undertake study to : (i) assess the qualitative factor
(hospital attribute) in handling and treatment of infectious
waste; (ii) quantitatively determine the amount of
infectious and non-infectious; (iii) analyze factor-factor
that influence the generation and proportion of infectious
waste from hospital.
2 Material and Methods
2.1 Study area
In Bandung area there were 35 hospitals with capacity
4941 beds. In order to represent the number of samples
then calculated the number of beds representing the
slovin formula. Based on the slovin calculations, from
population 4941 beds, 370 beds are minimum number of
bed that representing in this study. The sample was taken
from 7 hospitals that have given permission to this
research, from 7 hospitals we collected sample from 1001
beds. Thus the number of samples in this study has
represented the population of hospital beds in Bandung.
One of the hospitals has over 400 beds while the majority
of them variety between 100 and 300 beds. There five
hotels that determined as general hospital in this study.
General hospital providing out-patients services
diagnostic and medical treatment to in-patients, with a
great varies of medical condition diagnostic [1]. In
Indonesia the variety of diagnostic depend on the type
hospitals. There are four types hospitals in Indonesia :
Type A hospital (over 400 beds) , type B hospital
(between 300-400 beds), type C hospital (between 200-
300 beds) and type D (between 50-100 beds) hospital
(both for general and specific hospital). The scoop of this
study is calculated in-patient room generated waste at
different type of hospital.
2.2 Categories of infectious waste at hospital
Determination quantities and proportion of hospital
infection waste in-patient room become focus of study in
this research. According to similar study, categories of
hospital waste specially medical waste, divided into five
categories [4], there are (a) all material that contain blood
products and human blood (including plasma, blood
plaster, blood cotton batting, pampers, etc); (b) Sharps
(needles, scalpels, hypodermic needles, broken glasses,
etc); (c) Pathological wastes (organs, human tissues,
fluids, and other body parts); (d) Microbiological wastes
(stocks suspected to contain pathogens and laboratory
cultures); (d) Genotoxic wastes (cytotoxic wastes
chemicals and cytotoxic drugs). In Indonesia medical
waste from hospital divided into hazardous -infectious
waste and Hazardous non – infectious waste. Base on
regulation medical waste should be placed into different
color of plastic bags. Yellow plastic bag for infectious
waste, purple plastic bags for cytotoxic waste, brown
plastic bag for pathology waste and red plastic bag for
radioactive waste.
Before we start the study, we make a pilot hospital
(RSAU. Salamun Hospital) to justify the generation of
domestic waste and medical waste (infectious and non-
infectious waste), the data showed in Fig.2. From total
hospital waste 522,3kg/day consist 397,14kg/day
domestic waste and 125,17kg/day hazardous waste which
include 12,35kg/day non-infection waste and
112,82kg/day infectious waste.
Domestic wastes have 76% from total hospital waste
and 24% of hazardous waste, consists 22% infectious
waste and 2% non-infectious waste. The data showed at
Table 1.
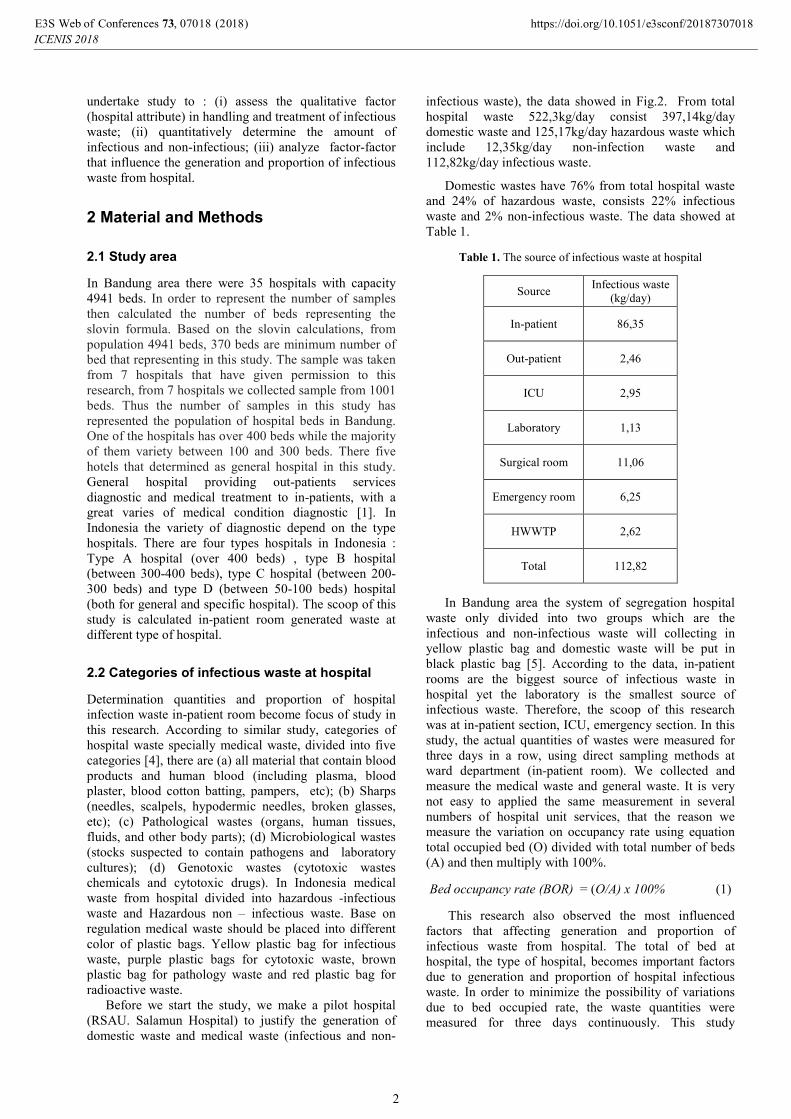
Table 1. The source of infectious waste at hospital
Source Infectious waste
(kg/day)
In-patient 86,35
Out-patient 2,46
ICU 2,95
Laboratory 1,13
Surgical room 11,06
Emergency room 6,25
HWWTP 2,62
Total 112,82
In Bandung area the system of segregation hospital
waste only divided into two groups which are the
infectious and non-infectious waste will collecting in
yellow plastic bag and domestic waste will be put in
black plastic bag [5]. According to the data, in-patient
rooms are the biggest source of infectious waste in
hospital yet the laboratory is the smallest source of
infectious waste. Therefore, the scoop of this research
was at in-patient section, ICU, emergency section. In this
study, the actual quantities of wastes were measured for
three days in a row, using direct sampling methods at
ward department (in-patient room). We collected and
measure the medical waste and general waste. It is very
not easy to applied the same measurement in several
numbers of hospital unit services, that the reason we
measure the variation on occupancy rate using equation
total occupied bed (O) divided with total number of beds
(A) and then multiply with 100%.
Bed occupancy rate (BOR) = (O/A) x 100% (1)
This research also observed the most influenced
factors that affecting generation and proportion of
infectious waste from hospital. The total of bed at
hospital, the type of hospital, becomes important factors
due to generation and proportion of hospital infectious
waste. In order to minimize the possibility of variations
due to bed occupied rate, the waste quantities were
measured for three days continuously. This study
https://doi.org/10.1051/e3sconf/2018730 , 0 (2018)E3S Web of Conferences 73ICENIS 2018
70 701818
2

conducted in month January – August in 2017, the
permission research procedure in hospital were very
difficult so it takes a long time to finish the sampling of
generation and proportion waste in 7 hospitals at
Bandung area.
3 Results and Discussion
3.1. Generation rates of Hospital Infectious waste
The generation rates of hospital infectious waste were
collected from seven (7) hospitals in Bandung region.
From 7 hospitals it consist 5 general hospitals and 2
specified hospitals. First we calculated the generation
rates from all hospitals and then we also calculated the
generation rates from general hospitals only. The analysis
data used the scatter plot to determine the correlation
coefficient (r) between total of beds due to infectious
waste generation rates with scale (kg/day), and between
total of occupied beds due to infectious waste generation
rates with scale (kg/day).
The aim from this comparison is to analyzed, which
one from the scale is more accurate to measure the
infectious generation rates from hospital. The scatter
plots showed that there is a significant correlation
between total of beds with infectious generation rates.
The value of coefficient correlation (r) was gain by
square rooted the R2 value. From the result, the number
of occupied bed parameters gave the highest value of
coefficient correlation in infectious generation rates from
in-patient room. The scatter plots were presents in Fig.1,
Fig 2, Fig.3 and Fig 4.
Fig.1. The correlation between infectious waste (kg/day)
with total of beds (from 7 hospitals)
Fig.2. The correlation between infectious waste (kg/day)
with total of beds (from general hospitals only)
The scatter plot between total of beds and the
generated quantities of infectious waste (kg/day) for all
hospitals and for general hospital only showed that, there
is a linier relationship with a better linier correlation
coefficient (r = 0,9376) with regression value y = 0,2407x
+ 12,783.
Fig.3. The correlation between infectious waste (kg/day)
with total of occupied beds (from 7 hospitals)
Fig.4. The correlation between infectious waste (kg/day)
with total of occupied of beds (general hospitals)
To predict quantities of infectious waste, an equation
between variable independent (total of beds; total of
occupied beds) and variables dependent (infectious waste
generation rates (kg/day) can be recap from each scatter
plot.
Table 2. Correlation between quantities infectious waste
with number of beds and number of occupied bed
Parameters
coefficient
correlation
(r)
Regression Sig
(p-value)
Average of infectious waste (kg/day) from 7 hospitals � all
type hospitals
Total of beds 0,9329 y= 0,265x+6,1798 0,000
Total of
occupied bed 0,9376 y= 0,2407x+12,783 0,000
Average of infectious waste (kg/day) from 5 hospitals� general
hospital type only
Total of bed 0,9229 y= 0,3624x+13,669 0,000
https://doi.org/10.1051/e3sconf/2018730 , 0 (2018)E3S Web of Conferences 73ICENIS 2018
70 701818
3

Total of
occupied bed 0,9308 y= 0,3373x+21,054 0,000
This results show there is a significant correlation
between generations of infectious waste with number of
occupied beds hospital. Table 3 presents a case where
quantities of hospital infectious wastes (kg/day) from 7
hospitals are estimated using (a) the formula y= 1,0579x
– 33,256 [6]; and (b) formula y= 0,2407x + 12,783
(Table.4), the “x” are symbol from total of occupied beds.
The average of infectious wastes (kg/day) also tested
using analysis of variance (anova) one way, to test is
there any significant differ of average infectious wastes
between survey result, formula a and formula b. The
anova analysis shows that p-value is 0,777 > 0,05 its
means There are no significant difference between survey
result, Sanida formula y= 1,0579x – 33,256 and y=
0,2407x + 12,783 formula.
Table 3. Results of this study compared to Sanida
estimations.
Hospital
Code
Observed
results
(a)
Sanida formula y=1,0579-33,256
(b)
y= 0,2407x + 12,783
Average of hospital infectious waste (kg/day) from 7 hospitals
1 67,17 90,52 40,94
2 122,28 293,64 87,16
3 52,05 -2,58 19,76
4 2,69 -21,62 15,43
5 14,7 -14,21 17,12
6 45,25 51,38 32,04
7 16,58 27,04 26,50
Total 320,72 424,16 238,95
Average 45,82 60,59 34,14
The most important phase from developing of risk
analysis from infectious waste management is determined
the infectious generation rates from Healthcare facilities.
The domestic waste is produced from different services
unit services at hospital, from non-medical activities such
as: administration department, housekeeping, food
product [7-8]. The infectious wastes had potential to
transmission of diseases, contain pathogenic microbe,
sufficient virulence that the doses enough to spread the
diseases. From this study, the number of occupied beds
have influence factor much better than only number of
beds to produced infectious waste generation rates, yet in
the field the ambiguity of definition infectious waste
might lead to mismanagement of the waste and can affect
the generation waste of infectious wastes and also affect
the proportion of infectious wastes. The knowledge of
healthcare facilities worker also need to improve
continuously for good practice of infectious waste
management.
3.2 Proportion of infectious wastes
Based on the calculation result, the average
proportion of infectious waste based on the type of
hospital between general hospital and specialized hospital
is 36.9% and 29.4% gives p value 0,101 > 0,05 then H0 is
accepted and H1 is rejected, hence can be concluded
mean inflation waste proportion is not significantly
different or same. Fig.8, Fig.9 and Fig.10. The recap of
significant test is present at Table 4. Based on hospital
attribute the 7 hospital consists: (a) 1 hospital with A
level ; (b) 2 hospital with B level; (c) 3 hospital C level;
and (d) 1 hospital with D level. The proportion estimated
by formula:
TW = IW + DM (2)
Proportion Infectious waste = (IW/TW) x 100% (3)
IW = Infectious waste
DW = Domestic waste
TW = Total waste
To analyze the influence factor to the proportion
infectious waste, the significant test using independent t-
test and one way anova.
Table 4. Statistic recap for proportion infectious
wastes based on hospital attribute
Independent
variable Sig (p-value)
Type of
hospital 0,101 p-value > 0,05
Level of
hospital 0,001 p-value < 0,05
Ownership
status 0,807 p-value > 0,05
Cleaning
service status 0,002 p-value < 0,05
The proportion of infectious wastes are varies greatly
among hospital. For total infectious waste, plaboot or
intravenous bag is the main source of infectious waste
which is contains plastics and textile. Plaboot or
intravenous bag proportion in total hazardous waste can
reach 35,2% [9]. As shown at Table 6, the influence
factors on proportion infectious waste are level of
hospital and cleaning service status. Level hospital in
Indonesia divided into 4 level (level A, B, C, and D).
Determination of level hospital based on number of beds
and the facility of treatment. The hospitals which had the
most complete facility will gain level A, and the lowest
of type of treatment facility will gain level D.
Observation on the field reveals that visitors of
hospitals in Bandung area less knowledge about
https://doi.org/10.1051/e3sconf/2018730 , 0 (2018)E3S Web of Conferences 73ICENIS 2018
70 701818
4

segregation waste, especially between infectious waste
and general waste. The visitor didn’t aware about the
differences of color the plastic bags. Sometimes the
visitor of hospital put the general waste into yellow
plastic bag. This condition obviously can cause the
increasing of generation rates and proportion infectious
waste at hospital. Beside visitors factor, quality of waste
segregation depends on many factors, but its strongly
relevant with employee involvement. Training program
and socialization about segregation of hospital waste has
improved segregation process, which has resulted in a
significant reduction in the volume of healthcare waste
and costs [10-11]. The improper of infectious waste
management also can cause the increasing of generation
and proportion of infectious waste, according to [12]
awareness level from cleaning services status affected the
hospital infectious waste management. To improve the
proper hospital infectious waste management, Ministry of
Environment and Forestry Indonesia trough government
regulation No.P.56/MENLHK-SETJEN/2015 attached
several chapters that contain the procedures about
handling, treatment, reduce, reuse and recycling
infectious waste, but unfortunately this regulation did not
relevant with other government regulation from Ministry
of Health Indonesia that mention any infectious waste
cannot be reduce, reuse or recycling. This situation makes
the healthcare facility management include hospital
management confuse and finally prefer to follow the
regulation from Ministry of Health Indonesia. Another
problem of infectious waste management in Bandung
region is the limitation of disposal and treatment facility.
However, government commitment and support the
proper implementation of infectious waste management
for universal long-term environmental improvement.
At the end, the carbon factor will be associated with
medical waste management. There are have been very
limited number of studies that have looked at the carbon
emission associated with medical waste management.
From this study, it provide information to start infectious
waste management strategy to reduce carbon footprint in
the future
4 Conclusions
Respectively, the average of generation waste of total
medical waste, infectious waste and general waste in
Bandung area are 0,91 ; 0,31 and 0,60kg/bed. Total
proportion of hospital medical waste generated in
Bandung area, 66,22% consisted of general waste and
33,77% infectious waste; The correlation and equation of
infectious waste generation rate optimum at correlation
coefficient 0,9376 with equation y= 0,240x+12,783 in
this study. The comparison of amount proportion
infectious waste among the seven studied hospitals
showed significant differences at level hospital and status
of cleaning service.
Based on this study, the current situation of infectious
waste management in Bandung region urgently needs to
improve the implementation in segregation process due to
reduce the volume of infectious waste. The knowledge of
cleaning service workers also need to improve by attends
the training program. At temporary storage area, the
infectious waste mostly getting overload that caused third
party schedule. The limitations of third party to collected
infectious waste become serious problem for infectious
waste management. Government must take an action for
alternative regulation and policy to prevent the overload
capacity from hospital temporary storage. Most of the
hospital temporary storage doesn’t have air conditioner or
freezer facility to maintain the temperature of the storage.
The delay collection schedule from third party can
affected the healthness of healthcare facility workers and
patient and also affected the environment.
This study was funded by Ministry of Science and Technology
Indonesia. The authors wish to thank all of the members of the
survey team, analysis team and the hospitals that participated in
the research.
References
1. WHO, Safe management of waste from health-care
facilities 2nd edition, 3 (2014)
2. M. Tsakona, E. Anagnostopoulou, E. Gidarakos,
Waste Management. 27, 912-920 (2007)
3. MenLHK (Ministry of Environment and Forestry).
http://ppid.menlhk.go.id/siaran_pers/browse/1169.
(2018)
4. Indonesia government regulation. PP no 101/2014.
Management of Hazardous waste (2014).
5. N. Fitria, E. Damanhuri, I.R.S. Salami, Matec Web
Conff SIBE, 147, 08004, (2018)
6. G. Sanida, A. Karagiannidis, F. Mavidou, D.
Vartzopoulus, N. Maoussiopoulos, S. chatzopoulos,
Waste management, 30, 532-538 (2010)
7. H. Taghipour, M. Mosaferi, Science of The Total
Environment, 407, 1537-1535 (2009)
8. M. Chaerul, M.Tanaka, A.V. Shekdar, Waste
management, 28, 442-449 (2008)
9. N. Fitria, E. Damanhuri, IWWG-ARB, Seminar
publish (2017)
10. M. Mosquera, M.J.A. Prado, G.R. Caravaca, P.
Latasa, M.E. Mosquera, American Journal of
Infection Control, 42, 894-897 (2014)
11. G. Patil, K. Pokhrel, Waste Management, 25, 592-
599 (2005)
12. N. Fitria, E. Damanhuri, I.R.S. Salami, IOP
Conf.Series : Earth and Environmental Science, 160,
012012 (2018)
https://doi.org/10.1051/e3sconf/2018730 , 0 (2018)E3S Web of Conferences 73ICENIS 2018
70 701818
5