Embed Size (px)
Citation preview
2021
Jairo Yunis and Elmira Aliakbari
GENERATION AND MANAGEMENT OF MUNICIPAL SOLID WASTE
How’s Canada Doing?

July 2021
Fraser Institute
Generation and Management of Municipal Solid Waste:
How’s Canada Doing?
by Jairo Yunis and Elmira Aliakbari

fraserinstitute.org
Contents
Executive Summary / i
Introduction / 1
Waste generation, disposal, and diversion in Canada / 4
Waste generation, disposal, and diversion in Canadian provinces / 11
Conclusion / 20
References / 21
About the Authors / 24
Acknowledgments / 24
Publishing Information / 25
Supporting the Fraser Institute / 26
Purpose, Funding, and Independence / 26
About the Fraser Institute / 27
Peer review —validating the accuracy of our research / 27
Editorial Advisory Board / 28

fraserinstitute.org
Yunis and Aliakbari • Generation and Management of Municipal Solid Waste: How’s Canada Doing? • i
fraserinstitute.org
Executive Summary
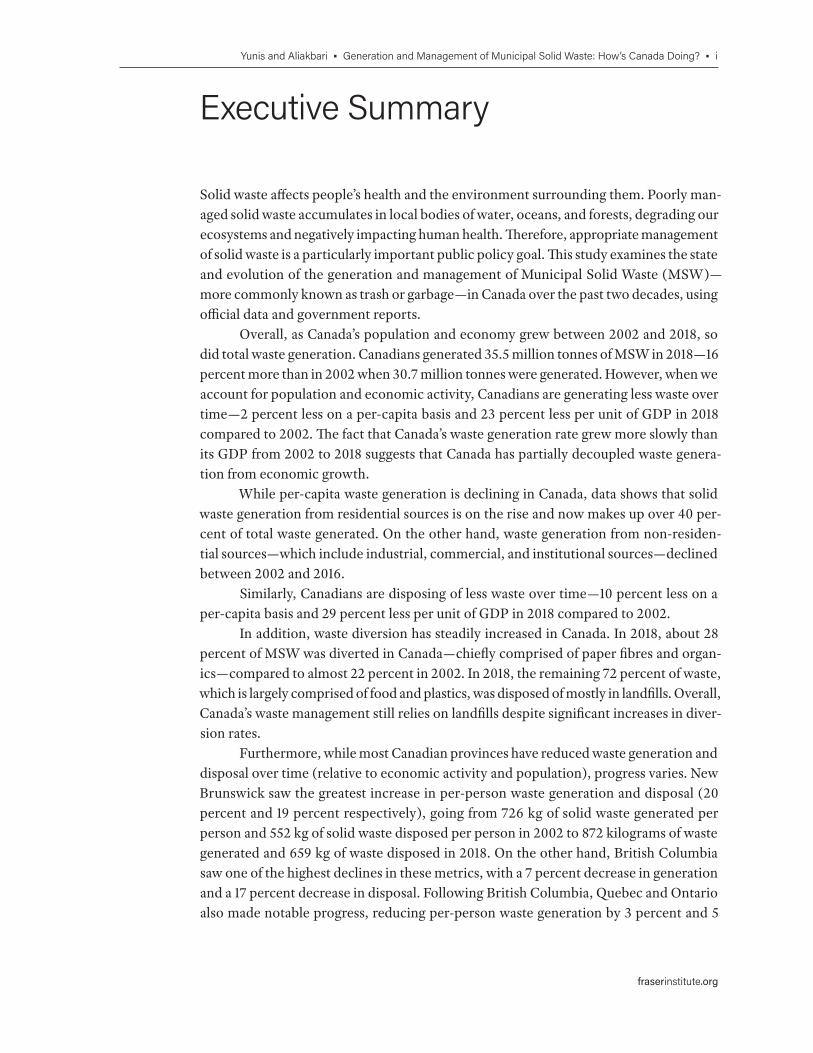
Solid waste affects people’s health and the environment surrounding them. Poorly man-aged solid waste accumulates in local bodies of water, oceans, and forests, degrading our ecosystems and negatively impacting human health. Therefore, appropriate management of solid waste is a particularly important public policy goal. This study examines the state and evolution of the generation and management of Municipal Solid Waste (MSW)—more commonly known as trash or garbage—in Canada over the past two decades, using official data and government reports.
Overall, as Canada’s population and economy grew between 2002 and 2018, so did total waste generation. Canadians generated 35.5 million tonnes of MSW in 2018—16 percent more than in 2002 when 30.7 million tonnes were generated. However, when we account for population and economic activity, Canadians are generating less waste over time—2 percent less on a per-capita basis and 23 percent less per unit of GDP in 2018 compared to 2002. The fact that Canada’s waste generation rate grew more slowly than its GDP from 2002 to 2018 suggests that Canada has partially decoupled waste genera-tion from economic growth.
While per-capita waste generation is declining in Canada, data shows that solid waste generation from residential sources is on the rise and now makes up over 40 per-cent of total waste generated. On the other hand, waste generation from non-residen-tial sources—which include industrial, commercial, and institutional sources—declined between 2002 and 2016.
Similarly, Canadians are disposing of less waste over time—10 percent less on a per-capita basis and 29 percent less per unit of GDP in 2018 compared to 2002.
In addition, waste diversion has steadily increased in Canada. In 2018, about 28 percent of MSW was diverted in Canada—chiefly comprised of paper fibres and organ-ics—compared to almost 22 percent in 2002. In 2018, the remaining 72 percent of waste, which is largely comprised of food and plastics, was disposed of mostly in landfills. Overall, Canada’s waste management still relies on landfills despite significant increases in diver-sion rates.
Furthermore, while most Canadian provinces have reduced waste generation and disposal over time (relative to economic activity and population), progress varies. New Brunswick saw the greatest increase in per-person waste generation and disposal (20 percent and 19 percent respectively), going from 726 kg of solid waste generated per person and 552 kg of solid waste disposed per person in 2002 to 872 kilograms of waste generated and 659 kg of waste disposed in 2018. On the other hand, British Columbia saw one of the highest declines in these metrics, with a 7 percent decrease in generation and a 17 percent decrease in disposal. Following British Columbia, Quebec and Ontario also made notable progress, reducing per-person waste generation by 3 percent and 5
ii • Generation and Management of Municipal Solid Waste: How’s Canada Doing? • Yunis and Aliakbari
fraserinstitute.org
percent, respectively, and by reducing their waste disposal per person figures by 16 per-cent and 12 percent, respectively.
Overall, Nova Scotia and British Columbia have the lowest disposal rates in the country, relative to both economic activity and population, while Manitoba has one of the highest.
Similarly, almost all provinces increased their diversion rates (i.e., the amount of MSW diverted as a proportion of waste generated) since 2002, with the exceptions of Manitoba and Alberta. Nova Scotia, which increased its diversion rate by 12 percent between 2002 and 2018, has the highest diversion rate in the country with almost half of its total amount of waste generated diverted from landfills. British Columbia is a close second with a diversion rate of almost 40 percent while Newfoundland and Labrador has the lowest diversion rate, at 10 percent. The largest provinces, Ontario and Quebec, have diversion rates of 25 percent and 33 percent, respectively.
Overall, the evidence illustrates that, when we account for population and eco-nomic activity, Canada has generated and disposed of less waste over the past two dec-ades. On balance, the fact that Canada partially decoupled solid waste generation and dis-posal from economic growth is good news for the environment. Moreover, the country’s progress in reducing per-capita solid waste disposal and waste disposal intensity, paired with increasing diversion rates, speaks volumes for Canada’s stellar environmental per-formance and builds on its already impressive environmental track record.
Yunis and Aliakbari • Generation and Management of Municipal Solid Waste: How’s Canada Doing? • 1
fraserinstitute.org
1. Introduction
What is Solid Waste And How Do We Manage It?Solid waste is one of those topics that impacts every one of us. We all generate waste in some form or another. But we don’t usually stop and think about the details of how much waste we generate, where it goes, and the impact it has on the environment. Over the last few decades, however, there has been an increasing awareness campaign focusing on reducing, reusing, and recycling solid waste—commonly called the three Rs—in Canada and worldwide. Additionally, reducing solid waste became a key environmental perform-ance metric after the adoption of the United Nation’s Sustainable Development Goals.
Solid waste, in broad terms, refers to discarded materials generated from eco-nomic activity. It can be hazardous or non-hazardous in nature and is generated from many sources including industrial, residential, commercial, and institutional. Generally, solid waste can be characterized into two categories depending on the source and end-of-life generation stage. Upstream waste is generated when resources are processed into material and goods, while downstream waste is generated after goods or materials are consumed (Ecofiscal Commission, 2018). In this report we focus on downstream solid waste, which is commonly known as Municipal Solid Waste (MSW). [1]
MSW includes waste generated by residential and industrial, commercial and insti-tutional (ICI) sources. It is primarily non-hazardous; however, it includes small quan-tities of hazardous materials (residential and non-residential) that require specialized collection, treatment, and disposal (Environment and Climate Change Canada, 2021). Examples of MSW include food scraps, electronics, used packaging, old computers, newspapers, and food waste generated by businesses and households.
Generally, municipalities have two main alternatives to manage MSW: disposal and diversion. [2] Waste disposal refers to how we get rid of the MSW that is generated, whether by transporting it to landfills (an open site or facility where waste is stored) or incinerating it in waste-to-energy facilities, municipal wastewater sludge incinerators, or biomedical incinerators. Solid waste diversion, on the other hand, refers to the prep-aration of MSW for recycling, composting, and re-using activities (Environment and Climate Change Canada, 2018a; Statistics Canada, 2018).
Overall, poorly managed solid waste can have a negative impact on public health and the environment. Waste management and recycling programs are costly but con-tribute to the public good by directly reducing litter and trash. In some cases, recycling
[1] In this report, the terms municipal solid waste, waste, and solid waste are used interchangeably.[2] In the waste management hierarchy, waste prevention (which refers to any action to avoid waste gen-eration) is the preferred option to manage MSW. However, measuring waste prevention is challenging as it represents waste that was never created. Currently, there is no available data on waste prevention.
2 • Generation and Management of Municipal Solid Waste: How’s Canada Doing? • Yunis and Aliakbari
fraserinstitute.org
programs may also generate processed waste products which can be resold. Note, how-ever, that households tend to separate the most valuable among their discarded goods either for selling themselves or donating to thrift shops. The residuals which are placed in the trash or recycling stream tend therefore to be the least valuable materials.
It is important to also note that diverting systems also have environmental foot-prints. There are some cases where manufacturing products from recycled materials requires more energy and resources than does manufacturing the same products from primary raw materials (Brown et al., 2004). However, the environmental costs associated with diversion are typically smaller than disposal systems (EPA, 2021; Environment and Climate Change Canada, 2021). In other words, waste diversion is a more environment-ally friendly method of waste management in comparison to waste disposal.
Nonetheless, it should be pointed out that the evidence is mixed regarding whether waste recycling is a cost-effective strategy to manage solid waste, especially when we account for both financial variables and environmental factors. While some studies have found recycling resulting in overall costs savings for waste management systems (Tonjes and Mallikarjun, 2013; Lavee, 2010), others have found that recycling costs tend to exceed the benefits (Tanskanen et al., 1998; Modak and Everett, 1996).
Who Is Involved?In Canada, MSW management is a shared responsibility between federal, provincial, and municipal governments. However, the bulk of the operation lies on municipal gov-ernments as they manage the collection, disposal, and recycling of both residential and non-residential solid waste. Municipalities manage MSW either directly by using their own government staff or through private contracting firms.
On the other hand, provincial and territorial authorities regulate MSW manage-ment by establishing policies, strategies, targets, and programs and approving and mon-itoring waste management facilities and operations.
The federal government, besides regulating the international and interprovincial move-ments of hazardous waste and recyclable materials, sets standards and identifies the best prac-tices for MSW management by publishing reports and recommendations. Additionally, it collects data, supports research and development, and provides fiscal incentives for recycling.
This complementary nature of MSW management is a key component of the Aspirational Canada-wide Waste Reduction Goal. On November 2018, the Canadian Council of Ministers of the Environment, composed of environment ministers from the federal, provincial, and territorial governments, set a non-binding aspirational goal of reducing per-capita solid waste disposal to 490 kg by 2030 and 350 kg by 2050 (Environment and Climate Change Canada, 2018b).
Objective and Main FindingsThe purpose of this study is to track the state and progress of municipal solid waste gen-eration and management in Canada over the last two decades. Section 2 breaks down Canada-wide data on solid waste generation, disposal, and diversion between 2002 and
Yunis and Aliakbari • Generation and Management of Municipal Solid Waste: How’s Canada Doing? • 3
fraserinstitute.org
2018. Section 3 analyzes and compares provincial data on MSW generation, disposal, and diversion between 2002 and 2018 while also describing some of the programs and objectives provinces have set for themselves.
Overall, the evidence shows that when we account for population and economic activity, Canada has generated and disposed of less waste over the past two decades. In particular, Canadians are generating less waste over time—2 percent less on a per-capita basis, and 23 percent less per unit of GDP in 2018 compared to 2002. In addition, per-capita waste disposal also declined by 10 percent during this period while disposal inten-sity, which measures MSW disposed of per unit of GDP, declined by 29 percent.
The fact that Canada’s waste generation and disposal grew significantly more slowly than its GDP from 2002 to 2018 suggests that Canada has partially decoupled waste gen-eration and disposal from economic growth.
Moreover, the data shows a shift in the sources of MSW generation. While non-residential sources continue to account for most of the solid waste generated in Canada (56 percent of total waste generated), its share has been declining since 2002 when it stood at 64 percent. Consequently, MSW generated by residential sources has increased from 11.2 million tonnes in 2002 to 15 million tonnes in 2016, making up 44 percent of total solid waste generated in Canada.
In addition, waste diversion has steadily increased in Canada. In 2018, about 28 percent of waste was diverted in Canada—chiefly comprised of paper fibres and organ-ics—compared to almost 22 percent in 2002. In 2018, the remaining 72 percent of waste, which is largely comprised of food and plastics, was disposed of mostly in landfills. Overall, Canada’s waste management still relies heavily on landfills despite significant increases in diversion rates.
Furthermore, while most Canadian provinces have reduced waste generation and disposal over time (relative to economic activity and population), progress varies. New Brunswick saw the greatest increase in per-person waste generation and disposal (20 percent and 19 percent increases, respectively), going from 726 kg of solid waste gener-ated per person and 552 kg of solid waste disposed per person in 2002 to 872 kg of waste generated and 659 kg of waste disposed of in 2018. On the other hand, British Columbia saw one of the the highest declines in these metrics—a 7 percent decrease in generation and a 17 percent decrease in disposal. Following British Columbia, Quebec and Ontario also made notable progress by reducing per-person waste generation by 3 percent and 5 percent, respectively, and by reducing their per person waste disposal figures by 16 per-cent and 12 percent, respectively.
With respect to waste diversion, almost all provinces have increased their diver-sion rates since 2002, with the exceptions of Manitoba and Alberta. Nova Scotia, which increased its diversion rate by 12 percent between 2002 and 2018, has the highest diver-sion rate in the country with almost half of its total amount of waste generated diverted from landfills. British Columbia is a close second with a diversion rate of almost 40 per-cent while Newfoundland and Labrador has the lowest diversion rate, at 10 percent.
4 • Generation and Management of Municipal Solid Waste: How’s Canada Doing? • Yunis and Aliakbari
fraserinstitute.org
2. Waste Generation, Disposal, and Diversion in Canada
In most countries, the amount of waste generated tends to increase generally in line with population and economic growth. However, not all waste is treated equally. It is important to recognize the difference in treatment between waste disposed and waste diverted. The former is considered garbage and is sent to landfills or to an incineration plant, while the latter is treated as a commodity and sent to recycling and composting facilities for processing and re-use.
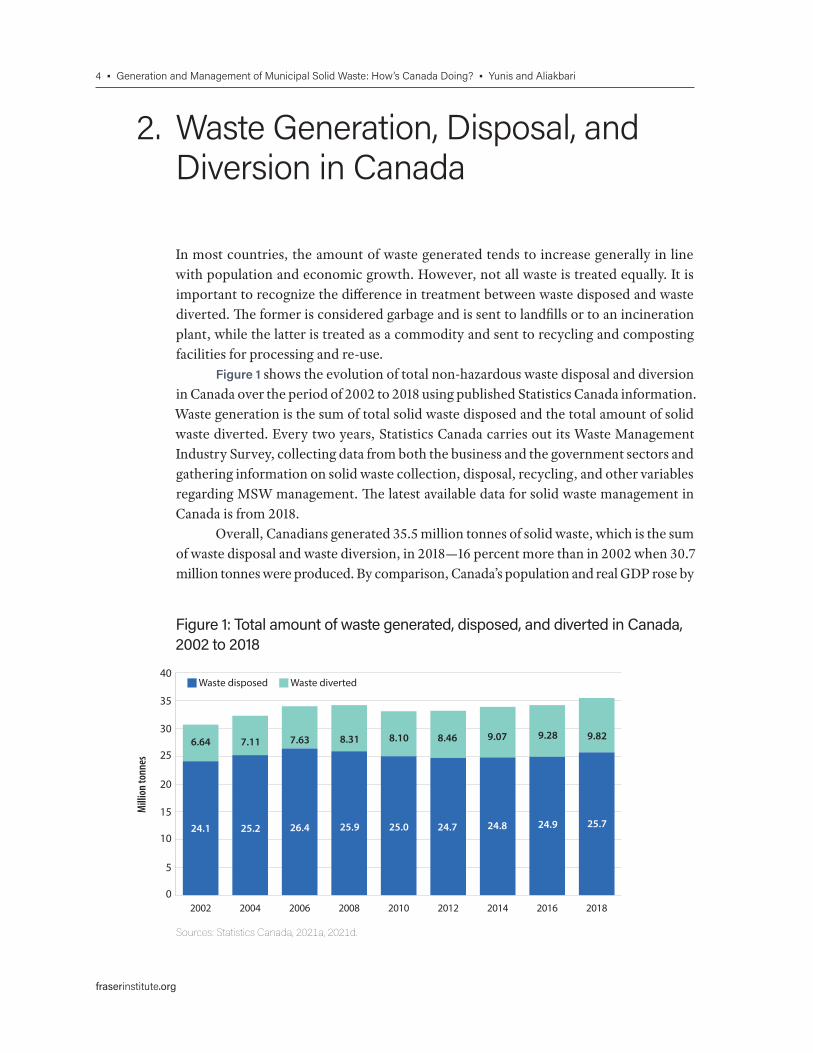
Figure 1 shows the evolution of total non-hazardous waste disposal and diversion in Canada over the period of 2002 to 2018 using published Statistics Canada information. Waste generation is the sum of total solid waste disposed and the total amount of solid waste diverted. Every two years, Statistics Canada carries out its Waste Management Industry Survey, collecting data from both the business and the government sectors and gathering information on solid waste collection, disposal, recycling, and other variables regarding MSW management. The latest available data for solid waste management in Canada is from 2018.
Overall, Canadians generated 35.5 million tonnes of solid waste, which is the sum of waste disposal and waste diversion, in 2018—16 percent more than in 2002 when 30.7 million tonnes were produced. By comparison, Canada’s population and real GDP rose by
Figure 1: Total amount of waste generated, disposed, and diverted in Canada, 2002 to 2018
Sources: Statistics Canada, 2021a, 2021d.
0
5
10
15
20
25
30
35
40
201820162014201220102008200620042002
Waste disposed Waste diverted
Mill
ion
tonn
es
6.64 7.11 7.63 8.31 8.10 8.46 9.07 9.28 9.82
24.1 25.2 26.4 25.9 25.0 24.7 24.8 24.9 25.7
Yunis and Aliakbari • Generation and Management of Municipal Solid Waste: How’s Canada Doing? • 5
fraserinstitute.org
18 percent and almost 50 percent, respectively, over the same period (Statistics Canada, 2021a; Statistics Canada, 2021b). Of the total amount of solid waste generated in 2018, 72 percent was disposed of (landfills, incineration, or export) while 28 percent was diverted. In 2016 (the most recent data available), most of Canada’s disposed solid waste went to landfill sites in Canada (82 percent), 15 percent was exported to the United States, while 3 percent was incinerated (Environment and Climate Change Canada, 2020).
Nationally, the amount of waste disposal reached 25.7 million tonnes in 2018—3 percent higher than 2016 levels and 7 percent above 2002 levels when waste disposal stood at 24.4 and 24.1 million tonnes, respectively.
Similarly, the total amount of waste diverted (reused, recycled, or composted) increased considerably over the same period. In 2002, Canadians diverted 6.6 million tonnes of solid waste. By 2018, the total amount of MSW diverted increased by 48 per-cent to reach 9.8 million tonnes.
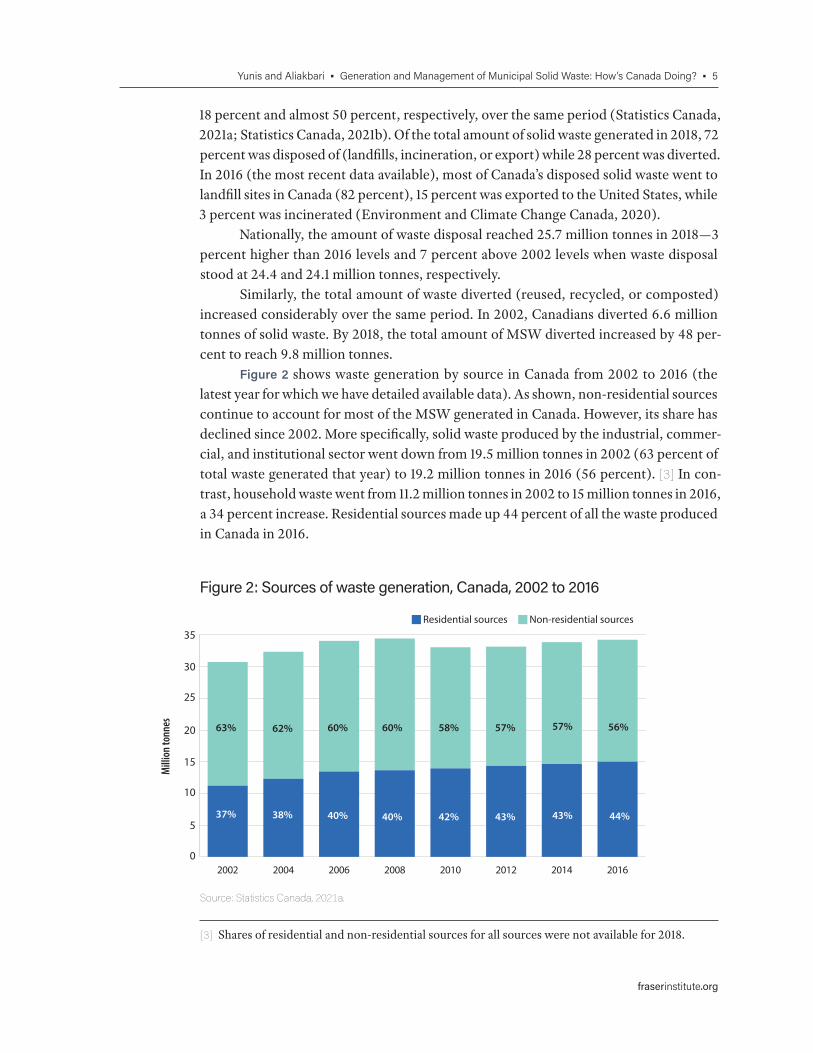
Figure 2 shows waste generation by source in Canada from 2002 to 2016 (the latest year for which we have detailed available data). As shown, non-residential sources continue to account for most of the MSW generated in Canada. However, its share has declined since 2002. More specifically, solid waste produced by the industrial, commer-cial, and institutional sector went down from 19.5 million tonnes in 2002 (63 percent of total waste generated that year) to 19.2 million tonnes in 2016 (56 percent). [3] In con-trast, household waste went from 11.2 million tonnes in 2002 to 15 million tonnes in 2016, a 34 percent increase. Residential sources made up 44 percent of all the waste produced in Canada in 2016.
[3] Shares of residential and non-residential sources for all sources were not available for 2018.
Figure 2: Sources of waste generation, Canada, 2002 to 2016
Source: Statistics Canada, 2021a.
0
5
10
15
20
25
30
35
20162014201220102008200620042002
Residential sources Non-residential sources
Mill
ion
tonn
es 63% 62% 60% 60% 58% 57% 57% 56%
37% 38% 40% 40% 42% 43% 43% 44%
6 • Generation and Management of Municipal Solid Waste: How’s Canada Doing? • Yunis and Aliakbari
fraserinstitute.org
Similar to waste generation, most of the waste disposed of comes from the non-residential sector. More specifically, in 2018, 58 percent came from non-residential sources and the residential sector accounted for 42 percent. However, these propor-tions have changed over time. The share of non-residential solid waste decreased from 65 percent in 2002 to 58 percent in 2018 while the share of residential solid waste increased from 35 percent in 2002 to 42 percent in 2018.
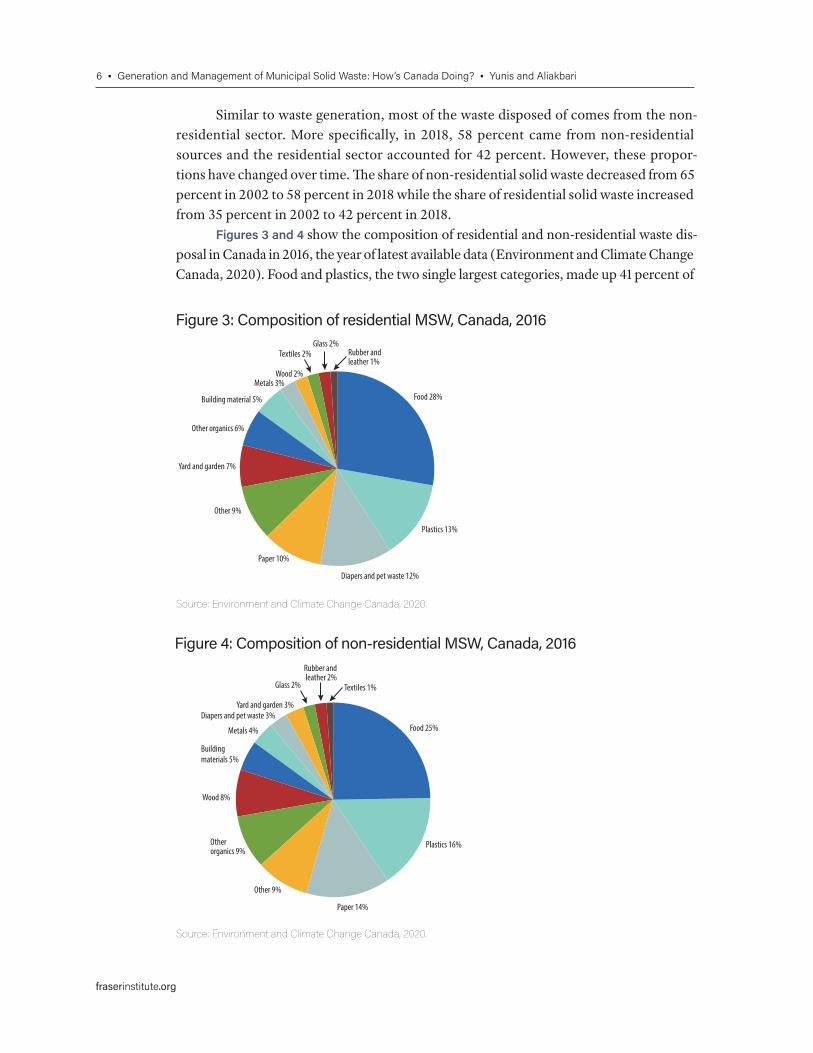
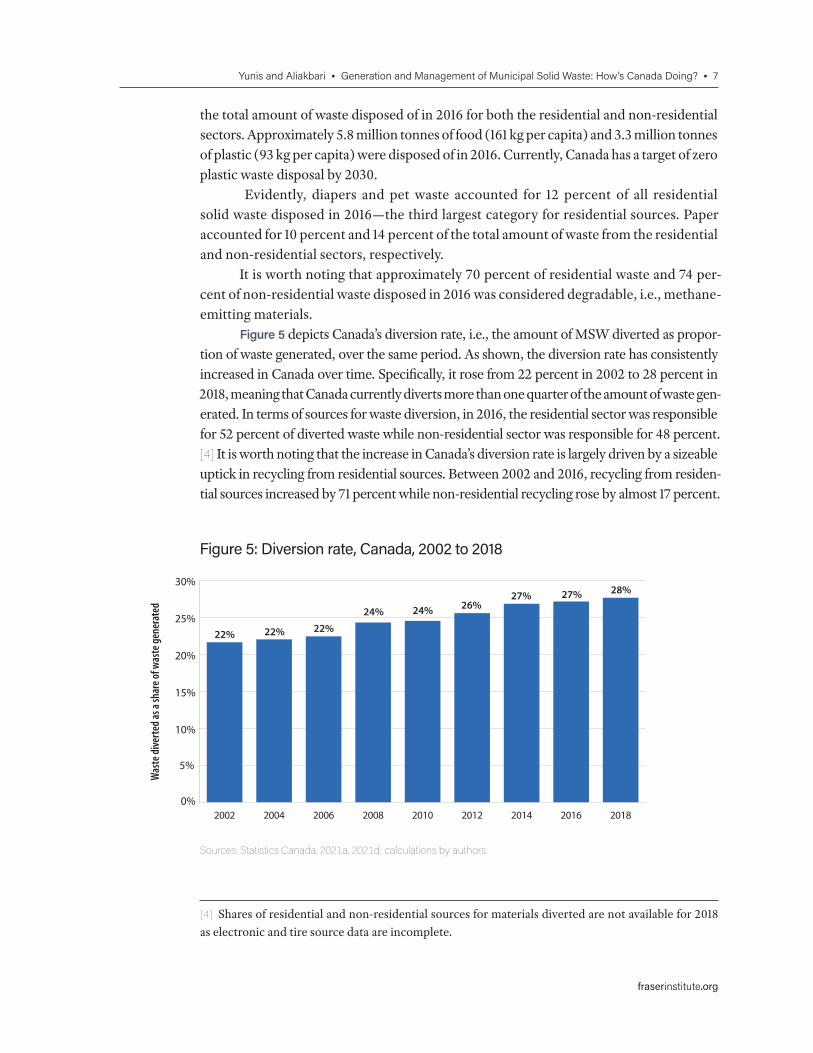
Figures 3 and 4 show the composition of residential and non-residential waste dis-posal in Canada in 2016, the year of latest available data (Environment and Climate Change Canada, 2020). Food and plastics, the two single largest categories, made up 41 percent of
Food 28%
Plastics 13%
Diapers and pet waste 12%
Paper 10%
Other 9%
Yard and garden 7%
Other organics 6%
Building material 5%
Metals 3%Wood 2%
Rubber and leather 1%
Glass 2%Textiles 2%
Food 25%
Plastics 16%
Paper 14%
Other 9%
Otherorganics 9%
Wood 8%
Buildingmaterials 5%
Metals 4%
Diapers and pet waste 3%Yard and garden 3%
Textiles 1%
Rubber and leather 2%
Glass 2%
Figure 3: Composition of residential MSW, Canada, 2016
Source: Environment and Climate Change Canada, 2020.
Figure 4: Composition of non-residential MSW, Canada, 2016
Source: Environment and Climate Change Canada, 2020.
Yunis and Aliakbari • Generation and Management of Municipal Solid Waste: How’s Canada Doing? • 7
fraserinstitute.org
the total amount of waste disposed of in 2016 for both the residential and non-residential sectors. Approximately 5.8 million tonnes of food (161 kg per capita) and 3.3 million tonnes of plastic (93 kg per capita) were disposed of in 2016. Currently, Canada has a target of zero plastic waste disposal by 2030.
Evidently, diapers and pet waste accounted for 12 percent of all residential solid waste disposed in 2016—the third largest category for residential sources. Paper accounted for 10 percent and 14 percent of the total amount of waste from the residential and non-residential sectors, respectively.
It is worth noting that approximately 70 percent of residential waste and 74 per-cent of non-residential waste disposed in 2016 was considered degradable, i.e., methane-emitting materials.
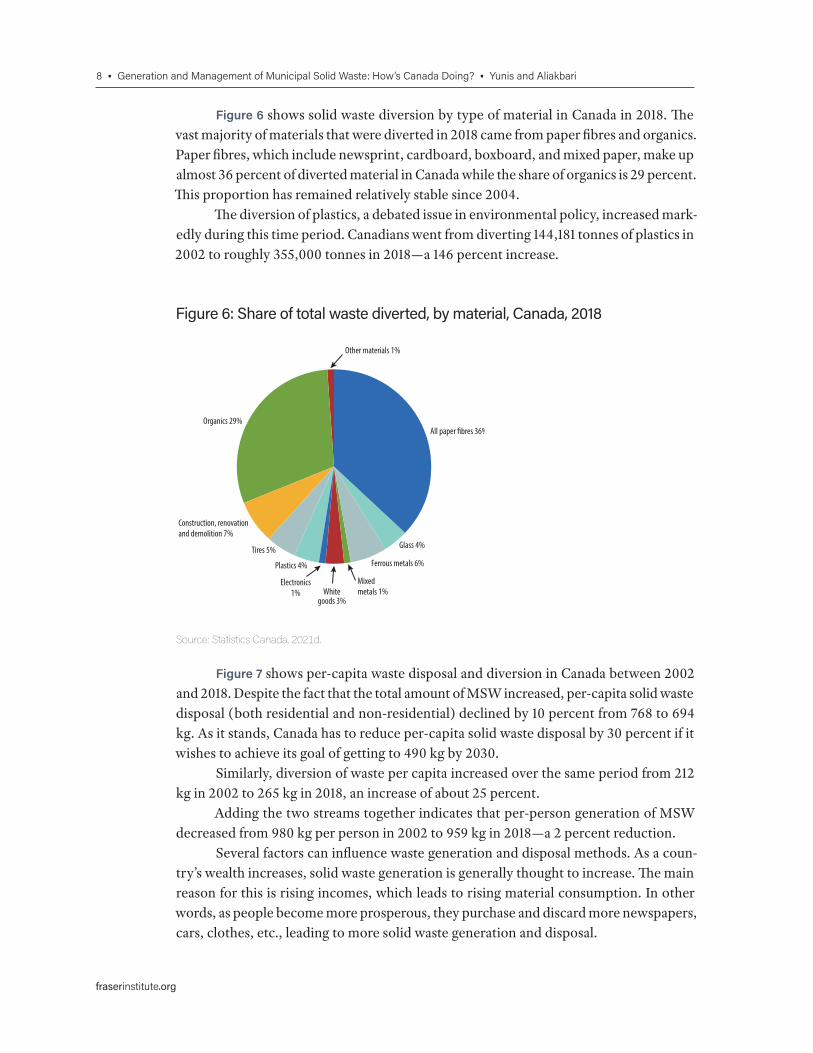
Figure 5 depicts Canada’s diversion rate, i.e., the amount of MSW diverted as propor-tion of waste generated, over the same period. As shown, the diversion rate has consistently increased in Canada over time. Specifically, it rose from 22 percent in 2002 to 28 percent in 2018, meaning that Canada currently diverts more than one quarter of the amount of waste gen-erated. In terms of sources for waste diversion, in 2016, the residential sector was responsible for 52 percent of diverted waste while non-residential sector was responsible for 48 percent. [4] It is worth noting that the increase in Canada’s diversion rate is largely driven by a sizeable uptick in recycling from residential sources. Between 2002 and 2016, recycling from residen-tial sources increased by 71 percent while non-residential recycling rose by almost 17 percent.
[4] Shares of residential and non-residential sources for materials diverted are not available for 2018 as electronic and tire source data are incomplete.
Figure 5: Diversion rate, Canada, 2002 to 2018
Sources: Statistics Canada, 2021a, 2021d; calculations by authors.
0%
5%
10%
15%
20%
25%
30%
201820162014201220102008200620042002
Was
te d
iver
ted
as a
shar
e of w
aste
gen
erat
ed
22% 22% 22%
24% 24% 26%27% 27% 28%
8 • Generation and Management of Municipal Solid Waste: How’s Canada Doing? • Yunis and Aliakbari
fraserinstitute.org
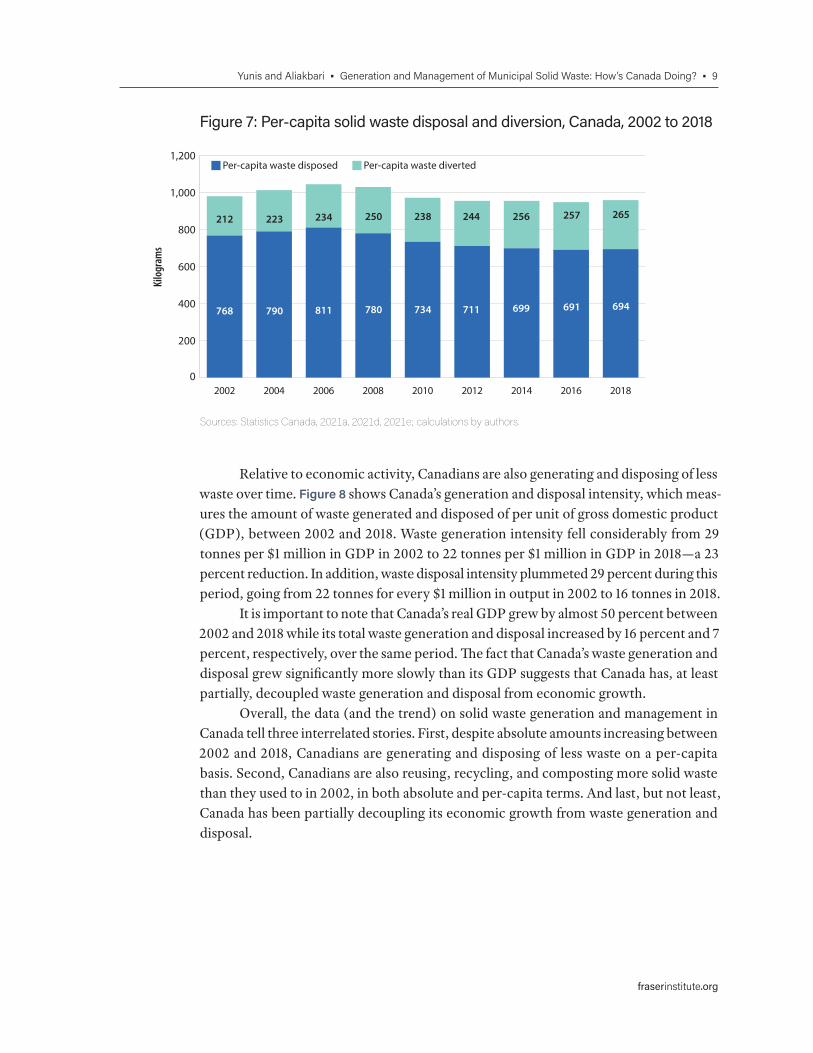
Figure 7 shows per-capita waste disposal and diversion in Canada between 2002 and 2018. Despite the fact that the total amount of MSW increased, per-capita solid waste disposal (both residential and non-residential) declined by 10 percent from 768 to 694 kg. As it stands, Canada has to reduce per-capita solid waste disposal by 30 percent if it wishes to achieve its goal of getting to 490 kg by 2030.
Similarly, diversion of waste per capita increased over the same period from 212 kg in 2002 to 265 kg in 2018, an increase of about 25 percent.
Adding the two streams together indicates that per-person generation of MSW decreased from 980 kg per person in 2002 to 959 kg in 2018—a 2 percent reduction.
Several factors can influence waste generation and disposal methods. As a coun-try’s wealth increases, solid waste generation is generally thought to increase. The main reason for this is rising incomes, which leads to rising material consumption. In other words, as people become more prosperous, they purchase and discard more newspapers, cars, clothes, etc., leading to more solid waste generation and disposal.
Figure 6 shows solid waste diversion by type of material in Canada in 2018. The vast majority of materials that were diverted in 2018 came from paper fibres and organics. Paper fibres, which include newsprint, cardboard, boxboard, and mixed paper, make up almost 36 percent of diverted material in Canada while the share of organics is 29 percent. This proportion has remained relatively stable since 2004.
The diversion of plastics, a debated issue in environmental policy, increased mark-edly during this time period. Canadians went from diverting 144,181 tonnes of plastics in 2002 to roughly 355,000 tonnes in 2018—a 146 percent increase.
All paper �bres 36%
Glass 4%
Ferrous metals 6%
Electronics1% White
goods 3%
Plastics 4%
Tires 5%
Construction, renovationand demolition 7%
Organics 29%
Other materials 1%
Mixedmetals 1%
Figure 6: Share of total waste diverted, by material, Canada, 2018
Source: Statistics Canada, 2021d.
Yunis and Aliakbari • Generation and Management of Municipal Solid Waste: How’s Canada Doing? • 9
fraserinstitute.org
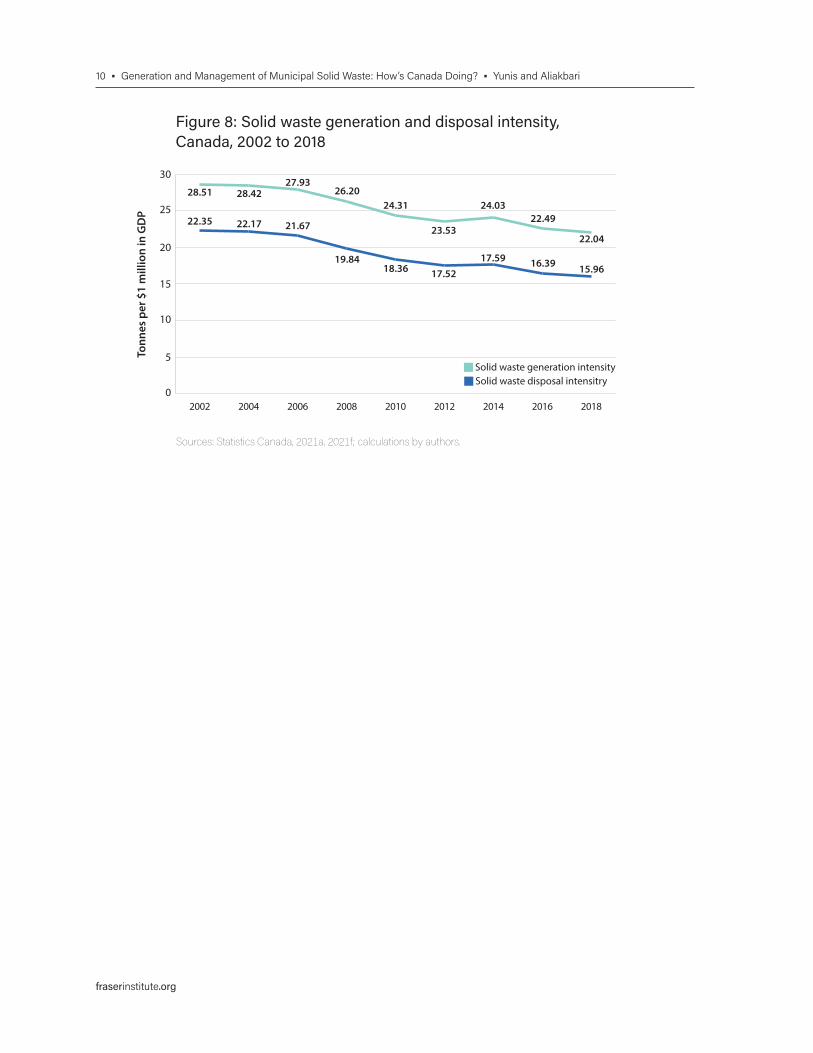
Relative to economic activity, Canadians are also generating and disposing of less waste over time. Figure 8 shows Canada’s generation and disposal intensity, which meas-ures the amount of waste generated and disposed of per unit of gross domestic product (GDP), between 2002 and 2018. Waste generation intensity fell considerably from 29 tonnes per $1 million in GDP in 2002 to 22 tonnes per $1 million in GDP in 2018—a 23 percent reduction. In addition, waste disposal intensity plummeted 29 percent during this period, going from 22 tonnes for every $1 million in output in 2002 to 16 tonnes in 2018.
It is important to note that Canada’s real GDP grew by almost 50 percent between 2002 and 2018 while its total waste generation and disposal increased by 16 percent and 7 percent, respectively, over the same period. The fact that Canada’s waste generation and disposal grew significantly more slowly than its GDP suggests that Canada has, at least partially, decoupled waste generation and disposal from economic growth.
Overall, the data (and the trend) on solid waste generation and management in Canada tell three interrelated stories. First, despite absolute amounts increasing between 2002 and 2018, Canadians are generating and disposing of less waste on a per-capita basis. Second, Canadians are also reusing, recycling, and composting more solid waste than they used to in 2002, in both absolute and per-capita terms. And last, but not least, Canada has been partially decoupling its economic growth from waste generation and disposal.
0
200
400
600
800
1,000
1,200
201820162014201220102008200620042002
Per-capita waste disposed Per-capita waste divertedKi
logr
ams
212 223 234 250 238 244 256 257 265
768 790 811 780 734 711 699 691 694
Figure 7: Per-capita solid waste disposal and diversion, Canada, 2002 to 2018
Sources: Statistics Canada, 2021a, 2021d, 2021e; calculations by authors.
10 • Generation and Management of Municipal Solid Waste: How’s Canada Doing? • Yunis and Aliakbari
fraserinstitute.org
0
5
10
15
20
25
30
201820162014201220102008200620042002
Tonn
es p
er $
1 m
illio
n in
GD
P
Solid waste disposal intensitrySolid waste generation intensity
28.51 28.4227.93
26.2024.31
23.53
24.0322.49
22.04
22.35 22.17 21.67
19.8418.36 17.52
17.59 16.39 15.96
Figure 8: Solid waste generation and disposal intensity, Canada, 2002 to 2018
Sources: Statistics Canada, 2021a, 2021f; calculations by authors.
Yunis and Aliakbari • Generation and Management of Municipal Solid Waste: How’s Canada Doing? • 11
fraserinstitute.org
3. Waste Generation, Disposal, and Diversion in Canadian Provinces
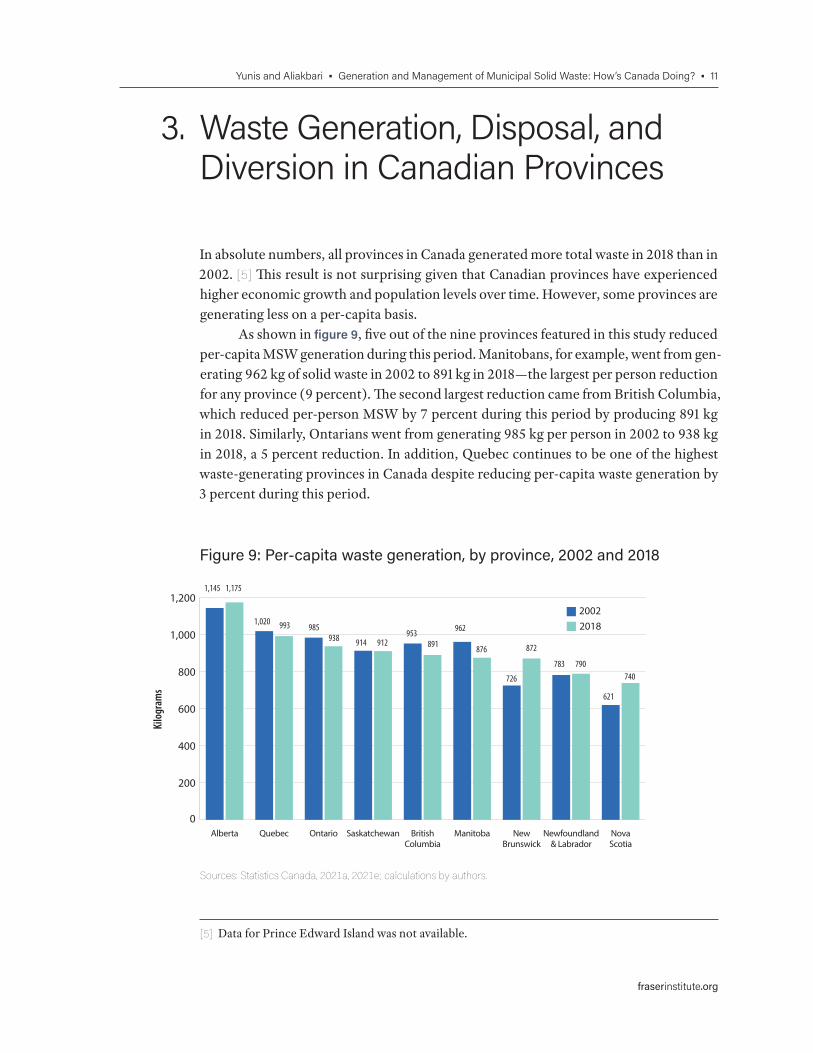
In absolute numbers, all provinces in Canada generated more total waste in 2018 than in 2002. [5] This result is not surprising given that Canadian provinces have experienced higher economic growth and population levels over time. However, some provinces are generating less on a per-capita basis.
As shown in figure 9, five out of the nine provinces featured in this study reduced per-capita MSW generation during this period. Manitobans, for example, went from gen-erating 962 kg of solid waste in 2002 to 891 kg in 2018—the largest per person reduction for any province (9 percent). The second largest reduction came from British Columbia, which reduced per-person MSW by 7 percent during this period by producing 891 kg in 2018. Similarly, Ontarians went from generating 985 kg per person in 2002 to 938 kg in 2018, a 5 percent reduction. In addition, Quebec continues to be one of the highest waste-generating provinces in Canada despite reducing per-capita waste generation by 3 percent during this period.
[5] Data for Prince Edward Island was not available.
0
200
400
600
800
1,000
1,200
NovaScotia
Newfoundland& Labrador
NewBrunswick
ManitobaBritishColumbia
SaskatchewanOntarioQuebecAlberta
20022018
Kilo
gram
s
1,145
1,020985
914953 962
726
783
621
1,175
993938 912 891 876 872
790740
Figure 9: Per-capita waste generation, by province, 2002 and 2018
Sources: Statistics Canada, 2021a, 2021e; calculations by authors.
12 • Generation and Management of Municipal Solid Waste: How’s Canada Doing? • Yunis and Aliakbari
fraserinstitute.org
Overall, Alberta, Quebec, and Ontario are the provinces that generated the most MSW on a per-capita basis in 2018, possibly reflecting higher levels of economic activity compared to other provinces.
On the other hand, the three Atlantic provinces—Newfoundland and Labrador, Nova Scotia, and New Brunswick—generated the least amount of MSW in Canada, per-haps due to the small sizes of their economies. However, the three provinces increased per-capita waste generation during this time. Notable increases came from New Brunswick, which went from producing 726 kg of MSW per person in 2002 to 872 kg in 2018, and Nova Scotia, which increased its per-person MSW generation figures by 19 percent.
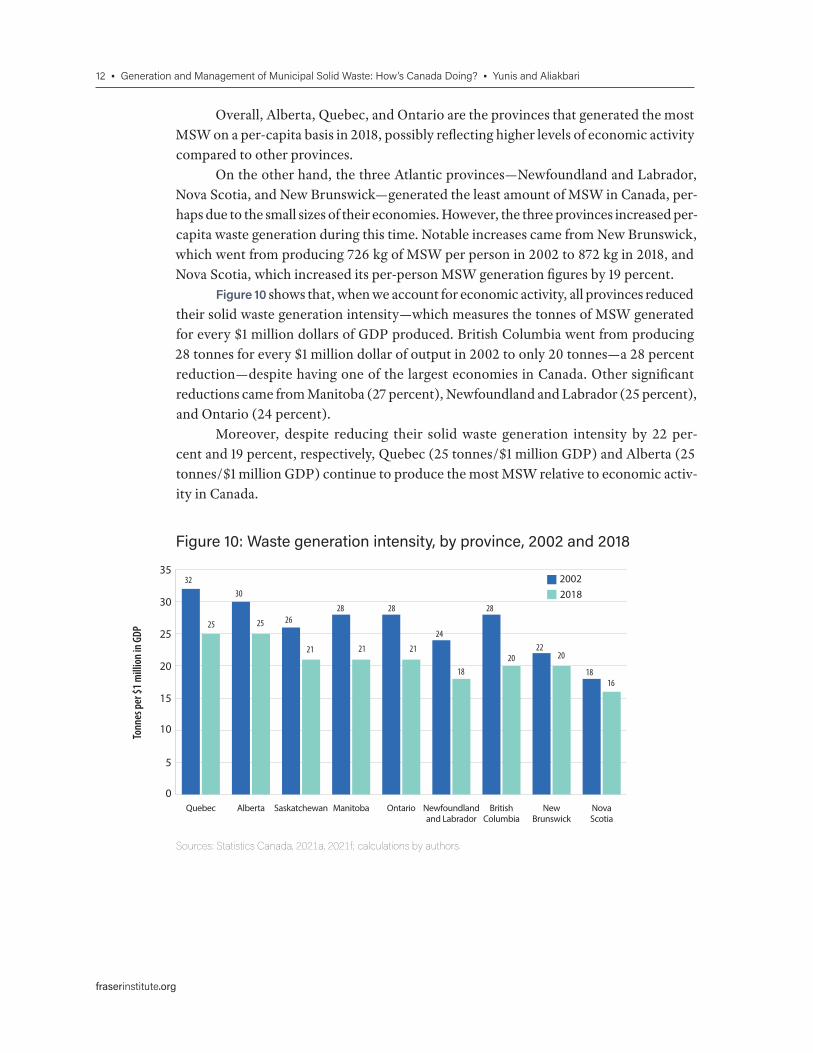
Figure 10 shows that, when we account for economic activity, all provinces reduced their solid waste generation intensity—which measures the tonnes of MSW generated for every $1 million dollars of GDP produced. British Columbia went from producing 28 tonnes for every $1 million dollar of output in 2002 to only 20 tonnes—a 28 percent reduction—despite having one of the largest economies in Canada. Other significant reductions came from Manitoba (27 percent), Newfoundland and Labrador (25 percent), and Ontario (24 percent).
Moreover, despite reducing their solid waste generation intensity by 22 per-cent and 19 percent, respectively, Quebec (25 tonnes/$1 million GDP) and Alberta (25 tonnes/$1 million GDP) continue to produce the most MSW relative to economic activ-ity in Canada.
0
5
10
15
20
25
30
35
NovaScotia
NewBrunswick
BritishColumbia
Newfoundlandand Labrador
OntarioManitobaSaskatchewanAlbertaQuebec
20022018
Tonn
es p
er $
1 m
illio
n in
GDP
3230
2628 28
24
28
22
18
25 25
21 21 21
1820 20
16
Figure 10: Waste generation intensity, by province, 2002 and 2018
Sources: Statistics Canada, 2021a, 2021f; calculations by authors.
Yunis and Aliakbari • Generation and Management of Municipal Solid Waste: How’s Canada Doing? • 13
fraserinstitute.org
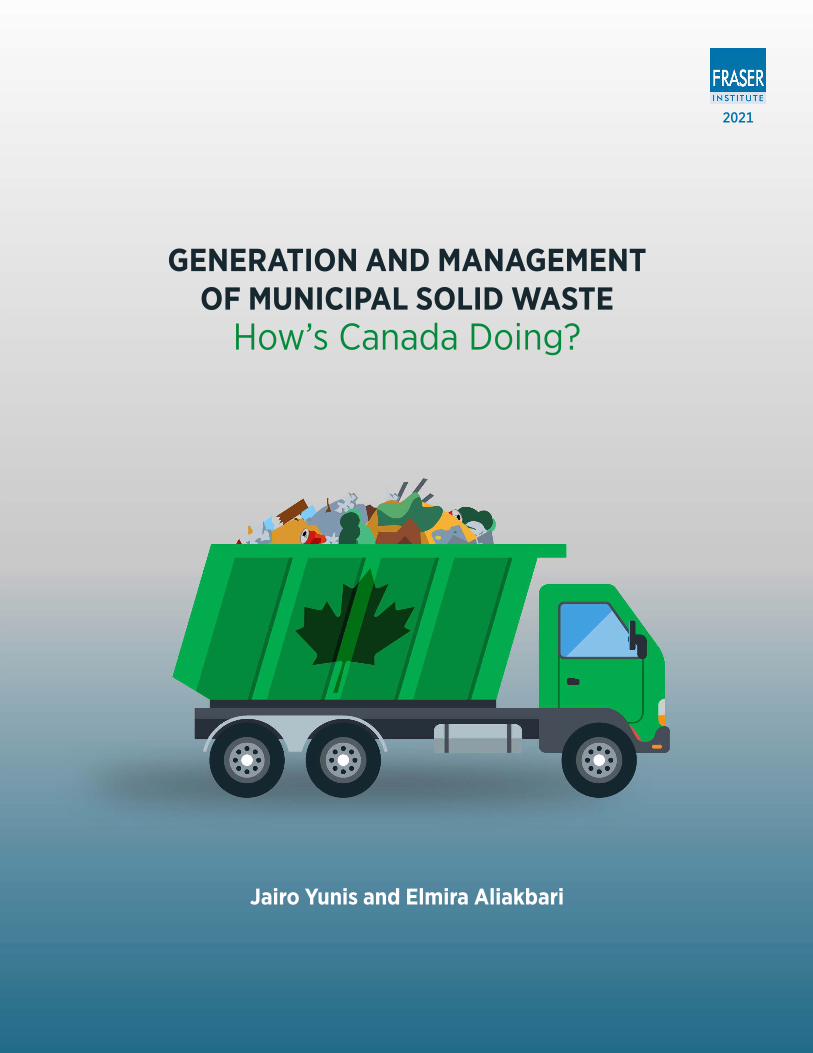
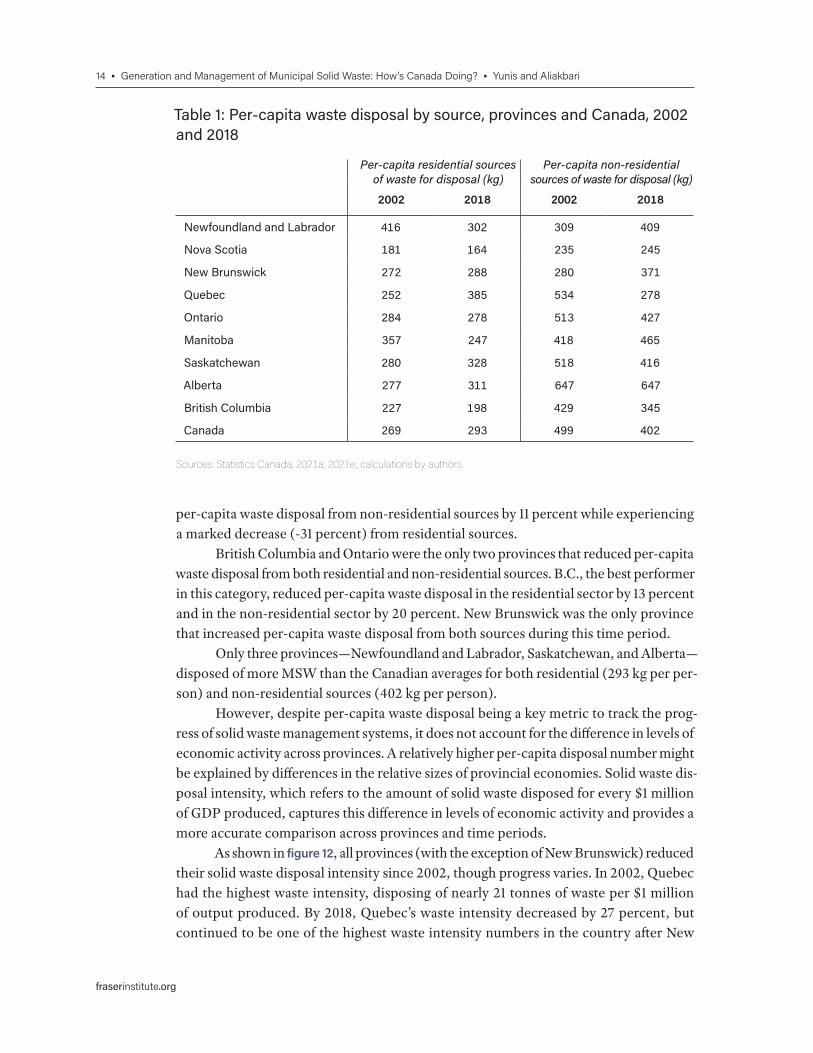
Table 1 shows waste disposal per-person by source in 2002 and 2018 in Canadian provinces compared to the national average. Results vary across provinces. Quebec, for example, experienced a significant jump (53 percent) in per-capita waste disposal from residential sources between 2002 and 2018 while seeing a considerable (-48 per-cent) reduction from non-residential sources. Manitoba, on the other hand, increased
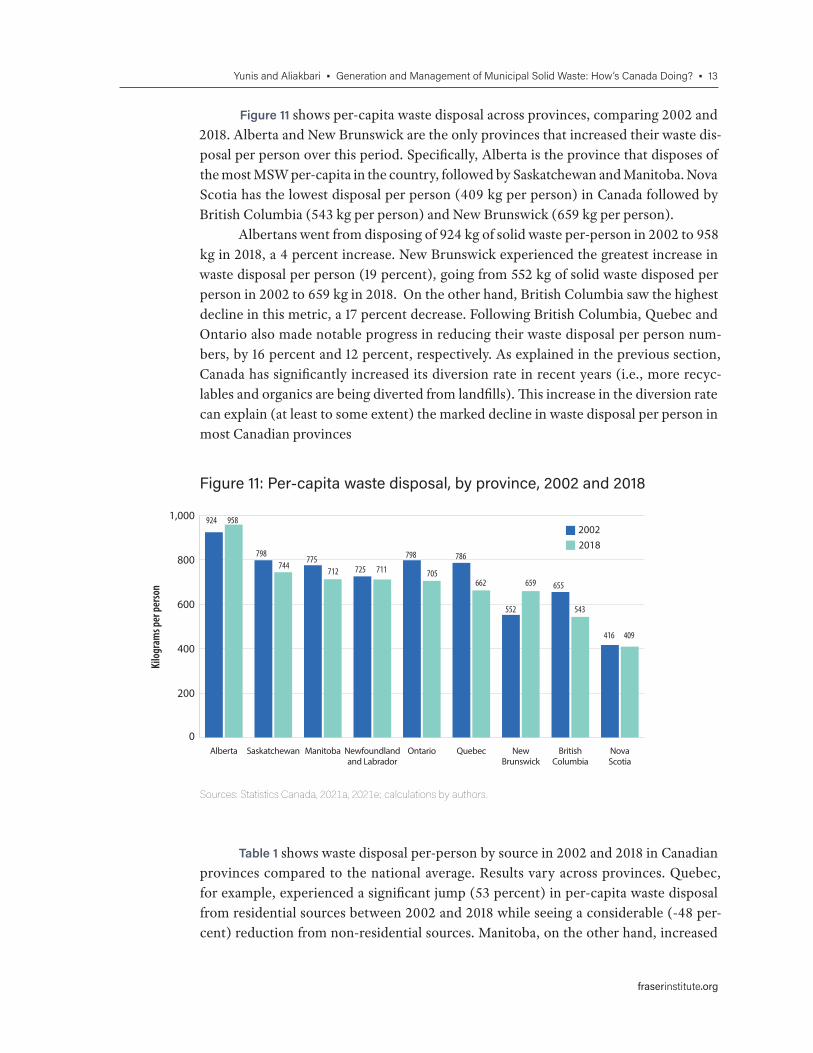
Figure 11 shows per-capita waste disposal across provinces, comparing 2002 and 2018. Alberta and New Brunswick are the only provinces that increased their waste dis-posal per person over this period. Specifically, Alberta is the province that disposes of the most MSW per-capita in the country, followed by Saskatchewan and Manitoba. Nova Scotia has the lowest disposal per person (409 kg per person) in Canada followed by British Columbia (543 kg per person) and New Brunswick (659 kg per person).
Albertans went from disposing of 924 kg of solid waste per-person in 2002 to 958 kg in 2018, a 4 percent increase. New Brunswick experienced the greatest increase in waste disposal per person (19 percent), going from 552 kg of solid waste disposed per person in 2002 to 659 kg in 2018. On the other hand, British Columbia saw the highest decline in this metric, a 17 percent decrease. Following British Columbia, Quebec and Ontario also made notable progress in reducing their waste disposal per person num-bers, by 16 percent and 12 percent, respectively. As explained in the previous section, Canada has significantly increased its diversion rate in recent years (i.e., more recyc-lables and organics are being diverted from landfills). This increase in the diversion rate can explain (at least to some extent) the marked decline in waste disposal per person in most Canadian provinces
Figure 11: Per-capita waste disposal, by province, 2002 and 2018
Sources: Statistics Canada, 2021a, 2021e; calculations by authors.
0
200
400
600
800
1,000
NovaScotia
BritishColumbia
NewBrunswick
QuebecOntarioNewfoundlandand Labrador
ManitobaSaskatchewanAlberta
20022018
Kilo
gram
s per
per
son
924
798775
725
798 786
552
655
416
958
744712 711 705
662 659
543
409
14 • Generation and Management of Municipal Solid Waste: How’s Canada Doing? • Yunis and Aliakbari
fraserinstitute.org
per-capita waste disposal from non-residential sources by 11 percent while experiencing a marked decrease (-31 percent) from residential sources.
British Columbia and Ontario were the only two provinces that reduced per-capita waste disposal from both residential and non-residential sources. B.C., the best performer in this category, reduced per-capita waste disposal in the residential sector by 13 percent and in the non-residential sector by 20 percent. New Brunswick was the only province that increased per-capita waste disposal from both sources during this time period.
Only three provinces—Newfoundland and Labrador, Saskatchewan, and Alberta—disposed of more MSW than the Canadian averages for both residential (293 kg per per-son) and non-residential sources (402 kg per person).
However, despite per-capita waste disposal being a key metric to track the prog-ress of solid waste management systems, it does not account for the difference in levels of economic activity across provinces. A relatively higher per-capita disposal number might be explained by differences in the relative sizes of provincial economies. Solid waste dis-posal intensity, which refers to the amount of solid waste disposed for every $1 million of GDP produced, captures this difference in levels of economic activity and provides a more accurate comparison across provinces and time periods.
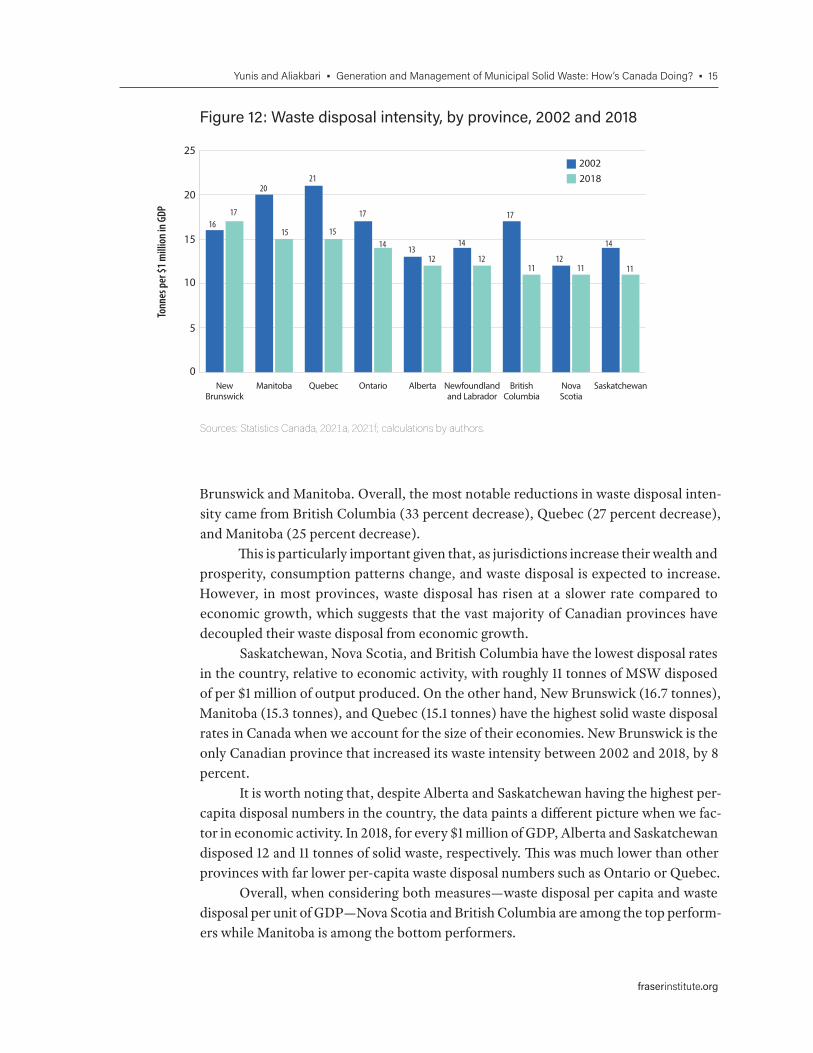
As shown in figure 12, all provinces (with the exception of New Brunswick) reduced their solid waste disposal intensity since 2002, though progress varies. In 2002, Quebec had the highest waste intensity, disposing of nearly 21 tonnes of waste per $1 million of output produced. By 2018, Quebec’s waste intensity decreased by 27 percent, but continued to be one of the highest waste intensity numbers in the country after New
Table 1: Per-capita waste disposal by source, provinces and Canada, 2002 and 2018
Sources: Statistics Canada, 2021a, 2021e; calculations by authors.
Per-capita residential sources of waste for disposal (kg)
Per-capita non-residential sources of waste for disposal (kg)
2002 2018 2002 2018
Newfoundland and Labrador 416 302 309 409
Nova Scotia 181 164 235 245
New Brunswick 272 288 280 371
Quebec 252 385 534 278
Ontario 284 278 513 427
Manitoba 357 247 418 465
Saskatchewan 280 328 518 416
Alberta 277 311 647 647
British Columbia 227 198 429 345
Canada 269 293 499 402
Yunis and Aliakbari • Generation and Management of Municipal Solid Waste: How’s Canada Doing? • 15
fraserinstitute.org
Brunswick and Manitoba. Overall, the most notable reductions in waste disposal inten-sity came from British Columbia (33 percent decrease), Quebec (27 percent decrease), and Manitoba (25 percent decrease).
This is particularly important given that, as jurisdictions increase their wealth and prosperity, consumption patterns change, and waste disposal is expected to increase. However, in most provinces, waste disposal has risen at a slower rate compared to economic growth, which suggests that the vast majority of Canadian provinces have decoupled their waste disposal from economic growth.
Saskatchewan, Nova Scotia, and British Columbia have the lowest disposal rates in the country, relative to economic activity, with roughly 11 tonnes of MSW disposed of per $1 million of output produced. On the other hand, New Brunswick (16.7 tonnes), Manitoba (15.3 tonnes), and Quebec (15.1 tonnes) have the highest solid waste disposal rates in Canada when we account for the size of their economies. New Brunswick is the only Canadian province that increased its waste intensity between 2002 and 2018, by 8 percent.
It is worth noting that, despite Alberta and Saskatchewan having the highest per-capita disposal numbers in the country, the data paints a different picture when we fac-tor in economic activity. In 2018, for every $1 million of GDP, Alberta and Saskatchewan disposed 12 and 11 tonnes of solid waste, respectively. This was much lower than other provinces with far lower per-capita waste disposal numbers such as Ontario or Quebec.
Overall, when considering both measures—waste disposal per capita and waste disposal per unit of GDP—Nova Scotia and British Columbia are among the top perform-ers while Manitoba is among the bottom performers.
0
5
10
15
20
25
SaskatchewanNovaScotia
BritishColumbia
Newfoundlandand Labrador
AlbertaOntarioQuebecManitobaNewBrunswick
20022018
Tonn
es p
er $
1 m
illio
n in
GDP
16
2021
17
1314
17
12
14
17
15 1514
12 1211 11 11
Figure 12: Waste disposal intensity, by province, 2002 and 2018
Sources: Statistics Canada, 2021a, 2021f; calculations by authors.
16 • Generation and Management of Municipal Solid Waste: How’s Canada Doing? • Yunis and Aliakbari
fraserinstitute.org
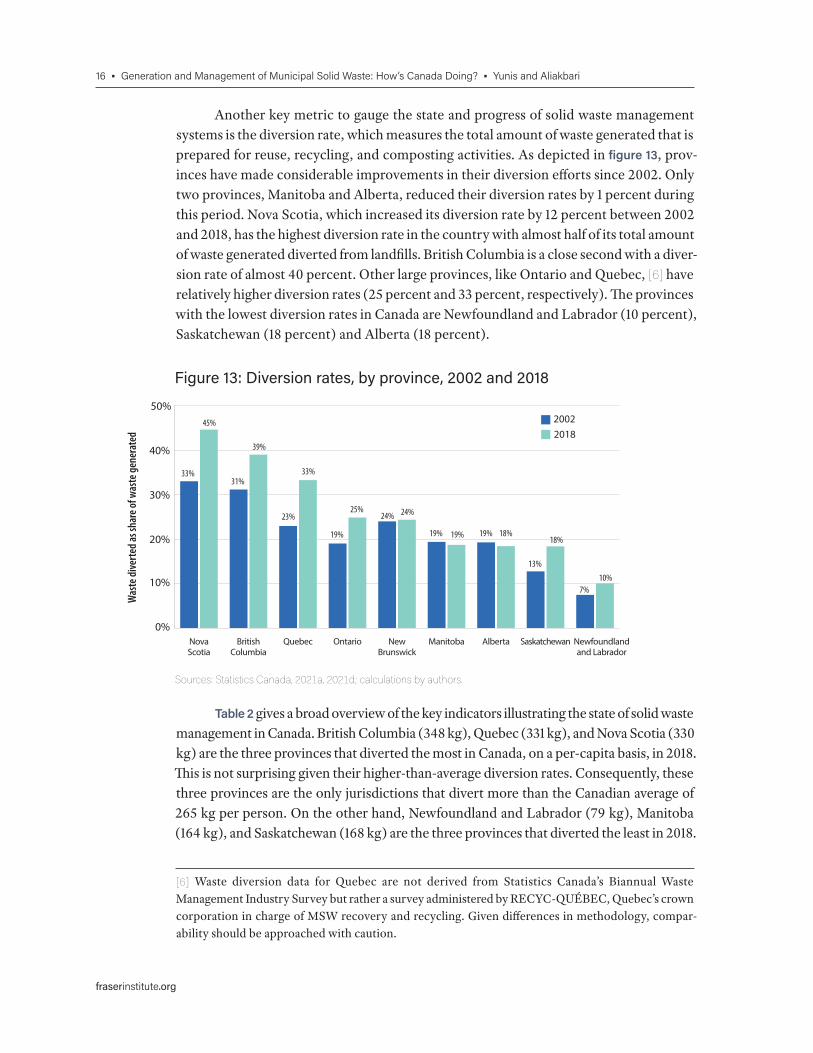
Another key metric to gauge the state and progress of solid waste management systems is the diversion rate, which measures the total amount of waste generated that is prepared for reuse, recycling, and composting activities. As depicted in figure 13, prov-inces have made considerable improvements in their diversion efforts since 2002. Only two provinces, Manitoba and Alberta, reduced their diversion rates by 1 percent during this period. Nova Scotia, which increased its diversion rate by 12 percent between 2002 and 2018, has the highest diversion rate in the country with almost half of its total amount of waste generated diverted from landfills. British Columbia is a close second with a diver-sion rate of almost 40 percent. Other large provinces, like Ontario and Quebec, [6] have relatively higher diversion rates (25 percent and 33 percent, respectively). The provinces with the lowest diversion rates in Canada are Newfoundland and Labrador (10 percent), Saskatchewan (18 percent) and Alberta (18 percent).
Table 2 gives a broad overview of the key indicators illustrating the state of solid waste management in Canada. British Columbia (348 kg), Quebec (331 kg), and Nova Scotia (330 kg) are the three provinces that diverted the most in Canada, on a per-capita basis, in 2018. This is not surprising given their higher-than-average diversion rates. Consequently, these three provinces are the only jurisdictions that divert more than the Canadian average of 265 kg per person. On the other hand, Newfoundland and Labrador (79 kg), Manitoba (164 kg), and Saskatchewan (168 kg) are the three provinces that diverted the least in 2018.
[6] Waste diversion data for Quebec are not derived from Statistics Canada’s Biannual Waste Management Industry Survey but rather a survey administered by RECYC-QUÉBEC, Quebec’s crown corporation in charge of MSW recovery and recycling. Given differences in methodology, compar-ability should be approached with caution.
0%
10%
20%
30%
40%
50%
Newfoundlandand Labrador
SaskatchewanAlbertaManitobaNewBrunswick
OntarioQuebecBritishColumbia
NovaScotia
20022018
Was
te d
iver
ted
as sh
are o
f was
te g
ener
ated
33%31%
23%
19%
24%
19% 19%
13%
7%
45%
39%
33%
25% 24%
19% 18%18%
10%
Figure 13: Diversion rates, by province, 2002 and 2018
Sources: Statistics Canada, 2021a, 2021d; calculations by authors.
Yunis and Aliakbari • Generation and Management of Municipal Solid Waste: How’s Canada Doing? • 17
fraserinstitute.org
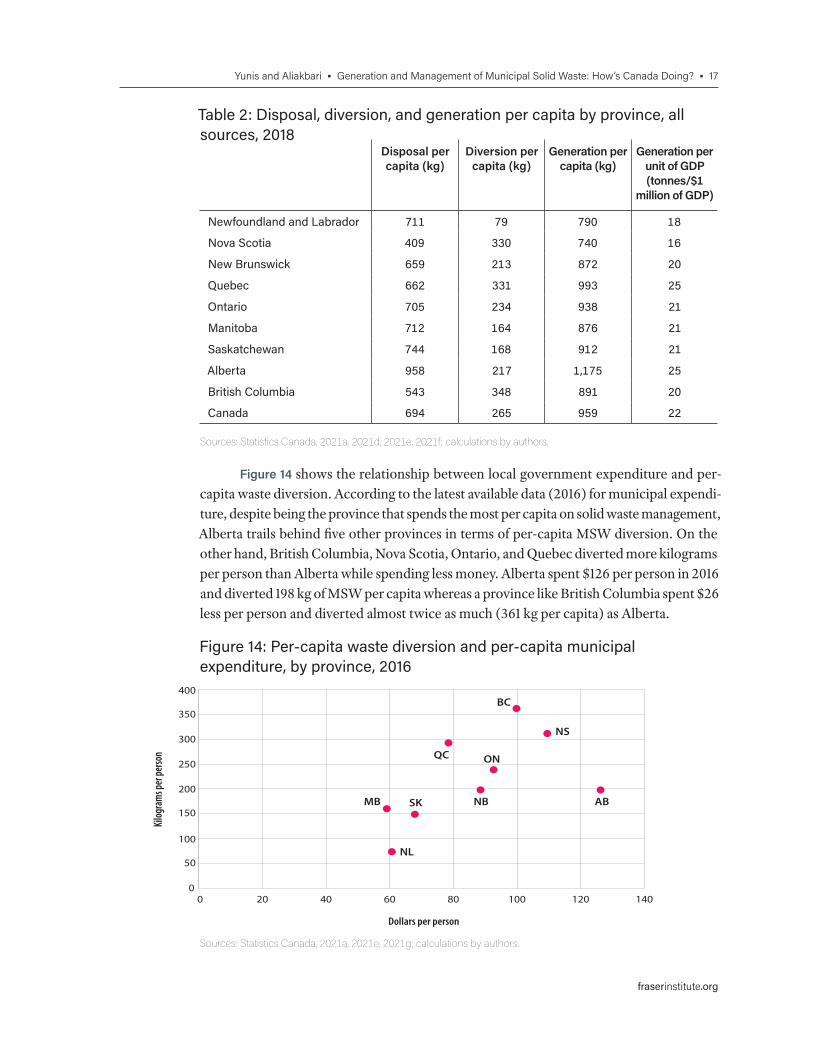
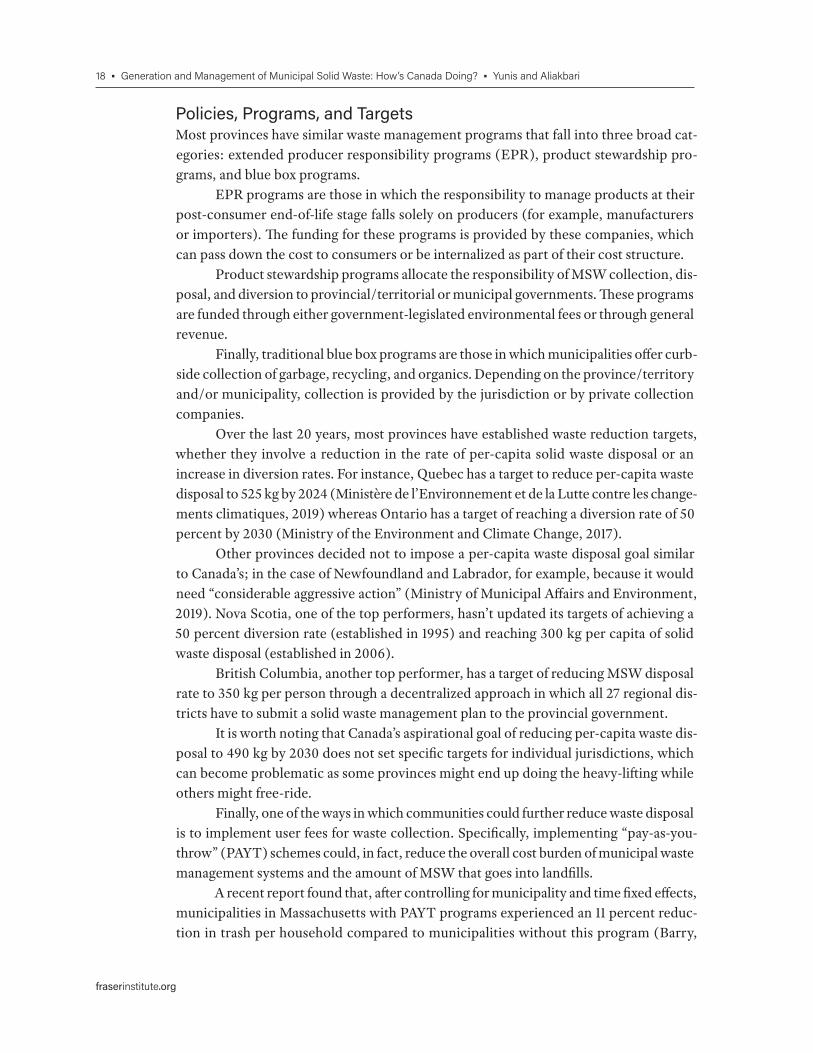
Figure 14 shows the relationship between local government expenditure and per-capita waste diversion. According to the latest available data (2016) for municipal expendi-ture, despite being the province that spends the most per capita on solid waste management, Alberta trails behind five other provinces in terms of per-capita MSW diversion. On the other hand, British Columbia, Nova Scotia, Ontario, and Quebec diverted more kilograms per person than Alberta while spending less money. Alberta spent $126 per person in 2016 and diverted 198 kg of MSW per capita whereas a province like British Columbia spent $26 less per person and diverted almost twice as much (361 kg per capita) as Alberta.
0 20 40 60 80 100 120 1400
50
100
150
200
250
300
350
400
Kilog
ram
s per
perso
n
Dollars per person
NL
MB SK
ON
NB
QC
NS
AB
BC
Figure 14: Per-capita waste diversion and per-capita municipal expenditure, by province, 2016
Sources: Statistics Canada, 2021a, 2021e, 2021g; calculations by authors.
Table 2: Disposal, diversion, and generation per capita by province, all sources, 2018
Sources: Statistics Canada, 2021a, 2021d, 2021e, 2021f; calculations by authors.
Disposal per capita (kg)
Diversion per capita (kg)
Generation per capita (kg)
Generation per unit of GDP (tonnes/$1
million of GDP)
Newfoundland and Labrador 711 79 790 18
Nova Scotia 409 330 740 16
New Brunswick 659 213 872 20
Quebec 662 331 993 25
Ontario 705 234 938 21
Manitoba 712 164 876 21
Saskatchewan 744 168 912 21
Alberta 958 217 1,175 25
British Columbia 543 348 891 20
Canada 694 265 959 22
18 • Generation and Management of Municipal Solid Waste: How’s Canada Doing? • Yunis and Aliakbari
fraserinstitute.org
Policies, Programs, and TargetsMost provinces have similar waste management programs that fall into three broad cat-egories: extended producer responsibility programs (EPR), product stewardship pro-grams, and blue box programs.
EPR programs are those in which the responsibility to manage products at their post-consumer end-of-life stage falls solely on producers (for example, manufacturers or importers). The funding for these programs is provided by these companies, which can pass down the cost to consumers or be internalized as part of their cost structure.
Product stewardship programs allocate the responsibility of MSW collection, dis-posal, and diversion to provincial/territorial or municipal governments. These programs are funded through either government-legislated environmental fees or through general revenue.
Finally, traditional blue box programs are those in which municipalities offer curb-side collection of garbage, recycling, and organics. Depending on the province/territory and/or municipality, collection is provided by the jurisdiction or by private collection companies.
Over the last 20 years, most provinces have established waste reduction targets, whether they involve a reduction in the rate of per-capita solid waste disposal or an increase in diversion rates. For instance, Quebec has a target to reduce per-capita waste disposal to 525 kg by 2024 (Ministère de l’Environnement et de la Lutte contre les change-ments climatiques, 2019) whereas Ontario has a target of reaching a diversion rate of 50 percent by 2030 (Ministry of the Environment and Climate Change, 2017).
Other provinces decided not to impose a per-capita waste disposal goal similar to Canada’s; in the case of Newfoundland and Labrador, for example, because it would need “considerable aggressive action” (Ministry of Municipal Affairs and Environment, 2019). Nova Scotia, one of the top performers, hasn’t updated its targets of achieving a 50 percent diversion rate (established in 1995) and reaching 300 kg per capita of solid waste disposal (established in 2006).
British Columbia, another top performer, has a target of reducing MSW disposal rate to 350 kg per person through a decentralized approach in which all 27 regional dis-tricts have to submit a solid waste management plan to the provincial government.
It is worth noting that Canada’s aspirational goal of reducing per-capita waste dis-posal to 490 kg by 2030 does not set specific targets for individual jurisdictions, which can become problematic as some provinces might end up doing the heavy-lifting while others might free-ride.
Finally, one of the ways in which communities could further reduce waste disposal is to implement user fees for waste collection. Specifically, implementing “pay-as-you-throw” (PAYT) schemes could, in fact, reduce the overall cost burden of municipal waste management systems and the amount of MSW that goes into landfills.
A recent report found that, after controlling for municipality and time fixed effects, municipalities in Massachusetts with PAYT programs experienced an 11 percent reduc-tion in trash per household compared to municipalities without this program (Barry,
Yunis and Aliakbari • Generation and Management of Municipal Solid Waste: How’s Canada Doing? • 19
fraserinstitute.org
2017). Another study found that PAYT programs had a significant impact on waste reduc-tion in municipalities in Southern Maine between 2007 and 2013 (Blackmer and Criner, 2014).
A PAYT model is considered an efficient market-based pricing mechanism for solid waste disposal in which users are charged a variable rate depending on the weight or volume of MSW they offer to municipal garbage collection services. For example, if an individual disposes 10 kg of MSW every week, and the pay-as-you-throw rate is $1 per kilogram, said individual would have to pay a weekly fee of $10. If the next week, the same individual disposes 5 kg of MSW then said individual would have to pay a weekly fee of only $5. Therefore, a PAYT scheme creates a direct incentive to either generate less waste or to recycle or reuse more of the waste an individual generates.
However, implementing a PAYT program might create several unintended conse-quences. For instance, the “polluter pays” principle might create a potential incentive for households to reduce their PAYT liabilities through illegal dumping, littering, or other inappropriate waste disposal methods (Blackmer and Criner, 2014).
Generally, however, Canadian municipal waste management systems are funded through property taxes or via fixed fees, regardless of the amount and composition of waste that is collected and disposed.
20 • Generation and Management of Municipal Solid Waste: How’s Canada Doing? • Yunis and Aliakbari
fraserinstitute.org
4. Conclusion
Overall, as Canada’s population and economy grew between 2002 and 2018 so did total waste generation and disposal. However, Canadians are generating 2 percent less waste on a per capita basis and 23 percent less per unit of GDP. The sources of waste are changing: residential sources now make up over 44 percent of all waste generated whereas MSW from non-residential sources, which include industrial, commercial and institutional sources, declined during this time.
On a provincial level, performance varies across jurisdictions. Some provinces, like Nova Scotia and British Columbia, are leading the way in generating and disposing of less waste, relative to population and economic activity, and diverting more. On the other hand, Manitoba consistently exhibits higher-than-average per-capita waste disposal rates, high waste disposal intensity figures, and low diversion rates. At the same time, Alberta generates and disposes the most MSW on a per-capita basis, but, interestingly enough, the province has lower waste disposal intensity with respect to GDP than other provinces with far lower per-capita waste disposal numbers such as Ontario and Quebec.
Altogether, since 2002, while most provinces reduced per-capita generation of MSW, the vast majority of the provinces reduced per-capita disposal of solid waste, with the exceptions of Alberta and New Brunswick. Similarly, almost all provinces increased their diversion rates during this time with the exceptions of Manitoba and Alberta.
On balance, the fact that Canada partially decoupled solid waste generation and disposal from economic growth is good news for the environment. Furthermore, the country’s progress in reducing per-capita solid waste disposal and waste disposal intensity coupled with an increasing diversion rate speaks volumes for Canada’s stellar environ-mental performance and builds on its already impressive environmental track record.
Yunis and Aliakbari • Generation and Management of Municipal Solid Waste: How’s Canada Doing? • 21
fraserinstitute.org
References
Barry, Thomas W. IV (2017). When Trash Costs Money: Analyzing the Impact of Pay-As-You-Throw Programs in Massachusetts. Journal of Environmental and Resource Economics at Colby 4, 1. <https://digitalcommons.colby.edu/jerec/vol4/iss1/3>
Blackmer, Travis, and George Criner (2014). Impacts of Pay-As-You-Throw and Other Residential Solid Waste Policy Options: Southern Maine 2007–2013. Maine Policy Review 23, 2: 51–58. <https://digitalcommons.library.umaine.edu/mpr/vol23/iss2/14>
Brown, J., K. Green, S. Hansen, and L. Fredricksen (2004). Environmental Indicators (Sixth Edition). Fraser Institute. <https://www.fraserinstitute.org/sites/default/files/
EnvironmentalIndicators2004.pdf>
Ecofiscal Commission (2018). Cutting the Waste: How to Save Money While Improving Our Solid Waste Systems. Ecofiscal Commission. <https://ecofiscal.ca/wp-content/
uploads/2018/10/Ecofiscal-Commission-Solid-Waste-Report-Cutting-the-Waste-October-16-2018.
pdf>
Environment and Climate Change Canada (2018a). Canadian Environmental Sustainability Indicators: Solid Waste Diversion and Disposal. Government of Canada. <https://www.canada.ca/content/dam/eccc/documents/pdf/cesindicators/solid-waste/2018/
solid-waste-diversion-disposal-en.pdf>
Environment and Climate Change Canada (2018b). Federal Government, Provinces, and Territories Push Forward on a Canada-Wide Zero-Plastic-Waste Waste Strategy. Government of Canada. <https://www.canada.ca/en/environment-climate-change/
news/2018/11/federal-government-provinces-and-territories-push-forward-on-a-canada-wide-
zero-plastic-waste-strategy.html>
Environment and Climate Change Canada (2020). National Waste Characterization Report: The Composition of Canadian Residual Municipal Solid Waste. Government of Canada. <http://publications.gc.ca/collections/collection_2020/eccc/en14/En14-405-2020-eng.
pdf>
Environment and Climate Change Canada (2021). Reducing Municipal Solid Waste. Government of Canada. <https://www.canada.ca/en/environment-climate-change/services/
managing-reducing-waste/municipal-solid/reducing.html>
22 • Generation and Management of Municipal Solid Waste: How’s Canada Doing? • Yunis and Aliakbari
fraserinstitute.org
Environmental Protection Agency (2021). Waste Diversion at EPA. Government of the United States. <https://www.epa.gov/greeningepa/waste-diversion-epa>
Giroux, Laurie (2014). State of Waste Management in Canada. <https://www.nswai.org/
docs/State_Waste_Mgmt_in_Canada.pdf>
Lavee, D. (2010). A Cost-Benefit Analysis of a Deposit-Refund Program for Beverage Containers in Israel. Waste Management 30: 338–45. <https://doi.org/10.1016/j.
wasman.2009.09.026>
Ministère de l’Environnement et de la Lutte contre les changements climatiques (2019). Politique québécoise de gestión des matières résiduelles. Government of Quebec. <https://www.recyc-quebec.gouv.qc.ca/sites/default/files/documents/plan-action-2019-2024-
pqgmr.pdf>
Ministry of the Environment and Climate Change (2017). Strategy for a Waste-Free Ontario: Building the Circular Economy. Government of Ontario. <https://files.ontario.ca/
finalstrategywastefreeont_eng_aoda1_final-s.pdf>
Ministry of Municipal Affairs and Environment (2019). Solid Waste Management in Newfoundland and Labrador. Government of Newfoundland and Labrador. <https://
www.gov.nl.ca/eccm/files/waste-management-final-report-review-pswms.pdf>
Modak, A.R., and Everett, J.W. (1996). Optimal Regional Scheduling of Solid Waste Systems: II. Model Systems. J. Environ. Eng. 122: 793–99. <https://doi.org/10.1061/
(ASCE)0733-9372(1996)122:9(793)>
Statistics Canada (2012). Human Activity and the Environment: Waste Management in Canada. <https://www150.statcan.gc.ca/n1/en/pub/16-201-x/16-201-x2012000-eng.
pdf?st=dIf5jBXN>
Statistics Canada (2021a). Table 38-10-0032-01 Disposal of waste, by source. <https://doi.
org/10.25318/3810003201-eng>
Statistics Canada (2021b). Table 38-10-0033-01 Materials diverted, by source, inactive. <https://doi.org/10.25318/3810003301-eng>
Statistics Canada (2021c). Table 38-10-0034-01 Materials diverted, by type, inactive. <https://doi.org/10.25318/3810003401-eng>
Statistics Canada (2021d). Table 38-10-0138-01 Waste materials diverted, by type and by source. <https://doi.org/10.25318/3810013801-eng>
Yunis and Aliakbari • Generation and Management of Municipal Solid Waste: How’s Canada Doing? • 23
fraserinstitute.org
Statistics Canada (2021e). Table 17-10-0005-01 Population estimates on July 1st, by age and sex. <https://doi.org/10.25318/1710000501-eng>
Statistics Canada (2021f ). Table 36-10-0222-01 Gross domestic product, expenditure-based, provincial and territorial, annual (x 1,000,000). <https://doi.
org/10.25318/3610022201-eng>
Statistics Canada (2021g). Table 38-10-0036-01 Local government characteristics of the waste management industry. <https://doi.org/10.25318/3810003601-eng>
Tanskanen, J.-H., Reinikaien, A., and Melanen, M. (1998). Waste Streams, Costs, and Emissions in Municipal Solid Waste Management: A Case Study from Finland. Waste Manage. Res. 16: 503–13. <https://doi.org/10.1177/0734242X9801600602>
Tonjes, David J., and Sreekanth Mallikarjun (2013). Cost Effectiveness of Recycling: A Systems Model. Waste Management 23: 2548–56. <https://doi.org/10.1016/j.
wasman.2013.06.012>
World Bank (2018). What a Waste: An Updated Look into the Future of Solid Waste Management. World Bank. <https://www.worldbank.org/en/news/immersive-
story/2018/09/20/what-a-waste-an-updated-look-into-the-future-of-solid-waste-management>
24 • Generation and Management of Municipal Solid Waste: How’s Canada Doing? • Yunis and Aliakbari
fraserinstitute.org
About the Authors
Jairo YunisJairo Yunis is a policy analyst at the Fraser Institute. He holds a Bachelor of Political Science and International Relations from the Pontifical Xaverian University of Colombia and a Master’s degree in Public Policy from the University of Calgary. Jairo has previ-ously worked for government in Colombia in policy issues related to local economic development and competitiveness. He special-izes in energy policy, with a focus on carbon pricing and electricity markets.
Elmira AliakbariElmira Aliakbari is associate director of the Centre for Natural Resource Studies at the Fraser Institute. She received a Ph.D. in Economics from the University of Guelph, and M.A. and B.S. de-grees in Economics, both from the University of Tehran in Iran. She has studied public policy involving energy and the environ-ment for nearly eight years. Prior to joining the Fraser Institute, Ms. Aliakbari was Director of Research, Energy, Ecology and Prosperity with the Frontier Center for Public Policy. She has pre-sented her work at many academic conferences and has been published in the presti-gious academic journal Energy Economics. Ms. Aliakbari’s research has been discussed in prominent media outlets including the Wall Street Journal, and her commentaries have appeared in major Canadian and American newspapers such as the Globe and Mail, Washington Times, National Post, and Financial Post.
Acknowledgments
The authors wish to thank the anonymous reviewers for their comments, suggestions, and insights. Any re maining errors or oversights are the sole responsibility of the authors. As the researchers have worked independently, the views and conclusions expressed in this study do not necessarily reflect those of the Board of Directors of the Fraser Institute, the staff, or supporters.
Yunis and Aliakbari • Generation and Management of Municipal Solid Waste: How’s Canada Doing? • 25
fraserinstitute.org
Publishing Information
DistributionThese publications are available from <http://www.fraserinstitute.org> in Portable Document Format (PDF) and can be read with Adobe Acrobat® or Adobe Reader®, versions 7 or later. Adobe Acrobat Reader® DC, the most recent version, is available free of charge from Adobe Systems Inc. at <get.adobe.com/reader/>. Readers having trouble viewing or print-ing our PDF files using applications from other manufacturers (e.g., Apple’s Preview) should use Reader® or Acrobat®.
Ordering publicationsTo order printed publications from the Fraser Institute, please contact us via e-mail: [email protected]; telephone: 604.688.0221, ext. 580 or, toll free, 1.800.665.3558, ext. 580; or fax: 604.688.8539.
MediaFor media enquiries, please contact our communications department via e-mail: [email protected]; telephone: 604.714.4582.
CopyrightCopyright © 2021 by the Fraser Institute. All rights reserved. No part of this publica-tion may be reproduced in any manner whatsoever without written permission except in the case of brief passages quoted in critical articles and reviews.
ISBN978-0-88975-652-6
CitationYunis, Jairo, and Elmira Aliakbari (2020). Generation and Management of Municipal Solid Waste: How’s Canada Doing? Fraser Institute. <http://www.fraserinstitute.org>.
26 • Generation and Management of Municipal Solid Waste: How’s Canada Doing? • Yunis and Aliakbari
fraserinstitute.org
Purpose, Funding, and Independence
The Fraser Institute provides a useful public service. We report objective information about the economic and social effects of current public policies, and we offer evidence-based research and education about policy options that can improve the quality of life.
The Institute is a non-profit organization. Our activities are funded by charitable donations, unrestricted grants, ticket sales, and sponsorships from events, the licensing of products for public distribution, and the sale of publications.
All research is subject to rigorous review by external experts, and is conducted and published separately from the Institute’s Board of Directors and its donors.
The opinions expressed by authors are their own, and do not necessarily reflect those of the Institute, its Board of Directors, its donors and supporters, or its staff. This publication in no way implies that the Fraser Institute, its directors, or staff are in favour of, or oppose the passage of, any bill; or that they support or oppose any particular pol-itical party or candidate.
As a healthy part of public discussion among fellow citizens who desire to im-prove the lives of people through better public policy, the Institute welcomes evidence-focused scrutiny of the research we publish, including verification of data sources, repli-cation of analytical methods, and intelligent debate about the practical effects of policy recommendations.
Supporting the Fraser Institute
To learn how to support the Fraser Institute, please contact us via post: Development Department, Fraser Institute, Fourth Floor, 1770 Burrard Street, Vancouver, British Columbia, V6J 3G7, Canada; telephone: toll-free to 1.800.665.3558, ext. 548; e-mail: [email protected]; or visit our webpage: <www.fraserinstitute.org/support-us/
overview.aspx>.
Yunis and Aliakbari • Generation and Management of Municipal Solid Waste: How’s Canada Doing? • 27
fraserinstitute.org
About the Fraser Institute
Our mission is to improve the quality of life for Canadians, their families and future gen-erations by studying, measuring and broadly communicating the effects of government policies, entrepreneurship and choice on their well-being.
Notre mission consiste à améliorer la qualité de vie des Canadiens et des générations à venir en étudiant, en mesurant et en diffusant les effets des politiques gouvernementales, de l’entrepreneuriat et des choix sur leur bien-être.
Peer review —validating the accuracy of our research
The Fraser Institute maintains a rigorous peer review process for its research. New re-search, major research projects, and substantively modified research conducted by the Fraser Institute are reviewed by experts with a recognized expertise in the topic area being addressed. Whenever possible, external review is a blind process. Updates to pre-viously reviewed research or new editions of previously reviewed research are not re-viewed unless the update includes substantive or material changes in the methodology.
The review process is overseen by the directors of the Institute’s research depart-ments who are responsible for ensuring all research published by the Institute passes through the appropriate peer review. If a dispute about the recommendations of the reviewers should arise during the Institute’s peer review process, the Institute has an Editorial Advisory Board, a panel of scholars from Canada, the United States, and Europe to whom it can turn for help in resolving the dispute.
28 • Generation and Management of Municipal Solid Waste: How’s Canada Doing? • Yunis and Aliakbari
fraserinstitute.org
Members
Past members
Editorial Advisory Board
* deceased; † Nobel Laureate
Prof. Terry L. Anderson
Prof. Robert Barro
Prof. Jean-Pierre Centi
Prof. John Chant
Prof. Bev Dahlby
Prof. Erwin Diewert
Prof. Stephen Easton
Prof. J.C. Herbert Emery
Prof. Jack L. Granatstein
Prof. Herbert G. Grubel
Prof. James Gwartney
Prof. Ronald W. Jones
Dr. Jerry Jordan
Prof. Ross McKitrick
Prof. Michael Parkin
Prof. Friedrich Schneider
Prof. Lawrence B. Smith
Dr. Vito Tanzi
Prof. Armen Alchian*
Prof. Michael Bliss*
Prof. James M. Buchanan* †
Prof. Friedrich A. Hayek* †
Prof. H.G. Johnson*
Prof. F.G. Pennance*
Prof. George Stigler* †
Sir Alan Walters*
Prof. Edwin G. West*