Embed Size (px)
Citation preview
Generating Electricity in Canada from Wind and Sunlight
Is Getting Less for More Better than Getting More for Less?
Pierre Desrochers and Andrew Reed
2019

fraserinstitute.org
2019 • Fraser Institute
Generating Electricity in Canada from
Wind and SunlightIs Getting Less for More Better
than Getting More for Less?
by Pierre Desrochers and Andrew Reed
fraserinstitute.org
Contents
Executive Summary / i
Introduction / 1
1. Integrating Wind and Solar Power into Electricity Systems / 2
2. The Impact of Provincial Renewable Energy Policies / 18
Quebec / 19
Prince Edward Island / 21
Ontario / 24
British Columbia / 31
Alberta / 35
Nova Scotia / 41
Conclusion / 44
References / 47
About the Authors / 55
Acknowledgments / 56
Publishing Information / 57
Supporting the Fraser Institute / 58
Purpose, Funding, and Independence / 58
About the Fraser Institute / 59
Editorial Advisory Board / 60
Desrochers and Reed • Generating Electricity in Canada from Wind and Sunlight • i
fraserinstitute.org
Executive Summary
Using wind and sunlight to generate electricity is controversial. Advocates urge increased reliance on these variable renewable energy (VRE) sources because they are seen as a low-cost way of mitigating a looming climate-change crisis. Critics take the opposite stance, claiming wind and solar power are costly, and the environmental bene-fits negligible at best. Some Canadian provinces have gone to considerable lengths to encourage adoption of these technologies, but the results have been mixed.
This study shows that both positions contain elements of truth. Electricity generated using wind and sunshine is relatively inexpensive. However, once the capacity is in place, it is only available at certain times of the day and/or when the weather cooperates. But consum-ers require a reliable electricity supply and integrating VRE into existing electricity systems while maintaining a continuous and reliable supply is complicated and costly, both finan-cially and environmentally. Electricity consumers and taxpayers are interested primarily in the financial burden that results from efforts to increase electricity generating capacity using VRE sources. This includes the costs wind and solar power impose on the electricity system as a whole, not just the cost of the VRE-generated electricity supplied to the grid.
The incremental financial costs to the system fall into three basic categories: first, augmenting existing conventional generating capacity so that it is able to compensate for the unreliable supply of wind and solar power. Second, ensuring that the necessary investment in conventional generating capacity is forthcoming although the VRE in the system makes it impossible to use this capacity efficiently. This requirement is usu-ally satisfied either with a capacity market or contracts with suppliers of conventional generating capacity. Third, adding transmission grid capacity and the configuration of grid services required to integrate VRE into the electricity system. Each category has repercussions for the environment. Cheap electricity from wind turbines and solar pan-els paradoxically results in larger bills for electricity users and taxpayers. Higher utility rates for businesses and households and higher taxes and cutbacks to public services dampen economic activity and reduce living standards.
Compared to conventional power sources, small and variable amounts of electricity are generated when wind and solar energy are captured and transformed by a dispersed array of VRE installations. Large areas of land, often in remote locations, are required.
fraserinstitute.org
This inevitably results in significant additional costs in terms of delivery infrastructure (for example, high-voltage power lines) and back-up power generation (for example, natural-gas-powered turbines) that would not otherwise be incurred. The first part of this study examines how electricity systems work in order to evaluate the contradictory claims made about VRE. Whether or not wind and solar power are clean and cheap depends on how the evaluation is framed. Critics point out that the economic and environmental costs of the electricity generated using wind and solar technologies can be quite different from the impact of this source of electricity on a system-wide basis.
The second part of the study shows how the system-wide costs and benefits of add-ing wind and solar power to an existing electricity system are affected by the policies of provincial governments, the cost of electricity, the conventional generating assets already in place, and the structure of the electricity system. Comparing experiences with VRE in different provinces illustrates the importance of these factors.
Cross-Canada comparisons show that electricity utilities themselves are usually best placed to determine whether or not the system-wide cost of these technologies is justified. Prior to 2015, Alberta demonstrated how a competitive wholesale market for electricity determined the extent to which wind and solar energy is economically feasible. Neither is the involvement of provincial governments necessarily a bad thing. Prince Edward Island has successfully integrated a substantial amount of wind power into its electricity system under unique circumstances: a provincial Crown corporation oper-ates several wind farms but the rest of the electricity system is privately or municipally owned. Problems arise when dramatic increases in wind and solar power receive political sanction and the economic consequences are underestimated or ignored. A bold initia-tive to increase wind and solar generating capacity in the Ontario electricity system backfired badly, leading to soaring electricity rates for both consumers and manufactur-ers. Between 2015 and 2019, the Alberta government worked towards installing even more wind and solar capacity than had proved politically and economically unsustainable in Ontario, but the electorate allowed that government only a single term in office.
A policy should be judged by whether or not the chosen means have delivered the promised ends. Our review of Canadian wind and solar energy policy shows that they led to consequences consistent with those in other jurisdictions: ramping up electricity production using these power sources results in increased costs for taxpayers and con-sumers when account is taken of the impact these technologies have on the electricity system as a whole and, when done on any significant scale, generally negative and unnecessary environmental consequences.
Desrochers and Reed • Generating Electricity in Canada from Wind and Sunlight • 1
fraserinstitute.org
Introduction
1. The term “intermittent” is often applied to wind and solar energy in order to highlight its “on again, off again” character. Intermittent, however, implies a rapid, “flickering” quality, with the resource available one minute and not the next. This may be true to some extent for solar energy as a consequence of passing clouds, but wind power usually varies over time periods of hours rather than minutes. As wind dominates grid-connected capacity, the term variable renewable energy (VRE) is preferred.
The extent to which wind and solar energy should be used to generate electricity in Canada is a controversial topic. Advocates argue that government action is urgently needed to increase the adoption of these variable renewable energy (VRE)1 technologies to accelerate the transition to a low-carbon economy. Opponents contend that this par-ticular cure is worse than the disease, and lament the inevitable increases in the cost of electricity and the unnecessary environmental consequences that result.
To understand this dispute, the first part of the study describes how electricity systems operate. It then examines the validity of the conflicting claims. It concludes that the arguments advanced on both sides have some validity: the controversy arises because the frameworks used by proponents and detractors to assess the merits of wind and solar power are completely different. Proponents of accelerated adoption of VRE focus attention on its low operating costs and the absence of harmful emissions. Opponents concentrate on the impact on the electricity system as a whole: from this perspective, the adverse environmental and economic impacts of VRE often make it unattractive in comparison with conventional generating technologies.
The second part of the study examines the integration of VRE in different parts of the country to illustrate the circumstances under which these technologies are beneficial or counterproductive. In some provinces, wind power has been successfully incorporated into the electricity system whereas in others it led to dramatic increases in electricity costs. The motivation for adding VRE, the existing mix of generating assets, the organ-ization of the electricity system, and the role played by provincial governments are examined in order to understand these differences.
2 • Generating Electricity in Canada from Wind and Sunlight • Desrochers and Reed
fraserinstitute.org
1. Integrating Wind and Solar Power into Electricity Systems
This section briefly describes the operations of an electricity utility. It begins by discuss-ing the operational challenges faced by a utility that depends on conventional technolo-gies to generate electricity. It then explains the issues that arise when wind and solar capacity is superimposed on a conventional electricity system.
Conventional electricity systems Electricity systems consist of three distinct components: generating facilities that create electricity, the distribution system that connects users, and a high-voltage transmission grid that links the two. In many Canadian jurisdictions, the electricity system is dominated by a single entity, often a provincial Crown corporation or a private company. Municipally owned distribution companies are also common. Private investors, provincial taxpayers, municipal ratepayers, and consumers all benefit when electrical utilities operate efficiently.
A reliable supply of electricity is a prerequisite for modern life. There is a tendency to take its availability for granted … until the power goes off, as it did most notoriously in the blackout that plunged a large part of the northeastern United States and adjacent areas of Canada into darkness in 2003. Electricity is, however, different from goods that are produced at one location, stored and transported to the places where they are dis-played for sale and purchased, and then used or consumed elsewhere. Electricity grids connect supply with demand. Electricity is not “transported” from point a to point b in the conventional sense, but demand must be continuously matched with supply.
An ability to store large quantities of electricity for extended periods of time would alleviate the need to continuously match supply with demand. Everyone is familiar with batteries that store very small amounts of electricity and power cell phones, computers, and electric vehicles. However, storage of electricity on the scale and at a cost sufficient to reduce the need to continuously match electricity supply with demand is not yet a practical option. The most significant of these initiatives are summarized in Text Box 1. Lack of suitable storage gives generating technologies that can be turned on and off as required—known as “dispatchable” power sources—a huge advantage over technologies without this attribute.
Desrochers and Reed • Generating Electricity in Canada from Wind and Sunlight • 3
fraserinstitute.org
Electricity—base load, peak load, load following
Facilities generating electricity provide three categories of “product” to electricity sys-tems: electricity, grid services, and capacity. The electricity actually “dispatched” from a generating station when required to match demand is self-explanatory. However, demand for electricity varies over time according to the time of day, the day of the week, and season of the year, and there may be underlying longer-term trends.2 The minimum amount of electricity required by the grid—base load—needs to be supplied continuously. The 5% of the time during the year when demand is highest is desig-nated “peak load”. Demand between these two extremes is referred to as “load following” (van Kooten, 2015).
2. Some utilities attempt to encourage off-peak electricity use with time-of-use (TOU) pricing, which requires smart meters to monitor electricity used during different portions of the day. BC Hydro invested heavily in equipping consumers with smart meters but has not yet introduced time-of-use pricing. The TOU pricing differentials in Ontario are often criticized as insufficient to discourage peak-period consump-tion. In the medium and longer term, increases in electricity prices encourage households and businesses to switch to more economic fuels, and industries that use large amounts of electricity to relocate to juris-dictions where electricity costs are lower.
TEXT BOX 1: THE STORAGE PROBLEM
A number of electricity storage options are technically feasible but cost effectiveness remains a challenge. Storage options currently fall into two broad categories: batteries and energy transformation options.
The most commonly discussed batteries are those scaled up from Tesla’s lithium-ion electric car battery. Although manufacturing scale economies have reduced the cost of this technology, the scarcity of the key ingredient is likely to prevent further significant price reductions (Goehring & Rozencwajg, 2018).
After 10 years of development, Professor Donald Sadoway, a Canadian professor at MIT, is publicizing a quite different approach using liquid metal. The chief advantage of this approach over lithium-ion technology is readily available and hence low-cost raw materials (Alsin, 2018).
Pumped storage is the dominant energy transformation option. It involves use of low-cost electricity to pump water into a hydroelectric storage dam. This water is subsequently released to generate electricity when prices rise. Using Ontario wind energy to pump water into Quebec reservoirs is frequently discussed but appears impractical (Brouillette, 2017; OSPE, 2014a).
Compressed Air Energy Storage (CAES) involves using cheap electricity to compress air that is then stored in geological formations. It is subsequently released and combined with natural gas to power electricity-generating turbines. Adding the precompressed air to the process improves the efficiency of the gas plant.
The Canadian Wind Institute in Prince Edward Island has a project underway that uses inexpensive wind-generated electricity to create hydrogen using electrolysis. Its partner is Hydrogenics (http://www.hydrogenics.com), based in Mississauga, Ontario. The hydrogen is used to power transit vehicles in its Hydrogen Village demonstration project.
4 • Generating Electricity in Canada from Wind and Sunlight • Desrochers and Reed
fraserinstitute.org
Matching demand continuously with electricity supplied by conventional generat-ing facilities is complicated. Demand is divided into different categories because each requires dispatchable generating capacity with specific “ramping” characteris-tics. “Ramping” refers to how rapidly a particular generating facility can begin produ-cing electricity. The speed with which supply can be ramped up or down at will to meet changes in demand varies considerably according to the power source employed. “At will” is emphasized because this is the main advantage of electricity generated by conven-tional means. Conventional sources of electricity such as coal- and gas-fired generating stations, hydroelectric installations, and nuclear power plants produce “dispatchable” power that can be adjusted to supply specified amounts of electricity within tolerances characteristic of the technology.
Dealing with sudden surges of demand (peak load) requires generating capacity that can be turned on quickly. Satisfying “base load” demand requires generating capacity that can operate economically for extended periods of time but may take a long time to bring on line. Load-following capacity does not need to be activated as quickly as peak-load capacity because this portion of the demand curve follows a predictable pattern (for example, less demand at night, more during business hours) and can be anticipated.
The cost of electricity produced by conventional generating assets of different types also varies. Production costs in specific generating facilities are compared using the concept of Levelized Costs of Electricity (LCOE). This is calculated by dividing the costs incurred building and operating a generating facility by the amount of electricity generated dur-ing its operational life ($/MWh).3 The duration of a facility’s operational lifespan and the extent to which its potential or “nameplate” capacity is used (its capacity utilization) over that period both affect the LCOE. It is important to note that LCOE calculations are of limited value for comparing the economics of electricity production by different technologies because they are facility specific. Two hydroelectricity stations with the same capacity may have very different capital costs and LCOE if they were built decades apart (van Kooten, 2015).
Utilities normally strive to provide a reliable supply of electricity at reasonable cost. Ensuring stability of the system requires constant manipulation of this supply. Demand for electricity is broken down into dispatch intervals of, usually, one or five minutes in
3. Electricity generating capacity is measured in MW (megawatts = a million watts or a 1,000 kilowatts (kW)). The electricity generated is measured in MWh (megawatt hours) or kWh (kilowatt hours)
Desrochers and Reed • Generating Electricity in Canada from Wind and Sunlight • 5
fraserinstitute.org
duration. Sources of available supply are ranked,4 and the appropriate amount of elec-tricity is “dispatched” to the grid to match demand for each dispatch interval. Ideally, the lowest-cost electricity should be dispatched first, with more expensive electricity sequentially added—a process known as “economic dispatch”. How electricity costs are determined, however, varies from jurisdiction to jurisdiction.
Grid services
The second category of product—grid services—are used to maintain the stability of the grid. These include regulating services, ramping services, and frequency control and ancillary services (FCAS). Regulating services include capacity idling in readiness to respond quickly to fluctuations in demand in future dispatch intervals. Ramping-up and ramping-down services work in conjunction with the system operator to balance sup-ply and demand during significant system ramps. Frequency-response ancillary servi-ces enable the system to deal with variations in system balance either over time periods shorter than the dispatch interval or not forecast at the time the dispatch of electricity supply was scheduled. In conventional electricity systems, grid services are provided by generating facilities.
This definition of grid services presupposes the existence of the transmission grid that connects electricity generating facilities with local distribution networks and consumers. This narrow definition makes sense in an electricity system where trans-mission grid capacity is a function of the distribution of conventional generating cap-acity. However, this relatively simple relationship ceases when wind and solar cap-acity are integrated into the electricity system. For this reason, when discussing the impact of wind and solar power on an electricity system it is necessary to broaden the definition of “grid services” to include the “service” the grid itself contributes to the system as a whole.
“Nameplate” generating capacity
The final category of product is the “nameplate” generating capacity (measured in MW) available. The need to have adequate generating capacity available to meet anticipated demand, plus a cushion to cover periods when generating facilities may be temporar-ily out of service for routine maintenance and refurbishment is obvious. The generating capacity available at any point in time must also have the mix of ramping characteristics
4. This ranking is known as the “merit order”. The criteria used to determine the merit order may vary. For example, the ranking of available “in-house” sources within a large Crown corporation may differ from a ranking based on competitive bids from independent suppliers (see, for example, Alberta, below page 35).
6 • Generating Electricity in Canada from Wind and Sunlight • Desrochers and Reed
fraserinstitute.org
necessary to match the demand profile. The large capital costs and long lead times required to bring conventional generating facilities into operation, compounded by uncertain trends in demand, complicate capacity planning.
Integrating wind and solar power Running a conventional electricity system is complicated across a broad array of time scales. Proponents of wind and solar energy focus attention on the merits of the elec-tricity these technologies contribute to the grid. They emphasize three attributes: first, the cost of electricity generated once the capacity is in place is low, given that their fuels are freely available in nature and almost no maintenance is required: this attrib-ute is emphasized by the terminology “renewable energy”; second, variable renewable energy (VRE) technologies are touted as being environmentally benign when operating (none of the greenhouse gas or particulate emissions associated with electricity gener-ated using fossil fuels nor the risks associated with nuclear-power plants); and third, the improving efficiency of industrial wind turbines (IWT) and photovoltaic panels is high-lighted to show that the cost of generating renewable electricity is declining.
This section shows that proponents of wind and solar power intentionally misrepre-sent the advantages of these technologies by focussing attention solely on the costs and benefits obtained whenever electricity is being generated. The costs of wind and solar power are considerably higher and the environmental benefits much lower when account is taken of the impact these technologies have on an entire electricity system. Ultimately, consumers do not pay for electricity generated using wind and sunlight but for electricity that is delivered to them continuously by the electricity system as a whole. Therefore, when VRE is introduced into an electricity system, ratepayers are interested in its system-wide impact, not just the cost of the wind and solar power entering the grid. The additional conventional generating capacity required to provide back-up elec-tricity supply when VRE capacity is not generating electricity because of a lack of wind or sunshine is a significant incremental cost to the system.
Furthermore, the impact of VRE technology on the cost of electricity delivered to con-sumers may be only part of the story. LCOE calculations reflect the economics of elec-tricity production and are used to guide the allocation of capital expenditure by an electricity utility. They do not normally reflect the subsidies used by politicians either to encourage the widespread adoption of a particular technology or to ensure that con-struction of a particular facility goes ahead in order to “create jobs”. Historically, such subsidies played a major role in the proliferation of nuclear-powered generating cap-acity in Ontario, and more recently have been used to ensure completion of the Muskrat
Desrochers and Reed • Generating Electricity in Canada from Wind and Sunlight • 7
fraserinstitute.org
Falls hydroelectric mega-project in Labrador. The political impetus provided for wind and solar technologies provides yet another instance of this phenomenon in several provinces. These subsidies require a political decision to use public funds to support an
“emerging” technology, the “creation” of jobs, or both, diverting funds from alternatives such as health care, education, and debt reduction, which many might consider higher priority. Subsidies that encourage installation of VRE generating capacity represent a cost to taxpayers, over and above the increases they see in their utility bills. Wherever political rather than economic decisions prompt widespread adoption of VRE, the finan-cial burden is frequently borne both by businesses and households via higher utility rates and by taxpayers via higher taxes or cutbacks in public services.
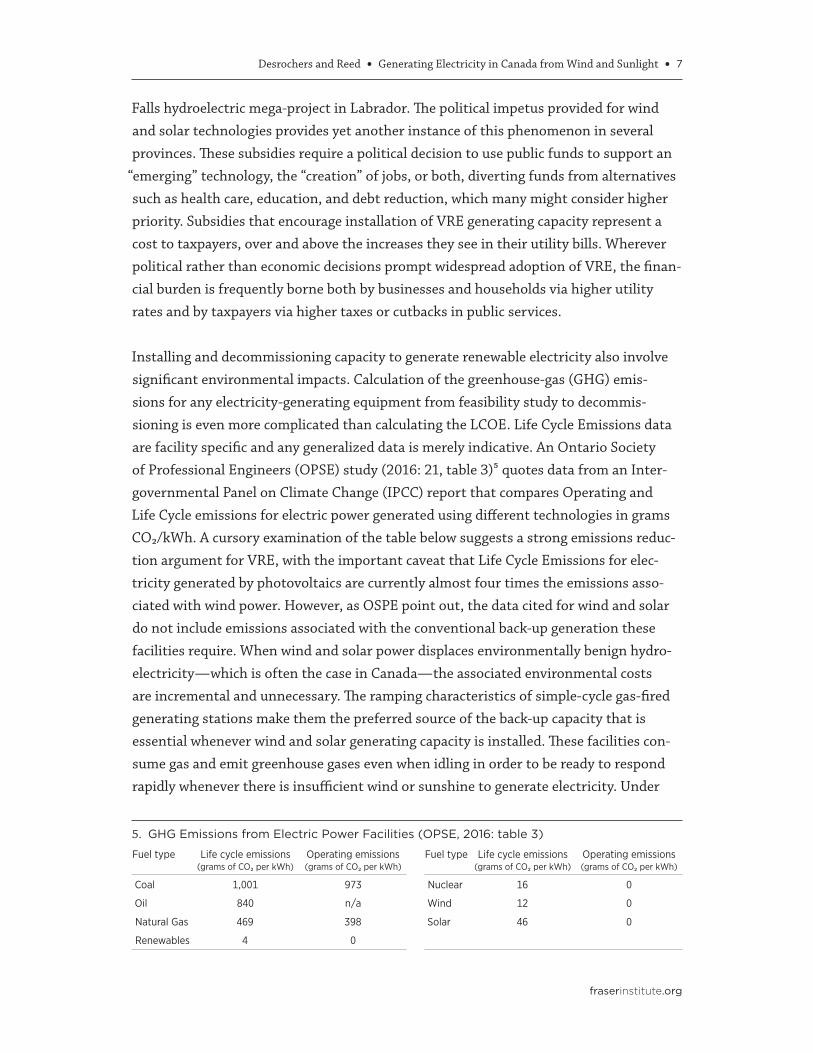
Installing and decommissioning capacity to generate renewable electricity also involve significant environmental impacts. Calculation of the greenhouse-gas (GHG) emis-sions for any electricity-generating equipment from feasibility study to decommis-sioning is even more complicated than calculating the LCOE. Life Cycle Emissions data are facility specific and any generalized data is merely indicative. An Ontario Society of Professional Engineers (OPSE) study (2016: 21, table 3)5 quotes data from an Inter-governmental Panel on Climate Change (IPCC) report that compares Operating and Life Cycle emissions for electric power generated using different technologies in grams CO2/kWh. A cursory examination of the table below suggests a strong emissions reduc-tion argument for VRE, with the important caveat that Life Cycle Emissions for elec-tricity generated by photovoltaics are currently almost four times the emissions asso-ciated with wind power. However, as OSPE point out, the data cited for wind and solar do not include emissions associated with the conventional back-up generation these facilities require. When wind and solar power displaces environmentally benign hydro-electricity—which is often the case in Canada—the associated environmental costs are incremental and unnecessary. The ramping characteristics of simple-cycle gas-fired generating stations make them the preferred source of the back-up capacity that is essential whenever wind and solar generating capacity is installed. These facilities con-sume gas and emit greenhouse gases even when idling in order to be ready to respond rapidly whenever there is insufficient wind or sunshine to generate electricity. Under
5. GHG Emissions from Electric Power Facilities (OPSE, 2016: table 3)
Fuel type Life cycle emissions (grams of CO2 per kWh)
Operating emissions (grams of CO2 per kWh)
Fuel type Life cycle emissions (grams of CO2 per kWh)
Operating emissions (grams of CO2 per kWh)
Coal 1,001 973 Nuclear 16 0
Oil 840 n/a Wind 12 0
Natural Gas 469 398 Solar 46 0
Renewables 4 0

8 • Generating Electricity in Canada from Wind and Sunlight • Desrochers and Reed
fraserinstitute.org
such circumstances, the emissions generated per kWh of electricity delivered to the grid for the gas plant will increase dramatically. The same is true to a lesser extent for other conventional generating assets that suffer reduced capacity utilization due to the addi-tion of VRE capacity. Blanketing the country with wind turbines does not eliminate the need for conventional generating capacity to provide electricity when there is no wind. However, the required (natural gas) back-up would significantly increase emissions unless the conventional power sources were fueled by coal (without state-or-the-art emissions “scrubbing” technology) or oil.
Electricity generating technologies that use wind or sunlight may be integrated either into the transmission grid or the distribution network. The system-wide impacts are somewhat different in each case. The main focus here is on the alleged benefit of adding wind and solar power to high-voltage transmission grids. However, some comments on the issues that arise when these technologies are connected to the distribution system are in order first.
“Embedded” wind and solar power
Consumers with access to service provided by an electricity utility have a number of options. Relying on electricity available from the local distributor is the usual choice. They may choose to contract with a green energy supplier such as Bullfrog Power and pay a premium price.6 Homes or businesses may opt to install their own electricity generating devices to reduce their dependence on the grid. These devices are known as
“embedded” or “DX” capacity. Most frequently these are solar panels erected on residen-tial or farm properties or on the roofs of homes and businesses.7 Access to the local dis-tribution network provides back-up power when the embedded power generation equip-ment is idle as a result of insufficient sunshine or wind. Modest amounts of electricity may also be stored in batteries, further reducing demand for electricity from the grid and the local distribution network.
“Embedded” generation is important because it accounts for the majority of solar power capacity in Canada. In Ontario, for example, 85% of solar energy is embedded (DX), and 15% grid-connected (TX). For wind, 86% is grid-connected. The cost of installing embed-ded wind or solar capacity is considerable, and the capacity now in place is primarily the
6. For further information, see the website of Bullfrog Power, <www.bullfrogpower.com>.
7. Gas-powered back-up generators designed to provide power to homes and businesses when the distri-bution network is disrupted are an additional category of distributed electricity-generating capacity.
Desrochers and Reed • Generating Electricity in Canada from Wind and Sunlight • 9
fraserinstitute.org
consequence of participation in provincial or federal government incentive programs. These are usually part of a conservation initiative designed to reduce demand for electri-city from the grid and often rely on “net-metering”. Under a net-metering program, elec-tricity generated in situ may be uploaded to the distribution network when surplus to domestic requirements, and downloaded from the network when on-site generation is unavailable or insufficient. Financial incentives may include a premium price offered for surplus electricity uploaded to the distribution network, a subsidy for the installation of the necessary equipment, or some combination of the two.
Initiatives to encourage distributed generation are controversial for several reasons.8 Two are of particular importance. The first is that subsidization of embedded solar power benefits a limited number of participants at the expense of the larger number who share the cost. Hence the argument that those who choose unusually complicated and expensive ways of obtaining their electricity supply should be free to do so but should not expect others to foot the bill. When the same issue arises in the context of grid-connected VRE capacity, decisions taken centrally—often politically motivated—eliminate consumer choice.
The second reason reducing demand on the grid by encouraging distributed generation is controversial is that successful conservation initiatives lead to higher electricity rates because utilities need to recoup their overhead costs from reduced demand.9 Therefore, ratepayers pay both the cost of conservation programs if they are included in their elec-tricity bill and the rate increases utilities need to cover their fixed costs as billable kWh and capacity utilization declines. The same phenomenon occurs when scaled up to the electricity system level: ratepayers are asked to pay more for the same benefit (the elec-tricity they use) because the efficiency of the system as a whole has declined.
8. For example, McKitrick and Green (2014) show that energy consumption and economic development move in lockstep, and conservation initiatives are misguided attempts to reduce both. Attempts to push in the opposite direction are counterproductive. Smil (2017) agrees, and shows that human develop-ment depends on improving the efficiency with which energy is converted. McKitrick and Adams (2016) show that costly conservation initiatives are rooted in the mistaken belief that people do not know what is best for them
9. This is one manifestation of the “stranded assets” problem discussed below, p. 13. Irrespective of the underlying trajectory of demand for electricity in the medium and longer term, the electricity utility is often required to encourage addition of embedded solar or wind capacity (“conservation” initiatives), the benefits of which are captured by those who participate in these subsidized programs, and to cover the cost of having sufficient conventional generating and transmission capacity available to provide the electri-city needed when wind and solar capacity is unable to generate any electricity.
10 • Generating Electricity in Canada from Wind and Sunlight • Desrochers and Reed
fraserinstitute.org
Grid-connected wind and solar power
In Canada, most wind-power generating capacity but very little solar power capacity is connected directly to high voltage transmission grids. This discussion of the conse-quences does not deal with the quite different outcome that may prevail at some future date if large-scale storage becomes practical. The impact of VRE technologies on electri-city systems as a whole is emphasized.
VRE has three characteristics that complicate its integration into electricity systems: it is variable and uncertain, it is generated at low marginal cost, and it is non-synchronous in nature (Riesz & Milligan, 2015: 2–3). These characteristics affect all three “product” categories the system draws from generating facilities: electricity supply, ancillary servi-ces, and generating capacity. Each is considered briefly in turn.
Electricity supply and existing capacity
If proponents of wind and solar power use the term “renewable energy” to emphasize its desirable environmental attributes, opponents sometimes use the term “unreli-able energy” to highlight its major limitation. The variable and uncertain character of wind and solar energy stems from reliance on natural phenomena that vary over time. Consequently, wind and solar electricity supplies are considered non-dispatchable because they cannot be “turned on” whenever required. Matching variable demand for electricity with “dispatchable” supply that can be activated as required is problematic enough. Trying to do so using supply that is also variable is even more complicated.
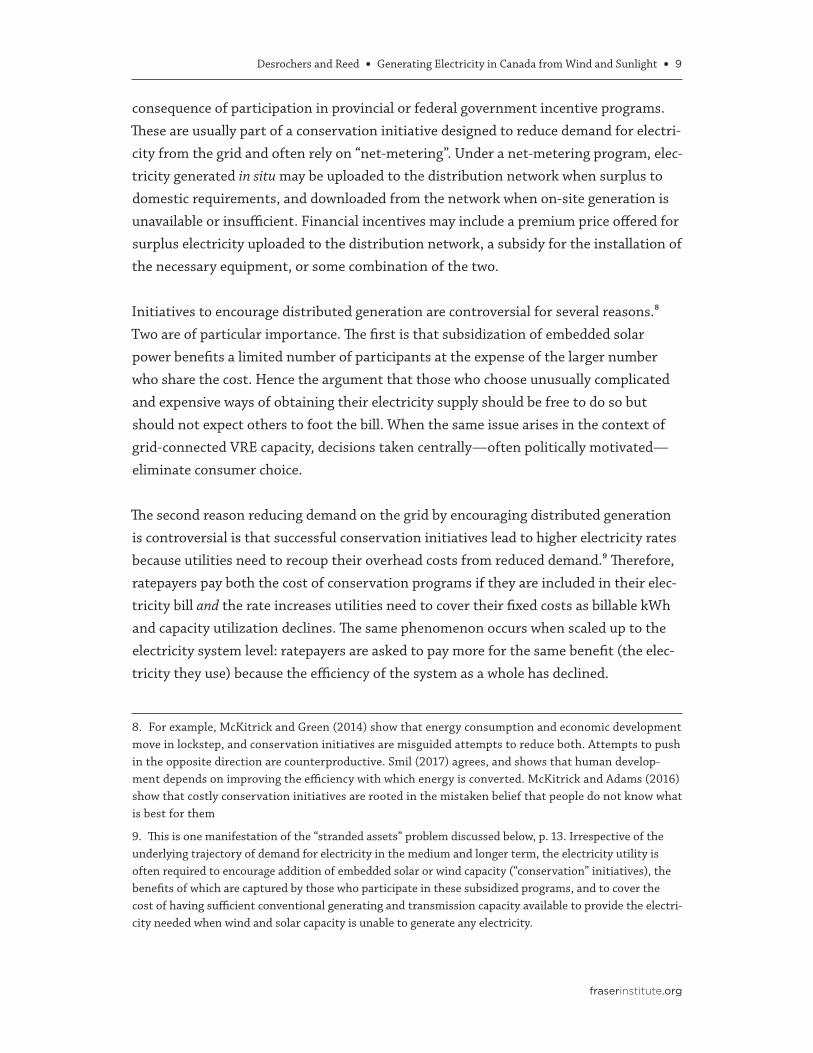
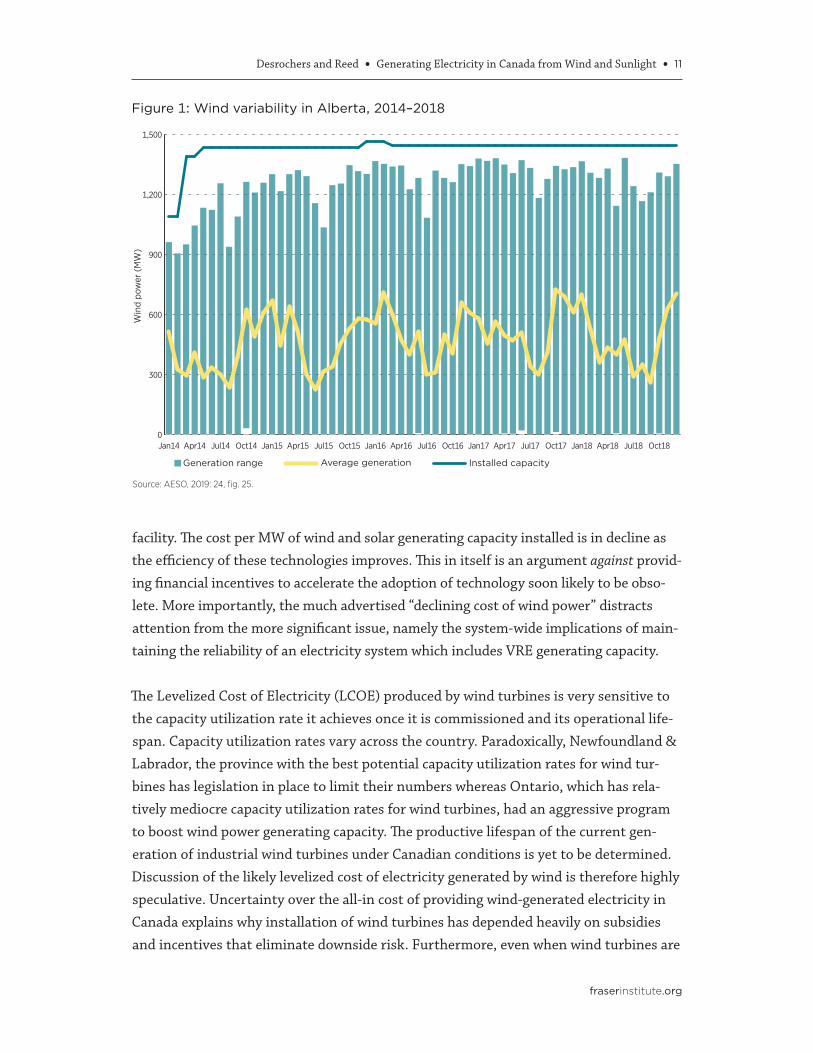
Capacity utilization rates for wind depend on location, but are typically low relative to conventional generating technologies.10 In Alberta, where capacity utilization rates for wind turbines are relatively good (averaging 35% in 2017 and 32% in 2018), the varia-tion around that mean is considerable (figure 1). Although the maximum amount of wind energy in any given month always falls short of nameplate capacity, in most months there are periods when installed wind capacity is generating no electricity at all. This has impli-cations for the back-up capacity required, and the technology used to provide that back-up.
The marginal cost of electricity produced by wind may be extremely low, but the capital cost of installing wind turbines has to be recouped over the operational lifespan of the
10. Simple-cycle gas plants used to provide peak-load electricity (and to back up wind and solar capacity) are an exception. Capacity utilization of simple-cycle gas plants in Alberta was only 12% in 2017. It increased sharply in 2018 as a consequence of cheaper gas and the impact of the carbon tax on electricity generated by coal-fired plants.
Desrochers and Reed • Generating Electricity in Canada from Wind and Sunlight • 11
fraserinstitute.org
facility. The cost per MW of wind and solar generating capacity installed is in decline as the efficiency of these technologies improves. This in itself is an argument against provid-ing financial incentives to accelerate the adoption of technology soon likely to be obso-lete. More importantly, the much advertised “declining cost of wind power” distracts attention from the more significant issue, namely the system-wide implications of main-taining the reliability of an electricity system which includes VRE generating capacity.
The Levelized Cost of Electricity (LCOE) produced by wind turbines is very sensitive to the capacity utilization rate it achieves once it is commissioned and its operational life-span. Capacity utilization rates vary across the country. Paradoxically, Newfoundland & Labrador, the province with the best potential capacity utilization rates for wind tur-bines has legislation in place to limit their numbers whereas Ontario, which has rela-tively mediocre capacity utilization rates for wind turbines, had an aggressive program to boost wind power generating capacity. The productive lifespan of the current gen-eration of industrial wind turbines under Canadian conditions is yet to be determined. Discussion of the likely levelized cost of electricity generated by wind is therefore highly speculative. Uncertainty over the all-in cost of providing wind-generated electricity in Canada explains why installation of wind turbines has depended heavily on subsidies and incentives that eliminate downside risk. Furthermore, even when wind turbines are
0
300
600
900
1,200
1,500
Oct18Jul18Apr18Jan18Oct17Jul17Apr17Jan17Oct16Jul16Apr16Jan16Oct15Jul15Apr15Jan15Oct14Jul14Apr14Jan14
Source: AESO, 2019: 24, fig. 25.
Figure 1: Wind variability in Alberta, 2014–2018
Generation range Average generation Installed capacity
Win
d po
wer
(M
W)
12 • Generating Electricity in Canada from Wind and Sunlight • Desrochers and Reed
fraserinstitute.org
generating revenue in a competitive energy market, the poor correlation between the availability of wind and demand generally means that electricity generated will be dis-proportionately available when demand—and wholesale prices—are low.11
Surplus capacity required in a conventional electricity system is in the order of 15%. This enables the system to handle routine maintenance and repairs that may tempor-arily sideline some dispatchable power capacity. The fluctuations in wind and solar capacity utilization dictated by natural phenomena require considerable back-up. According to the OSPE (2014b), up to 90% of variable renewable capacity needs to be replicated with dispatchable power. The financial and environmental costs associated with this capacity vary depending on the technology mix. Existing hydroelectricity capacity may be used when wind is “off” for extended periods. But the ramping char-acteristics of simple cycle-gas turbines make it the preferred source of back-up gener-ating capacity. Such plants, which would otherwise be redundant, involve significant capital cost and will operate at low-capacity utilization rates, idling, burning fuel, and generating GHGs even when not supplying electricity to the grid because wind and solar power is available.
Both solar and wind power are susceptible to rapid ramping events (sharp increases or decreases in availability). The mix of generating assets required to provide back-up is different from the mix required when the entire load is provided by dispatchable power sources. In other words, the prospect of wind being added to the system requires both qualitative and quantitative changes in conventional electricity generating capacity. Substantial capital investments are required to create a mix of generating assets that will “work” with wind or other variable renewables. Once the necessary equipment is installed, VRE generates electricity at low marginal cost whenever nature cooper-ates. The low operating costs of these technologies are a benefit for wind and solar farm operators: wherever electricity supply is determined by the principle of economic dispatch, the low marginal cost of wind and solar power means suppliers can outbid electricity from conventional generating stations and VRE will be used whenever it is available. In the absence of a bona fide energy market to price electricity from differ-ent sources, wind and solar power are often afforded priority access to the grid when available. In either case, wind and solar power, whenever they are available, will displace
11. In Alberta, electricity is accepted by the grid according to the principle of “economic dispatch” (lowest cost electricity first). Electricity generated by wind turbines installed before government subsidies became available top the merit order, and therefore determine the system’s marginal price, only when demand is extremely low. Wind is the only power source that consistently earns less than the average pool price. This discount was 12% in 2017 and 23% in 2018 (AESO, 2018, 2019).
Desrochers and Reed • Generating Electricity in Canada from Wind and Sunlight • 13
fraserinstitute.org
electricity produced by conventional generating technologies at higher marginal cost. The average cost of electricity accepted by the grid therefore tends to decline as VRE capacity is added.
From the perspective of the electricity system as a whole, however, the low marginal cost of electricity is a problem. Generating assets that were routinely dispatched before vari-able renewables were added to the system are called upon to supply electricity to the grid less frequently. Their capacity utilization rates and revenue earned from electricity sales will decline. This impact will intensify as the amount of wind and solar power available increases. The cost structure of the system as a whole will increase, and this has import-ant implications for the sustainability of the system in the medium and longer terms.
The fundamental problems given the current state of wind and solar technology are its variability and the absence of any cost-effective means of storing electricity generated to bridge the lack of electricity supply that occurs when there is insufficient wind or sun-shine.12 Conventional generating capacity is required to provide back-up supply capacity capable of covering demand whenever electricity from VRE sources is unavailable. Hence, VRE is not currently a substitute for conventional generating technologies. Adding VRE capacity does not permit the early retirement of conventional generating capacity: it means that conventional capacity usually needs to be augmented to ensure an ability to respond when VRE is not available. Instead of one (conventional) system with capacity to supply the electricity needs placed on the system, adding VRE capacity requires conven-tional generating capacity capable of supplying those same demands (but configured some-what differently to provide the back-up characteristics required to operate in conjunction with VRE sources) as well as the VRE capacity itself. These parallel systems often involve higher financial and environmental costs than the original conventional system alone.
Conventional generating assets that experience a reduction in capacity utilization and revenue when displaced by wind and solar power are known as “stranded assets”. Investments were made in these facilities based on assumptions about their expected capacity utilization and revenue stream but these change substantially when wind and solar power are added to the system. Stranded assets are a sign of a decline in the efficiency of the system as a whole. Revenue is diverted from conventional generating
12. It is for this reason that the ability to store large quantities of electricity cost-effectively is so fre-quently discussed (see Text Box 1). If VRE plus storage were a viable alternative to conventional electricity-generating capacity, that capacity would be replaced gradually as existing facilities reached the end of their useful life, a process governed by economic rather than political considerations.
14 • Generating Electricity in Canada from Wind and Sunlight • Desrochers and Reed
fraserinstitute.org
capacity to variable renewable capacity but investment in generating assets as a whole increases as a result of the addition of wind and solar capacity. Hence, return on assets declines on a system-wide basis. The need to provide suitable conventional generat-ing capacity to back up variable renewables when they are not available increases the necessary investment, pushing return on assets down even further. The net effect is an increase in system costs whether the electricity used (dictated by demand) increases, declines, or remains unchanged. Wherever electricity consumers bear the brunt of price increases attributable to installation of VRE capacity, higher prices will encourage a reduction in demand, exacerbating the problem of stranded assets.
In a system organized around an electricity market, competition determines whole-sale prices. When variable renewables affect anticipated financial returns generated by conventional generating assets, the consequences fall principally on investors.13 In a publicly owned utility such as a Crown corporation, the decline in efficiency will usually lead to requests for rate increases even though the marginal cost of the electricity gen-erated may be in decline. As will become evident, the worst-case scenario arises where provincial governments intervene to ensure assets “stranded” by the installation of VRE generating capacity remain profitable.
Future electricity generating capacity
The stranded-asset problem has both short- and long-term consequences. Private invest-ment in conventional generating technologies is discouraged when existing generating capacity is yielding returns lower than anticipated as a consequence of increased levels of VRE capacity in the system. Efforts by some provincial governments to encourage pri-vate investment in electricity generating capacity in general, and simultaneous efforts to encourage more widespread adoption of VRE technologies are counterproduct-ive: the political commitment to VRE is itself a disincentive to investment in conven-tional generating assets. Uncertainty regarding political support for VRE in the future increases reluctance to invest in conventional generating assets, which usually require a protracted approval, construction, and commissioning process. When such projects do eventually generate electricity, they may never be used intensively enough to yield an acceptable return. This is known as the “missing money problem”. Frequently, the pol-itical “solution” to the missing money problem is lucrative “take-or-pay” contracts for investors that eliminates their risk and transfers costs to consumers or taxpayers.
13. The “stranded asset” problem has led to the bankruptcy of energy companies in the US south, where embedded solar installations have depressed demand. For a general discussion of this issue, see The Economist (2017).
Desrochers and Reed • Generating Electricity in Canada from Wind and Sunlight • 15
fraserinstitute.org
Capacity planning involving dispatchable generating assets is complicated, and variable renewables create a need for more capacity and discourage investment in that capacity at the same time. Using market signals is one way to counteract the disincentive that arises from the presence of variable renewables in the market. One approach is to cre-ate a capacity market that pays for the availability of generating capacity but is separ-ate from the market for electricity (see, for example, Brown, 2018). A capacity market ensures the “energy only” market will remain competitive in the future and sidesteps the missing money problem, but it involves considerable additional expense for the electricity system as a whole. In the case of an integrated Crown corporation or a pri-vate utility, political pressure to add variable renewables requires additional investment in conventional assets that are likely to be underused, depressing efficiency and hence, putting upward pressure on electricity prices, depressing profitability, or both.
Grid services
Integrating wind and solar generating capacity into an electricity system requires quan-titative and qualitative changes in the transmission grid as well as the parallel conven-tional generating capacity required as back-up. The transmission and connection “ser-vice” that the grid provides to the electricity system requires significant and costly reconfiguration when wind and solar power are added to an electricity system. These upgrades to grid infrastructure are an incremental cost borne by the system as a whole. These costs are frequently underestimated or even ignored completely by those advocat-ing expansion of VRE capacity.
Capturing “free” wind and solar energy and converting it into electricity contribute rela-tively small amounts of electricity to the grid when weather conditions are suitable. A large number of widely distributed installations are therefore required to generate the same amount of electricity as a single conventional generating facility. Shellenberger (2018) points out that the relatively efficient Ivanpah solar farm in California would have to be replicated 18 times to generate the same amount of electricity as the Diablo Canyon nuclear plant. Not only would this involve 18 transmission lines but those lines would inevitably be longer as VRE facilities are usually located in areas of low popula-tion density, whereas fossil-fuel and nuclear-powered generating stations are often sited where demand for electricity is concentrated.14 Nor would the hypothetical 18 trans-mission lines replace those associated with the single line transmitting power from a nuclear plant because those lines would only be used when the sun is shining, and
14. This is of course not the case for large hydroelectric facilities, but the rated capacity of such facilities dwarfs that of wind and solar installations.
16 • Generating Electricity in Canada from Wind and Sunlight • Desrochers and Reed
fraserinstitute.org
some other form of conventional generating capacity (probably simple-cycle gas plants) would be required to back up the VRE source. In this example, the multiple transmis-sion links required to link the nuclear plant, the 18 solar farms, and the required back-up gas plants to distribution networks is significantly more costly and extensive than the single link required when all the electricity is supplied by the nuclear plant. As is the case with generating capacity, the transmission infrastructure required to connect VRE with an electricity system duplicates rather than replaces the transmission infrastruc-ture required by conventional generating facilities.
The substantial capital costs of the transmission capacity required to bring about the integration of wind and solar power into electricity systems and maintain supply reli-ability is only one aspect of the issue, however. Transmission lines serving sources of wind and solar power typically deliver electricity below their rated capacity because of the variability of the electricity supply. Hence the transmission connections associated with wind and solar generating capacity will be intentionally underused. Those resour-ces would be more efficiently used transmitting electricity generated by conventional technologies. Connecting variable renewables to the grid also requires costly “fixes” for over-voltage, excessive voltage, and transformer issues that do not occur with dispatch-able electricity (Gallant and Fox, 2011).
Grid services ensure optimal functioning of the grid. Instability occurs in grids trans-mitting electricity from conventional power sources, and the necessary countermea-sures have traditionally been provided by generating facilities. Adding wind or solar capacity introduces a significant new source of instability. Part of the problem is the inherent variability and uncertainty of an electricity supply that is dependent on natural phenomena. System operators responsible for balancing supply and demand also often have incomplete information regarding the amount of variable renew-ables entering the grid at any given point in time. This is particularly true when large amounts of solar capacity are embedded in the distribution system.
Adding variable renewables to an existing system creates a need for a mix of services that is different from the mix required when all electricity is dispatchable, as well as significantly increasing demand for additional transmission grid. Additional protection from unanticipated ramping-up and ramping-down of supply is one example (AESO, 2012). This protection can be achieved in various ways, such as increasing the excess dispatch cushion or by activating ancillary services. Both impose additional costs on the system. Suppliers are compensated for their readiness to provide grid services whenever they are needed, as well as the services actually used.
Desrochers and Reed • Generating Electricity in Canada from Wind and Sunlight • 17
fraserinstitute.org
Broadening the need for grid services has been accompanied by a diversification of sup-ply. The non-synchronous characteristic of wind and solar power puts them at a dis-advantage as suppliers of grid services. However, increasing technical sophistication of power electronics now make it possible for variable renewables to provide a limited range of grid services (for a Canadian example, see Fairley, 2016). Small battery packs are also now being used as a frequency regulating service for variable renewables, but at considerable cost.
Concluding Remarks
The cost of integrating variable renewables into an existing electricity grid is consider-able. If an integrated utility is left alone to manage its own business, these incremental, system-wide costs discourage installation of VRE generating capacity. If the electricity system allocates market access based on price, the level of variable renewable penetra-tion will be determined by the market rules that govern competition. However, as the next section shows, provincial policies often preclude these two alternatives.
In most jurisdictions, provincial governments have intervened in order to increase VRE capacity installed. In such circumstances, the availability of this low-cost electricity is a both a benefit and a problem. It is a benefit because it may lower the average cost of electricity entering the grid. It is a problem because conventional generating capacity must remain available to back up the VRE capacity whenever it fails to generate elec-tricity, but its capacity utilization rates suffer whenever weather conditions make VRE available to the grid.
18 • Generating Electricity in Canada from Wind and Sunlight • Desrochers and Reed
fraserinstitute.org
2. The Impact of Provincial Renewable Energy Policies
15. Industry consolidation normally brings complementary businesses together in order to minimize transaction costs and improve efficiency. The involvement of IPPs in electricity systems runs counter to this trend.
Electricity utilities in Canada vary in structure. They include provincial Crown corpora-tions with varying degrees of autonomy (Quebec, British Columbia), one province where electricity supply depends on a competitive wholesale market (Alberta), and private companies (Prince Edward Island, Nova Scotia). In this section, comparisons between provinces illustrate the consequences of efforts to integrate VRE into provincial elec-tricity grids. Outcomes diverge depending on the conventional generating mix in place before VRE, the organisational structure of the electricity sector, and the motives and mechanisms used to encourage installation of wind and solar generating capacity.
Private-sector entities (other than the dominant provincial utility if it is a private com-pany) encouraged to invest in electricity generating capacity are usually referred to as
“independent power producers” or IPPs. Whatever the motivation for a strategy that relies on IPPs, it complicates the process of coordinating electricity supply and demand, a responsibility usually shouldered by the provincial electricity utility.15 Reliance on IPPs to provide generating capacity in many provinces adds another layer of complexity to the problem of integrating wind and solar power into electricity systems.
In jurisdictions where there is no competitive market, IPPs find themselves in a difficult position. Their participation depends on political commitment. They will be required to work through a maze of procedures and approvals. If successful, they must collab-orate with an incumbent provincial utility that may well resent their intrusion. Their overriding objective is to generate a return on their investment commensurate with the risks involved. The terms of participation negotiated under such circumstances generally provide incentives that guarantee a revenue stream for an extended period of time. These incentives often take the form of Feed-in-Tariff (FIT) schedules or Power Purchase Agreements.
Desrochers and Reed • Generating Electricity in Canada from Wind and Sunlight • 19
fraserinstitute.org
To the extent that IPPs are guaranteed an acceptable rate of return on their invest-ment via long-term contracts, their position vis-à-vis the electricity utility is like adding preferred shareholders or bond holders to a public company: they are first in line to receive their income. Ordinary “shareholders” (taxpayers in the case of Crown corporations) find themselves in a residual and less advantageous position. This is an important consideration when assessing how the costs and benefits of “green energy” initiatives are allocated.
QuebecQuebec’s electricity utility has a relatively straightforward structure. The impact of VRE is therefore easy to see. Hydro-Québec is an integrated and autonomous provincially owned corporation. It has a mandate to deliver reliable and affordable electricity, and hydroelectric rates in Quebec are the lowest in the country. Quebecers also benefit from the dividends Hydro-Québec contributes to the provincial treasury. It exports electricity to the north-eastern United States both because it is cost competitive and because it helps American utilities meet mandated green-energy targets.16
The majority of the electricity distributed by Hydro-Québec is generated by large-scale hydroelectric stations. The most recent of these projects, the four-phase La Romaine hydroelectric station on the north shore of the St. Lawrence, is nearing completion. Hydroelectric generating stations emit neither greenhouse gases nor particulates, so there is no obvious environmental argument for adding wind or solar generating cap-acity in Quebec. Hydro-Québec has incentives to operate efficiently: failure to do so would jeopardize the competitiveness of its electricity in the US market, threaten the dividends it contributes to provincial government coffers, and inflict higher electricity prices on Quebec businesses and residents. It is therefore unlikely that Hydro-Québec, if left to its own devices, would add wind and solar generating capacity to the Quebec electricity grid.
Early in the century, the demand forecasts on which capacity planning was based turned out to be overly optimistic and Hydro-Québec found itself with an energy surplus even before the 2008 financial crisis. Its strategy to address this problem included a take-over
16. In many US states and some Canadian provinces, the legislated targets established to encourage increased reliance on electricity-generating technologies considered “green” are known as Renewable Portfolio Standards (RPS). There are wide variations among these frameworks, but many US states give preferential treatment to wind and solar power.
20 • Generating Electricity in Canada from Wind and Sunlight • Desrochers and Reed
fraserinstitute.org
bid for the New Brunswick electricity utility in 2009 (which would have improved access to the US market), negotiations to supply electricity to Prince Edward Island, and the decision not to refurbish its only remaining nuclear plant.17
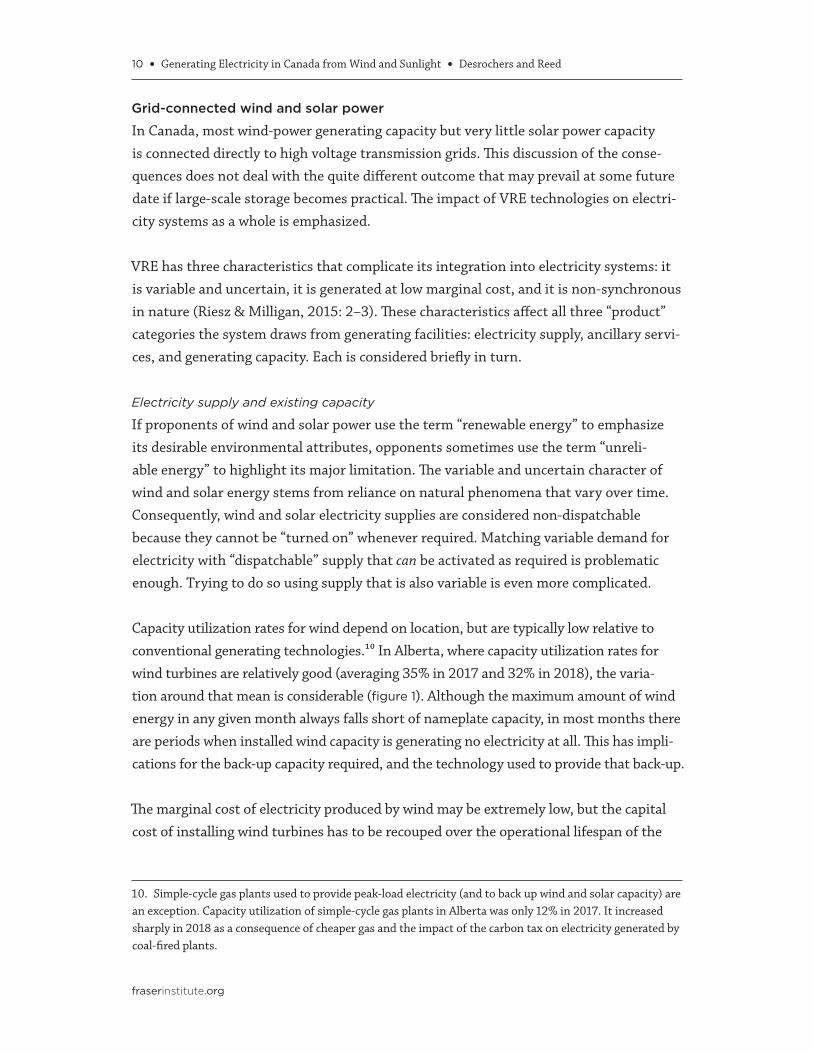
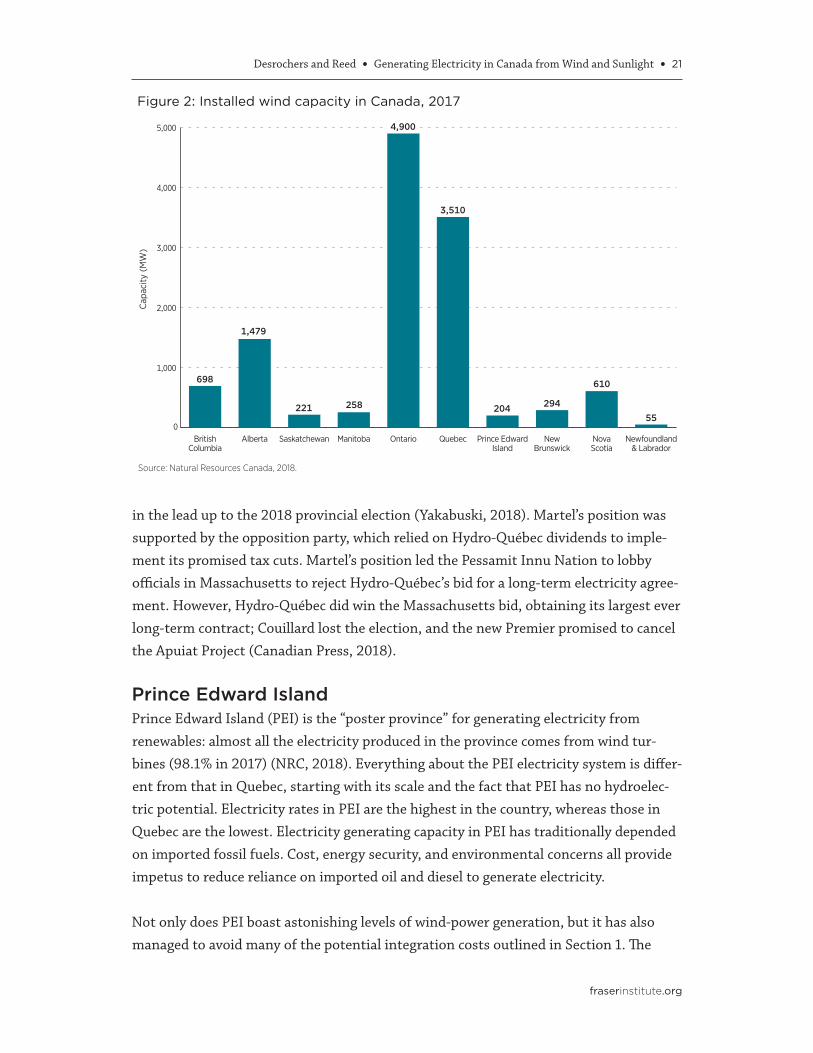
This over-supply situation was exacerbated by a parallel initiative on the part of the provincial government to encourage municipal hydroelectricity, biomass cogeneration, and IPP wind-farm projects. The most generous incentives were provided for wind-farm projects: 20-year contracts for wind power at prices that averaged two and one half times the price Hydro-Québec would recoup from its sale. The primary motivation for this initiative was regional development: IPPs installing wind capacity were required to produce 60% of the parts used to construct wind turbines in Quebec and 30% in Gaspésie, one of the province’s least developed regions. By 2017, Quebec had the second largest installed wind capacity in the country, 3,510 MW; this was 30% of the installed capacity in Canada (figure 2). Wind power accounted for 3.6% of the electricity gener-ated in the province (NRC, 2018).18
Hydro-Québec found itself forced to accept delivery of high-cost electricity that it sub-sequently sold at a loss. As early as 2013 the cost of mandated purchases under 58 long-term contracts with IPPs was cited by Hydro-Québec as the reason behind its request for a 2.8% rate increase. At the time, wind contracts alone represented annual losses to Hydro-Québec ranging from $695–735 million. Significantly, this range reflects differ-ent estimates given by Hydro-Québec for the cost of integrating wind power into the grid (Chassin, 2013).
As this wind power came on stream, it compounded Hydro-Québec’s capacity surplus and problem with underused assets. It paid a heavy penalty to renege on a contract with TransCanada Energy for electricity supplied by a co-generation plant in Bécancour (Yakabuski, 2016). Eric Martel, the current CEO of Hydro-Québec, re-emphasized the importance of maintaining profitability when he took over in 2015. In 2017, he took issue with a government decision to proceed with the Apuiat wind project in northern Quebec, which was expected to cost Hydro-Québec somewhere between $1.5 and $2 bil-lion (MEI, 2017). A war of words ensued between Martel and Quebec Premier Couillard
17. An agreement in principle was reached with New Brunswick but it proved impossible to overcome local opposition. Hydro-Québec closed its last nuclear reactor in 2012 after it was decided the anticipated cost of an imminent refurbishing was not justified.
18. The Churchill Falls Hydroelectric mega-project in Labrador with 5,128 MW capacity is a major source of electricity distributed by Hydro-Québec, so this figure overstates the importance of wind in the provin-cial energy mix. For the history of this controversial project, see Mathias, 1971.
Desrochers and Reed • Generating Electricity in Canada from Wind and Sunlight • 21
fraserinstitute.org
in the lead up to the 2018 provincial election (Yakabuski, 2018). Martel’s position was supported by the opposition party, which relied on Hydro-Québec dividends to imple-ment its promised tax cuts. Martel’s position led the Pessamit Innu Nation to lobby officials in Massachusetts to reject Hydro-Québec’s bid for a long-term electricity agree-ment. However, Hydro-Québec did win the Massachusetts bid, obtaining its largest ever long-term contract; Couillard lost the election, and the new Premier promised to cancel the Apuiat Project (Canadian Press, 2018).
Prince Edward IslandPrince Edward Island (PEI) is the “poster province” for generating electricity from renewables: almost all the electricity produced in the province comes from wind tur-bines (98.1% in 2017) (NRC, 2018). Everything about the PEI electricity system is differ-ent from that in Quebec, starting with its scale and the fact that PEI has no hydroelec-tric potential. Electricity rates in PEI are the highest in the country, whereas those in Quebec are the lowest. Electricity generating capacity in PEI has traditionally depended on imported fossil fuels. Cost, energy security, and environmental concerns all provide impetus to reduce reliance on imported oil and diesel to generate electricity.
Not only does PEI boast astonishing levels of wind-power generation, but it has also managed to avoid many of the potential integration costs outlined in Section 1. The
0
1,000
2,000
3,000
4,000
5,000
Newfoundland& Labrador
NovaScotia
NewBrunswick
Prince EdwardIsland
QuebecOntarioManitobaSaskatchewanAlbertaBritishColumbia
Source: Natural Resources Canada, 2018.
Figure 2: Installed wind capacity in Canada, 2017
698
1,479
221 258
4,900
3,510
204 294
610
55
Cap
acity
(M
W)
22 • Generating Electricity in Canada from Wind and Sunlight • Desrochers and Reed
fraserinstitute.org
high level of wind-power capacity in PEI is possible because it is the Canadian jurisdic-tion that most closely resembles what may be termed the Danish model (see Text Box 2).
Prince Edward Island relies on the New Brunswick (NB) electricity system for its back-up electricity.19 It solves the variability problems of wind by relying on imported dispatch-able power instead of installing the necessary back-up “on Island”. It also exports surplus wind power to NB, some of which helps defray the cost of imports.20 The New Brunswick electricity system plays the role of a giant battery into which the much smaller PEI system is plugged. The NB system operator also manages grid reliability and balancing for PEI.
The high incidence of wind power in the PEI energy mix is the result of a protracted search for cost-effective solutions to the island’s electricity needs supported, but not directed, by the provincial government. Reliance on NB for back-up power means that embedded power generation does not “cannibalize” the PEI electricity system: distrib-uted generation directly translates into reduced electricity imports. The province has a long history of encouraging embedded generation, starting with a net metering pro-gram introduced in 1971. More recently, installation of embedded solar and wind power capacity has been encouraged. PEI was an early adopter of time-of-use billing to moder-ate fluctuations in demand.
In PEI, the wind option was one of the few solutions available to reduce the island’s dependence on burning oil and diesel. Capacity utilization rates for PEI wind farms are around 45%, indicating very good “wind resources”. The province’s small size limits the cost of connecting wind farms to the grid. The extent that any electricity generated from wind can replace electricity derived from imported fossil fuels constitutes a win-win situation, yielding both cost savings and environmental benefits.
The Wind Energy Institute of Canada, a non-profit R&D organization, was established on North Cape, PEI in 1981. It is a hub for research into wind energy, and also experi-ments with electricity storage and conversion options, including the production of hydrogen by electrolysis during periods when electricity demand is low and wind power is available. The hydrogen is used in experimental vehicle applications.
19. New Brunswick is the only province other than Ontario with nuclear-powered electricity generating capacity. The original undersea cables between PEI and NB were installed in the 1970s. In 2009, when their reliability was failing PEI entered into discussions with Hydro-Québec as a possible replacement electricity source. These negotiations came to nought and the cables were replaced and capacity expanded in 2017.
20. One of the privately owned wind farms on PEI exports its energy under contract to NB. For all intents and purposes it is a NB wind farm.
Desrochers and Reed • Generating Electricity in Canada from Wind and Sunlight • 23
fraserinstitute.org
PEI’s first wind farm was established by the PEI Energy Corporation—a Crown cor-poration established to develop the Island’s wind potential—in 2001. The Energy Corporation currently owns four of the Island’s eight wind farms and has another in development. Provincial experience operating wind farms and a cost-minimization objective meant the province was never overly generous to independent power produ-cers. Prospective wind-farm developers who met with Energy Minister Richard Brown often drew attention to the disparity between the terms offered in PEI with those available under the Feed-in-Tariff program in Ontario. The Energy Minister’s response was to encourage them to take advantage of the Ontario program (Blakewell, 2018). Nonetheless two privately owned wind farms are now running in PEI. The other two are operated by the Summerside Electricity Utility and the Wind Energy Institute of Canada.
Once wind power became available in PEI, it increased the range of potential demand management and conservation options. Water heaters synchronized to off-peak demand are one example. The possibility of converting smart meters to “time-of-wind” billing is now being investigated.
TEXT BOX 2: THE DANISH MODEL
Denmark was a pioneer in the adoption of wind power. It is a relatively small country with little hydroelectricity potential. The oil shocks of the early 1970s prompted a concerted effort to reduce dependence on imported fossil fuels. Legislation that eliminated the use of nuclear fission as a possible electricity generating option was enacted in 1985. Wind power generated in Denmark in 2017 was 43.4% of the electricity consumed, and there are plans in place to raise that to 50% by 2020. For this reason, Denmark is often cited by proponents of wind power as the example to follow.
Cursory examination of the Danish situation suggests that high levels of wind power are an option any jurisdiction can emulate. However, examination of the system-wide factors that make it possible to integrate such high levels of wind-generated electricity reveals the special circumstances that make it feasible.
Much of the wind power generated in Denmark is out of sync with demand, which means it cannot be consumed domestically. Back-up is provided by inter-ties with Norway, Sweden, and Germany. Wind power is exported by Denmark to these countries, usually at night. This allows reduced levels of hydroelectricity production in Scandinavia—essentially storing the equivalent of imported wind power for future use—and reduced use of coal-fired generating capacity in Germany. Denmark imports hydroelectricity from Norway and Sweden, nuclear power from Sweden, and electricity from coal-fired plants in Germany as required to supply its needs when wind power is unavailable or inadequate (Bach, 2019).
Danish electricity prices are the highest in the world. Nonetheless, grassroots support for wind power in Denmark is strong and many wind installations are cooperatively owned. Danes are prepared to accept the trade-off between the cost and benefit of wind power because alternatives, including nuclear power produced in Denmark, are even less appealing.
24 • Generating Electricity in Canada from Wind and Sunlight • Desrochers and Reed
fraserinstitute.org
One of the most significant aspects of the approach taken to wind power in PEI was the manner in which it was implemented. The structure of the PEI electricity system might be described as “fractured”, as it involves a private company, a provincial Crown cor-poration specializing in wind power, and a municipal electricity utility that also oper-ates a wind farm. Nonetheless, the components have managed to collaborate effectively to solve electricity-related problems in a sensible and cost-effective manner. The fit between wind power and the peculiar circumstances of the PEI electricity system was discovered through a methodical approach that explored various options, quite different from the large gambles on VRE taken by politicians in some other jurisdictions.
OntarioOntario is one of the provinces where accelerated installation of VRE technology became government policy—with disastrous consequences. Significant wind and solar capacity was installed in the province through a series of initiatives, each of which offered more attractive incentives than its predecessors. These culminated in the Green Energy and Green Economy Act (Green Energy Act or GEA) in 2009. The objectives of the GEA were to increase VRE capacity, to stimulate economic growth in the province in the wake of the 2008 financial crisis, and to kick-start the creation of a local renewable energy industry.21 Independent power producers (IPPs) were offered generous incentives to generate various types of renewable energy.22 Of these, grid-connected wind became the most important.
In terms of generating capacity added alone, the GEA was a moderate success despite falling short of the ambitious targets announced.23 At the end of 2017, Ontario accounted for almost all of Canada’s grid-connected solar electricity-generating cap-acity (380 MW) and had the largest share of grid-connected wind capacity (4,213 MW). Together, these provide 12.5% of the provincial grid’s generating capacity. Wind tur-bines were responsible for 7.3% of the electricity generated in Ontario in 2017. Solar grid-connected generation amounted to only 0.2% of the total as 85% of solar capacity is embedded in the distribution system (IESO, 2018).
21. This “Green Keynesianism” or “Green New Deal” policy was a common political strategy at the time. The Obama Administration’s response to the financial crisis of 2008, the Economic Recovery and Reinvestment Act of 2009 also provided stimulus for green-energy projects.
22. The Auditor General of Ontario (2015) calculated that 200 long-term contracts signed under the GEA Feed-in-Tariff (FIT) program would cost $4.7 billion more in total than would have been the case if the rates achieved earlier by competitive bidding had been paid instead.
23. The target for wind, solar, and bioenergy online capacity in the Ontario Long Term Energy Plan of 2013 was 10,700 MW by 2021 (Ontario, 2013: 6). Expectations for the contributions to electricity supply and the respective capacity factors of each category of renewables suggests wind capacity would need to be at least 7,500 MW. This compares with actual 2017 capacity of 4,900 MW (IESO, 2018).
Desrochers and Reed • Generating Electricity in Canada from Wind and Sunlight • 25
fraserinstitute.org
However, Ontario is also Canada’s worst example of the unintended consequences that result from a strong political commitment to VRE when its system-wide impact is exam-ined. Critics of Ontario’s electricity policies point out that this power was not needed, and that the province would have been much better off had that capacity not been installed.24 The GEA incentives for wind and solar power contributed to a sharp increase in electricity rates. Residential rates rose from 5.2¢ per kWh at the end of 2008 to 11.55¢ at the end of 2017, an increase of 122% over nine years (IESO, 2018). Electricity costs were a fac-tor in the 2018 provincial election, which resulted in the incumbents losing their official party status in the legislature.25 The new government quickly took steps to reverse its predecessor’s electricity policies.26
The pre-existing generating capacity mix was a fundamental problem when VRE was introduced. Ontario depends heavily on nuclear power and hydroelectricity (87.9% of grid-connected generation in 2017), both of which have low marginal costs and are emissions-free. Wind and solar energy frequently displaces electricity from these power sources, “stranding” these conventional generating facilities. Coal-fired plants were phased out in Ontario by 2014 and replaced with unnecessary gas-fired and VRE gener-ating capacity. This gas-fired generating capacity is now “justified” as providing the back-up and grid services for the superfluous VRE capacity.27
24. According to one calculation, eliminating wind turbines altogether and instead relying on the OPG Lennox gas plant would have yielded a saving of nearly $4.9 billion over the period from 2009 to 2017 (that is, since the GEA). This total involves using wasted electricity that was denied access to the grid ($1.8 billion in hydro, $200 million nuclear, $800 million wind) and a saving of the bill for wind used minus the cost of generating the required electricity by running the Lennox gas plant at 20% of its capacity for a sav-ing of $2.1 billion (Gallant, 2018).
25. Official party status confers access to a substantial budget for the purposes of research and payment of staff. Without this status, those elected sit in the legislature as “Independents”. This limits their ability to participate in debates and direct questions to governing party ministers.
26. This is somewhat ironic, as the last time the same party was in power, they initiated the unsuccessful attempt to reorganize the provincial electricity utility, starting a chain of events that exacerbated the prob-lems they now face. The new government quickly cancelled a controversial wind-farm project already under construction in Prince Edward County and later halted 759 renewable-energy projects including four wind farms in the pre-construction phase. The GEA was repealed, and modifications made by the previous gov-ernment to the Environmental Protection and the Land Use Planning Acts reversed.
27. The Ontario Society of Professional Engineers (OSPE) indicates that gas plants provide these servi-ces because hydroelectric capacity is insufficient to take on this role (OSPE, 2016). The list of services gas plants provide include: spinning and standby reserves for sudden forced outages, contingency reserves for extreme weather impacts on VRE, system restoration following a blackout and management of fast-power imbalances between supply and demand, especially when there is significant VRE capacity in the generation mix.
26 • Generating Electricity in Canada from Wind and Sunlight • Desrochers and Reed
fraserinstitute.org
The structure of the electricity system in Ontario made it particularly vulnerable to ad hoc government intervention. Because the system had been broken up into a number of different entities, there was no counterpart to Hydro-Québec’s CEO, an individual responsible for the efficiency of the utility as a whole. Each component pursued its own limited and sometimes conflicting objectives without any concern for the overall per-formance of the electricity system. This situation became ripe for exploitation when the government decided to dramatically increase VRE. How that structure evolved helps explain why VRE had such a devastating impact when introduced in Ontario.
Until 1999, Ontario Hydro was the Crown corporation responsible for capacity planning, operating generating stations, the grid, and much of the distribution network as Hydro-Québec still does today. It was then divided into two new organizations, Ontario Power Generation (OPG) and Hydro One, the former responsible for generating assets and the latter for transmission assets. OPG subsequently leased the operations of its Bruce nuclear-generating station to a private consortium. A fourth entity, the Independent Electricity System Operator (IESO), was set up to coordinate electricity supply with demand.28 This restructuring was counter-productive: it removed the sector’s oper-ational autonomy and created a capacity planning vacuum.
A wholesale electricity market run by the IESO began operating in May 2002. Prices rose sharply suggesting either a shortage of generating capacity or a concentration of market power (Rivard and Yatchew, 2015). Potential investors were understandably wary of participating in a regulated and politicized industry dominated by the legacy nuclear and hydroelectric generating assets of Ontario Hydro.29 These assets provide baseload and load-following electricity at low marginal cost, leaving prospective invest-ors in proposed gas-powered plants with uncertain demand for their output. Their reluctance to participate was reinforced when regulated rates for many customers were reintroduced and frozen six months after the market opened. The price freeze remained in effect until 2006, confirming a de facto policy reversal.
Following a change in government in 2004, the Electricity Restructuring Act (ERA) created a separate planning and procurement function known as the Ontario Power Authority (OPA). This Act also allowed the provincial government to issue directives to
28. The significant debts of Ontario Hydro were not transferred to the new entities but quarantined in another body. A debt retirement charge was added to electricity bills in order to whittle down that debt.
29. Enthusiasm for nuclear capacity in the 1960s was bolstered by Ontario Hydro’s projections of demand of 90,000 MW by 2000, when it actually remained under 25,000 MW (Morton, 2004).
Desrochers and Reed • Generating Electricity in Canada from Wind and Sunlight • 27
fraserinstitute.org
the OPA regarding generation and transmission planning, the electricity-supply mix, and targets for conservation and renewable energy. This provision was necessary to enable the new government to keep its election promise to close the province’s coal-fired generating stations.30 The OPA’s role as the instrument of government capacity planning initiatives expanded over time.
The OPA was immediately directed to encourage investment in gas-fired generating capacity through contracts with IPPs. Subsequent directives created a situation where all generating facilities were back-stopped by contracts with the OPA or, in the case of OPG-owned capacity, were granted regulated rates. Then, in 2006, the government directed the OPA to prepare a plan to ramp up “renewables” capacity in the province. These targets were subsequently raised.31
This background is important for three reasons. First, it demonstrates where targets for non-hydro renewables originated, namely with the government. Second, it explains why they were established without input from electricity professionals or any semblance of a cost/benefit analysis, a situation inconceivable in Quebec, PEI, or Alberta. The Ontario Society of Professional Engineers (OSPE) became a trenchant critic of the government’s wind power initiatives (OSPE, 2014a, 2014b). Third, it shows why the so-called “hybrid” market is really not a market at all.
The existence of a “wholesale” electricity market in Ontario creates the illusion that there is price competition. Suppliers of generating capacity, however, do not depend on the Hourly Ontario Electricity Price (HOEP) determined by the wholesale market for their revenue. Contracts between owners of legacy generating facilities and the OPA are essentially a financial back-stop mechanism. Contracts with IPPs for all the electri-city produced using wind and sunshine, and most of the electricity derived from gas-powered plants include incentives necessary to overcome their reluctance to invest in capacity. The cost of these contracts is included in electricity bills as part of a “Global
30. Ontario’s experience closing coal-fired generating stations closely parallels efforts outlined here to rapidly increase VRE: a great deal promised, but the net impact was counter productive (see, for example, McKitrick and Aliakbari, 2017a). As the OSPE pointed out, the closure of coal plants undermined the environmental justification for wind power (OSPE, 2016: 50).
31. In 2010 and 2013, the government’s long-term energy plans were issued without the OPA’s involve-ment. According to Rivard and Yatchew (2015), the Ontario Energy Board, the sector’s oversight body, had not reviewed either of these plans at the time their report was written. The government’s commitment to the Green Energy and Green Economy Act was so strong it rendered whatever they might contribute moot. In 2015, the OPA became a part of the IESO. Here the term OPA is used to refer to the contracting part of the agency, and IESO for its market and grid management functions.
28 • Generating Electricity in Canada from Wind and Sunlight • Desrochers and Reed
fraserinstitute.org
Adjustment” charge. Markets are supposed to create incentives for efficiency. The com-bination of government directives and the contracts between the OPA and owners of generating capacity in the province has the opposite effect: a non-market “cost-plus” pricing mechanism that encourages spiraling inefficiency.
Capacity planning driven by government directives creates opportunities. The extent to which an IPP is operating in a seller’s market is a function of the government’s commit-ment to achieving its objectives. The succession of programs that encouraged renewable energy projects leading up to the GEA were typical of efforts being made elsewhere at the time. In Ontario, these efforts were considered “unsuccessful” because capacity fell short of the objective the politicians had in mind: the GEA was an attempt to do bet-ter. “Better for whom?” is the obvious question in light of the subsequent impact of this legislation on electricity consumers and taxpayers.32
Significantly increasing VRE capacity in the province involved both direct and indirect costs. OPA contracts pay a premium price to wind and solar generators for a commodity that is then resold for much lower prices to consumers. These contracts were set up on a “take-or-pay” basis, meaning that payment is made for all electricity that capacity gen-erates, irrespective of whether or not it enters the grid. Indirect costs are also consider-able. Further gas capacity was commissioned to back up VRE and provide the necessary array of grid services. All these gas-powered plants now operate at very low-capacity utilization rates, although their owners are compensated via OPA contracts for idling, or having the capacity to generate electricity available should the need arise. Conventional generating assets are “stranded” whenever VRE electricity is available. The IESO has been forced to deal with surplus baseload generation when there is not enough demand to match all the carbon-free sources of supply. In such cases, the availability of wind leads either to a situation where generating capacity may be wasted,33 or to one where excess electricity is accepted by the grid and then exported at a loss.
32. Although the consequences, not the causes, of increased wind- and solar-power capacity are the main concern here, it is worth noting that a coalition of environmental activists and renewable energy inter-ests formed the Green Energy Act Alliance in the summer of 2008 to help policy makers understand the incentives a “successful” program would require (Lau, 2015). This organization was a classic example of a coalition of “Baptists” (who want to do the “right thing”) and “bootleggers” (who want to profit from the policies urged by the “Baptists”). The terminology refers to the interests that lobbied for prohibition in the United States. The “Baptists” in this case are the environmentalists, and the “bootleggers” wind industry representatives. The same industry representatives were actively involved in the similar “consultations” conducted by the recently defeated Alberta government (Healing, 2015).
33. The electricity wasted is not actually generated. Nuclear power is thus said to be “steamed-off”, hydro-electric power “spilled”, and wind power “curtailed”.
Desrochers and Reed • Generating Electricity in Canada from Wind and Sunlight • 29
fraserinstitute.org
The contractual arrangements between the OPA and the owners of generating facili-ties insulate them from the problem of stranded assets. These costs are “bundled” into the Global Adjustment charge on electricity bills along with the cost of VRE and losses incurred exporting surplus electricity, and are a significant contributor to soaring prices. Contracts that protect conventional generating facilities from the negative conse-quences of VRE create inefficiency. Electricity prices go up, depressing demand, which further exacerbates the stranded-assets problem, creating a vicious cycle.
The rapid increase in electricity costs fell disproportionately on residential and small business customers. These higher rates increase energy poverty and the number of “inability-to-pay” disconnections from the distribution system for lower-income families, and reduce the living standards of other residential customers (Sepulveda, 2018). Attempts were made to shield larger firms from the full impact of the govern-ment’s electricity policy, but were not very effective. The price tag for increasing VRE in Ontario put a general damper on economic activity that manifests itself in job losses, a decline in the province’s manufacturing base, and lower consumer spending as consum-ers allocated more of their income to their electricity bill and less to other purchases (McKitrick and Aliakbari 2017b, 2017c).
The government was also criticized for the measures it took to accelerate the approval process for wind projects. Municipal governments (and the residents they represent) were denied the right to object to proposals for wind farms. Wind-farm projects were offered low property-tax assessments,34 imposing, in effect, a subsidy on local rate pay-ers. To facilitate approval, short cuts were permitted in the environmental assessment process, stoking the ire of those concerned about the impact of wind turbines on bird and bat populations, the noise they emit and the related health problems, disruption of groundwater flow, and their unsightly appearance. Opposition was coordinated through a number of grassroots anti-wind organizations.35
34. Property assessments on which local taxes are based rise whenever improvements are made and over time due to inflation. The Current Value Assessment on which local taxes are based for all properties in Ontario is determined by the Municipal Property Assessment Corporation (MPAC), a not-for-profit cor-poration. The provincial government issued a directive to “ensur[e] that property tax does not act as a dis-incentive to energy generation …” (Ontario, 2011; Gallant, 2012). The local tax base is adversely affected in three ways: assessments do not rise for property owners who add embedded VRE, assessments for grid-connected wind turbines are capped and do not rise with inflation, and the “market value” assessment of residential properties within sight or sound of wind turbines will be adversely affected.
35. For example, Wind Concerns Ontario, an advocacy organization providing information “on the poten-tial impact of industrial-scale wind-power generation on the economy, human health, and the natural environment” (http://www.windconcernsontario.ca/).
30 • Generating Electricity in Canada from Wind and Sunlight • Desrochers and Reed
fraserinstitute.org
The visceral reaction to the imposition of wind turbines on rural Ontario highlighted the splits that emerge within the environmental movement around controversial topics such as VRE. In Ontario, the debate over wind turbines divided those who think the environmental problem is the global impact of green house gas (GHG) emissions from those who are more interested in the short-term, local consequences of wind turbines. There is no straightforward way of assessing the relative importance of very different categories of environmental concerns.
When Ontario replaced coal with gas, there was a corresponding reduction in GHG emissions. Since 2014, when the last coal plant closed, GHG emissions from the elec-tricity sector have levelled off. It could be argued that the introduction of significant non-hydro renewables was in fact carbon-neutral because, when available, wind power usually displaced hydroelectricity or nuclear power, which are both emissions-free. But by using gas plants as back-up, Ontario’s VRE program created emissions that would otherwise have been avoided (OSPE, 2014b, 2016).36 Since most electricity exports occur when VRE creates a surplus that is often sold at a fraction of the cost of produc-tion in the United States, it could also be argued that the United States is getting an emissions benefit at the expense of Ontario electricity consumers.
The Auditor General’s 2015 report calculated the decline in GHG emissions in terms of the cost of “non-hydro renewables” and came up with a figure of $257/tonne (Auditor General of Ontario, 2015). However, this implies a relationship that does not exist. If the decline in GHG emissions was the result of closing coal plants, then these reductions were not “purchased” with expenditures on non-hydro renewables. Had there been no push to increase wind and solar power, these costs could have been avoided and the reduction in GHG emissions would still have occurred. The more important point is that GHG emis-sions from electricity-generating facilities now make up an extremely small contribution to the Ontario total, something in the order of 3% (OSPE, 2016: 6). The transportation, building, and industrial sectors account for 80% of the total. There are, therefore, huge opportunities to reduce emissions intensities in other sectors. The objective should be to get the biggest improvement at the lowest cost (OSPE, 2016; Monbiot, 2010).
Unfortunately, the rising cost of electricity is exerting pressure in the opposite direc-tion. Electric baseboard heating is now such a liability in Ontario that it affects resale property values. This has prompted widespread conversion from electric to natural
36. Gas plants consume gas even when they are idling, although they are not producing electricity. The idling rates for most of Ontario’s gas plants are high by industry standards, hence the high compensation required to cover their costs.
Desrochers and Reed • Generating Electricity in Canada from Wind and Sunlight • 31
fraserinstitute.org
gas or propane heating, and these fuels are the dominant option in new construction. Increased “distributed” gas-fired energy consumption to heat residences and business premises and the associated GHG emissions are an obvious consequence of the upward pressure on electricity prices caused by the direct and indirect costs of VRE.
The active and ad hoc political direction of capacity procurement in the Ontario elec-tricity sector resulted in an imbalance between supply and demand. The institutional arrangements in place that protect conventional generation capacity from the stranded-assets problem add considerably to the cost of electricity. Unreliable VRE, which com-plicates management of the system as a whole, is unnecessary. Its existence necessitates back-up gas-plant capacity nonetheless. Avoiding wind power would not only use con-ventional generating capacity that has been left stranded, it would have also saved the cost of gas-plant over-capacity and subsidized exports.37
The addition of variable renewables to Ontario’s electricity sharply increased costs. Ontario’s experience with wind and solar power illustrates how a single government purchaser dealing with independent electricity suppliers transfers risk from the owners of those assets to consumers and/or taxpayers.38 The decision to implement a “bold initiative” to increase VRE without any cost/benefit analysis proved unsustainable, both economically and politically. In the process, support for any future initiatives to miti-gate climate change has been dealt a serious blow in the province.
British ColumbiaThere are both similarities and differences between the efforts to increase wind and solar power capacity in British Columbia (BC) and Ontario. The BC government directed the provincial electricity utility to urgently increase capacity to generate electricity by adding small-scale renewable projects. This initiative proved expensive and politically unpopu-lar. But, unlike Ontario, the unpopularity of the initiative in BC had more to do with its short-run environmental consequences than the financial burden imposed on ratepayers, and wind and solar were a relatively small component of the initiative. The final difference was the structure of the electricity sector into which the new capacity would be integrated.
37. Exports of electricity by Ontario in 2017 added $1.5 billion to system-wide costs. This is about 10% of the cost of electricity production in the province. Most of these exports occurred when wind was entering the grid. As a rule of thumb, a billion dollar increase in system-wide costs adds nearly $200 per annum to an average residential electricity bill.
38. The Fair Hydro Plan effective July 1, 2017 allocated about 20% of the costs of wind and solar power to current and future taxpayers, adding interest charges on borrowings of $21 billion to the total system-wide cost of the green-energy initiative (Green, Aliakbari, and Steadman, 2017).
32 • Generating Electricity in Canada from Wind and Sunlight • Desrochers and Reed
fraserinstitute.org
As in Ontario, independent power producers (IPPs) were the mechanism whereby the policy to increase renewable energy capacity in BC was implemented. The original deci-sion to depend on IPPs to add generating capacity in BC was part of a 2002 plan to break up BC Hydro. The utility was reconstituted after this expensive and disruptive policy was reversed. BC Hydro once again became an integrated publicly owned utility that dominates the electricity sector in the province.39 But the commitment to rely on investment from IPPs for additional electricity-generating capacity survived the restruc-turing attempt (Griffin Cohen, 2003). This policy was in place before political interven-tion in the economy was justified by concerns about climate change. These concerns would later emerge as a major influence on public policy in BC, and were behind the attempt to implement a fiscally neutral provincial carbon tax in 2008 (Green, 2017).40
The vast majority of electricity generated in BC comes from hydroelectric projects so, as in Quebec, adding renewable capacity was not driven by any perceived need to replace less environmentally benign generating facilities. The environment looms large in BC politics and it is therefore not surprising that capacity expansion was routinely (and ironically, as it turned out) referred to as a “green” initiative. The government’s decision to depend on IPPs to expand and diversify the electricity-generating portfolio may have been a consequence of a combination of factors: declining confidence in BC Hydro’s com-petence, a way of obtaining increased capacity up front but paying for it over the life of long-term contracts, and as a stimulus for economic activity that would otherwise not take place. Concerns that the province would face electricity shortages were also being voiced, but appear ill-founded (Sopinka and van Kooten, 2011). Declining activity in the forest-products sector, traditionally a major consumer of electricity in the province, may have been considered a temporary phenomenon rather than a long-term trend. Whatever the reason, the decision was taken and implemented at a time when the future of the controversial Site C hydroelectricity mega-project proposal on the Peace River in north-eastern BC was uncertain. The decision to proceed with this project would only be made after the government behind the IPP-led projects was no longer in office.
As in Ontario, IPPs in BC were offered long-term take-or-pay energy purchase agree-ments (EPAs) under a standard offer program. However, most of the new capacity
39. A subsidiary of the private company Fortis provides electricity service in the Kootenay region of the province. It is involved in all three components of the business in this region: generation, transmission, and distribution.
40. The objective of a carbon tax is to modify behaviour by altering the framework within which decisions are made throughout the economy. This mechanism encourages change where the greatest benefit is pos-sible. Once in place, further intervention reduces its effectiveness. However, after implementing the car-bon tax, the same BC government actively intervened in the electricity sector.
Desrochers and Reed • Generating Electricity in Canada from Wind and Sunlight • 33
fraserinstitute.org
added to the electricity system under the BC program involved “run-of-river” hydroelec-tric projects (BC Hydro, 2018).41 In BC, it was these “run-of-river” hydro projects that sparked the most vociferous opposition from environmentalists, and not wind farms as was the case in Ontario.
In both BC and Ontario, the provincial government took over the capacity planning responsibility that had formerly resided with the provincial utility. BC Hydro was issued directives; environmental assessments and municipal approvals were “streamlined” to speed up implementation of government policy; and the BC Utilities Commission, the counterpart of the Ontario Energy Board, was denied oversight of any aspect of the initiative. Projects were provided with access to Crown land on extremely favourable terms (in the case of wind farms) and water rights at concessionary rates (for run-of-river hydro projects) (Calvert, 2007).
The Opposition called for a moratorium on IPP projects and an end to the carbon-tax in the run-up to the 2009 provincial election. For many, the well-publicized negative environmental consequences of these hydro-electric projects reinforced a prejudice that the damage was a direct consequence of private-sector involvement. Others, particu-larly unions representing BC Hydro’s employees, objected to involvement of profit-seek-ing private firms in the energy sector. Environmental activists were sharply divided on the government’s policy in the electricity sector (Hoberg and Rowlands, 2012). Those favouring reduction of greenhouse-gas emissions to save the planet at any cost (the
“smokestack pluggers”) were willing to support the carbon tax and IPP projects despite their short-term consequences. Others (the “tree-huggers”) were not prepared to toler-ate local environmental damage now in order to save the planet at some unspecified future date. A third faction preferred the concentrated impact of mega-projects to the more widely distributed environmental consequences of smaller but more numerous projects. Here again BC Hydro unions would exert considerable influence. The contro-versy among BC environmentalists highlights once again the difficulty of comparing dif-ferent environmental consequences without a common assessment standard.
Climate-change activists rallied support for the government, which was re-elected by a narrow margin. Subsequent legislation, the Clean Energy Act of 2010, repeated the mantra of the Ontario Green Energy and Environment Act, claiming investments in IPP projects would form the foundation on which an innovative green economy would
41. “Run-of-river” hydroelectric projects rely on river flow rather than water stored behind dams to generate electricity. The electricity generated is therefore variable at a seasonal time scale as a result of fluctuating run-off.
34 • Generating Electricity in Canada from Wind and Sunlight • Desrochers and Reed
fraserinstitute.org
be built. It also emphasized the potential for clean-energy exports to the United States from the planned IPP projects. Ironically, at that time BC environmental activists were lobbying the authorities in California—a major destination for BC electricity exports—to rescind the “clean energy” certification of BC electricity from run-of-river projects.
One significant difference between BC and Ontario is how the financial consequences of the IPP initiatives were distributed. In BC, electricity ratepayers were insulated from the financial repercussions of IPP projects, at least in the short run. The government either imposed a cap on hydro rates or disallowed applications for rate increases requested by BC Hydro (Hoberg and Rowlands, 2012; Calvert and Griffin Cohen, 2013). In 2011, the new leader of the governing party was keen to limit electricity rate increases at a time when the costs of IPP projects were starting to affect BC Hydro’s bottom line. The utility applied unsuccessfully for a 30% rate increase.
Throughout this period, the government insisted that BC Hydro continue its dividend payments to the province. The utility had to deal with the additional demands imposed by the provincial government, which included activation and connection of IPP projects, and make payments for the electricity generated under their contracts. The transmis-sion requirements for these projects was a huge cost burden in BC, given the difficult terrain in the province. The debt of the Crown corporation ballooned to accommodate its obligations while revenues were constrained. The BC Auditor General found that BC Hydro was struggling to invest in the necessary transmission grid infrastructure and that costs of these upgrades were being hidden in deferral accounts, a practice that persists (BC Auditor General, 2011, 2019; Shaw, 2018). The report implied the requested 30% rate increase was inadequate, and that additional increases would be required to cover the cost of electricity from IPP projects. Although ratepayers remained largely oblivious, the finances of BC Hydro deteriorated to the point where it became a “ticking time bomb” (Corcoran, 2017; Caldicott, 2016).
After 2011, enthusiasm for IPP projects in general and wind projects in particular quickly waned under the new Premier. The labour-environment coalition kept the inflated cost of IPP run-of-river hydro projects in the spotlight. Uncertainty over the future of the Site C hydro-electric project began to diminish. Several IPPs changed their minds about completing wind projects under development (Smyth, 2016).42
42. Several of the on-going wind projects are in the BC interior, where at some future date the pumped stor-age option using surplus wind in combination with the Site C hydro dam may be feasible. The current BC government reluctantly agreed to complete the Site C hydroelectric project shortly after its election victory.
Desrochers and Reed • Generating Electricity in Canada from Wind and Sunlight • 35
fraserinstitute.org
The contribution of IPP projects to BC Hydro’s financial woes stopped growing but was substantial nonetheless. Some of the energy agreements between BC Hydro and IPPs extend for as long as 56 years as a result of some medium-sized hydroelectric and large biomass installations. The government responsible for these projects was defeated in 2017, and the new government is now grappling with the aftermath. Substantial increases in electricity rates are now seen as the only solution to the financial problems of BC Hydro. Fortunately, wind and solar power made only a modest contribution to these problems.
AlbertaQuebec’s electricity system is dominated by a successful Crown corporation. Alberta’s electricity system lies at the opposite extreme of the organisational spectrum. Alberta has been an example of an electricity system built around a competitive wholesale mar-ket known as the Alberta Power Pool. The Power Pool involves about 200 participants and is managed by the Alberta Electric System Operator (AESO). The guiding principle underlying the Alberta electricity market is “FEOC”—fair, efficient, and openly com-petitive. Ranked bids submitted for each one-minute dispatch interval determine the Energy Market Merit Order (EMMO) and the market-clearing offer determines the System Marginal Price (SMP) from which the pool price for each hour is calculated.
The grid is also privately owned by four major Transmission Facilities Owners (TFOs) and was optimized to provide grid access to owners of traditional generating technolo-gies. The AESO determines the need for transmission grid extensions and upgrades, and then either assigns the work to a TFO or solicits competitive bids to complete larger projects. The AESO has a “zero congestion” grid policy to encourage competitive pricing of made-in-Alberta electricity.43
The Alberta market and transmission system were designed around dispatchable power sources, primarily coal- and gas-fired facilities. Coal and gas provided 89% of net-to-grid electricity in 2017 and 2018. The system is “technology neutral”: the pricing mechanism eliminates bias towards any particular generating technology. The AESO considers this neutrality essential for its “fair, efficient and openly competitive” mandate.
The “openly competitive” requirement also means that the Alberta system encour-ages new suppliers prepared to abide by the rules. Alberta has a long history with wind
43. All imports are priced at $0/MWh, exerting downward pressure on the pool price. As a result, imported electricity displaces power generated in Alberta from the merit order.
36 • Generating Electricity in Canada from Wind and Sunlight • Desrochers and Reed
fraserinstitute.org
energy, and capacity utilization rates for wind turbines in the province were 35% in 2017 and 32% in 2018. The first wind farm in the country began operating in Alberta in 1993. Wind-energy suppliers were initially unable to meet the established dispatch-ability requirements and hence were unable to bid in the wholesale market. The AESO set out to change the rules in order to allow wind-energy suppliers to participate in the electricity market (AESO, 2012). In 2012, the AESO embarked on a six-month wind-dispatch pilot project with one wind supplier, simply by adding “lack of wind” to the list of “accepted operating reasons” for inability to supply dispatched power. All exist-ing wind generating facilities were participating in the wholesale market before the six-month trial was over.
Some additional wind capacity was added in Alberta once wind suppliers became active participants in the wholesale market, but nameplate capacity then levelled off at just over 1,400 MW between 2014 and 2018. Under these circumstances, wind suppliers were paid the system marginal price for electricity available to the grid. According to the AESO’s market reports (AESO 2018, 2019), wind supplied 7% of Alberta’s net-to-grid44 generation in 2017 and 2018. Wind-power suppliers’ achieved price per MWh averaged about $20 in 2017.
A second revenue stream is available to wind-power producers in the form of renew-able energy certificates. These certificates are a feature of Alberta’s emissions-reduction mechanism introduced in 2007. Large polluters were required to make a “contribution” to the provincial Emissions Reduction Fund of $15 per tonne of over-target emissions between 2007 and 2015. The effective cost for a typical coal-fired electricity generating station under these rules was just below $2 per MWh (Leach and Tombe, 2016).45
Large emitters can meet their emissions targets in a number of ways. They can reduce their emissions, or limit their “contributions” by purchasing or generating offsets. Offsets in the form of tradeable renewable energy certificates (TRECS) are generated by businesses that emit less than the average CO2-equivalent for their industry. These may
44. Two levels of electricity demand in Alberta are reported: Alberta Internal Load (AIL) refers to all the electricity consumed in the province. Net-to-grid refers to the electricity that moves to consumers through the transmission grid. The difference is the “behind-the-fence” consumption of electricity generated by gas-powered co-generation plants that are part of some large-scale industrial operations.
45. The new government in Alberta in 2015 moved quickly to make emissions restrictions more strin-gent, and was surprised when owners of rights to sell electricity generated by coal-fired plants surrendered them to the Alberta Power Pool, passing the cost to electricity ratepayers (Leach and Tombe, 2016).
Desrochers and Reed • Generating Electricity in Canada from Wind and Sunlight • 37
fraserinstitute.org
be sold to large emitters and, as the fines levied on targeted emitters are slated to rise, so the value of the TRECS will also grow over time.46 Wind farms are sources of TRECS.
In the spring of 2016, the province’s first wind farm was decommissioned. At the time, an employee of the facility’s owner encapsulated the dilemma facing the wind industry in the province when he was quoted as saying: “Transalta is very interested in repower-ing this site. Unfortunately, right now, it’s not economically feasible. We are anxiously waiting to see what incentives might come from our new government. Alberta is an open market and the wholesale price when it’s windy is quite low, so there’s just not the return on investment in today’s situation. So, if there is an incentive, we’d jump all over that” (Healing, 2016).
The government elected in 2015 did not disappoint. A Climate Leadership Report com-missioned by the incoming government was issued in November the same year. The steps the government intended to take to implement the Plan were released in June 2018 (Alberta, 2018) and included plans to close the province’s mine-head coal-fired plants by 2030 and split electricity generation between renewables (30%) and natural gas (70%) by 2032. The AESO was given the task of adding 5,000 MW of wind power under the Renewable Electricity Program component of the climate plan. The govern-ment also sought to increase solar power capacity to 700 MW by 2032.47 The wisdom of the targets for closing the coal plants and the shift to a mix of 30% renewables and 70% gas-powered electricity generation was questioned in light of Ontario experience as soon as it was announced (Livingston, 2018).
The AESO conducted three competitive tenders for renewable energy capacity under the program (Alberta, 2019). A constrained “fuel neutrality” was imposed despite the objections of the AESO. Selection of bids to provide capacity would be competitive but restricted to variable renewables. Successful bidders were award “contracts for differ-ences”. Under such contracts, suppliers are guaranteed the bid price for the electricity generated by wind turbines. When the market price for wind energy produced is lower than the accepted bid price, the government compensates the wind-energy supplier for
46. Alberta is also a member of the Western Renewable Energy Generation Information System (WREGIS) tracking system for renewable energy certificates. Under this agreement, Tradeable Renewable Energy Certificates (TRECs) earned by generating wind energy in Alberta can be sold in other participating jurisdictions.
47. These targets for wind (5,000 MW) and solar (700 MW) are higher than Ontario’s current variable renewable grid-connected capacity, which is 4,213 MW of wind and 380 MW of solar.
38 • Generating Electricity in Canada from Wind and Sunlight • Desrochers and Reed
fraserinstitute.org
the price differential. Should the market price rise above the bid price accepted, the sup-plier of wind energy is obliged to pay the government the difference between the market price and the price specified in the supply contract. The first tender, in 2017, accepted bids for 600 MW of wind capacity (from two foreign firms and one Edmonton-based company) at a weighted average price of $37/MWh. The second round, which required 25% indigenous ownership participation, accepted five bids totalling 363.5 MW at a weighted average price of $38.69/MWh. Three bids were accepted in the third round for 400 MW at a weighted average price of $40.41/MWh (Alberta, 2019). These bids all resulted in wind-power prices significantly higher than the $20/MW obtained for wind sold on the wholesale market in 2017, although all were also substantially lower than bids accepted in Ontario in 2016, which averaged $85 per MWh.
In each case, bids were restricted to electricity generated using renewable fuel resources as defined in the Renewable Electricity Act. Although the long hours of sunshine, little snow, and wind usually sufficient to clear snow from photovoltaic panels are advantages favouring solar-powered electricity generation on the prairies, its cost remained pro-hibitive relative to wind in competitive bids. The only solar project operating in Alberta at the time was a 15 MW installation outside Brooks, which was 50% funded by an Emissions Reduction Alberta grant of $15 million (Bakx, 2017).48 The provincial govern-ment then indicated it would provide the “necessary” incentives for solar power. Early in 2019, the government announced plans to purchase solar power at just over $48 per MW under a 20-year agreement with a partnership between Canadian Solar Solutions Inc., a private company, and a Métis organization to purchase power from three solar farms with a combined nameplate capacity of 100 MW to be built south-east of Calgary. This electricity would supply public-sector facilities (Stephenson, 2019).
Alberta’s market-driven electricity system had gone to considerable lengths to integrate modest amounts of wind power. But after the 2015 election the provincial government put its thumbs firmly on the scales by subsidizing installation of renewables capacity, and by imposing additional penalties on existing coal-fired generating stations and mandating their closure by 2030.49
48. This project covers 30 hectares and consists of 50,000 panels. Its output is advertised as sufficient to power 3,000 homes. Arbitrary use of funding from the Climate Change Emissions and Management Fund for such projects is a mechanism whereby politicians encourage specified technologies instead of leaving markets determine which are efficient.
49. Coal plants provided 47% of the electricity generated in Alberta in 2017 and set the electricity price 79% of the time, suggesting considerable disruption of electricity markets should they cease operating. (AESO, 2018).
Desrochers and Reed • Generating Electricity in Canada from Wind and Sunlight • 39
fraserinstitute.org
The impact of these policies on residential rate payers would have become apparent beginning only in 2021 because the government included a rate cap in its renewable energy legislation.50 Were market prices to rise above 6.8¢/kWh before 2021, the gov-ernment was prepared to compensate owners of generating capacity for the price dif-ferential. Worrisome estimates circulated of the shock ratepayers would receive once the cap was lifted (Libin, 2018). The government also committed itself to dip into its rev-enue to compensate coal companies for stranded assets and for the payments required under the long-term contracts for new wind projects. However, the most significant upward pressure on the price of electricity was expected after 2030 when the transition away from coal was expected to be complete. With coal no longer setting the price for electricity the majority of the time, as has traditionally been the case, this role would be taken over by bids submitted by more expensive gas-powered generating facilities
2018 provided a warning of what the future might hold if the government followed through on its plans for the provincial electricity system. A combination of low natural-gas prices, a rise in the carbon tax, and the closure of two coal-fired generators increased the competitiveness of electricity generated from natural gas. The average pool price that year was just over $50 per MW, a 127% increase over the previous year. The average price real-ized by wind suppliers also increased—from $20 in 2017 to almost $39 per MW in 2018—but the discount wind power received relative to the average pool price increased too, rising from 12% in 2017 to 23% in 2018. The close proximity of the average price for wind power earned in the electricity market to the prices to be paid for wind power from capacity to be installed by the successful bidders in the three tenders for renewable energy led the wind lobby to trumpet the competitiveness of wind power. The fact that these contracts insulate suppliers from downside risk, the variability of wind power, and the inevitable system-wide costs of dramatically increasing wind-power capacity in the province were not mentioned, nor the fact that the increase in wholesale market prices stemmed primarily from govern-ment policies that reduced the competitiveness of electricity supplied by coal-fired plants.
As there was no increase in year-over-year wind capacity (but a slight decline in wind capacity utilization) the higher average price paid for electricity entering the grid in 2018 reflected the substitution of electricity from somewhat more expensive combined-cycle gas plants for electricity generated from coal. Plans to dramatically increase wind
50. Alberta consumers have a number of options in how they pay for their electricity. The rate cap applies to the Regulated Rate Option, the default contract for most Alberta residential consumers. “Regulated” is misleading as the cost of electricity in this rate is based on the wholesale market price and the transmis-sion and distribution portions of the bill are based on “cost of service”.
40 • Generating Electricity in Canada from Wind and Sunlight • Desrochers and Reed
fraserinstitute.org
capacity in the province would require much more expensive simple-cycle gas plants as back-up. The government’s stated goal of 70% gas and 30% renewables is misleading because the dramatic increase in wind capacity implied would require in excess of 90% of demand be matched with gas-fired generating capacity because Alberta has very limited hydroelectric generating potential.51
The uncertainty that large amounts of subsidized wind power bring to an electricity system would exacerbate both the missing-money problem and increase the need for back-up capacity. Replacing coal capacity alone would require significant investment in combined-cycle gas-plant capacity to supply base-load electricity. Adding variable renewables would require back-up from simple-cycle gas plants. To ensure that the necessary generating capacity is in place, the AESO began the process of creating a cap-acity market slated to begin operating in 2021. The political decision to increase reli-ance on wind created the need for a capacity market and its associated costs. Wind and solar pose the same problems for the design of capacity markets as they did for inclu-sion in the Energy Market Merit Order (EMMO). Owners of these assets cannot predict whether they will be generating power at some specified time in the future. Bending the rules to include bids from wind suppliers in the EMMO was relatively easy because wind turbines generating electricity in Alberta are likely to continue to do so in the very short run. Time frames in the capacity market are much longer.
The capacity-market design included wind farms already participating in the energy-only market, but excluded capacity to be installed under the provisions of the Renewable Energy Act. The rationale was that the long-term agreements under which the provincial government subsidizes these projects constitute a commitment to have the specified capacity installed, and compensation is fully covered under the rates agreed for power actually generated. This appears to have been a stop-gap measure. Future participation of variable renewables in a capacity market would hinge on experience with the limited participation of unsubsidized wind capacity if the capacity market begins operating.
Necessary adjustments to the mix of reserves and ancillary services required by the reconfiguration of capacity to “70% gas-powered and 30% renewables” might
51. If the conventional capacity required to satisfy estimated demand is considered 100%, the govern-ment’s targets would need to be restated as something like 90% gas and 30% renewables. Although per-haps a more accurate representation of the situation, such a statement would merely lead many to ques-tion the math skills of those responsible. The AESO capacity forecast for 2032, which was built around the former government’s policy, shows the anticipated decline in the electricity system’s capacity utilization (see Livingston, 2018: 6).
Desrochers and Reed • Generating Electricity in Canada from Wind and Sunlight • 41
fraserinstitute.org
conceivably be handled by the capacity market. But the grid itself would need to be sub-stantially rebuilt to handle nearly 13,000 MW of new generating capacity, over 20% of which would be provided by new, widely distributed wind farms. One of the headlines in an article commenting on Livingston’s concerns over the provincial government’s plans for the electricity sector is “[t]hink of it as rebuilding 75% of Alberta’s current grid in less than 15 years” (Libin, 2018) This statement is misleading because the author is referring to the additional generating capacity required to meet the government’s objectives, not the required increase in the transmission grid. As emphasized earlier, the investment in the transmission grid required to accommodate provincial government plans—which includes a substantial proportion of VRE—would be much, much higher than implied by the 75% increase in generating capacity. The premature closure of the coal-fired plants (one of which only began production in 2011) and the abandonment of the grid assets that supported these plants would also add to system-wide costs.
In the Alberta system, ratepayer’s bills have traditionally reflected the cost of electri-city determined in a competitive market, with transmission and distribution added on a “cost-of-service” basis. The abrupt switch in the policies of the provincial government meant the electricity system would be funded both by ratepayers and taxpayers. The subsidies available to the successful bidders in the recent competitive auctions for VRE-generated electricity would begin that transition once those projects are commissioned. Compensation to the owners and employees of coal plants slated for premature closure and the decision to use premium-priced solar energy in government facilities would add to the burden on taxpayers.
However, in April 2019 Albertans voted the government that had proposed sweeping changes to the electricity sector out of office. The election platform of the new govern-ment called for a halt to many initiatives that affected the electricity sector, including subsidies for renewable energy and the planned capacity market. The contracts recently signed with wind- and solar-power producers will be a contentious issue if the new gov-ernment attempts to return to the status quo ante, namely an electricity sector organ-ized around a single, technology-neutral, energy-only wholesale market.
Nova ScotiaNova Scotia (NS) is the final province considered in this review of how different policies have affected the integration of wind and solar power across Canada. Nova Scotia gen-erates the highest percentage of its electricity from wind after PEI. Between 2005 and 2016, wind-power penetration grew faster in Nova Scotia than in Ontario, increasing from 1% to 10.6% of electricity generated.
42 • Generating Electricity in Canada from Wind and Sunlight • Desrochers and Reed
fraserinstitute.org
The provincial electricity utility, Nova Scotia Power (NSP), was privatized in 1998 and is now a subsidiary of Emera Inc., an investor-owned private company. NSP accounts for a large share of the province’s GHG emissions as a result of its heavy reliance on coal-fired thermal generating stations. Alternative sources of electricity generation have been aggressively encouraged to reduce GHG emissions and dependence on imported coal.
NSP is required to accept electricity generated by independent power producers, includ-ing wind-farm operators. It has actively campaigned to raise awareness of the true cost of wind power at the system-wide level, for the same reason as Hydro-Québec. NSP recently completed the Maritime Link undersea cable between Nova Scotia and Newfoundland as part of its strategy to obtain access to hydroelectricity from the Muskrat Falls project in Labrador.52 If this project begins operating in time, it will enable NS achieve to its 40% renewable energy target set for 2020.
To encourage a broad spectrum of alternative energy initiatives Nova Scotia introduced an Enhanced Net Metering and Commercial Renewables initiative. A Community Feed-in-Tariff (COMFIT) program for renewable energy generation from a variety of fuels other than solar was in effect between 2011 and 2015. This program provided prefer-ential rates and connection rules for projects that were majority-owned by local com-munities, First Nations, co-operatives, not-for-profits, and Community Economic Development Funds. Solar was excluded because of its high cost. This program exceeded its target of 100 MW of renewable capacity by 25% before it was cancelled. COMFIT pro-jects account for 15% of the provincial utility’s costs but provide only 5% of its electricity, putting upward pressure on prices.
There are currently just over 300 wind turbines operating in Nova Scotia, installed by an array of companies representing five nations. The provincial Energy Minister announced in 2017 that wind power for in-province consumption had reached its upper limit, and that further wind-farm projects would depend on access to US mar-kets. Nova Scotia Power made an unsuccessful bid in the recent competition for a major electricity-supply contract with Massachusetts in the autumn of 2018, the competition won by Hydro-Québec.
52. When this cable began operating, it was used to export electricity from Nova Scotia coal-fired plants to Newfoundland where it displaced power produced in generating stations burning heavy oil. Newfoundland & Labrador is responsible for the undersea link under the Strait of Belle Isle, which separates Newfoundland from Labrador.
Desrochers and Reed • Generating Electricity in Canada from Wind and Sunlight • 43
fraserinstitute.org
Nova Scotia went beyond providing incentives to IPPs and community groups prepared to install VRE capacity. It also backed a number of unsuccessful ventures associated with the wind-turbine industry. Seaforth Industries, a manufacturer of small wind tur-bines used in distribution-embedded applications, went out of business in 2014 owing money to various economic development agencies. In 2010, the Nova Scotia govern-ment partnered with Daewoo Shipbuilding in a joint venture to build wind towers and blades in the former Trenton Railcar Plant (DSME Trenton Ltd.). The provincial govern-ment contributed $60 million and the federal government $10 million but the enter-prise went into receivership early in 2016 owing the provincial government $56 million.
Nova Scotia imposed aggressive RPS targets on itself in order encourage efforts to reduce emissions from the electricity sector. Having done so, the province could have left the private energy companies the challenge of meeting that objective. Instead, it actively promoted increases in renewables including wind but excluding solar on the grounds it was not cost effective. Wind also proved expensive from the perspective of the electricity utility required to incorporate renewable electricity into the grid. Purchasing hydroelectricity from the Muskrat Falls project in Labrador was the util-ity’s preferred option, and it invested in the necessary undersea inter-tie. Unfortunately, the cost of that electricity when it does become available may be pricey. The cost of the Muskrat Falls project has ballooned to almost $13 billion, about twice that of Hydro-Québec’s La Romaine project—which has triple the capacity.
44 • Generating Electricity in Canada from Wind and Sunlight • Desrochers and Reed
fraserinstitute.org
Conclusion
This study illustrates the importance of using appropriate criteria to evaluate the con-troversial issue of wind and solar power. Proponents of VRE often use a narrow frame-work that fails to consider its indirect consequences. Electricity systems are exceedingly complex and changes made to one component may have significant repercussions on the system as a whole.
The emissions-free character of VRE is often used as an argument for government pro-grams to accelerate their adoption. However, adding this capacity will only reduce emis-sions at the system-wide level if it displaces electricity generated burning fossil fuels. This does not happen when hydroelectric and nuclear plants dominate the conventional generation mix as is the case in British Columbia, Ontario, and Quebec. In Atlantic Canada, where imported coal and oil are used to generate electricity, the prospects for wind power are somewhat brighter. Here, however, potential competition for wind power exists in the form of imported hydroelectricity.
VRE is extremely competitive if only its marginal production costs are taken into account. However, its irregular supply (in the absence of practical storage options) requires high levels of back-up. Gas-fired plants are usually preferred, despite their GHG emissions. Both VRE capacity and its required back-up must be connected to the grid and an appropriate array of grid services provided. VRE becomes an expensive option when the indirect costs to the system as whole are taken into account. Low-capacity utilization rates are inevitable: for the VRE because it is dependent on the weather, and for the back-up because it is generating electricity only when VRE is not available and idling the remainder of the time. The inefficient use of conventional generating capacity is inevitable as VRE “strands” assets.
How the costs of adding VRE are allocated across an electricity system depends very much on how the electricity system is organized. The interests of electricity consumers and tax-payers, and hence the well-being of provincial economies, are best served when the sys-tem is as efficient as possible. This applies irrespective of whether the system is publicly or privately owned. Whenever government intervention circumvents this principle, sooner or later consumers and taxpayers will suffer the consequences. Unfortunately, efforts by some provincial governments to increase VRE generating capacity provide good examples.
Desrochers and Reed • Generating Electricity in Canada from Wind and Sunlight • 45
fraserinstitute.org
Alberta and Prince Edward Island demonstrate how efficiency criteria can determine the appropriate mix of wind in the electricity system. A technology-neutral competitive market led to the installation of modest levels of wind capacity in Alberta prior to 2015. The electricity system in PEI also evolved along a least-cost trajectory, which in this instance prompted the installation of substantial wind capacity. The high cost of electri-city in PEI made wind an attractive alternative to local oil-fired generating facilities and imported electricity. PEI also avoided major wind integration costs because it is backed up by the New Brunswick power system. In both these cases, the interests of electricity users were protected.
In contrast, several provincial governments introduced programs to sharply accelerate the adoption of wind and solar power. The efficiency of electricity systems was unwit-tingly undermined by changes made to encourage independent power producers (IPPs) to participate in the sector as owners of generating capacity whenever a competitive market is not used to source electricity supply. Reliance on IPPs requires significant reallocation of benefits and costs. The regulatory oversight of provincial electricity util-ities, planning restrictions, and environmental assessment procedures were curbed in order to streamline the approval of VRE projects.
Concern over the long-term viability of their businesses aligns the interest of strong electricity utilities with those of their customers and owners. They may therefore oppose provincial policies that have short-term political objectives but negative finan-cial ramifications over the longer term. In Quebec, despite push-back from Hydro-Québec, the government used IPPs to add significant wind capacity to the electricity system. These increased costs adversely affected taxpayers and consumers. In Nova Scotia, the privately owned utility also resisted provincial government policy because it recognized imported hydroelectricity might be preferable to wind power as an alterna-tive to imported coal. Nova Scotia Power recently completed an undersea cable inter-tie to Newfoundland that will provide access to hydroelectricity from the Muskrat Falls project in Labrador—if it is reasonably priced. Attempts by Hydro-Québec to export electricity to the Maritimes a decade ago were rebuffed, but increasingly look like a missed opportunity.
Failed restructuring attempts rendered the electricity utilities in British Columbia and Ontario incapable of resisting active provincial government involvement in their plan-ning and procurement functions. The provincial government in BC provided IPPs with incentives to increase renewable electricity generating capacity in the province. Run-of-river hydroelectricity projects were the centrepiece of this initiative, and opposition
46 • Generating Electricity in Canada from Wind and Sunlight • Desrochers and Reed
fraserinstitute.org
focussed primarily on their adverse environmental consequences. In the short-run, the government prevented BC Hydro from passing on the full cost of IPP projects to the ratepayers, and the utility’s finances deteriorated alarmingly. The cost of wind projects made a relatively small contribution to this particular debacle.
A very strong government commitment to achieving a dramatic shift to wind and solar power proved disastrous in Ontario. Generous incentives were offered to IPPs prepared to install wind and solar capacity in an electricity system that was better off without it. As in BC, renewable energy projects were fast-tracked through an approval process “sim-plified” by limiting opportunities for objections. Within the electricity system, the con-tractual relationships between the OPA and conventional electricity sources protected
“stranded” generating capacity. OPG, Hydro One, and Bruce Nuclear all prosper while residential and small business ratepayers bear the brunt of the inefficiencies originating in the push to increase VRE. The Ontario economy continues to suffer through its green energy hangover.
The previous government in Alberta decided to intervene decisively in the electricity sector. It established targets of a 30% penetration rate for renewables, predomin-antly wind power, by 2032. The cost of these policies was to have been shared between taxpayers and electricity ratepayers, but the recently elected provincial government opposes subsidies for the renewable energy industry.
Critics of VRE initiatives focus on their serious financial and environmental conse-quences. There are opportunity costs whenever governments give a particular course of action priority and there is growing awareness that VRE initiatives have precluded less damaging and more effective alternatives. VRE initiatives also proved politic-ally unpopular: governments in Nova Scotia, British Columbia, Quebec, Ontario, and Alberta all now find themselves constrained in their ability to deal with other issues by the consequences of their predecessor’s ill-considered support for wind and solar power.
Desrochers and Reed • Generating Electricity in Canada from Wind and Sunlight • 47
fraserinstitute.org
References
Alberta (2018). Climate Leadership Plan: Implementation Plan. (Alberta Open Government, June). <https://open.alberta.ca/dataset/da6433da-69b7-4d15-9123-01f76004f574/
resource/b42b1f43-7b9d-483d-aa2a-6f9b4290d81e/download/clp_implementation_plan-jun07.pdf>.
Alberta (2019). Renewable Electricity Program: Competitions for Utility-Scale Renewable Energy Generation in Alberta. <https://www.alberta.ca/renewable-electricity-program.aspx>.
Alberta Electric System Operator [AESO] (2012). Phase II Wind Integration Study (December 20). <https://www.aeso.ca/downloads/Phase_II_Wind_Integration_Recommendation_-_
Final.pdf>, as of October 15, 2018. This report is no longer available on the AESO web-site but remains available from the authors.
Alberta Electric System Operator [AESO] (2018). Annual Market Statistics 2017 (March). <https://www.aeso.ca/market/market-and-system-reporting/annual-market-statistic-reports/>.
Alberta Electric System Operator [AESO] (2019). Annual Market Statistics 2018 (March/June). <https://www.aeso.ca/market/market-and-system-reporting/annual-market-statistic-reports/>.
Alsin, Arne (2018). Q & A: MIT Professor Donald Sadoway on the Future of Battery Storage and Renewable Energies. Forbes (August 24). <https://www.forbes.com/sites/
aalsin/2018/08/24/qa-mit-professor-donald-sadoway-on-the-future-of-battery-storage-and-renewable-
energies/#7ee77e882c62>.
Auditor General of Ontario (2015). Annual Report 2015. Office of the Auditor General of Ontario. <http://www.auditor.on.ca/en/content/annualreports/arreports/en15/2015AR_en_final.pdf>.
Bach, Paul Frederick (2019). Electricity in Denmark 2017. <http://www.pfbach.dk/firma_pfb/
references/pfb_danish_electricity_balance_2017_2018_02_13.pdf>.
Bakx, Kyle (2017). Alberta Renewable Revolution Begins with Launch of Largest Solar Project in Western Canada. CBC (Dec. 22) <https://www.cbc.ca/news/business/brooks-solar-
newell-elemental-energy-1.4458277>.
48 • Generating Electricity in Canada from Wind and Sunlight • Desrochers and Reed
fraserinstitute.org
BC Auditor General (2019). Rate-Regulated Accounting at BC Hydro (February 12). <https://
www2.gov.bc.ca/assets/gov/farming-natural-resources-and-industry/electricity-alternative-energy/
electricity/bc-hydro-review/final_report_desktop_bc_hydro_review_v04_feb12_237pm-r2.pdf>.
BC Auditor General (2011). The Effects of Rate-Regulated Accounting (October 27). <http://
www.auditor.on.ca/en/content/annualreports/arreports/en11/303en11.pdf>.
BC Hydro (2018). Independent Power Producers (IPPs) Currently Supplying Power to BC Hydro. <https://www.bchydro.com/content/dam/BCHydro/customer-portal/documents/corporate/
independent-power-producers-calls-for-power/independent-power-producers/ipp-supply-list-in-
operation.pdf>.
Blakewell, Richard (2010). Why PEI’s Wind Plan Is Dying. Globe and Mail (October 11; updated May 2, 2018). <https://www.theglobeandmail.com/report-on-business/industry-news/
energy-and-resources/why-peis-wind-plan-is-dying/article1370245/>.
Brouillette, Marc (2017). Ontario’s High Cost Wind Millstone. Council for Clean and Reliable Energy. <https://www.thinkingpower.ca/PDFs/Commentary/CCRE%20Commentary%20
-%20Ontario%27s%20High-Cost%20Wind%20Millstone%20-%20Marc%20Brouillette%20-%20June%20
2017.pdf>.
Brown, David P. (2018). Capacity Market Design: Motivation and Challenges in Alberta’s Electricity Market. School of Public Policy, Unitversity of Alberta. <https://www.policyschool.
ca/publications/capacity-market-design-motivation-challenges-albertas-electricity-market/>.
Caldicott, Arthur (2016). BC Hydro’s $76 Billion Debt. Watershed Sentinal (March 1). <https://watershedsentinel.ca/articles/bc-hydros-76-billion-debt/>.
Calvert, John (2007). BC’s Billion-Dollar Wind Power Giveaway. The Tyee (May 14). <https://thetyee.ca/Views/2007/05/14/Windfall/>.
Calvert, John, and Marjorie Griffin Cohen (2013). What Can Be Done about BC Hydro rates? Canadian Centre for Policy Alternatives <https://www.policyalternatives.ca/publications/
commentary/what-can-be-done-about-bc-hydro-rates>.
Canadian Press (2018). Hydro-Quebec Awarded Major, 20-Year Electricity Deal from Massachusetts. Financial Post (January 25). <https://business.financialpost.com/commodities/
energy/hydro-quebec-awarded-major-20-year-electricity-deal-from-massachusetts>.
Desrochers and Reed • Generating Electricity in Canada from Wind and Sunlight • 49
fraserinstitute.org
Chassin, Youri (2013). The Growing Cost of Electricity Production in Quebec. Montreal Economic Institute. <http://www.iedm.org/files/note0613_en.pdf>.
Corcoran, Terence (2017). Canada’s Green Electricity Bailouts Make the Bombardier Giveaway Look like Peanuts. Financial Post (February 9). <https://business.financialpost.
com/opinion/terence-corcoran-now-up-to-50-billion-canadas-green-electricity-bailouts-make-the-
bombardier-giveaway-look-like-peanuts>.
Economist (2017). A World Turned Upside Down. Renewable Energy. <https://www.economist.
com/briefing/2017/02/25/a-world-turned-upside-down>.
Fairley, Peter (2016). Can Synthetic Inertia from Wind Power Stabilize Grids? IEEE Spectrum (Nov. 7). <https://spectrum.ieee.org/energywise/energy/renewables/can-synthetic-inertia-
stabilize-power-grids>.
Gallant, Parker (2012). Green Energy Agenda Usurps Property Assessment and Municipal Tax Base (January 5). <http://www.windconcernsontario.ca/parker-gallant-green-energy-agenda-
usurps-property-assessment-and-municipal-tax-base-2/>.
Gallant, Parker (2018). Former Ontario Liberal Energy Ministers: Your Turn to Eat Crow. More Enlightened Facts from the Lennox Gas Plant, and How Billions Have Been Wasted. Parker Gallant Energy Perspectives (November 21). <https://parkergallantenergyperspectives
blog.wordpress.com/2018/11/21/former-ontario-liberal-energy-ministers-your-turn-to-eat-crow/>.
Gallant, Parker, and Glenn Fox (2011). Omitted Costs, Inflated Benefits: Renewable Energy Policy in Ontario. Bulletin of Science, Technology & Society 31, 5: 369–376. <https://docs.wind-watch.org/gallant2011.pdf>.
Goehring, Leigh R., and Adam Rozencwajg (2018). Déjà Vu: A History & Study of Electric Vehicles and the Oil Market Today (First Quarter). Natural Resource Market Commentary (New York).
Green, Kenneth P. (2017). Poor Implementation Undermines Carbon Tax Efficiency in Canada. Fraser Institute (May). <https://www.fraserinstitute.org/sites/default/files/poor-
implementation-undermines-carbon-tax-efficiency-in-canada.pdf>.
Green, Kenneth P., Elmira Aliakbari, and Ashley Steadman (2017). Ontario’s Fair Hydro Plan—A Temporary Band-Aid with High Costs. (Appeared in the Toronto Sun, October 22). <https://www.fraserinstitute.org/article/ontarios-fair-hydro-plan-a-temporary-band-aid-with-high-costs>.
50 • Generating Electricity in Canada from Wind and Sunlight • Desrochers and Reed
fraserinstitute.org
Griffin Cohen, Marjorie (2003). Gutting a Powerhouse: BC and the New Energy Plan. Canadian Centre for Policy Alternatives. <http://www.sfu.ca/~mcohen/publications/Electric/gutting.pdf>.
Healing, Dan (2016). Oldest Commercial Wind Farm in Canada Headed for the Scrapyard after 23 Years. Calgary Herald (March 15). <https://calgaryherald.com/business/
energy/oldest-commercial-wind-farm-in-canada-headed-for-scrapyard-after-23-years>.
Hoberg, George, and Ian H. Rowlands (2012). Green Energy Politics in Canada: Comparing Electricity Policies in BC and Ontario. Paper delivered at the annual meeting of the Canadian Political Science Association, Edmonton, Alberta (June 12–15, 2012). <https://www.cpsa-acsp.ca/papers-2012/Hoberg-Rowlands.pdf>.
Independent Electricity System Operator (IESO) (2018). Ontario Energy Report Q4 2017. Ontario/IESO/OEB. <https://www.ontarioenergyreport.ca/pdfs/6210_IESO_2017Q4OER_
Electricity_EN.pdf>.
Lau, Matthew (2015). Crony Capitalism Lurks in Renewable Energy Subsidies Programs. Fraser Institute. Canadian Student Review (Winter). <https://www.fraserinstitute.org/sites/
default/files/crony-capitalism-lurks-in-renewable-energy-subsidies-program.pdf>.
Leach, Andrew, and Trevor Tombe (2016). Power Play: The Termination of Alberta’s PPAs. SPP Communiqué 8, 11. School of Public Policy, University of Calgary. <https://www.
policyschool.ca/wp-content/uploads/2016/02/Albertas-PPAs-Leach-Tombe.pdf>.
Libin, Kevin (2018). Alberta’s Now Copying Ontario’s Disastrous Electricity Policies. What Could Go Wrong? Financial Post (April 19). <https://business.financialpost.com/opinion/
kevin-libin-albertas-now-copying-ontarios-disastrous-electricity-policies-what-could-go-wrong>.
Livingston, Brian (2018). The Albert Electrical Grid: What to Expect in the Next Few Years. SPP Communiqué 10, 3. School of Public Policy, University of Calgary. <https://www.
policyschool.ca/wp-content/uploads/2018/04/AB-Electrical-Grid-Livingston.pdf>.
Mathias, Philip (1971). Forced Growth: Five Studies of Government Involvement in the Development of Canada. James Lorimer.
McKitrick, Ross, and Elmira Aliakbari (2017a). Did the Coal Phase-out Reduce Ontario Air Pollution? Fraser Institute (January). <https://www.fraserinstitute.org/sites/default/files/did-the-
coal-phase-out-reduce-ontario-air-pollution.pdf>.
Desrochers and Reed • Generating Electricity in Canada from Wind and Sunlight • 51
fraserinstitute.org
McKitrick, Ross, and Elmira Aliakbari (2017b). Rising Electricity Costs and Declining Employment in Ontario’s Manufacturing Sector. Fraser Institute (October). <https://www.
fraserinstitute.org/sites/default/files/rising-electricity-costs-and-declining-employment-in-ontarios-
manufacturing-sector.pdf>.
McKitrick, Ross, and Elmira Aliakbari (2017c). 75,000 Manufacturing Jobs Lost — That’s the Price of Ontario’s Electricity Disaster. Financial Post (October 17). <https://
business.financialpost.com/opinion/75000-manufacturing-jobs-lost-thats-the-price-of-ontarios-
electricity-disaster>.
McKitrick, Ross, and Tom Adams (2016). Demand-Side Mismanagement: How Conservation Became Waste. Fraser Institute (April). <https://www.fraserinstitute.org/studies/
demand-side-mismanagement-how-conservation-became-waste>.
McKitrick, Ross, and Kenneth P. Green (2014). Why Engineering Energy Scarcity Is Likely to Hinder GDP Growth. Financial Post (June 3). <https://business.financialpost.com/
opinion/energy-conservation-gdp>.
Monbiot, George (2010). The German Disease. <https://www.monbiot.com/2010/03/12/the-
german-disease/>.
Montreal Economic Institute [MEI] (2017). Hydro-Québec Is Right to Want to Prioritize Profitable Projects. Cision (August 9). <https://www.newswire.ca/news-releases/hydro-quebec-is-right-to-want-to-prioritize-profitable-projects-690471541.html>.
Morton, Calvin (2004). The Failure of Crown Run Electricity in Ontario. University of Western Ontario. Western Undergraduate Economics Review 2004: 15–27. <https://
economics.uwo.ca/undergraduate/wuer/2004/3_Morton.pdf>.
Natural Resources Canada [NRC] (2018). Renewable Energy Facts. <https://www.nrcan.gc.ca/
energy/facts/renewable-energy/20069#L6>.
Ontario (2011). Proposed Regulation under the Assessment Act regarding the Property Tax Treatment of Renewable Energy Installations. <http://www.ontariocanada.com/registry/
showAttachment.do?postingId=7322&attachmentId=11017>.
Ontario (2013). Achieving Balance: Ontario’s Long Term Energy Plan <https://www.ontario.ca/
document/2013-long-term-energy-plan>.
52 • Generating Electricity in Canada from Wind and Sunlight • Desrochers and Reed
fraserinstitute.org
Ontario Society of Professional Engineers [OSPE] (2014a). The Real Cost of Electrical Energy. Energy Policy Presentation (November 2014). <https://www.ospe.on.ca/public/
documents/presentations/real-cost-electrical-energy.pdf>.
Ontario Society of Professional Engineers [OSPE] (2014b). Wind and the Electrical Grid. OPSE Study Findings. Joint OSPE – PEO Chapter Energy Policy Presentation (January). <https://www.ospe.on.ca/public/documents/presentations/wind-and-electrical-grid.pdf>.
Ontario Society of Professional Engineers [OSPE] (2016). Ontario’s Energy Dilemma: Reducing Emissions at an Affordable Cost. Research Report (March). <https://www.ospe.
on.ca/public/documents/advocacy/2016-ontario-energy-dilemma.pdf>.
Riesz, Jenny, and Michael Milligan (2015). Designing Electricity Markets for a High Penetration of Variable Renewables. <https://arena.gov.au/assets/2017/06/Riesz_et_al-2015_
FD_8-2.pdf>.
Rivard, Brian, and Adonis Yatchew (2015). Can the Electricity Market Structure Accommodate Significant Levels of Renewable Generation? An Evaluation of Carbon Policy Options for the Alberta Electricity Sector. Prepared by Charles River Associates for the Alberta Market Surveillance Administrator. <https://albertamsa.ca/uploads/pdf/
Archive/00000-2017/2017-01-17%20CRA%20electricity%20market%20report%20for%20MSA.pdf>.
Sepulveda, Eduardo (2018). Privatization and Electioneering Have Made Electricity Prices Unbearable in Ontario. The Monitor (May /June). <https://www.policyalternatives.ca/
publications/monitor/power-people>.
Schellenberger, Michael (2018). Yes, Solar and Wind Really Do Increase Electricity Prices -- and for Inherently Physical Reasons. Forbes (April 25). <https://www.forbes.com/
sites/michaelshellenberger/2018/04/25/yes-solar-and-wind-really-do-increase-electricity-prices-and-
for-inherently-physical-reasons/#4414042217e8>.
Shaw, Rob (2018). Political Directives Have Undermined BC Hydro’s Finances Auditor General Says. Vancouver Sun (August 30). <https://vancouversun.com/news/politics/political-
directives-have-undermined-b-c-hydros-finances-auditor-general-says>.
Smil, Vaclav (2017). Energy and Civilization: A History. MIT Press.
Desrochers and Reed • Generating Electricity in Canada from Wind and Sunlight • 53
fraserinstitute.org
Smyth, Michael (2016). The Site C Dam Blows Away Major Wind Power Project from B.C. The Province. <https://theprovince.com/technology/smyth-the-site-c-dam-blows-away-major-wind-
power-project-from-b-c>.
Sopinka, Amy, and G. Cornelis van Kooten (2011). Is BC a Net Power Importer or Exporter? University of Victoria. <http://web.uvic.ca/~kooten/documents/BCgeneratingSystem.pdf>.
Stephenson, Amanda, (2019). Alberta to Double Solar Capacity; Government Facilities Will Be Powered by the Sun. Calgary Herald (February 15). <https://calgaryherald.com/
business/local-business/alberta-to-double-solar-power-capacity-government-facilities-will-be-powered-
by-the-sun>.
van Kooten, G. Cornelis (2015). All You Want to Know about the Economics of Wind Power … Maybe. <https://ageconsearch.umn.edu/record/241693/files/WorkingPaper2015-07.pdf>.
Yakabuski, Konrad (2016) Wait – Quebec Has a Billion-Dollar Gas Plant Scandal, Too? Globe and Mail (January 14) <https://www.theglobeandmail.com/report-on-business/wait-quebec-
has-a-billion-dollar-gas-plant-scandal-too/article28198115/>.
Yakabuski, Konrad (2018). Is Wind Power Blowing Holes in Hydro-Québec’s Profits? Globe and Mail (August 14). <https://www.theglobeandmail.com/business/commentary/article-is-
wind-power-blowing-holes-in-hydro-quebecs-profits>.

fraserinstitute.org

Desrochers and Reed • Generating Electricity in Canada from Wind and Sunlight • 55
fraserinstitute.org
About the Authors
Pierre DesrochersPierre Desrochers is Associate Professor of Geography at the University of Toronto Mississauga. He holds a Ph.D. in Geography from the University of Montreal (2000). His research and teaching activities focus primarily on economic development, technological innovation, entrepreneurship, international trade, food policy, busi-ness-environment and business-university interactions. His other areas of expertise include intellectual property and urban and hous-ing policy. He has published over fifty academic articles and co-authored two books on these and other topics. His website can be found at <http://geog.utm.utoronto.ca/desrochers/>.
Andrew ReedAndrew Reed is is an independent researcher. He studied at the University of Toronto (Economic Geography), the University of Barcelona (Spanish) and the University of Surrey, UK (Russian) before embarking on a career in the private sector. He was the Agricultural Economist at a major Canadian Bank and was then involved in researching acquisition targets, due diligence, and business planning work in the automotive components, farm machinery, and industrial equipment industries in North America and Europe. He is a member of the International J.A. Schumpeter Society and much of his research focuses on Schumpeter’s contention that economic development occurs only when government policy does not influence technical change. The Soviet Union offered an extreme illustration of what happens when technical change is not directed by markets. A longstanding interest in Soviet agriculture led to work implementing, managing, and evaluating technical assistance projects in former Soviet Republics following the collapse of the Soviet Union. This experience pro-vided fresh perspective on another research interest, prairie agriculture. Mr Reed’s Ph.D. from the University of London evaluated the interaction between government policy and agriculture on the Canadian prairies over its 200-year history. The Invisible Green Hand, a Policy Primer published by the Mercatus Center at George Mason University, was the result of a previous collaboration with Pierre Desrochers.

56 • Generating Electricity in Canada from Wind and Sunlight • Desrochers and Reed
fraserinstitute.org
Acknowledgments
The authors would like to thank Jack Gibbons, Chair of the Ontario Clean Air Alliance, and Parker Gallant for taking time to discuss issues addressed in this study; Shalin Moradi, Market Analytics Analyst at the AESO for her help clarifying terminology and providing data; two anonymous reviewers for their constructive comments on prelimin-ary drafts; and Professor George Hoberg at UBC for permission to cite an as yet unpub-lished conference paper co-authored with Ian Rowlands from the University of Waterloo (Hoberg and Rowlands, 2012).
Any remaining errors or oversights are the sole responsibility of the authors. As the researchers have worked independently, the views and conclusions expressed in this paper do not necessarily reflect those of the Board of Directors of the Fraser Institute, the staff, or supporters.
Desrochers and Reed • Generating Electricity in Canada from Wind and Sunlight • 57
fraserinstitute.org
Publishing Information
DistributionThese publications are available from <http://www.fraserinstitute.org> in Portable Document Format (PDF) and can be read with Adobe Acrobat® or Adobe Reader®, versions 7 or later. Adobe Reader® DC, the most recent version, is available free of charge from Adobe Systems Inc. at <http://get.adobe.com/reader/>.
Ordering publicationsTo order printed publications from the Fraser Institute, please contact us via e-mail: sales@
fraserinstitute.org; telephone: 604.688.0221, ext. 580 or, toll free, 1.800.665.3558, ext. 580.
MediaFor media enquiries, please contact our communications department via e-mail: [email protected]; telephone: 604.714.4582.
CopyrightCopyright © 2019 by the Fraser Institute. All rights reserved. No part of this publication may be reproduced in any manner whatsoever without written permission except in the case of brief passages quoted in critical articles and reviews.
Date of issue2019
ISBN978-0-88975-563-5
CitationPierre Desrochers and Andrew Reed (2019). Generating Electricity in Canada from Wind and Sunlight: Is Getting Less for More Better than Getting More for Less? Fraser Institute.
58 • Generating Electricity in Canada from Wind and Sunlight • Desrochers and Reed
fraserinstitute.org
Supporting the Fraser Institute
To learn how to support the Fraser Institute, please contact us via post: Development Department, Fraser Institute, Fourth Floor, 1770 Burrard Street, Vancouver, British Columbia, V6J 3G7, Canada; telephone: toll-free to 1.800.665.3558, ext. 548; e-mail: [email protected]; or visit our web page: <http://www.fraserinstitute.org/
support-us/overview.aspx>.
Purpose, Funding, and Independence
The Fraser Institute provides a useful public service. We report objective information about the economic and social effects of current public policies, and we offer evidence-based research and education about policy options that can improve the quality of life.
The Institute is a non-profit organization. Our activities are funded by charitable dona-tions, unrestricted grants, ticket sales, and sponsorships from events, the licensing of products for public distribution, and the sale of publications.
All research is subject to rigorous review by external experts, and is conducted and pub-lished separately from the Institute’s Board of Trustees and its donors.
The opinions expressed by authors are their own, and do not necessarily reflect those of the Institute, its Board of Directors, its donors and supporters, or its staff. This publica-tion in no way implies that the Fraser Institute, its directors, or staff are in favour of, or oppose the passage of, any bill; or that they support or oppose any particular political party or candidate.
As a healthy part of public discussion among fellow citizens who desire to improve the lives of people through better public policy, the Institute welcomes evidence-focused scrutiny of the research we publish, including verification of data sources, replication of analytical methods, and intelligent debate about the practical effects of policy recommendations.

Desrochers and Reed • Generating Electricity in Canada from Wind and Sunlight • 59
fraserinstitute.org
About the Fraser Institute
Our mission is to improve the quality of life for Canadians, their families and future generations by studying, measuring and broadly communicating the effects of govern-ment policies, entrepreneurship and choice on their well-being.
Notre mission consiste à améliorer la qualité de vie des Canadiens et des générations à venir en étudiant, en mesurant et en diffusant les effets des politiques gouvernementales, de l’entrepreneuriat et des choix sur leur bien-être.
Peer review —validating the accuracy of our researchThe Fraser Institute maintains a rigorous peer review process for its research. New research, major research projects, and substantively modified research conducted by the Fraser Institute are reviewed by experts with a recognized expertise in the topic area being addressed. Whenever possible, external review is a blind process. Updates to previously reviewed research or new editions of previously reviewed research are not reviewed unless the update includes substantive or material changes in the methodology.
The review process is overseen by the directors of the Institute’s research departments who are responsible for ensuring all research published by the Institute passes through the appropriate peer review. If a dispute about the recommendations of the reviewers should arise during the Institute’s peer review process, the Institute has an Editorial Advisory Board, a panel of scholars from Canada, the United States, and Europe to whom it can turn for help in resolving the dispute.

60 • Generating Electricity in Canada from Wind and Sunlight • Desrochers and Reed
fraserinstitute.org
Editorial Advisory Board
Members
Past members
* deceased; † Nobel Laureate
Prof. Terry L. Anderson
Prof. Robert Barro
Prof. Jean-Pierre Centi
Prof. John Chant
Prof. Bev Dahlby
Prof. Erwin Diewert
Prof. Stephen Easton
Prof. J.C. Herbert Emery
Prof. Jack L. Granatstein
Prof. Herbert G. Grubel
Prof. James Gwartney
Prof. Ronald W. Jones
Dr. Jerry Jordan
Prof. Ross McKitrick
Prof. Michael Parkin
Prof. Friedrich Schneider
Prof. Lawrence B. Smith
Dr. Vito Tanzi
Prof. Armen Alchian*
Prof. Michael Bliss*
Prof. James M. Buchanan* †
Prof. Friedrich A. Hayek* †
Prof. H.G. Johnson*
Prof. F.G. Pennance*
Prof. George Stigler* †
Sir Alan Walters*
Prof. Edwin G. West*