Embed Size (px)
Citation preview
Chalmers University of Technology University of Gothenburg Department of Computer Science and Engineering Göteborg, Sweden, April 2011
Generating Driving Scenarios from Real World Video Records Master of Science Thesis [in the Programme of Software Engineering and
Technology]
MINHAZUR RAHMAN
2
The Author grants to Chalmers University of Technology and University of Gothenburg the non-exclusive right to publish the Work electronically and in a non-commercial purpose make it accessible on the Internet. The Author warrants that he/she is the author to the Work, and warrants that the Work does not contain text, pictures or other material that violates copyright law. The Author shall, when transferring the rights of the Work to a third party (for example a publisher or a company), acknowledge the third party about this agreement. If the Author has signed a copyright agreement with a third party regarding the Work, the Author warrants hereby that he/she has obtained any necessary permission from this third party to let Chalmers University of Technology and University of Gothenburg store the Work electronically and make it accessible on the Internet.
Generating Driving Scenarios from Real World Video Records MINHAZUR, RAHMAN © Minhazur Rahman, April 2011. Examiner: FANG CHEN Chalmers University of Technology University of Gothenburg Department of Computer Science and Engineering SE-412 96 Göteborg Sweden Telephone + 46 (0)31-772 1000 [Cover: Showing screenshot of Vehicle Simulator Driving] Department of Computer Science and Engineering Göteborg, Sweden June 2011

3
ACKNOWLEDGEMENT I would first and foremost like to thank my supervisor and examiner Professor Fang Chen, for believing and providing me the opportunity to work in this project. During the entire project, her depth of knowledge in this project, encouragement and supervision helped me to conduct this research work efficiently. I would also like to thank my supervisor Dominik Schmölz, who works as a PHD student at SAFER. From the beginning of my thesis work he has been great help and give me guidelines through out the entire project. He has been spent a lot of time regarding the progress, which has made this project successful. Furthermore, I would like to thank my family, my colleagues, Minjuan Wang who helped me to complete this thesis project successfully.
4
ABSTRACT Nowadays’ a single day without use of transportation is unimaginable. No matter how small or big the distance is, we tends to use transport to travel from each place to another. There is a lot of medium available for traveling from one place to another. Among this mediums, traveling by roadway vehicles seems to be generally used. In recent times, many research has been done to create awareness for the driver and facilitate building assistance technologies. These assistance technologies help drivers not only to maintain but increase safe driving while not to interfere or giving too much information. These days many new technologies were implmented to create awareness for the driver. Before implementing a new technology into a vehicle, vehicle simulator can be used for driving assessment. In vehicle simulator, test scenarios are created for experimentation and to see how the test subject reacts on new surroundings. It is easy to execute the scenario in vehicle simulator and observe the human behavour rightaway and create the same environment over and over again. In this thesis, I have watched and analysed naturalistic drive records and afterwards convert those videos into vehicle simulator scenarios. There are a lot of naturalistic drive records from different projects performed earlier in SAFER. These video recordings were taken from different type of roads. These video records can help us to understand better, how the driving vehicle would interact with other road users. Video records from FOT project and from China was analysed in this thesis. For analyzing the videos I have several meetings with my professor, supervisor and colleague from SEMCON and the results were put into a excel file. After analyzing, sorting and extracting the most significant video clips, I have designed storyboards based on that. Those story boards were used to develop scenarios in car simulator at the interaction design lab. These scenarios will be used for further future HMI studies and to test the design see if it can help the driver to avoid different kind of dangerous moments happening on the road. After designing the scenarios in vehicle simulator (STISIM), the results were taken out in log file and in realtime to use it another EFESOS projects.
Keyword: FOT, STISIM, Matlab, EFESOS, HMI, log file, real-time.
5
CONTENTS ACKNOWLEDGEMENT I ABSTRACT II 1 INTRODUCTION 6 1.1 Purpose 6 1.2 Objectives 6 1.3 Thesis Objectives 6 2 TECHNICAL BACKGROUND 7 2.1 Sony Vegas Pro 7 2.2 STISIM 7 2.3 Matlab 7 3 METHODOLOGY 8 3.1 Selection Process and Analysis of Video 8 3.2 Storyboard 10 3.3 Analysis of video and Results 10 4 RESULTS 12 4.1 Expectation 12 4.2 Scenario Development in STISIM 12 4.2.1 Pedestrian Block 14 4.2.2 Bicycle Block 18 4.2.3 Vehicle Block 20 4.3 Real-time Output in Matlab 22 5 DISCUSSION and FUTURE WORKS 25 6 CONCLUSION 26 7 REFERENCE 27 8 APPENDIX 28
6
1 INTRODUCTION At present, to ensure safety while driving many new technologies has been applied [1]. Ensuring safety is a ever growing process, where not only its main motto is to increase driver’s safety but also make sure driver feel comfortable around it. While driving a vehicle, driver interacts with his eye sight, hearing ability and sensing physically. Many of the mishaps happened while driving because of lack of focus on the road. Inattention has been identified as one of the biggest factors that contribute to traffic accidents. Inattention often leads to the driver failing to notice and respond to hazards in a timely manner. However, it may have some limitations when the traffic situation is especially busy or complex, such as the busy time in city centres. Before implementing a new alert system for vehicle and to test the system, vehicle simulator is used for generating the same scenario with different participant and change the scenario according to development needs. In this thesis, driving scenario was taken from different places. To get a better understanding of what happens in real traffic situations; over 30 hours of driving video records in China were generated, taken by one camera pointing in driving direction. These videos cover both, inner-city and country road driving. As additional source, videos excerpted from Field Operational Test (FOT) data recorded on Swedish roads were used. The video material was searched for incidents requiring prompt driver interaction, and the selected parts were categorized according to predefined factors. The result is a database of over 70 short clips containing incidents, which are clustered into groups. This database serves as a basis for scenarios for future studies carried out in driving simulators. The first application of this database was a study on in-car information sound. According to the requirements of the study certain video clips were chosen. The simulation scenarios were then built on this basis, ensuring analogy to real world traffic situations.
1.1 Purpose In this thesis, the aim is to analyze and extract video clips from the naturalistic drive records; than develop scenarios in vehicle simulator based on the findings of real-life driving scenario and generate a real-time positioning output in MATLAB using serial port.
1.2 Objectives
• Acquire a video clip database where all the categories are well defined.
• develop scenarios in vehicle simulator for according to finding of the video clips.
• While driving in the vehicle simulator, driven vehicles and surrounding vehicles and pedestrians real time positioning can be assessed in real-time and in log files.
1.3 Thesis Organization Thesis was developed in two major parts. Two parts are different and comprise seperately. In the first part, video recoreds were watched and analyzed. Then most significant video clips were sorted and extracted, based on the clips story boards were created. In the second part, video clips were developed block-wise scenario in the vehicle simulator (STISIM). The individual scenario blocks were designed in a way, new scenario can be created easily using those blocks. After the scenario developing, records of the driver vehicle were taken out successfully in a log file and also in real-time in MATLAB using serial port.

7
2 TECHNICAL BACKGROUND The following chapter explains the software and hardware used during the research and important for a greater overview of the system.
2.1 Sony Vegas Pro Before analyzing the Chinese and Swedish road videos, we have spent a short time for finding the right tool for cutting the videos. While looking for editing software, we were looking for lightweight but also versatile. We have come across, Adobe Premiere and Sony Vegas Pro. Among this two, Sony Vegas Studio Pro’s trial version had the full functionality, and it was faster than the Adobe. Sony Vegas is a professional tool used for non-linear editing system. It both supported audio and video editing. It features real-time multi track video and audio editing on unlimited tracks and complex mixing. It is designed for Microsoft Windows [4].
2.2 STISIM After analysing the video clips, we have used STISIM vehicle driving simulator to develop the scenario. There were two other driving simulators from Volvo car and vti in consideration for developing the scenario. However, STISIM is easily accessible and you can get into the scenario definition language without difficulties in a limited time by reading the manual without having a programming background. As it is around Lindholmen premises, we opted for this vehicle simulator to develop our scenarios and students have permanent access. STISIM Drive, is interactive, PC-based driving simulator with diverse scenario development experience. It is ideal for research and development applications concerning the driver. It is also used for drugs and pharmaceutical assessment, novice and professional training Applications [5].
2.3 MATLAB After developing the scenarios in STISIM, it was required to get certain parameters such as vehicle position in real-time. To get the real-time data from STISIM, a MATLAB script had to be created on a second computer in order to enable data communication between the two programs. However, we have thought of programming in Java using serial port but instead opted for MATLAB. It is an enriched tool with great support. While extracting the data, it not only gave us freedom to extract the data in terms of our needs but also improve data visualization. MATLAB is a numerical computing environment and programming language. It provides detailed tools, where built in functionality helps to write new required code swiftly. MATLAB allows matrix manipulations, plotting of functions and data, implementation of algorithms, creation of user interfaces, and interfacing with programs written in other languages, including C, C++, and Fortran [7]. In this study, we have used its matrix manipulation, algorithm and user interface creation tool.
8
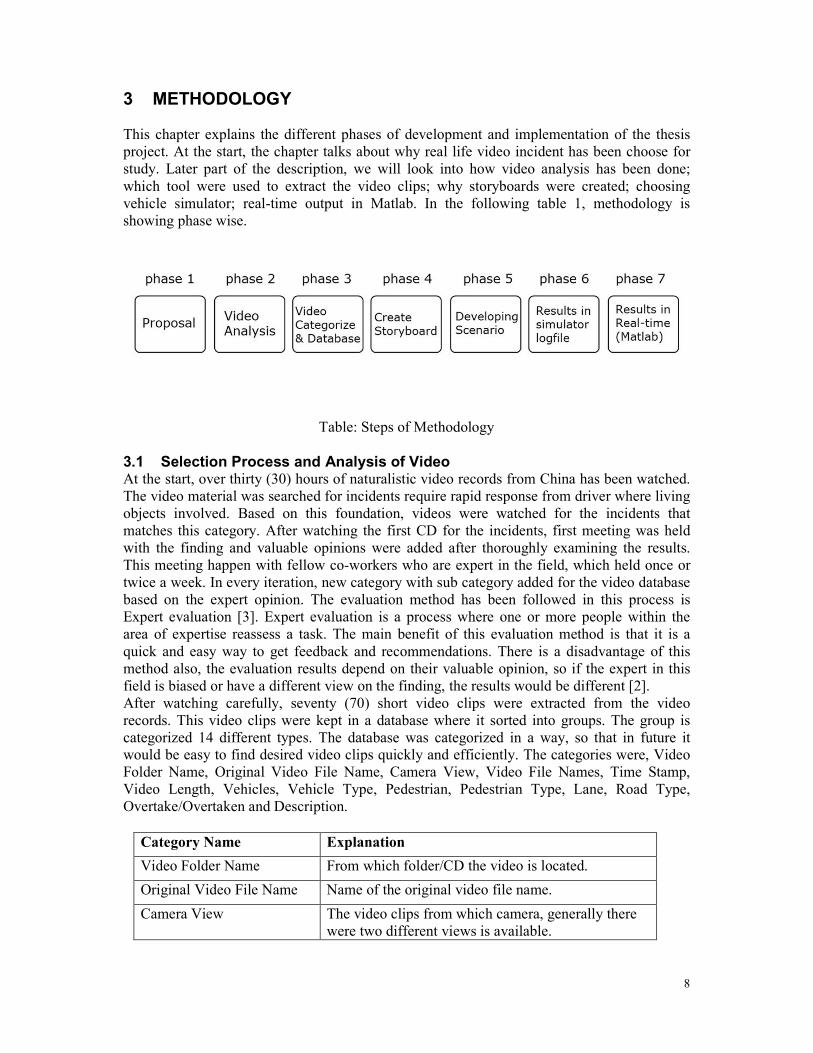
3 METHODOLOGY This chapter explains the different phases of development and implementation of the thesis project. At the start, the chapter talks about why real life video incident has been choose for study. Later part of the description, we will look into how video analysis has been done; which tool were used to extract the video clips; why storyboards were created; choosing vehicle simulator; real-time output in Matlab. In the following table 1, methodology is showing phase wise.
Table: Steps of Methodology
3.1 Selection Process and Analysis of Video At the start, over thirty (30) hours of naturalistic video records from China has been watched. The video material was searched for incidents require rapid response from driver where living objects involved. Based on this foundation, videos were watched for the incidents that matches this category. After watching the first CD for the incidents, first meeting was held with the finding and valuable opinions were added after thoroughly examining the results. This meeting happen with fellow co-workers who are expert in the field, which held once or twice a week. In every iteration, new category with sub category added for the video database based on the expert opinion. The evaluation method has been followed in this process is Expert evaluation [3]. Expert evaluation is a process where one or more people within the area of expertise reassess a task. The main benefit of this evaluation method is that it is a quick and easy way to get feedback and recommendations. There is a disadvantage of this method also, the evaluation results depend on their valuable opinion, so if the expert in this field is biased or have a different view on the finding, the results would be different [2]. After watching carefully, seventy (70) short video clips were extracted from the video records. This video clips were kept in a database where it sorted into groups. The group is categorized 14 different types. The database was categorized in a way, so that in future it would be easy to find desired video clips quickly and efficiently. The categories were, Video Folder Name, Original Video File Name, Camera View, Video File Names, Time Stamp, Video Length, Vehicles, Vehicle Type, Pedestrian, Pedestrian Type, Lane, Road Type, Overtake/Overtaken and Description.
Category Name Explanation
Video Folder Name From which folder/CD the video is located.
Original Video File Name Name of the original video file name.
Camera View The video clips from which camera, generally there were two different views is available.
9
Video File Names Extracted video clips from Original video file.
Time Stamp From which part from which part video is extracted.
Video Length Duration of the video clips.
Vehicles There are multiple video types available, it is categorized whether that vehicle is available in a single frame of that video clips.
Vehicle Type In this category, it defined what kind of vehicle types are available in the clips.
Pedestrian In this video how many pedestrian are available in a single frame and also illustrate their passing or crossing in the roadway.
Pedestrian Type In this part, it denotes, whether kid or old, man or woman available in the scene.
Lane Here, it represents how many lanes is available and also the driven vehicle made any lane changes in the roadway.
Road Type In this part, different type of road type described.
Overtake/Overtaken The driven video overtaken or overtook in the roadway.
Description A short description of what happened and the significance of the extracted video clips.
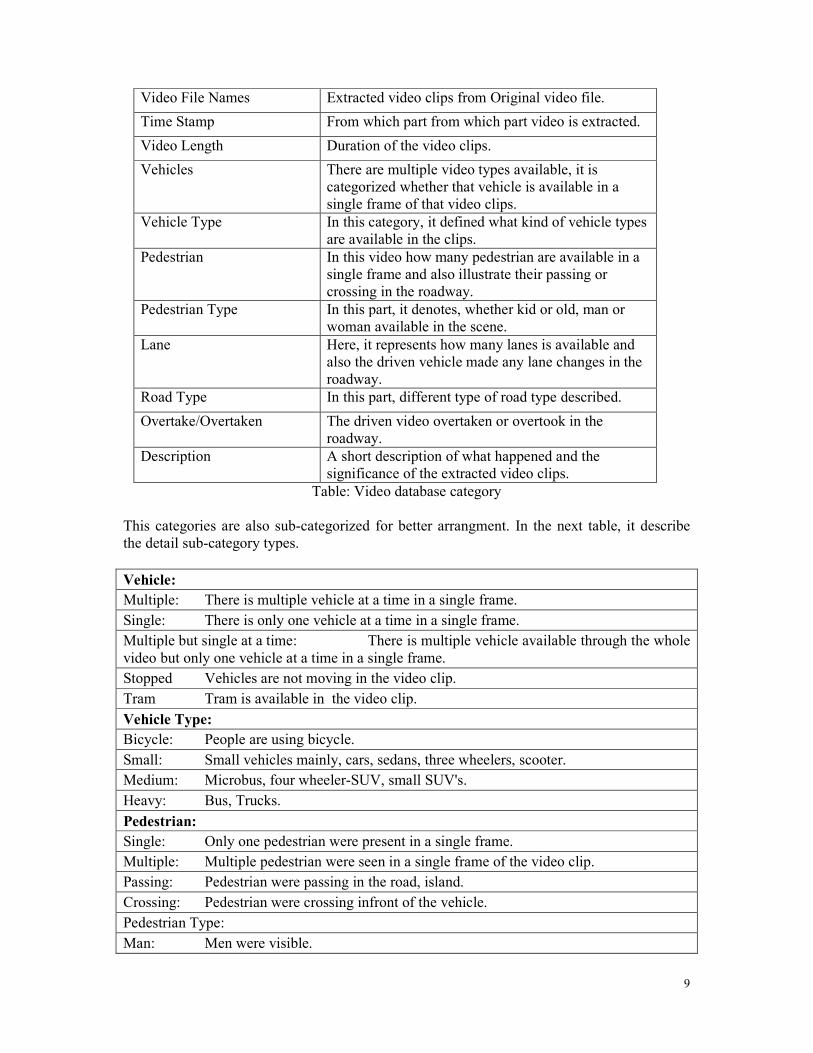
Table: Video database category This categories are also sub-categorized for better arrangment. In the next table, it describe the detail sub-category types.
Vehicle:
Multiple: There is multiple vehicle at a time in a single frame.
Single: There is only one vehicle at a time in a single frame.
Multiple but single at a time: There is multiple vehicle available through the whole video but only one vehicle at a time in a single frame.
Stopped Vehicles are not moving in the video clip.
Tram Tram is available in the video clip.
Vehicle Type:
Bicycle: People are using bicycle.
Small: Small vehicles mainly, cars, sedans, three wheelers, scooter.
Medium: Microbus, four wheeler-SUV, small SUV's.
Heavy: Bus, Trucks.
Pedestrian:
Single: Only one pedestrian were present in a single frame.
Multiple: Multiple pedestrian were seen in a single frame of the video clip.
Passing: Pedestrian were passing in the road, island.
Crossing: Pedestrian were crossing infront of the vehicle.
Pedestrian Type:
Man: Men were visible.

10
Woman: Women were visible.
Senior: Senior citizen were visible.
Kid: Kids were visible in the video clip.
Lane:
lane changes When the vehicle chnages the lanes or move to a different road size.
number (#) of lane Number of lanes were seen in a single frame.
Road Type:
City: Inside a city road.
Country: Inside a country road.
Small: The road is quite small and generally a single lane.
Oneway: Road might be in the city or country, it's a oneway road.
Twoway: Road might be in the city or country, it's a twoway road.
Highway: This type of roads are available outside country, city and generally a twoway road.
Tunnel: Tunnels were available in the video clip.
Junction: It's a fourway, junction.
Tollbooth/Checkpost: Tollbooth/Checkpost in a highway.
Overbridge: Overbridge were seen while drive by.
Bridge: The vehicle is in a bridge.
Overtake/Overtaken
Overtake The vehicle overtook some vehicle.
Overtaken The vehicle is overtaken by some other vehicle.
Both Overtake and overtaken were happened in a video clip.
Table: Legends used in video database
After careful observation, from selected seventy video clips twenty five video clips were chosen. This twenty five video clips has a combination of most frequently happened traffic incidents that occur in everyday life of China. A typical traffic incident is where regular activities is seen in a traffic. Later, video records from FOT project has been watched and carry out the same procedure to distinguish the most occuring behaviour. After watching 10 hours of video clips from FOT data, two significant video clips were choosen where animal were crossing middle of a country side road. In the end, 40 video clips contained crash incidents were introduced. Out of the 40 video clips, 15 video clips were choosen after analysis, for building the scenario in vehicle simulator software.
3.2 Storyboard Storyboards are a series of illustrations or images in a row for purpose of pre-visualizing animation, motion graphic, interactive media sequence. It shows users the story step by step by illustration. Benefits of having storyboard is that it allows user to experiment with changes in the storyline and focus on the imperative parts [8]. In the beginning of storyboard illustration, from selected video clips common sequence were selected. At first, storyboards has been done using a general template with pencil. Later selected illustration were put into computer for visual design. At the end, thirty (30) storyboards were created for vehicle simulator design. Every storyboard consists of six (6) sequential plots. From beginning to the end, each of the storyboards sequence consists of scenario sequentially according to incidents. However, in the
11
analysed video clips, there is only one moment where significance incidents happen. That distinguish from other selected scenarios. In the results parts, it will be describe with different objects.
3.3 Vehicle Simulator and Results Vehicle simulator is used for realistic interpretation of traffic incidents. In this thesis, STISIM vehicle simulator is used for developing the scenario. STISIM Drive is a PC-based interactive driving simulator that allows the driver to control and experience motor and behavioral aspects of driving including steering, speed control, and situational awareness. STISIM Drive is flexible and robust. The hardware configurations with STISIM Drive can range from a simple single monitor display to a complex wide field-ofview display with dynamic steering and throttle inputs. Scenario Definition Language (SDL) is the language used to write the scenarios [6]. The SDL represents objects that we encounter on the road in a format that the computer recognizes. These objects specified are then used to create a scenario. A scenario is just a list of different objects that called events. A few examples of events include roadways, intersections, pedestrians and interactive traffic. At first, before developing the scenario for vehicle simulator drive, anyone has to get familiar with the interface of the simulator drive. The vehicle simulator drives interface is simple and equipped with different features. It is easy to edit and update the scenarios from the main window. From toolbar, options such as configuration and help files are worth mentioning. To develop a scenario in STISIM Drive, anyone has to familiar with its own definition language. It is called Scenario Definition Language (SDL). The scenario definition language is simple and categorize event wise. If anyone wants to develop a scenario, he needs to take the different events (e.g. ROAD, PED, SIGN) and put into a event file (.evt). One of the most important features of STISIM Drive is, detailed of its results. In this study, to get the right results is required. In STISIM drive, the results can be extract from logfiles and also in realtime through serial port. In the log files, the results are divided in different categories. Whether it is predefined blocks or new dynamically defined ones, the results are showed one after another. The dynamically blocks is need to define in scenario files for object tracking and to look closer to vehicle drivers behaviour. On the other hand, real-time results can be extracted using a serial port. The parameters are almost as same as dynamically save blocks. Using serial port, we can use another computer to get the results. The results can be derive using another programming language and work around with it. We have used Matlab to get the data using serial port and show that values in two different figures in real-time. The results are arranged in a symmetrical order, so anyone can work around for further study later time.

12
4 RESULTS The following chapter present the results of the master’s thesis project. The chapter is divided into overview of the results, followed by detailed descriptions of the various sub-systems.
4.1 Expectation One of the main project challenges was to get a better understanding of what happens in real life traffic scenarios. In this study, over 30 hours of driving video records in China were assessed and for videos from Sweden, FOT recorded data were used. After careful observation and evaluation, unique and the most occurred scenarios were selected. Selected scenarios were sketched into storyboard for developing more realistic vehicle simulator scenarios.
4.2 Scenario Development in STISIM STISIM vehicle simulator software was used to develop the scenarios. It has all the required objects necessary to develop a realistic scenario. STISIM version 2 for developing all the scenarios. Developed scenarios were designed as block. Every block represents a unique event. This blocks are designed carefully depending on each incidents that taken from the video clips from real-life traffic videos. The vehicle simulator scenarios developed in separate event file. As the goal is to designed the scenario block-wise, so each blocks were described separately. The developed scenarios were generally divided in to 3 categories, a) Pedestrian block, b) Bicycle block, and c) Vehicle block. This blocks are defined in a way, it is easy to took away the block and put into a new ones for generating complete new scenarios. The event file contains three to five different blocks, which contains events from the real-life traffic scenarios. Each of the event file contains, several required component with a lot optional components. At first, in event it needed to describe, which system of measurement is going to follow in the event file. There are Metric and English system available for defining the units in the event file. We have used Metric system for our unit while developing the scenario. The first event will be a road, the most important aspect of the driving experience. If it is not defined in the vehicle simulator, the program does not generate a by itself. For scenario design, we have chosen a highway and a suburban city road as our recorded videos were mainly from countryside and busy city road. While creating the ROAD event in scenario, it has 31 different parameters that helps user to design specific road incidents. A generally syntax for events would like this, GENERAL SYNTAX: ON_DISTANCE, EVENT_NAME, PARAMETER 1,... N. In the following table, the parameters for Road events with short description demonstrated,
Parameter Parameter Value Description
1 12 Width (m) of each roadway lane; here, it is 12 m
2 2 Total number of lanes available in the desired roadway; here it is 2-lane road.
3 1 The number of right hand side lens in the event.
4 1 Roadway’s dividing lane’s striping options, here, 1 denotes it is a broken dashed line.
5 1 Distance (m) from the edge of the roadway the inside edge of the edge line.
13
6 10 Length of stripes in meter
7 10 Longitudinal distance between stripes end
8 .5 Width (m) between the lanes divided markers.
9 .5 Width (m) of available edge lines.
10 100 Works if there’s multiple road events defined.
11 -1 Cross slope for right-hand side lanes in percent grade (100 * meter/meter), Negative value refers to, road is sloping downwards.
12 -1 Same as previous parameter but it is for left-hand side lanes.
13 -5 Same as parameter 11, but instead of lane sides, shoulder is defined.
14 6 Width (m) of the right-hand side shoulder.
15 -5 Same as parameter 14, but for left-hand side.
16 6 Width (m) of the left-hand side shoulder.
17 -30 Slope for the right-hand side foreslope in percent grade (100 * m/m). Negative values refers to road is sloping downwards, from the center line to outer edges.
18 10 Width (m) of the right-hand side foreslope.
19 -30 Same as parameter 17, but it is for left-hand side.
20 10 Width (m) of the left-hand side foreslope.
21 0 Width (m) of the center median.
22 0 No texture map is used in this parameter.
23 0 No texture map is used in this parameter.
24 C:\STISIM\Data \Textures\Grass01.Jpg
A texture map is used, for displaying roadway shoulders.
25 12 The width of the texture map in meter used in previous parameter.
26 0 No texture map is used in this parameter.
27 0 No texture map is used in this parameter.
28 C:\STISIM\Data \Textures\Grass04.Jpg
A texture map is used, for displaying the ground.
29 12 The width of the texture map in meter used in previous parameter.
30 _ No texture map is used in this parameter.
31 _ No texture map is used in this parameter.
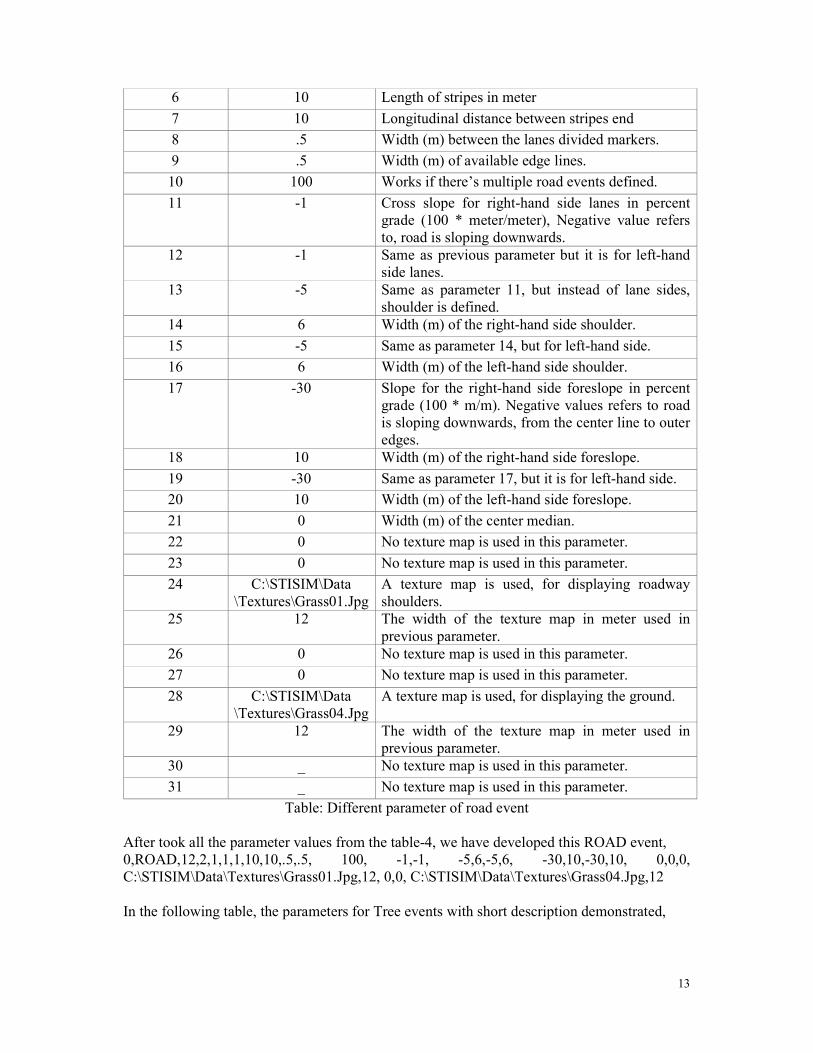
Table: Different parameter of road event After took all the parameter values from the table-4, we have developed this ROAD event, 0,ROAD,12,2,1,1,1,10,10,.5,.5, 100, -1,-1, -5,6,-5,6, -30,10,-30,10, 0,0,0, C:\STISIM\Data\Textures\Grass01.Jpg,12, 0,0, C:\STISIM\Data\Textures\Grass04.Jpg,12 In the following table, the parameters for Tree events with short description demonstrated,
14
Parameter Parameter Value Description
1 10 The maximum number of trees will be displayed at a time.
2 0 This parameter is for older STISIM version.
3 *1~16;-15;-4;-10;-7;-2;-6
Types of tree will be displayed, “*” denotes “all”, “~” denotes to, (e.g. 1 to 16). Negatives value denotes exclude that parameter from the list.
4 50 Lateral Distance from road’s centerline that the trees will appear.
5 100 Lateral Distance from the road’s centerline that the trees will appear.
6 0 Side of the roads trees will appear, 0 value represents both side.
Table: Different parameter of tree objects
After took all the parameter values from the table-5, we have developed this Tree event, 0, TREE, 10, 0,*1~16;-15;-4;-10;-7;-2;-6, 50, 100, 0 Intersection event is created after 1000 meter of the roadway, Before the event name, it is introduced. In the following table different parameters described,
Parameter Parameter Value Description
1 0 The type of intersection, 0 denotes it will be full intersection.
2 0 Longitudinal distance offset the location of intersection.
3 1 In this parameter, it defines which way vehicle can turn, 1 denotes, full intersection is possible.
Table: Road intersection parameters 1000, I, 0, 0, 1 Where first parameter shows, it’s a full intersection, 2nd parameter denotes longitudinal design offset where intersection will appear and the last parameter shows in which way turning is allowed in the roadway, 1 is representing, it is allowing user to turn left or right.
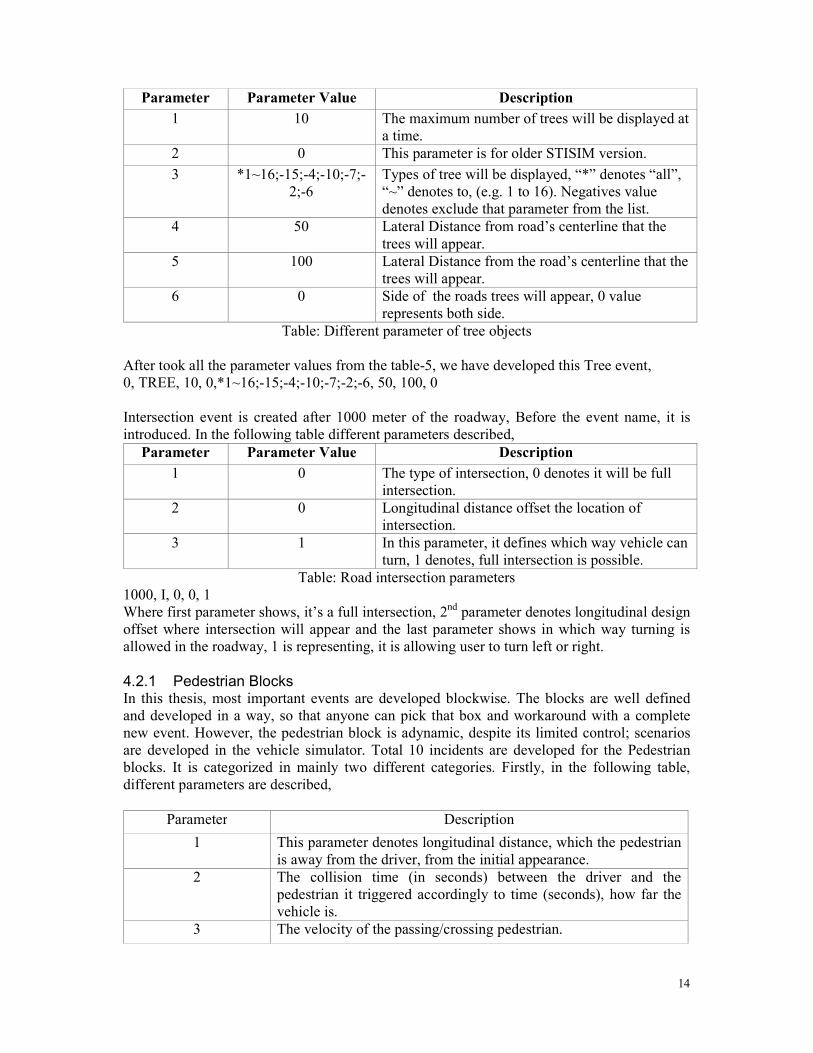
4.2.1 Pedestrian Blocks In this thesis, most important events are developed blockwise. The blocks are well defined and developed in a way, so that anyone can pick that box and workaround with a complete new event. However, the pedestrian block is adynamic, despite its limited control; scenarios are developed in the vehicle simulator. Total 10 incidents are developed for the Pedestrian blocks. It is categorized in mainly two different categories. Firstly, in the following table, different parameters are described,
Parameter Description
1 This parameter denotes longitudinal distance, which the pedestrian is away from the driver, from the initial appearance.
2 The collision time (in seconds) between the driver and the pedestrian it triggered accordingly to time (seconds), how far the vehicle is.
3 The velocity of the passing/crossing pedestrian.
15
4 Lateral position of pedestrian with respect to roadway dividing line.
5 Direction of pedestrian, there are four different directions available
6 Model of the pedestrian that will be displayed.
Table: Parameter available for pedestrian
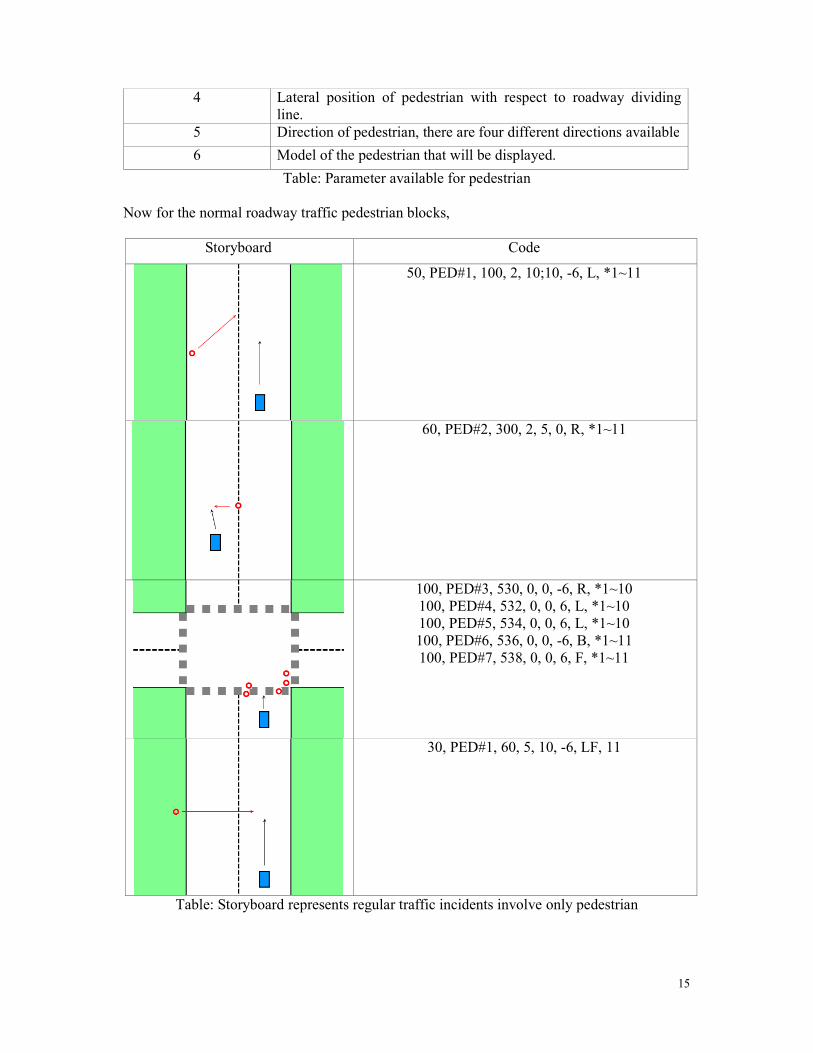
Now for the normal roadway traffic pedestrian blocks,
Storyboard Code
50, PED#1, 100, 2, 10;10, -6, L, *1~11
60, PED#2, 300, 2, 5, 0, R, *1~11
100, PED#3, 530, 0, 0, -6, R, *1~10 100, PED#4, 532, 0, 0, 6, L, *1~10 100, PED#5, 534, 0, 0, 6, L, *1~10 100, PED#6, 536, 0, 0, -6, B, *1~11 100, PED#7, 538, 0, 0, 6, F, *1~11
30, PED#1, 60, 5, 10, -6, LF, 11
Table: Storyboard represents regular traffic incidents involve only pedestrian
16
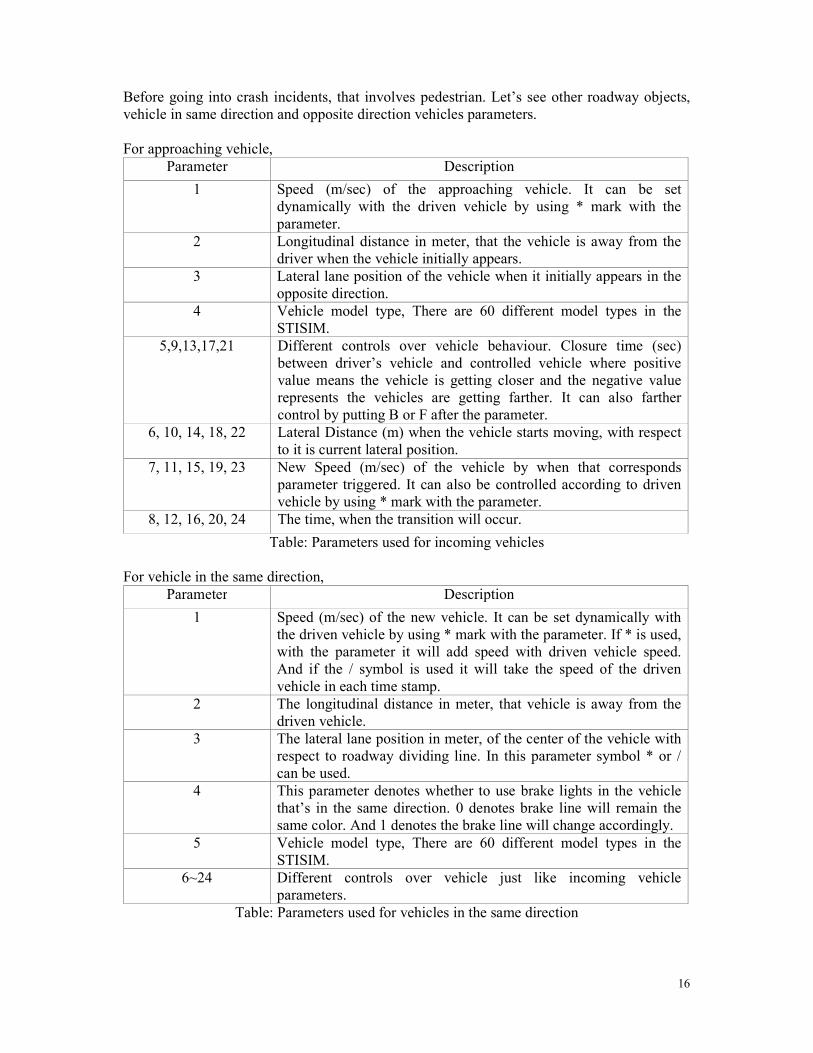
Before going into crash incidents, that involves pedestrian. Let’s see other roadway objects, vehicle in same direction and opposite direction vehicles parameters. For approaching vehicle,
Parameter Description
1 Speed (m/sec) of the approaching vehicle. It can be set dynamically with the driven vehicle by using * mark with the parameter.
2 Longitudinal distance in meter, that the vehicle is away from the driver when the vehicle initially appears.
3 Lateral lane position of the vehicle when it initially appears in the opposite direction.
4 Vehicle model type, There are 60 different model types in the STISIM.
5,9,13,17,21 Different controls over vehicle behaviour. Closure time (sec) between driver’s vehicle and controlled vehicle where positive value means the vehicle is getting closer and the negative value represents the vehicles are getting farther. It can also farther control by putting B or F after the parameter.
6, 10, 14, 18, 22 Lateral Distance (m) when the vehicle starts moving, with respect to it is current lateral position.
7, 11, 15, 19, 23 New Speed (m/sec) of the vehicle by when that corresponds parameter triggered. It can also be controlled according to driven vehicle by using * mark with the parameter.
8, 12, 16, 20, 24 The time, when the transition will occur.
Table: Parameters used for incoming vehicles
For vehicle in the same direction,
Parameter Description
1 Speed (m/sec) of the new vehicle. It can be set dynamically with the driven vehicle by using * mark with the parameter. If * is used, with the parameter it will add speed with driven vehicle speed. And if the / symbol is used it will take the speed of the driven vehicle in each time stamp.
2 The longitudinal distance in meter, that vehicle is away from the driven vehicle.
3 The lateral lane position in meter, of the center of the vehicle with respect to roadway dividing line. In this parameter symbol * or / can be used.
4 This parameter denotes whether to use brake lights in the vehicle that’s in the same direction. 0 denotes brake line will remain the same color. And 1 denotes the brake line will change accordingly.
5 Vehicle model type, There are 60 different model types in the STISIM.
6~24 Different controls over vehicle just like incoming vehicle parameters.
Table: Parameters used for vehicles in the same direction

17
As this pedestrian crash involved video had vehicles positioning involved and this happened because of other vehicle is on the roadway. For this reason, it is important to get the position right for the other vehicles.
Storyboard Code
0,A, 0, 105, -5, 1, *1~6 0,V, 0, 95, 5, 1, *1~6 0,V, 0, 99, 5, 1, *12~24 10, PED, 90, 3.7, 1.22, 5.18, R, *4~5
10,V, 10, 150, 4, 1, 3, 4, 2, 0, 1, 3, 2, 0, 1 0, PED, 200, 4, 10, 5.3, B, *1~10 0, PED, 200, 3.5, 10, 5.5, B, *1~10 0, PED, 200, 4.2, 10, 6, B, *1~10
100,A, 5, 300, -4, 4, *13~17 100,A, 5, 300, -1, 10, *18~24 0,V, 5, 200, 4, 1, *10~19, 4, 0, 0, 1, 3, 0, 0, 1 0, PED, 350, 1, 2, 6, R, *1~3
400,V, 0, 95, -5, 1, 60 410,V, 0, 99, -4.5, 1, 60 400,V, 0, 95, -5, 1, 60
0, PED, 400, 2, 1.5, 0, L, *1~10 0, PED, 411, 2, 2, -6.2, L, *1~10 0, PED, 412, 2.5, 3, -6.1, L, *1~10 0, PED, 415, 2.2, 2, -6, L, *1~10

18
Table: Storyboard represent crash/near crash incidents involved pedestrian.
4.2.2 Bicycle Blocks In this thesis, bicycle is one of three defined blocks. The bicycle block is dynamic, and it can be controlled as inline and opposite direction vehicle. While mentioning the vehicle type, it needs to be denoted 36 there. Total 10 incidents are developed for the Bicycle blocks. First table 12, represents normal roadway traffic incidents while, table 13 will represent the crash incidents that relate with the bicycle.
Storyboard Code
50,V, 5, 75, 6, 1, 36, 3,-8,5,1
0,V#1, 15, 100, 3, 1, 36 150,A#2, 15,800, -3, 36
150,A#3, 15, 300, 5, 36 151,V#4, 20, 990, 0, 1, 36
100,V#8, 5, 800, 1, 1, 36, 3,4,4,1

19
751,V#5, 0, 700, 5, 1, 36 754,V#6, 0, 700, 4, 1, 36 757,V#7, 0, 700, 1, 1, 36
Table: Storyboard represents regular traffic incidents involve only bicycles
Storyboard Code
0, A, 3, 360, 6, 36, 2, -5, 1, 1, 3, 0, 0, 1 0,V, 5, 130, 5, 1, *1~20, 3,0,5,1 0,V, 5, 123, 5, 1, *1~20, 4,0,0,1 0,V, 5, 110, 5, 1, *1~20, 3,0,0,1 0,A, 10, 350, -5, *1~20 0,A, 5, 360, -5, *1~20 0,A, 5, 355, -5, *1~20
0, A, 5, 666, 3, 36, 1, 2.5, 1, 1, 3, 0, 0, 1 0,V, 5, 330, 5, 1, *1~20, 3,0,5,1 0,V, 5, 323, 5, 1, *1~20, 4,0,0,1 0,V, 5, 310, 5, 1, *1~20, 3,0,0,1 0,A, 5, 660, -5, *1~20 0,A, 5, 655, -5, *1~20
0,V, 5, 910, 5, 1, *1~20, 3,0,5,1 0,V, 5, 910, -5, 1, *1~20, 4,0,0,1 0,V, 5, 920, 5, 1, *1~20, 3,0,0,1 0,V, 5, 900, -5, 1, *1~20, 3,0,0,1 0,V, 5, 900, -5, 1, 36, 1,10,10,1
400, I, 0, 450, 0, 0, 0 400, CT, 450, 3, 0, 0, L, 1, 0 400, CT, 460, 3, 0, 0, R, 36, 0 0, A, 10, 1300, -6 {0}, *1~5, $3, 5 {6}, 5, 2, 3 {5}, 10 {7}, 5, 2
20
0,V, 10, 950, 5, 1, 36, 0.5,-10,15,1
Table: Storyboard represents crash/near crash traffic incidents involves bicycle
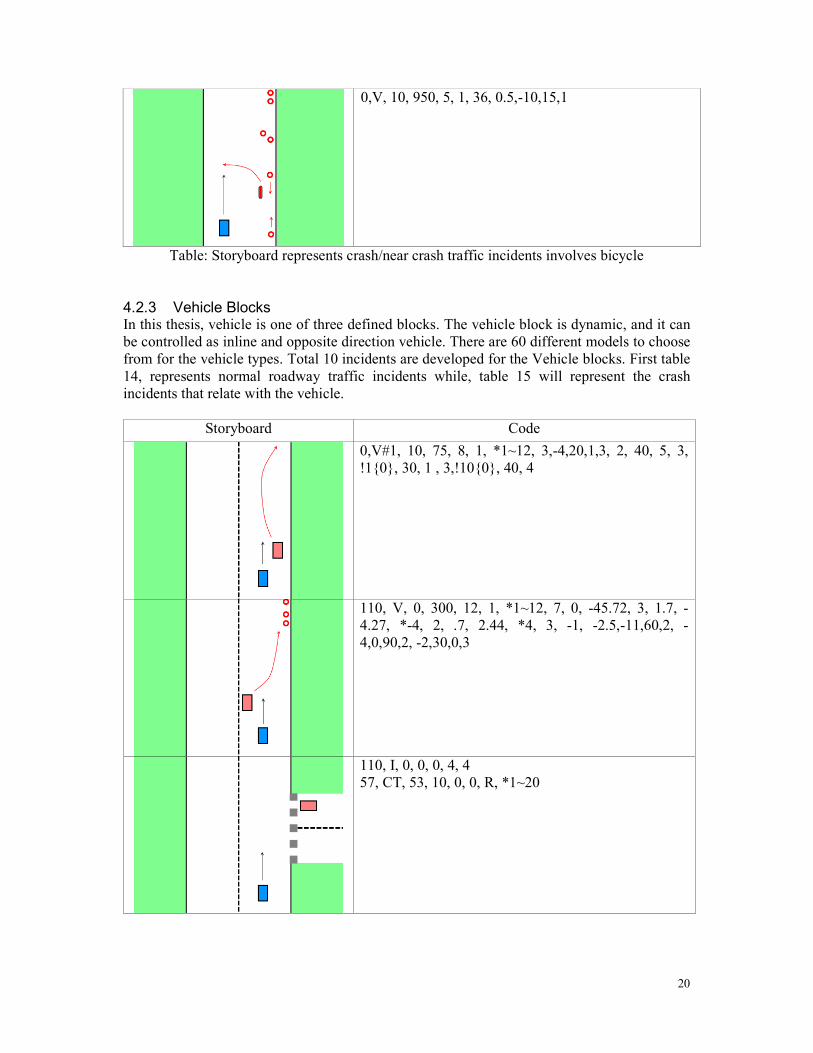
4.2.3 Vehicle Blocks In this thesis, vehicle is one of three defined blocks. The vehicle block is dynamic, and it can be controlled as inline and opposite direction vehicle. There are 60 different models to choose from for the vehicle types. Total 10 incidents are developed for the Vehicle blocks. First table 14, represents normal roadway traffic incidents while, table 15 will represent the crash incidents that relate with the vehicle.
Storyboard Code
0,V#1, 10, 75, 8, 1, *1~12, 3,-4,20,1,3, 2, 40, 5, 3, !1{0}, 30, 1 , 3,!10{0}, 40, 4
110, V, 0, 300, 12, 1, *1~12, 7, 0, -45.72, 3, 1.7, -4.27, *-4, 2, .7, 2.44, *4, 3, -1, -2.5,-11,60,2, -4,0,90,2, -2,30,0,3
110, I, 0, 0, 0, 4, 4 57, CT, 53, 10, 0, 0, R, *1~20
21
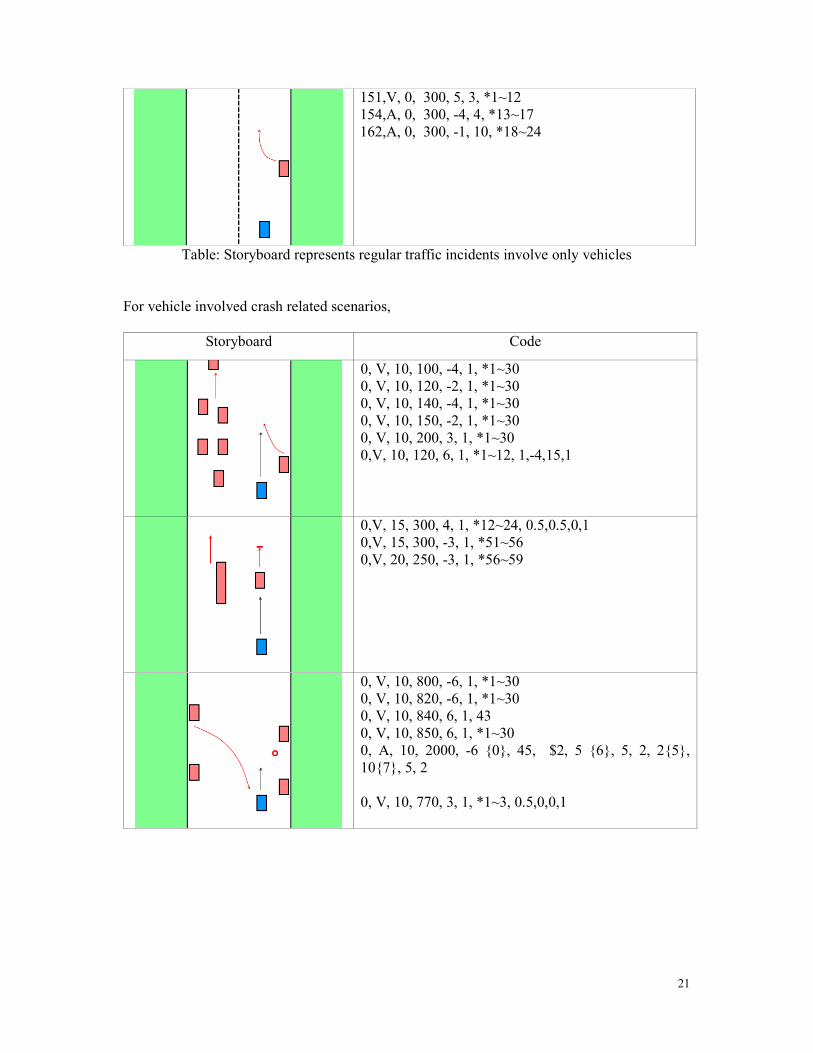
151,V, 0, 300, 5, 3, *1~12 154,A, 0, 300, -4, 4, *13~17 162,A, 0, 300, -1, 10, *18~24
Table: Storyboard represents regular traffic incidents involve only vehicles
For vehicle involved crash related scenarios,
Storyboard Code
0, V, 10, 100, -4, 1, *1~30 0, V, 10, 120, -2, 1, *1~30 0, V, 10, 140, -4, 1, *1~30 0, V, 10, 150, -2, 1, *1~30 0, V, 10, 200, 3, 1, *1~30 0,V, 10, 120, 6, 1, *1~12, 1,-4,15,1
0,V, 15, 300, 4, 1, *12~24, 0.5,0.5,0,1 0,V, 15, 300, -3, 1, *51~56 0,V, 20, 250, -3, 1, *56~59
0, V, 10, 800, -6, 1, *1~30 0, V, 10, 820, -6, 1, *1~30 0, V, 10, 840, 6, 1, 43 0, V, 10, 850, 6, 1, *1~30 0, A, 10, 2000, -6 {0}, 45, $2, 5 {6}, 5, 2, 2{5}, 10{7}, 5, 2 0, V, 10, 770, 3, 1, *1~3, 0.5,0,0,1

22
0, V, 15, 1300, 6, 1, 7, 1, -4, 20, 1, 1, 0, 0, 0.5
0,V, 15, 1100, -3, 1, 17, 0.5, 6, 30, 1 0,V, 15, 1120, 3, 1, *5~6, 0.5, 0, 0, 1
Table: Storyboard represents crash/near crash traffic incidents involves vehicles For saving the behaviour of objects and driven vehicle, save as a log files can be used, in our case, we wanted to see how the individual objects data created and checked the data afterwards. STISIM has fifty different parameters for help user to give which kind of values to work for. In our case, we have used time elapsed, parameter one and the 46 number, which gives specifically three different values of pre-defined objects.
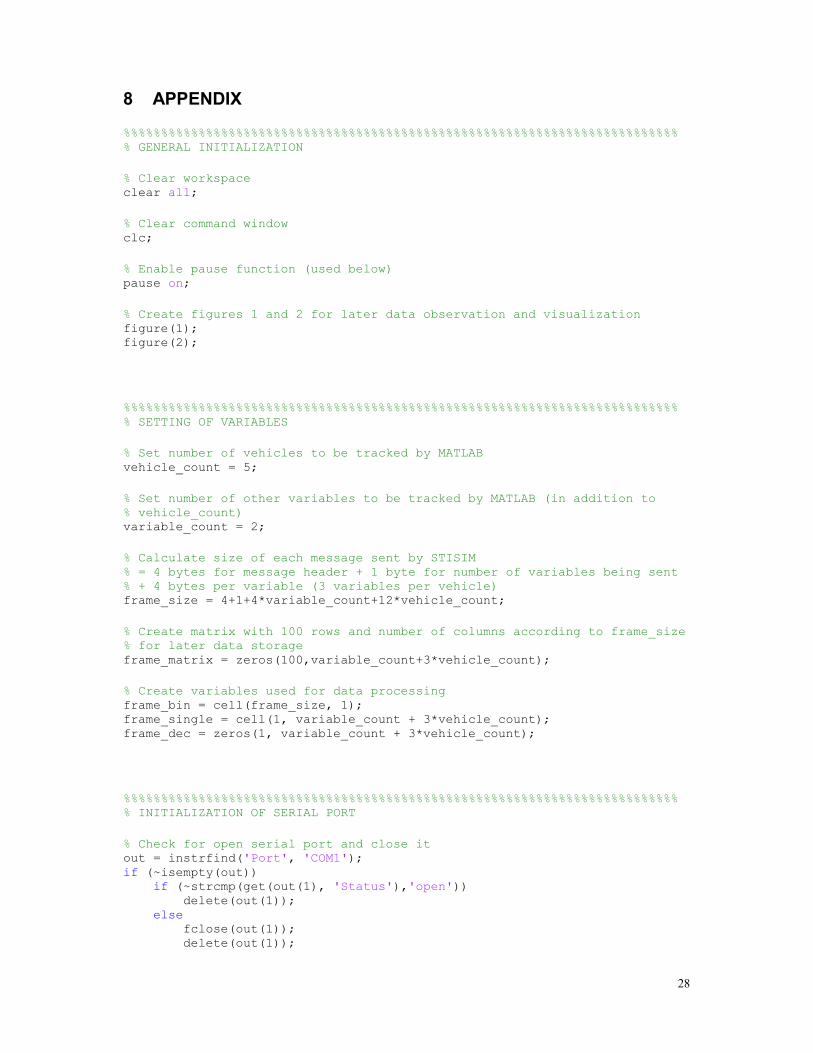
4.3 Real-time output in Matlab Matlab is used to generate realtime output of the simulator scenarios to create and control for example human machine interface prototypes later on. It can track multiple vehicle and multiple objects simultaneously. Before working with Matlab, the pre existing port and workspace need to close down for better work environment. In the initialization part, two different figures were created for observing the data. The first figure will track the object and it’s lateral speed and distance while second figure is used for observing the position of the vehicle in real-time. These figures are meant to be adapted to the needs of later studies. Declaring variable is important part of this experiment, here it clearly states which variable specified for which work. As the code is designed for multiple vehicle output simultaneously, before running the code, it can be changed according to STISIM’s data output. From STISIM through serial port, data were passing as in bytes and, 4 bytes at a time consist of one single value, that is needed for further calculation and assessment. For this reason, 4 bytes of transferred data result in one single value after data conversion. At this time, the variable “frame size” is created to define the size in bytes for each message including the header transferred from STISIM to Matlab and the matrix is created for storage the data which is used later to convert bytes to values in real-time.
% Set number of vehicles to be tracked by MATLAB vehicle_count = 5; % Set number of other variables to be tracked by MATLAB (in addition to % vehicle_count)
23
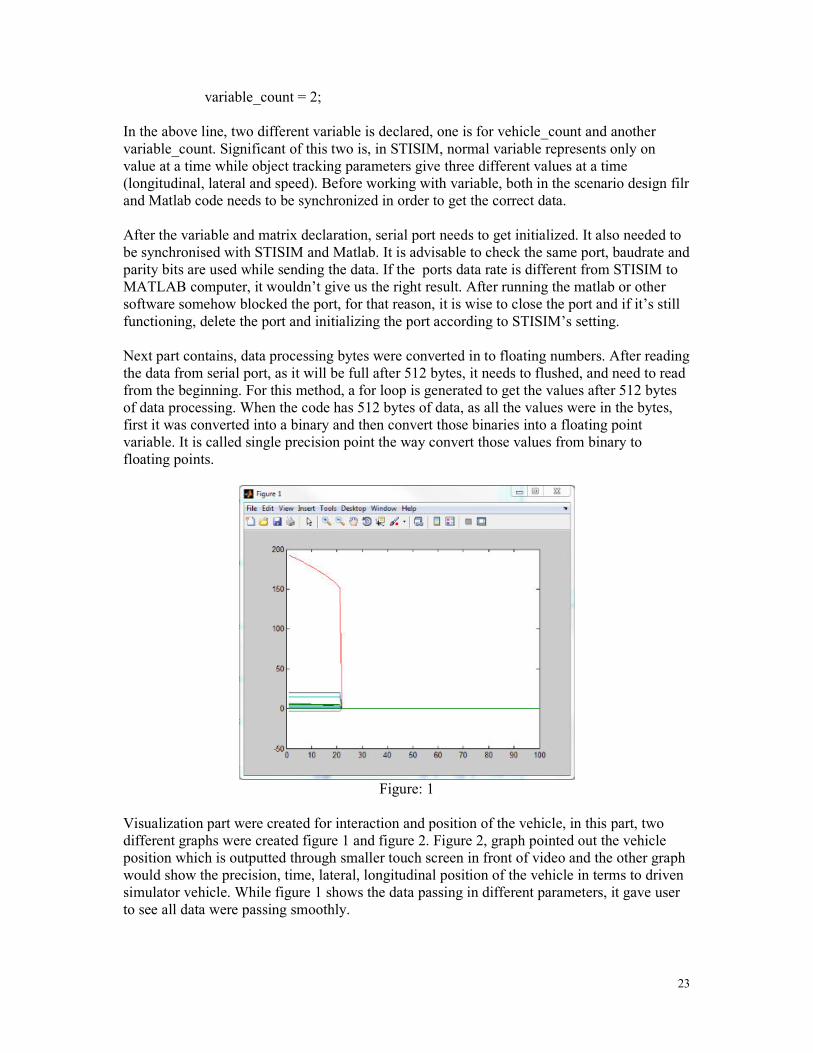
variable_count = 2; In the above line, two different variable is declared, one is for vehicle_count and another variable_count. Significant of this two is, in STISIM, normal variable represents only on value at a time while object tracking parameters give three different values at a time (longitudinal, lateral and speed). Before working with variable, both in the scenario design filr and Matlab code needs to be synchronized in order to get the correct data. After the variable and matrix declaration, serial port needs to get initialized. It also needed to be synchronised with STISIM and Matlab. It is advisable to check the same port, baudrate and parity bits are used while sending the data. If the ports data rate is different from STISIM to MATLAB computer, it wouldn’t give us the right result. After running the matlab or other software somehow blocked the port, for that reason, it is wise to close the port and if it’s still functioning, delete the port and initializing the port according to STISIM’s setting. Next part contains, data processing bytes were converted in to floating numbers. After reading the data from serial port, as it will be full after 512 bytes, it needs to flushed, and need to read from the beginning. For this method, a for loop is generated to get the values after 512 bytes of data processing. When the code has 512 bytes of data, as all the values were in the bytes, first it was converted into a binary and then convert those binaries into a floating point variable. It is called single precision point the way convert those values from binary to floating points.
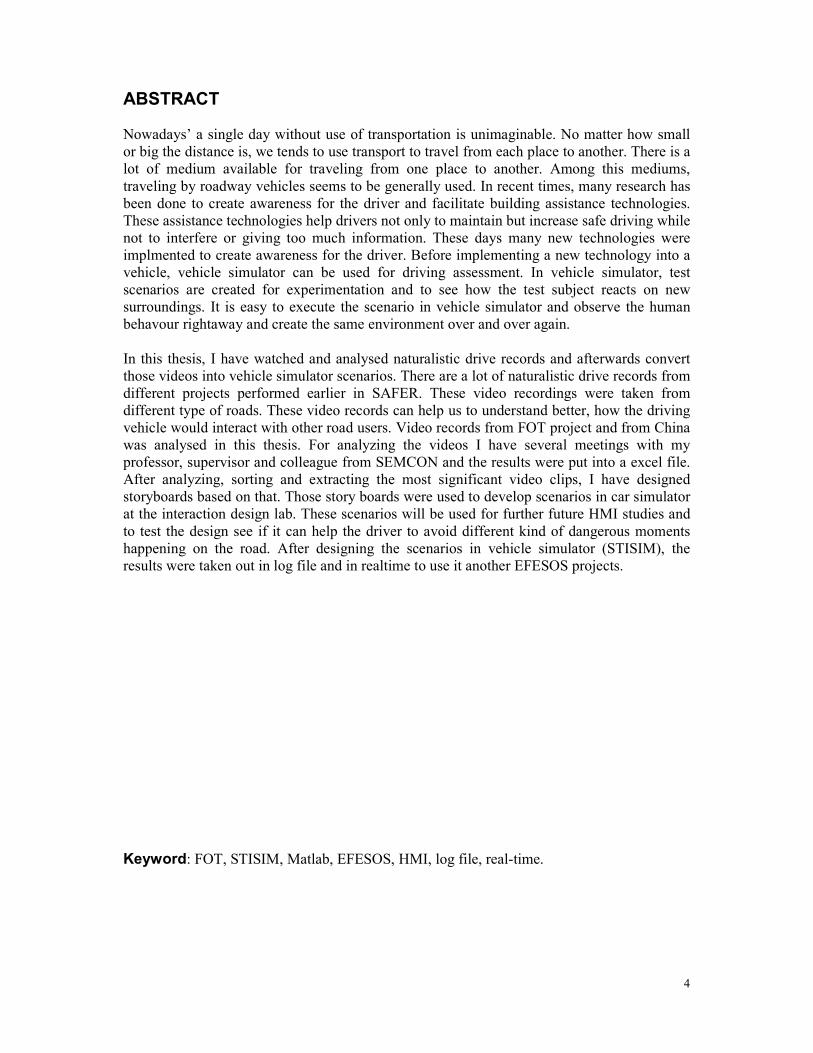
Figure: 1
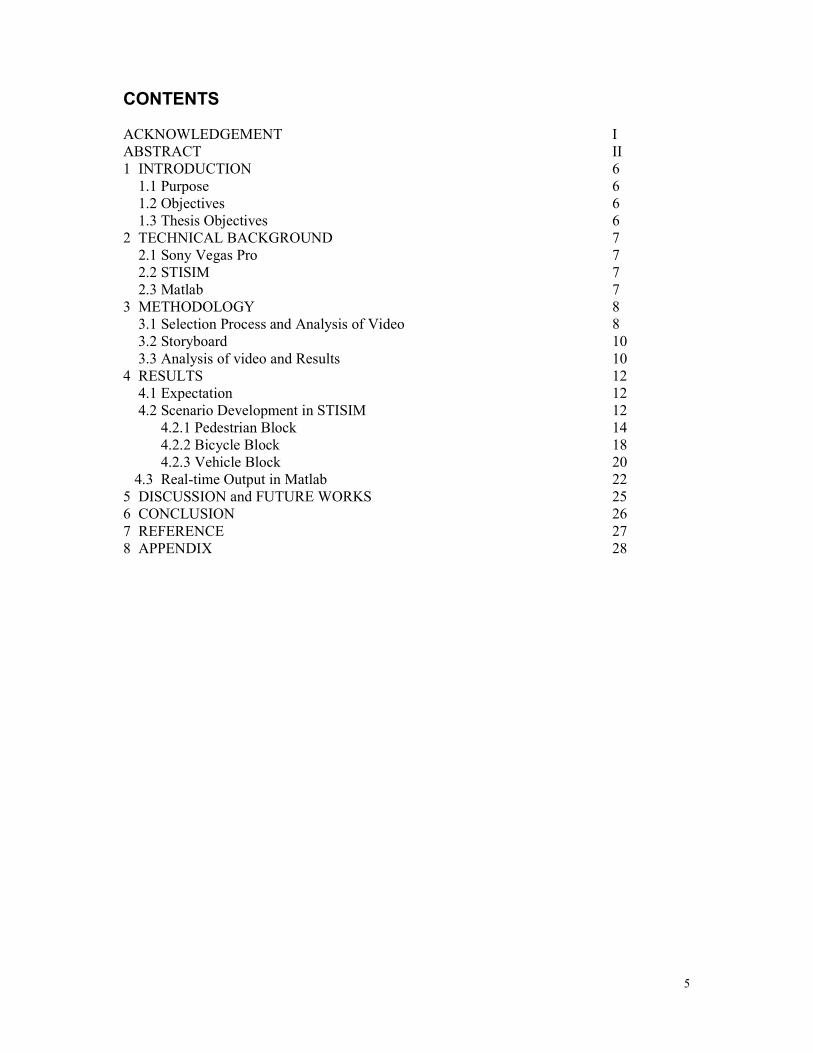
Visualization part were created for interaction and position of the vehicle, in this part, two different graphs were created figure 1 and figure 2. Figure 2, graph pointed out the vehicle position which is outputted through smaller touch screen in front of video and the other graph would show the precision, time, lateral, longitudinal position of the vehicle in terms to driven simulator vehicle. While figure 1 shows the data passing in different parameters, it gave user to see all data were passing smoothly.

24
Figure: 2
25
5 DISCUSSION and FUTURE WORKS This thesis included different parts, from video analyzing to scenario development in vehicle simulator and generating real-time output in Matlab. Analyzing 30 hours (approx) of naturalistic video clips was time consuming and required extensive meetings with colleagues. The video clips are categorized single frame availability of objects. The reason behind choosing single frame division is, it will be easy to distinguish and categorize the video clips easily for further study. After creating the video database, storyboards were created for better understanding and smooth implementation of video clips. In short sketches, it is easy to distinguish main characteristic and reason behind choosing that clip. As the main goal is to cover all sort of road traffic incidents. So, it is easy to distinguish the attributes from sketches. Sketches are built in block wise, so does the scenario in vehicle simulator. It is because, in future it can be easily use the vehicle simulator events in different study. Whether to built a longer 20 minutes scenario or just 1 minute long, it will help other study to understand it well. One other aspect was to show the data of behaviour of vehicle interms of other road objects, in log file and also in real-time. These two results are different and implemented differently in the simulator. This two type of results will give different observation in vehicle simulation study. The self-STISIM generated log-file contains the object behaviour, and is used for detailed study. While the real-time results help the study of response in real-time from test objects and showing the position of the objects while driving the vehicle simulator. In this study, there are some limitations when it comes to vehicle simulator. In vehicle simulator it has limited control over some of the dynamically moving objects like, pedestrian and cross sectional vehicle. The graphics of the vehicle simulator is not the best graphics program in today’s world. The recorded video is has limited data support, interms of position of other vehicle in the roadway traffic. In future, the levels of data that is generated from the vehicle simulator that can help other ongoing projects to find human behaviour during near crash and normal scenario. The generated data is extensive and detailed. There are different vehicle simulator available, many of the chosen scenario can be implement there and to compare between other simulator and to see how that is different and reason behind it. It will also help to choose between simulator for different type of study. Finally, implement a small dash board position system in front of the driver, so that he can actually see what is infront of his vehicle. This tool may become handy in the dark night or if there is so much dew in the roadway.
26
6 CONCLUSIONS The main goal of this thesis was divided into two major parts. At first, analyze, extract and sort out the naturalistic video clips and made a database where clips are distributed. Secondly, developed scenarios according to selected video clips and afterwards get the results in log file and real-time. There are many study has been conducted in the vehicle simulator but very few has been done in the likes of why realistic video records is important for developing the scenario in the vehicle simulator. It gave a naturalistic feel to developed scenarios in vehicle simulator and makes a comparison with the real video records. After the experiment, as the real world video records doesn’t have detailed data, the simulator study results can help generate related detail data in terms of vehicle and pedestrian positioning and tracking.
27
6 REFERENCE [1] Lindgren, A., Chen. F., Jordan, P.W., & Ljungstrand, P. (2007). Do you need assistance? – Naturalistic case studies investigating the need of Advanced Driver Assistance Systems during normal driving. [2] Maguire, M. (2001). Methods to support human-centered design. Int. J. Human-Computer Studies, 55, 587-634. [3] Alan Dix, Janet Finlay, Gregory D. Abowd. Human-computer interaction, 325-327 [4] link: http://www.sonycreativesoftware.com/vegaspro [5] link: http://www.stisimdrive.com/our-solutions/raampd-solutions/automotive.html?task=view [6] link: http://web.mit.edu/16.400/www/auto_sim/Help/SDL.htm [7] link: http://www.mathworks.com/products/matlab/description1.html [8] link: http://accad.osu.edu/womenandtech/Storyboard%20Resource/
28
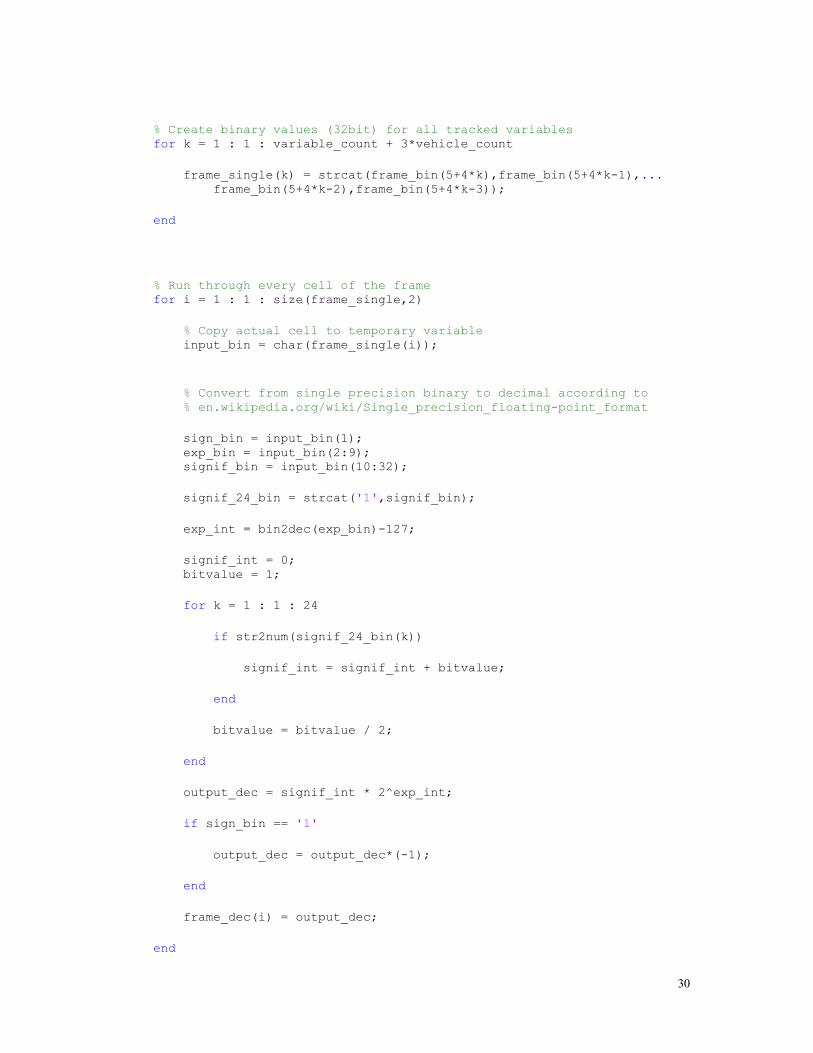
8 APPENDIX %%%%%%%%%%%%%%%%%%%%%%%%%%%%%%%%%%%%%%%%%%%%%%%%%%%%%%%%%%%%%%%%%%%%%%%%%% % GENERAL INITIALIZATION % Clear workspace clear all; % Clear command window clc; % Enable pause function (used below) pause on; % Create figures 1 and 2 for later data observation and visualization figure(1); figure(2); %%%%%%%%%%%%%%%%%%%%%%%%%%%%%%%%%%%%%%%%%%%%%%%%%%%%%%%%%%%%%%%%%%%%%%%%%% % SETTING OF VARIABLES % Set number of vehicles to be tracked by MATLAB vehicle_count = 5; % Set number of other variables to be tracked by MATLAB (in addition to % vehicle_count) variable_count = 2; % Calculate size of each message sent by STISIM % = 4 bytes for message header + 1 byte for number of variables being sent % + 4 bytes per variable (3 variables per vehicle) frame_size = 4+1+4*variable_count+12*vehicle_count; % Create matrix with 100 rows and number of columns according to frame_size % for later data storage frame_matrix = zeros(100,variable_count+3*vehicle_count); % Create variables used for data processing frame_bin = cell(frame_size, 1); frame_single = cell(1, variable_count + 3*vehicle_count); frame_dec = zeros(1, variable_count + 3*vehicle_count); %%%%%%%%%%%%%%%%%%%%%%%%%%%%%%%%%%%%%%%%%%%%%%%%%%%%%%%%%%%%%%%%%%%%%%%%%% % INITIALIZATION OF SERIAL PORT % Check for open serial port and close it out = instrfind('Port', 'COM1'); if (~isempty(out)) if (~strcmp(get(out(1), 'Status'),'open')) delete(out(1)); else fclose(out(1)); delete(out(1));
29
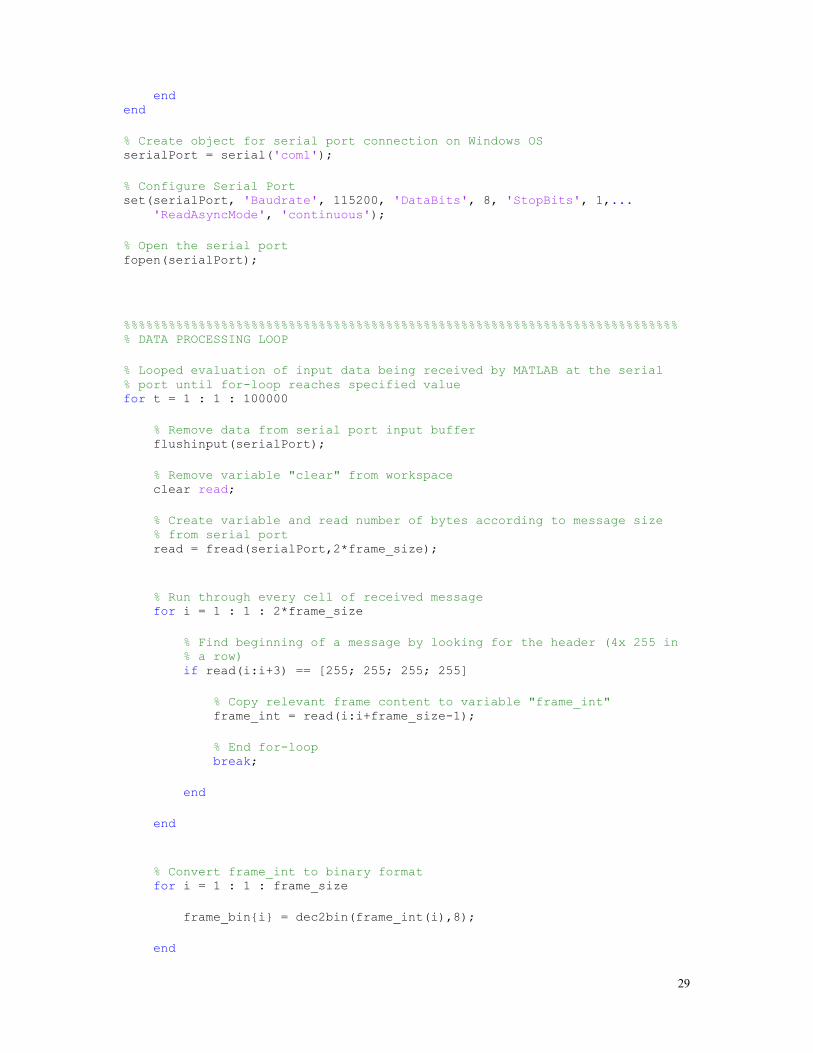
end end % Create object for serial port connection on Windows OS serialPort = serial('com1'); % Configure Serial Port set(serialPort, 'Baudrate', 115200, 'DataBits', 8, 'StopBits', 1,... 'ReadAsyncMode', 'continuous'); % Open the serial port fopen(serialPort); %%%%%%%%%%%%%%%%%%%%%%%%%%%%%%%%%%%%%%%%%%%%%%%%%%%%%%%%%%%%%%%%%%%%%%%%%% % DATA PROCESSING LOOP % Looped evaluation of input data being received by MATLAB at the serial % port until for-loop reaches specified value for t = 1 : 1 : 100000 % Remove data from serial port input buffer flushinput(serialPort); % Remove variable "clear" from workspace clear read; % Create variable and read number of bytes according to message size % from serial port read = fread(serialPort,2*frame_size); % Run through every cell of received message for i = 1 : 1 : 2*frame_size % Find beginning of a message by looking for the header (4x 255 in % a row) if read(i:i+3) == [255; 255; 255; 255] % Copy relevant frame content to variable "frame_int" frame_int = read(i:i+frame_size-1); % End for-loop break; end end % Convert frame_int to binary format for i = 1 : 1 : frame_size frame_bin{i} = dec2bin(frame_int(i),8); end
30
% Create binary values (32bit) for all tracked variables for k = 1 : 1 : variable_count + 3*vehicle_count frame_single(k) = strcat(frame_bin(5+4*k),frame_bin(5+4*k-1),... frame_bin(5+4*k-2),frame_bin(5+4*k-3)); end % Run through every cell of the frame for i = 1 : 1 : size(frame_single,2) % Copy actual cell to temporary variable input_bin = char(frame_single(i)); % Convert from single precision binary to decimal according to % en.wikipedia.org/wiki/Single_precision_floating-point_format sign_bin = input_bin(1); exp_bin = input_bin(2:9); signif_bin = input_bin(10:32); signif_24_bin = strcat('1',signif_bin); exp_int = bin2dec(exp_bin)-127; signif_int = 0; bitvalue = 1; for k = 1 : 1 : 24 if str2num(signif_24_bin(k)) signif_int = signif_int + bitvalue; end bitvalue = bitvalue / 2; end output_dec = signif_int * 2^exp_int; if sign_bin == '1' output_dec = output_dec*(-1); end frame_dec(i) = output_dec; end
31
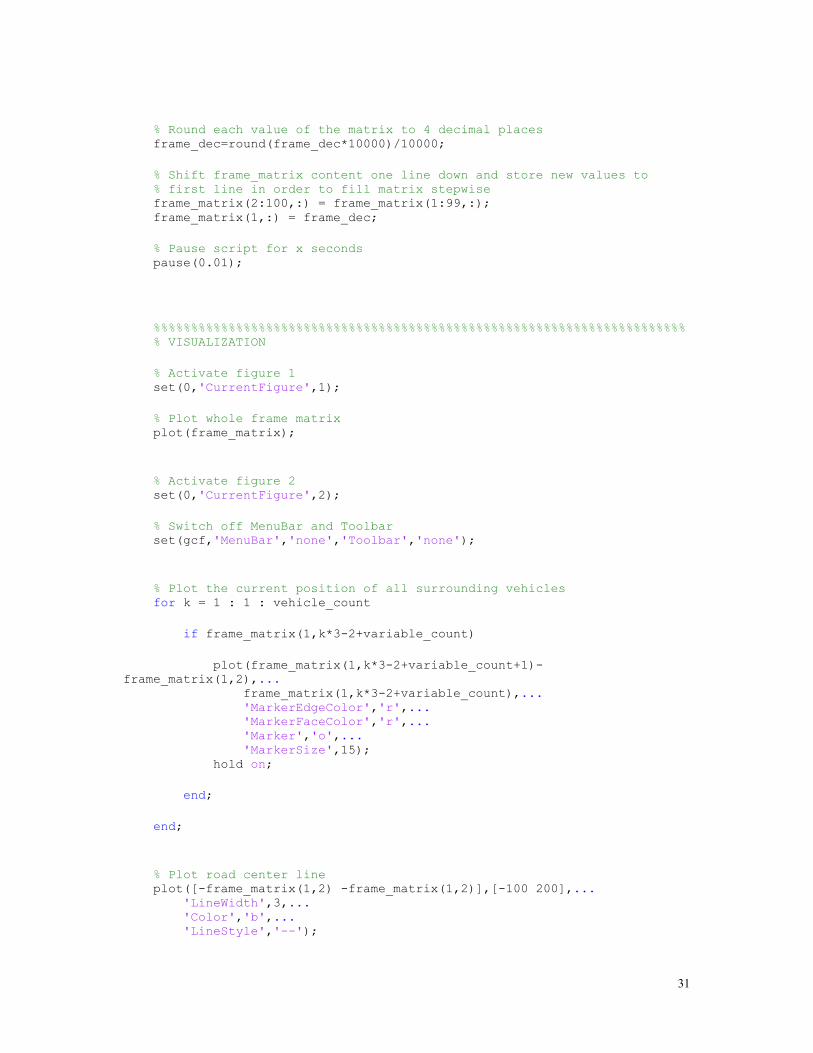
% Round each value of the matrix to 4 decimal places frame_dec=round(frame_dec*10000)/10000; % Shift frame_matrix content one line down and store new values to % first line in order to fill matrix stepwise frame_matrix(2:100,:) = frame_matrix(1:99,:); frame_matrix(1,:) = frame_dec; % Pause script for x seconds pause(0.01); %%%%%%%%%%%%%%%%%%%%%%%%%%%%%%%%%%%%%%%%%%%%%%%%%%%%%%%%%%%%%%%%%%%%%%% % VISUALIZATION % Activate figure 1 set(0,'CurrentFigure',1); % Plot whole frame matrix plot(frame_matrix); % Activate figure 2 set(0,'CurrentFigure',2); % Switch off MenuBar and Toolbar set(gcf,'MenuBar','none','Toolbar','none'); % Plot the current position of all surrounding vehicles for k = 1 : 1 : vehicle_count if frame_matrix(1,k*3-2+variable_count) plot(frame_matrix(1,k*3-2+variable_count+1)-frame_matrix(1,2),... frame_matrix(1,k*3-2+variable_count),... 'MarkerEdgeColor','r',... 'MarkerFaceColor','r',... 'Marker','o',... 'MarkerSize',15); hold on; end; end; % Plot road center line plot([-frame_matrix(1,2) -frame_matrix(1,2)],[-100 200],... 'LineWidth',3,... 'Color','b',... 'LineStyle','--');
32
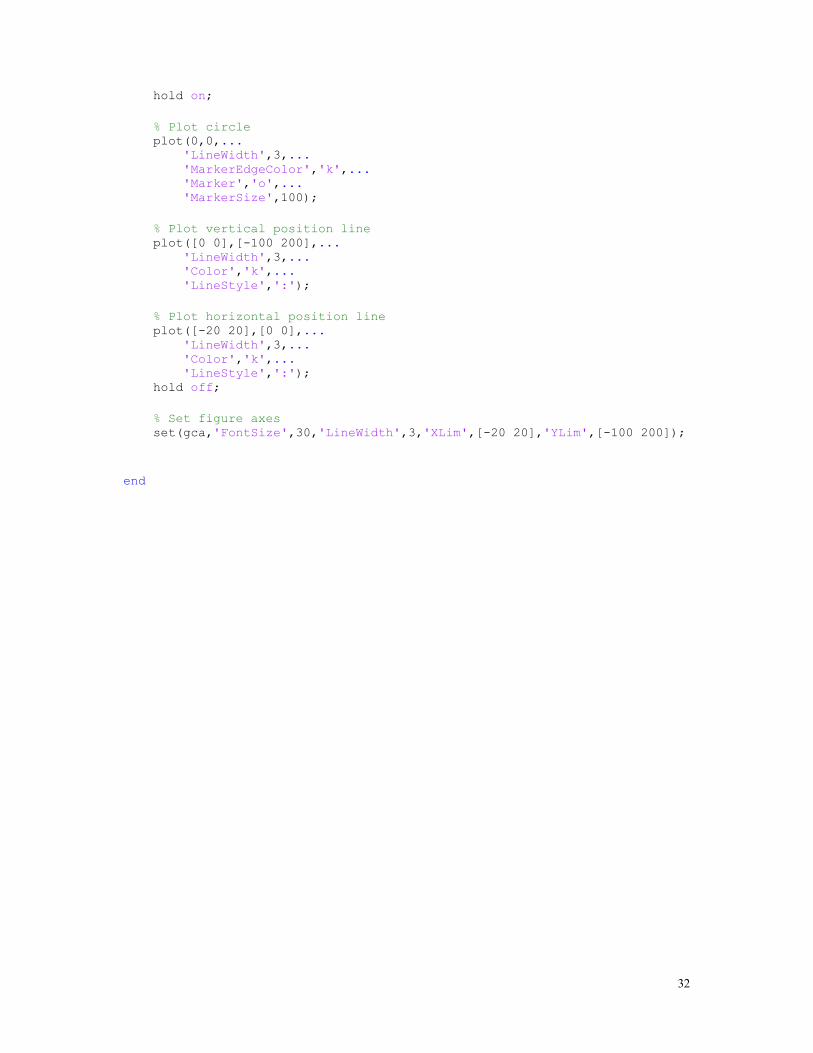
hold on; % Plot circle plot(0,0,... 'LineWidth',3,... 'MarkerEdgeColor','k',... 'Marker','o',... 'MarkerSize',100); % Plot vertical position line plot([0 0],[-100 200],... 'LineWidth',3,... 'Color','k',... 'LineStyle',':'); % Plot horizontal position line plot([-20 20],[0 0],... 'LineWidth',3,... 'Color','k',... 'LineStyle',':'); hold off; % Set figure axes set(gca,'FontSize',30,'LineWidth',3,'XLim',[-20 20],'YLim',[-100 200]); end