Embed Size (px)
Citation preview

Generalizing Power Transitions as a Cause of Warby
Erik Fogg
Submitted to the Department of Political Science in Partial Fulfillment of the Requirements for the Degrees of
Bachelor of Science in Political Scienceand
Master of Science in Political Scienceat the Massachusetts Institute of Technology, June 2009
© 2009 Erik Fogg. All Rights ReservedThe author hereby grants to MIT permission to reproduce and distribute publicly paper and electronic copies of this document in whole or in part
in any medium now known or hereafter created.
Signature of Author..........................................................................................................................................Department of Political Science
May 21, 2009
Certified by......................................................................................................................................................Gabriel Lenz
Professor of Political ScienceThesis Supervisor
Certified by......................................................................................................................................................Roger Petersen
Professor of Political ScienceSecond Reader
Accepted by......................................................................................................................................................Charles Stewart III
Head, Political Science Department
Accepted by......................................................................................................................................................Roger Petersen
Chair, Graduate Student Committee
1

2

ACKNOWLEDGEMENTS
The author would like to offer his most sincere thanks to the following individuals: Thanks to Dennis Perepelitsa, Christian Ternus, and Greg Echelberger, for critical assistance in data-collection and organization. Thanks to Professor M. Taylor Fravel for advice, direction, and wisdom throughout the formative stages of the thesis. Thank you to MIT's generous donors for making my academic pursuits financially possible. Thank you to my Professors in Political Science for stimulating discussion, enlightening instruction, and the cultivation of my skills and interests as a social scientist. Thank you to Tobie and Scott, for rapid-response help, administrative and personal guidance, and friendship throughout the ordeal that is graduate school. Thank you to my friends for companionship, emotional support, and care when times were tough. Thank you to Kathleen for particular attention to my sanity, happiness, and comfort when I let all three slip. Thank you to my parents and grandparents for encouragement of and pride in my dreams, tolerance of my difficulties, and generous financial and logistical support. Thank you to Professor Roger Petersen, who graciously agreed to take the time to be not only my second reader, but a great advisor in the last year of the project. Thank you finally to Professor Gabriel Lenz, by thesis advisor, for single-handedly fostering my transformation into a competent and inspired social scientist, for guiding my thesis from malformed idea into a coherent and compelling argument, for generously dedicating countless hours to advising and supporting the project, for sagelike guidance, and for being both my greatest supporter and toughest critic over the past two years.
3

4

ABSTRACT
In this thesis, I ask three questions about the nature of power transition theory. First, I ask whether power transition theory can be generalized beyond identification of great powers or regional hierarchies. Lemke and Werner introduce the concept of a multiple hierarchical order, in which mutually relevant regional powers can go to war over dissatisfaction with a regional status quo. I submit that this concept can be generalized into a continuous concept to include all states within the umbrella of the theory. Second, I ask how often status quo states initiate war in power transition cases. Jack Levy explains that status quo states have a motive to launch a preemptive war against a revisionist state, before it becomes too powerful to defeat. I submit that these motivations lead to a high incidence of status quo actor-initiated war in power transitions. Finally, I ask whether the rate of change of relative power matters during a transition period. I hypothesize that quick changes in the relative difference in power between two states would create a fast-closing window of opportunity. This closing window creates a crisis and motivates leaders to move quickly, leading to a higher probability of avoidable war. Incorporation of rate of power transition could explain war in power transition cases yet to achieve true parity, or even explain peace in a period of parity and revisionism. To test these questions, I create a large, inclusive (571,000+ N) dataset of nearly all dyads between 1821 and 2001, using the Correlates of War Composite Index of National Capabilities as the basis of power independent variables, and a composite of distance and power measurements to determine the relevance independent variable. I run a number of regressions of the power and relevance independent variables against the onset of war. I reach decisive conclusions about the nature of power dynamics in the international system, and propose their incorporation into the power transition literature. Generalized, continuous measurements of relevance, parity, and rate of change of power transition increase the explanatory power of the model; the revisionist state does not always or even usually provoke power transition war; finally, higher rates of power transition lead to a higher probability of war. The thesis ends with a number of shortfalls with the model I propose, and a number of further revisions and expansions of power transition theory.
5

6

Introduction
The purpose of this thesis is to better understand the causes of interstate war so that policymakers
may predict and prevent future conflicts. To that end, this paper tests and develops the structural causes of
war as proposed by power transition theory. A.F.K. Organski (1958)1 introduces power transition theory
as a challenge to the prevailing realist theory, balance of power. He hypothesizes that a balance of power
does not lead to peace among international powers—to the contrary, power parity leads to war, especially
when one great power overtakes the dominant power in the international system. Organski and Kugler
(1980)2 explain that the dominant power in the international system uses its might to create an
international order, with which a rising challenger may be dissatisfied. If the challenger is dissatisfied, it
is likely to try to unseat the dominant power and revise the international order once it has the capability to
do so—that is, when it has achieved power parity. Mearsheimer contends that the very structure of the
international system prevents all states from being satisfied (status quo) powers; for the sake of their own
security, states will seek power or revisions in international structures.3 William Reed (2003)4 reasons that
power parity is a particularly dangerous point in a power transition because information asymmetries are
highest in this period, and states are thus unable to correctly measure each other’s relative capability and
will. Houweling and Siccama (1988)5 re-analyze Organski and Kugler’s work to show that power
transitions happen among all great powers—not just the dominant state and a challenger—because all
great powers influence the international order.
I summarize power transition theory in its current state as such:
1 A.F.K Organski, World Politics, 1958.
2 A.F.K Organski, Jacek Kugler. The War Ledger, 1980.
3 John Mearsheimer, The Tragedy of Great Power Politics, pp 42-53.
4 William Reed, “Information, Power, and War,” 2003.
5 Henk Houweling, Jan Siccama, “Power Transitions as a Cause of War,” 1988.
7

Power Transition → WarX
RelevanceX
Revisionism/Dissatisfaction,
which states that power transitions lead to war when the two states in the dyad are mutually relevant and
one of the states is “revisionist,” or dissatisfied with the status quo. Relevance and revisionism are
antecedent conditions, meaning that they influence the probability of observing the dependent variable
(war) but only when the independent variable (power transition) is significantly present. Relevancy is a
concept that describes whether two states are important enough to each other such that their relative
power matters—Germany and France are quite mutually relevant, Nicaragua and Madagascar are not.
A strong base of academic empirical support shows that power transition theory explains a
significant proportion of great power interstate war over centuries in the entire international system.
Examples include both World Wars, the Napoleonic wars, Franco-Prussian wars, the 100-years war, and
more.6 Various large-N and case studies have shown statistically significant effects of power transition on
interstate war with many measurements of state power and many operationalizations of transition. Kim
uses GNP as a measure of power to show that power transitions have led to war among great powers as
far back as the 1600s.7 DeSoysa, O’Neal, and Park show that power transition theory explains war using
multiple alternative measures of power.8 Tammen, et al. use GDP as a measurement of power over
multiple case studies to show how power transitions caused the Franco-Prussian War, World Wars I and
6 Woosang Kim, “Power Transitions and Great Power War from Westphalia to Waterloo,” 1992; Woosang Kim, James D Morrow, “When do Power Shifts Lead to War?,” 1996; Suzanne Werner, Jacek Kugler. “Power Transitions and Military Buildups,” 1996; Douglas Lemke, Suzanne Werner, “Power Parity, Commitment to Change, and War,” 1996; Douglas Lemke, “The Continuation of History: Power Transition Theory and the End of the Cold War,” 1997; Indra DeSoysa, John R. O’Neal, Yong-Hee Park, “Testing Power-Transition Theory Using Alternative Measure of National Capabilities,” 1997; Tammen, et al, Power Transitions, 2000.
7 Kim (1992)
8 DeSoysa, O’Neal, Park (1997). The measurements used are GDP and the Correlates of War Composite Index of National Capabilities (available at http://www.correlatesofwar.org), the latter of which takes GNP, population, urban population,
8

II, the Iran-Iraq War, and the Cold War (in particular, its lack of eruption).9 But does the theory in its
current state correctly identify all or most cases of power transition war? I contend that power transition
theory has much more explanatory power than has yet been shown, and that more wars in history were
caused by power transitions than are currently understood.
To explore this, I ask three questions about the nature of power transition theory. First, I ask
whether power transition theory can be generalized beyond identification of great powers or regional
hierarchies. Lemke and Werner introduce the concept of a multiple hierarchical order, in which mutually
relevant regional powers can go to war over dissatisfaction with a regional status quo.10 I believe this
concept can be generalized to include all states within the umbrella of the theory. Second, I ask how often
status quo states initiate war in power transition cases. Jack Levy explains that status quo states have a
motive to launch a preemptive war against a rising revisionist state, before the revisionist state becomes
too powerful to defeat. The inclusion of these cases will increase the accuracy of our assessments of the
causes of war.11 Finally, I ask whether the rate of change of relative power matters during a power
transition period. It seems reasonable that very quick changes in the relative difference in power between
two states would create a quickly closing window of opportunity to act. The quickly-closing window
creates a sense of crisis and motivates leaders to move quickly, leading to a higher probability of
avoidable war. It seems also reasonable that slower power transitions will lead to longer periods in parity,
and thus more opportunities to go to war—I explore exactly how rate of power transition affects war.
Incorporation of rate of power transition could explain war in power transition cases yet to achieve true
parity, or even explain peace in a period of parity and revisionism.
9 Tammen, et al (2000), pp 49-60, 76.
10 Lemke, Werner (1996).
11 Levy, Jack (1987)
9

The rest of this paper introduces the research question by describing the three hypotheses about
the nature of power transitions that would increase the accuracy and scope of the theory as a tool. The
paper continues by explaining the methodology behind a large-N empirical analysis of all three
hypotheses, using restructured databases of state attributes between 1821 and 2001 as a case set. The next
section uses the case set to test the validity of all three hypotheses. In these tests, I find that power
transition theory has greater explanatory power than previously thought. Each hypothesis, when tested,
successfully increases the explanatory power of the model, as well as the validity of the generalized
power transition model as a whole. All three of these hypotheses expand the explanatory force of power
transition theory and increase its accuracy in identifying the onset of interstate war. The final section
concludes that power transition theory very accurately explains a large proportion of all wars—enough so
to suggest that the theory could potentially be used to predict dangerous power transition moments in the
future. Continued advances in scope and accuracy can make power transition theory an increasingly
powerful tool for policymakers in predicting—and thus preventing—the potential onset of interstate war.
Regional Hierarchies and the Continuous Mutual Relevance Model
This paper’s first question addresses the condition of relevancy in power transition theory. The
Lemke and Werner (1996) inception of the multiple hierarchy model is a groundbreaking step in
expanding the scope of the theory: the model shows that power transitions explain a significant proportion
of war in great and middle powers, due to the existence of multiple regional orders over which states can
fight. Lemke and Werner use literature on relevant dyads to identify regions where a group of states are
mutually relevant. Relevancy, in general, refers to states that can influence each other’s behavior through
incentives—usually, the threat of force. In general, we tend to think of relevant states as large and
proximal, constantly negotiating and jockeying to change each other’s behavior and the structure of their
10

international or regional system.12 We can see immediately that such jockeying has the potential to lead to
war, where states that have no such competition are unlikely to find conflicts to fight over. In 1995,
Lemke introduces a new measurement of proximity (which goes beyond mere contiguity, as in the past)
based on power projection capabilities to measure mutual relevance.13
To identify regions, Lemke and Werner use the methods of Lemke (1995) to measure the power
projection capabilities of each state, based on the state’s capabilities, the proximity of other states, and the
terrain features of the region.14 Where these spheres of power projection capability overlap, Lemke and
Werner create a case set of local hierarchies (that are somewhat time-dependent) in South America, and
Lemke (2000) creates a case set that encompasses most of the entire modern world (except for Europe
and North America).15 He tests power transitions as causes of war within these hierarchies, to great
empirical success. The multiple hierarchy model also appears in Tammen, et al. to explain the Iran-Iraq
war, the Korean peninsula conflict, the Vietnamese war, and the Indo-Pakistani wars.16 By breaking the
world into multiple small hierarchies, Lemke and Werner successfully expand the scope and accuracy of
the theory.
The multiple hierarchy model suffers from a specific problem. By breaking the world into such
parts, one creates a binary model of what is ultimately a continuous concept. The power projection
capabilities of a state drop off in a continuous way over distance (logarithmically, according to Lemke),
rather than instantaneously, and the mutual relevancy of states can be thought of as a continuous concept.
12 Lemke, Reed (2001).
13 Lemke (1995).
14 In Lemke, Werner (1996), the authors model power projection as capability logarithmically declining over distance, adjusted by the number of miles per day that could be travelled on that terrain at that time. They cite such documents as missionary records (See Lemke (1995)) to determine historical force movement speeds.
15 Douglas Lemke, Regions of War and Peace, 2002, pp 90-91.
16 Tammen, et al., 2000, pg 76.
11

Therefore, to break the world into multiple hierarchies requires creating thresholds of power projection: if
the power projection is too low, the multiple hierarchy model decides simply that the states do not
influence each other’s regional orders, and therefore no revisionism can arise. But given that the drop-off
of power projection is continuous, it seems logical that the mutual influence of two states on each other’s
regional orders drops continuously, rather than instantaneously. That is, we should not ask whether two
states influence each other’s regional orders, but by how much. In short, we do not want to measure
whether two states are mutually relevant; we want a continuous measure of their mutual relevance. An
example of where this binary distinction fails is between China and India: due to the existence of the
Himalayas, Lemke places these two states into separate regional orders. But their 1962 war—long before
either was a dominant world power—is explained by Sushil Kumar to be a power transition war; the two
states entered war when they were near power parity.17
To avoid these failures, we must generalize the concept of the international order. Rather than
choosing between one international order and many discrete ones, we must admit that regions “bleed”—
in the Sino-Indian war example, war crossed the Himalayas because each state had sufficient power to
influence and threaten the other. I contend that the international order should be reconceptualized.
Generalizing upon the findings of Organski and Kugler: if a state is dissatisfied with pressures and rules
imposed on its behavior (that is, the aggregate influences of the states most relevant to it; or the
geographical order), it will pressure the states most relevant to those rules to change them. Lemke and
Werner showed that the states most relevant to the pressures and rules imposed on another are not
necessarily the dominant powers. Expanding on Lemke and Werner’s regional hierarchy work, I contend
that the states most relevant to those rules may not necessarily be within a discrete region. I hypothesize
instead that each state influences another based on its power and proximity. Neighboring states tend to
influence each other’s behavior, and very powerful states influence many more states than less powerful
17 Sushil Kumar. “Power Cycle Analysis of India, China, and Pakistan in Regional and Global Politics,” 2003.
12

ones. I call this conceptualization of the international order “the continuous mutual relevance model.”
We can operationalize this idea by saying that, within a dyad, the influence of state A on state B is equal
to the combination of state A’s power and the proximity of A and B; state B’s influence on state A is
equal to the combination of state B’s power and the same proximity of A and B. All states have some
level of influence on each other (from anything as simple as a comparative advantage in textiles to a vote
in the UN); for the purposes of predicting interstate war, we are concerned with how much.
Such a metric would scale to make states like France and Germany highly influential upon each
other, while Oman and Venezuela would have almost no mutual influence. It would also explain why
China and the United States could experience power transitions (due to overwhelming power), and why
Iraq and Iran have in the past (due to very close proximity). This scalar concept causes a continuously
scaling probability of war within the dyad, such that dyads of high mutual influence have a high
probability of going to war during a power transition. States with very disparate levels of power will have
disparate levels of influence on each other, but they also have an extremely low likelihood of going to war
over power transition motivations.
There are specific cases that this model will correctly incorporate where other models have not; in
the Sino-Indian war example, the multiple hierarchy model fell short. Additionally, the Russo-Japanese
wars and Spanish-American war are likely power transition cases also missed by the multiple hierarchy
model and potentially incorporated by the continuous mutual relevancy model. The multiple hierarchy
model incorporates power transition wars that occur between regional powers that the original power
transition model missed. The continuous mutual relevancy model incorporates cases where the proximity
or power of a dyad alone are insufficient to fit in either of the previous models, but whose proximity and
power together interact to cause a power transition war.
13

Status Quo Power-Initiated Preventative War
This paper’s second question relates to the relationship between revisionism and war. According
to Lemke (2000), the conventional wisdom of power transition theory predicts that the rising state will
initiate war. Lemke states that the rising state does not always initiate or declare a power transition war,
but indeed indeed usually provokes that war.18 I contend that while the dominant state need not fight to
change the status quo, it may nonetheless initiate a war in its own self-interest. Dominant states are not
necessarily caught off-guard by a revisionist state—to the contrary, revisionist states often signal their
revisionism and make claims in hopes of bullying some portion of their demands out of the dominant
states.19 Jack Levy describes the following calculus: given the strength of strategic considerations in any
war, a dominant state may certainly decide that waging war early—while the rising state is still weak—is
a better idea than waiting and risking a war when the rising state is much stronger. Even if war is not
inevitable, fighting an easy war might well be better than submitting to the power of a state that grows to
dominate the system. While war is terrible, declining states are often stuck in a crisis, choosing between
two bad options, and observe a closing window of opportunity—the longer the declining state waits, the
worse its war will be, and it thus feels a great deal of pressure to act quickly. This reduces the time
necessary to reach a decision, and leads to more erratic decision-making—often, this leads to war.20
Examples of preventative war in power transition situations potentially include a number of the
Arab-Israeli wars, and Germany’s declarations of war against rising Russia in both World Wars. Given
that declining states have a motivation to declare war on rising, revisionist states, this paper will seek to
discover what proportion of the time that the rising state does declare war in a power transition. I intend
to show that while power transition theory traditionally concentrates on wars initiated by the revisionist
18 Douglas Lemke, Regions of War and Peace, 2002, pg 28.
19 David C. Kang, “Getting Asia Wrong,” 2003.
20 Jack S. Levy, “Declining Power and the Preventative Motivation for War,” 1987.
14

state, the theory’s explanatory power would be increased by inclusion of dominant state-initiated
preventative wars.
The paper will also explore whether it is possible to predict which state will initiate the war. If the
war originator can be effectively predicted, then peacekeeping efforts can be better prioritized; if all
peacekeeping efforts in power transition periods are spent on preventing the rising state from launching a
war, then these efforts may in fact enable the dominant state to launch a lower-risk preventative war, thus
increasing the risk of war overall. Policymakers should be armed with the tools necessary to avoid these
kinds of mistakes.
Rate of Change of Difference in Power and Transitional Crises
The third question of this paper addresses the meaning of a power transition. Traditionally, a
power transition was simply measured by power parity between two states, but I assert that this
measurement is insufficient.
The literature on rate of power transition is scant; Alsharabati (1997) concludes that slower power
transitions increase the probability of war because a dyad remains in parity for longer, and thus has more
time for a spark to cause conflict21. Other literature has been similarly suggestive, but discussion and
empirical evidence remain sparse.
I suggest that higher rates of power transition also provoke motivations for war; these two
motivators may compete, and one may be dominant. I have already established that declining states have
a preventative motivation to declare war to hedge against the risk of defeat or subordination later. Given
that they have a closing window of opportunity to act—that declaring war later means a constantly-
21 Alsharabati, Dynamics of War Initiation, 1997.
15

decreasing military advantage22—then we can also surmise that the faster this window closes, the greater
the crisis to act. Such crises, even if they do not lead to war, may motivate a state to take great measures
to prepare for war (by mobilizing, purchasing arms, moving troops toward the border, etc) that are likely
to decrease the security of the revisionist state, who will respond in kind—a classic case of a security
spiral23. Such crises to act are certainly influenced by the speed in which the balance of power shifts—a
state that is rapidly expanding its army is more worrisome than a state more slowly expanding its army,
and in the latter case, the threatened state has more time to think or negotiate before its security is
completely compromised. When it has no time to reach decisions or negotiate with the rising power, it is
driven to act—either by attacking (in preventative warfare) or by trying to rapidly bolster its own
defenses. Slowing down one’s expansion or mobilization will put it at a disadvantage if a war occurs, and
states are thus unlikely to halt such military buildups on the mere promise of another state that it will do
the same24.
When states have less time to act, the magnitude of these crises increases, and the ability to
negotiate decreases. The dominant state, confident that the revisionist state will meet it in power and
challenge it in some way, rapidly builds its defenses and falls folly to a perceived closing window of
opportunity to put down the rising state before it reaches parity. The revisionist state, aware that it will
soon overtake the dominant state in power (and thus bargaining ability) will resist calls to negotiate,
hoping always to negotiate later as its relative power grows, and constantly aware that the dominant state
may preemptively strike25. The state of tension means that even a small spark of conflict could quickly
22 Van Evera, 1998.
23 The security spiral is a behavior described by two states entering an unintended arms race by purely defensive motivations, as each state perceives the other’s armaments to undermine its own security. See Robert Jervis, Perception and Misperception in International Politics, 1976.
24 Jervis, Robert (1978).
25 Kugler, Lemke (1996).
16

escalate into full-fledged war. In power transitions, as both states try to negotiate their positions,
determine the capability and will of the other, and prepare to deal with the future, higher-speed transitions
are more likely to lead to war. Such behavior would run parallel to the spiral of mobilization and
perceived offensive advantage in the First World War that many scholars believe derailed negotiation
efforts between Austria and Russia26.
I study these competing hypotheses to determine precisely how the relative rate of power
transition affects the probability of war. I intend to show in this paper that higher rates of change in the
relative difference in power between dyads leads to a higher probability of dyadic war, overpowering the
effect of a short period of parity. Including the rate of change of relative difference in power (or more
simply, the speed of the power transition) will refine the accuracy of the theory—scholars will be able to
better predict whether two states undergoing a power transition will experience war.
Impact
These theoretical developments will generalize power transition theory, suggesting both greater
accuracy and scope in its ability to predict the onset of war. In particular, the use of a continuous
measurement of relevance and difference in power will allow policymakers to choose dyads and assign a
quantitative predictive value as to how likely the dyad is to go to war. In knowing the likely initiator of
war, policymakers can make better use of resources: they may spend most of their diplomatic and
peacekeeping policymaking resources on the state more likely to go to war, rather than splitting them
evenly or otherwise arbitrarily (as using peacekeeping resources on the state more likely to prefer peace
or defense seems a waste). Finally, the incorporation of second-order effects in power transitions, should
these effects have a significant impact on the likelihood of war, will strengthen the ability of
26 Van Evera, 1998.
17

policymakers to accurately predict the likelihood of war among a particular dyad. With greater scope,
power transition theory can be used in more cases to determine the probability of dyadic war; with greater
accuracy, the probabilities generated by the theory will be closer to the true probability of war in each
case. With further theoretical developments in scope and accuracy, policymakers may find power
transition theory a useful predictive tool. If policymakers can use the theory to reliably identify the
probability of the onset of war in dyads across the international system, they will then be able to
dramatically increase the efficiency and efficacy with which they use peacekeeping and diplomatic
resources to prevent war. Much work remains to be done, but the efficacy of these theoretical revisions
suggests that the theory is significantly more powerful than previously thought.
Methodology
Definitions
There are some useful definitions that should be spelled out carefully before proceeding.
Power: Power is the war-making capacity of a state, in the near-term and the long-term, and thus includes
population, urbanization and industrialization, army size and spending. Power is implied to lend
projection capabilities over a distance that scales based on the level of power.
Relevance: Two states are important to each other based on their relative power and their distance from
each other. That is, the closer and more powerful they are, the more relevant to each other. Relevance
means, in essence, how much one state can use pressure and leverage to influence the behavior of, and
rules on, the other state. Thus, when we speak of the “relevance” of a dyad, we speak of the relevance of
the larger state to the smaller.
18

Difference in Power: The difference in power is the opposite of the power parity. A very low difference
in power means the two states are approximately in parity.
Proportional Difference in Power: The proportional difference in power; that is, the difference in power
divided by the average power of the dyad. Using proportional rather than absolute power measurements
accounts for the idea that the equivalent difference of ten tanks was little for the NATO-USSR standoff,
but would be significant between Haiti and the Dominican Republic.
Power Shift: Short for the “rate of change of the difference in power,” this is the second-order dynamic
interesting to relative-power causal mechanisms. Power Shift is measured over five years, and is the
yearly average absolute change in Power Parity over five years. If two states have a large difference in
power five years ago and a small difference in the year of interest, then the Power Shift is negative with a
relatively high magnitude.
Proportional Power Shift: Power Shift, divided by the average power of the dyad (the division occurs
during both the year of interest and five years before the year of interest). Used to test the hypothesis that
it is not the absolute change in power (say, the number of tanks added to an army) but the proportional
change in power (the percentage change in difference in tanks) that is a more accurate description for a
linear relationship between changes in power and risk of war.
Absolute Power Shift: Short for the “absolute value of power shift,” the power shift is simply the
absolute value function applied to Power Shift. This captures simply the magnitude (rather than the
direction) of the power shift. The purpose of this measurement is to test whether simply the rate of change
of the status quo—rather than the specific encroachment of relative power—has an effect on war.
Proportional Absolute Power Shift: The absolute value of Proportional Power Shift, meant for the
analagous effects as Proportional Power Shift.
19

Case Selection
The cases for all tests in this thesis are ordered by dyad-year; that is, two countries and a year
(“Nicaragua, Vietnam, 1895,” for example). I include nearly all dyads and all years over the entire
international system between 1821 and 2001, with a few notable exceptions. The first exception is the
exclusion of very tiny states, including those that are not in the UN, like San Marino or the Holy See,
because they are simply too small to participate in war in any interesting way (and that they are not listed
in a number of key datasets, including Correlates of War). The second notable exception is unintended:
states that have not existed for 5 years are not included. This is an artifact of a pivotal variable that
requires a 5-year comparison of power of each state; any state that has existed for fewer than 5 years
cannot be described by this variable. The omission is small; less than 0.1% of cases are lost in this
fashion. But I note with resignation that these cases are certainly not random; new states may well be
involved in more conflicts than their older counterparts due to the inherent instability of state formation—
the Korean Peninsula conflict of 1949, the first Arab-Israeli wars, the American Revolutionary war, and
the first Indo-Pakistani war are good examples. Given the naturally transitional nature of new state
formation, I believe this case omission will cause my conclusions to be conservative—the proportion of
wars in my tests that are caused by power transitions will be lower than the true proportion in the
population.
Alternative case selection methodologies include utilizing a possibility analysis to eliminate cases
where power transition war is “not possible”—as an extreme example, the case of Mexico and French
Indochina in 1946. This methodology argues that flooding a case set with “impossible” cases leads to a
highly over-conservative estimate of the effect of any independent variable on the dependent variable.
This study, on the other hand, utilizes strong antecedent controls to sort cases into high- and low-
independent variable types. Any possibility analysis essentially uses controls and antecedent conditions to
20

analyze and then throw out any cases that do not meet sufficient thresholds. This study instead uses those
controls and antecedent conditions in the regression to push such low-possibility cases to the low-
independent variable range. Throwing out cases due to arbitrary thresholds could mask some interesting
cases—sometimes, plants do grow in the desert.
The Dependent Variables
War: The basic dependent variable is interstate war. I aggregate wars from the Correlates of War
(COW) Militarized Interstate Disputes (MID)27, which ranks interstate conflict on a 1-5 ordinal scale. I
use scores 4 and 5 of the dataset to designate war in my study. The 4th level denotes the use of force. The
5th level a dispute that involves the use of force and 1,000 or more yearly battle deaths. This study
incorporates all uses of force as wars in order to avoid differentiating between different cases based on
magnitude of conflict (which this study makes no attempt to predict or explain). I prefer the Correlates of
War dataset both for its completeness and its extensive use within the International Relations field of
literature. The project has been in use for decades and has gone through a number of checks. The MID
definition of war is reliable, and equally valid to most intuitively reasonable war death cutoffs. We drop
all cases in which the dyad has been in war greater than 1 year, in order to capture only war onset (rather
than duration).
Power Transition War: The meta-dependent variable is power transition war. A power
transition war is defined in two arbitrary ways, at two levels. At the more restrictive level, wars that occur
between states in the top 5% of relevance and top 5% of proportional power parity among all cases are
considered power transition wars. At the less restrictive level, those wars among dyads in the top 10% of
relevance and top 10% of proportional power parity are used.
27 http://www.correlatesofwar.org/COW2%20Data/MIDs/MID310.html
21

The Explanatory Variables
Power: Power is measured using the CoW Composite Index of National Capabilities (CINC)28.
The CINC measures power using 6 material properties of the state: electrical production, iron and steel
production, total population, urban population, active military personnel, and military spending. The
aggregate:
is generally computed by summing all observations on each of the 6 capability
components for a given year, converting each state's absolute component to a share of
the international system, and then averaging across the 6 components.29
Therefore, power is relative in the international system. Interestingly, this combination of
components takes a few useful properties into account. First, the relative values of military
personnel and military spending are a rough proxy for the “mechanization” or technology level of
the troops—more money per troop generally means better equipment. Electrical production is a
rough proxy for all infrastructure—there is a correlation between large electrical production and
extensive road/rail networks. Urban population and iron & steel production together are proxies
for the industrialization of the country.
The CINC roughly measures the war-making potential of the state, by measuring both
immediate force factors (military size and spending) and by long-term war potential (energy, iron
& steel, population, and urbanization). De Soysa, O’Neal, and Park (1997) determine that it is a
sufficient measure of power for the purposes of power transition30; the realist school of
International Relations considers influential power in the international system to be based on the
28 http://www.correlatesofwar.org/COW2 Data/Capabilities/nmc3-02.htm
29 From the National Material Capabilities codebook.30 De Soysa, O’Neal, Park (1997).
22

capability of the state to strike and sustain war, and the CINC measures such war-making power
with high validity and reliability.
The most common alternative to power in related literature is GNP. GNP is unlikely to
reflect influential power nearly as well—a state with a large GNP and no military is much less
able to coerce and intimidate states into acting against their own best interest than a state with a
smaller GNP and large army (Japan may serve as an excellent example: it is minimally influential
in the international order despite decades as the second-largest economy in the world; it spends
only 1% of its GDP on its military). Furthermore, while using economic bribes (like trade deals
or sanctions) can influence state behavior, a growth of this influence is less likely to lead to war; a
rising power with a small military is unlikely to worry its neighbors or try to militarily unseat
them, and a rich state with a small military is unlikely to launch a losing war against a rising state
with a mightier military. Military parity, on the other hand, is much more likely to lead to a war.
The passage of time undermines the reliability of the measurement of power—measuring
over 200 years changes power dynamics significantly (armies can move quicker and hit with
much more devastating force over time). To embrace this, I control for year and perform cross-
sectional time analyses on the data.
Difference in Power: The difference in power is tested both as an absolute and a
proportional term, to determine how close to parity a dyad is. Its validity is self-evident, and its
reliability is as strong as that of power.
Power Shift: The power shift (or rate of change of difference in power) is the difference
in power parity (at the year of measurement) and the power parity 5 years ago, divided by 5. It is
a simple measurement of the rate in which the difference in power between two countries is
increasing or decreasing. While 5 years is an arbitrary cutoff for this measurement, it makes some
23

intuitive sense that states will consider the growth patterns of a country over the last few years or
so—states are not so myopic to only consider the last year, nor are they generally concerned if
another state has grown larger than it was some decades ago.
The measurement is insensitive to changes between the 5-year difference in power and
the immediate difference in power; it assumes for simplicity that all 5-year changes in power are
approximately linear. A sensitivity analysis would be able to get at the heart of these second-
order effects (peaks, valleys, etc), but it is a measurement much too complicated to become one
of a number of variables in a large-N dataset. For the purposes of simplicity, I look only at the
first-order effects. Any inaccuracies here will be conservative, as well: my method pictures all
second-order effects to be linear—that is, the any changes in power parity are constant over 5
years. This means I assume no shocks or sudden spikes during the 5-year period. Intuitively, the
more shocks or sudden spikes in power parity, the more psychological tendency toward crisis—
for largely the same reason that a high rate of power transition leads to a crisis mentality.
Therefore, by ignoring second-order effects, I dampen these spikes or shocks, making any effects
from erratic power transitions less pronounced.
Relevance: The relevance of a dyad is a measurement that incorporates a dyad’s ability to
mutually project influential power. It therefore incorporates measures of power and proximity. Relevance
is a non-weighted combination of the normalized power of the larger state of the dyad, and a rough
distance of measurement, itself a linear combination of the normalized distance between the population-
weighted centers of each country, contiguity (already a binary measurement), and shared continent (a
binary measurement determining whether the two states are on the same continent)]:
(norm.-weighted-distance + contiguity + same-continent)/3 + norm-power[of larger state],
24

where the power of the larger state represents the coercive ability of the larger state (determining how
much the smaller state's behavior is influenced by the larger), and the first three variables are a crude
measurement of proximity. Contiguity is taken from the COW MID dataset31; continent is self-coded (1-8,
actually representing eight sub-continents, further described later). Each distance measurement is self-
evidently valid—contiguity simply measures whether two countries share a border; same-continent
measures whether two countries are on the same continent. While there is some debate over where one
continent starts and another ends, the measurement remains quite reliable for most countries. Distance
between weighted population centers is measured by the CEPII cartography project.32
This measure of relevance is much more crude than the use of decaying power projection in
Lemke (1995) (though Lemke ultimately places binary distinctions within his measure of relevance), but I
am unable to replicate his work for the span of this dataset. I argue that the validity of the measurement of
relevance remains high; before Lemke (1995), relevance was measured primarily by contiguity alone.
Intuitively, we can think of contiguity and continent as being two binary questions that set three “rings”
of distance—contiguous and continental, contiguous and non-continental or non-contiguous and
continental, and finally non-contiguous and non-continental; the first is the closest, the third the farthest.
For each of these rings, the distance between capitals allows us to differentiate between the closer and
farther of the countries within each ring of a country. This measurement does not take into account
geographical features like mountains, swamps, thick forest, rivers, lakes, etc, that would obviously act as
barriers (and thus decrease the ability of each state to coerce the other with military might). This
measurement’s results behave as if there were no terrain barriers between any country, and thus over-
estimates the relevance of most dyads. That said, it seems unclear exactly how one might quantitatively
incorporate these features in a very large-N study; even if it were clear, it would be difficult. Such
31 http://www.correlatesofwar.org/COW2%20Data/DirectContiguity/DCV3desc.htm
32 http://www.cepii.fr/anglaisgraph/bdd/distances.htm
25

shortcomings remind us that we should be modest as to what the results of this study suggest, but they
also probably lend my conclusions more towards conservatism than to false positives.
Revisionism: The revisionism of a state is drawn straight from the COW MID dataset. It was
coded by COW experts observing the apparent dissatisfaction of each state in the system; it is coded a 1
or 0, revisionist or not. There are some reliability and replicability problems with such an approach,
though each coding was cross-checked by multiple researchers.
Interestingly, Lemke (1996) concludes that rate of military buildup is a proxy for relative
commitment to change. Between two states, a quick military buildup by the smaller state is a sign of
commitment to changing the status-quo (that is, revisionism), and a quick buildup by the larger state is
indicative of a commitment to maintain the status quo. By coincidence, this paper’s rate of power
transition variable partially captures that effect (though military spending and personnel are only two of
six components of the CINC). It is a useful hedge against this measurement of revisionism, when
determining the power transition (explained next).
Controls
Regime Type: Regime type is taken directly from the Polity IV dataset.33 The Polity IV project
rates each country-year on a -10 to 10 scale of openness, with -10 being an absolute autocracy and 10
being an absolute democracy. The Polity IV convention is to call countries that score 6 or higher a
democracy, and -6 or lower an autocracy. This study controls for both countries being democracies, both
being autocracies, or one being a democracy and one autocracy to account for the interaction of different
regime types. The Polity IV project is a highly respected and reliable measurement of regime type, and is
used almost exclusively to measure regime type in relevant literature. In this study, I use Both 33 http://www.systemicpeace.org/polity/polity4.htm
26

Democracies and Both Authoritarians as controls, equaling 1 when both states are democratic or
authoritarian, respectively.
Diplomatic Exchange: The COW project keeps a dataset on the level of diplomatic exchange
between two countries, called the Diplomatic Exchange dataset34. Different levels of diplomatic exchange
include none, charge d’affairs, minister, and ambassador. The different levels of presence validly portray
the basic communicative relationship within a dyad—it is easier to communicate and negotiate with an
ambassador than no diplomatic presence at all. This control captures a dyad’s ability to communicate,
which presumably helps to avoid war. In this study, I use Mission to A and Mission to B as controls for
whether state B has a diplomatic presence at A and vice versa, respectively.
Time: Time is controlled by year, to crudely account for changes in technology, population
growth, and other time-correlated effects.
Ally: The COW project keeps a dataset on alliances35 that simply describes whether two states are
in a formal alliance at a given time. This control accounts for the notion that two states in an alliance are
drastically less likely to go to war with each other than two states not in an alliance, all other conditions
equal.
It should be noted here that this study does not consider the power transitions between alliance
groups. While Kim (1989) and Kim (1991) both consider these cases, this study does not, for a number of
reasons. The first is simplicity: aggregating a dataset both by states and by alliance groups is a daunting,
unclear task. But more importantly, for this kind of large-N research, aggregating by alliance groups has
serious problems of reliability. The US provides a key example: it has or has had bilateral pacts with
dozens of countries (South Korea, Japan, Taiwan, etc), and group pacts with others (The Allies, NATO,
34 http://www.correlatesofwar.org/COW2%20Data/Diplomatic/Diplomatic.html
35 http://www.correlatesofwar.org/COW2%20Data/Alliances/alliance.htm
27

Rio, etc). How do these many alliances interact with a potential adversary, like Germany, Russia, and
China? Clearly, not all states in pacts with the United States contribute with equal weight (based on their
power) to the influential power of the US over a potential adversary. When the adversary also has many
various pacts, the analysis becomes daunting to generalize to the scale of this study.
It should also be noted that trade, while available with the COW project36, is not incorporated
into this dataset, due to the data being very sparse and inconsistent over the time period of the study.
Dataset and Model
The master dataset was constructed by resorting any datasets in other formats into a dyad-year
format, and then aggregating relevant columns using perl37, python38, and C++39 scripts that are attached
as appendices. All testing models are multiple linear or third-order regressions.
Data Analysis and Results
Variable Summary
First, I briefly qualitatively and quantitatively summarize the variables used in our regressions.
• war: equal to one if the dyad scored a 4 or a 5 in the Correlates of War MID dataset
• norm. relevance: normalized relevance
36 http://www.correlatesofwar.org/COW2%20Data/Trade/Trade.html
37Thanks very much to Christian Ternus for this code.
38Thanks very much to Dennis Perpelitsa for this code.
39Thanks very much to Greg Eschelberger for this code.
28

• norm. relevance^2: relevance squared, then normalized
• norm. relevance^3: relevance cubed, then normalized
• norm. diff. in power: normalized difference in power at year of interest
• norm. diff. in power^2: difference in power squared, then normalized
• norm. diff. in power^3: difference in power cubed, then normalized
• norm. prop. diff. in power: normalized proportional difference in power at year of interest
• norm. power shift: the normalized 5-year rate of change of difference in power
• norm. abs. power shift: absolute power of powerchange, normalized (normalized power shift)
• norm. abs. power shift^2: the rate of change of difference in power squared, then normalized
• norm. abs. power shift^3: the rate of change in difference in power cubed, then normalized
• norm. prop. power shift: the normalized proportional 5-year rate of change of difference in power
• norm. average power: the normalized average power of the dyad at the year of interest
• ally: whether the dyad is in an alliance
• both democracies: whether both states in the dyad are democracies, according to PolityIV
• both authoritarians: whether both states in the dyad are autocracies, according to PolitIV
• mission to A: the ordinal level of diplomatic presence of countryb in countrya
• mission to B: the ordinal level of diplomatic presence of countrya in countryb
• year: the year of interest
• norm. relevance * diff. in power: the interaction effect between relevance and deltapower1, normalized
• norm. relevance * abs. power shift: the interaction effect between relevance and abspowerchange, normalized
• norm. abs. power shift * diff. in power: the interaction effect between abspowerchange and deltapower1, normalized
• norm. full interaction: the interaction effect between all three variables, normalized.
29

Additionally, I provide a brief quantitative analysis of the variables:
variable N Mean Std. Dev Min Max
war 572474 .001 .033 0 1
norm. relevance 513818 .164 .122 0 1
norm. relevance^2 513818 .042 .066 0 1
norm. relevance^3 513818 .015 .036 0 1
norm. diff. in power 571201 .042 .101 0 1
norm. diff. in power^2 571201 .012 .053 0 1
norm. diff. in power^3 571201 .005 .035 0 1
norm. prop. diff. in power 572474 .660 .302 0 1
norm. power shift 571201 .405 .424 0 1
norm. abs. power shift 571201 .009 .032 0 1
norm. abs. power shift^2 571201 .001 .012 0 1
norm. abs. power shift^3 571201 .00003 .008 0 1
norm. prop. power shift 572474 .822 .042 0 1
norm. average power 572474 .040 .087 0 1
ally 572474 .083 .277 0 1
both democracies 572474 .093 .291 0 1
both authoritarians 572474 .155 .362 0 1
mission to A 572474 .694 1.182 0 3
mission to B 572474 .689 1.179 0 3
year 572474 1967.89 36.997 1821 2001
norm. relevance * diff. in power 513818 .013 .045 0 1
norm. relevance * abs. power shift
571201 .004 .0196 0 1
norm. abs. power shift * diff. in power
571201 .002 .0019 0 1
norm. total interaction 513818 .001 .0004 0 1
Table 1: Statistical Summary of Relevant Variables
30

Testing Continuous Mutual Relevance
We find a very large explanatory power in the use of a continuous mutual relevance
measurement. Linear regressions (shown later) using the continuous relevance measurement show both
that states with a higher mutual relevance go to war much more often, and also that the effects of power
parity and rate of change of difference in power are both more pronounced and more significant when
relevance is incorporated into the regression. This form of relevance has a compelling effect on the
likelihood of war onset in all dyads (whether or not there are power transition effects).
Figure 1: Proportion of War vs. Relevance (Centiles)40
40Each centile contains 5724 datapoints. Centiles are built by sorting datapoints by their consecutive value of the relevant explanatory variable, and then divided evenly into 100 sorted groups. The mean value of the explanatory variable (war) is found for each of these groups, and plotted in order, from 1 to 100. Curves are then drawn to match these values, rather than against a scattergram of all datapoints.
31

In figure 1 above, we observe a dramatic effect that relevance has on war. Across the range of
relevance, we see very little activity in the lower three quartiles, and a significant spike in war propensity
in the upper quartile. Interestingly, the highest centile group has an average war propensity of about 5%.
We see here that the relatively exponential effects of continuous mutual relevance interact closely with
power dynamic explanatory variables to determine war outcome.
It should be noted that the dramatic, nonlinear effects seen here give some credence to a binary
definition of relevance, allowing a scholar to draw a distinction around the beginning of the final quartile
and capture most of the interesting effects. Nonetheless, we observe that a continuous notion of mutual
relevance allows us to assign predictions of war risk to different dyad cases with more granularity and
more accuracy, suggesting that power transition theory's accuracy and scope are expanded by the
incorporation of continuous mutual relevance measurements.
Testing the Explanatory Scope of the Theory
We are interested in discovering which wars are “well explained” by the generalized model of
power transition theory; that is, which wars would be considered “strong examples” of power transition
wars. We are interested in this for three primary reasons: first, observing strong examples of power
transition wars as designated by this model will provide an additional test of the model's validity. Second,
we can discover additional wars that exhibit strong power transition characteristics that may not have
been previously observed. Finally, we can use these cases as individual test cases and examples in later
analysis.
We must make arbitrary cutoffs in order to approximately identify what cases are “strong” cases
of power transition. For thoroughness, we apply both a more restrictive and a less restrictive cutoff. In the
32
more restrictive category, we take cases that are both in the top 5% of all cases in relevance and the
bottom 5% of all cases in difference in power—this encompasses dyads that are both very much
internally mutually relevant and very much in power parity: the classic binary definition of power
transition. In the less restrictive case, we take dyads that fall both in the top 10% of all cases in relevance
and bottom 10% of all cases in difference in power.
Using the broader definition, we are able to come up with a rough number of total power
transition wars, the percentage of total wars that are strong power transition examples, and how power
transition wars have varied over time.
In this study, we observe a total of 616 wars; war occurs in 0.11% of all cases. Out of 572,424
total cases, 4,564 are cases in the broader definition of strong power transition (0.80% of all cases); 1,152
are cases in the more restrictive definition of strong power transition (0.20% of all cases). In the broader
definition, we observe 146 wars, meaning war occurs 3.2% of the time in this category (29 times more
often than the average case). In the more restrictive definition, we observe 51 wars, meaning war occurs
4.4% of the time in this category (40 times more often than the average case).
“Strong” Power Transition Definition
% of all Cases
Proportion of Cases at War
Proportion of All Wars
(All Cases) 100% 0.11% 100%
Narrow 0.2% 3.2% 8.3%
Broad 0.8% 4.4% 23.7%
Table 2: Likelihood of War and Proportion of Wars in Strong Power Transitions41
41The “narrow” definition of a power transition example is a case in which the dyad is within the top 5% of all cases in terms of relevance, and the bottom 5% of cases in terms of difference in power (that is, in the top 5% of parity). The “broad” definition of a power transition is a case in which the dyad is in the top 10% in terms of relevance, and the bottom 10% in terms of difference in power.
33

Below, we observe the yearly proportion of power transition wars in all cases, both in isolation
(figure 2) and alongside total wars (figure 3).
Figure 2: Yearly Proportion of Power Transition Wars in All Cases
In this figure, we observe a marked change before and after World War II. Before 1945, over a
dozen years contain a proportion of power transition wars greater than 0.1% of all cases, but most years
have no power transition wars at all. After World War II, most years contain some power transition wars,
but the proportion of dyads involved is low. More than likely, this is due to the massive increase in the
total number of states in the international system that came as a result of World War II. This is highly
suggestive, though, that after World War II we observe power transition wars that are not between great
powers (as great power war has largely been avoided since 1945).
34

Figure 3: Yearly Proportion of Wars and Power Transition Wars in All Cases
As we can see, power transition wars are significantly less common than other wars in most
years. In this figure, we observe a very similar change in trends in the pre-1945 and post-1945 periods.
While power transition wars rarely make up the majority of wars in a given year, they are a significant
percentage of wars over time. In the more restrictive definition of strong examples of power transition
war, power transition wars make up 8.3% of the total population of wars; in the less restrictive definition,
power transition wars make up 23.7% of all wars. We observe that, indeed, power transition wars account
for large proportions of all war, and are not only rare great power clashes as previously imagined.
Finally, we explore which wars over time are strong examples of power transition war, and which
ones aren't. This exploration will help us both to find cases of power transition war not previously known,
and also to identify shortcomings in our methodology (that would lead to obviously strong cases of power
transition war not being included in our definition). Very interesting examples are listed and discussed
35

below, but a full list of wars identified as strong examples of power transitions is included in the
statistical analysis code section of Appendix C.
• 1972, Burundi, Rwanda, *
• 1902, Colombia, Venezuela, *
• 1975, Ethiopia, Sudan
• 1870, France, Germany
• 1937, France, Italy
• 1853, France, Russia, *
• 1914, Germany, Russia
• 1940, Germany, Russia
• 1918, Honduras, Nicaragua, *
• 1929, Honduras, Nicaragua, *
• 1941, Hungary, Yugoslavia, *
• 1980, Iran, Iraq
• 1973, Iraq, Israel
• 1990, Iraq, Saudi Arabia
• 1973, Israel, Saudi Arabia
• 1991, Liberia, Sierra Leone
• 1979, Morocco, Algeria, *
• (Multiple Years), Myanmar, Thailand
• 1976, Nicaragua, Chile, *
• 1958, DPRK, ROK, *
• 1926, Russia, China
• 1953, Syria, Israel, *
• 1968, Syria, Israel
• 1982, Syria, Israel, *
• 1967, Thailand, N. Vietnam
• 1973, Uganda, Kenya
• 1899, UK, Germany
• 1914, UK, Germany, *
• 1939, USA, Germany
• 1958, USA, Russia
Table 3: Selected Power Transition Wars42
We see above a number of interesting cases both occurring and not occurring in the above list.
We see many wars that we expect to see, given classical notions of power transition theory: World War I,
World War II, the Franco-Prussian War, the Iran-Iraq War, the Korean War, a number of Arab-Israeli
Wars, and the Gulf War. We see a number of interesting wars that have been largely undiscussed in the
42The format of these listings are: year, countrya, countryb, exclusivity, where exclusivity is identified with a * if the case is a case within the more restrictive definition.
36

power transition literature; largely, a number of African wars in volatile regions like the Great Lakes, the
Horn of Africa, and the Western Coast. Lemke (2000) incorporates these regions into his hierarchy
model, but in the above model, we observe wars between states that are very clearly not the dominant
powers of their region (Uganda and Kenya, Sierra Leone and Liberia, Burundi and Rwanda, as
examples), indicating that they are not fighting for supremacy of their region, but simply for increased
control, and thus security, in their regions.
In this result we observe a number of improvements over previous models. First, we are able to
incorporate both great powers and regional powers in a single generalized framework, rather than
needing to draw a distinction and explore both separately. Second and most interestingly, we observe a
number of cases that are strong examples of power transition wars that were not included in the Lemke
(2000) model. To name a few: Nicaragua-Chile (1976), Russia-China (1926), Honduras-Nicaragua (1918
and 1929), Hungary-Yugoslavia (1941), Iraq-Saudi Arabia (1990), Israel-Saudi Arabia (1973), and any
other European conflict (whether or not some of these countries were great powers or regional powers is
debatable). These results suggest that the generalized model of power transition theory using continuous
measurements of relevancy has significantly improved explanatory power over previous models. The
incorporation of mutual relevancy not only seamlessly incorporates previously separate analytical
frameworks for power transition wars, but incorporates wars that were otherwise missed by less granular
measurements of relevancy.
A number of wars are absent in this list; these wars emphasize some of the shortcomings of the
model. The Sino-Indian war of the early 1960s is absent because the two never reach power parity
according to our definition of power. This may largely be due to China's massive population and iron
production at the time that were largely not translated into projectable military power (due to internal
conflicts and consolidation problems, the aftershocks of the Great Leap Forward, the low quality of iron
37

being produced, the lack of advanced military technology at the time, and other problems that, when not
incorporated, inflate China's measured level of power). Also absent are any wars between Japan and
China, despite clear revisionism and expansionism in Japan during its military rise and China's Qing-era
collapse; by my observations, the absence of Sino-Japanese wars during the 20th century is due largely to
similar inflations that lead to the absence of the Sino-Indian war. The first Arab-Israeli war, the
Vietnamese civil war, and the Wars of German Unification are not included because some or all of the
states involved had not existed yet for five years, leading to the unfortunate consequence of the dyads
being dropped from the dataset. The Russo-Japanese war is not included for two primary reasons: first,
the relevant power of the Russians at the time was largely limited to anything close enough to
Vladivostok to be used—the Japanese did not need to contend with the entire Russian army. Second, our
relevance measurement's use of weighted population centers puts a very large distance between Japan and
Russia that does not correctly map reality—Russia and Japan were quite relevant despite Russia's
population weight towards the West. These cases exemplify a number of shortcomings in the dataset that
leave the analysis incomplete.
There are wars that should not fall into this measurement category that are indeed related to
power transitions. Colonies may have experienced power transitions with the expeditionary forces of
their colonial powers—the United States and South Africa are possible examples. Violent non-state
actors may experience power transitions within a state, using asymmetric forms of power to equalize their
relative might with the state—Somalia is an example. Finally, some wars may occur due to power
transitions between strong defensive alliances—World War I may be an example. All such wars are not
incorporated into the model as strong examples of power transition wars, though they may arguably be
so. We will discuss these further in the final section of the paper.
38

From the strong examples of power transition war identified in this section, the next section will
test the status quo state-initiated preemptive war hypothesis.
Testing the Status Quo State-Initiated Preemptive War Hypothesis
Of the 51 to 146 strong cases of power transition war, we consider how many were initiated by
the rising, revisionist state as opposed to the dominant, status-quo state. In the broad definition of power
transition wars, 49% of wars were initiated by the revisionist (as coded by CoW) state; in the more
narrow definition of power transition war, 53% of wars were initiated by the revisionist state. It would
seem that, contrary to popular belief, whether a state has revisionist tendencies or not has little to no
effect on whether it will declare war in cases of power transitions. There are potentially three major flaws
to such a conclusion. First, coding by the Correlates of War project may be incorrect in its designations of
revisionism (indeed, a number of cases had two “status quo” states at war). Second, one may simply
tautologically reject such a conclusion by stating that one cannot have a power transition war without the
revisionist state declaring war—that is, it would be a fundamentally different war if the status quo power
declared war, or if neither state involved was revisionist. There is some credence to this argument, though
it depends on a binary definition of revisionism—whether a state is revisionist or not. I contend that, like
other concepts, a state can be more or less revisionist, signaling more or less willingness to fight to
change the status quo; thus, it is possible that two states would go to war even if the level of revisionism
of both is relatively low (we will discuss this concept later in the final section of the paper). The final
flaw in such a conclusion would be based in an objection to the set of cases called “strong examples” of
power transition wars—one may argue that such a list is either too inclusive or simply incorrect. Given all
three of these possibilities, we must admit that there is only so much to be learned from the above
statistics. But a number of relatively compelling cases should make it clear that intuitive power transition
39

wars can at times be initiated by the status quo state (even without excessive aggression and military
provocation from the smaller, revisionist state). We discuss a few key cases below:
The 1948 Arab-Israeli War. In this case, it was Israel (and the West, in general) that sought to
change the status quo (specifically, the territorial boundaries of Trans-Jordan and the existence of an
Israeli Palestine). Arab states that initiated war against Israel were fighting to maintain the status quo, and
were generally considered somewhat more powerful. It became clear that Israel and the Arab states had
gone through an extremely high-speed power transition, as Israel's military coercive ability started out
very small at its inception, but by the end of the war was high enough to drive out the Arabs and occupy
large swaths of territory. This was clearly a power transition war initiated by the status quo powers.
World War I. While the German aspirations for territory strongly influenced decision-making in
all involved states, it was forceful preservations of the status quo that led to the first two declarations of
war in World War I. The Austro-Hungarian declaration of war against Serbia was designed to coerce the
Serbian government into preventing Bosnian-Serb nationalists within Serbia from continuing operations
against the Empire. The Russian declaration of war against Austria-Hungary, in turn, was intended to
prevent Austria-Hungary from acquiring territory in the Slavic Balkans. Both initiations of hostilities
were meant to enforce elements of the status quo important to each country, rather than significantly
change the international order.43
The British declaration of war against Germany, 1939. While Nazi Germany had indeed
severely provoked the Allies in the late 1930's by invading Czechoslovakia and Poland, the United
Kingdom did not respond until the invasion of Poland, when Germany's total military might finally
surpassed that of the United Kingdom. Specifically, Germany did not declare war on the United
Kingdom: Germany was content to continue its conquest of smaller states until it had achieved much
43 Van Evera, “The Cult of the Offensive and the Origins of the First World War,” 1984.
40

greater strength. Britain's declaration of war against Germany was a status quo-initiated war in an attempt
to maintain the continental status-quo.44
These are a few examples that illustrate the relatively muddled nature of revisionist initiation of
war in power transitions. While this paper does not attempt to predict whether the revisionist state will
declare war, nor does it predict what conditions lead to revisionism by a state, these issues are discussed
in the final section of the paper.
Testing the Rate of Change of Power Hypothesis
Consideration of the final question this paper asks leads us to explore the paper's most novel
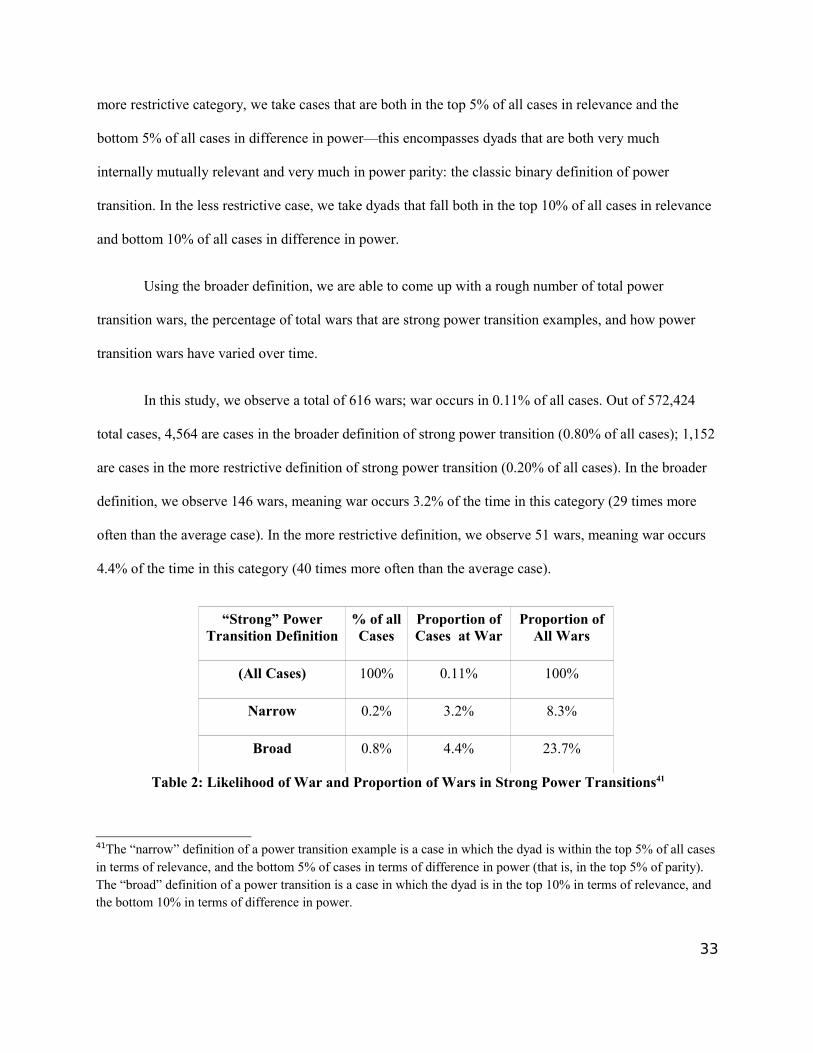
hypothesis. Graphically, we observe a marked nonlinear effect of rate of power shift when other effects
are not taken into account. In figure 4 below, we observe the approximate effects of power shifts on war
propensity when other effects are not held constant.
44John Mearsheimer, The Tragedy of Great Power Politics, pp 260-266.
41

Figure 4: Proportion of War vs. Centiles of Rate of Power Shift45
The figure above describes exactly what was expected when power shifts were defined earlier in
the paper. In the middle, where the magnitude of power shift is low, there is very low war propensity. At
the ends, with high negative and high positive magnitudes of power shift, we observe very high
probabilities of war. Figure 5 below presents the absolute value of power shifts.
45 Similarly, all cases are included in centiles (that is, 100 groups) of 5724 datapoints each.
42

Figure 5: Proportion of War vs. Centiles of Absolute Value of Power Shift46
Here we observe the prominent effects of magnitude of rate of change of difference in power.
Near zero, we observe very low propensity for war; in the top quintile, we observe a very quickly
increasing propensity for war. This result suggests that many power transition wars go through a
complete “crossover” before war onset; that is, the magnitude of power shift switches from positive to
negative at the point of complete power parity, leading to the U-shaped curve observed in figure 4. The
effect of the absolute value of power shift appears approximately exponential, suggesting that only very
high magnitudes of power shifts are relevant to the onset of war.
Ultimately, we conclude that the rate of change of the difference in power has a significant effect
on the onset of war that rivals the first-order difference in power at the year of interest. This effect should
be incorporated into power transition models in order to increase their accuracy and scope.
46 Similarly, all cases are included in centiles (that is, 100 groups) of 5724 datapoints each.
43

Basic Regression Analysis
In order to provide statistical rigor to the suggestive graphical results above, we next explore
regression analyses of the data. The regression analyses not only confirm the suggestive findings from
before, but also reveal new results.
The first regressions are basic bivariate regressions of different forms of the three explanatory
variables. These regressions give us a basic idea of how the explanatory variables interact with the
dependent variable, war. I briefly discuss the implications below.
War Coefficient(std. dev)
ConstantN
norm. relevance .0514(.0006)***
-.0053513818
norm. diff. in power
.0324(.0007)***
.0016571201
norm. prop. diff. in power
-.0010(.0003)***
.0036571201
powerchange .1909(.0430)***
.0030571201
norm. abs. power shift
.1221(.0023)***
.0019571201
norm. prop. power shift
-.0020(.0017)
.0046571201
Table 4: Separate Basic Bivariate Regressions of Various Explanatory Variables on War (* = p < .1, ** = p < .05, *** = p < .001)
Due to the size of the sample, it is unsurprising to see very low p-values; thus, the last result is
decisively insignificant. The first result shows a positive effect of relevance on the likelihood of war,
which we expect. The second result suggests that war is more likely when two states' power are more
disparate, which is not particularly supported by power transition theory. The third result suggests a very
slight increase in likelihood of war with greater proportional power parity. The fourth result suggests that
44

an increase in difference in power over 5 years leads to a much higher likelihood of war; the fifth suggests
that higher rates of change of difference in power (regardless of direction) lead to a higher likelihood of
war.
These results have very limited explanatory power without any controls. Power transition theory
hypothesizes that power parity leads to war only when states are relevant; testing random pairings of
states for power parity and asking whether they go to war is not particularly useful. Therefore, the next
regression to run is a regression of both difference in power and rate of change of difference in power,
with relevance as a control.
War Coefficients(std. dev)
norm. diff. in power -.0078(.0010)***
norm. abs. power shift .0894(.0029)***
norm. relevance .0468(.0007)***
ConstantN
-.0051513818
Table 5: Basic Linear Quadvariate Regression of Explanatory Variables on War(* = p < .1, ** = p < .05, *** = p < .001)47
We observe here results very consistent with the hypotheses of the generalized form of power
transition theory. Smaller differences in power, when controlling for relevance, lead to a higher likelihood
of war (though with a small coefficient). Higher rates of change in difference in power lead to a
significant increase in war likelihood, as does higher relevance. These results are suggestive that the
generalized form of power transition theory accurately increases the power of war onset. But to discover
47We observe a change in sign of norm. difference in power between tables 4 and 5. This is because in table 4, there are no controls; on its own, high differences in power increase the likelihood of war, because most wars are not power transition wars, and large states often go to war against smaller ones. When controlling for relevance, though, we see that relevant states go to war much more often when the difference in power is low, suggesting that power transitions are more likely to lead to war in cases of high relevance, as we'd expect.
45

whether or not the variables contribute to war in a stronger than linear way or not, we must explore
regressions of the interaction effects of our variables against the likelihood of war. Below, we observe a
regression with both linear and interaciton effects on the dependent variable, war, with controls.
war Coefficient (std.dev)
norm. full interaction -.3011(.0401)***
norm. relevance * diff. in power
-.0317(.0057)***
norm. relevance * power shift
.6329(.0214)***
norm. diff. in power * power shift
-.1695(.0302)***
norm. relevance .0385(.0008)***
norm. diff. in power -.0855(.0034)***
norm. abs. power shift -.1011(.0108)***
norm. average power .1246(.0032)***
ally -.0013(.0003)***
both democracies -.0030(.0003)***
both authoritarians -.0002(.0002)
mission to A -.0002(.0001)*
mission to B -.0002(.0001)***
year .00003(.000003)***
constantN
RMSE
-.0555513818.0545
Table 6: Linear Regression of Interaction and Linear Effects on War (* = p < .1, ** = p < .05, *** = p < .001)
46

In table 6, we observe coefficients much larger than the simple linear combinations of each pair
of variables. In fact, we observe some rather impressive results. Let us first note that all variables with
norm. diff. in power as a variable should have negative coefficients, given that it is a variable that we
expect to be negative (given that smaller differences in power lead to a higher likelihood of war). Given
that, we observe some particularly impressive effects. Particularly, the norm. full interaction shows a 30%
increase in war likelihood over its entire range, and the interaction between norm. relevance and norm.
power shift shows a full 63% increase in war likelihood over its entire range. These results are highly
suggestive of the idea that a generalized form of power transition theory, in which the first-order and
second-order power dynamics of a dyad interact with the bilateral relevance of the two countries to
produce particularly large effects on war, is a more inclusive and more accurate model than previous
models have been. Such findings are powerful evidence in favor of the conceptual changes to power
transition theory submitted earlier in the paper.
The next regression is a linear cross-sectional by time and cross-sectional by space analysis with
year and dyad fixed effects48 (which measures the change within dyads) using proportional measurements
of difference in power and rate of change of difference in power. This tests the effect of proportional first-
and second-order power dynamics on war, controlling for variation across time and across dyads. The
following controls are introduced: norm. average power, which controls for the power of the states
involved (under the common assumption that larger states go to war more often); ally, which controls for
whether the two states are allied (assuming that allied states should go to war less often than those not
allied); both democracies, which controls for both countries being democratic (assuming that democracies
go to war less often); both authoritarians, which controls for both countries being authoritarian (assuming
that authoritarian states go to war more often); mission to A and mission to B, which control for countries
48That is, I use “xtreg” in STATA with year and dyadnum (a dummy variable of unique numerical identifications for each dyad) as cross-sectional controls, and the “fe” (fixed-effects) option.
47

having sent diplomatic missions to each other (assuming that states with diplomatic missions can defuse
conflicts more easily than those without); and finally year, controlling for time.
war Coefficient (std.dev)
norm. relevance.0289*(.0120)
norm. prop. diff. in power
.0002(.0007)
norm. prop. power shift
-.0035*(.0020)
norm. average power
.0262**(.0083)
ally-.0051***
(.0005)
both democracies-.0032***
(.0004)
both authoritarians.0006**(.0003)
mission to A-.0003**(.0001)
mission to B-.0008***
(.0001)
year.0001***(.0000)
constantN
-.1185***513818
Table 7: Linear Cross-Sectional Regression of Proportional Power Dynamics on War(* = p < .1, ** = p < .05, *** = p < .001)49
There are a few points worth noting. The first is that the proportional difference in power does
not have any effect in this regression, suggesting that the use of absolute difference in power may be a
better measurement of the effect (assuming that previous studies have sufficiently validated basic power
transition theory). We observe that relevance causes about a 3% increase in likelihood of war over its
entire span, and that the proportional rate of change has a very slightly negative effect.
49The regression is cross-sectional with time and dyad as fixed effects.
48

The next regression is a linear cross-sectional by time and cross-sectional by space analysis using
absolute (rather than proportional) measurements of power dynamics. Additionally, the absolute value of
power shift is used to account for crossover effects50.
war Coefficient (std.dev)
norm. relevance.1287***
(.105)
norm. diff. in power-.0775***
(.0067)
norm. abs. power shift
.0636***(.0030)
norm. average power
.0417***(.0085)
ally-.0047***
(.0005)
both democracies-.0031***
(.0004)
both authoritarians.0006**(.0003)
mission to A-.0003**(.0001)
mission to B-.0008
(.0001)***
year.0001***(.0000)
constantN
-.1357***513818
Table 8: Linear Cross-Sectional Regression of Absolute Power Dynamics on War(* = p < .1, ** = p < .05, *** = p < .001) 51
50“Crossover effects” refer to an artifact of the power shift measurement, which fails under the following circumstances: if two states are experiencing a swap in power dominance (that is, the smaller power is overtaking the larger one), the power shift measurement indicates that just before power parity, the two states are experiencing a very negative power shift, and just after power parity, they experience a very positive power shift. Taking the absolute value of the power shift measurement ensures that the derivative of difference in power on both sides of the point of crossover approach the same value. This measurement has its own failings: two dyads, neither of which are near parity, are virtually indistinguishable between their difference in power increasing or decreasing over time.
51The regression is cross-sectional with time and dyad as fixed effects.
49

This regression yields much more convincing results. Over the range of relevance, we observe a
13% increase in likelihood of war, with extremely high significance, though this is expected given our
very large number of cases (over 513,000). Additionally, we observe an 8% drop in war propensity over
the range of difference in power, which is precisely what power transition theory predicts—lower
differences in power lead to higher risk of war. Finally, we observe a greater than 6% increase in the risk
of war over the entire range of the absolute value of the power shift. All of these coefficients have p-
values of less than .001, again suggesting high significance. These results are a strong positive result for
testing the validity of the generalized model of power transitions.
There are a few other points of note from this regression. We observe a 4% increase across the
range of average dyadic power, suggesting that larger states engage in warfare (either with other larger
states or smaller states) more often than small states with other small states. States in an alliance are only
very slightly less likely to go to war, which suggests either a problem with coding or an extremely high
correlation with another variable. Democracies go to war with each other slightly less often than when the
dyad is not both democratic, but the difference is small. The presence of diplomatic missions between
states, as well as the year, have small effects as well.
The final regression of interest is a third-order cross-sectional by time and cross-sectional by
space analysis using absolute measurements of power dynamics. The third-order regression adds squared
and cubed terms of relevance, difference in power, and power shift, in order to test whether the linear
regression captures well or poorly the effects of these three explanatory variables on the likelihood of
war.
50

war Coefficient (std.dev)
norm. relevance.0545
(.0342)
norm. relevance^2.1461**(.0740)
norm. relevance^3-.1178**(.0560)
norm. diff. in power-.1099***
(.0125)
norm. diff. in power^2.2230***(.0307)
norm. diff. in power^3-.2539***
(.0254)
norm. abs. power shift.1376***(.0068)
norm. abs. power shift^2-.1533***
(.0179)
norm. abs. power shift^3.0859***(.0141)
norm. average power.0531***(.0087)
ally-.0047***
(.0005)
both democracies-.0030***
(.0004)
both authoritarians.0006**(.0003)
mission to A-.0003**(.0001)
mission to B.0008***(.0001)
year.0001***(.0000)
constantN
-.1371***513818
Table 9: Third-Order Cross-Sectional Regression of Absolute Power Dynamics on War(* = p < .1, ** = p < .05, *** = p < .001) 52
It is difficult to look at the coefficients of the third-order explanatory variables and intuit the
actual effect over the range of the variables. For this reason, we provide three figures below that track the
52The regression is cross-sectional with time and dyad as fixed effects.
51

changes in war risk over the range of these variables, when all others are held equal53. It should be noted
first that these are approximate; second, that these figures are normalized such that a zero on the y-axis is
equal to the mean propensity for war, and that other values are changes from this mean propensity based
as affected by the changes in the explanatory variable.
Figure 6: Third-Order Curve of the Effects of Relevance on War (Other Effects Held Equal)
In this figure, we observe that relevance has a relatively linear effect on war, when other effects
are held equal. The total effect is an 8% increase in risk of war over the entire range of relevance, which
is less than the 13% seen in the linear regression.
53That is, these figures are simply graphs of the curves, from x = 0 to x = 1, traced by the three coefficients of each variable. They approximate the changes over the range of each explanatory variable with more accuracy than a simple single-order regression, though they are, of course, not perfect.
52
Figure 7: Third-Order Curve of the Effects of Power Difference on War (Other Effects Held Equal)
Here we observe a less-linear effect. As in the linear regression, the total effect over the range of
the explanatory variable results in a 15% decrease in war propensity, which is significantly larger than the
7.8% decrease in war propensity observed in the linear regression. Interestingly, the curve is “slow” to
drop off—that is, the effects of increases in power difference near parity are very low, suggesting that
“parity” (as defined in a binary theoretical framework) may encompass a relatively wide subset of cases.
53

Figure 8: Third-Order Curve of the Effects of Rate of Change of Difference in Power on War
(Other Effects Held Equal)
In the power shift curve, we observe a more linear effect again. We seen an 8% increase in
propensity for war over the entire range, with little variation over the length of the range.
A result of note is from the linear and third-order regressions at the beginning of the analysis
section. In the linear regression, we observed a 6.4% increase in war propensity over the entire range of
the power shift variable (compared to a 7.8% decrease in war propensity over the range of difference in
power). In the third-order regression, we observe an approximately 8% increase in war propensity over
the entire range of the power shift variable (compared to an approximately 15% decrease in war
propensity over the entire range of difference in power). From these regressions, we see that the rate of
change of difference in power has a large and significant effect on the onset of war even controlling for
difference in power. We conclude that these is an effect from rate of change in addition to effects from
54

difference in power. We also conclude that while the effects of the second-order power dynamics, while
not as strong as first-order effects, are more than half as strong, and must be taken into account in models
of power transition war.
We see, as a whole, significant and large correlations in the regressions run, as predicted by the
hypotheses of each explanatory variable. We have shown that the absolute (rather than the proportional)
power dynamics model predicts the onset of war consistently. From these results, we can draw decisive
conclusions as to the nature of the international system and the conditions that lead to high risk of war in
power transitions.
Alternative Explanation
There are legitimate concerns of reverse causality in some cases of power transition war. If one
state is bent on declaring war on another, the other state (particularly if it is weaker) has an incentive to
quickly build up its military force to try and deter the threatening force. Such a defensive buildup may
lead to a perceived power transition, even though it was domestic politics in the aggressor country that led
to war. There are two responses to this. The first is that the realist school of international politics assumes
that while domestic politics have some effect on war, their effect is much smaller than the logical realist
motivations that tend to generate foreign policy. Further, such cases may not be explanatory under the
umbrella of power transition theory, but they remain predictive. If there is such an alternative cause that
leads to both a power transition and a war, then the model remains predictive, if not completely
explanatory.
55

Conclusion
A number of interesting conclusions may be drawn from the results from above. The generalized
model of power transition theory predicts war better than the null hypothesis with great significance and
strength; we are confident that the explanatory variables have a real effect on the onset of war.
Additionally, we confirm our three hypotheses:
• A continuous measurement of relevance not only incorporates cases that a binary measurement
would not, but also explains greater variation among dyads that do and do not go to war when in
power transitions. We see very strong and consistent effect of continuous mutual relevance on the
onset of war when controlling for other power transition explanatory variables.
• Revisionist states do not always initiate war in a power transition moment. Status quo states
indeed have a preventative motivation to declare war on a revisionist state in order to assert the
status quo or preempt a more destructive war in the future. We observe a number of examples, as
well as systematic accounting to strongly suggest that this is the case.
• The second-order power dynamic—the rate of change of difference in power, or the power shift
—is a significant and important explanatory factor in the onset of war. When controlling for other
variables, we see strong and significant effects on war from higher magnitudes of rate of change
of difference in power. We conclude that the power shift is a measurement that must be
incorporated into power transition models in order to achieve accuracy and breadth.
As a whole, we conclude that the generalized model of power transition theory expands both the
accuracy and explanatory scope of power transition theory by removing, as much as possible, the need to
make arbitrary binary distinctions in what are ultimately continuous concepts. Further generalizations of
power transition theory may ultimately allow policymakers to create a probabilistic formula that would
56

take structural conditions (differences in power, rates of change of difference in power, proximity, etc),
and determine the approximate risk of a power transition war occurring. With increases in explanatory
accuracy, such a model would allow greater and greater confidence in predictions of risk, allowing
policymakers to more accurately and correctly allocate peacekeeping and diplomatic resources.
We conclude finally that this highly quantitative and inclusive model of power transition theory
allows us to directly use the model as a predictive tool. In table 6, we observe very strong coefficients on
our linear and interactive effects on war. Additionally, we observe a very low Root Mean Squared Error
(RMSE), of less than .06. This has significant implications. Using these coefficients, we could create a
linear predictive model, in which we take the explanatory variable and control values of a particular case,
multiply each of these values by its coefficient, and add them; this sum would give us the probability that
the case (dyad) would go to war, a value between 0 and 1. The RMSE of less than .06 means that, on
average, our answer would be less than .06 from the real value (or less than 6% wrong) if historical trends
correctly predict the future. This means that, despite significant shortcomings of this model and a great
deal of further research that needs doing, the current form of the model has a strong predictive value for
policymakers, and can relatively accurately predict the likelihood that a particular dyad will go to war in
the future, given that the explanatory values of the correct variables can be obtained. This should make
policymakers and scholars alike particularly optimistic about its value as a critical part of the
peacekeeping toolkit.
But it should be noted that this model has a few particular shortcomings that should tend us
towards some modesty in our conclusions. We have observed that an attempt at capturing strong
examples of power transition wars led to a number of cases failing to be included that probably should
have been. The use of a “use of force” standard for war led to the inclusion of some odd cases in both
total wars and power transition wars, but it is unclear what cutoff for war initiation is ideal, if it is above
57
this cutoff. We observe some specific problems with both our measurement of power and our
measurement of relevance that may lead to inaccuracies in results. But I contest that, overall, these
inaccuracies are small enough that they do not undermine the basic conclusions of the paper. Indeed, the
strength and significance of our findings indicate that any systematic biases from erroneous coding or
analysis would need to be relatively large to undermine the results, and there is little evidence that this is
the case. Nonetheless, there are multiple considerations for future research that should be discussed
briefly in the last section of the paper, below.
Further Research
While this paper is a compelling first step in generalizing power transition theory, there is a great
deal of research that could be done to potentially improve the accuracy of results, and to further expand
the explanatory scope of the model. This section explores some of those considerations for future
research.
Future research should better operationalize some of the cruder measurements of power and rate
of change of power used in this model. First, we see that this model's measurement of coercive power is
imperfect; the case of China is a good example. A further and more compelling example is the case of
nuclear weapons. Many scholars have argued that nuclear weapons have changed warfare by acting as a
new form of power (that is very difficult to quantitatively compare to conventional power). This criticism
is legitimate; nuclear weapons (and other forms of non-conventional power) interact with conventional
power in a way that is difficult to measure and to understand. A better measurement of power should be
striven for, and it has been extensively sought. But its importance cannot be overemphasized. An accurate
measurement of coercive power can have a significant impact on the accuracy of power transition
predictions by the model. Additionally, the relatively crude five-year measurement of rate of change of
58

power difference has self-evident problems that are also difficult to remedy. Correctly describing rates of
change in difference in power in a way that is relevant to policymakers and state actors is extremely
difficult, but worth pursuing for the same reasons as those listed for pursuing a more accurate portrayal of
power.
Future research should consider further generalizing the concept of revisionism in power
transition war. Currently, revisionism suffers from two major problems as a measurement: first, it is a
binary measurement, even though it is clearly not a binary concept. Lemke, Werner (1996) provides an
excellent measurement of relative commitment by the revisionist power to change the status quo, versus
the commitment of the status quo power to maintain it, by measuring relative power buildup. More
research should be done to explore this concept. Revisionism's second problem is that it is treated as an
independent variable, when it is more likely an intermediary variable. Structural conditions in the
international system, as well as the state's domestic politics, interact to cause revisionism. A structural
approach to revisionism as an intermediary variable would allow policymakers to predict when a state is
likely to show revisionist tendencies, and what magnitude these may be. An effective realist theory of
power transition should be able to predict when revisionism is likely, making it a variable dependent on
international structural conditions, rather than simply an arbitrary independent variable. Presumably,
whether a state should tend towards revisionism is something that should be predictable given the security
situation that the state faces. Such knowledge would be invaluable to policymakers in peacekeeping and
diplomacy. Furthermore, revisionism (in any form) should be a part of our explanatory variable. Two
states going through a power transition are much more likely to go to war if one or both of the states is a
revisionist power than if neither of them are. Unfortunately, the Correlates of War coding for revisionism
only applies to dyads that actually went to war, as opposed to those that didn't, which prevents its use as a
predictive explanatory variable. Finding and utilizing a predictive revisionist variable will be key to
completing this model of power transition theory. The model, frankly, suffers greatly without it.
59

Work should also be done to better measure relevance between dyads. Lemke (1995) uses a
compelling method of power projection, proximity, and terrain that seems to measure relevance well, but
it and later papers then go on to use it to create binary distinctions between relevant regions. Such work
should be converted into a database of dyadic relevance for future researchers.
Future research should also include alliance formation and inter-alliance transitions in a
generalized model of power transition theory. Kim (1989) and Kim (1991) conclude that alliance
formation and inter-alliance war often follow power transition dynamics, but most of the work in power
transition theory is limited to dyads. This is a shortcoming that should be resolved, but the task is
daunting and unclear. A fully generalized model would be able to seamlessly incorporate dyads and their
relative alliance frameworks; predictions of war would become greatly more accurate. But Organski and
Kugler justify ignoring alliances for the vast majority of wars. They argue that alliances are flexible and
fickle, and cannot be depended upon for security in the long-term. Therefore, the power of alliance
members is highly discounted in power calculations by major states considering war. Further, Organski
and Kugler argue that most wars with alliances typically include two primary states going to war as a
dyad, and that most other states within the alliance are, to some extent, tagging along (that is, they have a
relatively minimal effect on the calculus to go to war). In special instances, like the spider alliances of
World War I, allied states have a much larger effect on the war calculus of the primary states involved.
But these multipolar wars make up a small proportion of all wars in recent history.
We note also that raw power is not always an effective estimator of the impetus to go to war.
Many realists contend that certain periods of history are offensive-dominant (or at least are perceived by
the actors at the time to be offensive-dominant), and some are defense-dominant. Such technological
periods (which would be relatively global in a given period of time) may have a significant effect on the
60
likelihood of war in power transitions. Such a measure of technological advantage should be taken into
account in future measurements of power transition models.
Finally, power transition theory, if it is to remain relevant in the 21st century, should explore non-
traditional power transitions, particularly those between colonies and imperial expeditionary forces, and
between violent non-state actors and states. Asymmetric uses of power, democratization of light arms, the
internet, asymmetric sensitivity to casualties, and other factors can allow non-states or colonies to meet or
overcome the coercive power of a state, and it is likely that wars of independence or insurgencies depend
on the revisionist tendencies of the colony or non-state actor, as well as their power relative to the state.
Power transition theory has the potential to explain formation and conflict dynamics in these cases, and
should do so to achieve greater scope.
61

Annex A: Full Codebook (as variables appear in the dataset)
variablename: description of variable (data type, source [direct or indirect])
year: the year of interest (integer, CoW)
countrya: 3-letter country code of first country in the dyad (string, CoW)
countryb: 3-letter country code of second country in the dyad (string, CoW)
powera1: Correlates of War CINC score of countrya in year of interest (continuous, CoW)
powerb1: Correlates of War CINC score of countryb in year of interest (continuous, CoW)
powera5: CINC score of countrya 5 years before the year of interest (continuous, CoW)
powerb5: CINC score of countryb 5 years before the year of interest (continuous, CoW)
missiontoa: level of diplomatic presence at countrya from countryb (ordinal, CoW)
missiontob: level of diplomatic presence at countryb from countrya (ordinal, CoW)
ally: whether the dyad is in an alliance in the year of interest (binary, CoW)
politya: the polity score of countrya (ordinal -10 -> 10, PolityIV)
polityb: the polity score of countryb (ordinal -10 -> 10, PolityIV)
democa: whether countrya is a democracy in the polity scale (binary, PolityIV)
democb: whether countryb is a democracy in the polity scale (binary, PolityIV)
contiguity: whether countrya and countryb are contiguous (binary, CoW)
yearstart: the year that the dyad entered the current conflict, if a current conflict exists (integer, CoW [Mouz])
yearend: the year that the dyad ended the current conflict, if a current conflict exists (integer, CoW [Mouz])
conflictlevel: highest level of conflict reached during the year of interest (ordinal 0 -> 5, CoW)
revisiona: whether countrya portrays revisionist tendencies (binary, CoW [mouz])
revisionb: whether countryb portrays revisionist tendencies (binary, CoW [mouz])
originatea: whether countrya initiated the current conflict, if it exists (binary [if conflict], CoW [mouz])
originateb: whether countryb initiated the current conflict, if it exists (binary [if conflict], CoW [mouz])
distancew: the distance between the population-weighted geographic centers of the dyad (continuous, cepii)
continenta: the continent or sub-continent of countrya:
62

1) South America, 2) Central America, 3) North America, 4) Europe,
5) Africa, 6) Middle East, 7) Asia, 8) Oceania
continentb: continent or sub-continent of countryb
deltapower1: the dyadic difference in power in the year of interest (continuous, CoW)
deltapower5: the dyadic difference in power five years before the year of interest (continuous, CoW)
powerchange: the rate of change over five years in the difference of power in the dyad; the difference of deltapower1 and deltapower5 (continuous, CoW)
averagepower1: the mean of dyadic power in the year of interest (continuous, CoW)
averagepower5: the mean of dyadic power five years before the year of interest (continuous, CoW)
propdeltapower1: the proportional difference in power during the year of interest; deltapower1 divided by averagepower1 (continuous, CoW)
propdeltapower5: the proportional difference in power five years before the year of interest; deltapower5 divided by averagepower5 (continuous, CoW)
proppowerchange: the rate of change over five years of proportional power in the dyad; the difference between deltapower1 and deltapower5 (continuous, CoW)
nconflict: normalized conflict (normalized continuous, CoW [mouz])
npropdeltapower1: normalized propdeltapower1 (normalized continuous, CoW)
npropdeltapower5: normalized propdeltapower5 (normalized continuous, CoW)
nproppowerchange: normalized proppowerchange (normalized continuous, CoW)
war: whether the dyad is in war during the year of interest; dropped if yearslong > 1
0) conflict is 0, 1, 2, or 3
1) conflict is 4 or 5
bothdemoc: if both countries are democracies; politya > 6 and polityb > 6 (binary, CoW)
bothauth: if both countries are autocracies; politya < -4 and polityb < -4 (binary, CoW)
powerinteract: the interaction effects between the difference in power and the rate of change of the difference in power; powerchange * deltapower1 (continuous, CoW)
continentdiff: equal to 1 if the dyad are in separate continents (binary, CoW)
samecontinent: equal to 1 if the dyad are in the same continent (binary, CoW)
ndistancew: normalized distance (normalized continuous, cepii)
ncloseness: the reverse of the the normalized distance; 1 – ndistancew (normalized continuous, cepii)
npowera1: normalized range of powera1 (normalized continuous, CoW)
63

npowerb1: normalized range of powerb1 (normalized continuous, CoW)
relevancetoa: a linear combination of the normalized weighted dyadic distance, continent similarity, and the normalized power of countryb, measuring the relevance of countryb to countrya; (ndistancew + samecontinent + npowerb1) (continuous, CoW and cepii)
relevancetob: a linear combination of the normalized weighted dyadic distance, continent similarity, and the normalized power of countrya, measuring the relevance of countrya to countryb; (ndistancew + samecontinent + npowera1) (continuous, CoW and cepii)
relevance: the larger of relevancetoa and relevancetob (continuous, CoW)
nrelevance: normalized relevance (normalized continuous, CoW)
yearslong: the total length of the conflict, if there is currently a conflict; yearend – yearstart (integer, CoW)
dyad: a dummy appending of the 3-letter code of countryb to the end of countrya; this is transitively unique [that is, if AUHRUS exists, RUSAUH does not] (string, CoW)
dyadnum: a conversion of dyad into a unique numerical value for each dyad (integer, CoW)
nmissiontoa: normalized missiontoa (normalized ordinal, CoW)
nmissiontob: normalized missiontob (normalized ordinal, CoW)
naveragepower1: the normalized averagepower1 (normalized continuous, CoW)
revisionism: whether one of the states in the dyad is revisionist (binary, CoW)
abspowerchange: the absolute value of power shift [that is, negative values appear positive—this is to show the magnitude of a shift in power over time] (continuous, CoW)
nabspowerchange: normalized abspowerchange (normalized continuous, CoW)
ndeltapower1: normalized deltapower1 (normalized continuous, CoW)
propabspowerchange: proportional absolute value of powerchange; abspowerchange divided by averagepower1 (continuous, CoW)
npropabspowerchange: normalized propabspowerchange
deltapower1sq: the squared term of deltapower1; deltapower1 * deltapower1 (continuous, CoW)
deltapower1cu: the cubed term of deltapower1; deltapower1sq * deltapower1 (continuous, CoW)
relevancesq: the squared term of relevance; relevance * relevance (continuous, CoW)
relevancecu: the cubed term of relevance: relevancesq * relevance (continuous, CoW)
powerchangesq: the squared term of powerchange; powerchange * powerchange (continuous, CoW)
powerchangecu: the cubed term of powerchange; powerchangesq * powerchange (continuous, CoW)
ndeltapower1sq: normalized deltapower1sq (normalized continuous, CoW)
64

ndeltapower1cu: normalized deltapower1cu (normalized continuous, CoW)
nrelevancesq: normalized relevancesq (normalized continuous, CoW)
nrelevancecu: normalized relevancecu (normalized continuous, CoW)
npowerchangesq: normalized powerchangesq (normalized continuous, CoW)
npowerchangecu: normalized powerchangecu (normalized continuous, CoW)
ptcase55: a dummy cutoff of whether a dyad is “in a power transition;” whether a dyad falls within the top 5% of relevance and bottom 5% of deltapower1 (binary)
ptcase105: a dummy cutoff of whether a dyad is “in a power transition;” whether a dyad falls within the top 10% of relevance and bottom 5% of deltapower1 (binary)
ptcase1010: a dummy cutoff of whether a dyad is “in a power transition;” whether a dyad falls within the top 10% of relevance and bottom 10% of deltapower1 (binary)
ptwar55: a dummy that determines whether a dyad is “in a power transition war;” a variable that equals one when a ptcase55 dyad is at war in the year of interest (binary)
ptwar105: a dummy that determines whether a dyad is “in a power transition war;” a variable that equals one when a ptcase105 dyad is at war in the year of interest (binary)
ptwar1010: a dummy that determines whether a dyad is “in a power transition war;” a variable that equals one when a ptcase1010 dyad is at war in the year of interest (binary)
pwar: a dummy predictor value for the likelihood of a dyad to go to war based on a linear regression (continuous)
nlpwar: a dummy predictor value for the likelihood of a dyad to go to war based on a nonlinear regression (continuous)
revisionistwar: a war in which the revisionist state was also the originator (binary, CoW)
statusquowar: a war in which the originator of the war was not the revisionist state (binary, CoW)
nrelevanceXdeltapower1: the interaction effect between relevance and deltapower1, normalized (continuous)
nrelevanceXabspowerchange: the interaction effect between relevance and abspowerchange, normalized (continuous)
nabspowerchangeXdeltapower1: the interaction effect between abspowerchange and deltapower1, normalized (continuous)
65

Appendix B: Data Collection and Aggregation Code
Data collection code has been generously released to the academic community by its authors. There are
three pieces of code that, in stages, reorganize data into dyad-year form and then aggregate it into a
master database. The code is available at the following locations:
Python by Dennis Perepelitsa: http://web.mit.edu/efogg/Public/Thesis/processyear.py
Perl by Christian Ternus: http://web.mit.edu/efogg/public/Thesis/parsesql.pl
C++ by Greg Eschelberger: http://web.mit.edu/efogg/Public/Thesis/master.cpp
If you'd like to rebuild the master dataset from scratch using the above code, please contact the author, at
Alternatively, the fully aggregated master dataset (without variables added during analysis) is available at
the following location:
http://web.mit.edu/efogg/Public/Thesis/thesis-master.dta
The dataset with a full variable set (all those added during analysis) is available at the following location:
http://web.mit.edu/efogg/Public/Thesis/thesis-progress.dta
66

Appendix C: Statistical Analysis Code
The code used to analyze the aggregated master dataset is available at the following location:
http://web.mit.edu/efogg/Public/Thesis/thesis.do
The code is to be run in STATA with the master dataset from Appendix B. The code is not a single script
that outputs all relevant results, but instead a series of scripts with instructions to output different results.
The instructions are a bit particular, but should be navigable.
67

Bibliography
Alsharabati, Carole. Dynamics of War Initiation. PhD Dissertation, Claremont Graduate School, 1997.
Barbieri, Katherine. 1996. Economic Interdependence and Militarized Interstate Conflict, 1870-1985, Ph.D. Dissertation. Binghamton University, Binghamton, NY
Bayer, Resat. 2006. “Diplomatic Exchange Data set, v2006.1.” Online: http://correlatesofwar.org.
De Soysa, Indra, John R Oneal, Yong-Hee Park. “Testing Power-Transition Theory Using Alternative Measure of National Capabilities.” The Journal of Conflict Resolution, 41/4 (Aug, 1997), pp 509-528.
DiCiccio, Jonathan M, Jack S Levy. “Power Shifts and Problem Shifts: The Evolution of the Power Transition Research Program.” The Journal of Conflict Resolution, 43/6, (Dec, 1999), pp 675-704.
Geller, Daniel S. “Power Differentials and War in Rival Dyads.” International Studies Quarterly, 37/2 (Jun, 1993), pp 173-193.
Ghosn, Faten, Glenn Palmer, and Stuart Bremer. 2004. "The MID3 Data Set, 1993–2001: Procedures, Coding Rules, and Description." Conflict Management and Peace Science 21:133-154.
Gibler, Douglas M., and Meredith Sarkees. Forthcoming. "Measuring Alliances: the Correlates of War Formal Interstate Alliance Data set, 1816-2000." Journal of Peace Research.
Houweling, Henk W, Jan G Siccama. “Power Transitions as a Cause of War.” The Journal of Conflict Resolution, 32/1 (Mar, 1988) , 87-102.
Jervis, Robert. Perception and Misperception in International Politics. Princeton: Princeton University Press, 1976.
Jervis, Robert. “Cooperation Under the Security Dilemma.” World Politics, 30/2 (1978), pp 167-214.
Kang, David C. “Getting Asia Wrong.” International Security, 27/4 (Spring 2003), pp. 57–85
Kim, Woosang. “Alliance Transitions and Great Power War.” American Journal of Political Science, 35/4 (Nov 1991), pp 833-850.
Kim, Woosang. “Power, Alliance, and Major Wars, 1816-1975.” The Journal of Conflict Resolution, 33/2 (Jun, 1989), pp 255-273.
Kim, Woosang. “Power Transitions and Great Power War from Westphalia to Waterloo.” World Politics, 45/1 (Oct, 1992), pp 153-172.
Kim, Woosang, James D Morrow. “When Do Power Shifts Lead to War?” American Journal of Political Science, 36/4 (Nov, 1992) , pp 896-922.
Kugler, Jacek, Douglas Lemke. Parity and War: Evaluations and Extensions of the War Ledger. Ann Arbor: The University of Michigan Press, 1998.
Kumar, Sushil. “Power Cycle Analysis of India, China, and Pakistan in Regional and Global Politics.” International Political Science Review, 24/1 (Jan, 2003), pp 113-122.
68

Lemke, Douglas. “The Continuation of History: Power Transition Theory and the End of the Cold War.” Journal of Peace Research, 34/1 (Feb 1997), pp 23-36.
Lemke, Douglas. Regions of War and Peace. Cambridge, UK: Cambridge University Press, 2002.
Lemke, Douglas. “The Tyranny of Distance: Redefining Relevant Dyads.” International Interactions, 21/1 (1995), 23-38.
Lemke, Douglas, Suzanne Werner. “Power Parity, Commitment to Change, and War.” International Studies Quarterly, 40 (1996), pp 235-260.
Lemke, Douglas, William Reed. “The Relevance of Politically Relevant Dyads.” Journal of Conflict Resolution, 45/1 (2001), 126-144.
Levy, Jack S. “Declining Power and the Preventive Motivation for War.” World Politics, 40/1 (Oct, 1987), pp 82-107.
Organski, AFK. World Politics. New York: Knopf, 1958.
Organski, AFK, Jacek Kugler. The War Ledger. Chicago: University of Chicago press, 1980.
Powell, Robert. “Uncertainty, Shifting Power, and Appeasement.” The American Political Science Review, 90/4 (Dec, 1996), pp 749-464.
Reed, William. “Information, Power, and War.” American Political Science Review, 97/4 (Nov, 2003), pp 633-641.
Sarkees, Meredith Reid (2000). "The Correlates of War Data on War: An Update to 1997," Conflict Management and Peace Science, 18/1: 123-144.
Singer, J. David. (1987). "Reconstructing the Correlates of War Dataset on Material Capabilities of States, 1816-1985" International Interactions, 14: 115-32.
Singer, J. David, Stuart Bremer, and John Stuckey. (1972). "Capability Distribution, Uncertainty, and Major Power War, 1820-1965." in Bruce Russett (ed) Peace, War, and Numbers, Beverly Hills: Sage, pp 19-48.
Stinnett, Douglas M., Jaroslav Tir, Philip Schafer, Paul F. Diehl, and Charles Gochman. "The Correlates of War Project Direct Contiguity Data, Version 3." Conlict Mangagement and Peace Science, 19/2 (2002), pp 58-66.
Tammen, Ronald L., et al. Power Transitions: Strategies for the 21st Century. New York: Chatham House Publishers, 2000.
Mayer, Thierry, and Soledad Zignano. “CEPII Distance Measurements.” CEPII, accessed at http://www.cepii.fr/anglaisgraph/bdd/distances.htm during November, 2008.
Van Evera, Stephen. “The Cult of the Offensive and the Origins of the First World War.” International Security, 9/1 (1984), pp 58-107.
Van Evera, Stephen. Guide to Methods for Students of Political Science. Ithaca: Cornell University Press, 1997.
69

Van Evera, Stephen. “Offense, Defense, and the Causes of War.” International Security, 22/4 (1998), pp 5-43.
Walt, Stephen M. The Origins of Alliances. Ithaca, NY: Cornell University, 1987.
Waltz, Kenneth N. Theory of International Politics. New York: McGraw Hill, 1979.
Werner, Suzanne, Jacek Kugler. “Power Transitions and Military Buildups.” In Kugler, Jacek, Douglas Lemke. Parity and War. Ann Arbor: University of Michigan Press, 1996.
70