Embed Size (px)
Citation preview
EPA/600/2-88/070April 1989
Generalized Methodoloav for ConductinaIndustrial
Toxicity Reduction Evaluations(TREs)
J.A. FavaD. Lindsay
W. H. ClementR. Clark
G.M. DeGraeveJ.D. Cooney
Battelle Columbus Division
Stephen HansenS.R. Hansen and Associates ,
William RueE.A. Engineering Science and Technology, Inc.
Sam MooreBurlington Research Inc.
Perry LankfordAware, Inc.
Contract Number68-03-3248
Project OfficerKenneth Dostal
The Chemicals and Chemical Product BranchRisk Reduction Engineering LaboratoryU.S. Environmental Protection Agency
Cincinnati, Ohio 45268
Disclaimer
The information in this document has been funded wholly or in part by the UnitedStates Environmental Protection Agency under Contract 68-03-3248 to BattelleColumbus Division. It has been subjected to the Agency’s peer and administrativereview, and it has been approved for publication as an EPA document. Mention oftrade names or commercial products does not constitute endorsement orrecommendation for use.
Foreword
Today’s rapidly developing and changing technologies and industrial products andpractices frequently carry with them the increased generation of materials that, ifimproperly dealt with, can threaten both public health and the environment. The U.S.Environmental Protection Agency is charged by Congress with protecting the nation’sland, air, and water resources. Under a mandate of national environmental laws, theAgency strives to formulate and implement actions leading to a compatible balancebetween human activities and the ability of natural systems to support and nurturelife. These laws direct the EPA to perform research to define our environmentalproblems, measure the impacts, and search for solutions.
The Risk Reduction Engineering Laboratory is responsible for planning,implementing, and managing research, development, and demonstration programs toprovide an authoritative, defensible engineering basis in support of the policies,programs, and regulations of the EPA with respect to drinking water, wastewater,pesticides, toxic substances, solid and hazardous wastes, and Superfund-relatedactivities. This publication is one of the products of that research and provides a vitalcommunication link between the researcher and the user community.
The purpose of this document is to present guidance for the performance of ToxicityReduction Evaluations (TREs) at industrial facilities. This is accomplished bypresenting a generalized methodology for designing and conducting a TRE and 10supporting case studies which illustrate various approaches that have been used in theperformance of TREs to date.
E. Timothy Oppelt, DirectorRisk Reduction Engineering Laboratory
. . .III
Abstract
The U.S. Environmental Protection Agency or state regulatory agencies, under theClean Water Act, can require industries which cannot achieve water quality basedeMuent limitations specified in their NPDES permit to conduct a Toxicity ReductionEvaluation (TRE). The objective of the TRE is to determine those actions necessary toreduce the effluent’s toxicity to acceptable levels. This approach was written todescribe a generalized methodology for the design and performance of a TRE at anindustrial facility. The generalized methodology was developed based on the insightslearned in completing 10 TRE case studies.
A six-tier approach was directed toward the reduction of toxicity of the whole eMuentrather than specific components within the effluent. A flow chart was designed as adichotomous key linking the phases in a systematic progression to achieve the finalresult, which is an effluent that consistently meets the toxicity limitation assigned toit. The six tiers include: 1) information and data acquisition; 2) an evaluation ofremedial actions to optimize the operation so as to reduce final effluent toxicity;3) characterization/identification of the cause(s) of the final effluent toxicity;4) identification of the source(s) of the toxicity in the facility; 5) identification andevaluation of methods for reducing toxicity in the final effluent; and 6) follow-up of thetoxicity reduction to confirm that the toxicity limitation is met and maintained. The10 completed TREs that provided the basis for the structure of the protocol areappended as case studies and follow the same generalized format presented in theprotocol.
Contents
Page
Disclaimer . . . . . . . . . . . . . . . . . . . . . . . . . . . . . . . . . . . . . . . . . . . . . . . . . . . . . . . . . . . . . . . . . . . . . . . . . . . . . . . iiForeword . . . . . . . . . . . . . . . . . . . . . . . . . . . . . . . . . . . . . . . . . . . . . . . . . . . . . . . . . . . . . . . . . . . . . . . . . . . . . . . iiiAbstract . . . . . . . . . . . . . . . . . . . . . . . . . . . . . . . . . . . . . . . . . . . . . . . . . . . . . . . . . . . . . . . . . . . . . . . . . . . . . . . . . ivFigures . . . . . . . . . . . . . . . . . . . . . . . . . . . . . . . . . . . . . . . . . . . . . . . . . . . . . . . . . . . . . . . . . . . . . . . . . . . . . . . . . . xTables . . . . . . . . . . . . . . . . . . . . . . . . . . . . . . . . . . . . . . . . . . . . . . . . . . . . . . . . . . . . . . . . . . . . . . . . . . . . . . . . . . . xiGlossary . . . . . . . . . . . . . . . . . . . . . . . . . . . . . . . . . . . . . . . . . . . . . . . . . . . . . . . . . . . . . . . . . . . . . . . . . . . . . . . . xiiAcknowledgments . . . . . . . . . . . . . . . . . . . . . . . . . . . . . . . . . . . . . . . . . . . . . . . . . . . . . . . . . . . . . . . . . . . . . . xiii
Section 1.
Section 2.
Section 3.
Section 4.
Section 5.
Introduction . . . . . . . . . . . . . . . . . . . . . . . . . . . . . . . . . . . . . . . . . . . . . . . . . . . . . . . . . . . . . . . . . l - lPurpose . . . . . . . . . . . . . . . . . . . . . . . . . . . . . . . . . . . . . . . . . . . . . . . . . . . . . . . . . . . . . . . . . . . . l - lRegulatoryFramework . . . . . . . . . . . . . . . . . . . . . . . . . . . . . . . . . . . . . . . . . . . . . . . . . . . . . . . l - lObjectives of a TRE .......................................................... l - lAvailableApproaches . . . . . . . . . . . . . . . . . . . . . . . . . . . . . . . . . . . . . . . . . . . . . . . . . . . . . . . . l - lContent of this Document .................................................... l-2Flow-Chart Overview . . . . . . . . . . . . . . . . . . . . . . . . . . . . . . . . . . . . . . . . . . . . . . . . . . . . . . . . l-3
Information and Data Acquisition ............................................. 2- 1Regulatory Information ...................................................... 2-lFacility Monitoring Data ..................................................... 2-2
NPDESMonitoringData . . . . . . . . . . . . . . . . . . . . . . . . . . . . . . . . . . . . . . . . . . . . . . . . . 2-2In-House Monitoring Data ................................................ 2-2State Agency Monitoring Data ............................................ 2-2
Plant and Process Description ................................................. 2-2Process and Treatment Plant Descriptive Data .............................. 2-2Physical/Chemical Monitoring Data ....................................... 2-3
AnalysisofData . . . . . . . . . . . . . . . . . . . . . . . . . . . . . . . . . . . . . . . . . . . . . . . . . . . . . . . . . . . . . 2-3
GoodHousekeeping . . . . . . . . . . . . . . . . . . . . . . . . . . . . . . . . . . . . . . . . . . . . . . . . . . . . . . . . . . 3-lInitiation of the Housekeeping Study .......................................... 3-lEvaluation of Housekeeping Practices ......................................... 3-3Identification of Potential Problem Areas ...................................... 3-4Identification of Corrective Measures .......................................... 3-4Selection of Corrective Measures .............................................. 3-5Implementation of Corrective Measures ........................................ 3-5Follow-Up and Confirmation ................................................. 3-5
Treatment Plant Optimization ................................................ 4-lIdentification of Available Information ........................................ 4-lIdentification and Evaluation of Influent Wastestreams ......................... 4-2Description of Treatment System .............................................. 4-3Analysis of Treatment System Operation ....................................... 4-3Implementation of Corrective Action ........................................... 4-4Follow-Up and Confirmation .................................................. 4-5
Chemical Optimization ....................................................... 5-lInformationGathering . . . . . . . . . . . . . . . . . . . . . . . . . . . . . . . . . . . . . . . . . . . . . . . . . . . . . . . 5-lProcess Chemical Review ..................................................... 5-2Review MSDS Information .................................................... 5-3Chemical Composition Screen of Incoming Raw Materials ....................... 5-3Outcome of the Chemical Optimization Phase .................................. 5-3
Contents (continued)
Page
DataAnalysis . . . . . . . . . . . . . . . . . . . . . . . . . . . . . . . . . . . . . . . . . . . . . . . . . . . . . . . . . . . . . . . 5-4Follow-Up and Confirmation .................................................. 5-4
Section 6. Toxicity Identification Evaluation (TIE) ....................................... 6-lPhase I - Toxicity Characterization Procedures ................................. 6-l
Components of Variability ................................................ 6-3Determining the Number and Timing of Samples ............................ 6-3Toxicity Testing Procedures ............................................... 6-3Description of Characterization Methods ................................... 6-4Quality Assurance/Quality Control ........................................ 6-5
Phase II - Identification of Specific Toxicants ................................... 6-5Phase III -Confirmation of Identifications ..................................... 6-6
Section 7. Source Identification Evaluation .............................................. 7-lSetting the Initial Search Image ............................................... 7-2Sample Collection from the Influent Streams or Selected Process Streams ......... 7-2Chemical Specific Analyses for Tracking to Toxicant Sources ..................... 7-2
Evaluate Treatment Effects on Identified ToxicantsUse Bench Scale Model to SimulateTreatment Plant Degradation&d Track * . a ’ ’ . . ’
7-4
Toxicity to Source Streams ................................................ 7-4Characterize the Toxicity of Suspect Source Streams ......................... 7-5
Further Upstream Investigations .............................................. 7-6
Section 8. Toxicity Reduction Methodologies ............................................. 8-lSourceReduction . . . . . . . . . . . . . . . . . . . . . . . . . . . . . . . . . . . . . . . . . . . . . . . . . . . . . . . . . . . . 8-lWaste Treatment Operations Improvements .................................... 8-2Evaluation of Alternative Reduction Methodologies ............................. 8-3Selection of Reduction Methodology ............................................ 8-5Implementation of the Solution ................................................ 8-5Follow-Up and Confirmation .................................................. 8-5
Section 9. Follow-Up and Confirmation .................................................. 9-l
SectionlO. References . . . . . . . . . . . . . . . . . . . . . . . . . . . . . . . . . . . . . . . . . . . . . . . . . . . . . . . . . . . . . . . . . 10-l
Appendix A: TRECaseSummaries . . . . . . . . . . . . . . . . . . . . . . . . . . . . . . . . . . . . . . . . . . . . . . . . . . . . . .Introduction . . . . . . . . . . . . . . . . . . . . . . . . . . . . . . . . . . . . . . . . . . . . . . . . . . . . . . . . . . . . . .
Section A-l Case History: A Multipurpose Specialty Chemical Plant (MSCP) in Virginia ....Introduction . . . . . . . . . . . . . . . . . . . . . . . . . . . . . . . . . . . . . . . . . . . . . . . . . . . . . . . . . . . . . .Initial Data and Information Acquisition ....................................Toxicity Identification Evaluation (TIE) .....................................
EffluentToxicity . . . . . . . . . . . . . . . . . . . . . . . . . . . . . . . . . . . . . . . . . . . . . . . . . . . . . . .Characterization and Fractionation - Causative Agent Identification .......SourceInvestigation . . . . . . . . . . . . . . . . . . . . . . . . . . . . . . . . . . . . . . . . . . . . . . . . . . .Confirmation of Source or Agent ........................................
Toxicity Reduction Approaches .............................................Treatability Evaluations ...............................................OtherMethodsExamined . . . . . . . . . . . . . . . . . . . . . . . . . . . . . . . . . . . . . . . . . . . . . . .Basis for Selection of Method ............................................
Follow-Up and Confirmation ...............................................Effectiveness of Solution ................................................
Final Comments, Recommendations, and ConclusionsProblems Encountered ............................................. 1’. .. 1.. ........ 1.. ..........References . . . . . . . . . . . . . . . . . . . . . . . . . . . . . . . . . . . . . . . . . . . . . . . . . . . . . . . . . . . . . . . .
A-lA-l
A-3A-3A-3A-4A-4A-4A-5A-5A-6A-7A-7A-7A-7A-7A-7A-7A-7
Section A-2 Case History: Tosco Corporation’s Avon Refinery, Martinez, California . . . . , . , . . A-9Initial Data and Information Acquisition . . . . . . . . . . . . . . . . . . . . . . . . . . . . . . . . . . . . A-9Toxicity Identification Evaluation (TIE) . . . . . . . . . . . . . . . . . . . . . . . . . . . . . . . . . . . . . A-9
vi
Contents (continued)
Page
Selection of a Monitoring Tool ........................................... A-9Chemical Fractionation ............................................... A-11Single Chemical Analyses ............................................. A-11Source Investigation Study for Toxicity ................................. A-12Toxicity Reduction Through the Existing Treatment System .............. A-12ProcessStreamEvaluation . . . . . . . . . . . . . . . . . . . . . . . . . . . . . . . . . . . . . . . . . . . . A-12Biodegradability of Process Stream Toxicity ............................. A-13
Toxicity Reduction Approaches ............................................ A-13Follow-Up and Confirmation .............................................. A-14ProblemsEncountered . . . . . . . . . . . . . . . . . . . . . . . . . . . . . . . . . . . . . . . . . . . . . . . . . . . . A-14References . . . . . . . . . . . . . . . . . . . . . . . . . . . . . . . . . . . . . . . . . . . . . . . . . . . . . . . . . . . . . . . A-14
Section A-3 Case History: Martinez Manufacturing Complex, Shell Oil Company ..........Introduction . . . . . . . . . . . . . . . . . . . . . . . . . . . . . . . . . . . . . . . . . . . . . . . . . . . . . . . . . . . . .Initial Data and Information Acquisition ...................................
Plant Description . . . . . . . . . . . . . . . . . . . . . . . . . . . . . . . . . . . . . . . . . . . . . . . . . . . . .Toxicity Identification Evaluation (TIE) ....................................
Characterization and Fractionation ....................................Confirmation of Toxic Agents ..........................................
Toxicity Reduction Approaches ............................................OilandGrease . . . . . . . . . . . . . . . . . . . . . . . . . . . . . . . . . . . . . . . . . . . . . . . . . . . . . . . .Ammonia . . . . . . . . . . . . . . . . . . . . . . . . . . . . . . . . . . . . . . . . . . . . . . . . . . . . . . . . . . . .Amines (Organic Nitrogen) ............................................Flocculation Polymers (PEI and DMAEM/AM) ...........................SuspendedSolids . . . . . . . . . . . . . . . . . . . . . . . . . . . . . . . . . . . . . . . . . . . . . . . . . . . . .
Follow-Up and Confirmation ..............................................ProblemsEncountered . . . . . . . . . . . . . . . . . . . . . . . . . . . . . . . . . . . . . . . . . . . . . . . . . . . .Water Quality-Based Toxicity Limit ........................................References . . . . . . . . . . . . . . . . . . . . . . . . . . . . . . . . . . . . . . . . . . . . . . . . . . . . . . . . . . . . . . .
Section A-4 Case History: A North Carolina Textile Mill ................................Introduction . . . . . . . . . . . . . . . . . . . . . . . . . . . . . . . . . . . . . . . . . . . . . . . . . . . . . . . . . . . . .Initial Data and Information Acquisition ...................................
ProcessDescription . . . . . . . . . . . . . . . . . . . . . . . . . . . . . . . . . . . . . . . . . . . . . . . . . . .Wastewater Treatment Plant Description ...............................Characteristics of Influent and Effluent .................................
Toxicity Reduction Evaluation (TRE)EffluentToxicity . . . . . . . . . . . . . . . . . . . . . . . . . . . . . . . . . . . . . . . . . . . . . . . . . . . . . .Characterization and Fractionation ....................................
Toxicity Reduction ApproachesMetals Reduction Experiment ..........................................Extended Biological Treatment Experiment .............................Conclusions: Toxicity Reduction Experiments ...........................Implementation of Toxicity Reduction Recommendations .................
Follow-Up and ConfirmationProblems EncounteredReferences . . . . . . . . . . . . . . . . . . . . . . . . . . . . . . . . . . . . . . . . . . . . . . . . . . . . . . . . . . . . . . .
Section A-5 Case History: A North Carolina Metal Product Manufacturer .................Introduction . . . . . . . . . . . . . . . . . . . . . . . . . . . . . . . . . . . . . . . . . . . . . . . . . . . . . . . . . . . . .Initial Data and Information Acquisition ...................................
ProcessDescription . . . . . . . . . . . . . . . . . . . . . . . . . . . . . . . . . . . . . . . . . . . . . . . . . . .Wastewater Treatment Plant Description ...............................Housekeeping . . . . . . . . . . . . . . . . . . . . . . . . . . . . . . . . . . . . . . . . . . . . . . . . . . . . . . . .Characteristics of Influent and Effluent .................................Chemical Usage Review ...............................................
A-15A-15A-15A-15A-15A-15A-17A-17A-17A-17A-17A-18A-18A-18A-18A-18A-18
A-21A-21A-21A-21A-21A-21A-21A-21A-22A-23A-23A-23A-24A-24A-25A-25A-25
A-27A-27A-27A-27A-27A-27A-27A-27
VII
Contents (continued)
Page
A-28A-28A-28A-28A-29A-30A-30A-31A-31A-31A-31
On-site Visit .........................................................Toxicity Identification Evaluation (TIE) ....................................
Effluent Toxicity ......................................................Characterization and Fractionation ....................................Metal and Toxicity Reduction Experiments ..............................Field Application of Laboratory Procedures ..............................Toxicity Characterization Procedures ...................................Receiving Stream Effluent Concentrations ..............................
Conclusions and Recommendations for Toxicity Reduction ....................Follow-Up and Confirmation ..............................................References . . . . . . . . . . . . . . . . . . . . . . . . . . . . . . . . . . . . . . . . . . . . . . . . . . . . . . . . . . . . . . .
Section A-6 Case History: Texas Instruments Facility in Attleboro, Massachusetts ......... A-33Introduction . . . . . . . . . . . . . . . . . . . . . . . . . . . . . . . . . . . . . . . . . . . . . . . . . . . . . . . . . . . . . A-33Initial Data and Information Acquisition ................................... A-33Toxicity Identification Evaluation (TIE) .................................... A-33
Effluent Toxicity ...................................................... A-33Characterization of the Effluent ........................................ A-33
Toxicity Reduction Approaches ............................................ A-35PilotTesting . . . . . . . . . . . . . . . . . . . . . . . . . . . . . . . . . . . . . . . . . . . . . . . . . . . . . . . . . A-36
Conclusions, Comments, and Recommendations ............................. A-36References . . . . . . . . . . . . . . . . . . . . . . . . . . . . . . . . . . . . . . . . . . . . . . . . . . . . . . . . . . . . . . . A-36
Section A-7 Case History: Chemical Plant I ..............................................Introduction . . . . . . . . . . . . . . . . . . . . . . . . . . . . . . . . . . . . . . . . . . . . . . . . . . . . . . . . . . . . .Initial Data and Information Acquisition ...................................Toxicity Identification Evaluation (TIE) ....................................
Toxicity Screening . . . . . . . . . . . . . . . . . . . . . . . . . . . . . . . . . . . . . . . . . . . . . . . . . . . .Toxicity Reduction Approaches
. . . . . . . . . . . . . . . . . . .. . . . . . . . . . . . . . . . . . . . . . . . . . . . . . . . . .
SourceReduction . . . . . . . . . . . . . . . . . . . . . . . . . . . . . . . . . .Powdered Activated Carbon Treatment (PACT) ..........................Granular Activated Carbon (GAC) Adsorption ...........................Ozonation . . . . . . . . . . . . . . . . . . . . . . . . . . . . . . . . . . . . . . . . . . . . . . . . . . . . . . . . . . . .Basis for Selection of Method ...........................................
Follow-Up and Confirmation ..............................................ProblemsEncountered . . . . . . . . . . . . . . . . . . . . . . . . . . . . . . . . . . . . . . . . . . . . . . . . . . . .Recommendations, Comments and Conclusions ..............................Reference . . . . . . . . . . . . . . . . . . . . . . . . . . . . . . . . . . . . . . . . . . . . . . . . . . . . . . . . . . . . . . . .
A-37A-37A-37A-37A-37A-39A-39A-40A-40A-40A-40A-41A-41A-41A-41
Section A-8 Case History: Chemical Plant II .............................................Introduction . . . . . . . . . . . . . . . . . . . . . . . . . . . . . . . . . . . . . . . . . . . . . . . . . . . . . . . . . . . . .Initial Data and Information Acquisition ...................................
Plant or Process Description ...........................................Effluent Toxicity ......................................................Evaluation of Treatment Process Optimization ..........................
Toxicity Identification Evaluation (TIE) ....................................Causative Agent Identification .........................................
Confirmation of Source or Agent ...........................................Treatability Evaluations ..................................................
SourceTreatment . . . . . . . . . . . . . . . . . . . . . . . . . . . . . . . . . . . . . . . . . . . . . . . . . . . . .End-of-Pipe Treatment ................................................
Final Comments, Recommendations and Conclusions ........................
A-43A-43A-43A-43A-43A-43A-43A-43A-45A-45A-45A-45A-45
Section A-9 Case History: TRE of I.T.T. Effluent ......................................... A-47Introduction . . . . . . . . . . . . . . . . . . . . . . . . . . . . . . . . . . . . . . . . . . . . . . . . . . . . . . . . . . . . . A-47Initial Data and Information Acquisition ................................... A-47
Plant Description ..................................................... A-47
. . .VIII
Contents (continued)
Page
Characteristics of Effluent ............................................. A-47Toxicity Identification Evaluation (TIE) .................................... A-47
Data Collection and Methods ........................................... A-47Other toxicity tests .................................................... A-48EffluentToxicity . . . . . . . . . . . . . . . . . . . . . . . . . . . . . . . . . . . . . . . . . . . . . . . . . . . . . . A-48Characterization and Fractionation .................................... A-49Confirmation of Causative Agent ....................................... A-49
Toxicity Reduction Approaches ............................................ A-51Treatability Evaluation ............................................... A-51Air Stripping . . . . . . . . . . . . . . . . . . . . . . . . . . . . . . . . . . . . . . . . . . . . . . . . . . . . . . . . . A-51Nitrifkation - Denitrification .......................................... A-51
ProblemsEncountered . . . . . . . . . . . . . . . . . . . . . . . . . . . . . . . . . . . . . . . . . . . . . . . . . . . . A-51References . . . . . . . . . . . . . . . . . . . . . . . . . . . . . . . . . . . . . . . . . . . . . . . . . . . . . . . . . . . . . . . A-52
Section A-10 Case History: Monsanto Chemical Manufacturing Facility ................... A-53Introduction . . . . . . . . . . . . . . . . . . . . . . . . . . . . . . . . . . . . . . . . . . . . . . . . . . . . . . . . . . . . . A-53Initial Data and Information Acquisition ................................... A-53
Site1 . . . . . . . . . . . . . . . . . . . . . . . . . . . . . . . . . . . . . . . . . . . . . . . . . . . . . . . . . . . . . . . . A-53Site2 . . . . . . . . . . . . . . . . . . . . . . . . . . . . . . . . . . . . . . . . . . . . . . . . . . . . . . . . . . . . . . . . A-53Site 3 ................................................................ A-53
Toxicity Identification Evaluation (TIE) .................................... A-53Site1 . . . . . . . . . . . . . . . . . . . . . . . . . . . . . . . . . . . . . . . . . . . . . . . . . . . . . . . . . . . . . . . . A-54Site2 . . . . . . . . . . . . . . . . . . . . . . . . . . . . . . . . . . . . . . . . . . . . . . . . . . . . . . . . . . . . . . . . A-54Site 3 ................................................................ A-55
Toxicity Reduction Approaches ............................................ A-56Site1 . . . . . . . . . . . . . . . . . . . . . . . . . . . . . . . . . . . . . . . . . . . . . . . . . . . . . . . . . . . . . . . . A-56Site2 . . . . . . . . . . . . . . . . . . . . . . . . . . . . . . . . . . . . . . . . . . . . . . . . . . . . . . . . . . . . . . . . A-56Site3 . . . . . . . . . . . . . . . . . . . . . . . . . . . . . . . . . . . . . . . . . . . . . . . . . . . . . . . . . . . . . . . . A-56
Follow-Up and Confirmation .............................................. A-56Site 2 ................................................................ A-56
ProblemsEncountered . . . . . . . . . . . . . . . . . . . . . . . . . . . . . . . . . . . . . . . . . . . . . . . . . . . . A-56Site 1 . . . . . . . . . . . . . . . . . . . . . . . . . . . . . . . . . . . . . . . . . . . . . . . . . . . . . . . . . . . . . . . . A-56
References . . . . . . . . . . . . . . . . . . . . . . . . . . . . . . . . . . . . . . . . . . . . . . . . . . . . . . . . . . . . . . . A-56
ix
Figures
Figure 1.1.
Figure 1.2.
Figure 3.1.
Figure 4.1.
Figure 5.1.
Figure 6.1.
Figure 7.1.
Figure Al-l.
Figure A2- 1.
Figure A4-1.
Figure A4-2a.
Figure A4-2b.
Figure A5la.
Figure A5lb.
Figure A6-1.
Figure A7- 1.
Figure A8- 1.
Figure A9- 1.
Figure A9-2.
Figure A10-1
Page
Overview of the water quality-based toxics control process. . . . . . . . . . . . . . . . . . . l-2
Toxicity Reduction Evaluation (TRE) flow chart. . . . . . . . . . . . . . . . . . . . . . . . . . . . l-4
Good housekeeping logic flow diagram. .................................... 3-2
Treatment plant optimization logic flow diagram. .......................... 4-2
Chemical optimization flow chart. ........................................ 5-2
Toxicity Identification Evaluation (TIE) strategy flow chart. ................ 6-2
Source identification evaluation flow chart. ................................ 7-3
Multi-purpose specialty chemical waste flow diagram. . . . . . . . . . . . . . . . . . . . . . . A-4
Conceptual diagram of Tosco’s wastewater treatment system withdesignation of sites sampled during various elements of this study. . . . . . . . A-10
Early TRE 48-hour D. pulex acute static bioassay history, Glen Raven Mills. . A-22
Pre- and post- TRE 48-hour D. pulex acute static bioassay history,Glen Raven Mills. . . . . . . , . . . . . . . . . . . . . . . . . . . . . . . . . . . . . . . . . . . . . . . . . . . . . A-25
Pre- and post-TRE monthly average effluent flow (MGD),Glen Raven Mills. . . . . . . . . . . . . . . . . . . . . . . . . . . . . . . . . . . . . . . . , . . . . . . . . . . . . A-25
48-hour daphnid acute static bioassay history, Halstead Metal Products. . . . . A-30
Total recoverable copper concentrations, corresponding composite effluents . . A-30
Texas Instruments Attleboro outfall locations. . . . . . . . . . . . . . . . . . . . . . . . . . . . . A-34
Waste treatment plant process flow diagram. . . . . . . . . . . . . . . . . . . . . . . . . . . . . . A-38
Wastewater flow and treatment schematic. . . . . . . . . . , . . . . , . . . . . . . . . . . . . . . . A-44
A schematic diagram of the processes in the I.T.T.Rayonier wastewater treatment system. . . . . . . . . . . . . . . . . . . . . . . . . . . . . . . . A-48
Number of cystocarps for Champiaparuula (as % of control) plotted against%effluent. . . . . . . . . . . . . . . . . . . . . . . . . . . . . . . . . . . . . . . . . . . . . . . . . . . . . . . . . . . A-51
ESC effluent fractionation and testing scheme. . . . . . . . . . . . . . . . . . . . . . . . . . . . . A-54
Tables
Table 2.1.
Table 8-l.
Table 8.2.
Table 8.3.
Table 8.4.
Table Al-l.
Table A4- 1.
Table A5-1.
Table A6-1.
Table A6-2.
Table A7- 1.
Table A7-2.
Table A8- 1.
Table A9-1.
Table A9-2.
Table A9-3.
Page
Checklist of Useful Facility Specific Data ................................... 2-l
Effluent Levels Achievable in Heavy Metal Removals ........................ 8-3
Relative Biodegradability of Certain Organic Compounds .................... 8-4
Activated Carbon Treatment of Selected Compounds ......................... 8-4
Air Stripping of Selected Compounds ....................................... 8-4
Summary of Toxicity Data on Final Effluent Samples Collected at Site No. 1 . . A-6
Effluent Characterization, Glen Raven Mills TRE,Prechlorination Composite of December 17-18,1985. ..................... A-23
Influent and Effluent Data Summary, HalsteadMetal Products, August 1985 - November 1986 ........................... A-27
Range of Duphnia pulex: LC5O’s and NOAEL ............................... A-34
Summary of Results From Representative Acute and ChronicEffluent Toxicity Tests, Texas Instruments Toxicity ReductionEvaluation August 1985 ............................................... A-35
Typical Classification Results of Wastewater Sources ....................... A-39
Treatability and Toxicity Factors from Identified Wastestreams ............. A-39
Comparison of Reactor Performance ....................................... A-44
Additional Wastewater Characteristics During May 14-21,1986 ............. A-48
Description of I.T.T. Rayonier On-Site Samples ............................. A-48
Toxicity and Ammonia for I.T.T. Rayonier Effluent Samples ................. A-50
xi
Glossary
The following terms and abbreviations are used in this document:
BMP
BOD
COD
CWA
DOT
EDTA
MSDS
NOEL
NPDES
OSHA
RCRA
SIC
SIE
TIE
TOC
TRE
TSD
TSS
TU
WWTP
Best Management Practices
Biological oxygen demand
Chemical oxygen demand
Clean Water Act
U.S. Department of Transportation
Ethylenediaminetetraacetic acid
Material safety data sheet
No observable effect levels
National Pollutant Discharge Elimination System
Occupational Safety and Health Administration
Resource Conservation and Recovery Act
Standard industrial classification
Source identification evaluation
Toxicity identification evaluation
Total organic carbon
Toxicity reduction evaluation
Technical support document for water quality-basedtoxics control (U.S. EPA 1985)
Total suspended solids
Toxicity unit
Wastewater treatment plant
xii
Acknowledgments
Battelle Columbus Division (BCD) prepared this document for the Risk ReductionEngineering Laboratory (RREL), U.S. Environmental Protection Agency, Cincinnati,Ohio. Mr. Kenneth Dostal of RREL was the Project Officer. Principal contributorsinclude Dr. James A. Fava, Dr. William H. Clement and Daniel Lindsay, P.E. Othercontributors include Srinivas Krishnan, Dennis McIntyre, Ron Clark, Dr. John D.Cooney, and Dr. G. Michael DeGraeve, technical reviewer.
Battelle Columbus Division used the expertise of four subcontractors to prepare thisdocument. Principal contributors include Dr. Stephen R. Hansen of S. R. Hansen andAssociates and William Rue of EA Engineering, Science and Technology, Inc. Othercontributors include Samuel B. Moore of Burlington Research, Inc., and PerryLankford, P.E., of Aware, Inc. Ms. Linda Anderson-Carnahan, Region V, U.S.Environmental Protection Agency, Dr. Philip Dorn of Shell Development Corporation,and Dr. Donald Grothe of Monsanto Corporation are acknowledged for their valuablecontributions and as technical reviewers.
Mr. John Cannel1 of the Permits Division, U.S. Environmental Protection Agencyserved as the Agency’s principal technical reviewer and contributed significantly tothe development of this document.
The efforts and encouragement of William F. Brandes with the Permits Division areacknowledged.
. . .XIII
Section IIIntroduction
Purpose
The purpose of this document is to present guidancefor the performance of Toxicity ReductionEvaluations (TREs) at industrial facilities. This isaccomplished by presenting a generalizedmethodology for designing and conducting a TRE andis supported with case studies which illustratevarious approaches that have been used in theperformance of TREs to date. A synthesis of themethods and approaches employed in these casestudies provided the basis for the generalizedmethodology.
This document is intended for use by industrialfacilities that are required to perform a TRE.Permitting agencies may also use this document forreviewing plans submitted by regulated industries.In addition, supporting organizations that arepreparing a site-specific TRE plan or conducting aTRE may use this document as a guide.
Regulatory FrameworkOn March 9, 1984, the U.S. EnvironmentalProtection Agency (EPA) published a national policystatement entitled “Policy for the Development ofWater Quality-Based Permit Limitation for ToxicPollutants (U.S. EPA 1984). To implement the policy,EPA issued the Technical Support Document (TSD)for Water Quality-Based Toxics Control (U.S. EPA1985a). T h e T S D p r e s e n t e d p r o c e d u r a lrecommendations for identifying, analyzing, andcontrolling adverse water quality impacts caused bythe discharge of toxic pollutants.
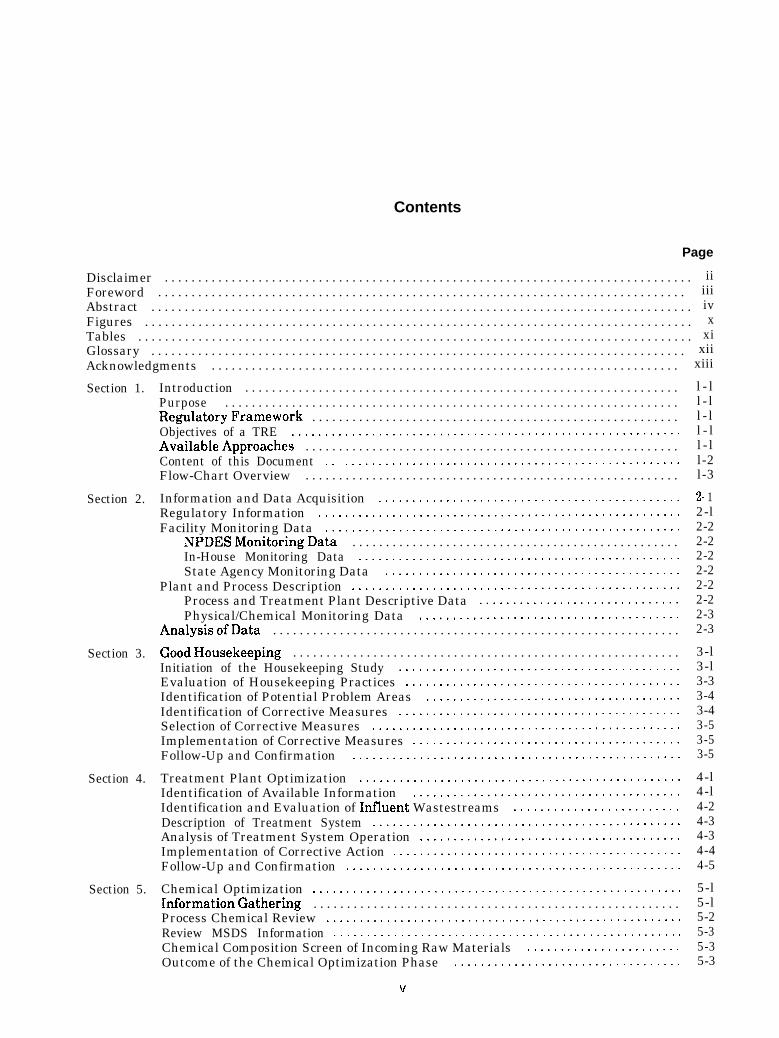
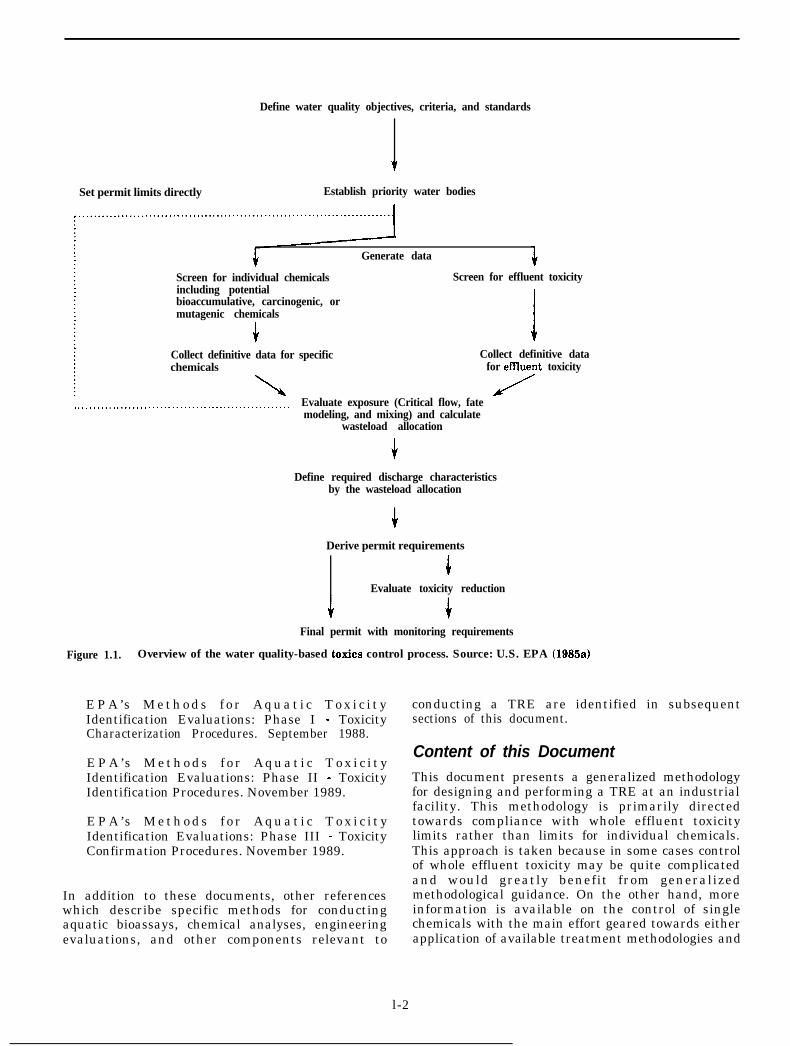
The overall process that one might go through toevaluate the potential impacts of an effluentdischarge to an aquatic environment and the need toestablish additional water quality based toxiccontrols is shown in Figure 1.1. This schematicillustrates the steps to be taken, from definition ofwater quality objectives, criteria, and standards, tothe setting of the final permit conditions withmonitoring requirements. When National PollutantDischarge Elimination System (NPDES) permitteescannot achieve effluent limitations for toxicity, EPAor a state regulatory authority may require thedischarger to conduct a Toxicity Reduction
Evaluation. The legal basis for requiring TREs isdiscussed in the Permit Writer’s Guide to Water-Quality-Based Permitting for Toxic Pollutants (U.S.EPA 1987a)
Objectives of a IRE
A TRE is an evaluation intended to determine thoseactions necessary to achieve compliance with waterquality-based effluent limits (i.e., reducing aneffluent’s toxicity or chemical concentration(s) toacceptable levels). Water quality-based limits (i.e.the regulatory target) could include limits on wholeeffluent acute or chronic toxicity, and/or limits onindividual chemical constituents. These limits areintended to protect beneficial uses of waterbodies,and consider factors such as dilution, environmentalfate, and the sensitivity of the resident aquaticcommunity. The TRE may identify a remedial actionas simple as improved “housekeeping” procedures orthe need to modify the operation of a component ofthe wastewater treatment system. On the other hand,for complex facilities with numerous and variablewastestreams, a TRE may involve a more extensiveinvestigation to identify toxicant of concern and/orcost-effective treatment or source reduction options.
Available ApproachesThis document describes how to design and perform aTRE at an industrial facility.Other documents whichprovide guidance for performing specific componentsof this overall process are:
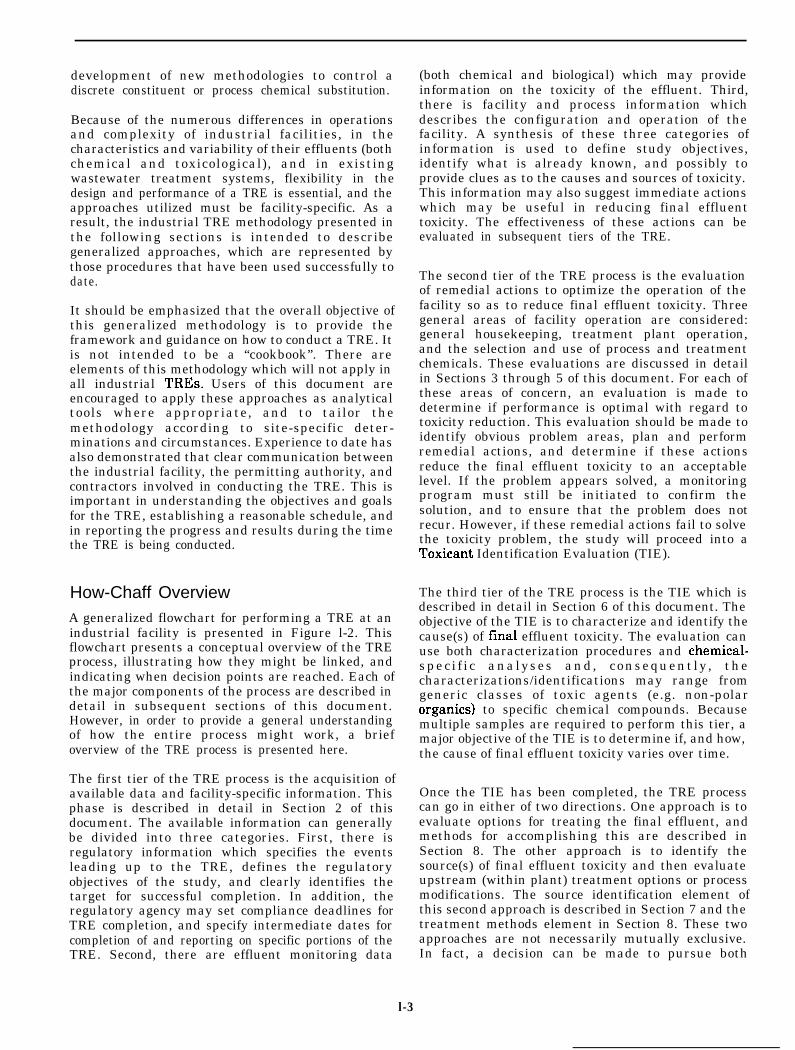
EPA’s Technical Support Document for WaterQuality-Based Toxics Control. Office of Water,Washington, D.C., pages 57-58 (1985a).
EPA’s Permit Writer’s Guide to Water Quality-Based Permitting for Toxic Pollutants. Office ofWater, Washington, D.C., pages 43-54 (1987).
EPA’s Toxicity Reduction Evaluation Protocol forMunicipal Wastewater Treatment Plants.November 1989.
l-1
Define water quality objectives, criteria, and standards
Set permit limits directly Establish priority water bodies
Generate data
Screen for individual chemicals Screen for effluent toxicityincluding potentialbioaccumulative, carcinogenic, ormutagenic chemicals
4 ICollect definitive data for specific Collect definitive datachemicals for efIluent toxicity
\,...............................................~...... Evaluate exposure (Critical flow, fate
modeling, and mixing) and calculatewasteload allocation
Define required discharge characteristicsby the wasteload allocation
Derive permit requirements
4Evaluate toxicity reduction
Final permit with monitoring requirements
Figure 1.1. Overview of the water quality-based toxics control process. Source: U.S. EPA (1985a)
E P A ’ s M e t h o d s f o r A q u a t i c T o x i c i t yIdentification Evaluations: Phase I - ToxicityCharacterization Procedures. September 1988.
E P A ’ s M e t h o d s f o r A q u a t i c T o x i c i t yIdentification Evaluations: Phase II - ToxicityIdentification Procedures. November 1989.
E P A ’ s M e t h o d s f o r A q u a t i c T o x i c i t yIdentification Evaluations: Phase III - ToxicityConfirmation Procedures. November 1989.
In addition to these documents, other referenceswhich describe specific methods for conductingaquatic bioassays, chemical analyses, engineeringevaluations, and other components relevant to
conducting a TRE are identified in subsequentsections of this document.
Content of this DocumentThis document presents a generalized methodologyfor designing and performing a TRE at an industrialfacility. This methodology is primarily directedtowards compliance with whole effluent toxicitylimits rather than limits for individual chemicals.This approach is taken because in some cases controlof whole effluent toxicity may be quite complicatedand would greatly benefit from generalizedmethodological guidance. On the other hand, moreinformation is available on the control of singlechemicals with the main effort geared towards eitherapplication of available treatment methodologies and
l-2
development of new methodologies to control adiscrete constituent or process chemical substitution.
Because of the numerous differences in operationsand complexity of industrial facilities, in thecharacteristics and variability of their effluents (bothchemical and toxicological), and in existingwastewater treatment systems, flexibility in thedesign and performance of a TRE is essential, and theapproaches utilized must be facility-specific. As aresult, the industrial TRE methodology presented inthe following sections is intended to describegeneralized approaches, which are represented bythose procedures that have been used successfully todate.
It should be emphasized that the overall objective ofthis generalized methodology is to provide theframework and guidance on how to conduct a TRE. Itis not intended to be a “cookbook”. There areelements of this methodology which will not apply inall industrial TREs. Users of this document areencouraged to apply these approaches as analyticaltools where appropriate, and to tailor themethodology according to site-specific deter-minations and circumstances. Experience to date hasalso demonstrated that clear communication betweenthe industrial facility, the permitting authority, andcontractors involved in conducting the TRE. This isimportant in understanding the objectives and goalsfor the TRE, establishing a reasonable schedule, andin reporting the progress and results during the timethe TRE is being conducted.
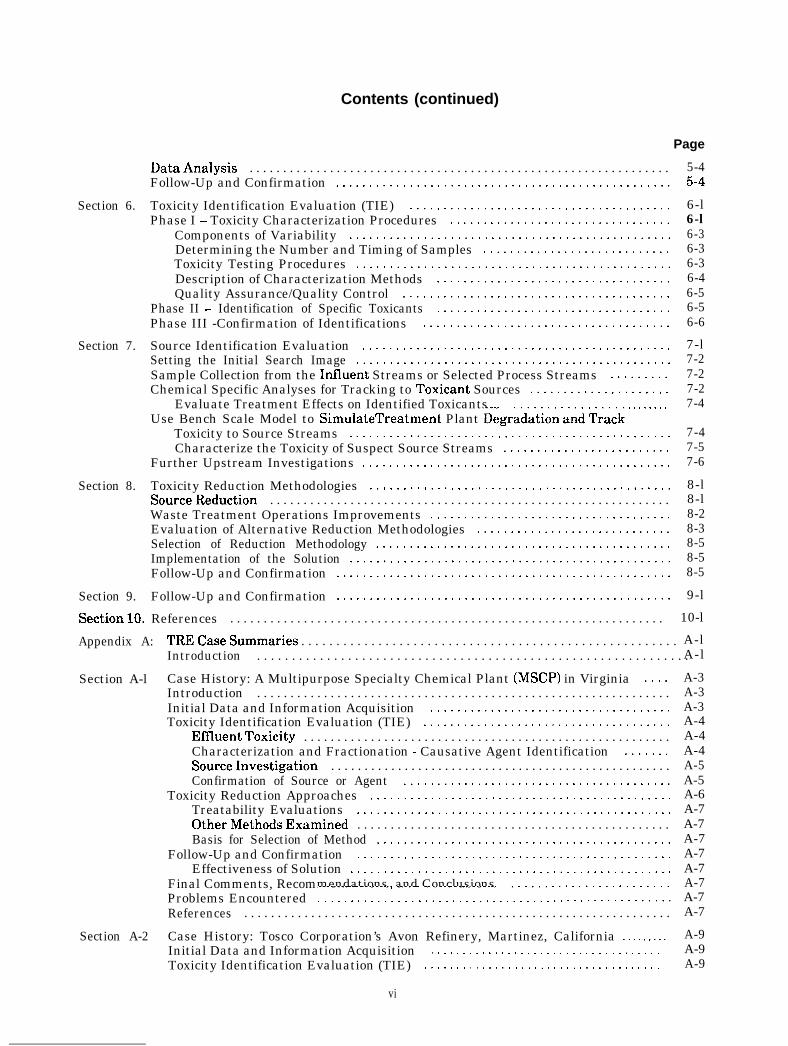
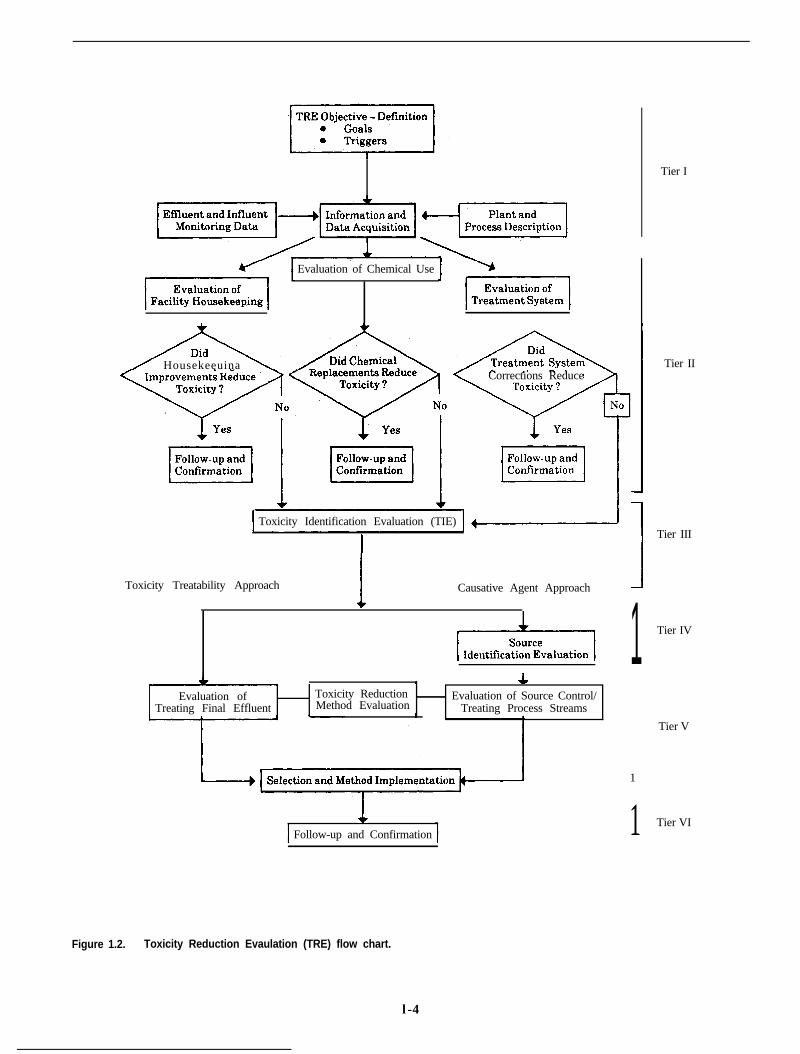
How-Chaff OverviewA generalized flowchart for performing a TRE at anindustrial facility is presented in Figure l-2. Thisflowchart presents a conceptual overview of the TREprocess, illustrating how they might be linked, andindicating when decision points are reached. Each ofthe major components of the process are described indetail in subsequent sections of this document.However, in order to provide a general understandingof how the entire process might work, a briefoverview of the TRE process is presented here.
The first tier of the TRE process is the acquisition ofavailable data and facility-specific information. Thisphase is described in detail in Section 2 of thisdocument. The available information can generallybe divided into three categories. First, there isregulatory information which specifies the eventsleading up to the TRE, defines the regulatoryobjectives of the study, and clearly identifies thetarget for successful completion. In addition, theregulatory agency may set compliance deadlines forTRE completion, and specify intermediate dates forcompletion of and reporting on specific portions of theTRE. Second, there are effluent monitoring data
(both chemical and biological) which may provideinformation on the toxicity of the effluent. Third,there is facility and process information whichdescribes the configuration and operation of thefacility. A synthesis of these three categories ofinformation is used to define study objectives,identify what is already known, and possibly toprovide clues as to the causes and sources of toxicity.This information may also suggest immediate actionswhich may be useful in reducing final effluenttoxicity. The effectiveness of these actions can beevaluated in subsequent tiers of the TRE.
The second tier of the TRE process is the evaluationof remedial actions to optimize the operation of thefacility so as to reduce final effluent toxicity. Threegeneral areas of facility operation are considered:general housekeeping, treatment plant operation,and the selection and use of process and treatmentchemicals. These evaluations are discussed in detailin Sections 3 through 5 of this document. For each ofthese areas of concern, an evaluation is made todetermine if performance is optimal with regard totoxicity reduction. This evaluation should be made toidentify obvious problem areas, plan and performremedial actions, and determine if these actionsreduce the final effluent toxicity to an acceptablelevel. If the problem appears solved, a monitoringprogram must still be initiated to confirm thesolution, and to ensure that the problem does notrecur. However, if these remedial actions fail to solvethe toxicity problem, the study will proceed into aToxicant Identification Evaluation (TIE).
The third tier of the TRE process is the TIE which isdescribed in detail in Section 6 of this document. Theobjective of the TIE is to characterize and identify thecause(s) of final effluent toxicity. The evaluation canuse both characterization procedures and chemical-spec i f i c analyses and, consequent ly , thecharacterizations/identifications may range fromgeneric classes of toxic agents (e.g. non-polarorganics) to specific chemical compounds. Becausemultiple samples are required to perform this tier, amajor objective of the TIE is to determine if, and how,the cause of final effluent toxicity varies over time.
Once the TIE has been completed, the TRE processcan go in either of two directions. One approach is toevaluate options for treating the final effluent, andmethods for accomplishing this are described inSection 8. The other approach is to identify thesource(s) of final effluent toxicity and then evaluateupstream (within plant) treatment options or processmodifications. The source identification element ofthis second approach is described in Section 7 and thetreatment methods element in Section 8. These twoapproaches are not necessarily mutually exclusive.In fact, a decision can be made to pursue both
l-3
Tier I
Evaluation of Chemical Use
Tier II/ Housekeeuina \ L ?rdGhe’Corrections Reduce
Toxicity Identification Evaluation (TIE)Tier III
1 Tier IV
1
Tier V
1 Tier VI
Toxicity Treatability Approach
1Causative Agent Approach
Evaluation ofTreating Final Effluent
I LToxicity Reduction Evaluation of Source Control/Method Evaluation
A Treating Process Streams
+Follow-up and Confirmation
Figure 1.2. Toxicity Reduction Evaulation (TRE) flow chart.
l-4
approaches simultaneously, and then to select themost technically and economically attractive option.
The source identification evaluation (SIE) is thefourth tier in the TRE process. The objective of thisevaluation is to identify those process streams whichare significant sources of final effluent toxicity. Afirst step in the SIE may be to review the informationand data collected on the causes of final effluenttoxicity. This synthesis forms a search image forupstream sources. The subsequent approach woulddepend upon the specificity of this search image. If aspecific toxic chemical has been identified as thecausative agent, the SIE would be straightforwardand have a high probability of success. It wouldinvolve the chemical analysis of process streams forthe identified causative agent or its parentcompound(s). Those process streams which containthe causative agent in sufficient concentrationswould clearly be designated as sources of finaleffluent toxicity. On the other hand, if the searchimage is more general (e.g., a class of toxiccompounds), the SIE may be more complicated. Itwould include the determination of thecharacteristics of the toxicity in the process streamsfeeding into the wastewater treatment system. A
comparison of process stream characteristics againstthe search image would then be used to identify thoseprocess streams which are prime suspects as thesource(s) of final emuent toxicity. In either case, thetreatability or application of other control methods tothese process streams would then be evaluated andthe effectiveness confirmed according to methodsdescribed in Tier V (Section 8).
The evaluation of toxicity reduction methods, thefifth tier of the TRE process, is described in Section 8.The objective of this tier is to identify methods forreducing toxicity in the final effluent and/or sourcestreams. Each method would be evaluated fortechnical and economic feasibility and the mosteffective method would be selected and implemented.
Follow-up and confirmation is the sixth and final tierof the TRE process and is described in Section 9. Thistier becomes operative after the selected method fortoxicity reduction has been implemented. Once theselected toxicity reduction alternative has beenimplemented, continued efI”luent toxicity testing overtime is important to confirm that the toxicity targethas been achieved and is being maintained.
l-5
Section 2Information and Data Acquisition
The first step (Tier I) in performing a TRE should bethe collection and analysis of any availableinformation and data which might prove useful indesigning the best directed and most cost-effectivestudy for the facility under consideration. Thepertinent information that is generally availablefalls into three categories:
the regulatory information which describes whythe TRE is being required and what objectivesare to be met (the NPDES permit requirementand schedule, for example);
the emuent monitoring data which describe thetoxicity and physical/chemical nature of the finaleffluent; and
plant and process information which describesthe physical layout of the plant, the processes inoperation, and the physical/chemical nature ofprocess wastewaters.
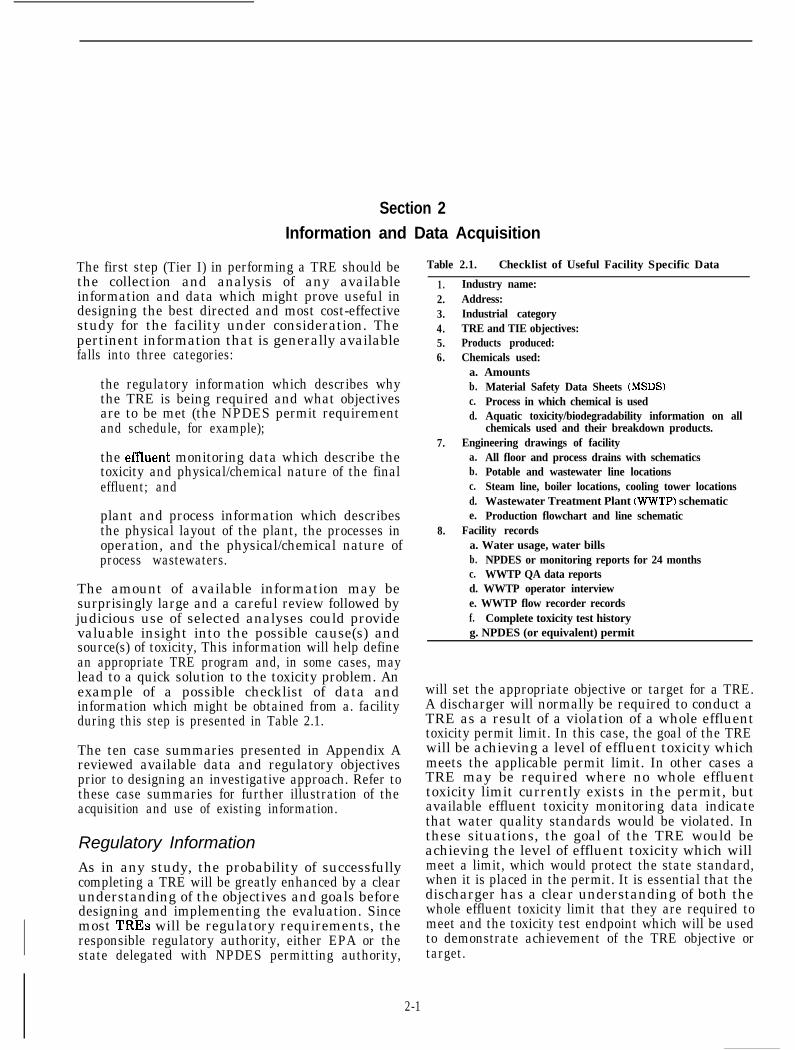
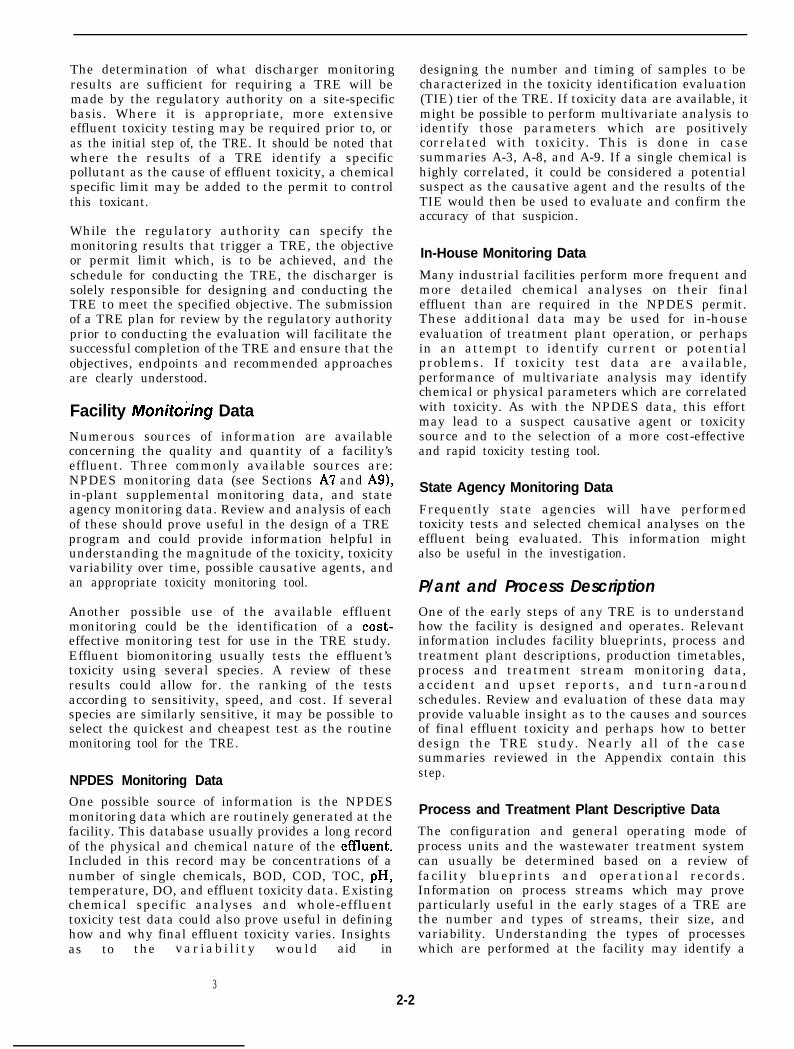
The amount of available information may besurprisingly large and a careful review followed byjudicious use of selected analyses could providevaluable insight into the possible cause(s) andsource(s) of toxicity, This information will help definean appropriate TRE program and, in some cases, maylead to a quick solution to the toxicity problem. Anexample of a possible checklist of data andinformation which might be obtained from a. facilityduring this step is presented in Table 2.1.
The ten case summaries presented in Appendix Areviewed available data and regulatory objectivesprior to designing an investigative approach. Refer tothese case summaries for further illustration of theacquisition and use of existing information.
Regulatory InformationAs in any study, the probability of successfullycompleting a TRE will be greatly enhanced by a clearunderstanding of the objectives and goals beforedesigning and implementing the evaluation. Sincemost TREs will be regulatory requirements, theresponsible regulatory authority, either EPA or thestate delegated with NPDES permitting authority,
Table 2.1. Checklist of Useful Facility Specific Data
1. Industry name:2. Address:3. Industrial category4. TRE and TIE objectives:5. Products produced:6. Chemicals used:
a. Amountsb. Material Safety Data Sheets (MSDS)c. Process in which chemical is usedd. Aquatic toxicity/biodegradability information on all
chemicals used and their breakdown products.7. Engineering drawings of facility
a. All floor and process drains with schematicsb. Potable and wastewater line locationsc. Steam line, boiler locations, cooling tower locationsd. Wastewater Treatment Plant (WWTP) schematice. Production flowchart and line schematic
8. Facility recordsa. Water usage, water billsb. NPDES or monitoring reports for 24 monthsc. WWTP QA data reportsd. WWTP operator interviewe. WWTP flow recorder recordsf. Complete toxicity test historyg. NPDES (or equivalent) permit
will set the appropriate objective or target for a TRE.A discharger will normally be required to conduct aTRE as a result of a violation of a whole effluenttoxicity permit limit. In this case, the goal of the TREwill be achieving a level of effluent toxicity whichmeets the applicable permit limit. In other cases aTRE may be required where no whole effluenttoxicity limit currently exists in the permit, butavailable effluent toxicity monitoring data indicatethat water quality standards would be violated. Inthese situations, the goal of the TRE would beachieving the level of effluent toxicity which willmeet a limit, which would protect the state standard,when it is placed in the permit. It is essential that thedischarger has a clear understanding of both thewhole effluent toxicity limit that they are required tomeet and the toxicity test endpoint which will be usedto demonstrate achievement of the TRE objective ortarget.
2-1
The determination of what discharger monitoringresults are sufficient for requiring a TRE will bemade by the regulatory authority on a site-specificbasis. Where it is appropriate, more extensiveeffluent toxicity testing may be required prior to, oras the initial step of, the TRE. It should be noted thatwhere the results of a TRE identify a specificpollutant as the cause of effluent toxicity, a chemicalspecific limit may be added to the permit to controlthis toxicant.
While the regulatory authority can specify themonitoring results that trigger a TRE, the objectiveor permit limit which, is to be achieved, and theschedule for conducting the TRE, the discharger issolely responsible for designing and conducting theTRE to meet the specified objective. The submissionof a TRE plan for review by the regulatory authorityprior to conducting the evaluation will facilitate thesuccessful completion of the TRE and ensure that theobjectives, endpoints and recommended approachesare clearly understood.
Facility Moniton’ng DataNumerous sources of information are availableconcerning the quality and quantity of a facility’seffluent. Three commonly available sources are:NPDES monitoring data (see Sections A7 and A9),in-plant supplemental monitoring data, and stateagency monitoring data. Review and analysis of eachof these should prove useful in the design of a TREprogram and could provide information helpful inunderstanding the magnitude of the toxicity, toxicityvariability over time, possible causative agents, andan appropriate toxicity monitoring tool.
Another possible use of the available effluentmonitoring could be the identification of a cost-effective monitoring test for use in the TRE study.Effluent biomonitoring usually tests the effluent’stoxicity using several species. A review of theseresults could allow for. the ranking of the testsaccording to sensitivity, speed, and cost. If severalspecies are similarly sensitive, it may be possible toselect the quickest and cheapest test as the routinemonitoring tool for the TRE.
NPDES Monitoring DataOne possible source of information is the NPDESmonitoring data which are routinely generated at thefacility. This database usually provides a long recordof the physical and chemical nature of the efYluent.Included in this record may be concentrations of anumber of single chemicals, BOD, COD, TOC, pH,temperature, DO, and effluent toxicity data. Existingchemical specific analyses and whole-effluenttoxicity test data could also prove useful in defininghow and why final effluent toxicity varies. Insightsas to the var iabi l i ty would aid in
3
designing the number and timing of samples to becharacterized in the toxicity identification evaluation(TIE) tier of the TRE. If toxicity data are available, itmight be possible to perform multivariate analysis toidentify those parameters which are positivelycorrelated with toxicity. This is done in casesummaries A-3, A-8, and A-9. If a single chemical ishighly correlated, it could be considered a potentialsuspect as the causative agent and the results of theTIE would then be used to evaluate and confirm theaccuracy of that suspicion.
In-House Monitoring Data
Many industrial facilities perform more frequent andmore detailed chemical analyses on their finaleffluent than are required in the NPDES permit.These additional data may be used for in-houseevaluation of treatment plant operation, or perhapsin an attempt to identify current or potentialproblems. If toxicity test data are available,performance of multivariate analysis may identifychemical or physical parameters which are correlatedwith toxicity. As with the NPDES data, this effortmay lead to a suspect causative agent or toxicitysource and to the selection of a more cost-effectiveand rapid toxicity testing tool.
State Agency Monitoring Data
Frequently state agencies will have performedtoxicity tests and selected chemical analyses on theeffluent being evaluated. This information mightalso be useful in the investigation.
P/ant and Process DescriptionOne of the early steps of any TRE is to understandhow the facility is designed and operates. Relevantinformation includes facility blueprints, process andtreatment plant descriptions, production timetables,process and treatment stream monitoring data,accident and upset reports, and turn-aroundschedules. Review and evaluation of these data mayprovide valuable insight as to the causes and sourcesof final effluent toxicity and perhaps how to betterdesign the TRE study. Nearly all of the casesummaries reviewed in the Appendix contain thisstep.
Process and Treatment Plant Descriptive DataThe configuration and general operating mode ofprocess units and the wastewater treatment systemcan usually be determined based on a review offacility blueprints and operational records.Information on process streams which may proveparticularly useful in the early stages of a TRE arethe number and types of streams, their size, andvariability. Understanding the types of processeswhich are performed at the facility may identify a
2-2
suspect stream because of problems that have beenobserved in the same or similar streams in otherfacilities.
Knowledge of the scheduled changes or events inprocess stream operation (i.e., batch, continuous, orintermittent) when coupled with toxicity data mayprovide strong evidence as to possible sources of finaleffluent toxicity and the reasons for variability ofeffluent toxicity. For example, assume that aparticular process is run as a three-day batchoperation once every two weeks; starting on Mondayand ending on Wednesday. A review of the toxicitytest results indicates that final effluent toxicity alsogenerally follows the same two week pattern. Thiscorrelation would cause an investigator to furtherevaluate this evidence. In addition, correlationsbetween turn-around schedules and toxicity couldprove very useful in determining suspect sourcestreams. If toxicity disappears while a process unit isundergoing service and reappears when the unit isback on line, a suspect stream has been identified andthis lead should be pursued. Similarly, it is often seenthat toxicity will increase when a unit starts up andthen decrease to background levels after a few hoursor days of operation. Good quality data from grabsamples may permit identification of this type ofphenomenon.
On the treatment system side, the information whichmight prove the most useful in the early stages of aTRE include the types and configuration ofequipment, flow equalization facilities, and records oftreatment plant upsets. Understanding the retentiontime of the system should help in selecting the properfrequency of testing required to detect effluentvariability in the toxicity identification evaluationtier of the TRE. Correlations between plant upsetsand toxicity events would suggest that aninvestigation of treatment plant operation should beone of the first components of the TRE study.
Physical/Chemical Monitoring Data
2-3
Another potentially productive approach could becorrelations between season and toxicity. If such apattern has been observed, and operating dataindicate that the treatment system is less eficientduring the period when high toxicity is measured,further evaluation of the treatment system may bewarranted.
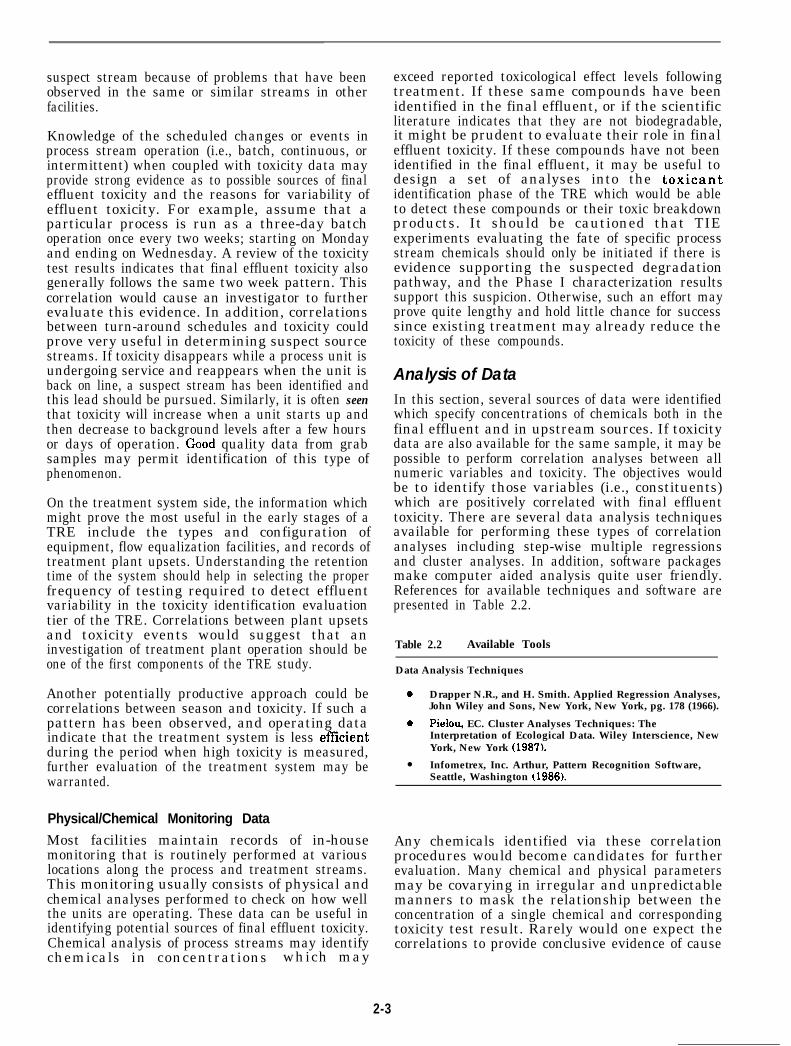
Most facilities maintain records of in-housemonitoring that is routinely performed at variouslocations along the process and treatment streams.This monitoring usually consists of physical andchemical analyses performed to check on how wellthe units are operating. These data can be useful inidentifying potential sources of final effluent toxicity.Chemical analysis of process streams may identifychemicals in concentrations which may
exceed reported toxicological effect levels followingtreatment. If these same compounds have beenidentified in the final effluent, or if the scientificliterature indicates that they are not biodegradable,it might be prudent to evaluate their role in finaleffluent toxicity. If these compounds have not beenidentified in the final effluent, it may be useful todesign a set of analyses into the toxicantidentification phase of the TRE which would be ableto detect these compounds or their toxic breakdownproducts. It should be cautioned that TIEexperiments evaluating the fate of specific processstream chemicals should only be initiated if there isevidence supporting the suspected degradationpathway, and the Phase I characterization resultssupport this suspicion. Otherwise, such an effort mayprove quite lengthy and hold little chance for successsince existing treatment may already reduce thetoxicity of these compounds.
Analysis of DataIn this section, several sources of data were identifiedwhich specify concentrations of chemicals both in thefinal effluent and in upstream sources. If toxicitydata are also available for the same sample, it may bepossible to perform correlation analyses between allnumeric variables and toxicity. The objectives wouldbe to identify those variables (i.e., constituents)which are positively correlated with final effluenttoxicity. There are several data analysis techniquesavailable for performing these types of correlationanalyses including step-wise multiple regressionsand cluster analyses. In addition, software packagesmake computer aided analysis quite user friendly.References for available techniques and software arepresented in Table 2.2.
Table 2.2 Available Tools
Data Analysis Techniques
0 Drapper N.R., and H. Smith. Applied Regression Analyses,John Wiley and Sons, New York, New York, pg. 178 (1966).
0 Pielou, EC. Cluster Analyses Techniques: TheInterpretation of Ecological Data. Wiley Interscience, NewYork, New York (1987).
l Infometrex, Inc. Arthur, Pattern Recognition Software,Seattle, Washington (1986).
Any chemicals identified via these correlationprocedures would become candidates for furtherevaluation. Many chemical and physical parametersmay be covarying in irregular and unpredictablemanners to mask the relationship between theconcentration of a single chemical and correspondingtoxicity test result. Rarely would one expect thecorrelations to provide conclusive evidence of cause
and effect. However, significantly positivecorrelations may act as a pointer in the TRE process,focusing attention to possible chemicals of concern,and may be used to support the results of the TIE andsource evaluation.
As a cautionary note, it should be recognized that apositive correlation between concentrations of asingle chemical and toxicity may prove to be a falselead. Some chemicals may covary with the actualtoxicant and, therefore, be mistaken as the causativeagent. For example, emulsifiers are often added topesticide formulations to promote solubility andfacilitate application. The concentration of the
emulsifier may correlate perfectly with toxicity, butit is probably not the toxic agent; in this case thepesticide would be the likely culprit.
In order to protect against the possibility of falsepositives, it is advisable to use Phase I ToxicityCharacterization Procedures as a check on positivecorrelations (see Section 6). If characterization testswhich are selected to specifically remove the suspectcausative toxicant (based on theirphysical/chemical nature) fail to remove orneutralize effluent toxicity, a false correlation islikely. Implementation of this check may preventgoing down blind alleys when the TRE proceeds intothe identification of specific causative agents.
2-4
Section 3Good Housekeeping
Good housekeeping at an industrial facility coversplant practices and operations which may directly orindirectly affect effluent water quality. Factorswhich are involved in this area include:
l General facility cleanliness/tidiness;
l Facility spill prevention and control;
l Waste and materials storage areas;
l Materials handling operations, including loadingstations, on-site transport, piping and valveassemblies;
l Waste handling and disposal operations; and
l Run-on/run-off control.
A facility which practices good housekeeping willreduce the chemical contributions which run-off,spillage, and similar occurrences make to toxicloading in the effluent stream.
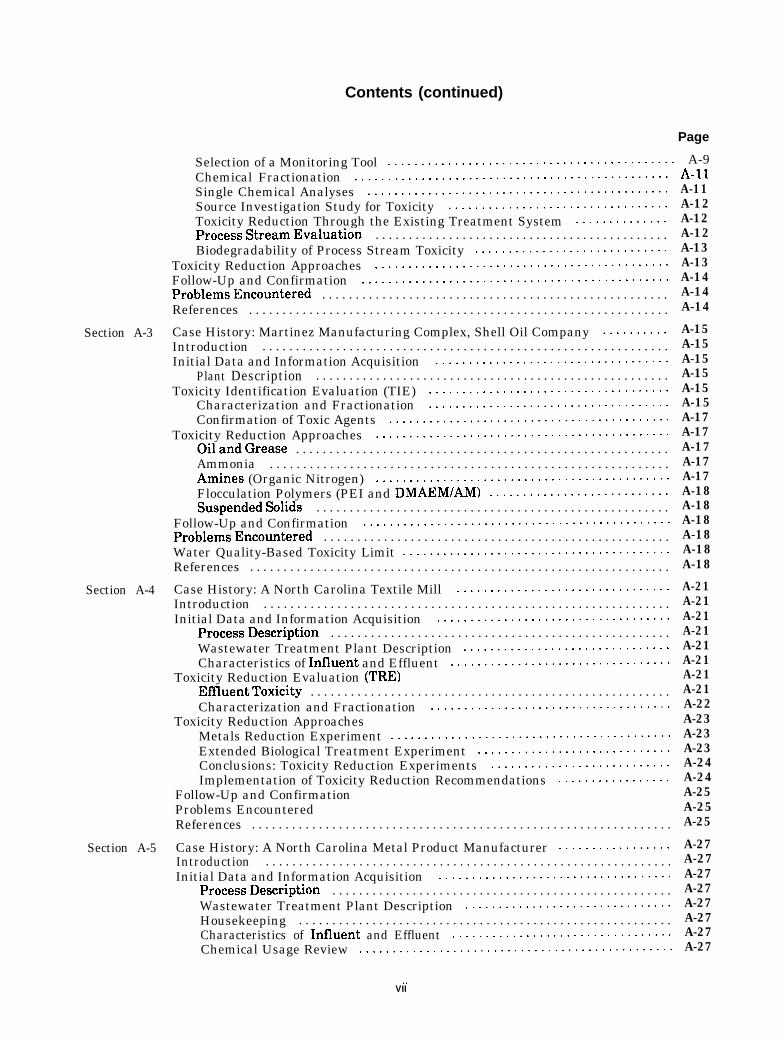
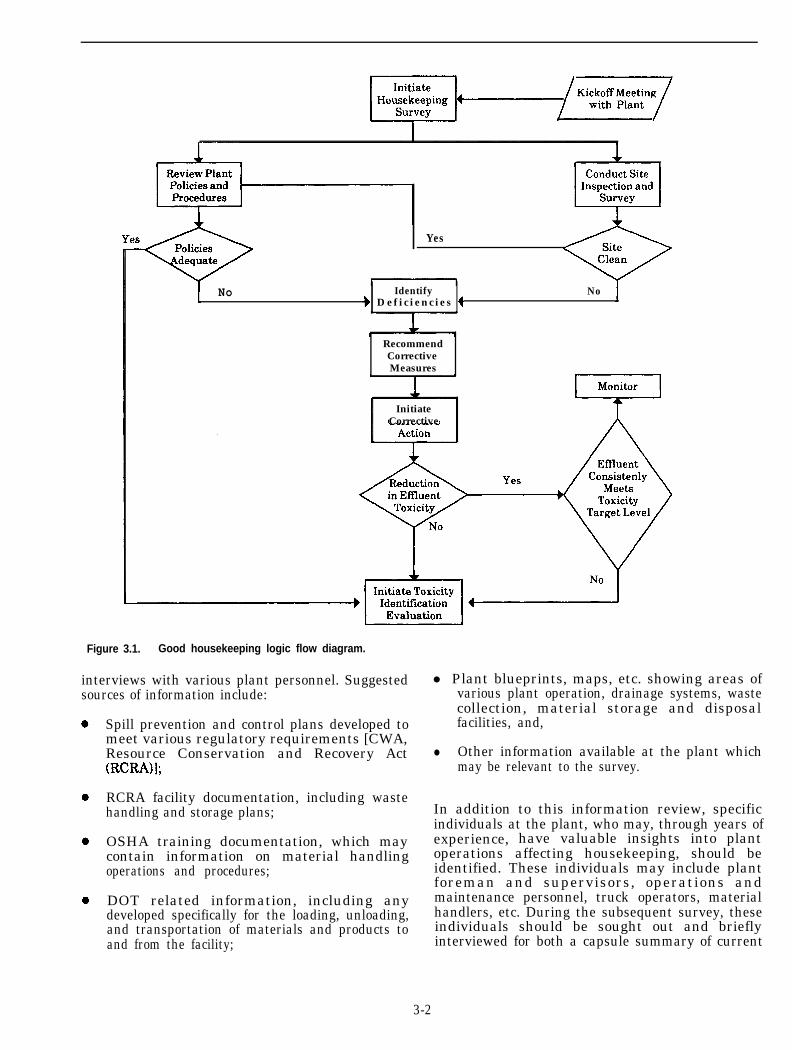
This section investigates the individual elements ofgood housekeeping at an industrial facility andpresents criteria by which these may be assessed.Methods to identify corrective measures areexamined. Selection and implementation ofappropriate corrective measures, and follow-upstudies, round out the discussion. Throughout, it isassumed that a preliminary survey will focus ondiscovery and subsequent improvements. Figure 3.1depicts schematically the steps involved in a goodhousekeeping study. Examples of housekeepingapproaches are presented in Sections (Appendix) A-3,A-4, and A-5. These case summaries containexamples describing rerouting of waste streams,evaluation of dye machine ratios, and installation ofsimple drain traps to catch runoff materials.
initiation of the Housekeeping StudyWhen unacceptable toxicity is identified in theeffluent, a housekeeping survey should be planned.The intent of the survey is 1) to identify areas whichmay be contributing to the observed toxicity and 2)reduce these contributions through the use of best
management practices (BMPs), administrative andprocedural controls. Thus, low-cost, simple, directsolutions are desired.
The first step of the study requires the assembly andcoordination of the study team, and the collection ofrelevant plant information. This can often beaccomplished through a kick-off meeting at the plantwhere the participants get together to discuss thepurpose and limits of the survey.
Housekeeping surveys tend to be somewhatsubjective in nature. In order to avoid possibleconflict between the survey team and plantpersonnel, it should be clearly established that theteam is not seeking to uncover poor housekeeping butrather to uncover practices which, whether good orbad, may affect effluent toxicity. A clearunderstanding should be established with plantmanagement and operations prior to the survey,including:
the organizational channels which must befollowed to obtain authorization to make thenecessary changes;
the resources available from the plant toinvestigate, define and implement an operationalor procedural change; and
the extent of justification required prior toimplementation, including the effect that aparticular action (or inaction) may have onoverall plant operations;
the cost and ease of implementation, and thelevel of benefit expected.
The justification criteria should be general enoughthat they may be applied to any plant area, yetspecific enough that they yield useful information tothe facility.
Survey team members should review plantprocedures, documented and otherwise, to assess thelevel of importance placed on housekeeping. This willinclude documentation review as well as
3-1
Yes
No Identify_) D e f i c i e n c i e s 4
No
RecommendCorrectiveMeasures
InitiateCorrective
Figure 3.1. Good housekeeping logic flow diagram.
interviews with various plant personnel. Suggestedsources of information include:
Spill prevention and control plans developed tomeet various regulatory requirements [CWA,Resource Conservation and Recovery Act(RCRNI;
RCRA facility documentation, including wastehandling and storage plans;
OSHA training documentation, which maycontain information on material handlingoperations and procedures;
DOT related information, including anydeveloped specifically for the loading, unloading,and transportation of materials and products toand from the facility;
l Plant blueprints, maps, etc. showing areas ofvarious plant operation, drainage systems, wastecollection, material storage and disposalfacilities, and,
l Other information available at the plant whichmay be relevant to the survey.
In addition to this information review, specificindividuals at the plant, who may, through years ofexperience, have valuable insights into plantoperations affecting housekeeping, should beidentified. These individuals may include plantforeman and supervisors, operations andmaintenance personnel, truck operators, materialhandlers, etc. During the subsequent survey, theseindividuals should be sought out and brieflyinterviewed for both a capsule summary of current
3-2
operations, and a historical perspective of plantoperations.
Evaluation of Housekeeping PracticesOnce subject areas have been identified and relevantinformation gathered, the actual survey can begin.The survey approach presented below will be two-phased; one being a review of plant policies andprocedures, the other being a “walk-through”inspection. Areas included in the review andinspection are:
0
0
0
l
l
0
l
l
l
0
l
l
0
l
Vehicle loading and unloading areas;
Diked Storage Areas;
Waste accumulation and handling areas;
Waste storage areas;
Raw materials storage and handling areas;
Process area and reactor cleaning/washdownpractices;
Laboratory areas, including laboratory wastehandling practices;
Above and below ground piping systems,including vents, drains, cleanouts, valves, etc.;
Atmospheric venting practices and scrubberoperation;
Non-point source flow contributions, includingrunoff, springs, and seeps;
Previously used waste disposal sites;
Process equipment and piping salvage arearunoff;
Controlled/permitted stack emissions; and
Routine maintenance practices.
The list developed for a particular facility will bespecific to that facility, and may include other factorsnot listed above. Close coordination with sitepersonnel will assure that all major subject areas areaddressed.
Notice should be taken of areas subject to obvious orprevious release or spill instances. Raw materials,intermediates, final products and wastestreams areall included in this survey. Proximity of these areasto overland flow paths, drainage channels, manholes,etc., should be carefully noted. If necessary, runoff
3-3
patterns for the facility should be developed as an aidin assessing potential impacts.
The release of accumulated water from diked bulkstorage areas presents another area for assessment.Often, the criteria for release of accumulatedmaterial is by visual inspection (coloration, floatingoil/debris, etc.). These criteria may not be appropriatewhere the potentially toxic substances cannot bevisually detected.
Laboratory practices should also be examined,especially where they may involve the disposal ofsmall quantities of materials on a routine or regularbasis. Both analytical and research laboratoriesshould be examined. Laboratories can often be thesource of small quantities of highly toxic materials,which if improperly disposed, could have a majorimpact on effluent quality.
Regular maintenance, process modifications, andnew process development should also be included inthe survey. Timely detection of leaking valves,loosefittings, and deteriorated piping systems could have amajor impact on the overall cleanliness of the facility.Corrected in a timely fashion, the impact of theseareas on the final discharge from the facility shouldbe negligible. On the other hand, if problems are notdetected and corrected quickly, significant impactsare possible.
Atmospheric venting in process or material deliverylines may release toxic substances to the atmosphere.These may have opportunity to impact the effluentthrough atmospheric deposition on building surfacesand roadways, and subsequent wash-out duringrainfall events. Accumulation of small quantities ofsubstances over time may result in measurablereleases during and subsequent to rainfall events.
Probably the largest and most noticeable area ofconcern involves waste and materials handling andstorage. These locations are often subject to otherpermitting and administrative controls, such asRCRA and NPDES requirements. Therefore,housekeeping should generally be good. There is,however, a possibility that certain areas (such asfinal product loading) may slip through thesecontrols. An example would be the pumping ofstormwater from the tank containment area, whichhas been slightly contaminated by a highly toxic,nonbiodegradable substance. If such is the case, theremay be a need to address these areas during thehousekeeping survey.
When observed conditions are matched against theestablished criteria, a decision must be madewhether to initiate housekeeping changes or not. Toaid in this decision, it may be advantageous for theteam to develop a grading checklist. The grading,
like the survey, will be subjective. It should, however,provide a basis upon which a decision to proceed withcertain activities can be made, and determine howthese activities may be prioritized with regard totheir effect upon meeting effluent discharge limits.
identification of Potential Problem AreasAfter completing the preliminary evaluation,potential problem area identification should begin.Potential problem areas may be identified byexamination of the following:
l Probability of release of a toxic material;
l Type and frequency of release which may occur;
l Quantity of toxic substances involved;
l Toxicity of substances released;
l Potential downstream impact of the substancesreleased; and
l Effect of release on final effluent quality.
These and other factors that may be identified in theproblem area should be weighed. This weighting maycontain both subjective and objective elements. Forinstance, the likelihood of a release may be based onan operator’s perception of how often tanks areoverfilled (if no records are available), while the toxiceffect (in weight of toxicant per mass spilled) maywell be known. For example, the release of 1 unit of ahighly toxic material may be more crucial than therelease of 10 units of a mildly toxic material.
Included in this weighting should be someconsideration of the probable effect that a releasefrom a specific area may have on final effluenttoxicity. It may be that an area identified during thesurvey in need of housekeeping improvements. maynot have any impact on final effluent toxicity. Ifprobable impact areas can be isolated from non-impact areas, the completion of further studies can beexpedited.
Once the weighting process is complete, a relativeworth may be assigned to each problem area. Thismay be accomplished by considering loss of productormaterial, perceived harm to the environment, effortneeded for cleanup efforts, or other factors as may bedeemed appropriate. Factoring this relative worthwith the likelihood of a release will derive arelationship by which to gauge the necessity of ahousekeeping improvement. Sites subject to thehousekeeping study may be ranked, with thoserequiring immediate attention ranked above those oflesser concern. After this ranking is completed, the
identification and selection of corrective measuresmay begin.
If the housekeeping survey identifies no deficiencies,the TRE should proceed on to the TIE component.
identification of Corrective MeasuresAfter potential problem areas have been identified,appropriate corrective measures for these areas mustbe examined. Probable corrective measures mayinclude:
Area cleanup; paving or containment;
Process or operational changes;
Material loss collection and recovery (seeAppendix Section A-5);
Chemical and biological testing of containedwaters prior to release from diked storage areas;
Increased storage capacity for contained watersto avoid toxic “slugs” to the effluent during stormevents and washdowns of fire water systemusage; and
Equipment modifications or changes (seeAppendix Section A-3 and A-8).
Each corrective measure identified should be capableof resolving a potential trouble spot without creatingan undue burden on plant operations. Costeffectiveness and continuity of effectiveness shouldalso be of primary consideration. For example, aninitial cleanup of a product loading area may provideimmediate results. However, without changing theloading procedures which resulted in the untidinessin the first place, problems would recur. In this case,the final solution would require a second stage - thatbeing a procedural change in the way materialloading occurs, or a material loss collection andrecovery system.
Housekeeping practices are normally acquired orlearned. They may suffer from the “traditionsyndrome” - operations which have always beenconducted in a particular manner, and which plantpersonnel are unwilling or reluctant to change.Retraining, refocusing, or re-emphasizing may benecessary to reach the individuals involved. Othertimes, housekeeping can be improved by initiatingnew methods or procedures, where establishedconduct has never been formalized. The process offormalization may be sufficient to generate a positivechange.
Obviously, corrective measures would not berequired for areas with little or no potential foraffecting final effluent toxicity, although, once
3-4 I
identified, the measures might be implemented forother reasons. The probability of affecting a positivechange by the implementation of correctivemeasures, as well as the willingness of plantpersonnel to follow through with the requiredchanges once they have been identified should beconsidered.
Selection of Corrective MeasuresAfter appropriate corrective measures have beenidentified, a solution must be selected from them. Thebasis of the selection will include level of benefit,consideration of cost, ease of implementation, andtimeliness of solution.
Most housekeeping solutions will carry a relativelysmall price tag. This is because they will largelyinvolve procedural changes rather than physical orequipment changes. Where physical changes areinvolved the cost should be balanced against theperceived benefit.
Ease of implementation should be considered inselecting an appropriate solution. Obviously,solutions which involve minimal procedural changesand require little adjustment on the part of plantpersonnel will generally be better received than thosewhich require substantial changes in the way a job isconducted.
Timeliness of solution is another importantconsideration. Those solutions which may beinitiated quickly and with a minimum of plantinterruption, will create a higher level of acceptancefrom within the plant, and, therefore, a higherprobability of success.
Implementation of Corrective MeasuresOnce the appropriate measure has been identified,the implementation phase should begin. This phaseshould be carefully planned so as to maximize the useof plant personnel and expertise, thereby positivelyinfluencing acceptance of the program. As mosthousekeeping improvements will include procedural(Best Management Practices) rather than physicalchanges, acceptance and involvement by plantpersonnel is imperative for the continued success ofthe program.
As much control as possible over the implementationof the corrective measures should be placed in thehands of plant personnel. This is important, since thecontinued success of the correction will not bemeasured by the first activity, but rather bymaintaining the positive correction.
In order to confirm adequately the effectiveness of thecorrective measure, toxicity tests and Phase Icharacterization procedures should be conductedbefore and after implementation. The results of thesetests will be useful for comparison with the follow-upevaluation of effects.
Follow-Up and ConfirmationOnce the solution has been implemented, follow-upstudies should be initiated (see Section 9). Insummary, follow-up on housekeeping studies wouldinclude:
l Continuation of implementation;
l Evaluation and confirmation of effectiveness ontoxic releases (toxicity tests and Phase Icharacterization);
l Solution impact on affected operations; and
l Rigidity of continued implementation.
The goal of the follow-up is to determine 1) whetherthe solution as envisioned has had the plannedpositive effect on the toxicity of the final effluent andthe management of this toxicity reduction;2) whether the solutions were well received andeasily implemented by the plant personnel; and3) whether operations would continue to have apositive impact on toxicity reductions in the planteffluent. Follow-up studies may also help to identifyadditional areas of improvement which were not seenin the original study.
If follow-up studies indicate that housekeepingimprovements have not resulted in the desiredtoxicity reductions, then alternative solutions mustbe developed. This may require a more detailedidentilication of contributing Pactors isection @, an&investigation of source contributions (Section 7).
3-5
Section 4
Treatment Plant Optimization
A critical element in reducing toxicity in anindustrial facility’s effluent is the evaluation andoptimization of the facility wastewater treatmentplant. A well maintained plant, operating underdesign conditions, may be capable of providing anacceptable level of treatment for conventional ordesign parameters, and still allow toxic compounds tobe released to the environment. On the other hand,the same plant may be able to handle the majority oftoxics it encounters if adjustments are made whichallow operation of the treatment processes at otherthan design conditions. The objective of thisoptimization is to assure that the treatment plant isoperating in optimal fashion with respect to removalof its design parameters. This will maximize theprobability that toxicity will also be removed.
The process of operational optimization begins withthe recognition that an effluent’s toxicity exceedslimits established by rule or permit. Plant operationsoptimization runs simultaneous with housekeepingimprovements (Section 3) and chemical optimization(Section 5). The plant optimization process is depictedschematically in Figure 4.1, and its components aredescribed in detail in the remainder of this section.
As the optimization process begins, it may be helpfulto develop a checklist of parameters which bearexamination. This will be specific to the plant underconsideration and will be highly dependent upon theinformation gained from various sources at the plant.Sources of information might include plant personnel(both active and retired), design, and constructiondocuments, and operating records (including influentand effluent monitoring information).
This section discusses the steps required to criticallyassess and optimize a treatment facility’s operations.This discussion is general in nature, providing anoverview of the operational parameters to beconsidered and analytical techniques which might beused. A program for the evaluation of a facility willneed to be based upon conditions specific to thatparticular facility.
Case summaries presented in Appendix Sections A-3,A-4, and A-8 all contain some aspects of treatmentplant optimization. In Appendix Section A-3, it was
determined that fluctuations in Nitrobacter bacteriacorrelated with effluent toxicity, whereas, inAppendix A-4, increased retention of wastewater inthe activated sludge basin would reduce effluenttoxicity. In case summary A-8, the use of activatedsludge from municipal treatment plants wasevaluated.
Identification of Available InformationInformation of interest in this evaluation will dealwith the design and performance of the treatmentsystem. Plant design information includes adescription of the specific treatment units and howthey are linked, design capacity and loading rates,and what the plant was intended to treat. In addition,identification of design performance criteria willprove useful in evaluating current operationalperformance. This information may be available froma number of sources, including system designdocumentation, system modification documentation,facility blueprints, plant operating and maintenanceprocedures and protocols, and discussions with plantpersonnel.
Performance information may be available for boththe overall treatment process and for each of thecomponent units. Of particular value are data on thequality of all influent and effluent streams. This maybe available from monitoring reports and studies oroperational logs. Some facilities even have their datain computer data bases.
After this information gathering is complete, theoptimization sequence may begin. This sequence willinclude evaluation of the influent wastestreams,description and evaluation of the treatment system,and optimization of treatment operations. Thesesteps are described in the following sections.
Mentification and Evaluation of lnfluentWastestreamsChanges in plant processes at a facility are likely toresult in changes in the influent to the treatmentplant. Consequently, the final wastestream maycontain components which were not in the original
4-l
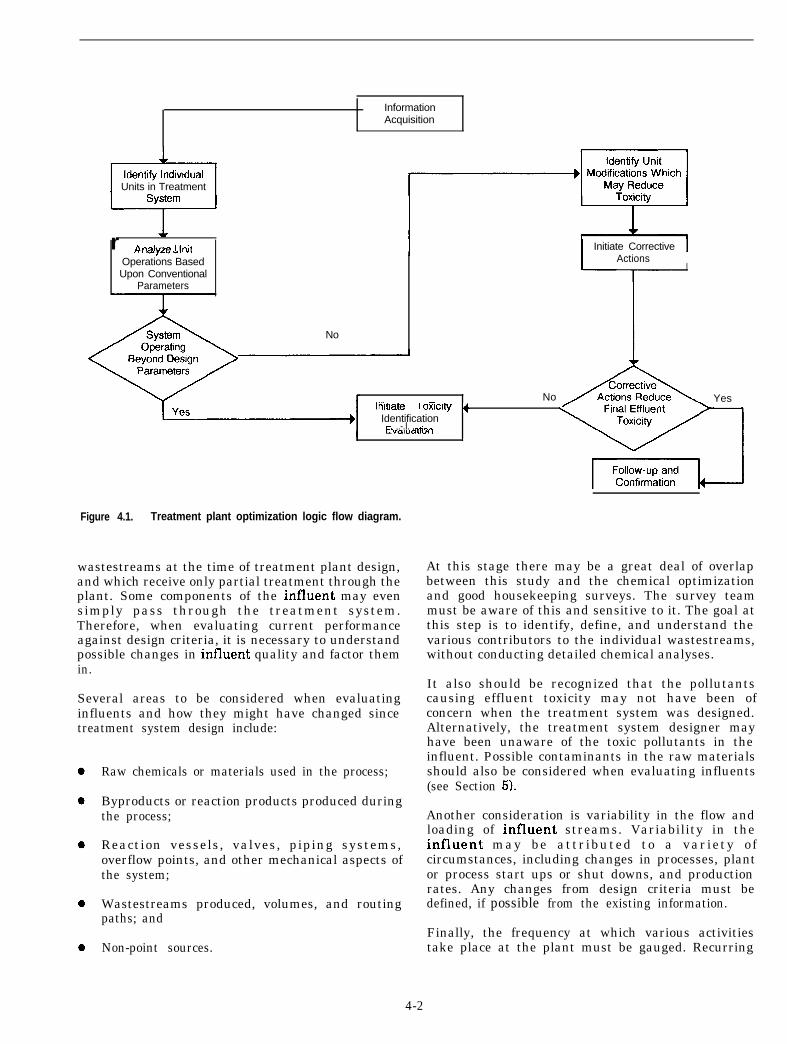
InformationAcquisition
Units in Treatment
r Analwe I hit I Initiate Corrective II . . ‘Y’,‘” WI . . .
Operations BasedUpon Conventional
Parameters
No
II” -Initlate Toxicity 4
-+IIdentification
c. ,.-.I. .rrc:-“.
ActionsI
No Yes
I cvaluaiwr i I
Figure 4.1. Treatment plant optimization logic flow diagram.
wastestreams at the time of treatment plant design,and which receive only partial treatment through theplant. Some components of the influent may evensimply pass through the treatment system.Therefore, when evaluating current performanceagainst design criteria, it is necessary to understandpossible changes in influent quality and factor themin.
Several areas to be considered when evaluatinginfluents and how they might have changed sincetreatment system design include:
Raw chemicals or materials used in the process;
Byproducts or reaction products produced duringthe process;
Reaction vessels, valves, piping systems,overflow points, and other mechanical aspects ofthe system;
Wastestreams produced, volumes, and routingpaths; and
Non-point sources.
At this stage there may be a great deal of overlapbetween this study and the chemical optimizationand good housekeeping surveys. The survey teammust be aware of this and sensitive to it. The goal atthis step is to identify, define, and understand thevarious contributors to the individual wastestreams,without conducting detailed chemical analyses.
It also should be recognized that the pollutantscausing effluent toxicity may not have been ofconcern when the treatment system was designed.Alternatively, the treatment system designer mayhave been unaware of the toxic pollutants in theinfluent. Possible contaminants in the raw materialsshould also be considered when evaluating influents(see Section 5).
Another consideration is variability in the flow andloading of influent streams. Variability in theinfluent may be attributed to a variety ofcircumstances, including changes in processes, plantor process start ups or shut downs, and productionrates. Any changes from design criteria must bedefined, if possible from the existing information.
Finally, the frequency at which various activitiestake place at the plant must be gauged. Recurring
4-2
activities, such as annual plant shutdowns, may havea significant impact on operations of the treatmentfacility. One would expect to find reduced loadingfrom normal process flows during this period.However, unique wastes generated during thecleaning and maintenance of various plantcomponents may have a significant impact ontreatment plant operations. Similarly, recurring butnon-continuous activities, such as boiler and coolingtower blowdowns, may add toxicity to the influentwhich may not be detected under some types ofsurveillance.
Description of Treatment System
The description of the treatment system begins byexamination of the design documents and subsequentmodifications. The objective at this stage is to definewhat types of pollutants the plant was designed toaccommodate, both qualitatively and quantitatively.Parameters of interest include:
l design basis for each constituent, includingvariability in flow conditions and concentrations;
0 treatment sequence;
l performance projections by constituents;
0 operational flexibility of each process; and
l treatment objectives and projected effluentstandards.
Design parameters which deserve special attentionat this stage include design flow and mass loadingrates. Most plants are designed to handle specific flowand mass loadings. These are usually based onloading projections, performance estimates, andpermit requirements at the time the treatmentsystem was designed. To account for uncertainty inproduction or design, factors of safety are usuallyincorporated. Many times design capacities will beexceeded in actual operations; sometimes resulting inplant upsets or po l lutant pass - through.Understanding the actual capacity of the system isnecessary in this analysis.
A flow schematic of the present system should bedeveloped which indicates sources of influent wastestreams, treatment steps in the process, sequencingof flows, losses within the treatment system,treatment by-products and final effluent disposition.The flow schematic should be simple, yet detailedenough to help determine whether the system, asdesigned, is being subjected to abnormal,unanticipated, or irregular flow and loadingconditions. A tabular summary should be prepared ofdesign capacities of each component.
Each process within the treatment system should beexamined and its impact on the final effluent qualityestimated. This evaluation should be made with boththe actual and design considerations of the system inmind. Specific parameters of investigation includewhether the unit is functioning according to designparameters and its ability to reduce non-designconstituents, such as toxics. Overall plantperformance will be judged through assessment ofboth operating and design information.
Available data on by-products of the treatmentprocess should also be examined during this phase.Of specific interest will be solid waste (sludge) andair emissions from the facility. Information on thecharacterization of these by-products will aid indetermining whether toxics removal is taking placein the present system. Special disposal problemsresulting from these emissions should be noted asthey may be affected either positively or negativelyby treatment process alterations.
In addition to the design parameters, the treatmentsystem should be evaluated as to its removalefficiency of other “non-design” parameters. Forinstance although activated sludge is typicallydesigned to remove BOD, many metals and non-polarorganics, potentially toxic compounds, are alsoremoved. Removal of non-design parameters whichmay be toxic should be evaluated and the impact ofprocess optimization or modification on their removalconsidered.
After examination of the treatment plant operations,the analyst should be able to suggest conditionsunder which the plant would operate most efficiently.The analyst should also be able to determine, basedupon knowledge and examination of the system,where treatment failure is likely to occur, and why.This knowledge will guide further analysis intoactual treatment systems operations, and ways tooptimize the performance.
Analysis of Treatment System Operation
After reviewing plant loading and designinformation, review of actual treatment plantoperation should begin. This is the step where theanalyst accumulates information on actual plantoperations and compares this to design, or theoreticaloperations to see how well the two compare. Atabular summary of system performance should beprepared as a comparison to design capacity for eachcomponent.
Two important parameters for this review are flowand mass loading. Either over or underloading maybe found to be significant in subsequent evaluations.Both impact plant operations and affect the quality ofeffluent from the treatment works. Overloading inthe plant can lead to poor treatment due to pass-
4-3
through of certain quantities of the constituent to betreated. Underloading indicates either overdesign orunder-utilization of capacity. An under-utilized planthas the capacity available to treat waste streams notpresently subject to treatment. Additionallyunderloading of BOD, a dilute waste stream forinstance, may reduce treatment efficiency.Information on plant loading is normally availablethrough records maintained at the treatment plant.
Plant bypassing also bears critical examination.Plant operators are often a good source ofinformation, as it is often the operator’s decision tobypass flow. Frequent bypassing may be indicative ofa plant operating at or near design capacity. Inaddition, bypassing may be a major source of toxicityin the final effluent. Bypassing during and afterheavy rainfall may allow toxic components in therunoff to be released to the receiving water withouttreatment. A thorough effort should be made tocorrelate bypass events with effluent toxicity.
Shock loads may be released during normal cleaningand maintenance activities, or may occur as a resultof a spill, process upset, etc. The frequency andimpact of shock loads on the treatment plant shouldbe evaluated through review of plant records(Berthovek and Fan 1986). Each occurrence will havea unique impact on the treatment process. These mayshow little or no effect on the process, may result incollapse of the treatment performance, or may besome middle ground. The frequency and duration ofsuch loadings, and the time required for completetreatment recovery, should be determined. Again, athorough effort should be made to correlate shockloading and process upsets with toxicity data.
Plant operations should be critically reviewed.Operating procedures which differ significantly fromthe original design may result in effluent qualitydifferent than anticipated. Variations between shiftsmay also show significant fluctuations in effluentquality. Operations may have been altered, out ofnecessity, due to changes in process or influentwastestreams. Other times, plant operators may haveinitiated changes out of convenience whichunintentionally impact treatment effectiveness.These changes or alterations should be documented,and their impact on final effluent quality assessed.
Operation and performance of the intermediatestages in the treatment process should be as closelyscrutinized as the overall system effectiveness. Forexample, toxicity reduction through a primaryclarifier, which is presumably a function of solidsremoval, will continue only as long as solids areremoved on a regular or continuous basis. However, ifsolids are allowed to accumulate in the clarifier,toxicity may worsen, due to ineffective solids removalor release of toxics into the water phase.
It is important to recognize that the quality of thefinal effluent is not always attributable to influents.Some treatment processes may result in highertoxicities rather than lower toxicities. Someexamples of this phenomenon are the generation oftoxic biological endproducts, the addition of toxicchemicals as treatment aids (e.g., cationic polymers),and the production of toxic chlorinated organicsduring the disinfection process. Chemistry withineach process should be examined, especially thosewhich are subject to chemical additions andenhancements.
Implementation of Corrective ActionThe objective of system optimization is to identifychanges in plant operations which will result in ahigher effluent quality without significantmodification of the facility (physical) or thechemical/biological processes.
During the definition and evaluation phases, areaswhich may not be operating at an optimal or designlevel, and those which may be improved throughminor modification and adjustments in plantoperations will have been identified. Correctivemeasures must now be defined and implemented,such that at the completion of the process, plantoperations are as good as they can be, given presentplant makeup and operations.
One area to examine is mass and flow loading rates.These can be adjusted by water conservation,retention, inflow controls, and waste stream mixing.Overloaded plants may be made to operate moreefficiently by “bleeding” certain contaminants intothe headworks of the plant. This may be possiblethrough taking advantage of existing system holdingcapacities, or through rerouting of streams to provideholding.
Modification of the flow sequence through thetreatment plant can sometimes significantly affectoverall treatment. If piping systems, pumps, etc. arealready in place, such that only minor redirection isneeded to effect the change, resequencing may be anexpedient means to optimize plant performance andimprove effluent quality. One example might be toconvert two tanks from parallel to series operation.
Redirection of individual flow paths may be anotherway to optimize plant performance. Certainwastestreams may be treated more effectively bysome processes than others. Similarly, the sameprocess may afford different levels of treatment tovarious waste streams dependent upon suchconditions as loading rate, influent concentration,retention times, and chemical feed rates. It may bepossible to improve overall effluent quality byadjusting plant operations according to the sourceand composition of the influent waste stream. An
4-4
example of this might be segregation of the influentstream to treat only those streams containing metalsin the precipitation process; at lower flows and higherconcentrations, metals removal will be moreefficient.
Batching or sequencing of flows may be other meansto optimize performance. At a facility with a varietyof different wastestreams, a singular plant operatedcontinuously may not be capable of providing thedesired level of treatment. If, however, waste streamscould be held for a scheduled strategic release andplant operations could be adjusted to provide the bestlevel for the individual waste stream(s) involved,effluent quality may be dramatically improved. Thiswould be particularly applicable to the handling ofpeak loads or non-compatible wastestreams.Sequencing of wastestreams would involve influentcontrol, such that waste from one process passesthrough the treatment facility separate from wastesfrom other processes. This would allow adjustmentsto be made in plant operations to accommodate theindividual wastestreams involved. Batching orsequencing may also be useful when mixing ofprocess waste streams may act to mitigate toxicity(e.g., an acid and basic waste stream).
Increasing the residence time of the effluent in thetreatment process may facilitate degradation andreduce toxicity. If excess storage space is available onsite, residence time could be increased by routingeffluents through these areas. In addition, the use ofbaffles may increase residence time in areas alreadyallocated.
Finally, consistency of plant operation must bemaintained. Variations between shifts, overmanufacturing and production cycles, etc., must bereduced to a minimal level. This may be extremelydifficult at some facilities with widely variableprocesses and production schedules.
When possible, toxicity testing should be utilized todetermine the effect of optimization on determinationof the efficiency of toxicity reduction. Both theinfluent and effluent should be tested and theeffectiveness of the various optimization activitiesdetermined. Phase I characterization procedures canalso be used to gain additional information on theeffectiveness and result of implementation.
Optimization steps may be modeled eithermathematically or in the laboratory, prior to systemadjustments, These steps may help to streamline theoptimization process, and reduce or eliminate trialand error activities. Additionally, if modifications areplanned for which the outcome is uncertain andwhich involve some element of risk, modeling mayprovide the degree of certainty needed to eitherproceed with the change over, or to investigate otheralternatives.
Follow-Up and ConfirmationAs with any system change, once the change has beencompleted, the effect must be assessed. This will comethrough follow-up and confirmation studies. Even ifchanges made in plant operations have the desiredeffect on effluent quality, periodic follow-up will berequired to confirm that the toxicity reduction ismaintained.
It is also important to note that changes in treatmentoperation that result in a reduction of effluenttoxicity must not do so at the expense of other limitedparameters. For example, a change in treatmentoperation that results in a reduction in effluenttoxicity is not necessarily desirable if it means thatthe facility’s TSS limit will be violated.
4-5
Section 5Chemical Optimization
Chemical optimization, when utilized in a TRE, is aprocess which occurs simultaneously withhousekeeping and treatment plant optimization. Theinitial steps of the chemical optimization process areas follows:
Review the use of chemicals in manufacturingprocess to insure that only the amounts ofchemicals needed are used.
With respect to their concentration in the finaleffluent, review all available aquatic organismtoxicity data for raw materials and processchemicals and their contaminants and by-products (known or potential). Emphasis shouldbe given to data for the species, genera and/orfamily of aquatic organism used to test thetoxicity of the effluent.
Review biodegradability information (aqueous)for raw materials and process chemicals and theircontaminants and by-products (known orpotential).
Determine if less toxic/more degradablealternatives are appropriate, and whether or notthey exist.
The goal of the chemical optimization process is toidentify simple solutions to the toxicity in theeffluent. This process is a first cut at reducingtoxicity by removing possible causative agents. Ingeneral, no cause and effect relationship will havebeen established between the chemicals beingremoved or substituted and final effluent toxicity.However, there may be some evidence thesechemicals can cause toxicity and that their removalwill help alleviate the problem at the facility. Thisevidence may come from experience at other facilitiesof similar type or from reported toxicity in thetechnical or scientific literature. Figure 5.1 depictsthe chemical optimization flow logic. Case summary(Appendix) A-4 provides the only true chemicaloptimization step found in the case summariesreviewed. Chemicals used in the manufacturingprocesses were reviewed for potential toxiccomponents and chemical application techniqueswere implemented to optimize chemical usage.
Similar to this case study, the investigators in casesummary A-l reviewed data on all possible rawingredients to determine sources of toxicity.
Information GatheringThere are two important sources of information forthe chemical optimization study. These are processdesign and operating information, and MSDS. Eachprovides valuable information for the conduct of thestudy.
Process design and operating information willp r o v i d e a d e f i n i t i o n o f u n i t o p e r a t i o n s ,manufacturing processes, and chemical uses andadditions. Where possible, this review shouldinclude:
l Examination of wastestreams produced byspecific production processes;
l Chemicals and raw materials and theircontaminants and by-products used in theprocess;
l Chemicals used in treatment;
l Chemicals and material use rates;
l Percentage of chemical in the final product; and
l Chemical reuse and waste recycling activities.
This information will be useful in defining whichprocesses and attendant wastestreams are mostlikely to influence toxicity in the effluent. Alsoduring data collection activities, a comprehensive listof MSDS should be assembled. These should beavailable through the facility health and safetycoordinator, or the person alternatively responsiblefor OSHA compliance.Information contained in theMSDS will aid in the identification of probablesources of toxicity, and will assist in defining thechemical makeup of certain chemicals suspected ofadding toxicity to the effluent.
It is important to remember that the chemicalconcentration of interest is that which is in the
5-l
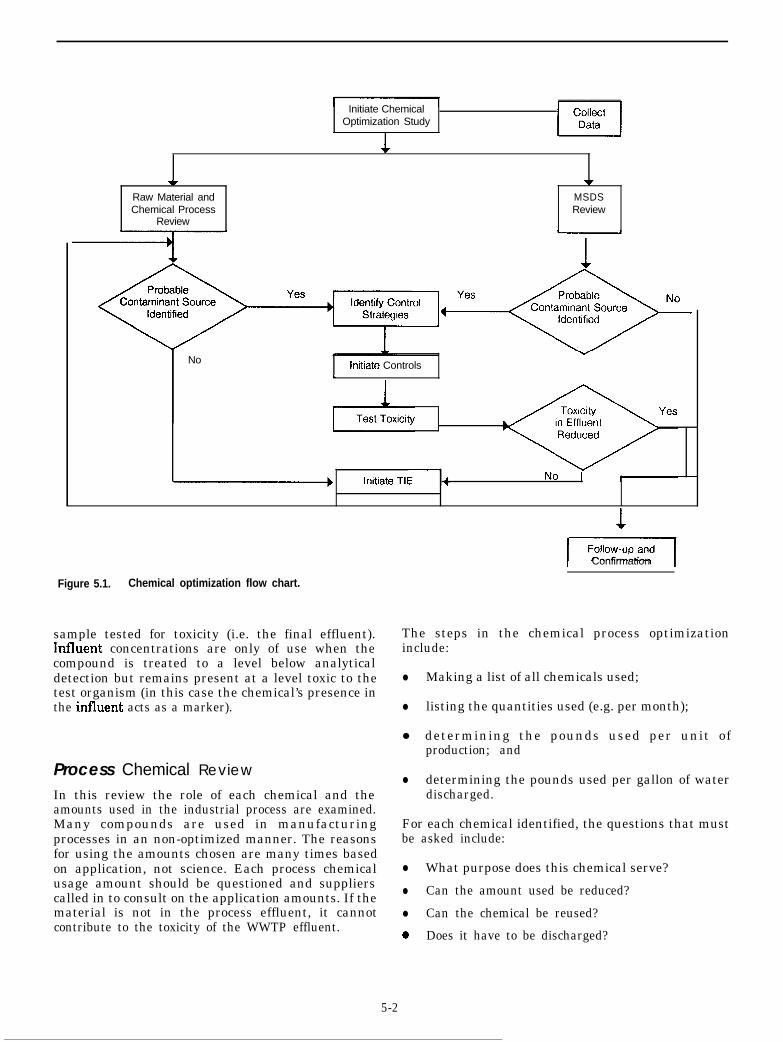
Initiate ChemicalOptimization Study
Ir
Raw Material andChemical Process
Review
W
MSDSReview
No lnltiate Controlsc
Figure 5.1. Chemical optimization flow chart.
sample tested for toxicity (i.e. the final effluent).Influent concentrations are only of use when thecompound is treated to a level below analyticaldetection but remains present at a level toxic to thetest organism (in this case the chemical’s presence inthe influent acts as a marker).
Process Chemical Review
In this review the role of each chemical and theamounts used in the industrial process are examined.Many compounds are used in manufacturingprocesses in an non-optimized manner. The reasonsfor using the amounts chosen are many times basedon application, not science. Each process chemicalusage amount should be questioned and supplierscalled in to consult on the application amounts. If thematerial is not in the process effluent, it cannotcontribute to the toxicity of the WWTP effluent.
I Confirmation
The steps in the chemical process optimizationinclude:
l Making a list of all chemicals used;
l listing the quantities used (e.g. per month);
l determining the pounds used per unit ofproduction; and
l determining the pounds used per gallon of waterdischarged.
For each chemical identified, the questions that mustbe asked include:
l What purpose does this chemical serve?
l Can the amount used be reduced?
l Can the chemical be reused?
* Does it have to be discharged?
5-2
At the completion of the review process, the analystwill have developed a clear picture of how the plantoperates and how these operations may impact finaleffluent toxicity.
Review MSDS InformationIn this process the MSDS information is reviewedand any aquatic toxicological information is noted.Suppliers should be asked for the aquatic toxicityinformation if the MSDS does not list it.
The steps of the MSDS review include:
Obtain an MSDS for all process chemicalsdischarged.
MSDS sections providing information on aquaticorganism toxicity should be highlighted
Examine the Hazardous Ingredient section andnote the “hazardous substances” listed.
Look at the disposal section of the MSDS and notewhether or not the material is a hazardous waste.
Look at the environmental section of the MSDSand note if any acute toxicity (e.g. LC& data foraquatic biota are available.
If no aquatic data are available, ask the supplierfor aquatic toxicology information.
Obta in and examine b iodegradabi l i tyinformation for each suspected compound.
Categorize all chemicals by hazard and irritationpotential and use standard references to obtainaquatic toxicity information, if possible.
For example, if the biocide ANYCO 1111 SOME-BIOCIDE, a cooling water treatment additive, isnoted as being used by an industry undergoing aTRE, the MSDS for this material would be obtained(ANYco Chemical Company) and reviewed. In thisexample case, the MSDS has a section (MSDS Section6) on Toxicological Information. All data presented inthis toxicological section of the MSDS are found to befor humans and animals. However, further search ofthe MSDS would detect the statement that theproduct is toxic to fish (MSDS Section II, Spill andDisposal Information). Then in the following sectionon Environmental Information (MSDS Section 12)actual aquatic toxicity data would be found. The datagiven in this section of the MSDS for Daphnia magna(an LC50 value of about 0.15 mg/L) and FatheadMinnows (an LC50 value of 0.12 mg/l) indicatedsignificant toxicity to aquatic organisms. Nobiodegradation information is provided in the MSDS.Therefore, this material would become listed as a
“suspect” causative agent and targeted for furtherexamination in the TRE process.
After this information is reviewed, the followingquestions should be asked:
l Are there any less toxic and more degradableproducts available?
l Can most serious problem chemicals be isolatedfrom the wastestream or treated prior to mixingwith the wastestream?
l Were toxic chemicals used in high quantities (i.e.,at or above known effect concentration) identifiedduring the Process Chemical Review?
Chemical Composition Screen ofincoming Raw MaterialsIn this part of the process, the raw materials that areused to make the final product are examined todetermine if a chemical is, or could be, removedduring the manufacturing process and enter thewastestream, If such a chemical is found, the sameinformation obtained for the processing chemicalsoutlined above is determined for the raw materialintermediate.
The steps in this process are not as direct as thosediscussed above. T h i s s e g m e n t i s h i g h l yindividualized to the industry involved.
The questions to be answered include:
l Are there chemicals that are removed?
l What are they?
l How much is removed?
l Are these chemicals degradable or toxic?
l Why are these chemical(s) present?
l Is it necessary to remove them?
l Can less onerous alternates be found?
Outcome of the Chemical OptimizationPhaseAs a result of this sequential process the followinginformation should now be available:
1. A list of all chemicals used in processing andmanufacturing the product. Included will be the
5-3
amounts used, why the compounds are used, andif optimization has taken place.
2. MSDS and literature reviews (if needed) will beon tile for all process chemicals.
3. A list of all chemicals and raw materialpurchased on a monthly basis and a record ofproduction volumes during the same time period.
This information may be valuable if a sourceinvestigation is conducted. For example: if thecharacterization/identification tests show that copperis a toxic problem, any chemicals shown to containcopper should be investigated as potential sources ofthe toxicity.
Experience has shown that once several TREs havebeen conducted on several industries of the sameStandard Industrial Classification (SIC) code, somecompounds will become “known” as problematic.These “known” compounds can be categorized andmore accurate toxicity/biodegradability determina-tions made. Once found toxic, the first informationthe industry conducting the TRE should look for iswhether or not these compounds are used. As these“problem” compounds are identified, letters from thedischarger to supplier asking that they be reduced orremoved from any “Tradename” products should helpeliminate some of the toxic compounds known to beused by the industry.
Data AnalysisDuring the chemical optimization phase, nosophisticated analysis need be performed. However,later in the TRE process, it may be useful to applyregression and cluster analysis techniques in anattempt to correlate chemical usage, water usage,known toxicity, and other numerical factors. Thistype of detail and sophistication might be done if,after the TRE, no other means of relating chemicalusage, flows, and other factors to toxicity exist.
Follow-Up and ConfirmationThe information gathered during the chemicaloptimization step in the TRE can yield a great deal ofuseful data. Chemicals that should not be excludedinclude those used in the manufacturing plant thatmay not be used in the manufacturing process. Watertreatment compounds are an example of such achemical.
The significance of the Chemical OptimizationProcess is that for many facilities it may represent auseful approach for identifying the source ofpotentially problematic chemicals, or assist in theconfirmation of the suspected causative agent ofeffluent toxicity. Ignoring this step could result inmodification of a WWTP when a simple chemicalsubstitution could convert an unacceptably toxiceffluent into a non-toxic one.
5-4
Section 6
Toxicity Mentification Evaluation (T/E)
The third tier in the generalized methodology forconducting a TRE at an industrial facility is thetoxicity identification evaluation (TIE). The overallobjective of a TIE is to identify the specificchemical(s) responsible for effluent toxicity. In somecases the results of this evaluation may only allowthe investigator to determine the physical/chemicalcharacteristics of the causative agents of effluenttoxicity. In either case, valuable information willhave been obtained for either the evaluation oftreatment methodologies or for the investigation ofthe source(s) of final effluent toxicity.
In TREs where Tier II evaluations of facilityhousekeeping, treatment plant optimization, orchemical optimization have indicated potentialcauses or sources of toxicity, application of the TIEprocedures will usually still be needed to provideadditional “weight of evidence” and confirmation ofthese suspected causes or sources. It can be expectedthat in most TREs at industrial facilities the initialtwo tiers of the protocol described in this documentshould take no longer than two to three months orapproximately 2530% of the total time scheduled forthe TRE. Effluent sampling and application of theinitial Phase I TIE procedures described in thissection can in most cases be conducted concurrentlywith these facility information gathering andoperations assessment steps. This will allow for moredirect confirmation of any solutions or reductions ineffiuent toxicity brought about by tier II evaluationsand streamline the TRE being conducted at a givenfacility.
The general strategy for performing a TIE consists ofthree phases and is presented as a flow chart inFigure 6.1. The first phase is the performance oftoxicity characterization tests which are designed todetermine the class or group of the compound orchemical causing effluent toxicity (i.e. the toxicchemical(s) physical/chemical characteristics). Thefrequency that these characterization procedures areperformed must be based on the nature andvariability of the effluent toxicity as observed in theresults of these tests. It is highly unlikely that it willever be suMicient to evaluate only a single sample.
The second phase of a TIE is to perform analyseswhich are designed to identify the specific toxicantin the final effluent. The number and type ofchemical analyses performed will be based on theresults of the Phase I characterization tests. Thethird phase of a TIE is the confirmation of thesuspected toxicants identified in Phases I and II. Incases where phase II identification was notsuccess fu l , Phase I I I conf i rmat ion o f thephysical/chemical characteristics determined by thePhase I tests should still be conducted. This isespecially important where treatability studies are tofollow the TIE and modifications to, or construction ofadditional treatment facilities are determined to benecessary based on the results of the TIE and thetreatability studies.
Toxicity identification evaluation procedures aredescribed in detail in Methods for Aquatic ToxicityIdentification Evaluations Phases I-III (Mount andAnderson-Carnahan, 1988), and can be summarizedhere in terms of the application of these methods foran industrial facility TRE. It should be noted that thecase studies contained in this document were, for themost part, conducted prior to the completion of theseTIE methods and utilize this approach to varyingdegrees. As more experience is gained and furtherresearch i s completed modi f i cat ions andenhancements of these methods will be made anddocumented.
Phase I - Toxicity CharacterizationProceduresThe Phase I toxicity characterization proceduresinvolve the use of a battery of bench-top tests coupledwith toxicity tests to determine the physical/chemicalclass or group of the toxic components in the effluent.The purpose of performing these procedures is tofocus the search for the causative agents of effluenttoxicity to compounds of a known class or group. Thisinformation greatly expedites the subsequent PhaseII toxicant identification analyses by narrowing the
6-l
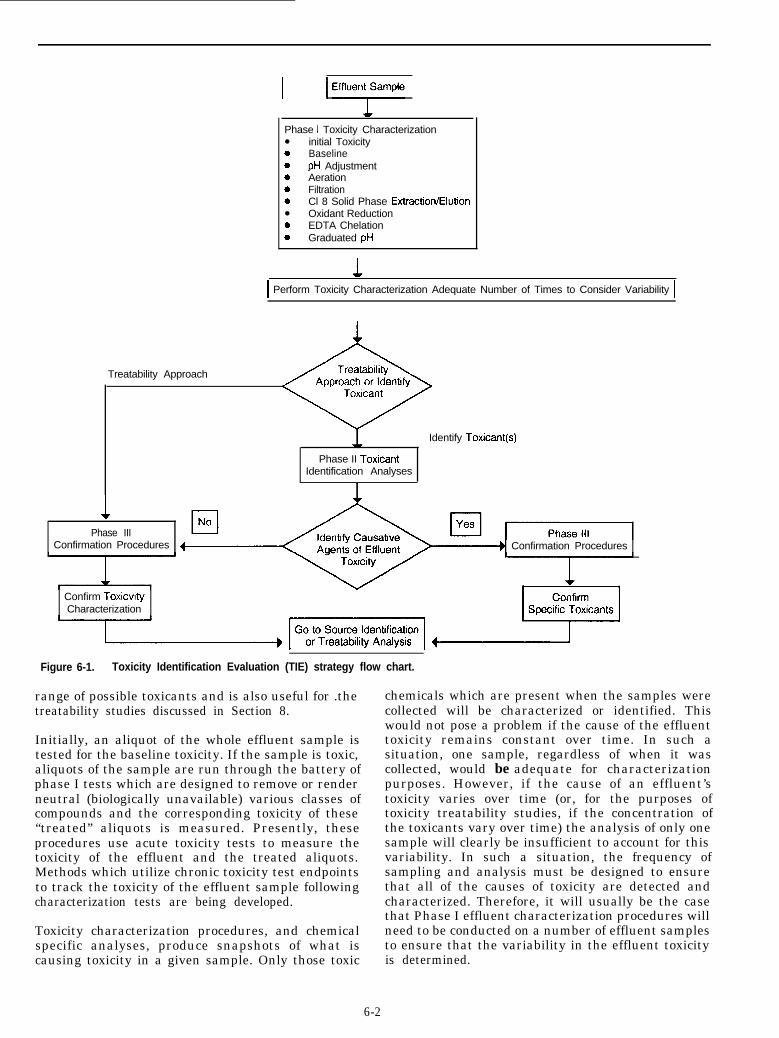
1 1 Effluen;Sample
Phase I Toxicity Characterizationl initial Toxicity0 Baseline0 pH Adjustment0 Aeration0 Filtration0 Cl 8 Solid Phase Extraction/Elutionl Oxidant Reduction0 EDTA Chelation0 Graduated pH
1 Perform Toxicity Characterization Adequate Number of Times to Consider Variability 1
Treatability Approach
Identify Toxicant
Phase II ToxicantIdentification Analyses
I
Phase IIIConfirmation Procedures Confirmation Procedures
Confirm ToxicwtyCharacterization
Figure 6-1. Toxicity Identification Evaluation (TIE) strategy flow chart.
range of possible toxicants and is also useful for .thetreatability studies discussed in Section 8.
Initially, an aliquot of the whole effluent sample istested for the baseline toxicity. If the sample is toxic,aliquots of the sample are run through the battery ofphase I tests which are designed to remove or renderneutral (biologically unavailable) various classes ofcompounds and the corresponding toxicity of these“treated” aliquots is measured. Presently, theseprocedures use acute toxicity tests to measure thetoxicity of the effluent and the treated aliquots.Methods which utilize chronic toxicity test endpointsto track the toxicity of the effluent sample followingcharacterization tests are being developed.
Toxicity characterization procedures, and chemicalspecific analyses, produce snapshots of what iscausing toxicity in a given sample. Only those toxic
chemicals which are present when the samples werecollected will be characterized or identified. Thiswould not pose a problem if the cause of the effluenttoxicity remains constant over time. In such asituation, one sample, regardless of when it wascollected, would be adequate for characterizationpurposes. However, if the cause of an effluent’stoxicity varies over time (or, for the purposes oftoxicity treatability studies, if the concentration ofthe toxicants vary over time) the analysis of only onesample will clearly be insufficient to account for thisvariability. In such a situation, the frequency ofsampling and analysis must be designed to ensurethat all of the causes of toxicity are detected andcharacterized. Therefore, it will usually be the casethat Phase I effluent characterization procedures willneed to be conducted on a number of effluent samplesto ensure that the variability in the effluent toxicityis determined.
6-2
Components of Wariability
The toxicity of an effluent can vary bothquantitatively and qualitatively. Quantitativevariability is a measure of how the magnitude of thetoxicity changes over time (e.g., ranges from 3 to 10toxic units). Qualitative variability is a measure ofhow the underlying causes of effluent toxicity changeover time (e.g., toxicity caused by high copperc o n c e n t r a t i o n s a t one time a n d h i g hpentachlorophenol concentrations at another). Bothof these components of variability may be (andfrequently are) present in an effluent. Therefore, atoxicity characterization sampling program andsubsequent treatability and/or chemical analysisprograms must be designed so that both componentsof variability -the magnitude and the underlyingcauses - are assessed by the evaluation.
Determining the Number and Timing of Samples
The magnitude, frequency, and type of variability intoxicity exhibited by an effluent will determine thenumber of samples which must be evaluated by thetoxicity characterization procedures. In general, thenumber and timing of samples must be sufficient tocapture both the pattern of variability exhibited bythe effluent and all of the toxicants which contributesignificantly to effluent toxicity over time. There areat least two methods for assessing the type andpattern of variability in an effluent’s toxicity.
6-3
Again, the most definitive approach is to repeat thebattery of Phase I characterization procedures anumber of times on freshly collected samples ofeffluent until the type and pattern of variability isidentified. In this way the variability can be assessedconcurrently with the determination of thephysical/chemical characteristics of the effluenttoxicity. This should be a very accurate approachbecause the results of the characterizations are usedas the point of comparison; if variability is observed,it is real variability. It is necessary to repeat thecharacterization procedures a sufficient number oftimes to ensure that both quantitative andqualitative variability are understood prior topreceding to either treatability studies or Phase IItoxicant identification analyses.
A second less direct approach for estimating the typeand magnitude of the variability in final effluenttoxicity is to use the existing data on effluent toxicitywhich is gathered in Tier I of this protocol. If severalspecies of aquatic organisms were routinely used totest the toxicity of a given effluent the responsesrecorded from a number of samples could show thatthe cause of effluent toxicity changes over time. Theamount that each species’ sensitivity to the effluentchanges from one sample to the next provides anindication of the magnitude and frequency ofquantitative variability in the effluent toxicity. The
manner in which the relative sensitivities of thevarious species changes over time may provide anindication of the occurrence and frequency ofqualitative variability. If the variability in aneffluent’s toxicity is totally quantitative in nature,the magnitude of each species‘ response would changeover time, but all species tested should maintain thesame relative sensitivities. On the other hand, if thespecies’ relative sensitivities also change over time,there is evidence for qualitative effluent variability.
The use of multiple species to assess qualitativevariability is based on the observation that differentspecies exhibit different sensitivities to varioustoxicants in effluents. For instance, for water withthe same hardness, the fathead minnow isconsiderably more sensitive to cadmium (LC5o =30.5 pg/L) than the amphipod, G a m m a r u spseudolimnaeus, (LC5o = 55.9 pg/L) (U.S. EPA.1985b); whereas for copper the situation is reversedwith G. pseudolimnaeus (LC50 = 22.1 pg/L) beingmore sensitive.than the fathead minnow (LC50 =115.5 pg/L) (U.S. EPA, 1985c).
It should be emphasized that this indirect approachhas several potential sources of error which couldlead to inaccurate conclusions (e.g., if data fromeffluent samples with different levels of hardness arecompared). Therefore, it is recommended that thedata from the Phase I characterization tests be usedas the primary basis for determinations of effluentvariability and the relative responses of the toxicitytest species should be used with caution as secondary,supporting evidence.
Toxicity Testing Procedures
In the performance of a toxicity identificationevaluation, it is essential to select a toxicitymonitoring tool which is sensitive enough and hassimilar toxicological responses to the designated TREtarget. In general, this criterion will lead to the use ofan aquatic organism toxicity test, since thedesignated target will usually be expressed as awhole effluent toxicity permit limit. The actualselection of the toxicity test organism for the TREmay or may not be specified as an NPDES permitcondition or in an administrative order issued by theregulatory authority. This factor, to a certain extent,will drive the choice of the species and the test to beused in the TRE. In other cases the guidance may notbe specific, and the discharger may have morediscretion in the selection of the TRE monitoring tool.However, pertinent information may be available toaid in the selection process. For example, if the TREwas triggered by an effluent toxicity biomonitoringmonitoring requirement, the results should provevaluable in identifying a sufficiently sensitive testorganism. Normally, several aquatic organismswould be utilized in this monitoring and the most
sensitive of these should be an adequate toxicityindicator in the TIE.
It is important to differentiate the objectives andrequirements for toxicity testing in TIES from thoseof the overall TRE and the NPDES permitbiomonitoring requirements. Usually, thebiomonitoring requirements that trigger a TRE willbe specified as the toxicity tests to be used in thefollow-up monitoring and confirmation of thereduction in effluent toxicity (Tier VI). These permitbiomonitoring requirements and the associatedwater quality-based whole effluent toxicity limits arederived in order to be protective of State water-quality standards. Achievement of the desiredeffluent toxicity reduction to meet the TRE objectivecan only be demonstrated by utilizing these samebiomonitoring tests and specified toxicity testendpoints (LC50 or NOEL). If an effluent exhibitsboth acute and chronic toxicity the TRE solution orcontrol method must ensure that all limits will bemet. For the purposes of TIES certain modifications ofappropriately sensitive toxicity tests can be used inorder to achieve the objectives of the particular phaseof the TIE being conducted. However, theinvestigator should never lose sight of the objective ofthe TRE: to reduce toxicity to acceptable levels for thepermit biomonitoring species. Thus, there must be ademonstrated toxicological relationship orcorrelation between the permitted species and theTIE test species.
In addition to sensitivity comparable to the toxicitytest specified for permit monitoring, other criteria inselecting a toxicity test for the TIE should be speedand cost. In most cases conducting characterizationprocedures will require the performance of arelatively large number of toxicity tests. For thisreason, tests species which are easily cultured andrelatively inexpensive should be considered first. If asensitive test species which is also convenient cannotbe found, it may be possible to modify a sensitive testso that it becomes more rapid and less expensive.Possible modifications for the purpose of TIES includethe use of shorter exposure times, fewer replicates,fewer organisms per replicate, fewer exposureconcentrations, and perhaps timed lethalityendpoints. Since modifications of this nature involveconcessions to the standard quality assurance andquality control procedures for toxicity testing, specialcare must be taken to ensure that the tests results arenot compromised and are of suf&ient accuracy forthe specific purpose for which they are used in theTIE. A more detailed discussion of this subject ispresented in t h e E P A P h a s e I T o x i c i t yCharacterization Procedures document.
As stated previously, the procedures described in theTIE methods manual (EPA, 1988) are only designedto utilize acute toxicity tests. However these TIEprocedures can be used in situations where either
acute or chronic toxicity triggered the TRE. In orderfor the current TIE methods to be applicable forachieving a chronic toxicity target there must bemeasurable whole effluent acute toxicity present toenable the characterization of the toxicity and theidentification of the toxicants. Use of the more easilyperformed acute test in situations where chronictoxicity is the most limiting requires the assumptionthat the acute and chronic toxicity of the effluent arecaused by the same compound. This assumption canbe validated in the Phase III confirmation step whichcorrelates the concentration of the toxicant(identified in Phase II) with both the acute andchronic toxicity measured in the same sample.
If it is not possible to utilize the current TIE methodswith acute toxicity tests, then Tier II evaluations,Tier IV source investigations, and Tier V treatabilitystudies can all still be carried out using EPAprocedures for chronic toxicity testing (Horning andWeber, 1985) to achieve the TRE objectives. In caseswhere measurable acute toxicity is present and theTIE methods are used to identify the toxicant and toselect a toxicity control method, chronic toxicity testswould then be used in the Tier VI follow-upmonitoring and confirmation of toxicity reduction,
Another concern in the selection of a toxicity test isthe presence of qualitative variability. If thecausative agents of toxicity change over time, it maybe necessary to simultaneously use more than onesensitive monitoring species (i.e., a sufficient numberof species to detect all of the expected toxicants). Ifone species is not sufficiently sensitive to all of thetoxicants over the range at which they are present inthe effluent, then the use of an additional monitoringspecies for the TIE would be indicated. While thismay be a concern in certain cases, it should beemphasized that variability in the causative toxicantwill not always necessitate the use of severalmonitoring species. As long as a single species of testorganism is sensitive to each toxicant at theconcentration range found in the effluent, thatspecies can be used.
Description of Characterization Methods
As previously mentioned, the objective of a toxicitycharacterization procedure is to narrow down thesearch for feasible treatment methods and/ormethods of analysis to identify the causative agentsof effluent toxicity. This is accomplished by dividingan effluent into a variety of fractions and thendetermining which of these fractions is toxic, or byisolating and inactivating a specific class oftoxicants. Theoretically, there are a large number ofschemes which could be devised based onfundamentalcharacterizewhich ariseindicators of.
principles of chemistry and physics toan effluent. However, the restraintsdue to the use of toxicity tests aswhich characterization tests alter the
6-4
toxicity complicate the development of a logical,broadly applicable procedure. For this reasonfacilities faced with conducting a TRE can benefitfrom detailed guidance on the methods that can beused for toxicity identification evaluations. Whileflexibil ity in the design and selection ofcharacterization procedures is attractive it should berecognized at the outset given a TRE that theinformation needed to choose the best scheme is notreadily apparent. Therefore to avoid each facilityhaving to expend the time and cost to developmethods for conducting TIES, detailed documentationof a characterization scheme has been prepared. Thisstandardized characterization procedure has provenvery useful in many TIES conducted to date and willbe described in the following paragraphs.
Some of the case studies contained in the appendix tothis document were conducted prior to theavailability of the Phase I methods and relied onother characterization schemes. One of these wasfirst developed by Walsh and Garnas (1983) and usesa sequence of resin adsorptions and chemicalextractions to divide the effluent eventually intoclasses of chemicals. This approach was a forerunnerin concept to the EPA recommended procedures.These methods may be useful as subsequent Phase Itests in cases where the experience of the investigatorallows for their modification for application to agiven effluent. However, for use as an initialapproach for characterization of effluent toxicity agreat deal of preliminary development of methodsand laboratory procedures would need to beconducted by the investigator at a given facility.
In the context of this discussion, the characterizationprocedures described in the Phase I document are themost germane. In this procedure, individual aliquotsof effluent are subjected to seven physical/chemicalcharacterization tests. Each test is designed toremove or neutralize a specific category of toxicants.Following the performance of each test, any changein effluent aliquot toxicity is determined, usingshort-term, inexpensive acute toxicity tests wheneverpossible. The toxicity attributable to the removed orneutralized group of compounds is calculated bysubtracting the treated aliquot toxicity from thebaseline toxicity of the effluent. Therefore, the firstcharacterization test is a determination of baseline(unmanipulated) effluent toxicity. The six remainingcharacterization tests are as follows:
1.
2.
Degradation Test - to determine how muchtoxicity degrades over time (also establishesacceptable sample holding time and conditions).
pH Adjustment Test and Graduated pH Test - todetermine the effect of pH manipulation oneffluent toxicants and the effect on causativeagent toxicity.
6-5
3.
4.
5.
6.
7.
It
Filtration Test - to determine toxicity associatedwith filterable material or toxicants that can bemade insoluble through pH change.
AerationlpH Adjustment Test - to determinetoxicity attributable to oxidizable or volatilecompounds or those compounds that can be madevolatile or oxidizable through pH change(pHadjustment helps define the acidic, basic, andneutral character or the oxidation state of thesetoxicants).
Solid Phase Extraction/pH Adjustment Test - todetermine toxicity attributable to non-polarorganic and metal chelate compounds or thosecompounds that can be made non-polar throughpH change (pH adjustments help define theacidic, basic, and neutral character of these non-polar toxicants).
Oxidant Reduction Test - to determine how muchtoxicity is attributable to oxidants or certainelectrophiles.
EDTA Chelation Test - to determine how muchtoxicity is attributable to certain cationictoxicants such as heavy metals.
should be noted that in order to accuratelycharacterize an effluent using the Phase I method, allof the tests should be performed. Each test is designedto consider a different question and rigorousconclusions can only be formed when the completebattery of tests is conducted. As discussed previously,the characterization tests should be performed asuffkient number of times to ensure that variabilityin the cause of effluent toxicity is addressed. Inaddition, it is recommended that the results of thecomplete battery of tests be considered together wheninterpreting the data. Consideration of all results,both positive and negative, will help define thenature of the causative agents.
Quality Assurance/Quality Control
As in all studies, it is imperative that a QA/QCprogram be implemented for the tox ic i tycharacterization procedures. Such a program mustaddress the performance of the chemical and physicalseparations as well as the toxicity tests. Detailedg u i d a n c e o f QA/QC f o r e f f l u e n t t o x i c i t ycharacterizations is presented in the EPA Phase I-IIIdocument.
Phase /I - /den tifica tion of SpecificToxican ts
The aforementioned toxicity characterizationprocedures are designed to identify classes or groupsof compounds contributing to effluent toxicity. Withthat information, a discharger may decide to attemptto identify the specific toxicants in these classes. A
successful identification will facilitate the selectionof treatment options and/or the identification of theultimate source(s) of toxicity.
Identification of specific toxicants has the greatestchance for success and is the most cost-effective ifit isbased on the findings of the toxicity characterizationprogram. Such a plan would perform only thosechemical analyses which could identify specifictoxicants of the type expected in the flagged toxiccharacterization classes. For instance, if the non-polar neutral organic fraction was identified as themost toxic, emphasis should be placed on performingchemical analyses on the neutral non-polar organiccompounds in the effluent. In this case, there wouldbe no need to spend time and money on analysis ofacidic or basic organics or for inorganics.
The number and timing of specific chemical analyseswhich need be performed should be geared to theexpected qualitative variability in effluent toxicity.Guidance should be available concerning this issuefrom the results of the previous effluent monitoringand Phase I toxicity characterization data andresults. However, it is important to recognize that thefewer the number of samples evaluated, the higherthe uncertainty that all of the causes of toxicity havebeen completely identified. The Phase II methodsdocument provides more detailed guidance onavailable methods of analysis and interpretation ofresults.
Phase l/l- Confirmation of/den tifica tions
Regardless of whether the identification of toxiccausative agents progressed to single chemicals ors t o p p e d a t c l a s s e s o f c h e m i c a l s o rphysically/chemically defined classes of compoundsto be used to determine a treatment method, it isdesirable to confirm these findings. This can beaccomplished in several ways depending upon thespecificity of the identification (PersonalCommunication, L. Anderson Carnahan, April. 1987).The EPA Phase III document addresses this issue indetail.
If single chemicals have been identified as the causeof final effluent toxicity, there are several approachesto confirmation:
1. toxicological literature data, for the toxicity testspecies which has been used, are available forthis chemical, a comparison can be made betweenthe observed concentration in the effluent and itsreported toxicity. If the effluent concentration isat a level consistent with the effluent toxicitybased on the effect concentration, confirmation issupported.
2.
3.
4.
5.
6.
7.
8.
Toxicity tests can be performed with a controlwater. similar to the effluent in its chemicalmake-up) spiked with the same concentration ofsuspect causative toxicant as in the effluentsample. If the results of the spiked control watertoxicity test approximate the effluent LC5o orNOEL, confirmation is supported.
Effluent samples which have been treated toremove toxicity can be spiked with the suspectedtoxicants at their original concentration in theeffluent. If the same degree of toxicity occurs atthe concentration originally found in the effluent,confirmation is supported.
If a water quality parameter is known to alter thetoxicity of a suspected toxicant (e.g., pH onpentachlorophenol), the effect of varying thatparameter on the toxicity of an effluent samplecan be evaluated. If the toxicity varies in theexpected manner, confirmation is supported.
A number of species can be simultaneouslyexposed to the effluent and the resulting speciessensitivities ranked. If, for the same species,literature values or results for control waterspiked with the suspect causative toxicantindicate the same ranking, confirmation issupported.
As the toxicity of the effluent varies over anumber of samples, compare the concentrationsof the suspected toxicant in those samples withtoxicity test results. If a significant correlation isobserved, confirmation is supported.
Some chemicals produce unique and discernableeffects in aquatic organisms. If the observedsymptoms match the known effects of thesuspected toxicant (as observed in a spikedcontrol water toxicity test), confirmation issupported.
Elimination of toxicity upon removal of thesuspect toxicant from the wastestreamsupports the study conclusions.
This is not an exhaustive list of possible confirmationmethods. No single method would produce conclusiveevidence and, therefore, performance of several isadvisable to provide a weight of evidence. If the TIEis halted following Phase I characterization, topursue a treatability approach confirmation shouldstill be undertaken. This will ensure that thetreatment option selected will adequately andconsistently remedy the toxicity and will produce aneffluent of sufficient quality to meet the TREobjective.
6-6
Section 7
Source Identification Evaluation
The results of the toxicity identification evaluation(TIE) should provide the clearest picture possible ofwhat is causing final effluent toxicity. Based on thisinformation, a discharger must decide how to proceedin the TRE process. One option at this point is toevaluate various treatment methods for the removalof the identified toxicants from the final effluent. Theother option is to search for the source(s) of theidentified toxicants or toxicity. Source controls, suchas chemical substitution, spill control or treatment ofthe source stream, may be technically andeconomically more attractive than treating the finaleffluent. For the purpose of this discussion, influentstreams are defined as all streams that aretributaries to the wastewater treatment system (e.g.,process streams, surface runoff, non-processwastewaters). Source streams are those influentstreams which are found to be contributing toeffluent toxicity.
There are advantages and disadvantages associatedwith both the treatability and source investigationoptions. Proceeding to treatability studies on thefinal effluent is perhaps the more direct approach andcan normally result in successful resolution of thetoxicity problem. However, the cost of this successmay be high; requiring the construction ormodification of a treatment unit with additionaloperating expenses. On the other hand, identificationof the source of toxicity could result in a much morecost-effective solution and minimize the potential forcross-media transfer of toxic pollutants to the air orsludge during wastewater treatment. The search forsource streams may be a difficult task in complexfacilities with highly variable production schedulesand processes. However, if the upstream search issuccessful and the toxicity of the identified sourcestreams can be easily treated or reduced by othersource control methods, a major savings inconstruction, operation, and maintenance might berealized. It is often the case, that treatment ofsmaller, more concentrated streams can be performedmore eficiently and economically than treatment oflarge, relatively dilute streams (e.g., the finaleffluent).
Selection between the treatability studies and sourceidentification options must be made on a site specific
7-1
basis. Subjects for consideration in this selectioninclude: the results of the TIE and facility operationtiers of the TRE, the ease of treating the finaleffluent, the number of possible source streams, theability to modify the associated processes o rsubstitute process chemicals, and the variability inthe causes of toxicity. The purpose of this section is topresent some generalized methods to conduct a sourceidentification evaluation. Guidance on treatabilitystudies is discussed in Section 8 - Toxicity ReductionMethods.
For this section, it is assumed that if the decision ismade to search for the sources of final effluenttoxicity, the following five step approach may proveappropriate:
1.
2.
3a.
3b.
4a.
4b.
Set a search image for upstream evaluationsbased on the results of the TIE.
Select sampling locations on selected suspectsource streams based on the TIE results andfacility information from Tiers I and II. If obvioussuspect source streams are not evident, use theprocess of elimination to systematically workupstream and narrow down the number ofpossible source streams.
If the causative agents of effluent toxicity havebeen identified in the TIE, use chemical specificanalyses for these compounds for tracking tosources.
Where necessary, evaluate the degradationeffects of the facility treatment plant on alteringthe toxicants identified in the effluent. Modifythe search image according to the results of thisevaluation.
If the TIE did not result in the identification ofthe specific chemicals causing effluent toxicityuse bench scale model to simulate treatmentplant degradation and track toxicity.
Where necessary characterize (Phase I of TIE)the bench scale treated samples from suspectsource streams to provide a more detailedcomparison with the search image.
5. If specific process streams have been clearlyidentified as the sources of final effluent toxicity,move up through the process stream to identifytoxic side- streams.
At the completion of this procedure, upstream sourcesof final effluent toxicity may be identified. Sourcestreams will only be identified if they are sufficientlytoxic and are not detoxified by the treatment system,or if they contain the specific toxicants found in thefinal effluent or their precursors. Figure 7.1 presentsa flowchart illustrating the strategy to conduct asource identification evaluation. This process will begreatly simplified if a specific chemical has beenidentified as a causative agent of final effluenttoxicity. If this chemical is known to be chemicallyrefractory to treatment, it would be possible to simplylook for this chemical in the influent streams.However, if there is the likelihood that the causativeagent is altered in the treatment process (e.g.,rearrangement or reaction/decomposition products),it may be necessary to follow the scheme forevaluating treatment degradation presented in thissection. Examples of source investigations arepresented in Appendices Al, A2, A3, A6 and A7.These examples vary in complexity from simplyidentifying the toxic source streams to the finalwastestream, to large and complex facilities wherethe biodegradability of toxicity of numerous processstreams was evaluated before and after treatment(A2 and A7).
Setting the Initial Search Image
In most cases, the results of the TIE will identifyeither the specific chemicals or classes of compoundswhich are causing final effluent toxicity. In addition,the manner in which these toxicants or thecharacteristics of the toxicity vary over time will alsobe assessed. A review of this information shouldproduce an initial search image for the sourceidentification effort. As one moves further upstream,it may be necessary to alter this initial search imagebased on how the wastewater treatment system orany other process may degrade or alter toxicconstituents.
Sample Collection from the InfluentStreams or Selected Process StreamsDesign of a sample collection scheme for sourceinvestigation tracking must be based on site specificcircumstances and on the information gathered inthe previously conducted Tiers of the TRE. Forchemical specific tracking it may be possible to usecollected information to determine one or more“suspected” source streams. The sampling schemewould then be designed to confirm which of thesesuspected source streams is in fact, the source of theidentified toxicants. Where there are a large numberof influent streams, and/or it is not evident from the
available facility information which are the likelysource streams, then the sampling design shouldutilize the process of elimination to work up throughthe influent streams to the source of the identifiedtoxicants. Procedures for sample collection andhandling are described in several EPA documents(USEPA 1982,1979,1988a and 1988b).
If the TIE has not resulted in the identification of thespecific toxicants, but has successfully characterizedthe physical/chemical nature of the toxicity, it willusually be difIicult to select “suspect” source streamsto streamline the source investigation. In this case itwould be most effective to design a more systematicsampling scheme which utilizes the process ofelimination to track the toxicity up the wastewaterstream to the source(s).
The information on the variability of the toxicitygained from the TIE and also from the facilityinformation Tiers of the TRE should be utilized toassist in determining the number and timing ofsamples. This information should also be useful fordeciding whether grab or composite samples shouldbe used. Initially, flow proportional compositesamples should be used and scheduled to coincidewith facility production schedules. Influent streamflow data must be collected as part of the samplecollection in order to determine the relativecontributions of each influent stream sampled to thecombined wastestream and final effluent.
Chemical Specific Analyses for Trackingto Toxicant SourcesIf the TIE has successfully identified and confirmedthe causative agents of effluent toxicity, chemicalspecific analyses for these compounds can be used forthe source investigation. This approach involvesutilizing the chemical analysis techniques used inPhase II of the TIE to test for these compounds in thesamples from the influent streams, In some cases thefacility information from Tier II of the TRE mayindicate which influent streams are the likelysources of the identified toxicants. However, it willusually be necessary to conduct sampling andanalysis to ascertain which influent stream(s) is infact the source of the toxicants. Methods for chemicalanalysis can be found in the Standard Methods forthe Examination of Water and Wastewater (APHA,1985) and in American Society for Testing andMaterials (ASTM) manuals.
Prior to chemical analysis of influent streamsamples, a literature search may be conducted todetermine if the toxicant identified could be adegradation product of the wastewater treatmentplant. Where there is clear evidence that the toxicantis a treatment by-product, the influent samplesshould be analyzed for the precursor compounds aswell as the identified toxicants. In cases where
7-2
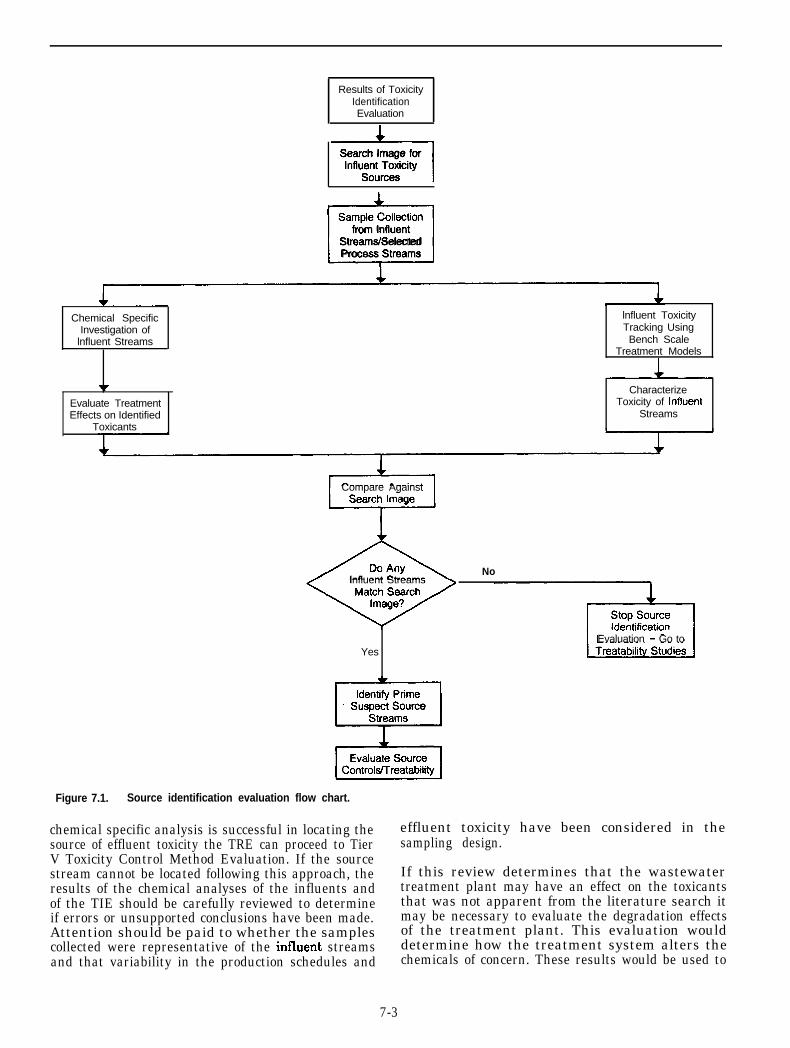
Results of ToxicityIdentificationEvaluation
-1Search Image forlnfluent Toxicity
Sources
Sample CollectionIfrom lnfluentStreams/SelectedProcess Streams
Chemical SpecificInvestigation of
lnfluent Streams
lnfluent ToxicityTracking UsingBench Scale
Treatment Models
V
Evaluate TreatmentEffects on Identified
Toxicants
CharacterizeToxicity of lnffuent
Streams
Compare Against
lnfluent Streams
Yes
Figure 7.1. Source identification evaluation flow chart.
chemical specific analysis is successful in locating thesource of effluent toxicity the TRE can proceed to TierV Toxicity Control Method Evaluation. If the sourcestream cannot be located following this approach, theresults of the chemical analyses of the influents andof the TIE should be carefully reviewed to determineif errors or unsupported conclusions have been made.Attention should be paid to whether the samplescollected were representative of the influent streamsand that variability in the production schedules and
No
Evaluation - Go to
effluent toxicity have been considered in thesampling design.
If this review determines that the wastewatertreatment plant may have an effect on the toxicantsthat was not apparent from the literature search itmay be necessary to evaluate the degradation effectsof the treatment plant. This evaluation woulddetermine how the treatment system alters thechemicals of concern. These results would be used to
7-3
modify the search image to be used for the sourceinvestigation.
Evaluate Treatment Effects on IdentifiedToxicants
Wastewater treatment systems can affect themagnitude and composition of toxicity in thewastewater stream in a variety of ways. Someinfluent toxicants may be degraded into non-toxicmoieties, others may simply pass unaffected throughthe system, and still others may be altered ordegraded into even more toxic products. In mostindustrial situations, it is not possible to predict thelikely outcome, This lack of predictability is notsurprising since wastewater treatment systems arenot generally designed to treat toxicity. Most systemsare designed to treat conventional pollutants and thefate of toxicity is incidental. Therefore, since the fateof toxicants cannot always be predicted, in some casesit may be necessary to empirically determine how thetreatment system at a specific facility affects toxicity.The objective of such an evaluation is to modify thesearch image formed from the TIE results to includeany alterations imposed by the treatment system.This revised search image will then allow for a morecomprehensive analysis for the chemicals in thevarious process streams that are potential sources offinal effluent toxicity. Again, in cases in which thespecific causative agents of toxicity in the finaleffluent are refractory to treatment, detailedevaluation of the role played by the treatment plantwill not be necessary.
7-4
The evaluation of how the wastewater treatmentsystem impacts toxicity can be addressed byperforming specific chemical analyses on both itsinfluent and effluent streams (e.g., Appendix SectionA2 and A7). If the toxicity in the effluent is variable,samples should be collected in a manner whichensures that the same slug of wastewater is beinganalyzed in the influent sample and the effluentsample. This will require consideration of transittime through the system and collection of the eMuentsample the proper amount of time after the influentsample was collected. Using this approach,comparison of the influent and emuent results shouldidentify how the treatment system affects themagnitude and composition of wastewater toxicity atany particular time.
The number and timing of samples required toadequately evaluate treatment system impacts ontoxicity will depend on the type and frequency ofvariability exhibited by the effluent. If the toxicity inthe final effluent has been shown to exhibit little orno qualitative variability over time, it might besufficient to perform this comparison of treatmentplant influent only twice. However, if qualitativevariability has been shown to be significant, thensamples should be analyzed a sufficient number of
If process streams are shown to contain the specifictoxicants found in the final effluent or containprecursors to those toxicants, there is little questionas to their designation as sources of final effluenttoxicity. However, if process streams are onlysuspected as possible sources of final effluent toxicitybecause they are known to contain the appropriatephysical/chemical classes of toxicants, there stillexists some uncertainty. A major reason for thisuncertainty is the possibility that even though theprocess stream contains the proper class of toxicants,the specific chemicals in the stream may degrade orbe chemically or physically transformed as they passthrough the wastewater treatment system. Justbecause a class of toxicants has the potential to eitherpass through the treatment process unaltered or bedegraded into another toxic class does not mean thatthe specific chemicals in any particular processstream will follow this general scenario. Therefore, ifgeneric toxicity is to be used to investigate whichinfluent streams are the sources of final effluenttoxicity, it will usually be necessary to evaluate thedegradability of each influent stream sample prior totesting for toxicity.
The degradability of the toxicity in a specific influentstream can best be estimated by individually passingthat stream through the actual wastewatertreatment system and observing the outcome (e.g.,A p p e n d i x A7). Unfortunately, this type ofexperiment is not usually possible in an industrial
times so that the fate of each of the identifiedtoxicants is evaluated. For example, if the toxicity inthe effluent is sometimes caused by a cations and atother times by a neutral organic, the treatment plantanalyses should be performed at least twice wheneach situation occurs. Double checking in thisanalysis is recommended in order to ensure asuccessful source investigation.
If the concentration of the toxicant in the influent tothe treatment plant can be shown to be greater thanor equal to the concentration observed in the finaleffluent, the plant probably does not have an effectand the SIE can proceed to chemical analysis of theprocess streams. On the other hand, if the specificcompound is absent in the influent or markedlyincreased in the effluent relative to the influent,more specific analysis will be necessary to determinethe precursor or parent compounds of the effluenttoxicants. Understanding the reactions would helpform the proper search image when proceeding intothe influent streams. Where this determinationproves to be a prodigious task, the investigator maychoose to use the alternative approach described instep 4 to track toxicity.
Use Bench Scale Model to SimulateTreatment P/ant Degradation and TrackToxicity to Source Streams
facility because of the difficulty in segregatingstreams and the lack of storage for the other sourcesof wastewater. Therefore, degradability must beestimated using physical models of the treatmentsystem (e.g., Appendix A2).
The first step in the use of physical models is todetermine the appropriate bench scale model of thewastewater treatment system. If the system justcontains one unit (e.g., an activated sludge unit withno equalization or aerated ponds) then this step istrivial. However, if the system consists of severalunits (e.g., aerated ponds, followed by activatedsludge, followed by carbon adsorption). then it isnecessary to either model all of these units or identifywhich unit is the most important in toxicity control.Such an identification effort may require samplingalong the treatment process and determining theeffect of each unit on toxicity.
The second step is to design the physical model tomimic the unit under consideration. Possible designcriteria would include hydraulic residence time,physical and chemical conditions (e.g., pH, DO, andtemperature), and biological composition (e.g., properbacterial composition and biomass).
The third step would be to validate the accuracy andprecision of the physical models predictions. Modelaccuracy could be evaluated by collecting a sample ofthe influent to the treatment plant and passing itthrough the model. If the output of the model is thesame as the real unit, accuracy is validated. Modelprecision could be evaluated by setting up severalreplicates of the model and passing the same wastestream through each or by splitting a sample andtesting each aliquot. If the outputs of all replicatesare the same, precision is validated. Since thepurpose of this approach is to assess the relativetoxicity of the influent streams to determine thesource of effluent toxicity, it is not always necessarythat the bench scale physical model exactly mimicthe quantitative effect of the treatment plant. Thisconcession to the accuracy and precision of the benchscale model should not compromise the models utilityto assess the toxicity which is refractory to treatmentnor should it prevent the tracking of this refractorytoxicity to its source.
The fourth and final step would be to pass eachprocess stream under consideration through themodel treatment system and evaluate thedegradation in toxicity. When individual processstreams are passed through the model system, it isimportant that consideration be given to whethersome predilution may be necessary. One reason forpredilution is to prevent killing the bacterialcommunity in the unit by exposure to a very toxicprocess stream. The resident bacterial flora may notbe accustomed to such high levels of toxicity, since itis normally exposed to this process stream only after
it has been diluted by other influent streams, Asecond reason for predilution is to provide anadequate range of nutrients to the bacterialcommunity. The resident bacterial flora may requirea variety of nutrients which it would normallyreceive from a mixture of all influent streams.However, if only one process stream is passedthrough the model, the bacterial flora may notrece ive i ts nutr i t ional requirements and,consequently, not function normally. This potentialproblem can be overcome by prediluting the suspectprocess stream with a small amount of the mixedinfluent which normally enters the treatment unit.This small amount of predilution will not alter theoutcome of the experiment as long as a suitablecontrol is used. The EPA protocol for conductingmunicipal TREs (1988) provides additionaldiscussion on designing these tests.
At the conclusion of the degradability test eachsample would be tested for toxicity. The toxicity testused should be the same as was utilized in the TIE.However, it is important to emphasize that eitheracute or chronic toxicity tests can be used for thisevaluation. By following the sampling schemedescribed above it should be possible to identify thoseinfluent streams which are the prime suspect sourcesof final effluent toxicity. These source streams willhave been identified because they are sufficientlytoxic and their toxicity is not diluted out by otherinfluent streams nor degraded in the treatmentsystem. At this point the investigator could proceedto Tier V of this methodology, the toxicity reductionmethod evaluation. If additional information on thetoxicity of the source stream(s) is desired prior to TierV evaluation, additional characterization of thetoxicity of the identified source stream can beconducted.
Characterize the Toxicity of Suspect SourceStreamsThe techniques used to characterize the toxicity inthe bench scale treated influent streams should bethe same as those used to characterize the finaleffluent. The characterization would begin bydetermining the amount of toxicity in the bench scaletreated source stream. This must be accomplished byusing the same toxicity test organism and endpointselected in the effluent TIE. These evaluations shouldbe performed often enough to detect any variabilityin the toxicity of the bench scale treated sourcestream. The toxic classes of compounds that arecharacterized in the samples would then be comparedagainst the search image to provide additionalcertainty that the source streams contain the properclasses of toxic constituents. It may be useful toperform these characterizations often enough toassess any source stream variability that couldcorrelate to variability in effluent toxicity.
7-5
Further Upstream Investigations
Once a process stream has been positively identifiedas a source of final effluent toxicity, it may bedesirable to move upstream through the process andidentify the specific “side streams” which are themajor contributors of toxicity (i.e., Appendix A2).Usually this, more detailed, evaluation would only benecessary at very large, complex facilities. Thedecision to proceed in this direction should considerthe cost effectiveness and technical feasibility ofsegregating and treating toxic side-streams if theyare identified. If the decision is made to proceed, asimilar strategy as was pursued to evaluate processstreams should be followed.
The first step is to identify the various side-streamswhich feed into the process stream. This can usuallybe accomplished by review of plant blueprints andinterviews with operations personnel. The secondstep is to either analyze for specific toxicants (if theyhave been identified) or determine the magnitude oftoxicity in each bench scale treated side-stream. A
toxicity evaluation should use the same monitoringtool as used in any previous characterization effortsand would be performed often enough to adequatelyconsider side-stream variability. If the side-streamreceives pretreatment before discharge into theprocess stream, it is essential that pretreatment becompleted before bench scale treatment and toxicitymeasurements are made. If it is not possible to obtaina side-stream sample after pretreatment, it will benecessary to use the bench scale model to simulatethe pretreatment units. The guidance provided in theprevious section could be followed to design, validate,and use such a model system.
At the conclusion of this evaluation, it may bepossible to identify a very concentrated process side-stream which is the ultimate source of final effluenttoxicity. If so, source control options might bedirected towards modification of the process,substitution of toxic compounds, installation ofadditional pretreatment methods, modifications toexisting pretreatment systems, or segregating theside-stream from the treatment system for recycling.
7-6
Section 8Toxicity Reduction Methodologies
The ultimate goal of the TRE is to reduce toxicity inthe final effluent to levels which are not harmful tothe aquatic life of the receiving water. In some cases,additional reduction in the effluent toxicity may benecessary for the protection of wildlife and humanhealth, Initially, one looks at direct solutions toaccompl ish th is ; housekeeping , chemicalssubstitution, and treatment plant optimization asdescribed in Sections 3 through 5. Once these stepsare completed, if the effluent still exhibits toxicity,then other approaches are indicated. These include:
l Source reduction technologies; and
0 Improvement of waste treatment operations.
Methods by which these may be applied to a specificindustrial facility are discussed below. In all cases,the evaluation of methods to remove toxicity fromwastestreams must consider the ramification oftransferring toxicants to other media. Possibleproblems include the need for disposal and/ortreatment of newly contaminated material. Each ofthe case studies included in Appendix A include somediscussion of identified toxicity reductionmethodologies which are specific to the identifiedtox icant (
Source ReductionSource reduction involves practices and proceduresaimed at reducing or eliminating toxic loads in themost practical, cost-effective, and permanent manneravailable. Source reduction may be accomplishedfrom the most upstream end of the process to thepoint of influent to the treatment plant. It assumesthat a specific source can be identified, and mayinvolve material substitution, process modifications,waste stream commingling, pretreatment, materialsrecovery or waste recycling.
Before source reduction can be effective, thosesources contributing to effluent toxicity must beidentified. This will normally take place during theToxicity Identification Evaluation or SourceIdentification phase of this study. Once identified,
appropriate remedial technologies for these wastestreams can then be examined.
Source reduction is not a clear-cut, step-by-stepprocess. The steps taken, criteria examined,procedures followed, and technologies addressed willbe highly case specific, and dependent upon suchfactors as wastestream composition, physicalconstraints, and flow variability. Therefore, whenexamining source reduction technologies, the analystmust first start out by identifying those areas mostlikely to be positively effected, and then identifyingthe technologies and approaches which are mostlikely to succeed.
Toxic components are sometimes found to be rawmaterial contaminants, reaction catalysts, oradditives. Sometimes even slight changes in thematerials used or specification of an alternate, higherpurity material can result in a measurable reductionin toxicity of the effluent. Further purification ofcontaminated raw materials at the plant site wouldbe an alternate means of accomplishing this end.
Modification of the process which generates aparticular toxic waste component has been found tobe a very practical means of toxicity reduction. Thesemodifications may be primarily aimed at wastereduction, or may be aimed at process efficiency; theend result is the same. Process modification couldalso consist of materials substitutions. All of theseoptions will involve an intensive evaluation byprocess engineering with the goal of eliminatingcertain specific compounds without sacrificingproduct quality or process efficiency.
Commingling of waste streams prior to treatmentmay also provide for toxicity reduction in theeffluent, The effect of dilution, neutralization,reaction, precipitation or other factors may enabletreatment or degradation of toxic components whichwas not otherwise possible. Care should be taken incombining waste streams, however, so as not toprompt unwanted reactions.
Materials recovery operations and waste recyclingare other source reduction options. For example, asmall amount of contaminated solvent may be
routinely discharged to the treatment system works,adding to the final toxicity. If this contribution can bediverted, and the material recovered, two benefits arepossible; toxicity in the final effluent may be reducedand solvent may be recovered. Metals recovery frommetal plating operations is another area where wasterecovery may be feasible.
Pretreatment should also be examined as a means ofreducing toxicity in the source waste streams. Bothphysical and chemical methods may be feasible,depending upon the stream. Each identified sourcestream should be examined to determine thecharacteristics of the toxic component(s). Knowledgeof these characteristics will allow evaluation ofalternate means to reduce the source toxicity,thereby reducing final effluent toxicity.
Technologies which may be applicable for sourcetreatment include chemical oxidation; wet airoxidation; resin adsorption; air, steam, or gasstripping; and membrane processes including reverseosmosis and filtration technologies. These processeswould be applied to the source stream prior toconventional treatment. The aim is to reduce thelevels of toxic contaminants in the source streamswhich are causing the observed toxicity in the finaleffluent. The actual technology employed in aparticular situation would be dependent upon factorsencountered at the site. Selection of an appropriatetechnology will probably require lab, bench and pilotscale demonstrations of the effectiveness of thetechnology prior to actual start up on a productionscale.
Waste Treatment OperationsImprovements
8-2
If toxicity in the effluent can be shown to result froma particular source contribution, and this source canbe economically reduced, then these techniquesshould be examined. If, however, toxicity stillappears in the effluent which cannot be attributed toa particular source or production process, or if sourcereduction is not feasible because the source cannot beidentified, then end-of-pipe treatment alternativesmust be examined.
Plant optimization is the most direct means toimprove waste treatment operations. Plantoptimization as described in Section 4 would takeplace before any plant alterations occur. If plantoperations are already at an optimal level, andeffluent quality still does not meet the desired goal,then further treatment modifications may berequired based on the results of the TIE. Areas to beexamined include hydraulic and mass loading of thefacility, chemical feed rates, biological enhancement,
source batching or segregation, effluent polishing,and additional treatment processes.
Hydraulic loading should be examined. It is possiblethat changes in existing processes or additions of newprocess lines may be causing serious disruptions inplant operations. If hydraulic loading is considered aproblem, alterations such as source sequencing,addition of equalization or buffer tanks, andexpansion of the treatment facility, should all beconsidered.
If contaminant levels in the waste streams are highenough, a plant can be hydraulically underloadedand still be receiving mass loadings in excess ofdesign capacity. High mass loading could result inpass-through of certain toxic contaminants, orreduction of treatment efficiency through shockloading and upsets of plant operations. All of thesepossibilities could lead to effluent toxicity and can beprevented through appropriate system modifications.
Adjustments and substitutions in the chemical usagein the various treatment processes can also result in adesirable improvement in the effluent water quality.Again, there may be sufficient difference betweendesign and operating conditions that adjustments areneeded to optimize plant performance. It may also bepossible, through substitution, to remove certainchemical species which are not removed by existingoperations, and which may be adding to the toxicityof the final effluent. Chemicals which should beconsidered include: cooling tower slimicides,ammonia nutrients, lime, some polymers, andoxidizing agents.
Bio-enhance_ment is another means to improvetoxicity reduction through a facility. Not allorganisms are equally effective at degradingparticular pollutants. If a stable community can beestablished which is capable of reducing certain toxiccontaminants, additional toxicity reduction mayresult. This may require seeding the system, possiblywith genetically engineered organisms, with anattendant period of growth and acclimation prior tooperation. The effectiveness and cost of establishing anew biological population should be carefullyinvestigate-d in bench or pilot-scale prior toimplementation.
Batching and sequencing of flows may be desirable inorder to even out peaks and valleys in the plantloading profiles. This can result in a more consistentlevel of treatment through the plant, and hence abetter quality effluent. This may require theconstruction of additional influent holding capacity(ponds or tanks).
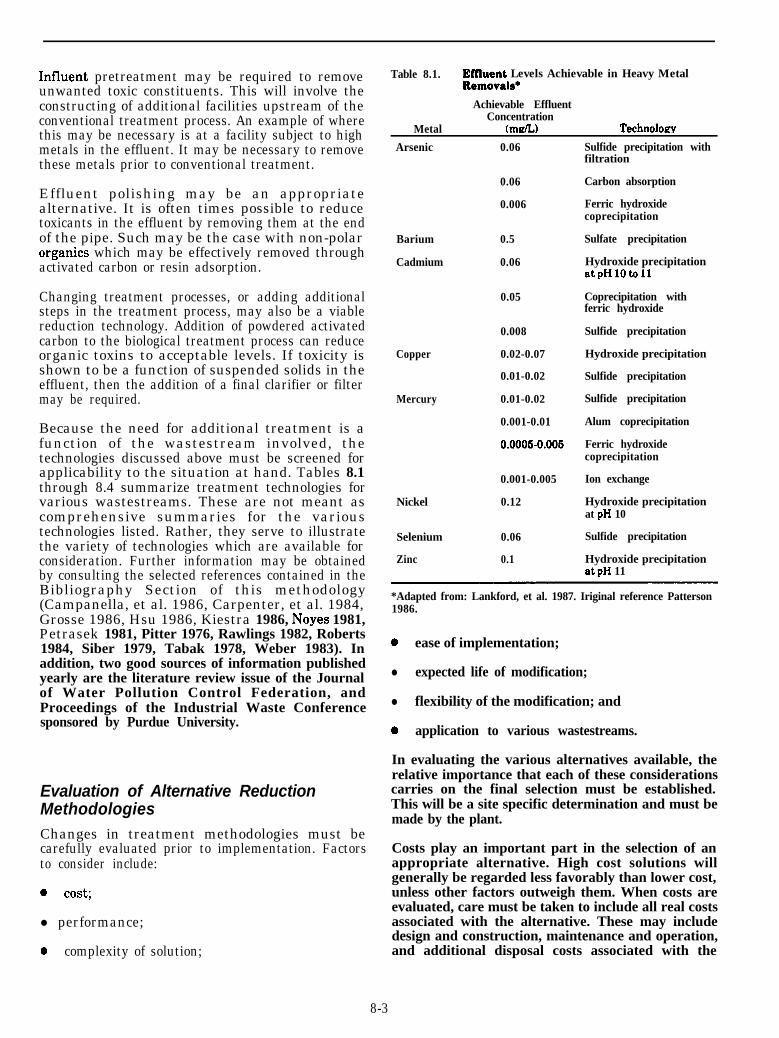
Influent pretreatment may be required to removeunwanted toxic constituents. This will involve theconstructing of additional facilities upstream of theconventional treatment process. An example of wherethis may be necessary is at a facility subject to highmetals in the effluent. It may be necessary to removethese metals prior to conventional treatment.
Effluent polishing may be an appropriatealternative. It is often times possible to reducetoxicants in the effluent by removing them at the endof the pipe. Such may be the case with non-polarorganics which may be effectively removed throughactivated carbon or resin adsorption.
Changing treatment processes, or adding additionalsteps in the treatment process, may also be a viablereduction technology. Addition of powdered activatedcarbon to the biological treatment process can reduceorganic toxins to acceptable levels. If toxicity isshown to be a function of suspended solids in theeffluent, then the addition of a final clarifier or filtermay be required.
Because the need for additional treatment is afunction of the wastestream involved, thetechnologies discussed above must be screened forapplicability to the situation at hand. Tables 8.1through 8.4 summarize treatment technologies forvarious wastestreams. These are not meant ascomprehensive summaries for the varioustechnologies listed. Rather, they serve to illustratethe variety of technologies which are available forconsideration. Further information may be obtainedby consulting the selected references contained in theBibliography Section of this methodology(Campanella, et al. 1986, Carpenter, et al. 1984,Grosse 1986, Hsu 1986, Kiestra 1986, Noyes 1981,Petrasek 1981, Pitter 1976, Rawlings 1982, Roberts1984, Siber 1979, Tabak 1978, Weber 1983). Inaddition, two good sources of information publishedyearly are the literature review issue of the Journalof Water Pollution Control Federation, andProceedings of the Industrial Waste Conferencesponsored by Purdue University.
Evaluation of Alternative ReductionMethodologiesChanges in treatment methodologies must becarefully evaluated prior to implementation. Factorsto consider include:
a cost;
l performance;
0 complexity of solution;
Table 8.1. Effluent Levels Achievable in Heavy MetalRemovaW
Metal
Achievable EffluentConcentration
(ma/L) Technoloarv
Arsenic 0.06
0.06
0.006
Barium 0.5
Cadmium 0.06
0.05
0.008
Copper 0.02-0.07
0.01-0.02
Mercury 0.01-0.02
0.001-0.01
0.0006-0.005
0.001-0.005
Nickel 0.12
Selenium 0.06
Zinc 0.1
Sulfide precipitation withfiltration
Carbon absorption
Ferric hydroxidecoprecipitation
Sulfate precipitation
Hydroxide precipitationatpH lot011
Coprecipitation withferric hydroxide
Sulfide precipitation
Hydroxide precipitation
Sulfide precipitation
Sulfide precipitation
Alum coprecipitation
Ferric hydroxidecoprecipitation
Ion exchange
Hydroxide precipitationat pH 10
Sulfide precipitation
Hydroxide precipitationatpH 11
*Adapted from: Lankford, et al. 1987. Iriginal reference Patterson1986.
0 ease of implementation;
l expected life of modification;
l flexibility of the modification; and
0 application to various wastestreams.
In evaluating the various alternatives available, therelative importance that each of these considerationscarries on the final selection must be established.This will be a site specific determination and must bemade by the plant.
Costs play an important part in the selection of anappropriate alternative. High cost solutions willgenerally be regarded less favorably than lower cost,unless other factors outweigh them. When costs areevaluated, care must be taken to include all real costsassociated with the alternative. These may includedesign and construction, maintenance and operation,and additional disposal costs associated with the
8-3
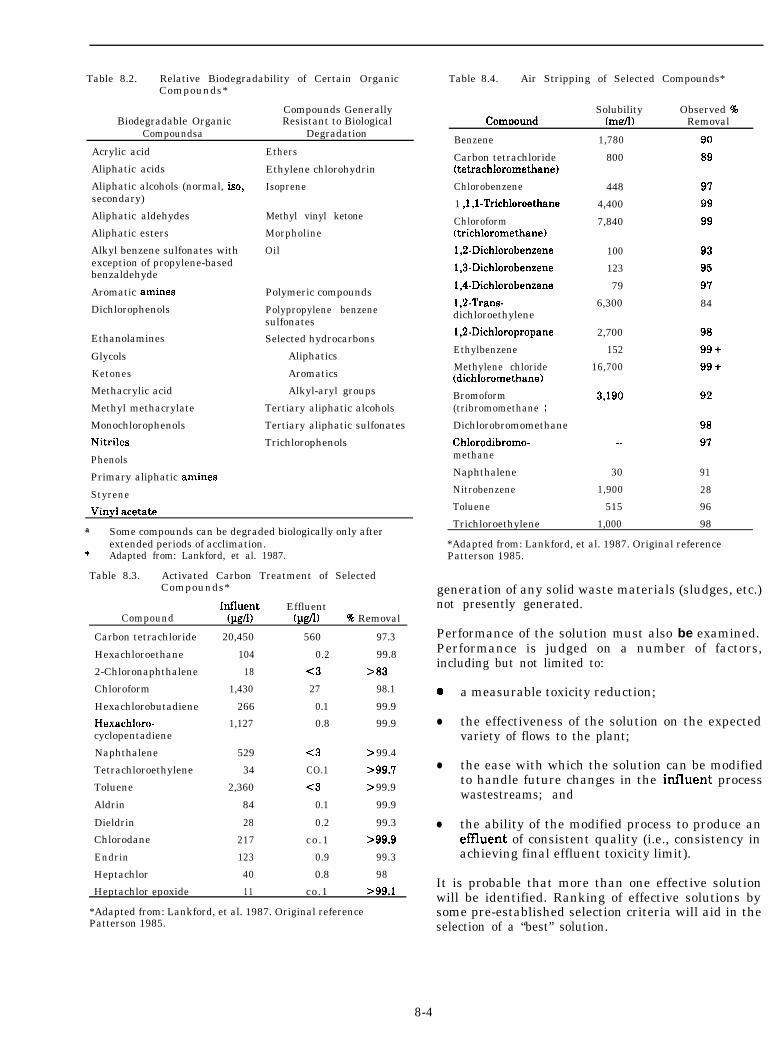
Table 8.2. Relative Biodegradability of Certain OrganicCompounds*
Biodegradable OrganicCompoundsa
Compounds GenerallyResistant to Biological
Degradation
Acrylic acid
Aliphatic acids
Aliphatic alcohols (normal, iso,secondary)
Aliphatic aldehydes
Aliphatic esters
Alkyl benzene sulfonates withexception of propylene-basedbenzaldehyde
Aromatic amines
Dichlorophenols
Ethanolamines
Glycols
Ketones
Methacrylic acid
Methyl methacrylate
Monochlorophenols
Nitriles
Phenols
Primary aliphatic amines
Styrene
Ethers
Ethylene chlorohydrin
Isoprene
Methyl vinyl ketone
Morpholine
Oil
Polymeric compounds
Polypropylene benzenesulfonates
Selected hydrocarbons
Aliphatics
Aromatics
Alkyl-aryl groups
Tertiary aliphatic alcohols
Tertiary aliphatic sulfonates
Trichlorophenols
a Some compounds can be degraded biologically only afterextended periods of acclimation.
* Adapted from: Lankford, et al. 1987.
Table 8.3. Activated Carbon Treatment of SelectedCompounds*
Influent EffluentCompound (pgfl) (pgfll 96 Removal
Carbon tetrachloride 20,450 560 97.3
Hexachloroethane 104 0.2 99.8
2-Chloronaphthalene 18 <3 >83
Chloroform 1,430 27 98.1
Hexachlorobutadiene 266 0.1 99.9
Hexachloro- 1,127 0.8 99.9cyclopentadiene
Naphthalene 529 <3 > 99.4
Tetrachloroethylene 34 CO.1 B99.7
Toluene 2,360 c3 > 99.9
Aldrin 84 0.1 99.9
Dieldrin 28 0.2 99.3
Chlorodane 217 co .1 >99.9
Endrin 123 0.9 99.3
Heptachlor 40 0.8 98
Heptachlor epoxide 11 co.1 >99.1
*Adapted from: Lankford, et al. 1987. Original referencePatterson 1985.
Table 8.4. Air Stripping of Selected Compounds*
Solubility Observed %Comnound (mg/l) Removal
Benzene
Carbon tetrachloride(tetrachloromethanel
Chlorobenzene
1 ,l ,l-Trichloroethane
Chloroform(trichloromethane)
1,2-Dichlorobenzene
1,3-Dichlorobenzene
1,4-Dichlorobenzene
1,2-Trans-dichloroethylene
1,2-Dichloropropane
Ethylbenzene
Methylene chloride(dichloromethanel
Bromoform(tribromomethane 1Dichlorobromomethane
Chlorodibromo-methane
Naphthalene
Nitrobenzene
Toluene
1,780 90
800 89
448 97
4,400 99
7,840 99
100 93
123 95
79 97
6,300 84
2,700 98
152 99+
16,700 99+
3,190
__
30 91
1,900 28
515 96
92
98
97
Trichloroethylene 1,000 98
*Adapted from: Lankford, et al. 1987. Original referencePatterson 1985.
generation of any solid waste materials (sludges, etc.)not presently generated.
Performance of the solution must also be examined.Performance is judged on a number of factors,including but not limited to:
0 a measurable toxicity reduction;
l the effectiveness of the solution on the expectedvariety of flows to the plant;
l the ease with which the solution can be modifiedto handle future changes in the influent processwastestreams; and
l the ability of the modified process to produce aneMuent of consistent quality (i.e., consistency inachieving final effluent toxicity limit).
It is probable that more than one effective solutionwill be identified. Ranking of effective solutions bysome pre-established selection criteria will aid in theselection of a “best” solution.
8-4
The complexity of the solution and the ease withwhich the solution may be implemented areimportant factors to consider. An easily implementedsolution is often desirable over one which requiressignificant investment in time and resources, notonly because of resource savings, but also because thereception at the plant level may be better. Complexbiological systems require more lengthy start-up andacclimation periods. The smoother the transitionprocess is the more likely changes will succeed inbringing about the desired effects.
All changes will carry with them attendant usefullives dependent upon the type of change made anddesign criteria. The useful life is associated with costand must also be viewed in light of possible changesin plant production processes and regulatoryrequirements.
The flexibility of the reduction methodology and itsapplicability to a variety of wastestreams also bearsexamination. A solution may give good results over ashort time frame, but may become obsolete throughthe introduction of new processes and newwastestreams. Process changes, plant expansions,and the like should all be considered. Fluctuations inthe present wastestream should also be examined, asthese may effect the appropriateness of the evaluatedtechnology.
Selection of Reduction MethodologyAfter potential reduction methodologies have beenidentified and evaluated, the selection process takesplace. At this point, each methodology has beenexamined, and certain qualities defined (cost,performance, flexibility). Selection requires thatthese qualities be ranked according to someestablished criteria, such that a “best” methodologymay be chosen from those identified as potentialsolutions.
Each alternative is assigned a weighting with regardto the criteria and ranked. Selection of the “best”alternative may then proceed based upon the rankingachieved.
Once the alternative is identified, confirmationbegins at the lab, bench and/or pilot scales. This isessential, since in most instances, significantinvestment in time and resources is required forimplementation. Solutions which look good on papermay not work in actual application due to unforeseenor unanticipated factors. It may be necessary to gothrough testing on several “best“ solutions before oneis identified which performs up to expectations.
Implementation of the SolutionWhen the “best” solution has been selected andconfirmed, the implementation process can begin.Implementation may consist of several phases,dependent upon the mechanism selected. If a newtreatment facility is built, then this process mayinclude design, construction, and start up. If thechange is procedural, then these stages may beconcept, planning, and implementation. Whateverthe method selected, the final objective is the same --reduce toxicity in the final effluent to acceptablelevels.
Follow-Up and ConfirmationAfter implementation, follow up and confirmationare essential. A solution which does not function asplanned is no solution; likewise, specific proceduralchanges must be carefully implemented andmaintained if they are to continue providing the levelof effectiveness anticipated. More is said on the followup tier in the following chapter.
8-5
Section 9Follow-Up and Confirmation
The final phase of the TRE process, which occursafter the control method has been selected andimplemented, is to confirm that final effluent toxicityhas been reduced to acceptable levels. This can beaccomplished by implementing an appropriatemonitoring program to measure final effluenttoxicity. The follow-up biomonitoring would alsomost likely be part of a required permit monitoringprogram, specified in an NPDES permit andassociated with a specific limit. In general, theacceptable endpoint of the evaluation would be thetarget that the TRE was designed to meet which alsowould be the permit compliance limits for toxicity.These limits and endpoints could be for either acuteor chronic toxicity.
Usually, the applicable conditions for follow-upmonitoring will be spelled out by the NPDES permit,administrative order, etc. Chemical analyses for thecausative agents of effluent toxicity might also berequired in the follow-up monitoring program.
Several of the case studies found in Appendix A haveprogressed to the point of implementing follow-upand confirmation activities. In Appendix A-l, follow-up testing indicated that acute toxicity had beeneither eliminated or greatly reduced. Follow-upmonitoring in Appendix A-7 was used to confirm thatnon-biodegradable organic matter was still thesource of final effluent toxicity.
Normally, the same biomonitoring test and toxicityendpoint (LC50 or NOEL) which initially indicatedthe effluent toxicity and triggered the TRE will beused to confirm the successful reduction of effluenttoxicity. The test conditions and procedures, as wellas the number and timing of samples, will bespecified by the regulatory authority. Typically, aperiod of accelerated monitoring to confirm thetoxicity reduction will be required prior to resumingregular permit biomonitoring.
9-l
Section 10References
Berg, E. 1982. Handbook for Sampling and SamplePreservation of Water and Wastewater. U.S.Environmental Protection Agency, Cincinnati,Ohio. EPA 600/4-82-019.
Berthovek, D.M., and R. Fan. “Evaluation ofTreatment Plant Performance: Causes, Frequency,and Duration of Upsets.” J. Water PollutionControl Federation, 58,368 (1986).
Burks, S.L. Toxicity of Petroleum RefineryWastewaters Relative to Types of TreatmentSystems. U.S. Environmental Protection Agency,Cincinnati, Ohio (1984).
Campanella, L., E. et al. “Mercury Removal fromPetrochemical Wastes,” Water Research, 20, 1, 63(1986).
Carpenter, B.H., et al. Toxicity Treatability of Ironand Steel Plant Wastewaters: A ResourceDocument. U.S. Environmental Protection AgencyOffice of Research and Development, Washington,D.C., June 1984.
Draper N. R., and H. Smith. Applied RegressionAnaZysis. John Wiley and Sons, New York, NewYork (1966) pg. 178.
Eckenfelder, W.W., J. Patoczka, and A. Watkin,Wastewater Treatment, Chemical Engineering,September 2,1985.
Grosse, D.W. “A Review of Alternative TreatmentProcesses for Metal Bearing Hazardous WasteStreams.” J. Air Pollution Control Federation, 36,603 (1986).
Hsu, E.H. “Treatment of Petrochemical Wastewatersin Sequencing Batch Reactors.” EnvironmentalProgress, 5,2,71(1986).
Infometrex, Inc., Arthur, Pattern RecognitionSoftware, Seattle, Washington (1986).
Kiestra, H., and I. Eggers. “Treatment of IndustrialWastewater.” Water Science Technology, 18, 3(1986).
Kincannon, D.F., and E.L. Stover. “Determination ofActivated Sludge Biokinetic Constants for
Chemical and Plastic Industrial Wastewaters.”Environmental Protection Agency Draft Report,CR-806843-01-02 (1982).
Lankford, P.W., Y. Argaman, and K.D. Torrens.Methodology for Toxicity Limitation ComplianceThrough Source Analysis. 59th Annual WaterPollution Control Federation Conference, October1986.
Lankford, P.W., W. W. Edrenfelder, and K. D.Torrens. Technological Approaches to ToxicityReduct ion in Munic ipal and Industr ia lWastewater. Annual Meeting Virginia WaterPollution Control Association, April 1987.
Mount, D. I., and L. Anderson-Carnahan. “Methodsfor Toxicity Reduction Evaluations: Phase I -Toxicity Characterization Procedures.” Draftdated January 1987.
Noergaard, G., D. Duffy, and S. Vanderboom.“Troubleshooting Conventional WastewaterPretreatment Systems.” Plating SurfaceFinishing, 73,2,26 (1986).
De Renzo, D.J. Pollution Control Technology forIndustrial Wastewater. Noyes Data Corporation,Parkeridge, New Jersey (1981).
Patterson, J.W. Industrial Wastewater TreatmentTechnology. 2nd Edition, Butterworth Publisher,Boston, Mass. (1985).
Petrasek, A.C. Removal and Partitioning of theVolatile Priority Pollutants in ConventionalWastewater Treatment Plants - A Capsule Report.U.S. Environmental Protection Agency Report,MERL, Cincinnati, OH, October 1981.
Petrasek, A.C., et al. Fate of Toxic OrganicCompounds in Wastewater Treatment Plants. J.Nat. Poll. Cont. Fed., V. 55, p. 1286 (1983).
Pielou, E.C. Cluster Analyses Techniques: TheInterpretation of Ecological Data. W i l e yInterscience, New York, New York (1987).
10-l10-l
Pitter, P. “Determination of Biological Degradabilityof Organic Substances,” Water Research, 10, 231(1976).
Rawlings, G.D. Toxicity Reduction Manual for theT e x t i l e M a n u f a c t u r i n g I n d u s t r y . U . S .Environmental Protection Agency, ResearchTriangle Park, N.C., June 1982.
Roberts, P.V., et al. Volatization of OrganicPollutants in Wastewater Treatment - ModelStudies. U.S. Environmental Protection AgencyNTIS No. PB84-158856 (1984).
SCS Engineers, A Curex Corporation. ToxicityReduction Manual for the Organic ChemicalIndustry. U.S. Environmental Protection Agency,Cincinnati, Ohio, February 1984.
Siber, S., and W.W. Eckenfelder. “Effluent QualityVariation from Multicomponent Substrates in theActivated Sludge Process.” Water Research, 13, 8,August 1979.
Tabak, H.H., and E.F.Barth. “Biodegradability ofBenzidine in Aerobic Suspended GrowthReactors.” Journal Water Pollution ControlFederation, 50,552 (1978).
U.S. Environmental Protection Agency. TechnicalGuidance Manual for Performing WasteloadAllocations, Book II. Streams and Rivers. Office ofWaste Regulations and Standards, Washington,D.C. (1983).
U.S. Environmental Protection Agency. TechnicalGuidance Manual for Performing WasteloadAllocations, Book III. Estuaries. Office of WasteRegulations and Standards. Washington, D.C.(1984a).
U.S. Environmental Protection Agency. TechnicalGuidance Manual for Performing WasteloadAllocations, Book IV. Lakes, Reservoirs, andImpoundments. Office of Waste Regulations andStandards, Washington, D.C. (1984b).
U.S. Environmental Protection Agency. “NationalPolicy Statement for the Development of WaterQuality-Based Permit Limitations for ToxicPollutants.” Federal Register 49:9016-9019(1984c).
U.S. Environmental Protection Agency. TechnicalSupport Document for Water Quality - BasedToxics Control. Office of Water, Washington, D.C.(1985a).
U. S. Environmental Protection Agency. AmbientWater Quality Criteria for Cadmium - 1984. Officeof Water, Washington, D. C. EPA440/5-84-032,January 1985b.
U. S. Environmental Protection Agency. AmbientWater Quality Criteria for Copper - 1984. Office ofWater, Washington, D. C. EPA440/5-84-031,January 1985c.
U.S. Environmental Protection Agency. T h eNational Pretreatment Program. EnvironmentalRegulations and Technology, EPA./625/10-86/005(1986a).
U.S. Environmental Protection Agency. ProjectSummary: Evaluation of Emerging Technologiesfor the Destruction of Hazardous Wastes.EPA/600/52-85/069, January 1986b.
U.S. Environmental Protection Agency. Report toCongress on the discharge of Hazardous Wastes toPublicly Owned Treatment Works (The DomesticSewage Study). Office of Water Regulations andStandards. February 1986.
U S. Environmental Protection Agency. PermitWriter’s Guide to Water Quality-Based Permittingfor Toxic PoZZutants. Office of Water, Washington,D.C. (1987a).
U.S. Environmental Protection Agency. “ToxicityReduction Evaluation Protocol for MunicipalWaste Treatment Plants.” Draft dated September1987b.
U.S. Environmental Protection Agency. 1979.Methods for Chemical Analysis of Water andWaste. Cincinnati, Ohio. EPA 600/4-79-020
U.S. Environmental Protection Agency. Methods forAquatic Toxicity Identification Evaluations: PhaseI - Toxicity Characterization Procedures.September 1988.
U.S. Environmental Protection Agency. “Methods forAquatic Toxicity Identification Evaluations: PhaseII - Toxicity Identification Procedures.” In press.
US. Environmental Protection Agency. “Methods forAquatic Toxicity Identification Evaluations: PhaseIII - Toxicity Confirmation Procedures.” In press.
Walsh, C. E., and R. L. Garnas. “Determination ofBioactivity of Chemical Fractions of Liquid WastesUsing Freshwater and Saltwater Algae andCrustaceans.” Environmental Science andTechnology, 17:180-182 (1983).
Weber, W.J., and B. Jones. “Toxic SubstanceRemoval in Activated Sludge and PAC TreatmentSystems.” U.S. Environmental Protection AgencyNTIS No. PB86- 182425/AS (1983).
10-2
TRE
Introduction
Appendix ACase Summaries
Appendix A presents case studies which provide examples of TREs conducted at 10different industrial facilities whose final effluents had been found to be toxic to aquaticorganisms. The 10 examples given represent a variety of industrial processes andillustrate a variety of approaches to TREs using the guidelines described in thisprotocol. Each case study is organized to present information in five categories:
1. Initial Data and Information Acquisition
2. Toxicity Identification Evaluation (TIE)
3. Toxicity Reduction Approaches
4. Follow-up and Confirmation
5. Problems Encountered.
As demonstrated by these case studies, there is considerable latitude within eachof the categories listed above with respect to an approach of the TRE. This illustratesthat the design of any TRE is unique and should be approached with deductivereasoning aimed at the particular situation (however, some general principles willapply in every case). Case studies A-5 and A-9 are more representative of the approachto conducting a TIE that is described in this protocol than are the other less recent casestudies.
A-l
Section A-1
Case History: A Multipurpose Specialty Chemical Plant (MSCP) in Virginia
/ntroduction
The Chemicals and Chemical Products Branch(CCPB) of the Water Engineering ResearchLaboratory (WERL) of the U.S. EPA, working withthe Battelle Columbus Division (BCD), has beendeveloping, testing, and refining a protocol forconducting TREs to provide guidance for permitwriters and permittees. Developing the protocolinvolves several case studies by Battelle wherebyTREs are conducted at specific industrial sites. Theresults of these case studies and others will bedocumented and will be used to develop the finalprotocol.
U.S. EPA-WERL selected a multipurpose specialtychemical plant in Virginia as the first site (Site No.1)for conducting a TRE base on the recommendations ofthe Virginia State Water Quality Control Board.Historical toxicity data collected in January 1985 byU.S. EPA indicated that the final effluent at Site No.1 was highly toxic to D. magna (24-hr. LC5o < 1percent effluent) and moderately toxic to fatheadminnows (24-hr. LC5o = 21 percent effluent). (U.S.EPA unpublished data). The on-site activities of theTRE at Site No. 1 started in May 1985 and werecompleted in June 1986.
initial Data and Information AcquisitionIn May, 1985, an initial visit to Site No. 1. wasconducted to interview plant personnel, tour thefacility, identify and establish sampling locations,and also visually inspect the wastewater treatmentsystem and the various waste streams and unitoperations of the system and plant. Operationsreports, such as NPDES monitoring reports and a listof chemicals utilized by the MSCP, were obtained.
During this initial work, a plant flow diagram wasdeveloped of the unit operations and waste treatmentsystem at the MSCP plant (Figure Al-l). Aminesfrom Unit No. 1 [Ala = 29,000 gallons per day(GPD)] and Unit No. 4 (Alb = 5,000 GPD) aredischarged into an aerated biological treatment tank(evaporation = 4,000 GPD; 20 to 30 day retention)and then into the main treatment sump (Al = 9,000GPD). Effluents from the cooling towers (A3 =
43,000 GPD), boiler (A4 = 173,000 GPD) andmetabisulfite unit (A5 = 87,000 GPD) are alsodischarged into the main treatment sump (Influent A= 341,000 GPD). The main treatment sump servesmainly as a pH adjustment unit. Amine effluents arebasic (pH 11 to 12) whereas the metabisulfite effluentis acidic (pH 5). Liming is done in the main treatmentsump (1 hour) and the contact time extended to 8hours in the aeration tank. The aeration tank(evaporation = 3,000 GPD) also receives effluentfrom the collection sump (Influent B = 180,000GPD). The collection sump receives the effluent fromthe specialty chemicals (Bl = 144,000 GPD), andfrom the aerosol pesticides (B2a), research (B2b) andlaboratory (B2c) unit operations (B2 = 36,000 GPD).
Effluent from the aeration tank (518,000 GPD)discharges to the first settling pond (total volume of800,000) where the mean residence time isapproximately 40 hours. Once or twice a year bottomsediment (principally CaS04 sludge) from this pondis removed and placed in a small drying pond prior todisposal at a landfill. Effluent from the first settlingpond was then discharged into the second settlingpond (total volume of 1.3 million gallons) where themean residence time is 60 hours, then finally to apolishing pond (total volume of 2.4 million gallons)where the mean residence time is approximately 110hours before being discharged to the receiving water.North pond also discharges into the aeration tankand first settling pond. This was an older wasteholding pond and has an intermittent discharge.
Because of the proprietary nature of much of thechemical production at Site No. 1, very littleinformation on production processes was obtained.
Toxicologists also reviewed a list provided by theBureau of Toxic Substances Information of the Stateof Virginia, which itemized all commercialcompounds utilized at Site No. 1. Historical toxicitydata collected in January 1985 by U.S. EPA indicatedthat the final effluent at MSCP was highly toxic to D.magna (24-hr. LC5o < 1 percent effluent) andmoderately toxic to fathead minnows (24-hr. LCso =21 percent effluent). Because the final effluentexhibited high acute toxicity to Duphnia but onlymoderate acute toxicity to fathead minnows,
A-3
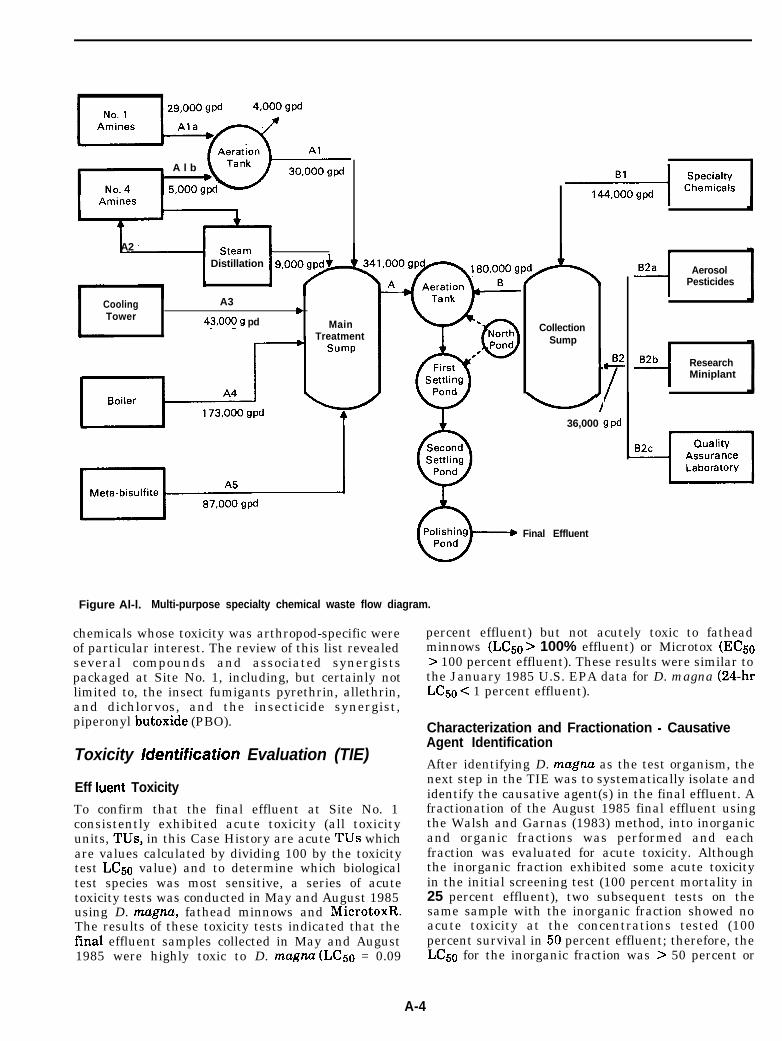
- A l b
‘y-k,A2 ,1 Distillation 1 9,ooi3gpd
fb
MainTreatment
IB2a---I Aerosol
Pesticides
CoolingTower
A3
43,OOg_g pd CollectionSump
IB2b--I Research
Miniplant
fI
36,000 g pd
Final Effluent
Figure Al-l. Multi-purpose specialty chemical waste flow diagram.
chemicals whose toxicity was arthropod-specific wereof particular interest. The review of this list revealedseveral compounds and associated synergistspackaged at Site No. 1, including, but certainly notlimited to, the insect fumigants pyrethrin, allethrin,and dichlorvos, and the insecticide synergist,piperonyl butoxide (PBO).
Toxicity identification Evaluation (TIE)
Eff bent Toxicity
To confirm that the final effluent at Site No. 1consistently exhibited acute toxicity (all toxicityunits, TUs, in this Case History are acute TUs whichare values calculated by dividing 100 by the toxicitytest LC5o value) and to determine which biologicaltest species was most sensitive, a series of acutetoxicity tests was conducted in May and August 1985using D. magna, fathead minnows and MicrotoxR.The results of these toxicity tests indicated that thefinal effluent samples collected in May and August1985 were highly toxic to D. magnu (LC50 = 0.09
percent effluent) but not acutely toxic to fatheadminnows (L&o > 100% effluent) or Microtox (EC50> 100 percent effluent). These results were similar tothe January 1985 U.S. EPA data for D. magna (24-hrLC5o < 1 percent effluent).
Characterization and Fractionation - CausativeAgent Identification
After identifying D. magna as the test organism, thenext step in the TIE was to systematically isolate andidentify the causative agent(s) in the final effluent. Afractionation of the August 1985 final effluent usingthe Walsh and Garnas (1983) method, into inorganicand organic fractions was performed and eachfraction was evaluated for acute toxicity. Althoughthe inorganic fraction exhibited some acute toxicityin the initial screening test (100 percent mortality in25 percent effluent), two subsequent tests on thesame sample with the inorganic fraction showed noacute toxicity at the concentrations tested (100percent survival in 50 percent effluent; therefore, theLC5o for the inorganic fraction was > 50 percent or
A-4
< 2 TUs after storage of one day). The toxicityoriginally observed in the inorganic fraction was notpersistent.
The organic fraction of the August 1985 final effluentsample, however, was highly toxic (LC50 = 0.14percent effluent or 714 TUs). Therefore, the organicfraction was further separated into acid, base/neutraland residual subfractions and each subfraction wasevaluated for acute toxicity. All three organicsubfractions exhibited acute toxicity, but the acidsubfraction (LC5o = 1.64 percent or 61 TUs) and thebase/neutral subfraction (LC5o = 0.41 percent or 244TUs) were significantly more toxic than levels of thesolvent, methylene chloride, added duringfractionation (LC5o > 10 percent or < 10 TUs). Thus,the acid and base/neutral subfractions were analyzedby GC/MS in an attempt to identify potentially toxicchemical constituents.
When the acute toxicity of the final effluent wasevaluated in terms of Toxicity Units (TUs), the finaleffluent sample initially contained 1,111 TUs. Theinorganic fraction contained < 2 TUs while theorganic fraction contained 714 TUs. There was anapparent loss of some toxicity in the fractionation(1,111 TUs in the effluent versus 716 TUs in thecombined fractions), but it appeared that theprincipal source of toxicity in this sample was organicin nature and may have resided in the base/neutralsubfraction (244 TUs in the base/neutral subfractionversus 61 TUs in the acid subfraction and < 10 TUsin the residual subfraction).
The GC/MS analysis of the base/neutral subfractionshowed dichlorvos present in the final effluent at aconcentration of 10 pg/L. High levels of two aminesproduced at Site No. 1, an alkyl diamine anddicyclohexylamine, also were found along with otherorganic components in this sample. Screeningtoxicity tests with the two amines found in highconcentrations indicated that neither the diamine(LC50 = 6 mg/L) nor the dicyclohexylamine (LC5o =16 mg/L) alone or together could have caused theacute toxicity observed in the August 1985 effluentsample. However, historical toxicity data ondichlorvos showed that it was acutely toxic toinvertebrates with an LC5o of 0.07 ug/L for Daphniapulex, an invertebrate closely related to D. magna,the test organism used in this TRE.
Source Investigation
Site No. 1 had an aerosol pesticide packagingoperation in which empty containers (formerlycontaining pesticides including dichlorvos) werewashed and the rinse water was discharged into thesewer and subsequently into the wastewatertreatment system through the collection sump. Inmid-November 1985, the pesticide-packagingoperation at Site No. 1 (the presumed source of the
A-5
dichlorvos) was permanently closed down and movedoff-site. Therefore, if dichlorvos (or some othercomponent of the packaging operation) wasresponsible for the toxicity of the final effluent, thenthe acute toxicity of the effluent should havedecreased in samples collected after the closure of thepackaging operation.
Following the closure of the packaging operation, thefinal effluent was screened three times for acutetoxicity, once in November 1985 and twice inJanuary 1986. The LC5o values resulting from thesetests were 0.6,81, and 79 percent effluent with TUs of167, 1, and 1, respectively. Compared with theAugust 1985 effluent sample which contained 1,111TUs, the three effluent samples collected after theclosure of the packaging operation were muchreduced in acute toxicity to D. magna indicating thatdichlorvos from the packaging operation may havebeen principally responsible for the toxicity observedpreviously.
Confirmation of Source or Agent
To confirm that the acute toxicity originally observedin the Site No. 1 final effluent was no longer present,a second effluent fractionation was performed on afinal effluent sample collected on February 24125,1986 High bisulfite concentrations were present inthe effluent sample due to poor operation of the wastetreatment system (286 to 290 mg/L SO$-) and thesample had to be aerated to oxidize the bisulfite andthe pH had to be readjusted to 7 before toxicitytesting. After aeration and pH adjustment, the LC5owas < 3 percent effluent (~33 TUs), which was agreater than six-fold increase in toxicity comparedwith the toxicity of the unaerated effluent (LC5o = 18percent effluent or 6 TUs) (Table Al-l).Some of theacute toxicity observed in the unaerated effluentsample may have been due to the low dissolvedoxygen caused by the high concentrations of bisulfitepresent in the effluent sample.
The fractionation and subsequent toxicity testing ofthe February 1986 effluent sample revealed that theorganic fraction was no longer toxic with an LCso >100 percent (95 to 100 percent survival in 100 percenteffluent fraction; effluent fractionated twice). Theinorganic fraction, however, exhibited the same toxicbehavior as the final effluent with the LC5o < 3percent for the aerated inorganic fraction an LC50 of42 percent (2 TUs) for the unaerated fraction. Some ofthe acute toxicity of the unaerated inorganic fractionmay have been caused by the low dissolved oxygen inthe test solutions due to the high bisulfiteconcentrations in the effluent sample (resulting frominefficient destruction of the bisulfite in the wastetreatment process). This behavior indicated that theaeration and/or pH adjustment treatments addedtoxicity to the sample by altering the effluentcomponents in some as yet unknown manner. In two
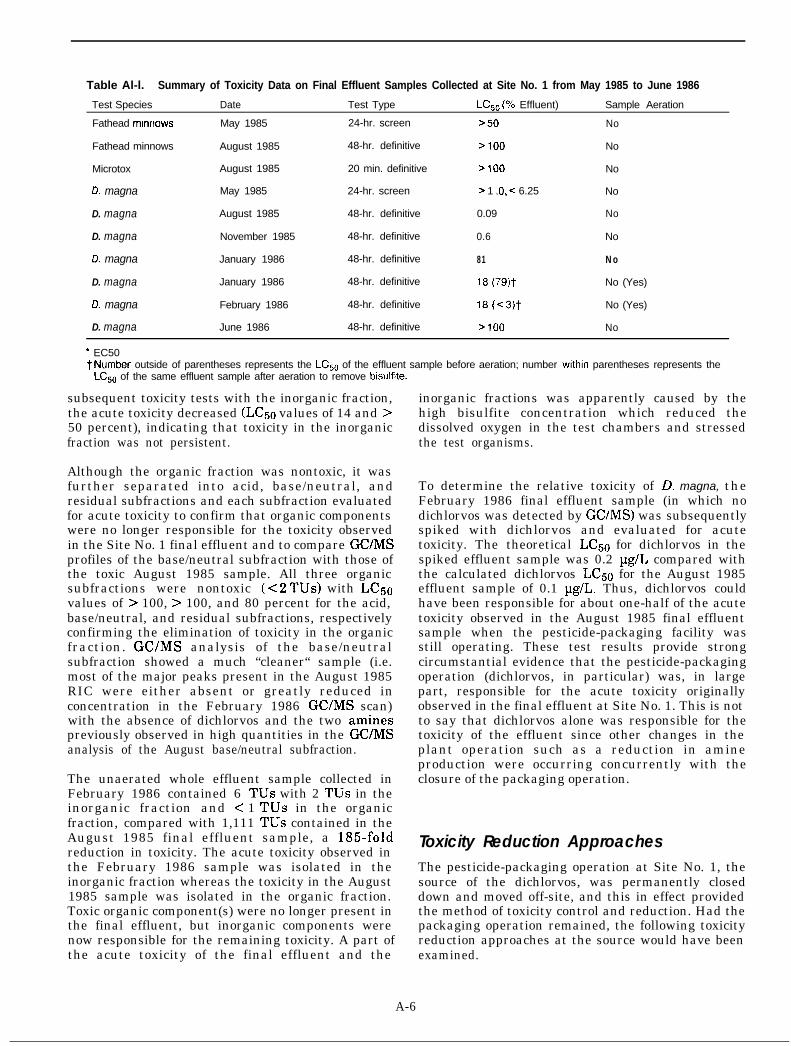
Table Al-l. Summary of Toxicity Data on Final Effluent Samples Collected at Site No. 1 from May 1985 to June 1986
Test Species Date Test Type LC,, (% Effluent) Sample Aeration
Fathead mrnnows May 1985 24-hr. screen >50 No
Fathead minnows August 1985 48-hr. definitive >lOO No
Microtox August 1985 20 min. definitive >lOO No
0. magna May 1985 24-hr. screen > 1 .O, < 6.25 No
D. magna August 1985 48-hr. definitive 0.09 No
D. magna November 1985 48-hr. definitive 0.6 No
D. magna January 1986 48-hr. definitive 81 No
D. magna January 1986 48-hr. definitive 16 (79)t No (Yes)
D. magna February 1986 48-hr. definitive 18 (<3)t No (Yes)
D. magna June 1986 48-hr. definitive >lOO No
* EC50TNumber outside of parentheses represents the LC,, of the effluent sample before aeration; number wrthrn parentheses represents the
L&s of the same effluent sample after aeration to remove btsulfite.
subsequent toxicity tests with the inorganic fraction,the acute toxicity decreased (LC50 values of 14 and >50 percent), indicating that toxicity in the inorganicfraction was not persistent.
Although the organic fraction was nontoxic, it wasfurther separated into acid, base/neutral, andresidual subfractions and each subfraction evaluatedfor acute toxicity to confirm that organic componentswere no longer responsible for the toxicity observedin the Site No. 1 final effluent and to compare GC/MSprofiles of the base/neutral subfraction with those ofthe toxic August 1985 sample. All three organicsubfractions were nontoxic (~2 TUs) with LC5ovalues of > 100, > 100, and 80 percent for the acid,base/neutral, and residual subfractions, respectivelyconfirming the elimination of toxicity in the organicfraction. GC/MS analysis of the base/neutralsubfraction showed a much “cleaner“ sample (i.e.most of the major peaks present in the August 1985RIC were either absent or greatly reduced inconcentration in the February 1986 GC/MS scan)with the absence of dichlorvos and the two aminespreviously observed in high quantities in the G-C/MSanalysis of the August base/neutral subfraction.
The unaerated whole effluent sample collected inFebruary 1986 contained 6 TUs with 2 TUs in theinorganic fraction and < 1 TUs in the organicfraction, compared with 1,111 TUs contained in theAugust 1985 final effluent sample, a 185-foldreduction in toxicity. The acute toxicity observed inthe February 1986 sample was isolated in theinorganic fraction whereas the toxicity in the August1985 sample was isolated in the organic fraction.Toxic organic component(s) were no longer present inthe final effluent, but inorganic components werenow responsible for the remaining toxicity. A part ofthe acute toxicity of the final effluent and the
inorganic fractions was apparently caused by thehigh bisulfite concentration which reduced thedissolved oxygen in the test chambers and stressedthe test organisms.
To determine the relative toxicity of D. magna, theFebruary 1986 final effluent sample (in which nodichlorvos was detected by GC/MS) was subsequentlyspiked with dichlorvos and evaluated for acutetoxicity. The theoretical L&o for dichlorvos in thespiked effluent sample was 0.2 pg/L compared withthe calculated dichlorvos LC50 for the August 1985effluent sample of 0.1 pg/L. Thus, dichlorvos couldhave been responsible for about one-half of the acutetoxicity observed in the August 1985 final effluentsample when the pesticide-packaging facility wasstill operating. These test results provide strongcircumstantial evidence that the pesticide-packagingoperation (dichlorvos, in particular) was, in largepart, responsible for the acute toxicity originallyobserved in the final effluent at Site No. 1. This is notto say that dichlorvos alone was responsible for thetoxicity of the effluent since other changes in theplant operation such as a reduction in amineproduction were occurring concurrently with theclosure of the packaging operation.
Toxicity Reduction ApproachesThe pesticide-packaging operation at Site No. 1, thesource of the dichlorvos, was permanently closeddown and moved off-site, and this in effect providedthe method of toxicity control and reduction. Had thepackaging operation remained, the following toxicityreduction approaches at the source would have beenexamined.
A-6
Treatability Evaluations
Carbon and/or resin adsorption of effluent B2a(Figure Al- 1).
Hydrolytic destruction of the pesticide(s) ineffluent B2a.
Biological removal of the causative toxicant inemuent B2a. This perhaps could have beenaccomplished by routing effluent B2a throughthe 20 to 30 day aerated biological treatmenttank (Al).
Other Methods Examined- Inplant controls. Limit the volume of
B2a using recycle procedures.’ discharge of
- Process modifications, Alter rinsing solution andmethod of cleaning so that a more effective rinsewould result, one with less volume of effluent andwith better destruction of residual pesticide(s).
Basis for Selection of Method
Not applicable to this case history.
Follow-Up and Confirmation
Effectiveness of Solution
The final sample from Site No. 1 was collected onJune 2/3, 1986, fractionated into an inorganic andorganic fraction, and the final effluent and eachfraction were evaluated for acute toxicity to D .magna The test results showed that neither the finaleffluent nor the two effluent fraction were acutelytoxic (< 2 TUs) to D. magna with LC50 values > 100percent for all three tests. The two most comparabledata sets were from August 1985 and June 1986when the wastewater treatment plant was properlyoperating. These results showed that acute toxicitypresent in the organic fraction of the August 1985sample had been eliminated resulting in a nontoxicfinal effluent at Site No. 1 in June 1986.
The TRE performed at Site No. 1 succeeded in itsprimary objective in isolating and identifying acausative toxic agent and then determining if thetoxicity of the final effluent was eliminated after theidentified toxic agent was removed. The originalfractionation of the August 1985 final effluent withsubsequent toxicity testing and GC/MS analysis ofthe toxic subfractions showed that dichlorvos, aninvertebrate-specific pesticide, may have beenresponsible for much of the observed toxicity.Independent of this work, the management at SiteNo. 1 permanently closed down the aerosol pesticide-packaging operation and moved it off-site. Afterclosure, the toxicity of the final effluent was then
monitored in the absence of any inputs from thepackaging operation. The biomonitoring resultsshowed that in the five final effluent samplescollected after the closure of the packaging plant, theacute toxicity in the TUs was 167, 1, 1, 6 and 1compared with the 1,111 TUs contained in theAugust 1985 effluent sample.
Final Comments, Recommendations, andConclusionsA TRE was found to be a useful process to isolate,identify, characterize, and reduce or control toxiccomponents in this particular industrial effluent. Thefractionation procedure as designed by Walsh andGarnas (1983) and modified during this study for SiteNo. 1, was useful in the isolation and identification ofthe principal toxic component (dichlorvos) in aspecific organic fraction (i.e., the base/neutralsubfraction). Although variability in toxicity of thefinal effluent at Site No. 1 occurred during the studyperiod, caused, in part, by an improperly operatingwastewater treatment plant, the variability resultedin different effluent components than thoseoriginally identified as being the cause of thetoxicity. In situations where such variability exists,it would be useful to perform additional toxicity testswhen the wastewater treatment plant is operatingproperly to confirm the results and success of theTRE.
Problems EncounteredThe wastewater treatment plant was operatingproperly during the August 1985 and June 1986sampling period, in contrast to the two sampling tripsin January and February 1986 where high bisulfiteconcentrations were present in the effluent samples.The high bisulfite concentration resulted in lowdissolved oxygen in the test solutions which stressedthe test organisms and confounded the interpretationof the test results. The inorganic toxicity observed inFebruary 1986 was not persistent and may have beenrelated to the high bisulfite concentrations present inthe effluent because of the improperly operatingwastewater treatment plant.
ReferencesCooney, S.D., W.H. Clement, and R. Clark. Multi-
Purpose Specialty Chemical Plant ToxicityReduction Evaluation (TRE) Site No.1 .U.S.Environmental Protection Agency, Cincinnati, OHMay 1987.
Peltier, W.H., and C.I. Weber (eds.). Methods forMeasuring the Acute Toxicity of Effluent toFreshwater and Marine Organisms. EPA-600/4-85-013, 3rd ed., U.S. Environmental Protection
A-7
U
U
Agency, Environmental Monitoring and supportLaboratory, Cincinnati, OH (1985).
S. Environmental Protection Agency. Methods forOrganic Analysis of Municipal and IndustrialWastewater. EPA-600/4-82-057, EnvironmentalMonitoring and Support Laboratory, Cincinnati,OH (1982).
S . E n v i r o n m e n t a l P r o t e c t i o n A g e n c y .“Development of Water Quality-Based PermitLimitations for Toxic Pollutants, National Policy.”Federal Register, Vol. 49, No. 48, pp. 9016-9019(1984).
U.S. Environmental Protection Agency. TechnicaLSupport Document for Water Quality-Based ToxicsControl. U.S. Environmental Protection Agency,Offke of Water, Washington, D.C. (1985).
Wall, T.M., and R.W. Hanmer. “Biological Testing toControl Toxic Water Pollutants.” JWPCF, 59( 1):7-12 (1987).
Walsh, C.E., and R.L. Garnas. “Determination ofBioactivity of Chemical Fractions of Liquid WastesUsing Freshwater and Saltwater Algae andCrustaceans.” Environmental Science andTechnology, 17:180-182 (1983).
A-8
Section A-2
Case History: Tosco Corporation’s Avon Refinery, Martinez, California
Initial Data and information Acquisition
At the beginning of the study, facility-specificinformation was obtained regarding the type offacility, regulatory target limits, the design of theexisting wastewater treatment system, and existingchemical and toxicological monitoring data for finaland internal effluent streams. As an introduction tothis case study, the following information is provided.
The Tosco Corporation’s Avon Refinery producesrefined petroleum products, primarily gasoline anddiesel fuel, from domestic crude oils. During the timeEA Engineering, Science, and Technology, Inc.conducted this TRE, the Avon refinery had anaverage crude throughput of 103,100 barrels per dayand generated an average of 3.1 million gallons perday (mgd) of process wastes, cooling tower blowdown,sanitary wastes, stormwater runoff, and other wastesfrom a sulfuric acid plant which is also operated onthe site. These wastewaters were treated by therefinery’s wastewater treatment system and thendischarged into Suisun Bay through a deep-waterdiffuser which provides at least 1O:l nearfielddilution.
When the project was begun, the regulatory target forthe TRE was an end-of-pipe 96-hour LC5o value of250 percent effluent for the three-spine stickleback.In August 1986, this limit became more stringent(96-hour LC5o 2 100 percent effluent).
The refinery’s wastewater collection network isserved by four sewer systems: the oily sewers, thechemical sewers, the sanitary sewers, and the cleansewers. The oily sewer system conveys oily processwaters from all process areas of the refinery to theAPI Separator/Dissolved Air Flotation (DAF) Unit.The DAF Unit discharges to the primary canal. Thechemical sewer system carries foul water stripperbottoms to near the head of the primary canal whereit is joined with the sanitary sewer system and theacidic effluent from the chemical plant. Thiscombined stream is commingled with the effluentfrom the DAF in the primary canal. The effluent fromthe ammonia recovery unit also enters the head of theprimary canal in the same vicinity via a dedicated,
above-ground pipeline. These combined streamsconstitute the feed water for the refinery’swastewater treatment plant.
The wastewater treatment system and its majorinfluent process streams are diagrammed in FigureA2-1. After the two aeration ponds, wastewater ispumped to the 12 RBCs which are situated in fourparallel trains of three units in series. Flow isnormally split equally among all four trains.Chemical feed facilities exist for feeding powderedactivated carbon (PAC) for adsorption of toxicants.Ferric chloride (FeC13) and polymer are injected asflocculent aids to enhance settling in the downstreamclarifiers.
Flow from the RBCs is split and sent to two 75-ft-d iameter c lar i f iers for so l ids removal bysedimentation. Clarified water is sent to amultimedia filter for final removal of colloidal andparticulate matter prior to discharge to the cleancanal. In the clean canal, the treated water joins theeffluent from the clean sewer system for dischargevia a deep-water diffuser.
Toxicity identification Evaluation (TIE)
The TIE for this program consisted of four elements:
- Selection of a cost effective toxicity monitoringtool, and routine screening of the final effluent,
- Chemical fractionation studies to identify classesof toxic constituents in the final effluent,
- Specific chemical analyses to identify specifictoxic elements and/or compounds in the finaleffluent, and
- A source investigation study to identify theultimate source(s) of toxicity within the facility.
Each of these TIE components is discussed below.
Selection of a Monitoring Tool
As a first step, three commonly measured chemicalparameters (i.e., COD, BOD, and TOC) were
A-9
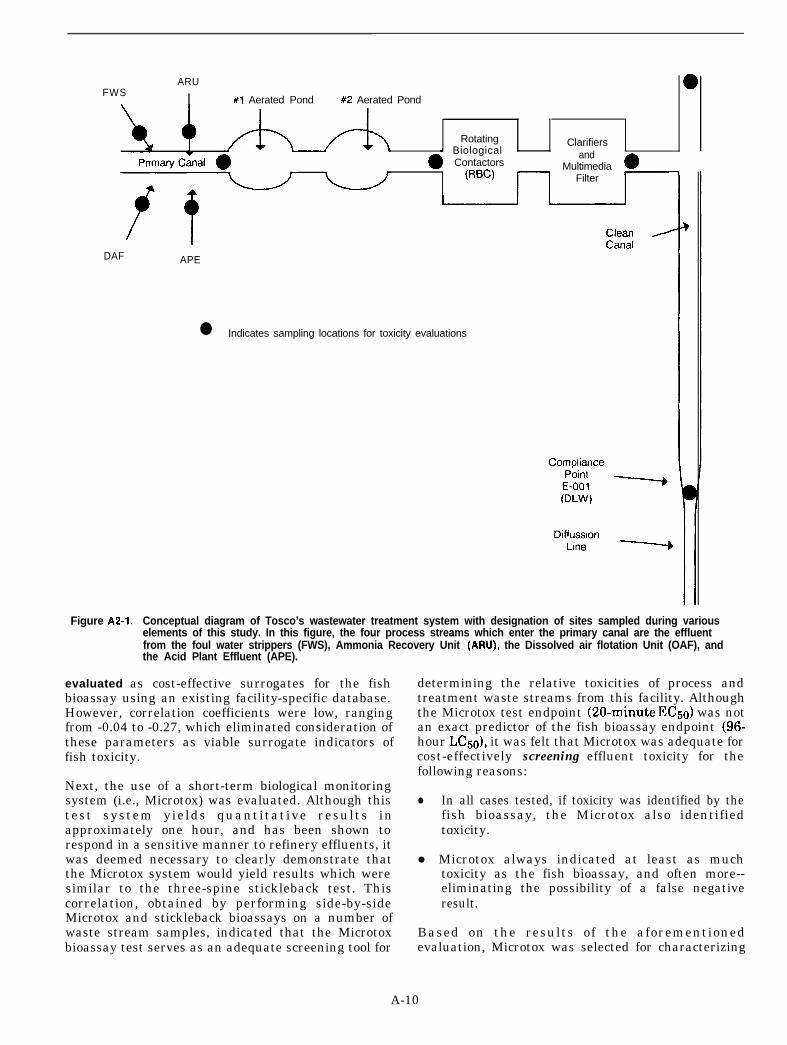
DAFI
APE
FWSARU 0
#l Aerated Pond #2 Aerated Pond
Rotating Clarifiers4 Biological
0 Contactorsand
(RBQMultimedia
l-lFilter
l Indicates sampling locations for toxicity evaluations
Figure A2-1. Conceptual diagram of Tosco’s wastewater treatment system with designation of sites sampled during variouselements of this study. In this figure, the four process streams which enter the primary canal are the effluentfrom the foul water strippers (FWS), Ammonia Recovery Unit (AN), the Dissolved air flotation Unit (OAF), andthe Acid Plant Effluent (APE).
evaluated as cost-effective surrogates for the fishbioassay using an existing facility-specific database.However, correlation coefficients were low, rangingfrom -0.04 to -0.27, which eliminated consideration ofthese parameters as viable surrogate indicators offish toxicity.
Next, the use of a short-term biological monitoringsystem (i.e., Microtox) was evaluated. Although thistest system yields quantitative results inapproximately one hour, and has been shown torespond in a sensitive manner to refinery effluents, itwas deemed necessary to clearly demonstrate thatthe Microtox system would yield results which weresimilar to the three-spine stickleback test. Thiscorrelation, obtained by performing side-by-sideMicrotox and stickleback bioassays on a number ofwaste stream samples, indicated that the Microtoxbioassay test serves as an adequate screening tool for
determining the relative toxicities of process andtreatment waste streams from this facility. Althoughthe Microtox test endpoint (20-minute EC& was notan exact predictor of the fish bioassay endpoint (96-hour LC&, it was felt that Microtox was adequate forcost-effectively screening effluent toxicity for thefollowing reasons:
l In all cases tested, if toxicity was identified by thefish bioassay, the Microtox also identifiedtoxicity.
l Microtox always indicated at least as muchtoxicity as the fish bioassay, and often more--eliminating the possibility of a false negativeresult.
Based on the results of the aforementionedevaluation, Microtox was selected for characterizing
A-10
the magnitude and variability of final effluenttoxicity. This was accomplished by analyzing 24-hourcomposite final effluent samples 34 times over a 4-month period (April-August 1985). A statisticalevaluation of the results indicated a mean toxicity (asa 20-minute Microtox EC5o) of 29.0 percent effluentwith an associated standard deviation of 11.7 percent.During the monitoring period, the maximum andminimum EC50 values were 100 percent and 1.1percent effluent, respectively. These Microtox 20-minute EC50 results can be expressed in terms ofthree-spine stickleback 96”hour LC50 results byusing an adjustment factor that is based on thecorrelation study discussed above. Based on thisrelationship, the Avon Refinery effluent wasestimated to have a mean 96-hour stickleback LC50 of59 percent effluent with a standard deviation of 30percent effluent. This extrapolated toxicity value wassufficient to pass the old effluent toxicity limit (LC5o= 50 percent), but was considerably below therevised limit (LC 50 = 100 percent) which becameapplicable in August 1986.
toxicity, it was sequentially extracted with a mixtureof methylene chloride and water under basic andacidic conditions. The resulting subfractions wereassayed for toxicity via Microtox, indicating whetherneutral, basic, and/or acidic compounds wereresponsible for organic toxicity.
The results of this fractionation effort indicated thatfinal effluent toxicity was almost always (11 out of 12times) attributable to organic constituents. Inaddition, the most toxicologically active organicsappeared to be the neutral and, to a lesser extent, theacidic classes. During this June-August samplingperiod, the refinery and the wastewater treatmentsystem were operating normally and the toxicityobserved was expected to be typical.
Single Chemical Analyses
Chemical Fractionation
In order to provide more information about the finaleffluent, a fractionation procedure (Walsh andGarnas 1983) was implemented in an attempt toidentify the number and types of chemical classesresponsible for final effluent toxicity. In thisprocedure the effluent was separated into organic andinorganic fractions and each tested for toxicity. If theorganic fraction proved toxic, it was furtherseparated into neutral, base, and acid fractions andeach of these was tested for toxicity. If the inorganicfraction proved toxic, it was separated into cationicand anionic fractions and each of these tested fortoxicity.
Two approaches were used in an attempt to identifyspecific chemicals which might be responsible forfinal effluent toxicity. The first was a comparison ofGC/MS results with maximum no-observable effectlevels (NOELs) reported in the toxicologicalliterature. The second was a computerized file ofroutine effluent monitoring data collected over theyears by refinery personnel. These data wereanalyzed for significant positive correlations betweentoxicity and any of the commonly measured chemicalparameters.
A-11
GCIMS Data
The specifics of the fractionation procedure are asfollows. On a weekly basis, from 3 June to 12 August1985, composite samples of final effluent werecollected. Each whole effluent sample was analyzedfor toxicity via Microtox and then 50 ml was passedthrough a lo-ml column packed with 5 ml of XAD-4polystyrene resin. The water elutriate, whichcontained the inorganic chemicals in the wastewatersample, was then analyzed for toxicity via Microtox.The XAD-4 column was then eluted with 10 ml ofacetone. The acetone elutriate, which contained theorganic chemicals in the wastewater sample, wasevaporated to less than 0.5 ml on a hot water bath,resuspended in 50 ml of distilled water, and analyzedfor toxicity via Microtox.
As described above, the fractionation processindicated that final effluent toxicity was routinelyassociated with the organic fraction. Therefore, onthree occasions final effluent samples were analyzedfor volatile and semivolatile organic compoundsusing U.S. EPA Methods 624 and 625. These analyseswere designed to identify all priority pollutants aswell as any major non-priority pollutant organiccompounds which were detected and could beidentified with the data system used for quantitation.
If the inorganic fraction exhibited toxicity, it wasfurther separated using anionic (l-x8) and cationic(5Ow-x8) exchange resins. The resulting subfractionswere assayed for toxicity via Microtox, indicatingwhether anions and/or cations were responsible forinorganic toxicity. If the organic fraction exhibited
Through the three analyses, a number of organiccompounds were identified in the final effluent(EOOl) samples. There was considerable variabilitybetween samples with regard to which compoundswere identified and their concentrations. No organiccompounds were identified in the March sample; 10organic compounds were quantified in the Aprilsample (ranging in concentration from 2 pg/L fort o l u e n e t o 120 pg/L for 2,3,4-trimethyl-3-cyclopenten-l-one); and six organic compounds werequantified in the December sample (ranging from 9pg/L dibenzofuran to 130 pg/L for 2-cyclopenten- l-one, 3 methyl).
A comparison of these concentrations with valuesreported in the toxicological literature failed to
identify any of the detected constituents as theprobable cause of final effluent toxicity. For several ofthese compounds (e.g., most of the ketones), virtuallyno data could be found concerning their aquatictoxicities. For those compounds for which significanttoxicological data do exist (e.g., isophorone, acetone,toluene) the measured concentrations were wellbelow known effect concentrations.
Routine Monitoring Data
Tosco maintains a computerized database of theresults of analyses performed on process andwastewater streams. Included in this database arechemical, physical, and toxicological properties of thefinal effluent. Consequently, it was possible todirectly compare concentrations of several chemicalconstituents found in the final effluent with thecorresponding fish toxicity results and evaluate forpositive correlations. Included in this evaluationwere pH, TSS, phenols, ammonia, oil and grease,chromium, zinc, sulfur, chlorine, DO, temperature,and flow. Review of these results indicated nosignificant correlations between final effluenttoxicity and any of the chemical and physicalparameters considered. Correlation coefficientsranged from -0.31 for TSS to 0.20 for pH.
Source Investigation Study for Toxicity
The source investigation study was designed toidentify the proximal and ultimate source(s) of finaleffluent toxicity. Through a combination of samplingand experimental manipulation, two issues wereaddressed:
1.
2.
A-12
What role does the wastewater treatment systemplay in final effluent toxicity--does it reduce,increase, or alter the toxicity of influent processstreams? and
Which process streams are the ultimate sourcesof final effluent toxicity?
Both issues are discussed below.
Toxicity Reduction Through the ExistingTreatment SystemAt five locations (Figure A2-1) along the treatmentprocess, samples were analyzed for total toxicity,fractionated chemical class toxicity, and specificchemical composition. These results weresynthesized to indicate how well the treatmentsystem functions and how it alters toxic constituentsduring each stage of treatment.
- Ammonia recovery unit effluent (ARU)
- Foul water strippers bottoms (FWS)
- Dissolved air flotation effluent (DAF)
- Acid Plant effluent (APE)
Each process stream was analyzed for whole streamtoxicity, fractionated chemical class toxicity, andindividual chemical composition. Degradationstudies were performed using bench-top models of thetreatment system and evaluating the reduction intoxicity experienced by individual process streams.Synthesis of these two sets of results identified whichprocess streams were the ultimate source of the toxicconstituents which were found in the effluent fromthe wastewater treatment system.
Whole-Effluent Toxicity
The Microtox data indicate that the overall reductionin toxicity from the inlet to the #l aerated pond tothe f ina l e f f luent compl iance po int wasapproximate ly 83 percent . Of th is to ta l ,approximately 90 percent of it occurs in the aeratedponds, 7 percent in the RBCs, and 3 percent in theclean canal (Figure A2-1).
Chemical Class Toxicity
Samples from each of the five sampling points werefractionated to examine the chemical characteristicsof the toxicity. The results indicated that toxicityreduction involved the differential elimination ofvarious classes of toxic constituents. The influent tothe #l aerated pond was quite toxic, with inorganicconstituents making the greatest constitution. Thegenerally lower toxicity of the organic fraction wasapparently due about equally to neutral and acidiccompounds.
After passing through the aerated ponds, theapproximately 75 percent reduction in toxicity wasgenerally associated with the total loss of the toxicinorganic fraction and a moderate decrease inorganic toxicity. Transit through the RBCs and downthe clean canal resulted in minimal toxicityreduction due to the removal of some organicconstituents (principally acidic compounds).
Process Stream Evaluation
By monitoring the toxicity of major process streamsinfluent to the treatment system and experimentallydetermining the degradability of each processstream’s toxicity, the ultimate sources of toxicitywere investigated. The following four major processstreams are influent to the wastewater treatmentsystem:
A-13
Acute Toxicity MonitoringFrom the resulting data, it was apparent that thewastewater from the ammonia recovery unit (ARU)and foul water strippers (FWS) were the most toxic(172 and 83 acute toxicity units (TUs), respectively).These streams make up approximately 14 and 24percent, respectively, of the total wastewater flowentering the #l aerated pond. On the other hand, theeffluent from the dissolved air flotation unit (8.8TUs) which contributes 62 percent of the total flow,was considerably less toxic. The acid plant effluentwas nontoxic.
Chemical Class Toxicity
By fractionating 24-hour composite samples, it wasdetermined that the toxicity in both the ARU andFWS wastewaters was due to a combination oforganic and inorganic constituents. In addition, therelative contribution made by each group was highlyvariable. When inorganic toxicity was present, it wasprimarily anionic in nature and organic toxicity wasdue to a mixture of neutral and acidic compounds.The toxicity in the DAF wastewater, on the otherhand, had no inorganic component and was duealmost exclusively to neutral and acidic organiccompounds.
Specific chemical analyses of the process streamswere limited to the identification of toxic organicconstituents. In general, the data were fairlyconsistent with the fractionation results. The DAFeffluent contains mostly neutral organics, someacidics, and no basic compounds. The FWS emuentshowed a somewhat different pattern with muchhigher concentrations of acidic organics, considerablylower concentrations of neutrals, and again no basics.The ARU, on the other hand, was much differentfrom either of the other two processes streams in thathigh concentrations of phenols were found along withsubstantial concentrations of amines. Neutralorganics were not prevalent in the ARU effluent.
Biodegradability of Process Stream ToxicityThis study element was designed to address the issueof the degradability of the toxicity of each processstream as it passes through the treatment system.Due to operational constraints, this issue could not beevaluated directly because the system could not bemanipulated to receive only one process stream at atime. Therefore, it was necessary to use bench-topmodels (i.e., microcosms) as surrogates for thetreatment system and predict actual process streamdegradability from the model results.
The results of the microcosm degradability testsindicated that the toxicity in the three major processstreams was readily (and approximately equally)
degradable. There was some loss of biodegradabilitywhen high (~50 percent) concentrations of aparticular process stream were used. However, exceptfor the DAF, this was of no concern since theseelevated concentrations did not occur in thewastewater treatment system.
Toxicity Reduction Approaches
The results of the final effluents and process streamcharacterization indicated that neutral organicchemicals were the primary cause of toxicity and thattheir ultimate source(s) were probably thewastewaters produced in the ammonia recovery unit(ARU) and foul water strippers (FWS). Therefore,various treatment options were considered whichmight be successful at removing neutral organicsfrom either the final effluent or the ARU and FWSprocess streams. To date, this study at the AvonRefinery has only partially gone through the toxicityreduction feasibility phase. Several treatmentoptions are currently under consideration by ToscoCorporation. Included among these are the use ofactivated carbon and increased residence time insurface impoundments. In-depth evaluations areplanned for all promising options to assess theirchances for success from the technical, economic, andregulatory perspectives. Tosco Corporation is still inthe early phases of these evaluations and the data areinsufficient to allow selection of a final treatmentoption.
Bench-top feasibility-level studies were performed toascertain whether one option, activated carbon, couldreduce toxicity in the final effluent and the ARUprocess stream to levels which would ensurecompliance with the mandated effluent toxicity limit.This was accomplished by the performance of batchexperiments using seven different brands ofactivated carbon and analyzing the treated effluentsvia Microtox.
The results obtained from these batch equilibriumstudies indicated that all six carbons tested couldeffectively treat the final effluent to the acute toxicitycriterion level. However, the concentration of carbonrequired varied considerably between brands(between 100 and 700 ppm).
Similarly, all seven carbons tested could effectivelytreat the ARU process stream such that the finaleffluent will be in compliance. As before, theconcentration of carbon required to meet thiscriterion varied considerably between brands(between 1,000 and 2,000 ppm). Based on theexperiences gained during this project, the followinginsights concerning the evaluation of treatmentoptions are made:
1. Technical feasibility can be screened at the benchscale level, but can only be verified through pilot
through pilot scale plants operating under actualfield conditions.
2. Economic evaluations must consider both thecapital and operating costs of the project, withspecial emphasis on future trends in theavailability and cost of disposal for any wastegenerated.
3. The evaluation of a treatment option mustconsider its capacity to cost-effectively meetpotentially more stringent regulations.
4. Caution must be exercised when solving a waterquality toxicity problem by transferring it toanother medium (e.g., solid waste as withcarbon). Environmental concerns are likely todiminish or eliminate the attractiveness of such asolution over time.
These items are not intended as a definitive list ofconcerns which must be addressed in evaluatingtreatment options. However, they should provide astarting point for the design of the evaluationprogram.
Follow-Up and ConfirmationAs stated above, a final toxicity reduction solutionhas not been selected although preliminary benchscale testing has indicated that activated carbon willreduce final eMuent toxicity to acceptable levels.
Problems EncounteredDuring this study, a number of methods andtechniques were used in the course of identifying thecauses and sources of toxicity. Some of these (e.g., theuse of microcosms in degradation studies) wereprimarily research tools adapted to a real worldsituation. These did not have standard protocols andrequired some innovation in their design andinterpretation. Planned process unit turnarounds,and unplanned upsets occurred occasionally,resulting in abnormal effluent quality. These eventsprovided insight into possible effluent variability,but at the same time made performance of plannedevaluations difficult.
References&A Engineering, Science, and Technology, Inc.
Tolcicity Reduction. Eualuatiott at the ToscoCorporation Avon Refinery, Martinez, California.Summary prepared for U.S. EnvironmentalProtection Agency Office of Water Enforcementand Permits, Washington (1987).
Fluor Daniels and EA Engineering, Science, andTechnology, Inc. Tosco Avon Refinery - WastewaterTreating Studies. Prepared for Tosco Corporation,Martinez, California (1987).
Walsh, G.E., and R.L Garnas. “Determination ofBioavailability of Chemical Fractions of LiquidWastes Using Freshwater and Saltwater Algaeand Crustaceans.” Environ. Sci. Technol., 17:180-182 (1983).
A-14
Section A-3
Case History: Martinez Manufacturing Complex, Shell Oil Company
mroduction
The California Regional Water Quality ControlBoard (CRWQCB) regulates the quality of effluentdischarged from Shell Oil Company’s refinery inMartinez, California, via an NPDES permit. Sincethe early 1970’s the facility’s whole effluent acutetoxicity limit has become more stringent, increasingfrom a static acute LC5o value of > 40 percenteffluent, to a newly revised limit (effective 20 August1986) which required LC5o values > 100 percenteffluent based on flow-through acute testing usingthe three-spine stickleback (Gasterosteius aculeatus).
In the early 197Os, extensive chemical andtoxicological research was conducted by Shell toinvestigate the facility’s effluent. Supplementalstudies (conducted in 1976 and 1980) (Hanson 1976,1980) examined the causes of the observed wholeeffluent toxicity. Constituents implicated in thesestudies included oil and grease, polymers andammonia.
The information presented in this case study is theresult of the above requirement and is derived fromseveral research efforts conducted from 1976 to 1985.These studies resulted in specific recommendationsfor the plant which included improved treatmentsystem operation, changes in the polymer addition,and more aggressive in-plant source controls.
Initial Data and Information Acquisition
Plant DescriptionShell Oil Company’s Martinez ManufacturingComplex (MMC) produces refined petroleumproducts, primarily gasoline, diesel fuel, lube oils,and greases. As with many large industrialcomplexes, plant operations may vary over time.Process wastes are treated in a central wastewatertreatment facility which includes oil/waterseparation, biological oxidation, secondaryclarification, and tertiary filtration. MMC dischargesthrough a single deep water diffuser into anestuarine environment at a rate of approximately 4million gallons per day (MGD).
Toxicity Identification Evaluation (TIE)
Characterization and Fractionation
To meet anticipated toxicity limits, a program wasinitiated to investigate the toxicants present in thefinal effluent. Based on plant operations experience,ammonia and oil and grease were among thepotential candidates. Therefore, an investigativeprocedure was developed to determine if these (orother chemicals) were the primary toxic agents.
In 1976, effluent was obtained from a point just priorto discharge for use in the analyses. Thefractionation/characterization procedure involvedfreon extraction of acidified wastewater to remove oiland grease, followed by nitrogen stripping at alkalinepH to remove ammonia. Oil and grease and ammoniawere also added back to the “stripped” sample todetermine if these components were the only toxicagents removed during the extraction and strippingprocedures.
Toxicity tests and chemical analysis for a specificgroup of parameters were conducted on the completeeffluent and at each stage of the extraction process.However, after collecting and analyzing foursamples, the unadulterated whole effluentapparently became (acutely) nontoxic and the testingprogram was suspended. Analysis of the collecteddata revealed some information. The toxicity of theeffluent decreased after the removal of the oil andgrease fraction and toxicity increased after the oiland grease was added back in. However, there werenot enough data to make a precise estimation of thetoxicity of the oil and grease fraction. Analysis of theoil and grease extract using infrared and ultravioletabsorbance procedures indicated the presence ofnaphthenic acid compounds with minor amounts ofamines and aromatic hydrocarbons. The simplestnaphthenic acid (cyclohexane carboxylic acid) is alsoreported to be toxic at concentrations of 5-7 mg/L,levels approaching those observed in the wastewater.The major source of naphthenic acids in MMCwastewater was identified as the wash water usedduring crude oil desalting. Naphthenic acid was
A-15
shown to be most toxic at low pH (Shell Oil Company1986).
Ammonia levels were consistently low because ofnitrification in the biological treatment systemduring the earlier studies, and this was believed to beone of the major reasons why the effluent remainedessentially non-acutely toxic.
Recognizing that the acute toxicity of the wastedischarge had for all practical purposes disappeared,a program was initiated to investigate what causedthe disappearance. Daily toxicity tests were begun onfinal effluent, and various refinery processes and in-plant waste streams were monitored to identifyrelationships between toxicity and potential sourcesof toxic wastes whenever the waste stream exhibitedacute toxicity. In addition to daily acute toxicitytests, various waste streams were monitored forammonia, nitrate and nitrite nitrogen, organicnitrogen, TSS, oil and grease, COD, and TOC.
Of the 37 different manufacturing processes, thereappeared to be a strong cause/effect relationshipbetween the chemical manufacturing process whichproduces diallylamine (DAAM plant), concentrationsof ammonia in the effluent, and effluent toxicity.Amine compounds identified in the effluent wereethylenediamine, monoallylamine, diallylamine,triallylamine, dimethylaminopropylamine, andpolyethyleneimine, a polymer used during theflocculation phase of waste treatment. It was notclear how amines reacted during effluent treatmentto cause toxicity and there is some evidence that: (1)amines may be converted to ammonia duringbiotreatment; (2) some amines may pass throughbiotreatment at high concentrations which may betoxic; and (3) amines may inhibit nitrification ofammonia. All three methods of actions are possibledepending on circumstances.
A third study (Shell Oil Company 1986) wasconducted in 1984 and 1985 to identify the sources oftoxicity in the biotreater effluent. Through thereview of the above studies, naphthenic acids,ammonia, vanadium, and a polyethyleneiminepolymer used for coagulation in the secondarydissolved air flotation clarifier were selected as themost significant contributors to effluent toxicity forwhich dose-response data should be developed.Although earlier studies identified organic nitrogencompounds (amines) as potential sources of toxicity,control measures implemented between 1976 and1979 sufficiently reduced concentrations of amines inthe final effluent.
The objective of this study was to determine a dose-response relationship for each constituent in theeffluent. Toxicity tests were performed using non-
A-16
acutely toxic biotreater effluent and spiking with thecomponent of interest.
For oil and grease, the residue was toxic to fish whenadded to a non-toxic effluent at a concentration of 12to 25 mg/L. Because the oil and grease fraction wasobserved to consist primarily of naphthenic acids,toxicity tests were also performed using refinednaphthenic acid and showed a 96-hour LC5o in therange of 5 mg/L which is consistent with publisheddata. However, it is difficult to relate the toxicity ofnaphthenic acids to oil and grease because of thecomplex nature of oil and grease.
The acute threshold effect concentration(concentration in the effluent which results in anLC5o < 100% effluent) for ammonia in the MartinezRefinery biotreater effluent was between 0.9 and 1.0mg-N/L un-ionized ammonia. Within the pH range ofthe biotreater effluent, the acutely toxic thresholdconcentration was expected to be above 20 mg/L astotal ammonia nitrogen.
Although vanadium produced toxicity in the effluentin the 6 to 16 mg/L range, concentrations ofapproximately 5 mg/L were designated asconcentrations of concern.
For polymer toxicity, the bioassay was not as simple.Because the concentration of the polymeric flocculentin the effluent is a function of its adsorption behavioron activated sludge, toxicity tests to determine thetoxicity of free polymer were conducted withsynthetic seawater. The resulting 96-hour LC50 forpolyethyleneimine (PEI) and DMAEM/AM weredetermined to be in the range of 5-15 mg/L and 30-50mg/L, respectively. Because these concentrationsrepresent free flocculent in solution and not applieddosage during waste treatment, adsorption isothermswere developed for biomass generated in theactivated sludge pilot units treating the MMCwastewater. Both the PEI and the DMAEM/AMpolymers were used as adsorbates. Isotherms weredetermined by adding known amounts of flocculent to1-L samples of biomass, mixing, settling the biomass,and analyzing the supernatant for residual flocculentconcentration. The amount of flocculent adsorbed tothe biomass was calculated by performing a materialbalance on the liquid phase. This allowed for theestimation of flocculent in solution given a specificamount of biomass in the wastewater flow, flocculentdosage rate, and the adsorptive capacity of the givenflocculent (either PEI or DMAEM/AM).
This study showed that not only did free PEI causetoxicity to fish, but it also inhibited both thebiodegradation of oil and grease (specificallynaphthenic acids) and the nitrification process whichfurther contributed to toxicity because of the
resulting high residual effluent concentrations of contaminants of concern. Toxicity reductionnaphthenic acid and ammonia. approaches for each of these contaminants are
discussed below.
Confirmation of Toxic AgentsOnce potential toxic agents were identified, their Oil and Grease
toxicity in the emuent had to be confirmed. This was The major source of naphthenic acids (oil and grease)done using several methods. Through fractionation in MMC effluent was identified as wash water fromprocedures described above, the toxicity of the the crude oil desalter and the toxicity from thiseffluent was shown to decrease once the oil and source was attributed to partitioning of water solublegrease fraction had been removed. Furthermore, the naphthenic acids from the crude oil into the waterindividual addition of oil and grease, ammonia, phase . A Br ine Deoi l ing Unit (BDU) wasvanadium, and amines to a nontoxic effluent subsequently installed to reduce the concentration ofincreased the toxicity of that effluent to that expected naphthenic acids discharged to the aqueous effluentin a similar toxic effluent. treatment facilities. Since the naphthenic acids are
water soluble, they still partition into the waterIn order to quantify the extent to which each toxicant phase to some degree and subsequently continue to becontributed to the total toxicity, weekly acute toxicity present in the aqueous effluent.tests were conducted for approximately one yearusing three-spined stickleback fish. In addition to the Bench scale tests indicated that powdered activatedtoxicity test, each sample was analyzed for an carbon (PACT) addition to activated sludge canextensive list of potential pollutants. For each of reduce effluent toxicity (Shell Oil Company 1986). Inthese pollutants, their toxicity was determined subsequent pilot scale slip-stream studies onsite, 50through a literature search. Because the fractional mg/L (basis feed flow) of powdered activated carbonacute toxicities of waste constituents are generally completely removed acute toxicity to sticklebackadditive, it was hypothesized that overall toxieity after addition of 20 mg/L naphthenic acid to theshould be equal to the sum of each individual biotreater feed. In contrast, a conventional biotreaterconstituent’s toxicity. This is mathematically fed the same spiked feed yielded an effluent with anexpressed as TCt = CJTL50a + Cb/TL5Ob - - - L& of about 60 percent. Emergency PACT additionCJrL50, to the MMC biotreater for toxicity reduction
following upsets or spills may be possible. Potentialwhere adverse effects or PACT (clarification, corrosion,
equipment wear) should be considered before fullTCt = total effluent toxicity in toxic units scale use is implemented. However, recent biotreater
operating performance shows that when the proposedC,...n = concentration of each individual waste 10 mg/L oil and grease NPDES limitation is met, the
constituent concentration of oil and grease (i.e., naphthenicacids) is kept below the effect concentration and a
TL50,-n = concentration of waste constituent nontoxic effluent is produced.which causes 50 percent mortality
Using this equation, a multiple linear regression Ammonia
eauation was derived and the statistical significance The most effective method of controlling effluentofleach constituent in reference to the overall toxicity ammonia levels is to sustain nitrification in thecould be determined. A correlation coefficient (R‘J) of activated sludge basin. Since February 1985, the0,59 was derived. The regression explains Martinez refinery biotreater has sustainedapproximately 62 percent of the toxicity. Based on nitrification, thereby reducing the effluent totalthis additive approach, significant contributors of ammonia concentration to less than 1 mg-N/L. Propertoxicity were identified as ammonia (18 percent), control of sludge age, pH, and inhibitory spills (i.e.,naphthenic acids (32 percent), and suspended solids source control) in addition to avoiding inhibitory(12 percent). The balance of 38 percent unexplained additives such as the polyethyleneimine type watertoxicity was attributed to the variability of the clarification polymers should allow for continuedtoxicity tests or the polymer, PEI, which was later nitrification and eliminate ammonia as a contributoridentified. to fish toxicity.
Toxicity Reduction Approaches Amines (Organic Nitrogen)
At this point, oil and grease (naphthenic acids), Ethylenediamine is produced as a waste gas in one ofammonia, amines (organic nitrogen), flocculation the chemical manufacturing processes. Prior to Maypolymers (PEI), and suspended solids had been 1976, this gas was discharged in series through aidentified in at least one of the studies performed as water scrubber and an incinerator, and the alkaline
A-17
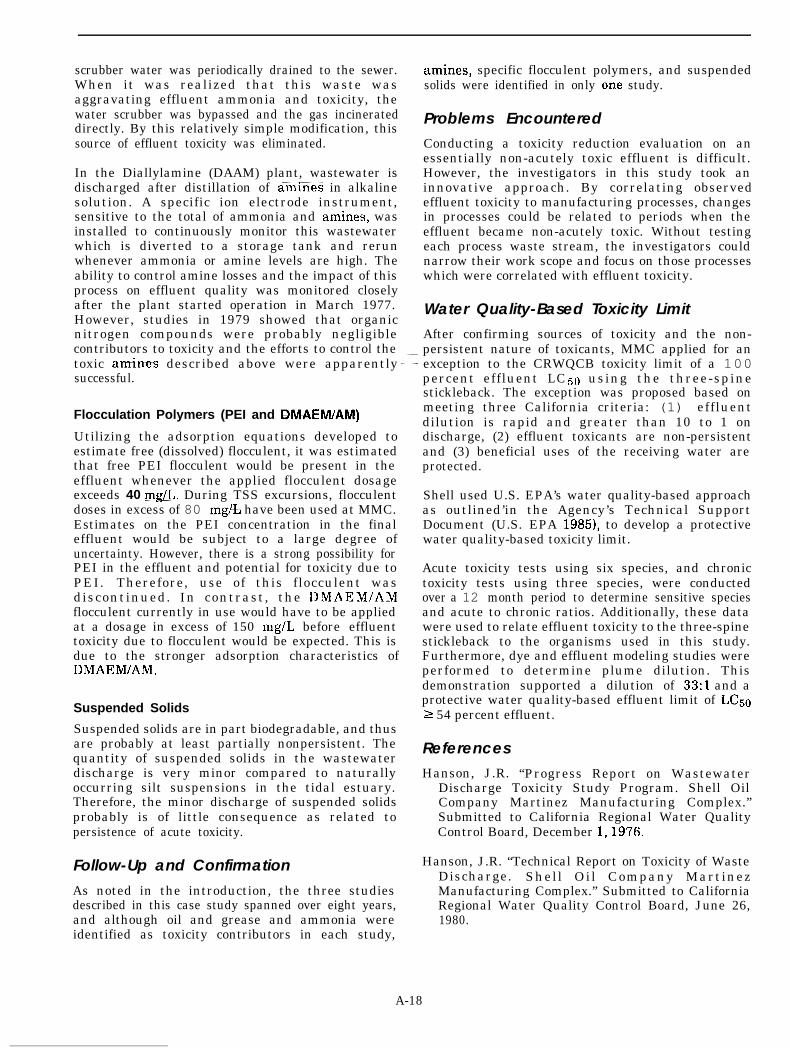
scrubber water was periodically drained to the sewer.When it was realized that this waste wasaggravating effluent ammonia and toxicity, thewater scrubber was bypassed and the gas incinerateddirectly. By this relatively simple modification, thissource of effluent toxicity was eliminated.
In the Diallylamine (DAAM) plant, wastewater isdischarged after distillation of amines in alkalinesolution. A specific ion electrode instrument,sensitive to the total of ammonia and amines, wasinstalled to continuously monitor this wastewaterwhich is diverted to a storage tank and rerunwhenever ammonia or amine levels are high. Theability to control amine losses and the impact of thisprocess on effluent quality was monitored closelyafter the plant started operation in March 1977.However, studies in 1979 showed that organicnitrogen compounds were probably negligiblecontributors to toxicity and the efforts to control thetoxic amines described above were apparentlysuccessful.
Flocculation Polymers (PEI and DMAEM/AM)
Utilizing the adsorption equations developed toestimate free (dissolved) flocculent, it was estimatedthat free PEI flocculent would be present in theeffluent whenever the applied flocculent dosageexceeds 40 mg/L. During TSS excursions, flocculentdoses in excess of 80 mg/L have been used at MMC.Estimates on the PEI concentration in the finaleffluent would be subject to a large degree ofuncertainty. However, there is a strong possibility forPEI in the effluent and potential for toxicity due toPEI. Therefore, use of this flocculent wasdiscontinued. In contrast, the DMAEM/AMflocculent currently in use would have to be appliedat a dosage in excess of 150 mg/L before effluenttoxicity due to flocculent would be expected. This isdue to the stronger adsorption characteristics ofDMAEMIAM.
Suspended Solids
Suspended solids are in part biodegradable, and thusare probably at least partially nonpersistent. Thequantity of suspended solids in the wastewaterdischarge is very minor compared to naturallyoccurring silt suspensions in the tidal estuary.Therefore, the minor discharge of suspended solidsprobably is of little consequence as related topersistence of acute toxicity.
Follow-Up and Confirmation
As noted in the introduction, the three studiesdescribed in this case study spanned over eight years,and although oil and grease and ammonia wereidentified as toxicity contributors in each study,
amines, specific flocculent polymers, and suspendedsolids were identified in only on.e study.
Problems Encountered
Conducting a toxicity reduction evaluation on anessentially non-acutely toxic effluent is difficult.However, the investigators in this study took aninnovative approach. By correlating observedeffluent toxicity to manufacturing processes, changesin processes could be related to periods when theeffluent became non-acutely toxic. Without testingeach process waste stream, the investigators couldnarrow their work scope and focus on those processeswhich were correlated with effluent toxicity.
Water Quality-Based Toxicity Limit
After confirming sources of toxicity and the non-persistent nature of toxicants, MMC applied for anexception to the CRWQCB toxicity limit of a 100percent effluent LC 50 using the three-spinestickleback. The exception was proposed based onmeeting three California criteria: (1) effluentdilution is rapid and greater than 10 to 1 ondischarge, (2) effluent toxicants are non-persistentand (3) beneficial uses of the receiving water areprotected.
Shell used U.S. EPA’s water quality-based approachas outlined’in the Agency’s Technical SupportDocument (U.S. EPA 1985), to develop a protectivewater quality-based toxicity limit.
Acute toxicity tests using six species, and chronictoxicity tests using three species, were conductedover a 12 month period to determine sensitive speciesand acute to chronic ratios. Additionally, these datawere used to relate effluent toxicity to the three-spinestickleback to the organisms used in this study.Furthermore, dye and effluent modeling studies wereperformed to determine plume dilution. Thisdemonstration supported a dilution of 33:l and aprotective water quality-based effluent limit of LCso2 54 percent effluent.
References
Hanson, J.R. “Progress Report on WastewaterDischarge Toxicity Study Program. Shell OilCompany Martinez Manufacturing Complex.”Submitted to California Regional Water QualityControl Board, December 1,1976.
Hanson, J.R. “Technical Report on Toxicity of WasteDischarge. Shell Oil Company MartinezManufacturing Complex.” Submitted to CaliforniaRegional Water Quality Control Board, June 26,1980.
A-18

Shell Oil Company. “Derivation of Water Quality-Based Toxicity Effluent Limits for the Shell OilMartinez Manufacturing Complex.” Prepared byEA Engineering, Science and Technology, Inc.Lafayette, California. (1986). 48 pp.
Control. EPA 440/4-85-032 Office of Water,Washington, D.C. (1985).
vanCompernolle, R, et al. Potential Contributors toU.S. Environmental Protection Agency. Technical Fish Toxicity in the Martinez Manufacturing
Support Document for Water Quality-Based Toxics Complex Biotreater Effluent. August 9,1985.
A-19
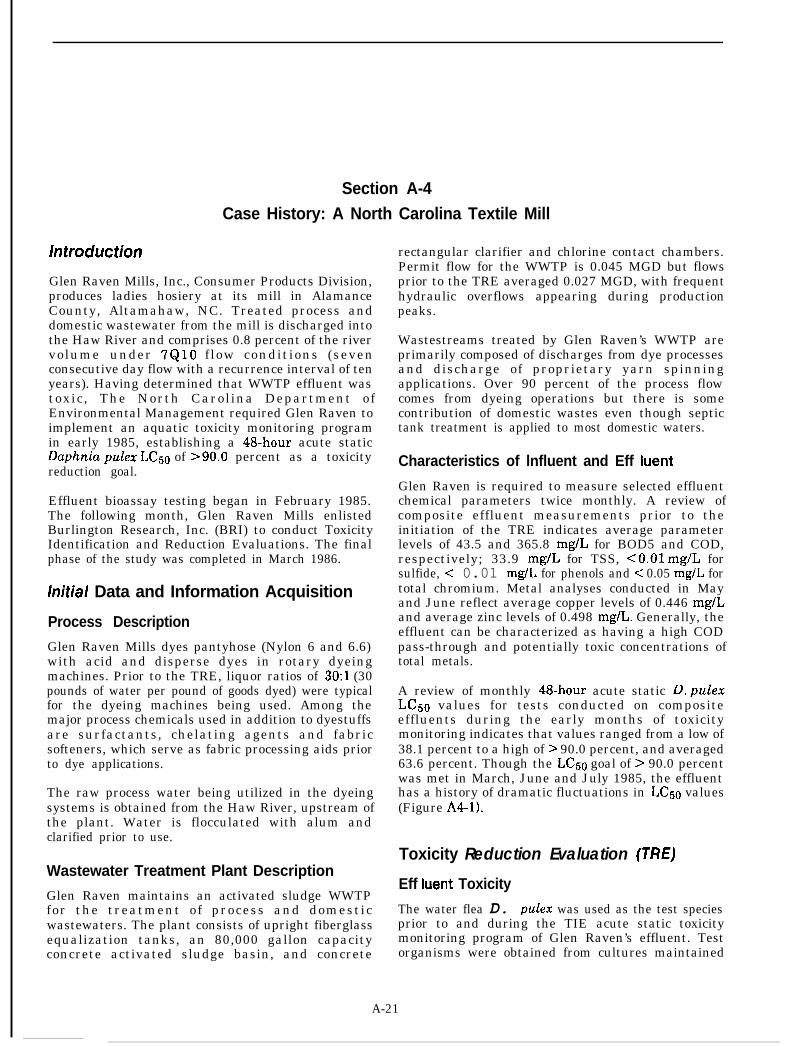
Section A-4Case History: A North Carolina Textile Mill
intfoduction
Glen Raven Mills, Inc., Consumer Products Division,produces ladies hosiery at its mill in AlamanceCounty, Altamahaw, NC. Treated process anddomestic wastewater from the mill is discharged intothe Haw River and comprises 0.8 percent of the rivervolume under 7QlO f low conditions (sevenconsecutive day flow with a recurrence interval of tenyears). Having determined that WWTP effluent wastoxic, The North Carolina Department ofEnvironmental Management required Glen Raven toimplement an aquatic toxicity monitoring programin early 1985, establishing a 48hour acute staticDuphnia pulex LQjo of >90.0 percent as a toxicityreduction goal.
Effluent bioassay testing began in February 1985.The following month, Glen Raven Mills enlistedBurlington Research, Inc. (BRI) to conduct ToxicityIdentification and Reduction Evaluations. The finalphase of the study was completed in March 1986.
lnitiai Data and Information Acquisition
Process Description
Glen Raven Mills dyes pantyhose (Nylon 6 and 6.6)with acid and disperse dyes in rotary dyeingmachines. Prior to the TRE, liquor ratios of 3O:l (30pounds of water per pound of goods dyed) were typicalfor the dyeing machines being used. Among themajor process chemicals used in addition to dyestuffsare surfactants, chelating agents and fabricsofteners, which serve as fabric processing aids priorto dye applications.
The raw process water being utilized in the dyeingsystems is obtained from the Haw River, upstream ofthe plant. Water is flocculated with alum andclarified prior to use.
Wastewater Treatment Plant Description
Glen Raven maintains an activated sludge WWTPfor the treatment of process and domesticwastewaters. The plant consists of upright fiberglassequalization tanks, an 80,000 gallon capacityconcrete activated sludge basin, and concrete
rectangular clarifier and chlorine contact chambers.Permit flow for the WWTP is 0.045 MGD but flowsprior to the TRE averaged 0.027 MGD, with frequenthydraulic overflows appearing during productionpeaks.
Wastestreams treated by Glen Raven’s WWTP areprimarily composed of discharges from dye processesand discharge of proprietary yarn spinningapplications. Over 90 percent of the process flowcomes from dyeing operations but there is somecontribution of domestic wastes even though septictank treatment is applied to most domestic waters.
Characteristics of lnfluent and Eff bent
Glen Raven is required to measure selected effluentchemical parameters twice monthly. A review ofcomposite effluent measurements prior to theinitiation of the TRE indicates average parameterlevels of 43.5 and 365.8 mg/L for BOD5 and COD,respectively; 33.9 mg/L for TSS, CO.01 mg/L forsulfide, < 0.01 mg/L for phenols and c 0.05 mg/L fortotal chromium. Metal analyses conducted in Mayand June reflect average copper levels of 0.446 mg/Land average zinc levels of 0.498 mg/L. Generally, theeffluent can be characterized as having a high CODpass-through and potentially toxic concentrations oftotal metals.
A review of monthly 48-hour acute static D. pulexLC5o values for tests conducted on compositeeffluents during the early months of toxicitymonitoring indicates that values ranged from a low of38.1 percent to a high of > 90.0 percent, and averaged63.6 percent. Though the L&o goal of > 90.0 percentwas met in March, June and July 1985, the effluenthas a history of dramatic fluctuations in LC50 values(Figure A4-1).
Toxicity Reduction Evaluation (TREJ
Eff bent Toxicity
The water flea D. pdex was used as the test speciesprior to and during the TIE acute static toxicitymonitoring program of Glen Raven’s effluent. Testorganisms were obtained from cultures maintained
A-21
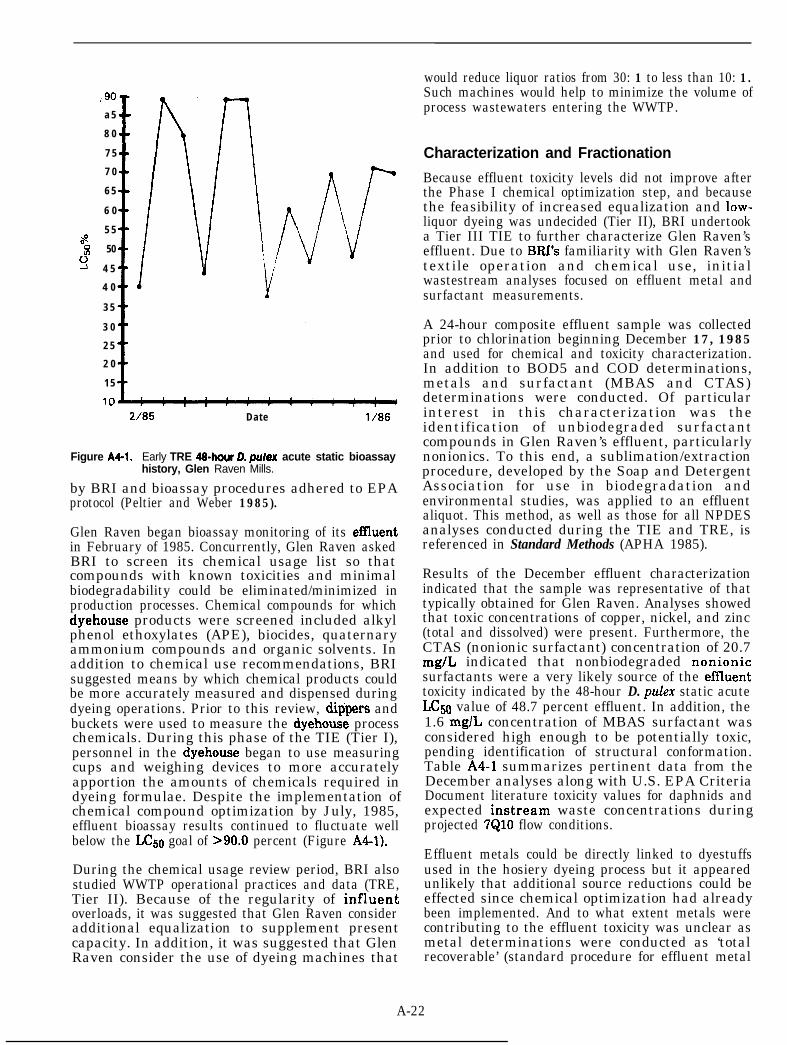
,. 90
a 5
8 0
7 5
7 0
6 5
6 0
5 585: 50
2 4 5
4 0I
3 5
3 0
2 5
2 0
1 5
. .2;85
,, (, . . . . I, ,-
Date l/86
Figure A4-1. Early TRE 48-hour 0. pulex acute static bioassayhistory, Glen Raven Mills.
by BRI and bioassay procedures adhered to EPAprotocol (Peltier and Weber 1985).
Glen Raven began bioassay monitoring of its emuentin February of 1985. Concurrently, Glen Raven askedBRI to screen its chemical usage list so thatcompounds with known toxicities and minimalbiodegradability could be eliminated/minimized inproduction processes. Chemical compounds for whichdyehouse products were screened included alkylphenol ethoxylates (APE), biocides, quaternaryammonium compounds and organic solvents. Inaddition to chemical use recommendations, BRIsuggested means by which chemical products couldbe more accurately measured and dispensed duringdyeing operations. Prior to this review, dip@rs andbuckets were used to measure the dyehouse processchemicals. During this phase of the TIE (Tier I),personnel in the dyehouse began to use measuringcups and weighing devices to more accuratelyapportion the amounts of chemicals required indyeing formulae. Despite the implementation ofchemical compound optimization by July, 1985,effluent bioassay results continued to fluctuate wellbelow the LC50 goal of B90.0 percent (Figure A4-1).
During the chemical usage review period, BRI alsostudied WWTP operational practices and data (TRE,Tier II). Because of the regularity of influentoverloads, it was suggested that Glen Raven consideradditional equalization to supplement presentcapacity. In addition, it was suggested that GlenRaven consider the use of dyeing machines that
A-22
would reduce liquor ratios from 30: 1 to less than 10: 1.Such machines would help to minimize the volume ofprocess wastewaters entering the WWTP.
Characterization and Fractionation
Because effluent toxicity levels did not improve afterthe Phase I chemical optimization step, and becausethe feasibility of increased equalization and low-liquor dyeing was undecided (Tier II), BRI undertooka Tier III TIE to further characterize Glen Raven’seffluent. Due to BRI’s familiarity with Glen Raven’stextile operation and chemical use, initialwastestream analyses focused on effluent metal andsurfactant measurements.
A 24-hour composite effluent sample was collectedprior to chlorination beginning December 17, 1985and used for chemical and toxicity characterization.In addition to BOD5 and COD determinations,metals and surfactant (MBAS and CTAS)determinations were conducted. Of particularinterest in this characterization was theidentification of unbiodegraded surfactantcompounds in Glen Raven’s effluent, particularlynonionics. To this end, a sublimation/extractionprocedure, developed by the Soap and DetergentAssociation for use in biodegradation andenvironmental studies, was applied to an effluentaliquot. This method, as well as those for all NPDESanalyses conducted during the TIE and TRE, isreferenced in Standard Methods (APHA 1985).
Results of the December effluent characterizationindicated that the sample was representative of thattypically obtained for Glen Raven. Analyses showedthat toxic concentrations of copper, nickel, and zinc(total and dissolved) were present. Furthermore, theCTAS (nonionic surfactant) concentration of 20.7mg/L indicated that nonbiodegraded nonionicsurfactants were a very likely source of the eftluenttoxicity indicated by the 48-hour D. pulex static acuteL&O value of 48.7 percent effluent. In addition, the1.6 mglL concentration of MBAS surfactant wasconsidered high enough to be potentially toxic,pending identification of structural conformation.Table A4-1 summarizes pertinent data from theDecember analyses along with U.S. EPA CriteriaDocument literature toxicity values for daphnids andexpected instream waste concentrations duringprojected 7610 flow conditions.
Effluent metals could be directly linked to dyestuffsused in the hosiery dyeing process but it appearedunlikely that additional source reductions could beeffected since chemical optimization had alreadybeen implemented. And to what extent metals werecontributing to the effluent toxicity was unclear asmetal determinations were conducted as ‘totalrecoverable’ (standard procedure for effluent metal
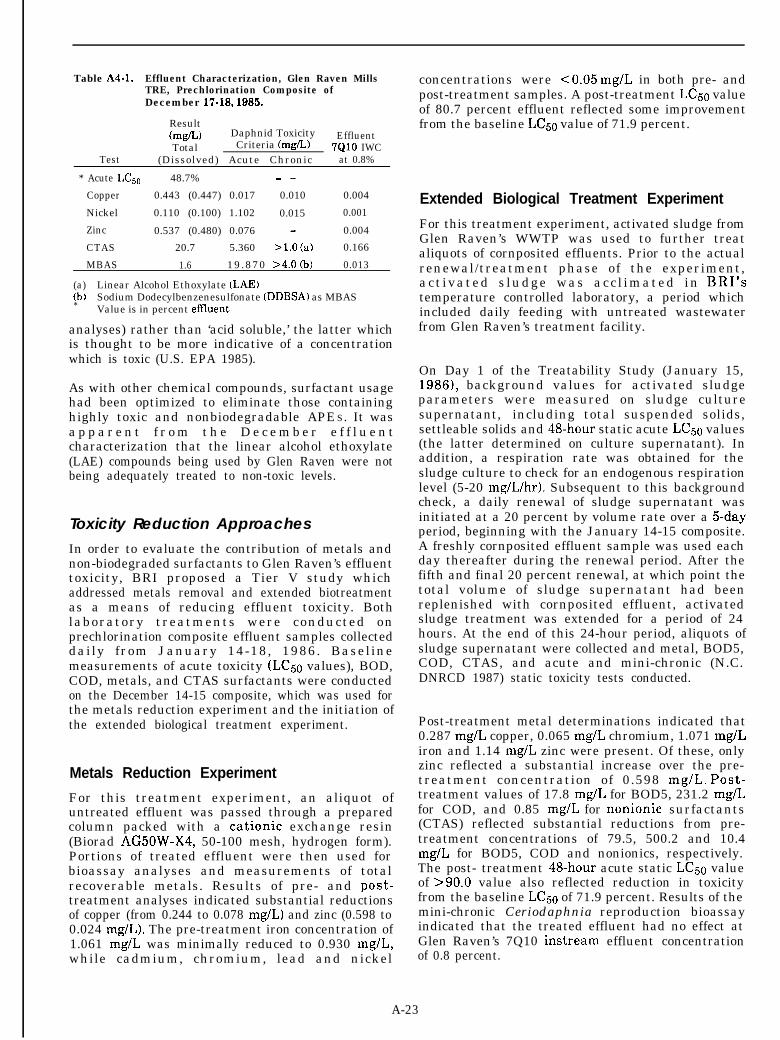
Table A4-1. Effluent Characterization, Glen Raven MillsTRE, Prechlorination Composite ofDecember 17-18,19&X
Result(mgfLJ Daphnid Toxicity EffluentTotal Criteria (mg/L> 7QlO IWC
Test (Dissolved) Acute Chronic at 0.8%
* Acute L&o 48.7% - -
Copper 0.443 (0.447) 0.017 0.010 0.004
Nickel 0.110 (0.100) 1.102 0.015 0.001
Zinc 0.537 (0.480) 0.076 - 0.004
CTAS 20.7 5.360 >l.O (a) 0.166
MBAS 1.6 19.870 >4.0 (b) 0.013
(a) Linear Alcohol Ethoxylate (LAE)(b) Sodium Dodecylbenzenesulfonate (DDBSA) as MBAS* Value is in percent effhient
analyses) rather than ‘acid soluble,’ the latter whichis thought to be more indicative of a concentrationwhich is toxic (U.S. EPA 1985).
As with other chemical compounds, surfactant usagehad been optimized to eliminate those containinghighly toxic and nonbiodegradable APES. It wasa p p a r e n t f r o m t h e D e c e m b e r e f f l u e n tcharacterization that the linear alcohol ethoxylate(LAE) compounds being used by Glen Raven were notbeing adequately treated to non-toxic levels.
Toxicity Reduction Approaches
In order to evaluate the contribution of metals andnon-biodegraded surfactants to Glen Raven’s effluenttoxicity, BRI proposed a Tier V study whichaddressed metals removal and extended biotreatmentas a means of reducing effluent toxicity. Bothlaboratory treatments were conducted onprechlorination composite effluent samples collecteddaily from January 14-18, 1986. Baselinemeasurements of acute toxicity (LC50 values), BOD,COD, metals, and CTAS surfactants were conductedon the December 14-15 composite, which was used forthe metals reduction experiment and the initiation ofthe extended biological treatment experiment.
Metals Reduction Experiment
For this treatment experiment, an aliquot ofuntreated effluent was passed through a preparedcolumn packed with a cationic exchange resin(Biorad AG5OW-X4, 50-100 mesh, hydrogen form).Portions of treated effluent were then used forbioassay analyses and measurements of totalrecoverable metals. Results of pre- and post-treatment analyses indicated substantial reductionsof copper (from 0.244 to 0.078 mg/L) and zinc (0.598 to0.024 mg/L). The pre-treatment iron concentration of1.061 mg/L was minimally reduced to 0.930 mg/L,while cadmium, chromium, lead and nickel
concentrations were co.05 mg/L in both pre- andpost-treatment samples. A post-treatment LC50 valueof 80.7 percent effluent reflected some improvementfrom the baseline LC5o value of 71.9 percent.
Extended Biological Treatment Experiment
For this treatment experiment, activated sludge fromGlen Raven’s WWTP was used to further treataliquots of cornposited effluents. Prior to the actualrenewal/treatment phase of the experiment,act ivated s ludge was acc l imated in BRI’stemperature controlled laboratory, a period whichincluded daily feeding with untreated wastewaterfrom Glen Raven’s treatment facility.
On Day 1 of the Treatability Study (January 15,1986), background values for activated sludgeparameters were measured on sludge culturesupernatant, including total suspended solids,settleable solids and 48-hour static acute LC50 values(the latter determined on culture supernatant). Inaddition, a respiration rate was obtained for thesludge culture to check for an endogenous respirationlevel (5-20 mg/L/hr). Subsequent to this backgroundcheck, a daily renewal of sludge supernatant wasinitiated at a 20 percent by volume rate over a 5-dayperiod, beginning with the January 14-15 composite.A freshly cornposited effluent sample was used eachday thereafter during the renewal period. After thefifth and final 20 percent renewal, at which point thetotal volume of sludge supernatant had beenreplenished with cornposited effluent, activatedsludge treatment was extended for a period of 24hours. At the end of this 24-hour period, aliquots ofsludge supernatant were collected and metal, BOD5,COD, CTAS, and acute and mini-chronic (N.C.DNRCD 1987) static toxicity tests conducted.
Post-treatment metal determinations indicated that0.287 mg/L copper, 0.065 mg/L chromium, 1.071 mg/Liron and 1.14 mg/L zinc were present. Of these, onlyzinc reflected a substantial increase over the pre-treatment concentration of 0.598 mg/L. Post-treatment values of 17.8 mg/L for BOD5, 231.2 mg/Lfor COD, and 0.85 mg/L for nonionic surfactants(CTAS) reflected substantial reductions from pre-treatment concentrations of 79.5, 500.2 and 10.4mg/L for BOD5, COD and nonionics, respectively.The post- treatment 48-hour acute static LC5o valueof B90.0 value also reflected reduction in toxicityfrom the baseline LC50 of 71.9 percent. Results of themini-chronic Ceriodaphnia reproduction bioassayindicated that the treated effluent had no effect atGlen Raven’s 7Q10 instream effluent concentrationof 0.8 percent.
A-23
Conclusions: Toxicity Reduction Experiments
Based on preliminary BOD5, COD, metal and acutestatic LC5o values, the composite eflluent samples ofDecember 17-18 and January 14-15 wererepresentative of effluent samples typically obtainedfrom Glen Raven’s Altamahaw facility.
Metal removal experiments on Glen Raven effluentshowed that metals did not appear to be majorcontributors to effluent toxicity. Compared topublished metal toxicity criteria, the Decembereffluent metal concentrations of copper at 0.443mg/L, nickel at 1.110 mg/L and zinc at 0.537 mg/Lwould appear to support the 48.7 percent static acutetest LCso value obtained for the composite. However,similarly toxic concentrations of copper and zinc(0.244 mg/L and 0.598 mg/L, respectively) werepresent in the January 15 composite and the LC5ovalue was considerably higher (71.9 percent).Likewise, toxic concentrations of copper (0.278 mg/L)and zinc (1.14 mg/L) were present in the treatabilityexperiment supernatant which had a measured LC50value of >90.0 percent. In explaining thisdiscrepancy, it must be kept in mind that flameatomic absorption determinations represent metalsin their free and complexed states. Textile processwater such as Glen Raven’s may contain metals thathave complexed with chelating agents such as EDTAand, therefore, are not as toxic as metals in their freeionic state.
Unbiodegraded nonionic surfactants were present inGlen Raven effluent at concentrations reported astoxic to aquatic organisms. Because Glen Ravenremoved alkyl phenolic surfactants (such as NP-10)from the production process as a result of the Tier Ichemical optimization, it was surmised that thenonionic surfactant concentrated from the effluentrepresented unbiodegraded l inear alcoholethoxylates (LAEs) which are known to be highlybiodegradable and non-toxic when completelytreated. A BRI in-house study, funded by the NorthCarolina DEM Pollution Prevention Pays Program,indicated that nonbiodegraded LAE is toxic toDccphnia pulex at concentrations of 2.4 mg/L (Moore,et al. 1987). Infrared scans of surfactant residue fromboth the December 18 and January 15 compositesconfirmed that the LAEs present in the effluent wereincompletely biodegraded, as evidenced by reducedterminal hydroxyl peaks at 3387 nm and reducedethylene oxide peaks at 1220-1280 nm.
That the level of toxicity in Glen Raven’s effluentcould be reduced with extended biological treatmentwas indicated by the acute static LC5o value of >90.0percent obtained with supernatant from theBiological Treatment experiment. In addition,results of the Ceriodaphnia mini-chronic bioassayindicated that effluent receiving extended biological
treatment did not impair organism reproductionthe 0.8 percent 7Q1.O instream concentration.
at
Based on the findings of the laboratory ToxicityReduction experiments, the following conclusionswere made:
1. Glen Raven effluent can be rendered acutely non-toxic upon receiving adequate biologicaltreatment.
2. Additional biological treatment will biodegradesurfactants and other organics to non-toxic levelsand reduce COD loading on receiving streamwaters.
3. Based on present WWTP design and theinstallation of two low-liquor dye machines, themaximum flow of wastewaters into the WWTPshould be no greater than 20 percent of thetreatment facility capacity. Alternatively, theWWTP could be expanded to allow for 20 percentmore contact time with the activated sludge.
4. Though concentrations of total recoverablemetals in the effluent exceed concentrationsreported to be acutely toxic to aquatic organisms,present levels do not appear to be contributingsignificantly to effluent toxicity.
Based on findings of the TRE, the most logical andleast expensive approach to toxicity reduction at theGlen Raven Mill was to increase process wasteequalization to accommodate continual WWTPoperation on a 24-hours per day, 7 days per week, 52weeks per year schedule. Because the mill had nosecond and third shift or weekend operations, theseperiods could be used for waste treatment. Additionalequalization would allow for a much slower additionof influent to the WWTP, thereby giving the facilitythe time necessary to adequately treat processwastes.
Implementation of Toxicity ReductionRecommendations
By August 1986, Glen Raven Mills had incorporatedsignificant changes at its Altamahaw facility. First,low-liquor ratio dyeing machines were installed in itsdyeing process, reducing by 50 percent water usageper pound of hosiery produced. Secondly, additionalequalization was incorporated into the design of theWWTP, thus eliminating peak influent surges. Thesechanges increased the retention time of processwastes in the activated sludge contact chamber froman average of 2.5 days to 4.5 days.
A-24
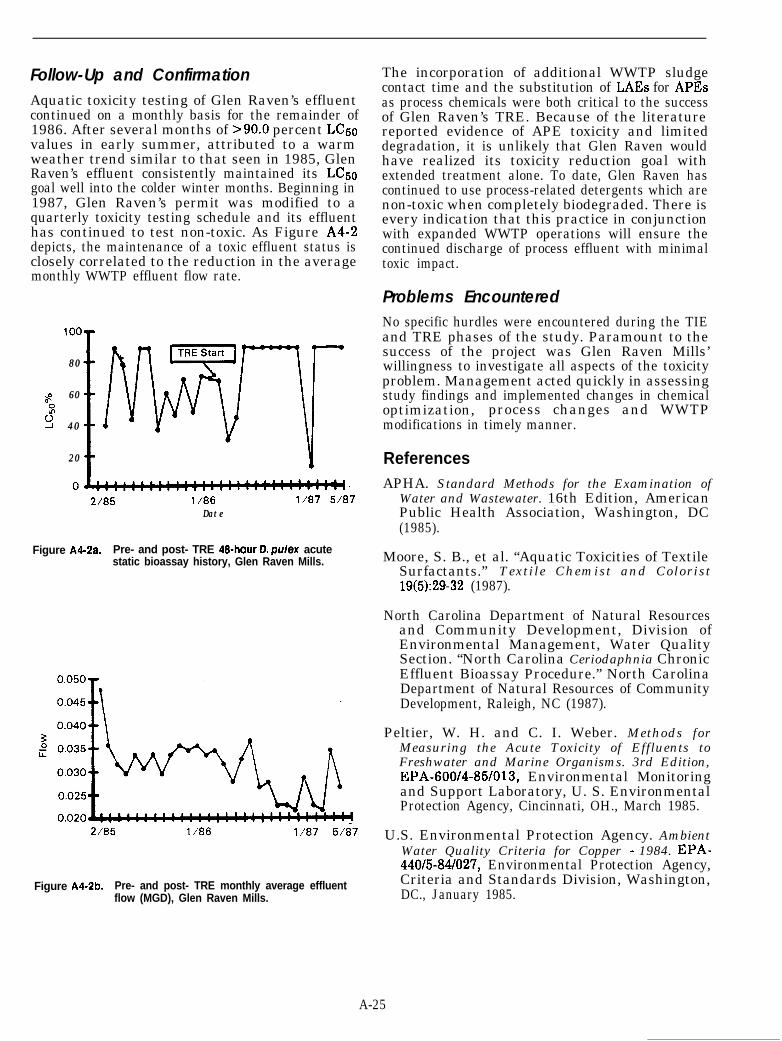
Follow-Up and ConfirmationAquatic toxicity testing of Glen Raven’s effluentcontinued on a monthly basis for the remainder of1986. After several months of >90.0 percent LC50values in early summer, attributed to a warmweather trend similar to that seen in 1985, GlenRaven’s effluent consistently maintained its LC50goal well into the colder winter months. Beginning in1987, Glen Raven’s permit was modified to aquarterly toxicity testing schedule and its effluenthas continued to test non-toxic. As Figure A4-2depicts, the maintenance of a toxic effluent status isclosely correlated to the reduction in the averagemonthly WWTP effluent flow rate.
8080
88 6060s:s:YY 4040
2020
oJ+l:::::w::“““““‘::t++H-2/852/85 l/86l/86 l/87l/87 5/875/87
DateDate
Figure A4-2a. Pre- and post- TRE 48-hour D. pulex acutestatic bioassay history, Glen Raven Mills.
21852185 l/86l/86 l/87l/87 5/875/87
Figure A4-2b. Pre- and post- TRE monthly average effluentflow (MGD), Glen Raven Mills.
The incorporation of additional WWTP sludgecontact time and the substitution of LAEs for APESas process chemicals were both critical to the successof Glen Raven’s TRE. Because of the literaturereported evidence of APE toxicity and limiteddegradation, it is unlikely that Glen Raven wouldhave realized its toxicity reduction goal withextended treatment alone. To date, Glen Raven hascontinued to use process-related detergents which arenon-toxic when completely biodegraded. There isevery indication that this practice in conjunctionwith expanded WWTP operations will ensure thecontinued discharge of process effluent with minimaltoxic impact.
Problems EncounteredNo specific hurdles were encountered during the TIEand TRE phases of the study. Paramount to thesuccess of the project was Glen Raven Mills’willingness to investigate all aspects of the toxicityproblem. Management acted quickly in assessingstudy findings and implemented changes in chemicaloptimization, process changes and WWTPmodifications in timely manner.
ReferencesAPHA. Standard Methods for the Examination of
Water and Wastewater. 16th Edition, AmericanPublic Health Association, Washington, DC(1985).
Moore, S. B., et al. “Aquatic Toxicities of TextileSurfactants.” Textile Chemist and Colorist19(5):29-32 (1987).
North Carolina Department of Natural Resourcesand Community Development, Division ofEnvironmental Management, Water QualitySection. “North Carolina Ceriodaphnia ChronicEffluent Bioassay Procedure.” North CarolinaDepartment of Natural Resources of CommunityDevelopment, Raleigh, NC (1987).
Peltier, W. H. and C. I. Weber. Methods forMeasuring the Acute Toxicity of Effluents toFreshwater and Marine Organisms. 3rd Edition,EPA-600/4-85/013, Environmental Monitoringand Support Laboratory, U. S. EnvironmentalProtection Agency, Cincinnati, OH., March 1985.
U.S. Environmental Protection Agency. AmbientWater Quality Criteria for Copper - 1984. EPA-440/5-84/027, Environmental Protection Agency,Criteria and Standards Division, Washington,DC., January 1985.
A-25
Section A-5Case History: A North Carolina Metal Product Manufacturer
Introduction
Halstead Metal Products, located in Stokes County,NC, produces copper piping through an extrusionprocess. Halstead operates a 0.025 MGD activatedsludge WWTP which has a monthly average effluentdischarge of 0.0054 MOD. Incoming wastewater isprimarily domestic in nature, with no actualcontribution from industrial processes. Halstead’seffluent is discharged into an unnamed tributary ofthe Dan River and has a 7QlO IWC of 32.6 percent.
The North Carolina Division of EnvironmentalManagement (NCDEM) conducted 48-hour acutestatic Duphniapulex bioassays on effluent samples inJune 1985 and January 1986. LC50 values of 37, 28,24 and 7 percent showed that effluent was toxic to thetest organism and indicated that instream impactwould be expected under 7QlO design streamconditions. As a result of these preliminarybioassays, the NCDEM required Halstead MetalProducts to begin a monthly program of 48-houracute static bioassay monitoring of its effluent.Burlington Research, Inc. (BRI) began the monthlytesting in March 1986 and LC5o values ranged fromc5.0 - 11.9 percent through October 1986. AtHalstead’s request, BRI initiated a ToxicityReduction Evaluation (TRE) the following month.
Initial Data and lnformation Acquisitibn
Process Description
Halstead melts copper scrap and cathodes to formbillets (copper logs) which are then used for theextrusion of tubes and cold-drawing of pipes/tubing ofvarious lengths and diameters. Monthly productionof finished product averages 5 million pounds.
Wastewater Treatment Plant Description
Halstead operates a package activated sludge WWTPconsisting of a 25,000 gallon aeration basin, 4,000gallon clarifier and a 525 gallon chlorine contactchamber. Permitted discharge for the WWTP is 0.025MGD but a 0.0058 MGD monthly average isproduced.
Housekeeping
Prior to the initiation of the TRE, Halstead conducteda review of housekeeping practices. A possiblecontributing source of toxic copper flakes throughfloor drains was corrected by the installation of draintraps. Except for the introduction of copper dust viafrequent hand washing by production personnel, noadditional source of contamination was identified.
Characteristics of lnfluent and Eff bent
Halstead’s NPDES permit requires both influent andeffluent analyses on a variable daily/weekly/monthlyschedule. A review of 16 months of NPDES data,summarized in Table A5-1, indicates substantialreductions of BOD5, ammonia nitrogen and totalsuspended solids through the WWTP.
Table AS-l. lnfluent and Effluent Data Summary, HalsteadMetal Products, August 1985 - November 1988
Concentration (mg/L) %Parameter lnfluent -’ Effluent Reduction
Flow (MGD) _ 0.0058 -
PH 7.517.51 6.486.48
130Ds 21792179 9696
COD 66
Oil and Grease 58
Ammonia Nitrogen 6.8 0.8 89
Residual Chlorine, 0.6Total
Solids, Total 581581 422422 2828
Solids, Total 7777 3131 6060Suspended
Chemical Usage ReviewExcept for two hand cleaning products, Halstead usesno chemical products in conjunction with its copperpipe production. It was noted that personnel involvedin the manufacturing process washed their handsfrequently to clean them of machinery oils andgrease. Whether soap product use at Halstead washigh enough to be contributing to the effluent toxicitywas questioned in absence of aquatic toxicity
A-27
information for the cleaners. It is well documentedthat detergentsisurfactants in their unbiodegradedstate can be toxic to aquatic organisms at levels < 1.0mg/L. Another concern regarding soap was itscharacteristic ‘wetting’ property and how it might beenhancing the toxicity of substances such as copperdust by acting as a mode for migration to therespiratory structures of toxicity test organisms.
On-site Visit
In late October 1986, an on-site tour of Halstead’sproduction and WWTP facilities was conducted. Atour of the manufacturing facility did not highlightany disposal problems. Except for the frequent handwashing by employees, which contributes greasesand copper into the waste lines, no contaminatingpoint sources were identified that would account forthe copper, grease, or other unidentified pollutantswhich could be responsible for the severe effluenttoxicity. Operation of the WWTP appeared to beoptimal though oil and grease surface film in theseparator suggested an area that might requireaddressing. An accumulation of copper bits at thepoint of influent discharge to the activated sludgebasin suggested the distinct likelihood of anaccumulation of copper particles in the treatmentbasin, especially since the basin had not beencompletely cleaned out during the previous 6-7 years.
During the on-site visit, a preliminary check onwater from Halstead’s source wells indicated thatincoming water had a pH of 6.27 and a very lowbackground copper concentration. Furthermore,though copper piping was used throughoutHalstead’s facility when it was built, it was unlikelythat any significant leaching from copper pipes wasoccurring at that pH level. A more thorough historyof pH and total metal levels was recommended due tothe rotating nature of pumping from the 5 wellswhich serve as the incoming water source forHalstead. It was also suggested that metal levels bemonitored at various taps and fountains throughoutthe facility.
Toxicity identification Evaluation (TIE)
Eff bent ToxicityLogically, copper was suspected as the primarytoxicant in Halstead’s effluent. Therefore, whenmonthly bioassay monitoring was initiated in March1986, total recoverable copper determinations wereconducted on all effluent composites collected forbioassay testing. EPA guidelines (Peltier and Weber1985) and Standard Methods (APHA 1985) werefollowed for all analyses.During the eight month period of bioassay and coppermonitoring prior to the TRE, 48-hour acute static
Duphnia pulex LC50 determinations consistentlyranged from < 5.0 - 11.9 percent and averaged 6.5percent. Total recoverable copper concentrations forthe same period ranged from 0.436 - 1.931 mg/L andaveraged 0.566 mg/L. EPA criteria documentationindicates that copper is toxic to freshwater organismsat levels as low as 0.007 mg/L (U.S. EPA 1985).
Based on available NPDES data, copper wassuspected as the primary cause of effluent toxicity inHalstead’s discharge, with copper dust and filingsfrom manufacturing processes entering the WWTPconsidered as the source. Oils and greases anddetergents were suspected to be contributing to theoverall effluent toxicity but confirmation throughadditional chemical testing was needed. Because ofthe domestic nature of the WWTP influent, othersources of toxicity were not suspected.
Characterization and FractionationA multi-phase approach was taken during this aspectof the Toxicity Identification Evaluation. Based onfindings and suspicions of the Background Review, a3-week Phase I study was designed to furthercharacterize Halstead’s wastestream. Objectivesinclude:
1.
2.
3.
4.
5.
The daily monitoring of the incoming watersupply over a period of several weeks in order toidentify any background metal contaminationfrom well aquifers.
Because of questions regarding the contributionof detergents to the toxic nature of the effluent, arequest for manufacturer’s information on handcleaners was made.
Monitoring of WWTP influent and effluent for aperiod of 3 weeks to establish incoming andoutgoing levels of metals, surfactants, and oilsand greases. Data would help establish:
a. Whether or not effluent copper levels weredue to accumulated solids in the treatmentbasin.
b. The extent to which surfactants and oils andgreases were components of the influent andhow well they were being biotreated.
Determination of whether metals toxicity,primarily copper, was due to particulate ordissolved forms.
After the establishment of the above outlineddatabase, a series of laboratory experimentswould be designed for the removal of identifiedtoxins from Halstead’s effluent wastestream.Effluent samples would be checked for toxicitybefore and after laboratory treatments.
A-28
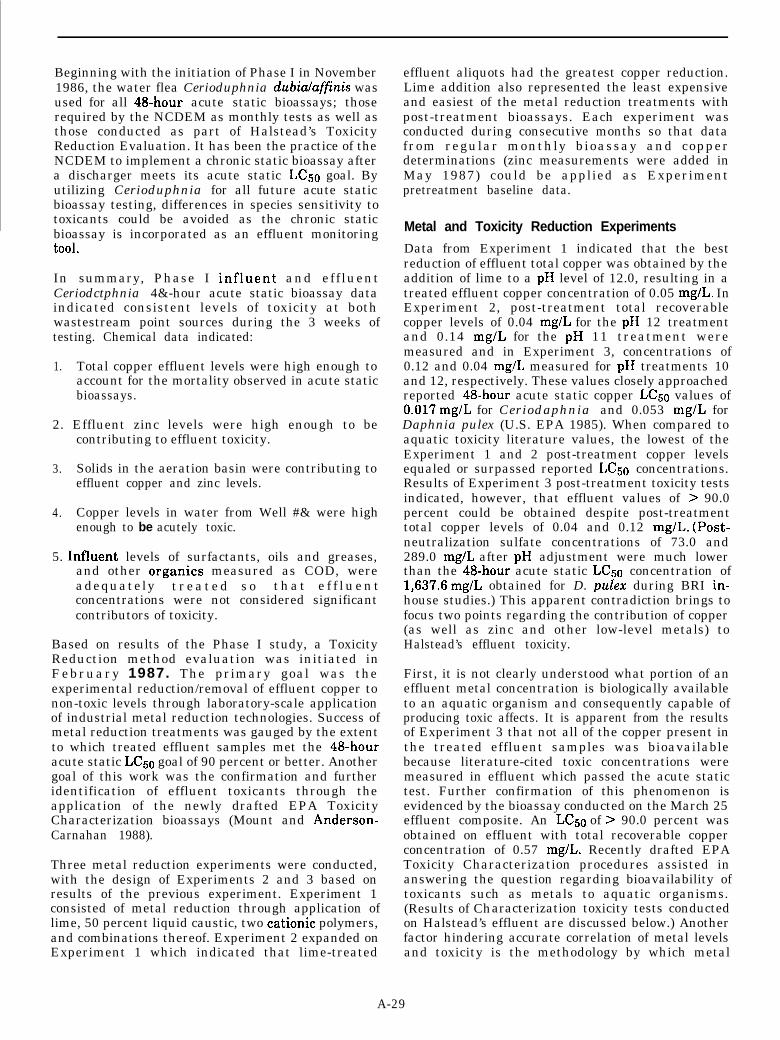
Beginning with the initiation of Phase I in November1986, the water flea Cerioduphnia dubialuffinis wasused for all 4&-hour acute static bioassays; thoserequired by the NCDEM as monthly tests as well asthose conducted as part of Halstead’s ToxicityReduction Evaluation. It has been the practice of theNCDEM to implement a chronic static bioassay aftera discharger meets its acute static LC5o goal. Byutilizing Cerioduphnia for all future acute staticbioassay testing, differences in species sensitivity totoxicants could be avoided as the chronic staticbioassay is incorporated as an effluent monitoringtool.
In summary, Phase I influent and eff luentCeriodctphnia 4&-hour acute static bioassay dataindicated consistent levels of toxicity at bothwastestream point sources during the 3 weeks oftesting. Chemical data indicated:
1. Total copper effluent levels were high enough toaccount for the mortality observed in acute staticbioassays.
2. Effluent zinc levels were high enough to becontributing to effluent toxicity.
3. Solids in the aeration basin were contributing toeffluent copper and zinc levels.
4. Copper levels in water from Well #& were highenough to be acutely toxic.
5. Influent levels of surfactants, oils and greases,and other organics measured as COD, wereadequately t r e a t e d s o t h a t e f f l u e n tconcentrations were not considered significantcontributors of toxicity.
Based on results of the Phase I study, a ToxicityReduction method evaluation was initiated inFebruary 1987. The primary goal was theexperimental reduction/removal of effluent copper tonon-toxic levels through laboratory-scale applicationof industrial metal reduction technologies. Success ofmetal reduction treatments was gauged by the extentto which treated effluent samples met the 48-houracute static LC50 goal of 90 percent or better. Anothergoal of this work was the confirmation and furtheridentification of effluent toxicants through theapplication of the newly drafted EPA ToxicityCharacterization bioassays (Mount and Anderson-Carnahan 1988).
Three metal reduction experiments were conducted,with the design of Experiments 2 and 3 based onresults of the previous experiment. Experiment 1consisted of metal reduction through application oflime, 50 percent liquid caustic, two cationic polymers,and combinations thereof. Experiment 2 expanded onExperiment 1 which indicated that lime-treated
effluent aliquots had the greatest copper reduction.Lime addition also represented the least expensiveand easiest of the metal reduction treatments withpost-treatment bioassays. Each experiment wasconducted during consecutive months so that datafrom regular monthly bioassay and copperdeterminations (zinc measurements were added inMay 1987) could be applied as Experimentpretreatment baseline data.
Metal and Toxicity Reduction Experiments
Data from Experiment 1 indicated that the bestreduction of effluent total copper was obtained by theaddition of lime to a pH level of 12.0, resulting in atreated effluent copper concentration of 0.05 mg/L. InExperiment 2, post-treatment total recoverablecopper levels of 0.04 mg/L for the pH 12 treatmentand 0.14 mg/L for the pH 11 treatment weremeasured and in Experiment 3, concentrations of0.12 and 0.04 mg/L measured for pH treatments 10and 12, respectively. These values closely approachedreported 4&-hour acute static copper LC5o values of0.017 mg/L for Ceriodaphnia and 0.053 mg/L forDaphnia pulex (U.S. EPA 1985). When compared toaquatic toxicity literature values, the lowest of theExperiment 1 and 2 post-treatment copper levelsequaled or surpassed reported LC5o concentrations.Results of Experiment 3 post-treatment toxicity testsindicated, however, that effluent values of > 90.0percent could be obtained despite post-treatmenttotal copper levels of 0.04 and 0.12 mg/L. (Post-neutralization sulfate concentrations of 73.0 and289.0 mg/L after pH adjustment were much lowerthan the 4&-hour acute static LC5o concentration of1,637.6 mg/L obtained for D. pulex during BRI in-house studies.) This apparent contradiction brings tofocus two points regarding the contribution of copper(as well as zinc and other low-level metals) toHalstead’s effluent toxicity.
First, it is not clearly understood what portion of aneffluent metal concentration is biologically availableto an aquatic organism and consequently capable ofproducing toxic affects. It is apparent from the resultsof Experiment 3 that not all of the copper present inthe treated effluent samples was bioavailablebecause literature-cited toxic concentrations weremeasured in effluent which passed the acute statictest. Further confirmation of this phenomenon isevidenced by the bioassay conducted on the March 25effluent composite. An LC5o of > 90.0 percent wasobtained on effluent with total recoverable copperconcentration of 0.57 mg/L. Recently drafted EPAToxicity Characterization procedures assisted inanswering the question regarding bioavailability oftoxicants such as metals to aquatic organisms.(Results of Characterization toxicity tests conductedon Halstead’s effluent are discussed below.) Anotherfactor hindering accurate correlation of metal levelsand toxicity is the methodology by which metal
A-29
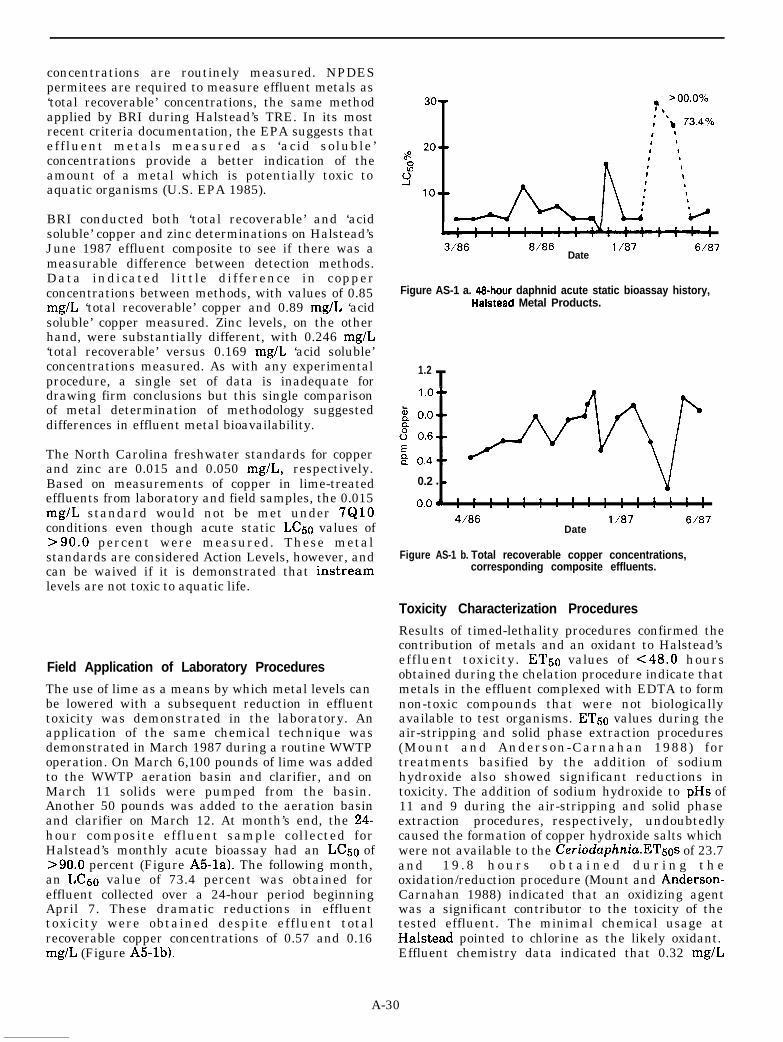
concentrations are routinely measured. NPDESpermitees are required to measure effluent metals as‘total recoverable’ concentrations, the same methodapplied by BRI during Halstead’s TRE. In its mostrecent criteria documentation, the EPA suggests thateffluent metals measured as ‘acid soluble ’concentrations provide a better indication of theamount of a metal which is potentially toxic toaquatic organisms (U.S. EPA 1985).
BRI conducted both ‘total recoverable’ and ‘acidsoluble’ copper and zinc determinations on Halstead’sJune 1987 effluent composite to see if there was ameasurable difference between detection methods.Data indicated l ittle difference in copperconcentrations between methods, with values of 0.85mg/L ‘total recoverable’ copper and 0.89 mg/L ‘acidsoluble’ copper measured. Zinc levels, on the otherhand, were substantially different, with 0.246 mg/L‘total recoverable’ versus 0.169 mg/L ‘acid soluble’concentrations measured. As with any experimentalprocedure, a single set of data is inadequate fordrawing firm conclusions but this single comparisonof metal determination of methodology suggesteddifferences in effluent metal bioavailability.
The North Carolina freshwater standards for copperand zinc are 0.015 and 0.050 mg/L, respectively.Based on measurements of copper in lime-treatedeffluents from laboratory and field samples, the 0.015mg/L standard would not be met under 7QlOconditions even though acute static LC5o values of>90.0 percent were measured. These metalstandards are considered Action Levels, however, andcan be waived if it is demonstrated that instreamlevels are not toxic to aquatic life.
Field Application of Laboratory Procedures
The use of lime as a means by which metal levels canbe lowered with a subsequent reduction in effluenttoxicity was demonstrated in the laboratory. Anapplication of the same chemical technique wasdemonstrated in March 1987 during a routine WWTPoperation. On March 6,100 pounds of lime was addedto the WWTP aeration basin and clarifier, and onMarch 11 solids were pumped from the basin.Another 50 pounds was added to the aeration basinand clarifier on March 12. At month’s end, the 24-hour composite effluent sample collected forHalstead’s monthly acute bioassay had an LC50 of>90.0 percent (Figure A5-la). The following month,an LC50 value of 73.4 percent was obtained foreffluent collected over a 24-hour period beginningApril 7. These dramatic reductions in effluenttoxicity were obtained despite effluent totalrecoverable copper concentrations of 0.57 and 0.16mg/L (Figure A5-lb).
I:::;;::;$;::;;!!3/86 8/86 l/87 6/87
Date
Figure AS-1 a. 48-hour daphnid acute static bioassay history,Halstead Metal Products.
1.2 Tl.O--l.O--
0.2 l -
o.or : : : I : : : ! ! : : : : : ! :4/86
Datel/87 6/87
Figure AS-1 b. Total recoverable copper concentrations,corresponding composite effluents.
Toxicity Characterization Procedures
Results of timed-lethality procedures confirmed thecontribution of metals and an oxidant to Halstead’seffluent toxicity. ET50 values of C48.0 hoursobtained during the chelation procedure indicate thatmetals in the effluent complexed with EDTA to formnon-toxic compounds that were not biologicallyavailable to test organisms. ET50 values during theair-stripping and solid phase extraction procedures(Mount and Anderson-Carnahan 1988) fortreatments basified by the addition of sodiumhydroxide also showed significant reductions intoxicity. The addition of sodium hydroxide to pHs of11 and 9 during the air-stripping and solid phaseextraction procedures, respectively, undoubtedlycaused the formation of copper hydroxide salts whichwere not available to the Cerioduphnia.ETsos of 23.7and 1 9 . 8 h o u r s o b t a i n e d d u r i n g t h eoxidation/reduction procedure (Mount and Anderson-Carnahan 1988) indicated that an oxidizing agentwas a significant contributor to the toxicity of thetested effluent. The minimal chemical usage atHalstead pointed to chlorine as the likely oxidant.Effluent chemistry data indicated that 0.32 mg/L
A-30
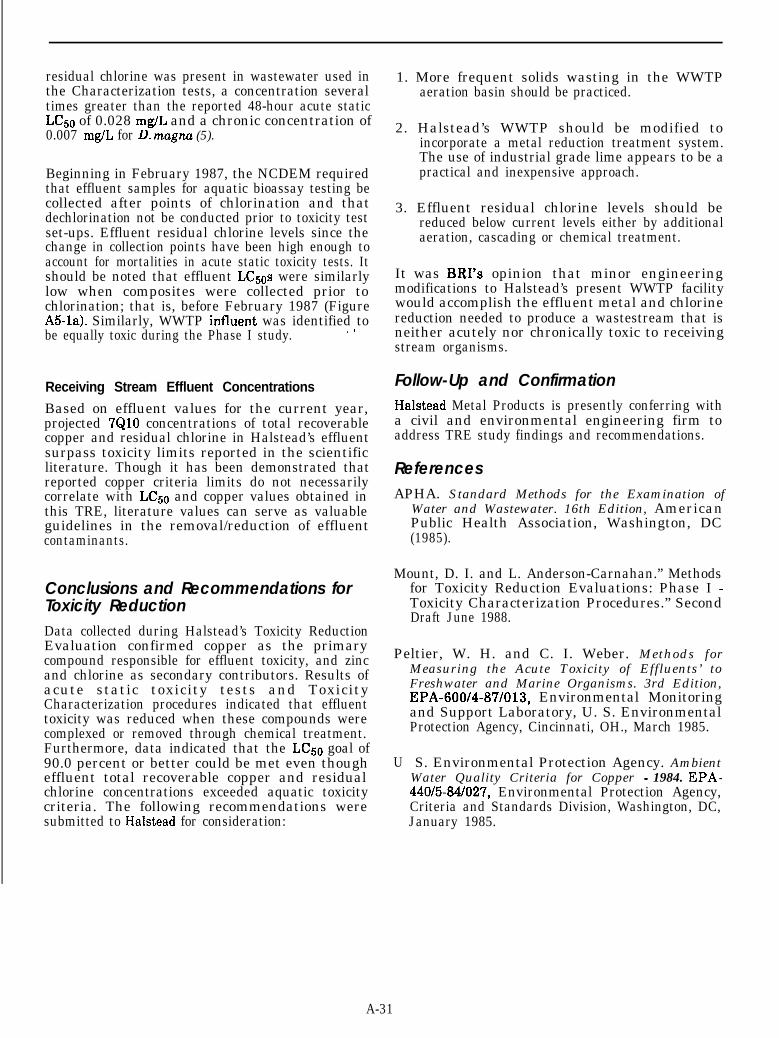
residual chlorine was present in wastewater used inthe Characterization tests, a concentration severaltimes greater than the reported 48-hour acute staticLC50 of 0.028 mg/L and a chronic concentration of0.007 mg/L for D. magna (5).
Beginning in February 1987, the NCDEM requiredthat effluent samples for aquatic bioassay testing becollected after points of chlorination and thatdechlorination not be conducted prior to toxicity testset-ups. Effluent residual chlorine levels since thechange in collection points have been high enough toaccount for mortalities in acute static toxicity tests. Itshould be noted that effluent LC5os were similarlylow when composites were collected prior tochlorination; that is, before February 1987 (FigureA5la). Similarly, WWTP influent was identified tobe equally toxic during the Phase I study. ’ ’
Receiving Stream Effluent Concentrations
Based on effluent values for the current year,projected 7QlO concentrations of total recoverablecopper and residual chlorine in Halstead’s effluentsurpass toxicity limits reported in the scientificliterature. Though it has been demonstrated thatreported copper criteria limits do not necessarilycorrelate with LC5o and copper values obtained inthis TRE, literature values can serve as valuableguidelines in the removal/reduction of effluentcontaminants.
Conclusions and Recommendations forToxicity ReductionData collected during Halstead’s Toxicity ReductionEvaluation confirmed copper as the primarycompound responsible for effluent toxicity, and zincand chlorine as secondary contributors. Results ofacute static toxicity tests and ToxicityCharacterization procedures indicated that effluenttoxicity was reduced when these compounds werecomplexed or removed through chemical treatment.Furthermore, data indicated that the LC50 goal of90.0 percent or better could be met even thougheffluent total recoverable copper and residualchlorine concentrations exceeded aquatic toxicitycriteria. The following recommendations weresubmitted to Halstead for consideration:
1. More frequent solids wasting in the WWTPaeration basin should be practiced.
2. Halstead’s WWTP should be modified toincorporate a metal reduction treatment system.The use of industrial grade lime appears to be apractical and inexpensive approach.
3. Effluent residual chlorine levels should bereduced below current levels either by additionalaeration, cascading or chemical treatment.
It was BRI’s opinion that minor engineeringmodifications to Halstead’s present WWTP facilitywould accomplish the effluent metal and chlorinereduction needed to produce a wastestream that isneither acutely nor chronically toxic to receivingstream organisms.
Follow-Up and ConfirmationHalstead Metal Products is presently conferring witha civil and environmental engineering firm toaddress TRE study findings and recommendations.
ReferencesAPHA. Standard Methods for the Examination of
Water and Wastewater. 16th Edition, AmericanPublic Health Association, Washington, DC(1985).
Mount, D. I. and L. Anderson-Carnahan.” Methodsfor Toxicity Reduction Evaluations: Phase I -Toxicity Characterization Procedures.” SecondDraft June 1988.
Peltier, W. H. and C. I. Weber. Methods forMeasuring the Acute Toxicity of Effluents’ toFreshwater and Marine Organisms. 3rd Edition,EPA-600/4-87/013, Environmental Monitoringand Support Laboratory, U. S. EnvironmentalProtection Agency, Cincinnati, OH., March 1985.
U S. Environmental Protection Agency. AmbientWater Quality Criteria for Copper - 1984. EPA-440/5-84/027, Environmental Protection Agency,Criteria and Standards Division, Washington, DC,January 1985.
A-31
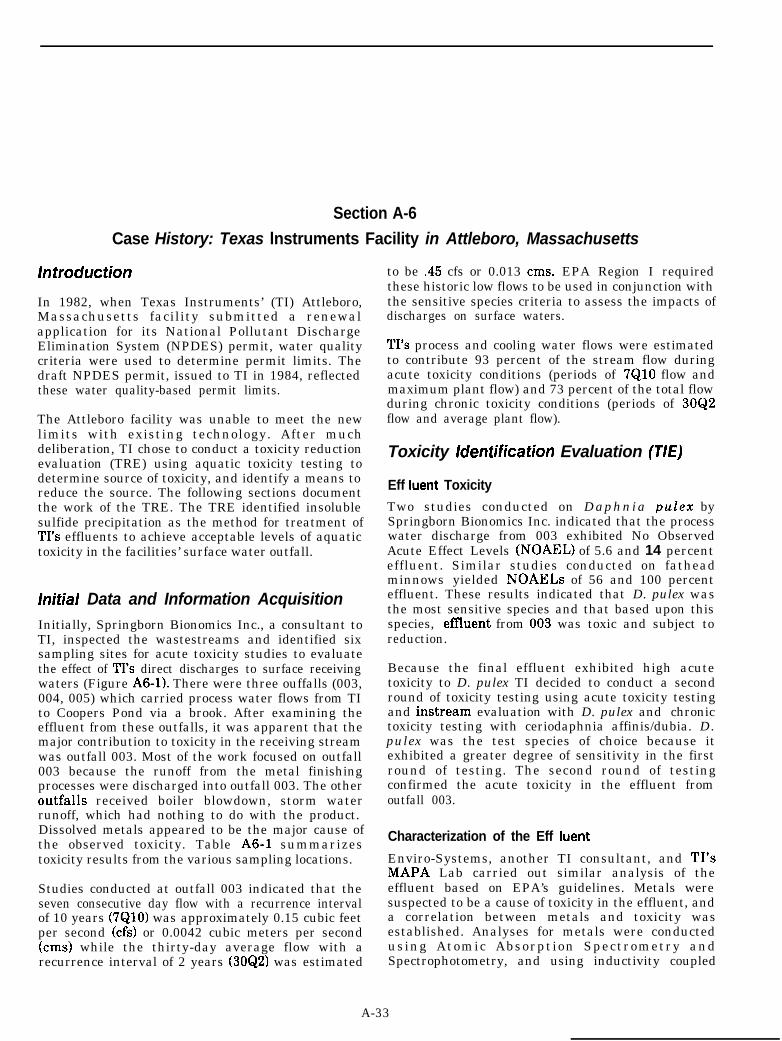
Section A-6Case History: Texas lnstruments Facility in Attleboro, Massachusetts
introduction
In 1982, when Texas Instruments’ (TI) Attleboro,Massachusetts facility submitted a renewalapplication for its National Pollutant DischargeElimination System (NPDES) permit, water qualitycriteria were used to determine permit limits. Thedraft NPDES permit, issued to TI in 1984, reflectedthese water quality-based permit limits.
The Attleboro facility was unable to meet the newlimits with existing technology. After muchdeliberation, TI chose to conduct a toxicity reductionevaluation (TRE) using aquatic toxicity testing todetermine source of toxicity, and identify a means toreduce the source. The following sections documentthe work of the TRE. The TRE identified insolublesulfide precipitation as the method for treatment ofTI’s effluents to achieve acceptable levels of aquatictoxicity in the facilities’ surface water outfall.
initial Data and Information AcquisitionInitially, Springborn Bionomics Inc., a consultant toTI, inspected the wastestreams and identified sixsampling sites for acute toxicity studies to evaluatethe effect of TI’s direct discharges to surface receivingwaters (Figure A6-1). There were three ouffalls (003,004, 005) which carried process water flows from TIto Coopers Pond via a brook. After examining theeffluent from these outfalls, it was apparent that themajor contribution to toxicity in the receiving streamwas outfall 003. Most of the work focused on outfall003 because the runoff from the metal finishingprocesses were discharged into outfall 003. The otheroutfalls received boiler blowdown, storm waterrunoff, which had nothing to do with the product.Dissolved metals appeared to be the major cause ofthe observed toxicity. Table A6-1 summarizestoxicity results from the various sampling locations.
Studies conducted at outfall 003 indicated that theseven consecutive day flow with a recurrence intervalof 10 years (7QlO) was approximately 0.15 cubic feetper second (cfs) or 0.0042 cubic meters per second(ems) while the thirty-day average flow with arecurrence interval of 2 years (30Q2) was estimated
to be .45 cfs or 0.013 ems. EPA Region I requiredthese historic low flows to be used in conjunction withthe sensitive species criteria to assess the impacts ofdischarges on surface waters.
TI’s process and cooling water flows were estimatedto contribute 93 percent of the stream flow duringacute toxicity conditions (periods of 7QlO flow andmaximum plant flow) and 73 percent of the total flowduring chronic toxicity conditions (periods of 30Q2flow and average plant flow).
Toxicity lcfentification Evaluation (TIE)
Eff bent ToxicityTwo studies conducted on Daphnia puZex bySpringborn Bionomics Inc. indicated that the processwater discharge from 003 exhibited No ObservedAcute Effect Levels (NOAEL) of 5.6 and 14 percenteffluent. Similar studies conducted on fatheadminnows yielded NOAELs of 56 and 100 percenteffluent. These results indicated that D. pulex wasthe most sensitive species and that based upon thisspecies, eMuent from 003 was toxic and subject toreduction.
Because the final effluent exhibited high acutetoxicity to D. pulex TI decided to conduct a secondround of toxicity testing using acute toxicity testingand instream evaluation with D. pulex and chronictoxicity testing with ceriodaphnia affinis/dubia. D.pulex was the test species of choice because itexhibited a greater degree of sensitivity in the firstround of testing. The second round of testingconfirmed the acute toxicity in the effluent fromoutfall 003.
Characterization of the Eff bent
Enviro-Systems, another TI consultant, and TI’sMAPA Lab carried out similar analysis of theeffluent based on EPA’s guidelines. Metals weresuspected to be a cause of toxicity in the effluent, anda correlation between metals and toxicity wasestablished. Analyses for metals were conductedusing Atomic Absorption Spectrometry andSpectrophotometry, and using inductivity coupled
A-33
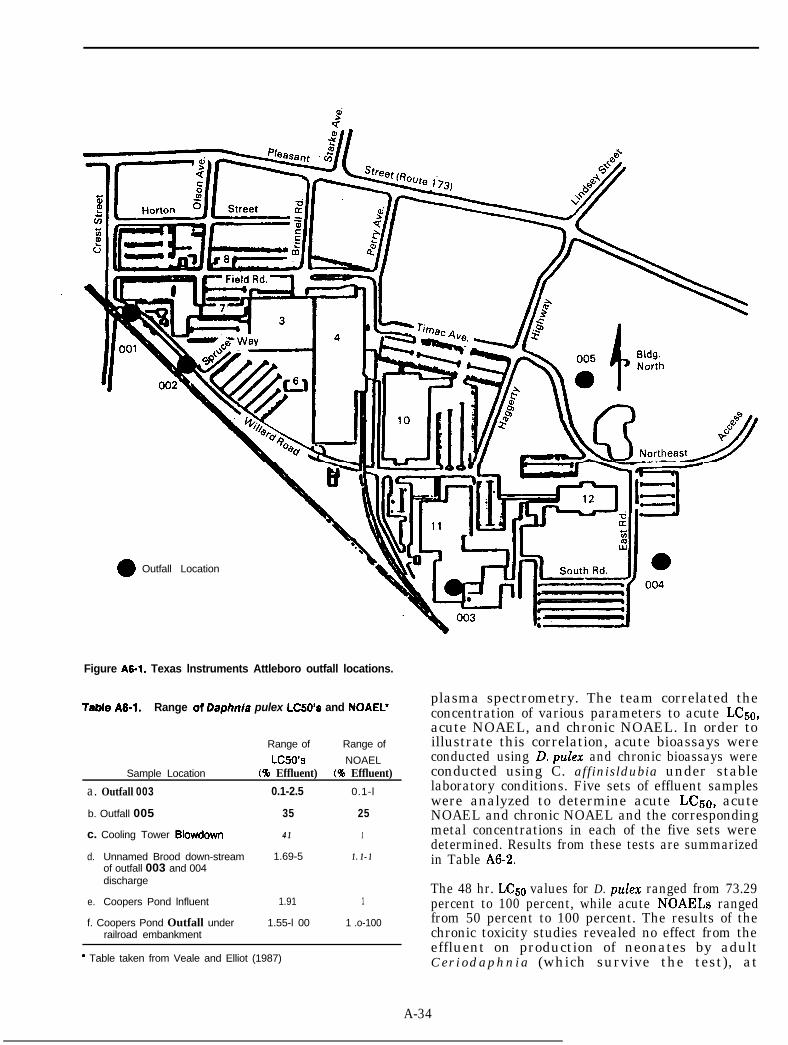
0 Outfall Location
Figure A6-1. Texas lnstruments Attleboro outfall locations.
TaMe A6-1. Range of Daphnia pulex LCSO’s and NOAEL’
Sample Location
a. Outfall 003
b. Outfall 005
c. Cooling Tower Blowdown
Range of Range of
LCSO’S NOAEL(% Effluent) (8 Effluent)
0.1-2.5 0.1-l
35 25
4141 11
d. Unnamed Brood down-stream 1.69-5 1.1-11.1-1of outfall 003 and 004discharge
e. Coopers Pond lnfluent
f. Coopers Pond Outfall underrailroad embankment
1.91 1
1.55-l 00 1 .o-100
* Table taken from Veale and Elliot (1987)
plasma spectrometry. The team correlated theconcentration of various parameters to acute LC50,acute NOAEL, and chronic NOAEL. In order toillustrate this correlation, acute bioassays wereconducted using D. pulex and chronic bioassays wereconducted using C. affinisldubia under stablelaboratory conditions. Five sets of effluent sampleswere analyzed to determine acute LCso, acuteNOAEL and chronic NOAEL and the correspondingmetal concentrations in each of the five sets weredetermined. Results from these tests are summarizedin Table A6-2.
The 48 hr. LC5o values for D. pulex ranged from 73.29percent to 100 percent, while acute NOAELs rangedfrom 50 percent to 100 percent. The results of thechronic toxicity studies revealed no effect from theeffluent on production of neonates by adultCeriodaphnia (which survive the test), at
A-34
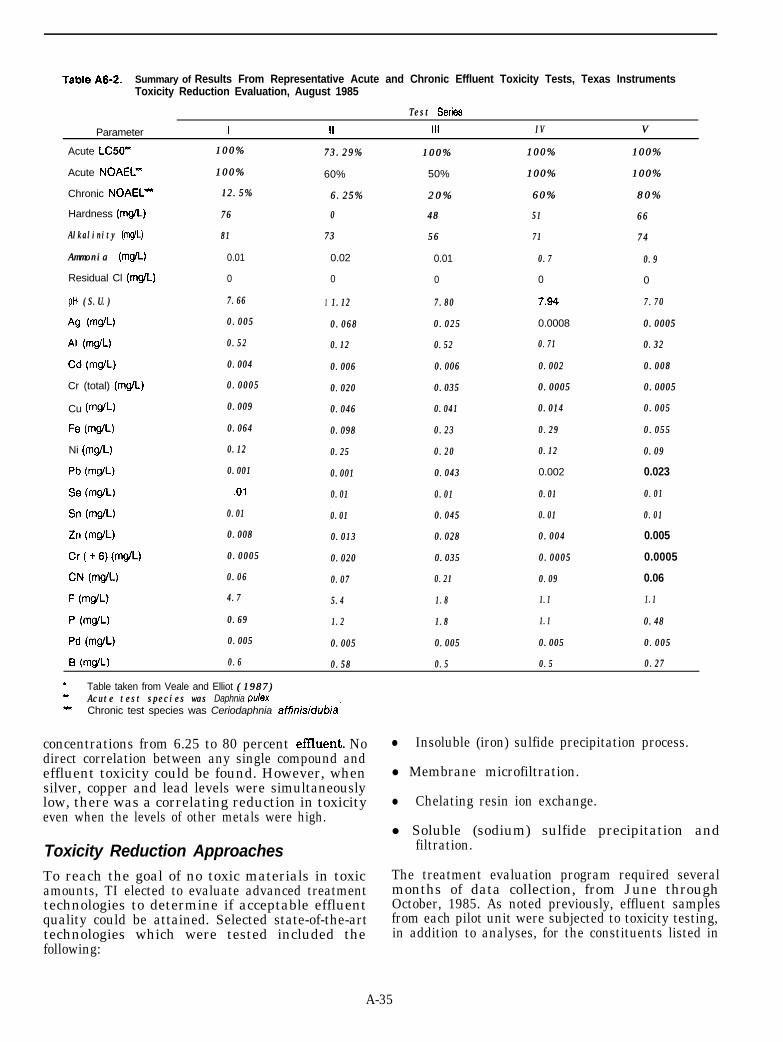
Table M-2. Summary of Results From Representative Acute and Chronic Effluent Toxicity Tests, Texas InstrumentsToxicity Reduction Evaluation, August 1985
Test Test SerifinSerifin
Parameter I II III IVIV VV
Acute LC50* 100%100% 73.29%73.29% 100%100% 100%100% 100%100%
Acute NOAEF
Chronic NOAEL”
100%100% 60% 50% 100%100% 100%100%
12.5%12.5% 6.25%6.25% 20%20% 60%60% 80%80%
Hardness (mgIL) 7676 00 4848 5151 6666
Alkalinity Alkalinity (mg/L) 8181 7373 5656 7171 7474
Ammonia Ammonia (mg/L) 0.01 0.02 0.01 0.70.7 0.90.9
Residual Cl (mg/L) 0 0 0 0 0
pHpH (S.U.) (S.U.) 7.667.66 11 1.121.12 7.807.80 7.94 7.707.70
AgAg (mg/L)(mg/L) 0.0050.005 0.0680.068 0.0250.025 0.0008 0.00050.0005
AlAl (mg/L)(mg/L) 0.520.52 0.120.12 0.520.52 0.710.71 0.320.32
Cd(mg/L)Cd(mg/L) 0.0040.004 0.0060.006 0.0060.006 0.0020.002 0.0080.008
Cr (total) (mg/L) 0.00050.0005 0.0200.020 0.0350.035 0.00050.0005 0.00050.0005
Cu (mg/L) 0.0090.009 0.0460.046 0.0410.041 0.0140.014 0.0050.005
Fe (mg/L) 0.0640.064 0.0980.098 0.230.23 0.290.29 0.0550.055
Ni (mg/L) 0.120.12 0.250.25 0.200.20 0.120.12 0.090.09
Pb W-c&) 0.0010.001 0.0010.001 0.0430.043 0.002 0.023
Se OWL) .Ol.Ol 0.010.01 0.010.01 0.010.01 0.010.01
Sn tmg/L) 0.010.01 0.010.01 0.0450.045 0.010.01 0.010.01
Zn OWL) 0.0080.008 0.0130.013 0.0280.028 0.0040.004 0.005
Cr ( + 6) tmcW 0.00050.0005 0.0200.020 0.0350.035 0.00050.0005 0.0005
CN VW-) 0.060.06 0.070.07 0.210.21 0.090.09 0.06
F OWL) 4.74.7 5.45.4 1.81.8 1.11.1 1.11.1
P OWL) 0.690.69 1.21.2 1.81.8 1.11.1 0.480.48
Pd tmq/L) 0.0050.005 0.0050.005 0.0050.005 0.0050.005 0.0050.005
B UWL) 0.60.6 0.580.58 0.50.5 0.50.5 0.270.27
* Table taken from Veale and Elliot (1987)(1987)** Acute test species was Acute test species was Daphnia pulexldot Chronic test species was Ceriodaphnia affinisidubia’
concentrations from 6.25 to 80 percent emuent. Nodirect correlation between any single compound andeffluent toxicity could be found. However, whensilver, copper and lead levels were simultaneouslylow, there was a correlating reduction in toxicityeven when the levels of other metals were high.
Toxicity Reduction ApproachesTo reach the goal of no toxic materials in toxicamounts, TI elected to evaluate advanced treatmenttechnologies to determine if acceptable effluentquality could be attained. Selected state-of-the-arttechnologies which were tested included thefollowing:
l Insoluble (iron) sulfide precipitation process.
l Membrane microfiltration.
l Chelating resin ion exchange.
l Soluble (sodium) sulfide precipitation andfiltration.
The treatment evaluation program required severalmonths of data collection, from June throughOctober, 1985. As noted previously, effluent samplesfrom each pilot unit were subjected to toxicity testing,in addition to analyses, for the constituents listed in
A-35
the new discharge permit. This in-depth testing, datacollection and data analyses eventually determined:
The feasibility of advanced treatment to producean effluent meeting the TRE objective.
Estimations of full-scale chemical consumptionrates and chemical costs.
Operational and maintenance advantages anddisadvantages of each process.
Process turndown capabilities and operationalflexibility.
Full-scale design parameters.
For this specific project, the pilot testing favored theselection of the insoluble sulfide precipitation processfor advanced treatment and polishing of the effluentfrom TI’s existing hydroxide precipitation treatmentsystem.
Pilot TestingIn order to establish baseline toxicity, design andoperating data for the advanced treatment processesrequired to meet TI’s new permit limits, acomprehensive pilot testing program was developed.During this pilot testing program, a series of acuteand chronic toxicity tests were conducted usingtreated effluent from the pilot units.
Conclusions, Comments, andRecommendations
In May 1985, TI contracted with United Engineersand Constructors Inc. (UE8zC) of Boston for thedesign upgrade of the existing industrial wastewatertreatment system for their Attleboro facility.Improvements to the existing wastewater treatmentsystem were to include advanced treatmenttechnologies.
UE&C developed a cost-effective application of anInsoluble Sulfide Precipitation Process during thepilot studies. This method was successful in meetingthe discharge limits and the toxicity requirements inthe NPDES permit. This new unit has not yet beenput into normal operation at the TI plant.
ReferencesBazza, R.V., C.M. Kelleeher, and M. B. Yeligar.
“Metal and Finishing Wastewater TreatmentUpgrade with Insoluble Sulfide PrecipitationProcess,” Paper presented at Eighth ConferencePollution Control for the Metal FinishingIndustry, San Diego, CA, Feb. 9-l 1,1987.
Veale, F.I., and M. J. Elliot. “Meeting the WaterQuality Criteria for the Metal FinishingIndustries.” Environmental Progress, 6(Z), May1987.
A-36
Section A-7Case History: Chemical Plant I
introduction
This case study presents information and datagathered during a toxicity reduction evaluationconducted in 1985 and 1986. The facility under studyis located in an eastern coastal state with dischargeto the Atlantic Ocean. The investigation wasperformed by AWARE Incorporated. A permiteffective July 1, 1985 required the plant to conducttoxicity tests on Mysidopsis bahia, a saltwatershrimp, to comply with a 96 hr LC50 value > 50percent effluent toxicity limit. This permitrequirement was to be attained in no more than threeyears from the effective date of the permit, withinterim improvement levels specified as well. Thepermit also required that the TRE identifytechnologies capable of attaining the interim andfinal toxicity limits within one year (July 1986).Quarterly reports on the technological progress toreduce toxicity were also required.
initial Data and lnformation Acquisition
Products manufactured at the facility includedorganic dyes and intermediates, epoxy resins, andfine chemicals used for textile, paper and plasticindustries. Figures A7-1 shows a process flowdiagram for the waste treatment system. As of June1985, the biologically treated wastewater at the plantwas highly toxic to M. bahia (LC50 = 5 percent).
Toxicity Identification Evaluation (TIE) ’
Toxicity Screening
Ammonia
Ammonia was suspected as a causative agent due tolevels of 20 to 30 mg/L in the treated effluent.Ammonia stripping was tested to determine ifammonia could be the major cause of the toxicity.
Biodegradability
Extended aeration biodegradation testing wasperformed with a seven day retention time followingactivated sludge treatment. A non-biodegradablefraction of 70 mg/L remained and no significant
reduction in toxicity was observed. However, thismethod succeeded in removing the chloro-compoundsrevealed during the GUMS analysis.
Priority Pollutants
Methylene chloride and methyl isobutylketone wereused in extraction tests to determine whether organicpriority pollutants in the effluent were causing thetoxicity. Both tests failed to achieve the objective ofeliminating toxicity.
Metals
In order to determine the role metals were playing inthe effluent toxicity, precipitation/filtration testswere performed using sulfide, hydroxide, and alum.Metals removal resulted in insignificant toxicityreduction.
Non-biodegradable/non-polar Organics
In order to determine the significance of non-biodegradable, non-polar organics, the biologicallytreated effluent was exposed to further, completebiological treatment followed by contacting withpulverized activated carbon. This resulted in nearlycomplete removal of TOC and toxicity.
N/MS Analysis
GUMS analysis revealed that benzanthracene, alarge multiple-ring aromatic compound was the mostprobable potential toxicant. However, there was noknown source of the compound within the plant. Thiscompound was detected in the final emuent samplewhich had the lowest LC50 value. Other potentiallytoxic compounds which were occasionally detectedincluded chloroform, tetrachloroethylene, l,l,l-trichloroethane, napthalene, dibutylphthalate andazo compounds. However, all of these compoundswere found in both non-toxic and toxic samples insimilar concentrations.
Toxicity Characterization and Sourceldentifica t/on
A preliminary screening program investigatedsources of toxicity from seven areas in the plant.
A-37
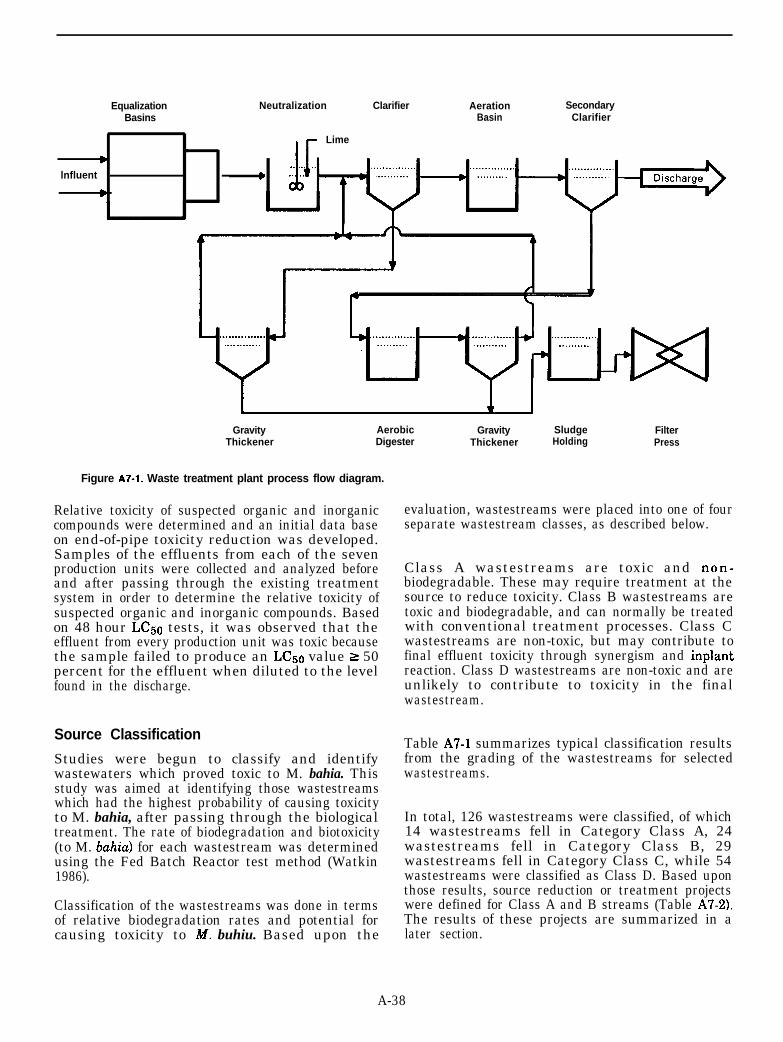
EqualizationBasins
Neutralization Clarifier Aeration SecondaryBasin Clarifier
lnfluent
*
L
* u- Lime
Gravity Aerobic Gravity Sludge FilterThickener Digester Thickener Holding Press
Figure A7-1. Waste treatment plant process flow diagram.
Relative toxicity of suspected organic and inorganiccompounds were determined and an initial data baseon end-of-pipe toxicity reduction was developed.Samples of the effluents from each of the sevenproduction units were collected and analyzed beforeand after passing through the existing treatmentsystem in order to determine the relative toxicity ofsuspected organic and inorganic compounds. Basedon 48 hour LC50 tests, it was observed that theeffluent from every production unit was toxic becausethe sample failed to produce an LC5o value 2 50percent for the effluent when diluted to the levelfound in the discharge.
Source Classification
Studies were begun to classify and identifywastewaters which proved toxic to M. bahia. Thisstudy was aimed at identifying those wastestreamswhich had the highest probability of causing toxicityto M. bahia, after passing through the biologicaltreatment. The rate of biodegradation and biotoxicity(to M. bahiu) for each wastestream was determinedusing the Fed Batch Reactor test method (Watkin1986).
Classification of the wastestreams was done in termsof relative biodegradation rates and potential forcausing toxicity to M. buhiu. Based upon the
evaluation, wastestreams were placed into one of fourseparate wastestream classes, as described below.
Class A wastestreams are toxic and non-biodegradable. These may require treatment at thesource to reduce toxicity. Class B wastestreams aretoxic and biodegradable, and can normally be treatedwith conventional treatment processes. Class Cwastestreams are non-toxic, but may contribute tofinal effluent toxicity through synergism and inplantreaction. Class D wastestreams are non-toxic and areunlikely to contribute to toxicity in the finalwastestream.
Table A7-1 summarizes typical classification resultsfrom the grading of the wastestreams for selectedwastestreams.
In total, 126 wastestreams were classified, of which14 wastestreams fell in Category Class A, 24wastestreams fell in Category Class B, 29wastestreams fell in Category Class C, while 54wastestreams were classified as Class D. Based uponthose results, source reduction or treatment projectswere defined for Class A and B streams (Table A7-2).The results oflater section.
these projects are summarized in a
A-38
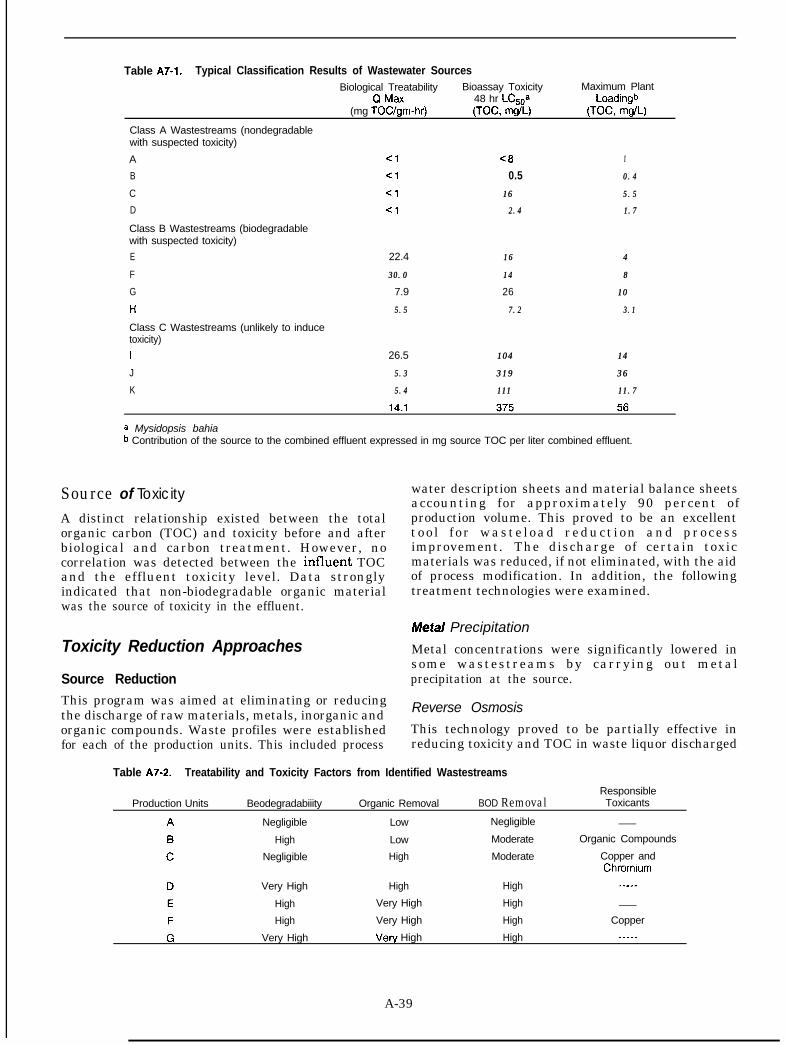
Table A7-1. Typical Classification Results of Wastewater SourcesBiological Treatability Bioassay Toxicity Maximum Plant
QMax 48 hr LCs,a Loadingb(mg TOC/gm-hr) (TOC, mg/L) (TOC, m@L)
Class A Wastestreams (nondegradablewith suspected toxicity)
A <l<l <8 11
B <l<l 0.5 0.40.4
C ClCl 1616 5.55.5
D <I 2.42.4 1.71.7
Class B Wastestreams (biodegradablewith suspected toxicity)
E 22.4 1616 44
F 30.030.0 1414 88
G 7.9 26 1010
l-il-i 5.55.5 7.27.2 3.13.1
Class C Wastestreams (unlikely to inducetoxicity)
I 26.5 104104 1414
J 5.35.3 319319 3636
K 5.45.4 111111 11.711.7
a Mysidopsis bahiab Contribution of the source to the combined effluent expressed in mg source TOC per liter combined effluent.
Source of Toxicity
A distinct relationship existed between the totalorganic carbon (TOC) and toxicity before and afterbiological and carbon treatment. However, nocorrelation was detected between the influent TOCand the effluent toxicity level. Data stronglyindicated that non-biodegradable organic materialwas the source of toxicity in the effluent.
Toxicity Reduction Approaches
Source ReductionThis program was aimed at eliminating or reducingthe discharge of raw materials, metals, inorganic andorganic compounds. Waste profiles were establishedfor each of the production units. This included process
water description sheets and material balance sheetsaccounting for approximately 90 percent ofproduction volume. This proved to be an excellenttoo l f or waste load reduct ion and processimprovement. The discharge of certain toxicmaterials was reduced, if not eliminated, with the aidof process modification. In addition, the followingtreatment technologies were examined.
Metal Precipitation
Metal concentrations were significantly lowered insome wastestreams by carrying out metalprecipitation at the source.
Reverse Osmosis
This technology proved to be partially effective inreducing toxicity and TOC in waste liquor discharged
Table A7-2. Treatability and Toxicity Factors from Identified Wastestreams
Production Units Beodegradabiiity Organic Removal BOD RemovalResponsibleToxicants
Negligible
High
Negligible
Very High
High
High
Very High
Low
Low
High
High
Very High
Very High
Very High
Negligible
Moderate
Moderate
High
High
High
High
_____
Organic Compounds
Copper andChromrum
--___
_____
Copper-____
A-39
from some production units. However, there wereseveral drawbacks associated with reverse osmosistechnology. Some of the problems included disposal ofthe concentrate, limitation of available membranesand formation of a heavy, tarry material due tocaustic soda addition during neutralization.
Peroxide TreatmentThis method gave mixed results. Although it needs tobe studied further, no attempt to investigate thistechnology was made until November 1986.
C a r b o n A d s o r p t i o n
Based on the identification of Class A streams in theclassification system described previously, carbonpretreatment tests on Class A wastestreams werecompleted by September 1985. Activated carbon(adsorption) dosages as high as 200,000 mg/L wererequired to reduce TOC to acceptable levels. Thecarbon dosage required to obtain an LC5o value of 50percent or greater effluent in a batch reactor rangedfrom 10,000 to 50,000 mg/L. Investigations wereperformed on 12 Class A streams and significantreduction in effluent toxicity by carbon contact wasobserved.
Wet A i r O x i d a t i o n
Wet air oxidation also was examined. Significantreductions in toxicity improved biodegradability anda 98 percent TOC removal were observed in somewaste streams. A 4 0 f o l d i m p r o v e m e n t i nbiodegradability was observed in some cases.
Powdered Activated Carbon Treatment (PACT)
Based on bench, pilot and full scale end-of-pipetreatment studies, it was determined that the PACTtechnology was a technically and economicallyfeasible alternative. A carbon dosage of 100 mg/.L wasrequired (in the bench-scale units) to consistentlymeet an interim toxicity requirement (L&-J value 120 percent effluent) while a dosage of 250 mg/L wasnecessary to comply with the final toxicityrequirement (LC50 value 2 50 percent effluent).Bench scale results also indicated that a carbondosage of up to 500 mg/L may be required undercertain extreme influent conditions.
Winter conditions did not significantly affect toxicityreduction performance, but did decrease the organicremoval ef&iency.
The effect of hydraulic retention time (HRT) did notseem to impact treatment performance significantly.The system was operated at HRT’s of 2.1 days and 1.1days during optimization studies to evaluate the
effect of operating only one of the two existingaeration basins.
The investigation demonstrated the success offlocculent addition to remove color, and the success ofPAC addition to remove metals, chromium inparticular.
The toxicity reduction potential of the system seemedto be impaired when operated at solids retentiontimes of 15 days or less. Solids retention times (SRT)of between 30 days and 50 days achieved optimumtoxicity reduction. Operating the system at an SRToutside this range was found to increase effluenttoxicity. Addition of ferrous ion to the activatedsludge reactor was not found to reduce toxicity.Regeneration of powdered activated carbon was notfound to be attractive due to loss of adsorptivecapacity and loss of carbon in the process. Forequivalent results approximately twice as muchregenerated carbon was required than virgin carbon,Carbon losses of 20 to 25 percent were experienced inthe regeneration process under conditions requiredfor good quality carbon.
Granular Activated Carbon (GAC) AdsorptionInitially, carbon isotherms were constructed on fouralternate carbons: Calgon F-300, Calgon F-400, ICIHD-3000 and ICI HD-4000. Calgon F-300 wasselected for the GAC column operation based uponmuch superior toxicity reduction in the isothermtesting.
Initial column studies (up to September 1985)indicated that GAC was very effective in toxicityreduction and in removing soluble organiccompounds from the wastewater, particularly thehigh molecular weight and non-polar compounds.Moderately high adsorption capacities were observedfrom the operation of three GAC columns in seriesutilizing an LC50 of 50 percent as the breakthroughcriterion. Carbon usage rates were found to be withinacceptable ranges (1 gram carbon per 0.09 to 0.12 gTOC removed). Thermal regeneration of Calgon F-300 did not appreciably alter its effectiveness.
OzonationOzonation of the secondary effluent was also studiedduring the end-of-pipe treatment evaluation. Itinitially demonstrated some effectiveness butadditional testing revealed that it was not as effectivein reducing toxicity as other methods examined.Therefore, ozonation was abandoned as a feasibletreatment alternative.
Basis for Selection of Method
Based on success with bench, pilot and full-scalestudies, conversion of the existing biological system
A-40
to PACT using virgin carbon was the system ofchoice. The selection criteria of most significancewere in the cases of installation, performanceflexibility, and cost.
Follow-Up and ConfirmationSource reduction, source treatment and treatmentsystem optimization efforts were completed betweenSeptember 1984 and June 1986. The new treatmentmodifications were designed by June 1986 andinstalled by November 1986. Follow-up studies arepresently underway at the facility.
Problems EncounteredAlthough there appeared to be a relationshipbetween residual TOC and toxicity after biologicaland carbon treatment, it was not consistent from dayto day. Some days an LCso of 50 percent appeared tocorrespond to a TOC of 20 mg/L. Other days, it mightbe 10 mg/L or 40 mg/L.
During pilot plant studies for the PACT andbiological treatment systems it was observed (incarbon regeneration) that the best condition for TOCremoval was found to be the worst for carbon losses.
Results of toxicity testing for 22 Class D streamsfollowing biological treatment indicated that asynergistic effect may have existed which resulted inelevated toxicity.
Recommendations, Comments andConclusions
As a result of conducting the TRE, the TOC loadingin the treatment plant discharge was reduced by 23percent in 1985 as compared to 1984. This waslargely due to source treatment methods, processmodifications, wastestream treatment, and improvedhousekeeping. By 1985, as many as 27 Class Astreams were treated, of which eight were treated atthe source; five were precipitated to eliminate copperand chromium and 14 sulfide containing streamswere air oxidized to generate a less toxic effluent. Thedischarge in six wastestreams was entirelyeliminated during the same time.
A PACT system with a carbon dose of 250 mg/L wouldenable the company to comply with all dischargecriteria.
The final results of the TRE indicated that if wet airregeneration of powdered carbon was used, thedosage could well increase to as much as double thevirgin dose. Although ash accumulation is associatedwith it, it is believed it would be manageable, butcarbon loss would be excessive.
ReferenceWatkin, A. Evaluation of Biological Rate Parameters
and Inhibitory Effects in Activated Sludge. Ph.D.Thesis, Vanderbilt University (1986).
A-41
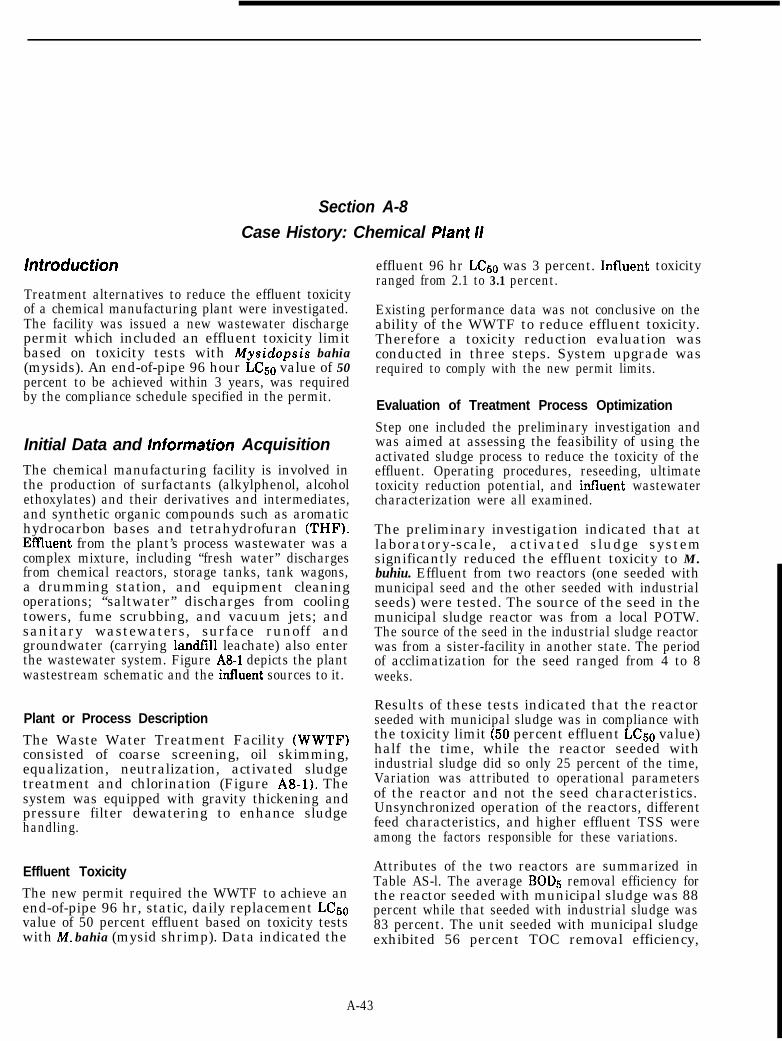
Section A-8Case History: Chemical P/ant /I
lntfoduction
Treatment alternatives to reduce the effluent toxicityof a chemical manufacturing plant were investigated.The facility was issued a new wastewater dischargepermit which included an effluent toxicity limitbased on toxicity tests with Mysidopsis bahia(mysids). An end-of-pipe 96 hour LC5o value of 50percent to be achieved within 3 years, was requiredby the compliance schedule specified in the permit.
Initial Data and information AcquisitionThe chemical manufacturing facility is involved inthe production of surfactants (alkylphenol, alcoholethoxylates) and their derivatives and intermediates,and synthetic organic compounds such as aromatichydrocarbon bases and tetrahydrofuran (THF).EfIluent from the plant’s process wastewater was acomplex mixture, including “fresh water” dischargesfrom chemical reactors, storage tanks, tank wagons,a drumming station, and equipment cleaningoperations; “saltwater” discharges from coolingtowers, fume scrubbing, and vacuum jets; andsanitary wastewaters, surface runoff andgroundwater (carrying landfill leachate) also enterthe wastewater system. Figure A8-1 depicts the plantwastestream schematic and the influent sources to it.
Plant or Process Description
The Waste Water Treatment Facility (WWTF)consisted of coarse screening, oil skimming,equalization, neutralization, activated sludgetreatment and chlorination (Figure A8-1). Thesystem was equipped with gravity thickening andpressure filter dewatering to enhance sludgehandling.
Effluent Toxicity
The new permit required the WWTF to achieve anend-of-pipe 96 hr, static, daily replacement LC5ovalue of 50 percent effluent based on toxicity testswith M. bahia (mysid shrimp). Data indicated the
effluent 96 hr LC50 was 3 percent. Influent toxicityranged from 2.1 to 3.1 percent.
Existing performance data was not conclusive on theability of the WWTF to reduce effluent toxicity.Therefore a toxicity reduction evaluation wasconducted in three steps. System upgrade wasrequired to comply with the new permit limits.
Evaluation of Treatment Process Optimization
Step one included the preliminary investigation andwas aimed at assessing the feasibility of using theactivated sludge process to reduce the toxicity of theeffluent. Operating procedures, reseeding, ultimatetoxicity reduction potential, and influent wastewatercharacterization were all examined.
The preliminary investigation indicated that atlaboratory-scale, activated sludge systemsignificantly reduced the effluent toxicity to M.buhiu. Effluent from two reactors (one seeded withmunicipal seed and the other seeded with industrialseeds) were tested. The source of the seed in themunicipal sludge reactor was from a local POTW.The source of the seed in the industrial sludge reactorwas from a sister-facility in another state. The periodof acclimatization for the seed ranged from 4 to 8weeks.
Results of these tests indicated that the reactorseeded with municipal sludge was in compliance withthe toxicity limit (50 percent effluent LC5o value)half the time, while the reactor seeded withindustrial sludge did so only 25 percent of the time,Variation was attributed to operational parametersof the reactor and not the seed characteristics.Unsynchronized operation of the reactors, differentfeed characteristics, and higher effluent TSS wereamong the factors responsible for these variations.
Attributes of the two reactors are summarized inTable AS-l. The average BOD5 removal efficiency forthe reactor seeded with municipal sludge was 88percent while that seeded with industrial sludge was83 percent. The unit seeded with municipal sludgeexhibited 56 percent TOC removal efficiency,
A-43
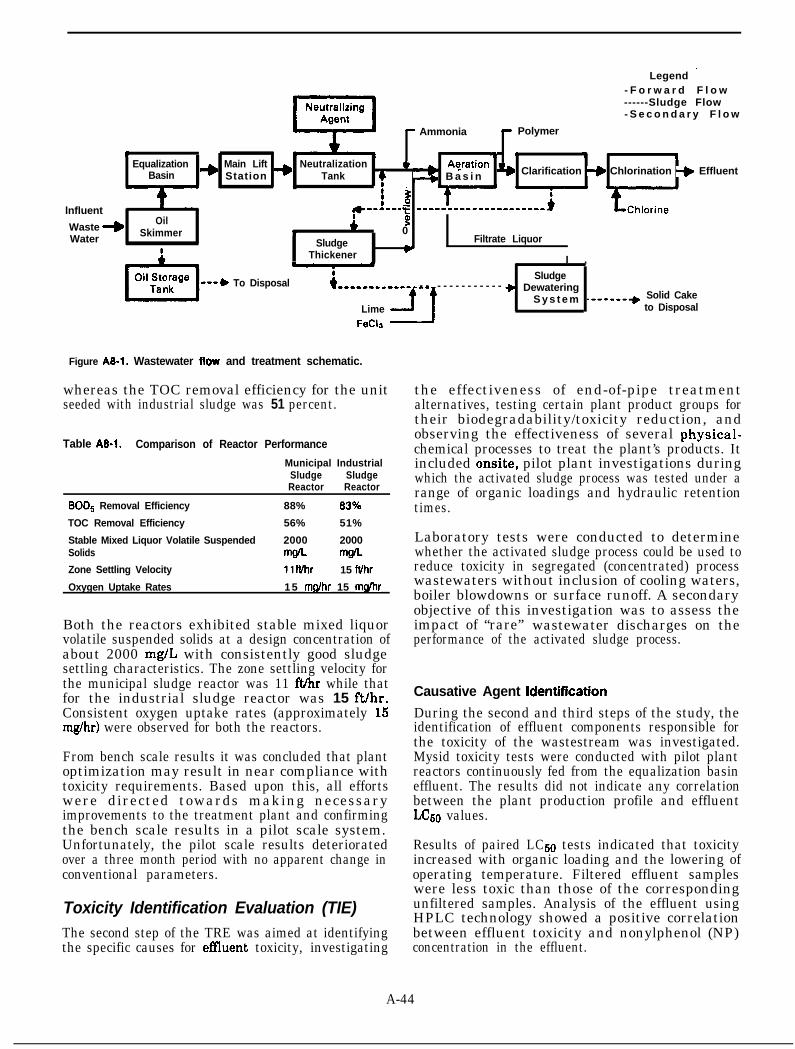
Legend .- F o r w a r d F l o w------Sludge Flow- S e c o n d a r y F l o w
- Ammonia - Polymer
b 4 * 9Equalization Main Lift
1
Basin + Station +Neutralization +
Tank 4 I) B a s i nA?ration 4
Clarification -(, Chlorination + Effluentl :
:i
lnfluent *--a--.+ ------------*--------
Waste +Oil I
& g0
Water Skimmer \Sludge Filtrate Liquor
# Thickener *
iI ,
I--+ To Disposal *Sludge
---a-------- - -
rt
- - - - - - - - - - - + DewateringS y s t e m -------* Solid Cake
Lime to Disposal
FeCl3
Figure AB-1. Wastewater ilow and treatment schematic.
whereas the TOC removal efficiency for the unitseeded with industrial sludge was 51 percent.
Table A8-1. Comparison of Reactor Performance
Municipal IndustrialSludge SludgeReactor Reactor
BOD, Removal Efficiency 88% 83‘Yo
TOC Removal Efficiency 56% 51%
Stable Mixed Liquor Volatile Suspended 2000 2000Solids mgrl meZone Settling Velocity llft/hr 15 ft/hr
Oxygen Uptake Rates 1 5 mg/hr 15 mlJhr
Both the reactors exhibited stable mixed liquorvolatile suspended solids at a design concentration ofabout 2000 mg/L with consistently good sludgesettling characteristics. The zone settling velocity forthe municipal sludge reactor was 11 ft(hr while thatfor the industrial sludge reactor was 15 ft/hr.Consistent oxygen uptake rates (approximately 15mg/hr) were observed for both the reactors.
From bench scale results it was concluded that plantoptimization may result in near compliance withtoxicity requirements. Based upon this, all effortswere directed towards making necessaryimprovements to the treatment plant and confirmingthe bench scale results in a pilot scale system.Unfortunately, the pilot scale results deterioratedover a three month period with no apparent change inconventional parameters.
Toxicity Identification Evaluation (TIE)The second step of the TRE was aimed at identifyingthe specific causes for eMuent toxicity, investigating
the effectiveness of end-of-pipe treatmentalternatives, testing certain plant product groups fortheir biodegradability/toxicity reduction, andobserving the effectiveness of several physical-chemical processes to treat the plant’s products. Itincluded onsite, pilot plant investigations duringwhich the activated sludge process was tested under arange of organic loadings and hydraulic retentiontimes.
Laboratory tests were conducted to determinewhether the activated sludge process could be used toreduce toxicity in segregated (concentrated) processwastewaters without inclusion of cooling waters,boiler blowdowns or surface runoff. A secondaryobjective of this investigation was to assess theimpact of “rare” wastewater discharges on theperformance of the activated sludge process.
Causative Agent Identification
During the second and third steps of the study, theidentification of effluent components responsible forthe toxicity of the wastestream was investigated.Mysid toxicity tests were conducted with pilot plantreactors continuously fed from the equalization basineffluent. The results did not indicate any correlationbetween the plant production profile and effluentL&O values.
Results of paired LC50 tests indicated that toxicityincreased with organic loading and the lowering ofoperating temperature. Filtered effluent sampleswere less toxic than those of the correspondingunfiltered samples. Analysis of the effluent usingHPLC technology showed a positive correlationbetween effluent toxicity and nonylphenol (NP)concentration in the effluent.
A-44
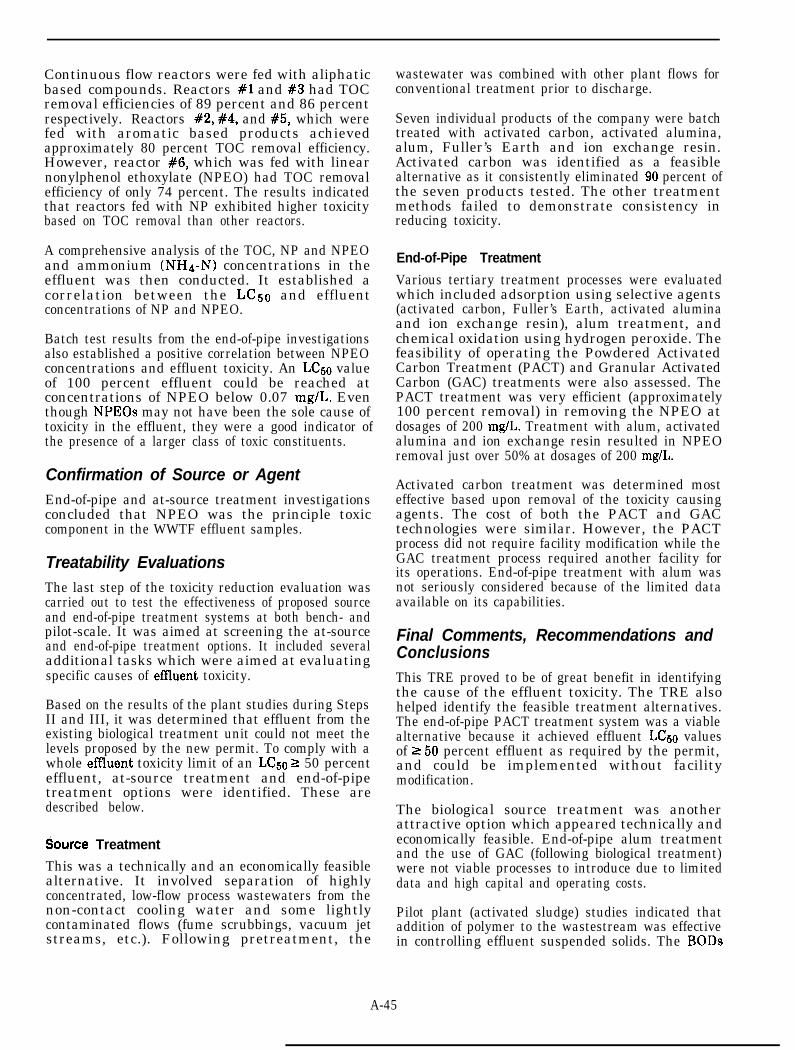
Continuous flow reactors were fed with aliphaticbased compounds. Reactors #l and #3 had TOCremoval efficiencies of 89 percent and 86 percentrespectively. Reactors #2, #4, and #5, which werefed with aromatic based products achievedapproximately 80 percent TOC removal efficiency.However, reactor #6, which was fed with linearnonylphenol ethoxylate (NPEO) had TOC removalefficiency of only 74 percent. The results indicatedthat reactors fed with NP exhibited higher toxicitybased on TOC removal than other reactors.
A comprehensive analysis of the TOC, NP and NPEOand ammonium (NH4-N) concentrations in theeffluent was then conducted. It established acorrelation between the LC50 and effluentconcentrations of NP and NPEO.
Batch test results from the end-of-pipe investigationsalso established a positive correlation between NPEOconcentrations and effluent toxicity. An LC50 valueof 100 percent effluent could be reached atconcentrations of NPEO below 0.07 mg/L. Eventhough NPEOs may not have been the sole cause oftoxicity in the effluent, they were a good indicator ofthe presence of a larger class of toxic constituents.
Confirmation of Source or AgentEnd-of-pipe and at-source treatment investigationsconcluded that NPEO was the principle toxiccomponent in the WWTF effluent samples.
Treatability EvaluationsThe last step of the toxicity reduction evaluation wascarried out to test the effectiveness of proposed sourceand end-of-pipe treatment systems at both bench- andpilot-scale. It was aimed at screening the at-sourceand end-of-pipe treatment options. It included severaladditional tasks which were aimed at evaluatingspecific causes of emuent toxicity.
Based on the results of the plant studies during StepsII and III, it was determined that effluent from theexisting biological treatment unit could not meet thelevels proposed by the new permit. To comply with awhole eflluent toxicity limit of an LC5o 2 50 percenteffluent, at-source treatment and end-of-pipetreatment options were identified. These aredescribed below.
dource Treatment
This was a technically and an economically feasiblealternative. It involved separation of highlyconcentrated, low-flow process wastewaters from thenon-contact cooling water and some lightlycontaminated flows (fume scrubbings, vacuum jetstreams, etc.). Following pretreatment, the
wastewater was combined with other plant flows forconventional treatment prior to discharge.
Seven individual products of the company were batchtreated with activated carbon, activated alumina,alum, Fuller’s Earth and ion exchange resin.Activated carbon was identified as a feasiblealternative as it consistently eliminated 90 percent ofthe seven products tested. The other treatmentmethods failed to demonstrate consistency inreducing toxicity.
End-of-Pipe Treatment
Various tertiary treatment processes were evaluatedwhich included adsorption using selective agents(activated carbon, Fuller’s Earth, activated aluminaand ion exchange resin), alum treatment, andchemical oxidation using hydrogen peroxide. Thefeasibility of operating the Powdered ActivatedCarbon Treatment (PACT) and Granular ActivatedCarbon (GAC) treatments were also assessed. ThePACT treatment was very efficient (approximately100 percent removal) in removing the NPEO atdosages of 200 mg/L. Treatment with alum, activatedalumina and ion exchange resin resulted in NPEOremoval just over 50% at dosages of 200 mg/L.
Activated carbon treatment was determined mosteffective based upon removal of the toxicity causingagents. The cost of both the PACT and GACtechnologies were similar. However, the PACTprocess did not require facility modification while theGAC treatment process required another facility forits operations. End-of-pipe treatment with alum wasnot seriously considered because of the limited dataavailable on its capabilities.
Final Comments, Recommendations andConclusionsThis TRE proved to be of great benefit in identifyingthe cause of the effluent toxicity. The TRE alsohelped identify the feasible treatment alternatives.The end-of-pipe PACT treatment system was a viablealternative because it achieved effluent LC50 valuesof 2 50 percent effluent as required by the permit,and could be implemented without facilitymodification.
The biological source treatment was anotherattractive option which appeared technically andeconomically feasible. End-of-pipe alum treatmentand the use of GAC (following biological treatment)were not viable processes to introduce due to limiteddata and high capital and operating costs.
Pilot plant (activated sludge) studies indicated thataddition of polymer to the wastestream was effectivein controlling effluent suspended solids. The BODs
A-45

and the TOC in each of the 6 reactors were incompliance with the new permit limits. Theconcentrations of phenol, surfactants (MBAS), oil andgrease also achieved permit limits.
A-46
Section A-9Case History: TRE of I.T.T. Effluent
introduction
The following is a description of the toxicityreduction evaluation (TRE) conducted at the I.T.T.Rayonier plant (Mount and Anderson-Carnahan,1986). I.T.T. Rayonier, Inc., located on the AmeliaRiver at Fernandina Beach, is one of Florida’s majorindustrial facilities. Figure A9-1 presents aschematic diagram of the processes in the I.T.T.Rayonier wastewater treatment system. In order toresolve outstanding NPDES permit issues associatedwith I.T.T.‘s effluent discharge, and to implement asite-specific application of EPA’s “Policy for theDevelopment of Water Quality-based PermitLimitations for Toxic Pollutants”, a number of issueswere studied at the I.T.T. plant. Toxicityidentification and reduction was an importantsegment of the study.
Initial Data and Information Acquisition
Plant Description
The I.T.T. plant manufactures chemical cellulose(pulp) from Southern pine by the sulfite process.EMuent control consists of red liquor evaporationand burning, primary, and secondary treatment(standard in the industry).
Characteristics of Effluent
Wastewater characteristics of the treated effluentduring May 14-21,1986 are presented in Table A9-1.
Toxicity Identification Evaluation (TIE)A preliminary effluent characterization wasperformed with effluent samples collected duringJuly 1985 and March 1986. An on-site study of theeMuent using two mobile toxicity test laboratorieswas performed during May 13-26,1986.
Data Collection and Methods
For the on-site study, grab and 24-hour timecornposited samples were collected from the aerationlagoon near the point of discharge. Table A9-2 showsa listing of the samples. These samples were coded
according to the date of collection (month/day) andthe number of the sample collected that day (I, II,III,..). Phased testing was conducted with thecollected effluent.
The physical and chemical properties of the effluenttoxicant were first isolated and characterizedusing a parallel series of tests. Each test wasdesigned to remove or render biologically unavailablea specific group of toxicants, such as oxidants,organics, metals, etc. Timed lethality tests usingCeriodaphnia were performed before and after thetest treatment to indicate the effectiveness of the test,and hence the nature of the toxicant( A series ofblanks and controls were used with each test toinsure that no toxic artifacts had been created duringsample manipulation. The variability of thecompounds causing toxicity was assessed byrepeating the toxicity characterization test seriesusing samples collected over a period of time. Boththe 48-hour LC50 value and average time it took tocause 50 percent lethality in Cerioduphnia were usedto measure the relative toxicity of the baselineeffluent. Other tests employed only timed lethalitytests to assess the change in toxicity. Five toxicantcharacterization tests were used in parallel duringthe study.
Filtration - This procedure is used to indicatewhether toxicants were associated with filterablematerials. Also, since the filtered effluent was usedin another characterization test, it was necessary toassess the effect of filtration on effluent toxicity.
Air-stripping - This is used to characterize thevolatility and oxidizability of causative toxicants. Byadjusting the pH of the effluent prior to stripping, theacidic or basic nature of the toxic compounds can alsobe assessed.
EDTA chelation - By adding increasing doses ofEDTA to aliquots of effluent, toxic cationic elements,like lead, copper, cadmium, nickel, zinc, etc. arecomplexed with an organic ligand to produce anontoxic form of the cation. The time to mortalityshould increase as the EDTA dose increases(provided that toxic levels of EDTA are avoided).
A-47
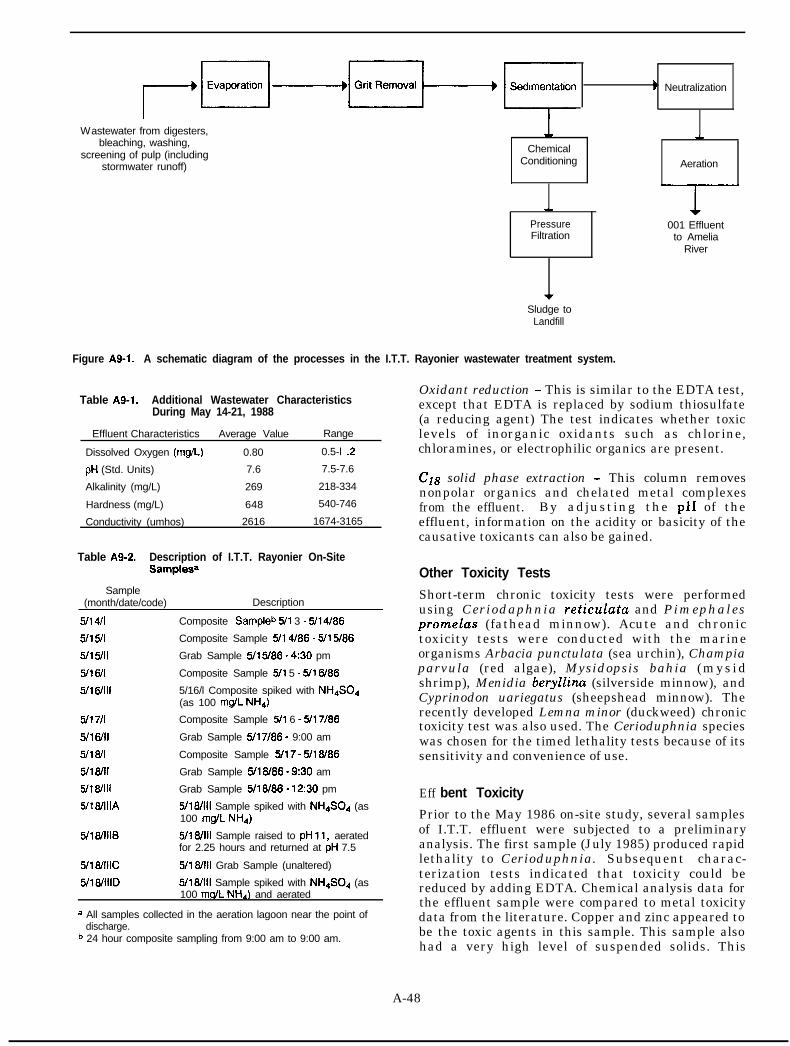
) Neutralization
Wastewater from digesters,bleaching, washing,
screening of pulp (includingstormwater runoff)
-
ChemicalConditioning
*
Aeration
*’
PressureFiltration
001 Effluentto Amelia
River
vSludge to
Landfill
Figure A9-1. A schematic diagram of the processes in the I.T.T. Rayonier wastewater treatment system.
Table A9-1. Additional Wastewater CharacteristicsDuring May 14-21, 1988
Effluent Characteristics Average Value Range
Dissolved Oxygen (mg/L) 0.80 0.5-l .2
pti (Std. Units) 7.6 7.5-7.6
Alkalinity (mg/L) 269 218-334
Hardness (mg/L) 648 540-746
Conductivity (umhos) 2616 1674-3165
Table A9-2. Description of I.T.T. Rayonier On-SiteSamplesa
Sample(month/date/code) Description
5/l 4/l Composite Sampleb 5/l 3 - 5/14/86
5/l 5/I Composite Sample 5/l 4186 - 5/l 5/86
5/l YII Grab Sample 5/15/86 - 4:30 pm
5/l 6/l Composite Sample 5/l 5 - 5/l 6186
5/l 6/ill 5/16/l Composite spiked with NH,S04(as 100 m@L NH4)
5/l 7/I Composite Sample 5/l 6 - 5/l 7/86
5/16/ll Grab Sample 5/17/86 - 9:00 am
5/l 8/l Composite Sample 5/17 - 5/18/86
5/l 8/ll Grab Sample 5/18/86 - 9:30 am
5/l 8/ill Grab Sample 5/18/86 - 12:30 pm
5/l 8/lllA 5/18/ill Sample spiked with NH4S04 (as100 mg/L NH4)
5/l 8/lllB 5/l 8/ill Sample raised to pH 11, aeratedfor 2.25 hours and returned at pH 7.5
5/l 8/lllC 5/l 8/M Grab Sample (unaltered)
5/18/lllD 5/18/ill Sample spiked with NH4S04 (as100 mg/L NHd) and aerated
a All samples collected in the aeration lagoon near the point ofdischarge.
b 24 hour composite sampling from 9:00 am to 9:00 am.
Oxidant reduction - This is similar to the EDTA test,except that EDTA is replaced by sodium thiosulfate(a reducing agent) The test indicates whether toxiclevels of inorganic oxidants such as chlorine,chloramines, or electrophilic organics are present.
Cl8 solid phase extraction - This column removesnonpolar organics and chelated metal complexesfrom the effluent. By adjusting the pH of theeffluent, information on the acidity or basicity of thecausative toxicants can also be gained.
Other Toxicity Tests
Short-term chronic toxicity tests were performedusing Ceriodaphnia reticulata and Pimephalesprone& (fathead minnow). Acute and chronictoxicity tests were conducted with the marineorganisms Arbacia punctulata (sea urchin), Champiaparvula (red algae), Mysidopsis bahia (mysidshrimp), Menidia beryllina (silverside minnow), andCyprinodon uariegatus (sheepshead minnow). Therecently developed Lemna minor (duckweed) chronictoxicity test was also used. The Cerioduphnia specieswas chosen for the timed lethality tests because of itssensitivity and convenience of use.
Eff bent ToxicityPrior to the May 1986 on-site study, several samplesof I.T.T. effluent were subjected to a preliminaryanalysis. The first sample (July 1985) produced rapidlethality to Cerioduphnia. Subsequent charac-terization tests indicated that toxicity could bereduced by adding EDTA. Chemical analysis data forthe effluent sample were compared to metal toxicitydata from the literature. Copper and zinc appeared tobe the toxic agents in this sample. This sample alsohad a very high level of suspended solids. This
A-48
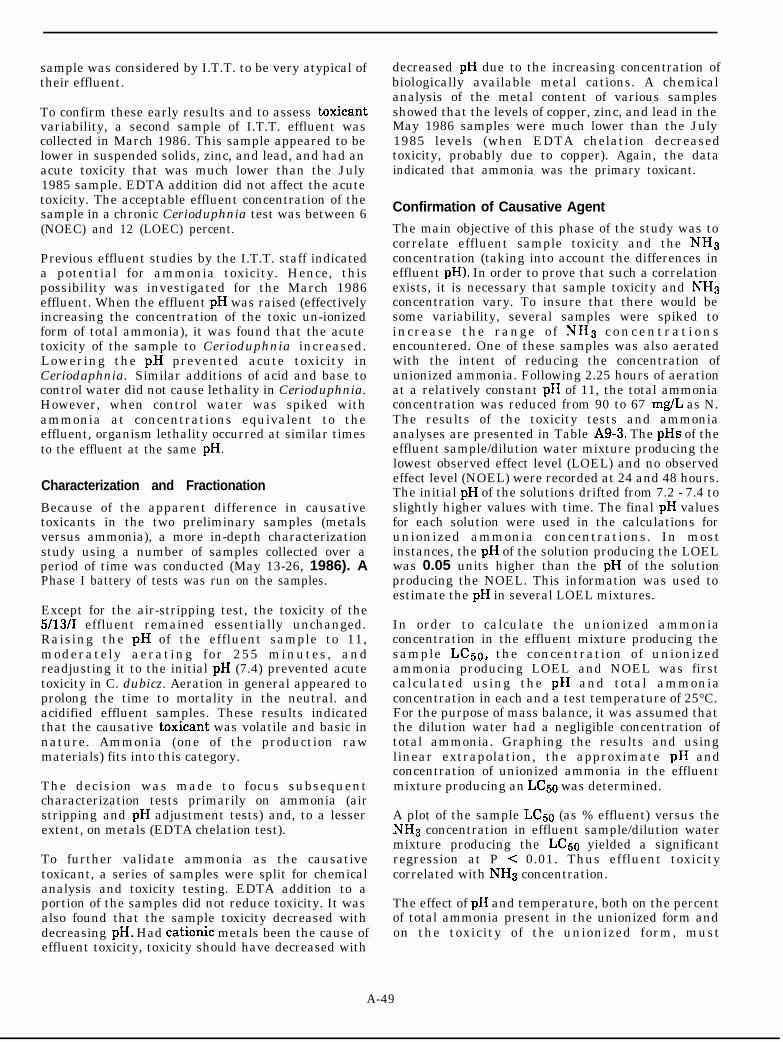
sample was considered by I.T.T. to be very atypical oftheir effluent.
To confirm these early results and to assess toxicantvariability, a second sample of I.T.T. effluent wascollected in March 1986. This sample appeared to belower in suspended solids, zinc, and lead, and had anacute toxicity that was much lower than the July1985 sample. EDTA addition did not affect the acutetoxicity. The acceptable effluent concentration of thesample in a chronic Cerioduphnia test was between 6(NOEC) and 12 (LOEC) percent.
Previous effluent studies by the I.T.T. staff indicateda potential for ammonia toxicity. Hence, thispossibility was investigated for the March 1986effluent. When the effluent pH was raised (effectivelyincreasing the concentration of the toxic un-ionizedform of total ammonia), it was found that the acutetoxicity of the sample to Cerioduphnia increased.Lowering the pH prevented acute toxicity inCeriodaphnia. Similar additions of acid and base tocontrol water did not cause lethality in Cerioduphnia.However, when control water was spiked withammonia at concentrations equivalent to theeffluent, organism lethality occurred at similar timesto the effluent at the same pH.
Characterization and Fractionation
Because of the apparent difference in causativetoxicants in the two preliminary samples (metalsversus ammonia), a more in-depth characterizationstudy using a number of samples collected over aperiod of time was conducted (May 13-26, 1986). APhase I battery of tests was run on the samples.
Except for the air-stripping test, the toxicity of the5/13/I effluent remained essentially unchanged.Raising the pH of the effluent sample to 11,moderately aerating for 255 minutes, andreadjusting it to the initial pH (7.4) prevented acutetoxicity in C. dubicz. Aeration in general appeared toprolong the time to mortality in the neutral. andacidified effluent samples. These results indicatedthat the causative toxicant was volatile and basic innature. Ammonia (one of the production rawmaterials) fits into this category.
The decision was made to focus subsequentcharacterization tests primarily on ammonia (airstripping and pH adjustment tests) and, to a lesserextent, on metals (EDTA chelation test).
To further validate ammonia as the causativetoxicant, a series of samples were split for chemicalanalysis and toxicity testing. EDTA addition to aportion of the samples did not reduce toxicity. It wasalso found that the sample toxicity decreased withdecreasing pH. Had cationic metals been the cause ofeffluent toxicity, toxicity should have decreased with
decreased pH due to the increasing concentration ofbiologically available metal cations. A chemicalanalysis of the metal content of various samplesshowed that the levels of copper, zinc, and lead in theMay 1986 samples were much lower than the July1985 levels (when EDTA chelation decreasedtoxicity, probably due to copper). Again, the dataindicated that ammonia was the primary toxicant.
Confirmation of Causative AgentThe main objective of this phase of the study was tocorrelate effluent sample toxicity and the NH3concentration (taking into account the differences ineffluent pH). In order to prove that such a correlationexists, it is necessary that sample toxicity and NH3concentration vary. To insure that there would besome variability, several samples were spiked toincrease the range of NH3 c o n c e n t r a t i o n sencountered. One of these samples was also aeratedwith the intent of reducing the concentration ofunionized ammonia. Following 2.25 hours of aerationat a relatively constant pH of 11, the total ammoniaconcentration was reduced from 90 to 67 mg/L as N.The results of the toxicity tests and ammoniaanalyses are presented in Table A9-3. The pHs of theeffluent sample/dilution water mixture producing thelowest observed effect level (LOEL) and no observedeffect level (NOEL) were recorded at 24 and 48 hours.The initial pH of the solutions drifted from 7.2 - 7.4 toslightly higher values with time. The final pH valuesfor each solution were used in the calculations forunionized ammonia concentrations. In mostinstances, the pH of the solution producing the LOELwas 0.05 units higher than the pH of the solutionproducing the NOEL. This information was used toestimate the pH in several LOEL mixtures.
In order to calculate the unionized ammoniaconcentration in the effluent mixture producing thesample LCso, the concentration of unionizedammonia producing LOEL and NOEL was firstcalculated using the pH and total ammoniaconcentration in each and a test temperature of 25°C.For the purpose of mass balance, it was assumed thatthe dilution water had a negligible concentration oftotal ammonia. Graphing the results and usinglinear extrapolation, the approximate pH andconcentration of unionized ammonia in the effluentmixture producing an LCso was determined.
A plot of the sample LC5o (as % effluent) versus theNH3 concentration in effluent sample/dilution watermixture producing the LCso yielded a significantregression at P < 0.01. Thus effluent toxicitycorrelated with NH3 concentration.
The effect of pH and temperature, both on the percentof total ammonia present in the unionized form andon the toxicity of the unionized form, must
A-49
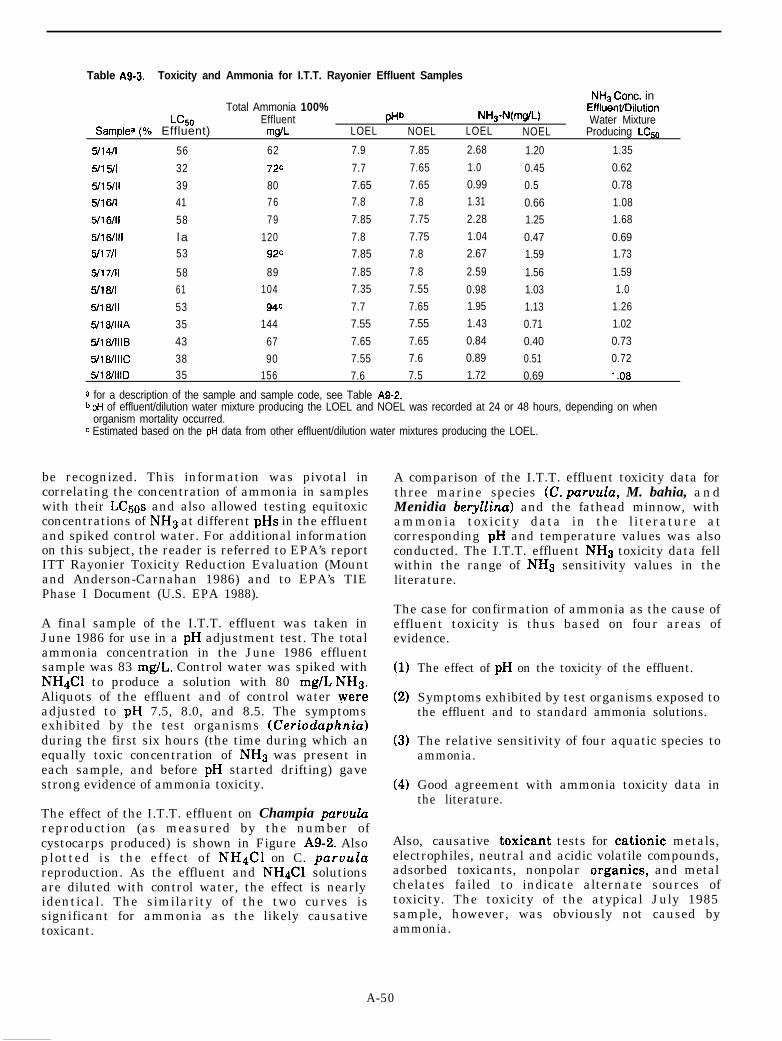
Table A9-3. Toxicity and Ammonia for I.T.T. Rayonier Effluent Samples
NH, Cont. inTotal Ammonia 100% Efflu&d/Dilution
GOGO Effluent pHb NH3-N(mg/L) Water MixtureSamplea (% Effluent) mg/L LOEL NOEL LOEL NOEL Producing LCso
5/l 4/i 56 62 7.9 7.85 2.68 1.20 1.35
5/l 5/l 32 72C 7.7 7.65 1.0 0.45 0.62
5/l 5/U 39 80 7.65 7.65 0.99 0.5 0.78
5/l 6/l 41 76 7.8 7.8 1.31 0.66 1.08
5/l 6/ll 58 79 7.85 7.75 2.28 1.25 1.68
5/l 6/M l a 120 7.8 7.75 1.04 0.47 0.695/l 7/l 53 92c 7.85 7.8 2.67 1.59 1.73
5/l 7/ll 58 89 7.85 7.8 2.59 1.56 1.59
5/l 8/l 61 104 7.35 7.55 0.98 1.03 1.0
5/l a/II 53 94c 7.7 7.65 1.95 1.13 1.26
5/l 8/lllA 35 144 7.55 7.55 1.43 0.71 1.02
5/l 8/lllB 43 67 7.65 7.65 0.84 0.40 0.73
5/l 8/lllC 38 90 7.55 7.6 0.89 0.51 0.725/l 8/lllD 35 156 7.6 7.5 1.72 0.69 I .oa
a for a description of the sample and sample code, see Table A9-2.b pH of effluent/dilution water mixture producing the LOEL and NOEL was recorded at 24 or 48 hours, depending on when
organism mortality occurred.c Estimated based on the pH data from other effluent/dilution water mixtures producing the LOEL.
be recognized. This information was pivotal incorrelating the concentration of ammonia in sampleswith their LC5os and also allowed testing equitoxicconcentrations of NH3 at different pHs in the effluentand spiked control water. For additional informationon this subject, the reader is referred to EPA’s reportITT Rayonier Toxicity Reduction Evaluation (Mountand Anderson-Carnahan 1986) and to EPA’s TIEPhase I Document (U.S. EPA 1988).
A final sample of the I.T.T. effluent was taken inJune 1986 for use in a pH adjustment test. The totalammonia concentration in the June 1986 effluentsample was 83 mg/L. Control water was spiked withNHdCl to produce a solution with 80 mg/L NH3.Aliquots of the effluent and of control water wereadjusted to pH 7.5, 8.0, and 8.5. The symptomsexhibited by the test organisms (Cerioduphnia)during the first six hours (the time during which anequally toxic concentration of NH3 was present ineach sample, and before pH started drifting) gavestrong evidence of ammonia toxicity.
The effect of the I.T.T. effluent on Champia paruulureproduction (as measured by the number ofcystocarps produced) is shown in Figure A9-2. Alsoplotted is the effect of NH&l on C. paruulareproduction. As the effluent and NH&l solutionsare diluted with control water, the effect is nearlyidentical. The similarity of the two curves issignificant for ammonia as the likely causativetoxicant.
A comparison of the I.T.T. effluent toxicity data forthree marine species (C. paruula, M. bahia, andMenidia beryllina) and the fathead minnow, withammonia toxicity data in the literature atcorresponding pH and temperature values was alsoconducted. The I.T.T. effluent NH3 toxicity data fellwithin the range of NH3 sensitivity values in theliterature.
The case for confirmation of ammonia as the cause ofeffluent toxicity is thus based on four areas ofevidence.
(1)
(2)
(3)
(4)
The effect of pH on the toxicity of the effluent.
Symptoms exhibited by test organisms exposed tothe effluent and to standard ammonia solutions.
The relative sensitivity of four aquatic species toammonia.
Good agreement with ammonia toxicity data inthe literature.
Also, causative toxicant tests for cationic metals,electrophiles, neutral and acidic volatile compounds,adsorbed toxicants, nonpolar organics, and metalchelates failed to indicate alternate sources oftoxicity. The toxicity of the atypical July 1985sample, however, was obviously not caused byammonia.
A-50
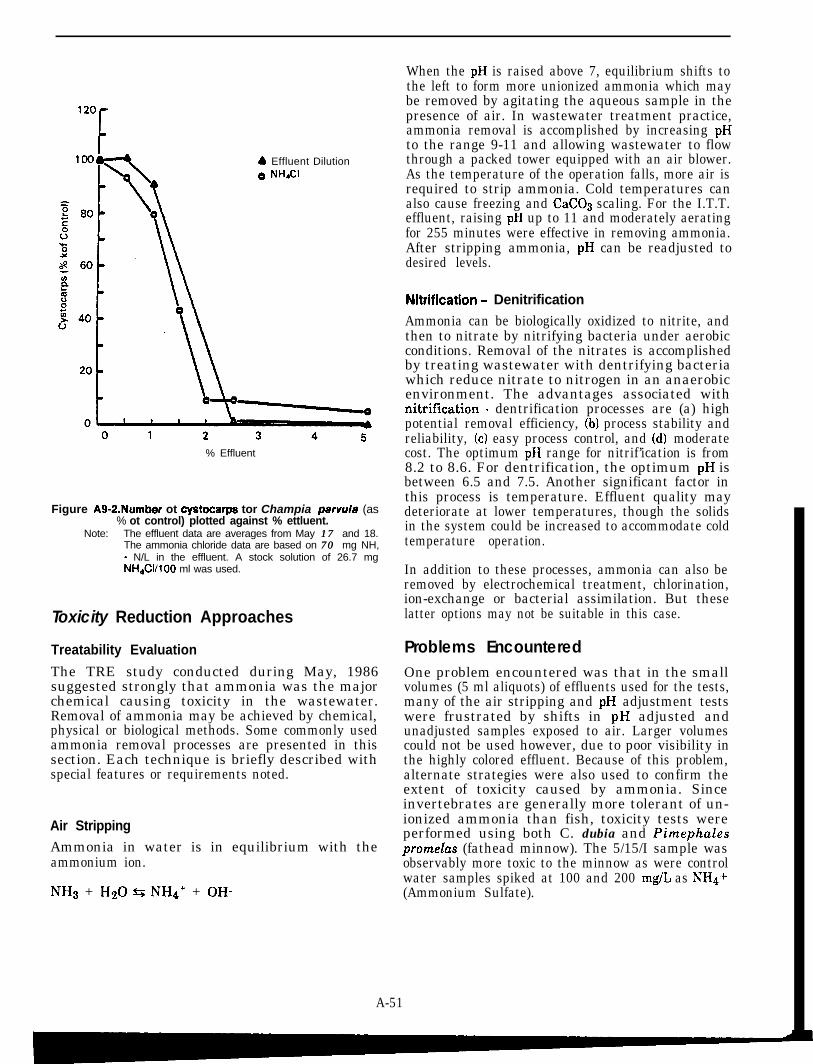
4 Effluent Dilution
% Effluent
Figure AS-2.Number ot cystocarps tor Champia parvula (as% ot control) plotted against % ettluent.
Note: The effluent data are averages from May 17 17 and 18.The ammonia chloride data are based on 70 70 mg NH,- N/L in the effluent. A stock solution of 26.7 mgNH&I/100 ml was used.
Toxicity Reduction Approaches
Treatability Evaluation Problems EncounteredThe TRE study conducted during May, 1986suggested strongly that ammonia was the majorchemical causing toxicity in the wastewater.Removal of ammonia may be achieved by chemical,physical or biological methods. Some commonly usedammonia removal processes are presented in thissection. Each technique is briefly described withspecial features or requirements noted.
One problem encountered was that in the smallvolumes (5 ml aliquots) of effluents used for the tests,many of the air stripping and pH adjustment testswere frustrated by shifts in pH adjusted andunadjusted samples exposed to air. Larger volumescould not be used however, due to poor visibility inthe highly colored effluent. Because of this problem,alternate strategies were also used to confirm theextent of toxicity caused by ammonia. Sinceinvertebrates are generally more tolerant of un-ionized ammonia than fish, toxicity tests wereperformed using both C. dubia and PimephaZespromelas (fathead minnow). The 5/15/I sample wasobservably more toxic to the minnow as were controlwater samples spiked at 100 and 200 mg/L as NH4+(Ammonium Sulfate).
Air StrippingAmmonia in water is in equilibrium with theammonium ion.
NH3 + Hz0 G NH4+ + OH-
When the pH is raised above 7, equilibrium shifts tothe left to form more unionized ammonia which maybe removed by agitating the aqueous sample in thepresence of air. In wastewater treatment practice,ammonia removal is accomplished by increasing pHto the range 9-11 and allowing wastewater to flowthrough a packed tower equipped with an air blower.As the temperature of the operation falls, more air isrequired to strip ammonia. Cold temperatures canalso cause freezing and CaC03 scaling. For the I.T.T.effluent, raising pH up to 11 and moderately aeratingfor 255 minutes were effective in removing ammonia.After stripping ammonia, pH can be readjusted todesired levels.
Nitrification - DenitrificationAmmonia can be biologically oxidized to nitrite, andthen to nitrate by nitrifying bacteria under aerobicconditions. Removal of the nitrates is accomplishedby treating wastewater with dentrifying bacteriawhich reduce nitrate to nitrogen in an anaerobicenvironment. The advantages associated withnitrification - dentrification processes are (a) highpotential removal efficiency, (b) process stability andreliability, (cl easy process control, and (d) moderatecost. The optimum pH range for nitrif’ication is from8.2 to 8.6. For dentrification, the optimum pH isbetween 6.5 and 7.5. Another significant factor inthis process is temperature. Effluent quality maydeteriorate at lower temperatures, though the solidsin the system could be increased to accommodate coldtemperature operation.
In addition to these processes, ammonia can also beremoved by electrochemical treatment, chlorination,ion-exchange or bacterial assimilation. But theselatter options may not be suitable in this case.
A-51

ReferencesMount, D.I. and L. Anderson-Carnahan. “ITT
Rayonier Toxicity Reduction Evaluation.” U.S.Environmental Protection Agency Internal ORDReport, October 1986.
U.S. Environmental Protection Agency. “Methods forAquatic Toxicity Identification Evaluations: PhaseI - Toxicity Characterization Procedures,” SecondDraft dated June 1988.
A-52
Section A-1 0
Case History: Monsanto Chemical Manufacturing Facility
introduction
Monsanto’s Environmental Science Center (ESC) hasdeveloped, tested and refined a ToxicityIdentification Evaluation (TIE) protocol which hasbeen used successfully to identify toxic compounds inseveral wastestreams (Doi and Grothe 1987). Ingeneral the procedure uses both chemical (cation andanion resins) and physical (helium spargingfiltration) separation to divide an effluent intoinorganic and organic fractions. The procedure isfollowed by toxicity testing of each fraction in order toidentify and eventually abate the source of toxicity.Once toxic constituents are known, remedialactivities can be planned.
Effluents from three chemical manufacturing plantsites were used to evaluate the utility of the protocol.Three effluents were selected based on the results ofacute toxicity tests conducted on Duphnia magna,which indicated an EC50 of less than 100 percent.Each effluent came from an individual site (dubbedsites 1,2, and 3 in this study).
Initial Data and Information Acquisition
Site 11
The wastewater at this site was a relatively complexmixture which contained a number of organic andinorganic constituents. The team was also aware ofthe fact that the wastewater had a relatively hightotal ammonia content (100 - 300 mg/L). Although ithad been speculated that ammonia may beresponsible for the wastewater toxicity to D. mugnu,earlier investigations failed to show that ammoniawas responsible for the toxicity of this wastewater.
Site 2
The wastestream at Site 2 was comprised of fourstormwater and/or cooling water inputs. The effluentbeing investigated was known to contain hexavalentchromium, chlorine, and biocide, which were used toprevent corrosion and growth of algae and microbesin the piping system.
Historical toxicity data collected in 1985 indicatedthat the final effluent was toxic to D. magna. It wasspeculated that hexavalent chromium could beresponsible for the effluent’s toxicity since theconcentrations of hexavalent chromium in thewastewater (100 - 200 ppb) were comparable to acuteeffect levels (20 - 212 ppb) reported in the literaturefor D. magna. No information was available on theacute toxicity of the biocide.
Site 3
The effluent at Site No. 3 was a complex chemicalmixture containing a number of inorganic andorganic substances. Operation reports showed theeffluent to have a very high conductivity (10,000 to25,000 micro mhos/cm). The existing levels ofcalcium (300 mg/L), sodium (1020 mg/L) and chloride(7310 mg/L) ions were associated with the highconductivity.
Toxicity tests have been performed on the effluentwith the fathead minnow since the mid-1970’s forinhouse and regulatory compliance purposes. Theresults of these tests indicated that the 96 hour LC5owas typically between 45 percent and 80 percent. Thetoxicity of the effluent was speculated by a number ofinvestigators to be associated with the high salinityof the wastewater.
Toxicity /den tifica tion Evaluation (Tl E)The main objective was to isolate and identify thefactors contributing to effluent toxicity. In order toachieve this, ESC employed the testing schemeillustrated in Figure A10-1 (based on concepts ofWalsh and Garnas (1983)) which utilized the ion-exchange resin technology to fractionate the effluentmixture into organic and inorganic constituents.Once the effluent mixture was separated intofractions, their potential toxicity was determined bysubjection to selected aquatic species. Additionalfractionation of the organic and inorganicconstituents would be necessary if either fraction wasfound toxic to the test species.
Besides conducting toxicity tests on each of thefractions, TOC (total organic carbon) and ICP
A-53
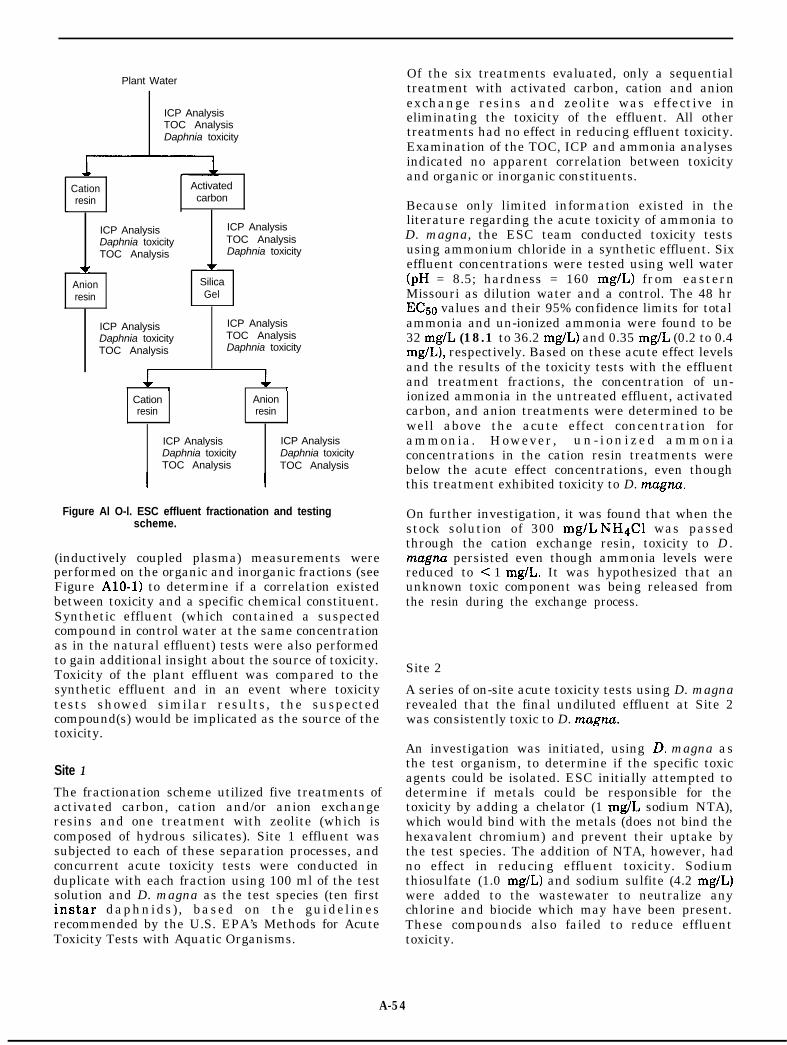
Plant Water
ICP AnalysisTOC AnalysisDaphnia toxicity
Cation Activatedresin carbon
L
ICP Analysis ICP AnalysisDaphnia toxicity TOC AnalysisTOC Analysis Daphnia toxicity
V w
Anion Silicaresin Gel
ICP AnalysisDaphnia toxicityTOC Analysis
ICP AnalysisTOC AnalysisDaphnia toxicity
, 7Cation Anionresin resin
ICP Analysis ICP AnalysisDaphnia toxicity Daphnia toxicityTOC Analysis TOC Analysis
I I
Figure Al O-l. ESC effluent fractionation and testingscheme.
(inductively coupled plasma) measurements wereperformed on the organic and inorganic fractions (seeFigure A10-1) to determine if a correlation existedbetween toxicity and a specific chemical constituent.Synthetic effluent (which contained a suspectedcompound in control water at the same concentrationas in the natural effluent) tests were also performedto gain additional insight about the source of toxicity.Toxicity of the plant effluent was compared to thesynthetic effluent and in an event where toxicitytests showed similar results, the suspectedcompound(s) would be implicated as the source of thetoxicity.
Site 11
The fractionation scheme utilized five treatments ofactivated carbon, cation and/or anion exchangeresins and one treatment with zeolite (which iscomposed of hydrous silicates). Site 1 effluent wassubjected to each of these separation processes, andconcurrent acute toxicity tests were conducted induplicate with each fraction using 100 ml of the testsolution and D. magna as the test species (ten firstinstar daphnids), based on the guidelinesrecommended by the U.S. EPA’s Methods for AcuteToxicity Tests with Aquatic Organisms.
Of the six treatments evaluated, only a sequentialtreatment with activated carbon, cation and anionexchange resins and zeolite was effective ineliminating the toxicity of the effluent. All othertreatments had no effect in reducing effluent toxicity.Examination of the TOC, ICP and ammonia analysesindicated no apparent correlation between toxicityand organic or inorganic constituents.
Because only limited information existed in theliterature regarding the acute toxicity of ammonia toD. magna, the ESC team conducted toxicity testsusing ammonium chloride in a synthetic effluent. Sixeffluent concentrations were tested using well water(pH = 8.5; hardness = 160 mg/L) from easternMissouri as dilution water and a control. The 48 hrE&o values and their 95% confidence limits for totalammonia and un-ionized ammonia were found to be32 mg/L (18.1 to 36.2 mg/L) and 0.35 mg/L (0.2 to 0.4mg/L), respectively. Based on these acute effect levelsand the results of the toxicity tests with the effluentand treatment fractions, the concentration of un-ionized ammonia in the untreated effluent, activatedcarbon, and anion treatments were determined to bewell above the acute effect concentration forammonia. However, u n - i o n i z e d a m m o n i aconcentrations in the cation resin treatments werebelow the acute effect concentrations, even thoughthis treatment exhibited toxicity to D. magna
On further investigation, it was found that when thestock solution of 300 mg/L NH4Cl was passedthrough the cation exchange resin, toxicity to D.magna persisted even though ammonia levels werereduced to c 1 mg/L. It was hypothesized that anunknown toxic component was being released fromthe resin during the exchange process.
Site 2
A series of on-site acute toxicity tests using D. magnarevealed that the final undiluted effluent at Site 2was consistently toxic to D. magna.
An investigation was initiated, using D. magna asthe test organism, to determine if the specific toxicagents could be isolated. ESC initially attempted todetermine if metals could be responsible for thetoxicity by adding a chelator (1 mg/L sodium NTA),which would bind with the metals (does not bind thehexavalent chromium) and prevent their uptake bythe test species. The addition of NTA, however, hadno effect in reducing effluent toxicity. Sodiumthiosulfate (1.0 mg/L) and sodium sulfite (4.2 mg/L)were added to the wastewater to neutralize anychlorine and biocide which may have been present.These compounds also failed to reduce effluenttoxicity.
A-54
D. mugnu toxicity tests, ICP, TOC and hexavalentchromium analyses were also conducted at variouslocations along the wastewater drainage system inan attempt to determine if a source of toxic agentcould be identified. Although no correlation wasfound between toxicity and the TOC and ICP results,a correlation was found between hexavalentchromium levels and toxicity. The results illustratedthat the most upstream sample (sampling point A)had the lowest concentration of hexavalentchromium (29 ppb) and exhibited the least acutetoxicity to D. magna (48 EC50 = 80 percent effluent).On the other hand, samples collected at samplingpoint B and other locations along the wastestreamexhibited increases in both effluent toxicity andhexavalent chromium levels. Final untreatedeffluent (containing 241 ppb of hexavalentchromium) produced 100 percent mortality within 48hours.
Once this relationship was observed, the ESC teamfractioned the wastewater by passing 200 mlsubsamples of the effluent through granularactivated carbon, cation and anion exchange resins.They then evaluated the wastewater for acutetoxicity to D. magna. The team also monitored thehexavalent chromium concentrations prior to andafter each treatment to establish a correlationbetween toxicity and hexavalent chromium. Theresults of these studies indicated that there was adirect correlation between hexavalent chromium andtoxicity to D. magna.
Treatment of the wastewater with anion exchangeresin and activated carbon, resulted in no mortalityto D. magna. The concentrations of hexavalentchromium in these treatments were 10 ppb (anionresins) and 20 ppb (activated carbon resin), which arebelow or near the lowest reported acute level forDaphnia. The cation resin failed to lower theconcentration of hexavalent chromium (210 ppb).This treatment provides further evidence thathexavalent chromium was likely responsible forwastewater toxicity.
To confirm whether the acute toxicity originallyobserved in the final effluent at Site No. 2 was due tohexavalent chromium, ESC plotted and analyzeddose-response curves for effluent and hexavalentchromium (synthetic effluent) toxicity tests. The 48hour EC!50 for hexavalent chromium concentrationsin the effluent (35 ppb) was compared to the 48 hourEC50 (41 ppb) for the hexavalent chromium in thesynthetic effluent. The similarities between thesetwo concentrations supported the hypothesis thathexavalent chromium was likely responsible for theobserved toxicity. Further confirmation of chromiumas the toxic component was supported by the fact thatwhen the plant stopped using hexavalent chromium,the wastewater became nontoxic.
Site 3
To determine if salinity could be responsible for SiteNo. 3 effluent’s toxicity ESC conducted a comparativeacute toxicity study by subjecting fathead minnowsto the final effluent (from the plant discharge) and asynthetic effluent (a solution of sodium chloride,calcium chloride and well water). The concentrationsof Na, Ca and chloride were similar to thoseoccurring in the natural effluent (Na = 1020 mg/L,Ca = 3000 mg/L, Cl = 7310 mg/L). The results of thiscomparative study indicated that salinity could beresponsible for the toxicity of the effluent sinceessentially identical 96 hr LCse values were observedfor the natural effluent (LC50 = 79 percent) andsynthetic effluent (LC5o = 70 percent).
ESC then conducted fractionation tests on effluentsamples to verify the causative agents by passingeffluent over four separate resins (granular activatedcarbon, cation exchange resin, anion exchange resinand cation followed by anion exchange resin). D.magna acute toxicity tests conducted before and afterresin treatment indicated that neither the activatedcarbon, nor cation/anion exchange resins couldeliminate effluent toxicity. No correlation existedbetween toxicity and TOC. However, a correlation didexist between toxicity and calcium and/or chlorideion concentrations since the concentrations ofcalcium and chloride in the final effluent, activatedcarbon, and anion exchange resin treatments werewell above the acute toxicity concentrations for D.magna.
The fact that calcium was one of the toxic componentsin the effluent was further verified by a comparisonof the calcium concentration in the effluent andcorresponding dose response curve to reported effectlevels (Rodgers, et al. 1987) for calcium in fatheadminnows (96 hr L&o values = 2766 mg/L). Based onthe test data, the 96 hour LC5e for the naturaleffluent was 79 percent. The calcium concentration inthe 100 percent effluent was 3000 mg/L with apredicted nominal calcium content in the 79 percenteffluent of 2400 mg/L indicating a correlationbetween calcium concentration and toxicity.
Additional synthetic and natural effluent toxicitytests were conducted to verify calcium and chlorideions as the toxic components. Approximately one-halfof these tests showed a strong correlation between thesynthetic and final effluents. The fact that nocorrelation was observed between some of the testsindicated that another factor(s) may at times beresponsible for the toxicity of the effluent.
ESC confirmed that calcium and chloride ions werethe sources of toxicity to D. magna in the effluent bypreparing a synthetic effluent which contained (only)calcium, sodium and chloride ions and compared the
A-55
dose response curves of the tests with dose responsecurves using the final effluent which contained thesame concentrations of calcium, chloride and sodiumions. A distinct relationship was observed in thesetest results and this in effect established andconfirmed that calcium and chloride ions wereprincipally responsible for the effluent toxicity.
Toxicity Reduction Approaches
Site 1
The final effluent from Site 1 was evaluated for acutetoxicity to D. magna after passing the effluentthrough granular activated carbon, cation and anionresin, combination treatment and the zeolitetreatment. The absence of mortality in the treatedfinal effluent showed that the concentration ofammonia was reduced to below the acute toxicitythreshold.
Site 2
The toxicity of the original effluent to D. magna waseliminated through treatment of the effluent withactivated carbon and anion exchange resin. Thesetechniques in effect reduced the concentration ofhexavalent chromium which was responsible for theeffluent toxicity. ESC also examined other treatmentmethods such as cation exchange resin. However,this technique failed to reduce toxicity.
Site 3
The TIE study indicated that a combination of anionand cation exchange resins eliminated toxicity in thefinal effluent.
Follow-Up and Confirmation
Site 2
ESC reevaluated the effluent for acute toxicity afterthe management at Site 2 permanently eliminatedthe use of hexavalent chromium. On doing so, thetoxicity of the final effluent was then monitored andfound to be nontoxic to D. magna. The resultsdemonstrated a useful modification in the watertreatment practices at Site 2.
Problems Encountered
Site 1
The hypothesis that an unknown toxic componentwas coming off the cation exchange resin wasconfirmed when a 300 mg/L NH4Cl stock solution inwell water was passed through the cation column.Toxicity persisted after treatment even thoughammonia levels had been reduced to < 1 mg/L, whichwas well below 32 mg/L (48 hr EC&. No toxicity wasobserved when well water alone was passed throughthe resin.
ESC was unable to reduce ammonia below effectlevels in the wastewater using air stripping methods.The use of zeolite resins was the only effective meansfor removing ammonia.
ReferencesDoi, J. and P.R. Grothe. “Use of Fractionation/
Chemical Analysis Schemes for Plant EffluentToxicity Evaluations.” Aquatic Toxicology andHazard Assessment; Eleventh Symposium,American Society for Testing and Materials,Philadelphia (1987).
Rodgers, J.H.,et al. “Toxicity of Calcium to BioassaySpecies.” Submitted for publication to Bulletin ofEnvironmental Contamination and Toxicology(1987).
Walsh, G.E. and R.L. Garnas. “Determination ofBioavailability of Chemical Fractions of LiquidWastes Using Freshwater and Saltwater Algaeand Crustaceans.” Environmental ScienceTechnology, 17:180-182 (1983).
* U.S. GOVERNMENT PRINTING OFFICE. 1989- 6 4 8 - 1 6 3 ’ 0 0 3 1 0
A-56


![Fibre-Reinforced Generalized Thermoelastic Medium ... · Ezzat and Youssef [9] studied the generalized magneto-thermoelasticity in a perfectly conducting medium. ... Alla and Ahmed](https://img.pdfslide.us/doc/110x75/5f7bec0929f0b937ea1df404/fibre-reinforced-generalized-thermoelastic-medium-ezzat-and-youssef-9-studied.jpg)