Embed Size (px)
Citation preview
1
General Stress-Strain Relationship for Concrete at Elevated Temperatures
M.A. Youssef*, M. Moftah
The University of Western Ontario, Department of Civil and Environmental Engineering, London,
ON N6A 5B9, Canada
Abstract
A general stress-strain relationship for concrete when subjected to fire is needed as it allows
designing concrete structures to specific fire-performance criteria and improves the understanding
of the behaviour of these structures during fire events. Existing relationships are developed based
on fire tests of unconfined concrete specimens. They provide significantly different predictions
because of uniqueness of each relationship and the existence of numerous formulations for
calculating the governing parameters. In this paper, available formulations for estimating the
parameters affecting the behaviour of unconfined and confined concrete are presented. These
parameters are concrete compressive strength, concrete tensile strength, concrete compressive
strain at peak stress, initial modulus of elasticity of concrete, transient creep strain, thermal strain,
and yield stress and bond strength of reinforcing bars. Recommendations for choosing specific
formulations are made based on accuracy, generality, and simplicity. Suitable compressive and
tensile stress-strain relationships at elevated temperature that utilize the recommended
formulations are proposed based on well-established relationships for confined concrete at ambient
temperature. The proposed relationships are compared to existing ones and available experimental
data. They can capture changes in the mechanical properties of concrete resulting from
temperature and confinement and are found to be superior to existing relationships. However,
additional tests are needed to further validate and improve the proposed relationships.
Keywords: Concrete; stress-strain relationship, temperature; fire; transient creep; initial stress;
thermal Strain; yield strength, tensile strength, compressive strength.
* Corresponding author. Tel.: +1 519 661-2111 Ext. 88661; Fax: +1 519 661-3779.
E-mail address: [email protected]
2
1. Introduction
Engineers generally satisfy fire safety requirements by choosing floor and wall assemblies
that satisfy specific fire ratings. Such a method does not require any temperature-dependent
calculations. However, new codes are moving towards performance-based design and
temperature-dependent calculations are expected to be required to satisfy certain performance
criteria. A general stress-strain relationship for concrete when subjected to high temperature is thus
needed. Such a relationship will also be beneficial to researchers interested in modelling the
behaviour of concrete structures when subjected to fire.
Numerous models were developed during the last century to represent the compressive and
tensile stress-strain behaviour of unconfined and confined concrete structures at ambient
temperature. Elevated temperatures occurring during fire events were found to change the
characteristics of the stress-strain relationships for unconfined concrete. A review of mechanical
properties of concrete at elevated temperature is given by Phan and Carino [1]. Effects of elevated
temperatures include decreasing concrete strength, f 'c , [2-7] and increasing the absolute value of
the strain corresponding to it (εo) [8-16]. Hertz [3], Lie [4], and Purkiss [7] reported that preloading
concrete with a compressive stress fci reduces the effect of elevated temperatures on f 'c and εo. fci
was also found to result in additional strains that were termed transient creep strains (εtr) [17-19].
The magnitude of these strains is a function of the heating rate, the concrete mix, and the
preloading stress level. The effect of elevated temperature on the stress-strain relationship of
confined concrete is not fully understood. Confinement is expected to be affected by the
deterioration of the bond between the reinforcing bars and the surrounding concrete [5, 7, 8, 10]
and the reduction in the yield stress of transverse reinforcing bars during fire [4, 6, 7]. Following a
fire event, residual properties of concrete are of importance as they define the best rehabilitation
strategy. Their values are different from those during fire [1,20].
In this paper, a review of existing models for concrete structures at normal and elevated
temperatures is given. This includes effect of elevated temperatures on concrete compressive and
tensile strengths, concrete compressive strain at peak stress, transient creep strain, yield strength
of reinforcing bars, and bond strength of reinforcing bars. General stress-strain relationships are
3
proposed and examined using available experimental results. The paper also identifies tests that
should be carried out to validate and improve the proposed models.
2. Compressive Stress-Strain Relationship for Concrete at Normal Temperature
The behaviour of concrete under compression is greatly affected by the degree of confinement
provided by the transverse reinforcement. For unconfined concrete, a widely used approximation
for the stress-strain relationship before maximum stress is a second-degree parabola. εo can be
taken as 0.002 or ci
'c
Ef2 ⋅ [21], where Eci is its initial modulus of elasticity. Mander et al. [22]
recommended estimating Eci as 'cf.5000 MPa. The post peak behaviour can be estimated either
by extending the equation of the second-degree parabola [23] or by using a linear decaying branch
with a slope of o
'cε0.0038
f0.15-−⋅ [21]. The length of the decaying branch is strongly affected by the
conditions of the test. A number of values for the maximum strain (εcu) can be found in the
literature. Those include 0.003 [24], 0.0035 [25], and 0.0038 [21]. Neville [26] proposed using
equation 1 to take into account the reduction in εcu that was noted for higher strength concretes.
2'c
7'c
53cu f10993.3f10995.610942.4)d concrete(unconfineε ⋅×+⋅×−×= −−− (1)
To account for effect of creep on the stress-strain relationship, It was suggested by Collins and
Mitchell [27] to shift the strain at the maximum stress to be equal εo + εcr, where εcr is the creep
strain at maximum stress.
Regarding confined concrete, a number of models exist in the literature [22, 28-31]. Two of the
widely used models will be briefly described in the following paragraphs.
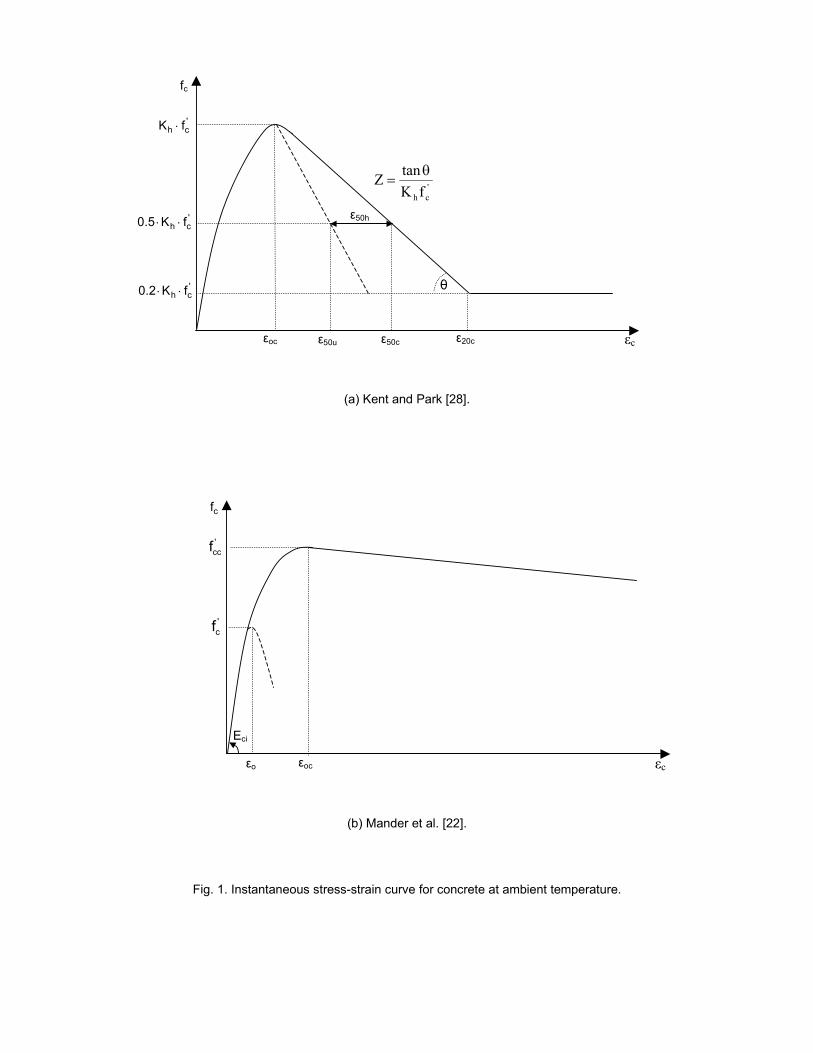
The model of Kent and Park [28] accounts for improvement in ductility due to confinement
provided by rectangle hoops. The model was later extended by Scott et al. [29] to account for the
improvement in strength. In this model, the monotonic concrete stress-strain relationship in
compression, shown in Fig. 1, is described by equations 2a to 2f. The equations were modified to
include the effect of creep in a similar approach to that suggested by Collins and Mitchell [27].
4
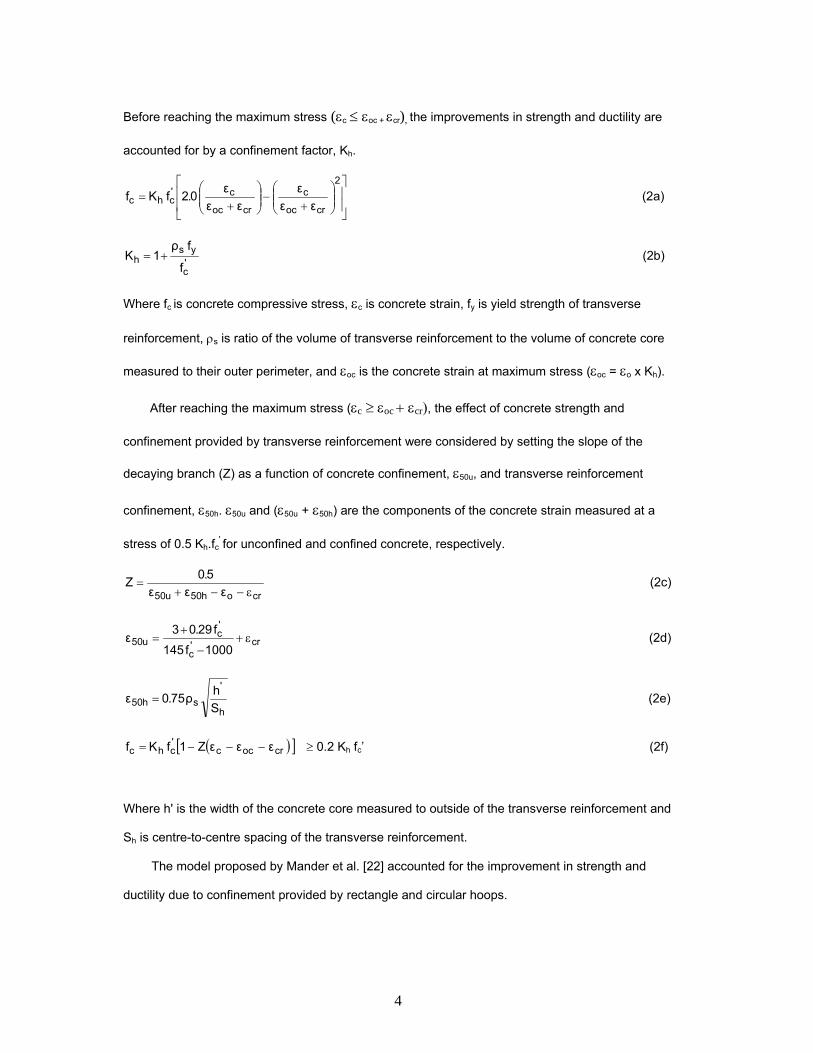
Before reaching the maximum stress (εc ≤ εoc + εcr), the improvements in strength and ductility are
accounted for by a confinement factor, Kh.
⎥⎥
⎦
⎤
⎢⎢
⎣
⎡
⎟⎟⎠
⎞⎜⎜⎝
⎛+
−⎟⎟⎠
⎞⎜⎜⎝
⎛+
=2
croc
c
croc
c'chc εε
εεε
ε0.2fKf (2a)
'c
ysh
f
fρ1K += (2b)
Where fc is concrete compressive stress, εc is concrete strain, fy is yield strength of transverse
reinforcement, ρs is ratio of the volume of transverse reinforcement to the volume of concrete core
measured to their outer perimeter, and εoc is the concrete strain at maximum stress (εoc = εo x Kh).
After reaching the maximum stress (εc ≥ εoc + εcr), the effect of concrete strength and
confinement provided by transverse reinforcement were considered by setting the slope of the
decaying branch (Z) as a function of concrete confinement, ε50u, and transverse reinforcement
confinement, ε50h. ε50u and (ε50u + ε50h) are the components of the concrete strain measured at a
stress of 0.5 Kh.fc' for unconfined and confined concrete, respectively.
croh50u50 εεε5.0Z
ε−−+ = (2c)
cr'c
'c
u501000f145
f29.03ε ε+−
+= (2d)
h
'sh50 S
hρ75.0ε = (2e)
( )[ ]crocc'chc εεεZ1fKf −−−= ≥ 0.2 Kh fc’ (2f)
Where h' is the width of the concrete core measured to outside of the transverse reinforcement and
Sh is centre-to-centre spacing of the transverse reinforcement.
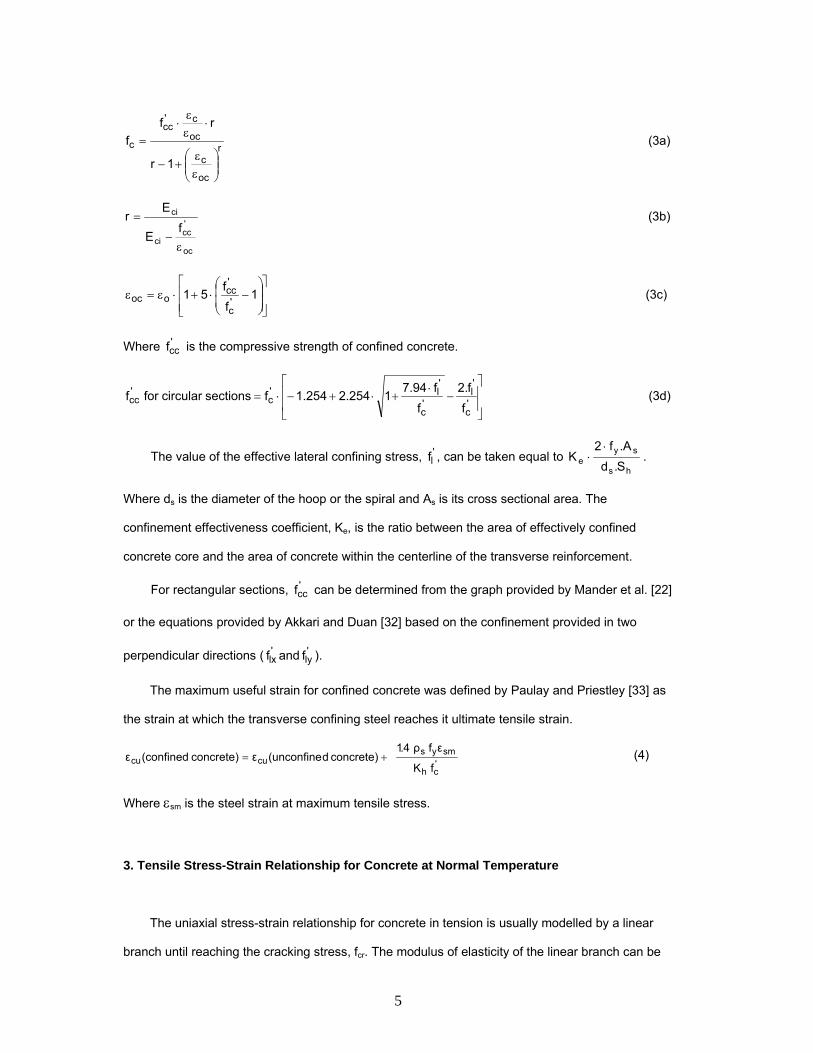
The model proposed by Mander et al. [22] accounted for the improvement in strength and
ductility due to confinement provided by rectangle and circular hoops.
5
r
oc
c
oc
c'cc
c
1r
rff
⎟⎟⎠
⎞⎜⎜⎝
⎛εε
+−
⋅εε
⋅= (3a)
oc
'cc
ci
ci
fE
Er
ε−
= (3b)
⎥⎥⎦
⎤
⎢⎢⎣
⎡
⎟⎟⎠
⎞⎜⎜⎝
⎛−⋅+⋅ε=ε 1
ff51 '
c
'cc
ooc (3c)
Where 'ccf is the compressive strength of confined concrete.
⎥⎥
⎦
⎤
⎢⎢
⎣
⎡−
⋅+⋅+−⋅=
'c
'l
'c
'l'
c'cc
ff.2
ff94.71254.2254.1fsections circular for f (3d)
The value of the effective lateral confining stress, 'lf , can be taken equal to
hs
sye S.d
A.f2K
⋅⋅ .
Where ds is the diameter of the hoop or the spiral and As is its cross sectional area. The
confinement effectiveness coefficient, Ke, is the ratio between the area of effectively confined
concrete core and the area of concrete within the centerline of the transverse reinforcement.
For rectangular sections, 'ccf can be determined from the graph provided by Mander et al. [22]
or the equations provided by Akkari and Duan [32] based on the confinement provided in two
perpendicular directions ( 'lxf and '
lyf ).
The maximum useful strain for confined concrete was defined by Paulay and Priestley [33] as
the strain at which the transverse confining steel reaches it ultimate tensile strain.
'ch
smyscucu
fK
εf ρ4.1 concrete) d(unconfineεconcrete) (confinedε += (4)
Where εsm is the steel strain at maximum tensile stress.
3. Tensile Stress-Strain Relationship for Concrete at Normal Temperature
The uniaxial stress-strain relationship for concrete in tension is usually modelled by a linear
branch until reaching the cracking stress, fcr. The modulus of elasticity of the linear branch can be
6
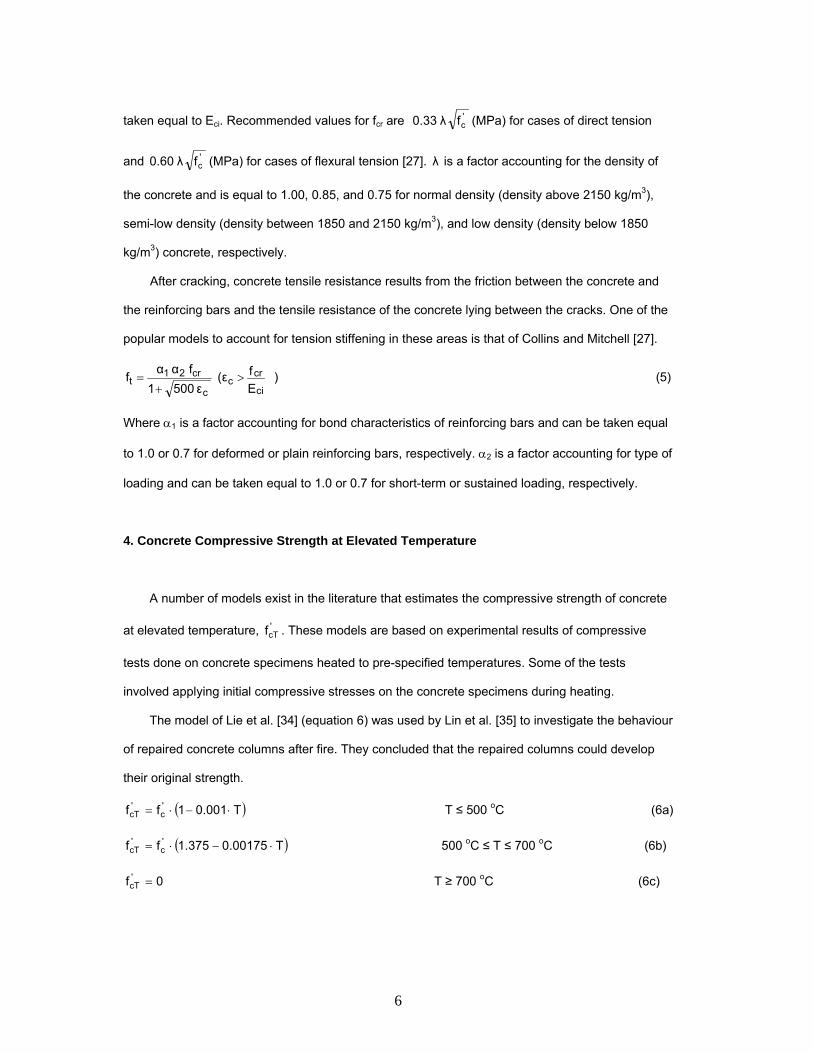
taken equal to Eci. Recommended values for fcr are 'cfλ 0.33 (MPa) for cases of direct tension
and 'cfλ 0.60 (MPa) for cases of flexural tension [27]. λ is a factor accounting for the density of
the concrete and is equal to 1.00, 0.85, and 0.75 for normal density (density above 2150 kg/m3),
semi-low density (density between 1850 and 2150 kg/m3), and low density (density below 1850
kg/m3) concrete, respectively.
After cracking, concrete tensile resistance results from the friction between the concrete and
the reinforcing bars and the tensile resistance of the concrete lying between the cracks. One of the
popular models to account for tension stiffening in these areas is that of Collins and Mitchell [27].
) Ef (ε
ε 5001f α αf
ci
crc
c
cr21t >
+= (5)
Where α1 is a factor accounting for bond characteristics of reinforcing bars and can be taken equal
to 1.0 or 0.7 for deformed or plain reinforcing bars, respectively. α2 is a factor accounting for type of
loading and can be taken equal to 1.0 or 0.7 for short-term or sustained loading, respectively.
4. Concrete Compressive Strength at Elevated Temperature
A number of models exist in the literature that estimates the compressive strength of concrete
at elevated temperature, 'cTf . These models are based on experimental results of compressive
tests done on concrete specimens heated to pre-specified temperatures. Some of the tests
involved applying initial compressive stresses on the concrete specimens during heating.
The model of Lie et al. [34] (equation 6) was used by Lin et al. [35] to investigate the behaviour
of repaired concrete columns after fire. They concluded that the repaired columns could develop
their original strength.
( )T0.0011ff 'c
'cT ⋅−⋅= T ≤ 500 oC (6a)
( )T0.001751.375ff 'c
'cT ⋅−⋅= 500 oC ≤ T ≤ 700 oC (6b)
0f 'cT = T ≥ 700 oC (6c)
7
The Eurocode model [36] (equation 7) was used by Saafi [37] to study the effect of fire on
concrete members reinforced with Fiber Reinforced Polymers (FRP). The study recommended a
minimum concrete cover of 64 mm for FRP reinforced concrete.
'c
'cT ff = T ≤ 100 oC (7a)
( )T0.000671.067ff 'c
'cT ⋅−⋅= 100 oC ≤ T ≤ 400 oC (7b)
( )T0.00161.44ff 'c
'cT ⋅−⋅= ≥ 0 T ≥ 400 oC (7c)
Lie and Lin model [38] (equation 8) was used by Zha [39] to develop a nonlinear finite element
program to calculate the resistance of concrete members subjected to fire.
⎟⎠⎞
⎜⎝⎛ −
⋅−⋅=1000
20T2.3532.011ff 'c
'cT ≤ '
cf (8)
Li and Purkiss [40] used their model (equation 9) to provide a comparison between different
stress-strain constitutive equations at elevated temperature.
⎥⎥⎦
⎤
⎢⎢⎣
⎡+⎟
⎠⎞
⎜⎝⎛⋅+⎟
⎠⎞
⎜⎝⎛⋅−⎟
⎠⎞
⎜⎝⎛⋅⋅= 1.002
100T0.025
100T0.03
100T0.00165ff
23'c
'cT (9)
Hertz [3] proposed a model (equation 10) that recognizes the variation of 'cTf with the
aggregate type. The decrease in the rate of decay of the concrete strength for preloaded concrete
is accounted for by multiplying equation 10 by 1.25 for initial stresses of 0.25 'cf . This decrease
results from the reduction in micro cracking caused by the initial compressive stress and was
observed by other researchers [2,4, 6, 7] as well.
⎥⎥⎥⎥⎥⎥
⎦
⎤
⎢⎢⎢⎢⎢⎢
⎣
⎡
⎟⎟⎠
⎞⎜⎜⎝
⎛+⎟⎟
⎠
⎞⎜⎜⎝
⎛+⎟⎟
⎠
⎞⎜⎜⎝
⎛++
⋅=64
64
8
8
2
21
'c
'cT
TT
TT
TT
TT1
1ff (10)
The proposed values for T1, T2, T8, and T64 are:
Siliceous aggregate: T1=15,000, T2=800, T8=570, and T64=100,000.
Lightweight aggregate: T1=100,000, T2=1100, T8=800, and T64=940.
Other aggregates: T1=100,000, T2=1080, T8=690, and T64=1000.
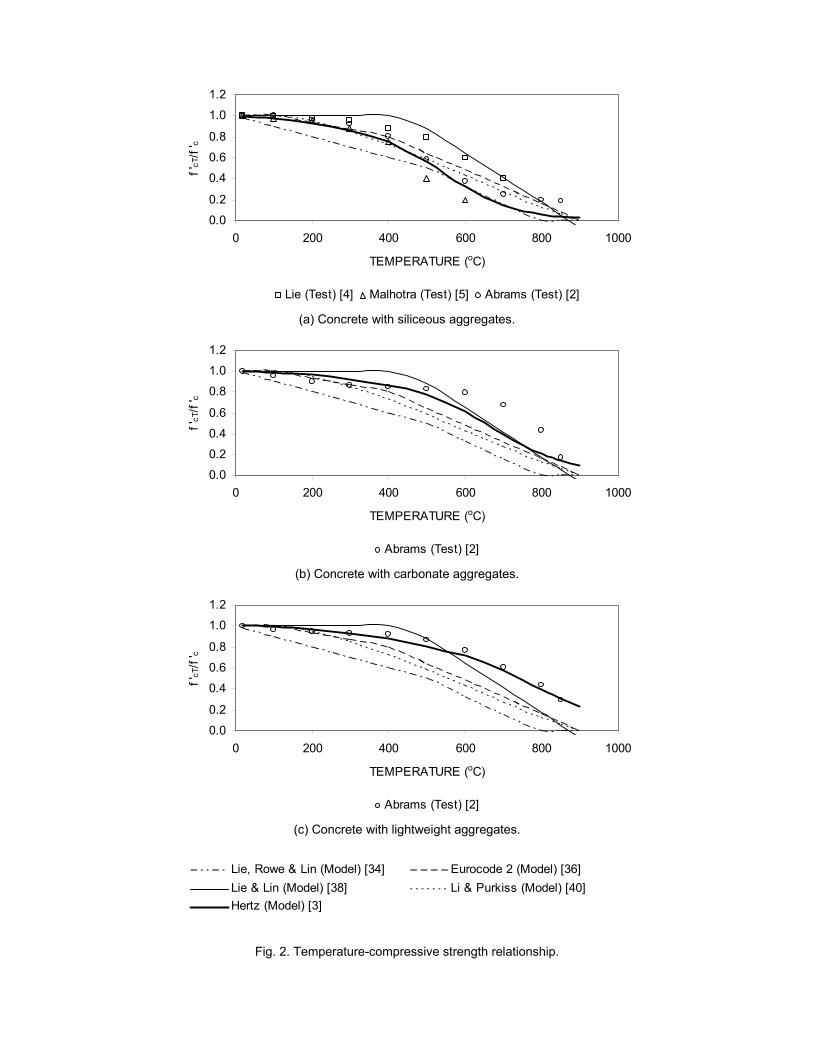
Fig. 2a compares the predictions of the above-mentioned models for siliceous aggregate
concrete at different temperatures against the experimental results by Malhotra [5], Pettersson
8
[reported in 4], and Abrams [2]. It is clear that Lie and Lin model [38] and Lie et al. model [34]
provide the upper and lower bounds for 'cTf . The results of the remaining models [3, 36, 40] are
closely correlated. In comparison with the experimental results, all models predicted the decrease
in the concrete strength with suitable accuracy considering the high variability of the problem.
Figs. 2b and 2c show the effect of aggregate type on 'cTf . Hertz model [3] is found to have good
accuracy in predicting the test results provided by Abrams [2] for concrete with carbonate and
lightweight aggregates. The remaining models [36, 40] need to be extended to account for the
aggregate type.
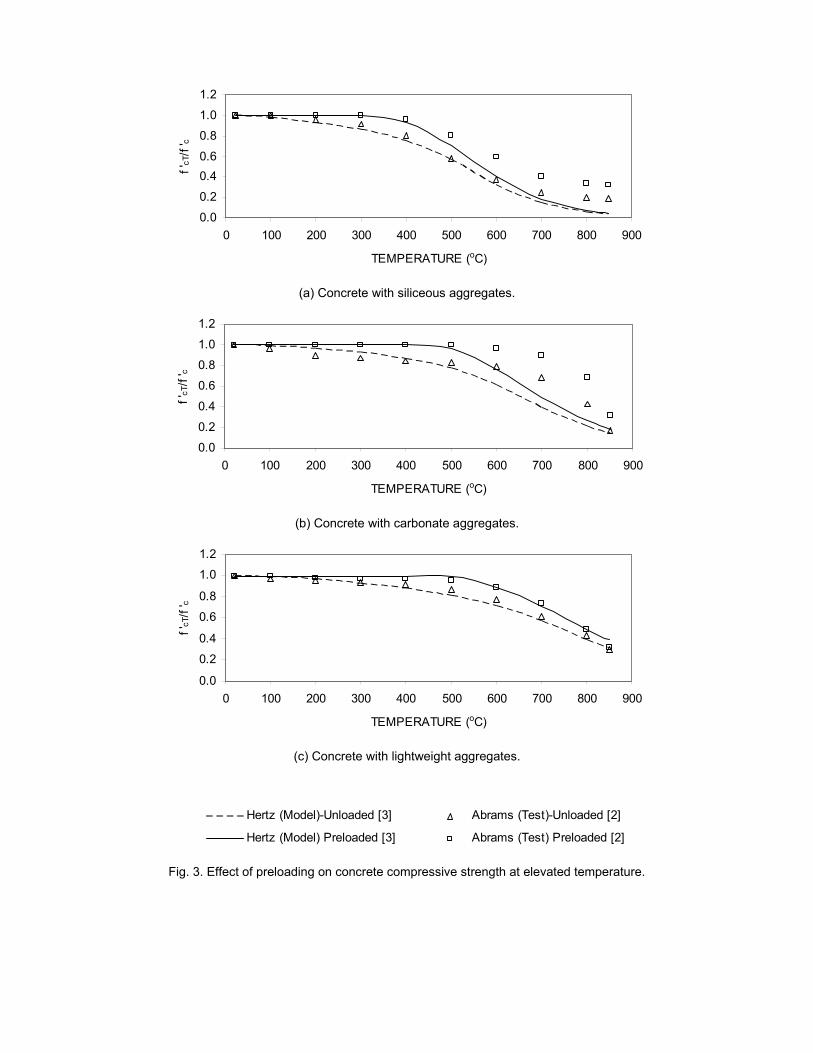
The experimental results provided by Abrams [2] that shows the effect of initial preload on 'cTf
are shown in Fig. 3 together with predictions of Hertz model [3]. Even so the initial stress (0.4 'cf ) is
higher than that reported by Hertz [3] (0.25 'cf ), a factor of 1.25 is used due to the unavailability of
other recommendations. The predictions of Hertz model [3] are found to have good accuracy.
Among the models available in the literature, Hertz model [3] is found to be the most
comprehensive, since it accounts for the effect of aggregate type and initial compressive stress on
'cTf . Additional experimental work is needed to identify the effect of different levels of initial
compressive and tensile stresses on 'cTf .
5. Concrete Strain at Elevated Temperature
The concrete strain at elevated temperature consists of four terms: instantaneous stress-
related strain (εfT), unrestrained thermal strain (εth), and creep strain (εtr). Definitions and
calculations of these strain terms are given below.
5.1. Instantaneous stress related strain
εfT is a function of the applied stress and the temperature. Its value at the peak stress (εoT)
and the initial value for the Modulus of Elasticity, EciT, define the shape of the stress-strain curve.
9
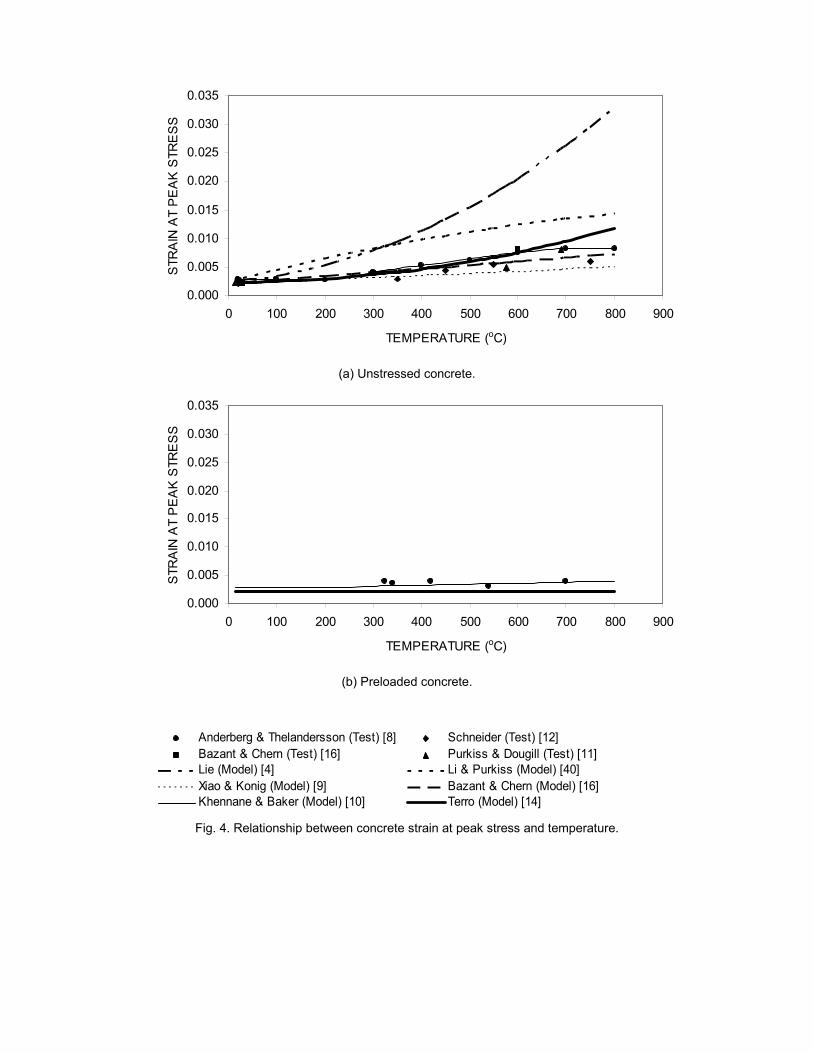
5.1.1. Strain at peak stress at elevated Temperature:
A number of models exist for estimating εoT. Equations 11 to 15 provide a summary for these
models for cases where concrete specimens were not loaded during the heating process.
Lie [4] ( ) 62oT 10T0.04T6.00.0025ε −×⋅+⋅+= (11)
Li and Purkiss [40] ( ) ( )284
ci
'c
oT 20T100.920T100.21E
f2ε −⋅×−−⋅×+
⋅= −− (12)
Lu and Yao [reported in 9] ( )0.9615T0.0019εε ooT +⋅⋅= (13)
Khennane and Baker [10] 0.003εoT = 20 ≤ T ≤ 200oC (14a)
0.000686T0.00001156εoT +⋅= ≤ 0.0082 T ≥ 200oC (14b)
Bazant and Chern [16] 0.00216T0.0000064εoT +⋅= 20 ≤ T ≤ 600oC (15a)
0.003T0.000015εoT −⋅= 600 ≤ T ≤ 650oC (15b)
Initial compressive stress was found to reduce the effect of fire temperature on εoT [13, 14].
Khennane and Baker [10] studied the experimental results provided by Anderberg and
Thelandersson [8] and proposed the following equation for concrete having an initial compressive
stress during the heating process.
0.002666T0.00000167εoT +⋅= ≥ 0.003 T ≤ 800oC (16)
Terro’s formula [14] (equation 17) accounted for the initial compressive stress level, λL, and
was based on the experimental results by Schneider [13].
( ) ( ) ( ) o3L2Lo2
2LLo1L
2LoT ελ10λ5ε5λλ20ε115λ50λε ⋅−⋅+⋅−⋅+⋅+−= (17a)
Where 3122963o1 T106.58T106.17T103.08102.05ε ⋅×+⋅×+⋅×+×= −−−− (17b)
3122963o2 T101.64T102.17T101.27102.03ε ⋅×+⋅×+⋅×+×= −−−− (17c)
0.002εo3 = (17d)
Fig. 4a provides a comparison of the above-mentioned models and the experimental results
for specimens with zero initial stress. It is clear that while the models of Lie [4] and Li and Purkiss
[40] provide the upper bound for εoT, the model of Lu and Yao [reported in 9] provides the lower
bound. The results of the three remaining models are closely related and in good agreement with
10
the experimental results. The effect of compressive load level that varies between 0.17 'cf and
0.225 'cf on εoT is shown in Fig. 4b. The models of Terro [14] and Khennane and Baker [10] were in
good agreement with the experimental results. Among the models available in the literature, Terro’s
model [14] has the advantage of accounting for different compressive stress levels and providing
good accuracy. Additional experiments accounting for different levels of initial compressive and
tensile stresses are needed to further validate and improve this model.
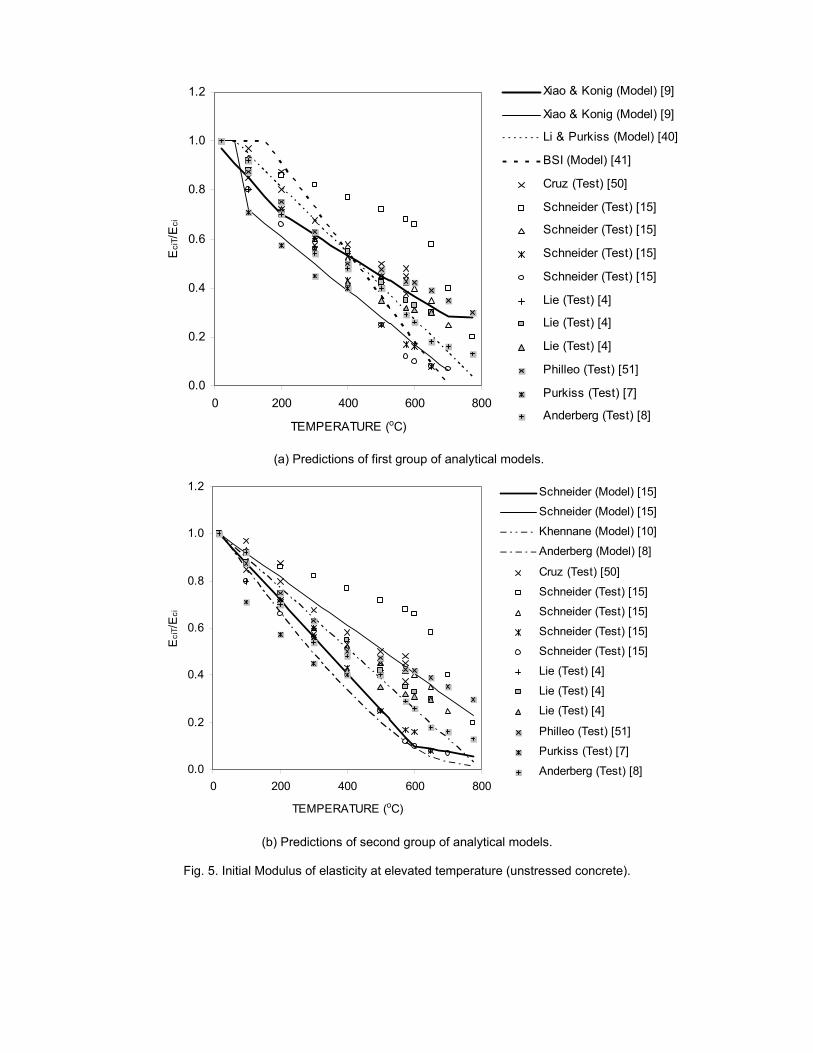
5.1.2. Initial Modulus of Elasticity at Elevated Temperature
The modulus of elasticity of the concrete is affected primarily by the same factors influencing
its compressive strength [6]. A great scatter in the experimental results for the initial modulus of
elasticity was observed by a number of researchers [4, 6, 7, 15]. A summary of the available
models is given below.
Lu [reported in 9] ( ) ciciT ET0.00151E ⋅⋅−= C200T20 o≤≤ (18a)
( ) ciciT ET0.000840.87E ⋅⋅−= ≥ ciE0.28 ⋅ (18b)
Li and Guo [reported in 9] ciciT EE = C60T20 o≤≤ (19a)
( ) ciciT ET0.00110.83E ⋅⋅−= C700T60 o≤≤ (19b)
Li and Purkiss [40] ciciT E740
T800E ⋅−
= ≤ ciE (20)
BSI [41] ciciT E550
T700E ⋅−
= ≤ ciE (21)
Schneider [15] Normal weight concrete:
( ) ciciT Eg1.03104T0.001552E ⋅⋅+⋅−= C600T20 o≤≤ (22a)
( ) ciciT Eg0.25T0.00025E ⋅⋅+⋅−= C1000T600 o≤≤ (22b)
Lightweight concrete:
( ) ciciT Eg1.0204T0.00102E ⋅⋅+⋅−= C1000T20 o≤≤ (23a)
where 100
20Tff1g 'c
ci −⋅+= 0.3
ff
'c
ci ≤ (23b)
11
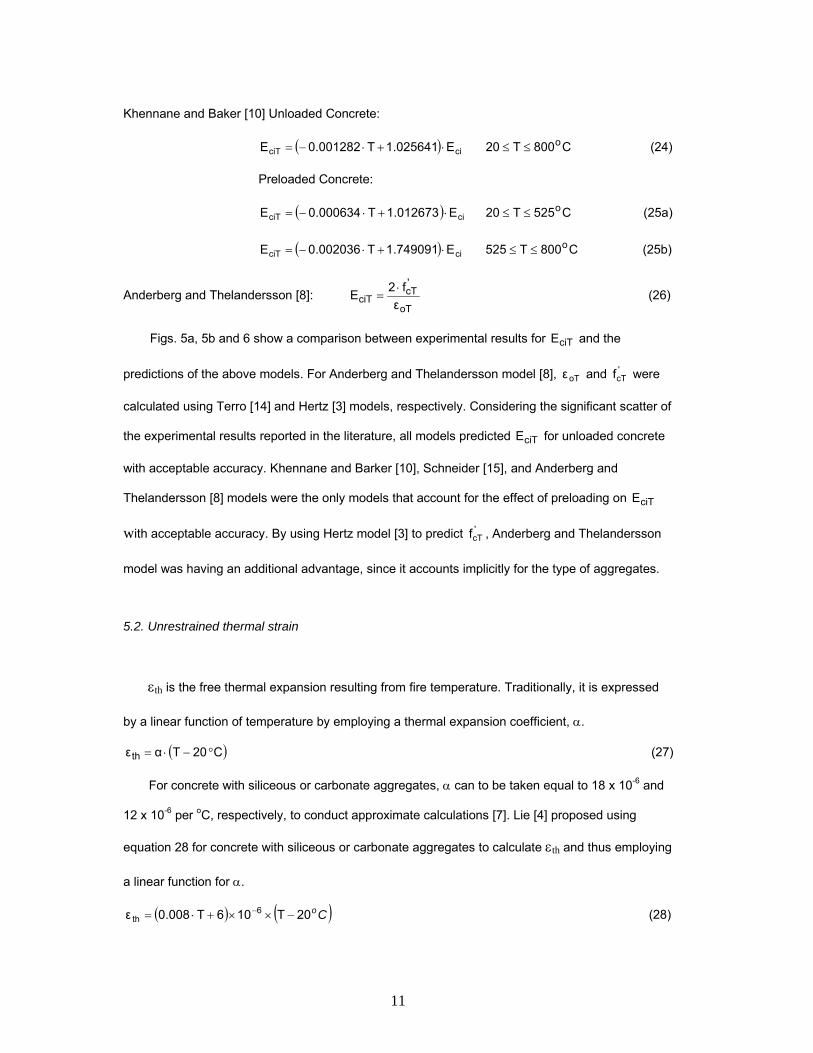
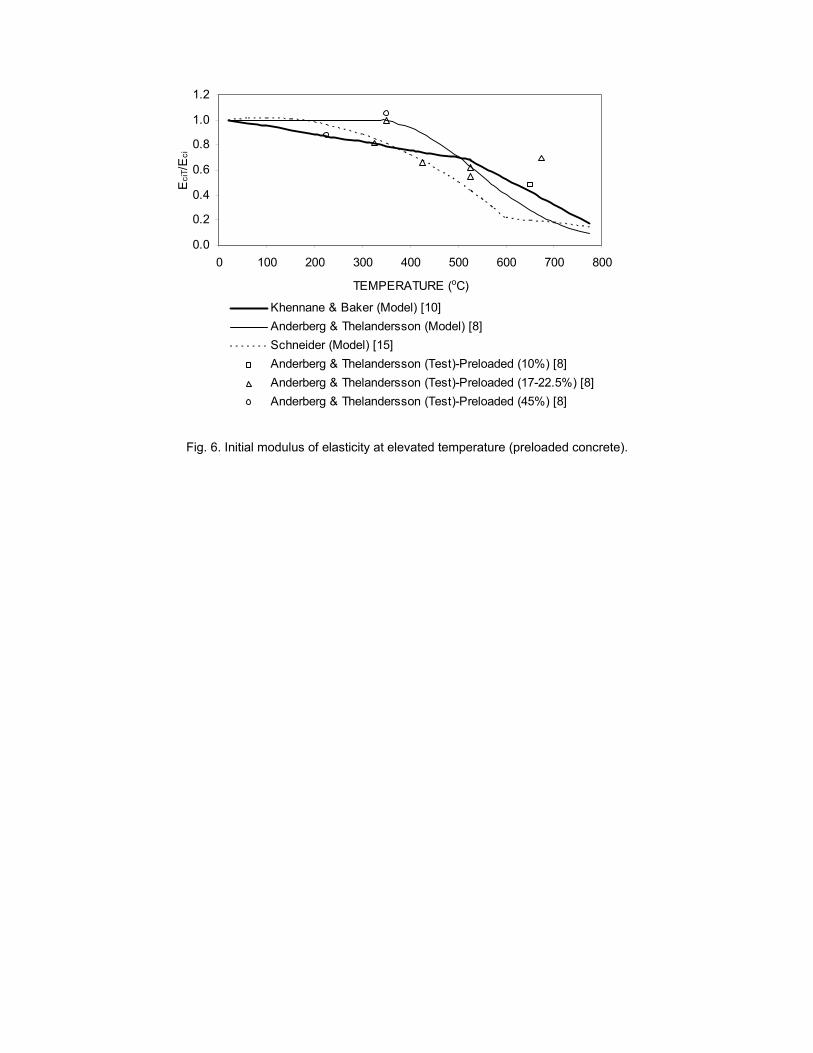
Khennane and Baker [10] Unloaded Concrete:
( ) ciciT E1.025641T0.001282E ⋅+⋅−= C800T20 o≤≤ (24)
Preloaded Concrete:
( ) ciciT E1.012673T0.000634E ⋅+⋅−= C525T20 o≤≤ (25a)
( ) ciciT E749091.1T002036.0E ⋅+⋅−= C800T525 o≤≤ (25b)
Anderberg and Thelandersson [8]: oT
'cT
ciT εf2E ⋅
= (26)
Figs. 5a, 5b and 6 show a comparison between experimental results for ciTE and the
predictions of the above models. For Anderberg and Thelandersson model [8], oTε and 'cTf were
calculated using Terro [14] and Hertz [3] models, respectively. Considering the significant scatter of
the experimental results reported in the literature, all models predicted ciTE for unloaded concrete
with acceptable accuracy. Khennane and Barker [10], Schneider [15], and Anderberg and
Thelandersson [8] models were the only models that account for the effect of preloading on ciTE
with acceptable accuracy. By using Hertz model [3] to predict 'cTf , Anderberg and Thelandersson
model was having an additional advantage, since it accounts implicitly for the type of aggregates.
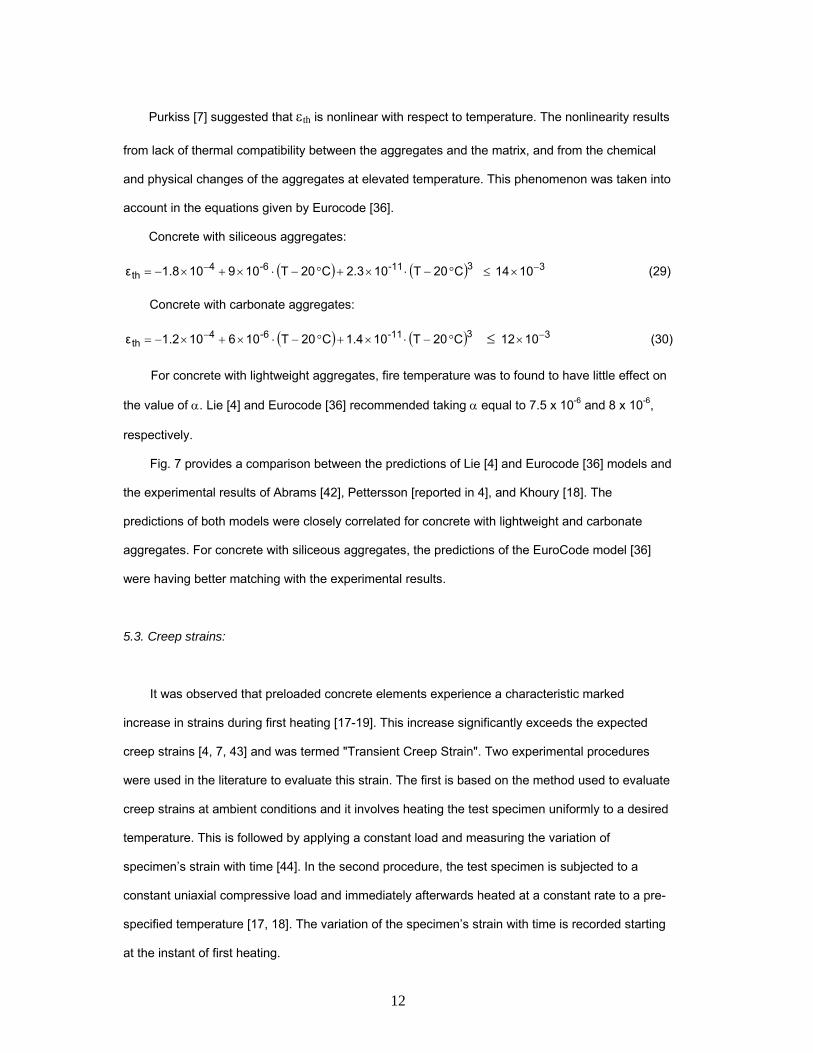
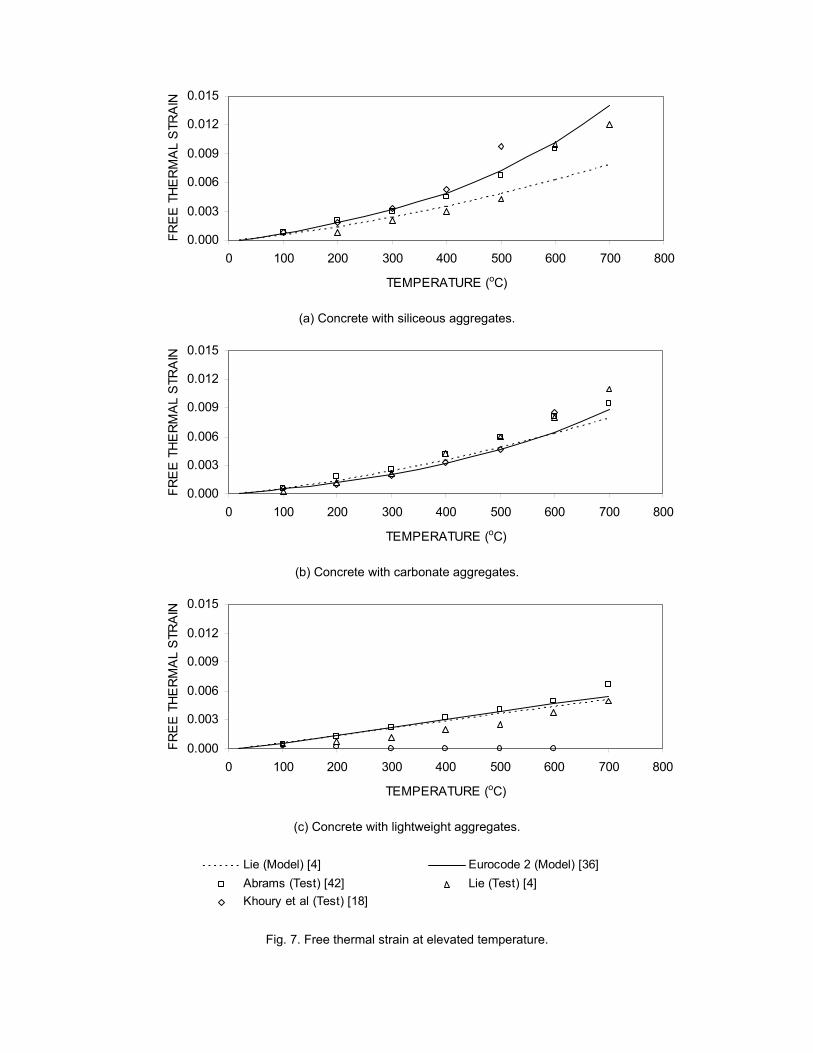
5.2. Unrestrained thermal strain
εth is the free thermal expansion resulting from fire temperature. Traditionally, it is expressed
by a linear function of temperature by employing a thermal expansion coefficient, α.
( )C 20Tαε th °−⋅= (27)
For concrete with siliceous or carbonate aggregates, α can to be taken equal to 18 x 10-6 and
12 x 10-6 per oC, respectively, to conduct approximate calculations [7]. Lie [4] proposed using
equation 28 for concrete with siliceous or carbonate aggregates to calculate εth and thus employing
a linear function for α.
( ) ( )Co20T106T0.008ε 6th −××+⋅= − (28)
12
Purkiss [7] suggested that εth is nonlinear with respect to temperature. The nonlinearity results
from lack of thermal compatibility between the aggregates and the matrix, and from the chemical
and physical changes of the aggregates at elevated temperature. This phenomenon was taken into
account in the equations given by Eurocode [36].
Concrete with siliceous aggregates:
( ) ( )3-11-64th C 20T102.3C 20T109101.8ε °−⋅×+°−⋅×+×−= − ≤ 31014 −× (29)
Concrete with carbonate aggregates:
( ) ( )3-11-64th C 20T10.41C 20T106101.2ε °−⋅×+°−⋅×+×−= − ≤ 31012 −× (30)
For concrete with lightweight aggregates, fire temperature was to found to have little effect on
the value of α. Lie [4] and Eurocode [36] recommended taking α equal to 7.5 x 10⁻⁶ and 8 x 10⁻⁶,
respectively.
Fig. 7 provides a comparison between the predictions of Lie [4] and Eurocode [36] models and
the experimental results of Abrams [42], Pettersson [reported in 4], and Khoury [18]. The
predictions of both models were closely correlated for concrete with lightweight and carbonate
aggregates. For concrete with siliceous aggregates, the predictions of the EuroCode model [36]
were having better matching with the experimental results.
5.3. Creep strains:
It was observed that preloaded concrete elements experience a characteristic marked
increase in strains during first heating [17-19]. This increase significantly exceeds the expected
creep strains [4, 7, 43] and was termed "Transient Creep Strain". Two experimental procedures
were used in the literature to evaluate this strain. The first is based on the method used to evaluate
creep strains at ambient conditions and it involves heating the test specimen uniformly to a desired
temperature. This is followed by applying a constant load and measuring the variation of
specimen’s strain with time [44]. In the second procedure, the test specimen is subjected to a
constant uniaxial compressive load and immediately afterwards heated at a constant rate to a pre-
specified temperature [17, 18]. The variation of the specimen’s strain with time is recorded starting
at the instant of first heating.
13
The creep strains obtained from the first procedure do not represent the behaviour of concrete
structures under fire conditions. During fire, structural elements are being exposed to a variable
temperature, which results in a non-uniform and varying temperature distribution within the
element. Malhotra [6] recommended using the second test procedure, which was referred to as
“short-duration transient-creep tests”. The strains measured while using this procedure implicitly
include both conventional and transient creep strains [14, 15, 17, 18]. A number of analytical
models capable of predicting transient creep strains (εtr) exist in the literature. They are based on
experimental results and are summarized below.
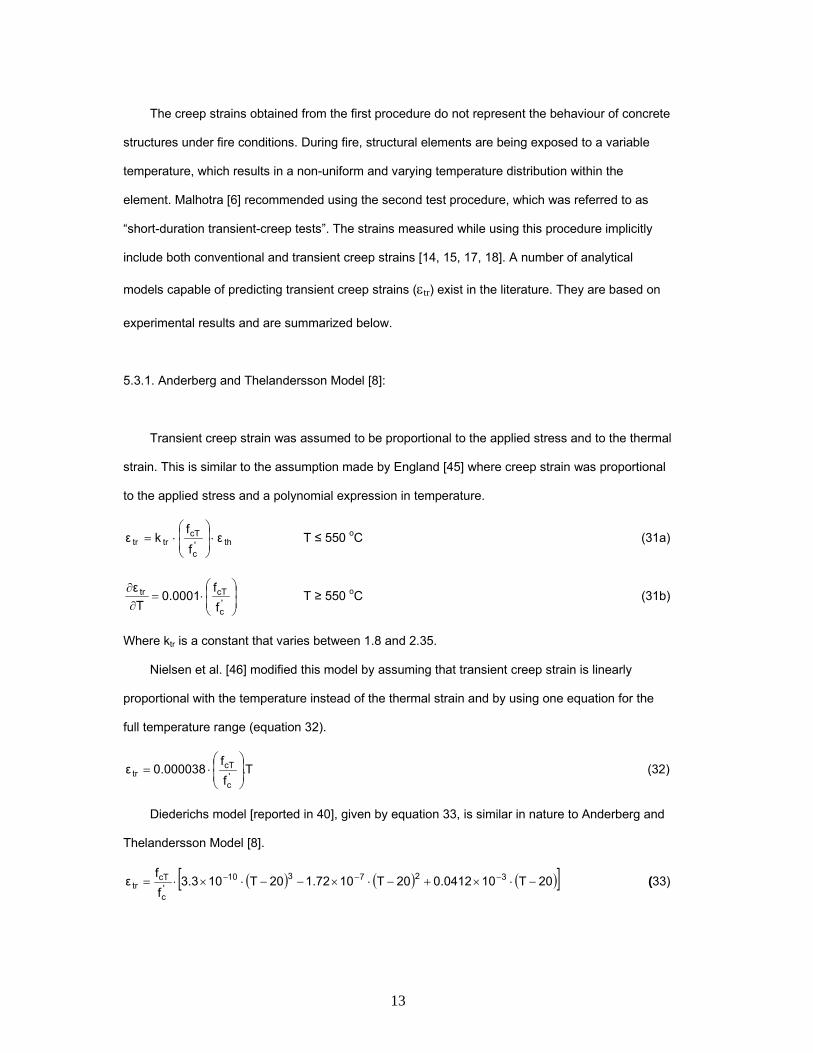
5.3.1. Anderberg and Thelandersson Model [8]:
Transient creep strain was assumed to be proportional to the applied stress and to the thermal
strain. This is similar to the assumption made by England [45] where creep strain was proportional
to the applied stress and a polynomial expression in temperature.
th'c
cTtrtr ε
ff
kε ⋅⎟⎟⎠
⎞⎜⎜⎝
⎛⋅= T ≤ 550 oC (31a)
⎟⎟⎠
⎞⎜⎜⎝
⎛⋅=
∂∂
'c
cTtr
ff
0.0001Tε T ≥ 550 oC (31b)
Where ktr is a constant that varies between 1.8 and 2.35.
Nielsen et al. [46] modified this model by assuming that transient creep strain is linearly
proportional with the temperature instead of the thermal strain and by using one equation for the
full temperature range (equation 32).
T.ff
000038.0ε'c
cTtr ⎟
⎟⎠
⎞⎜⎜⎝
⎛⋅= (32)
Diederichs model [reported in 40], given by equation 33, is similar in nature to Anderberg and
Thelandersson Model [8].
( ) ( ) ( )[ ]20T100.041220T101.7220T103.3ff
ε 327310'c
cTtr −⋅×+−⋅×−−⋅×⋅= −−− (33)
14
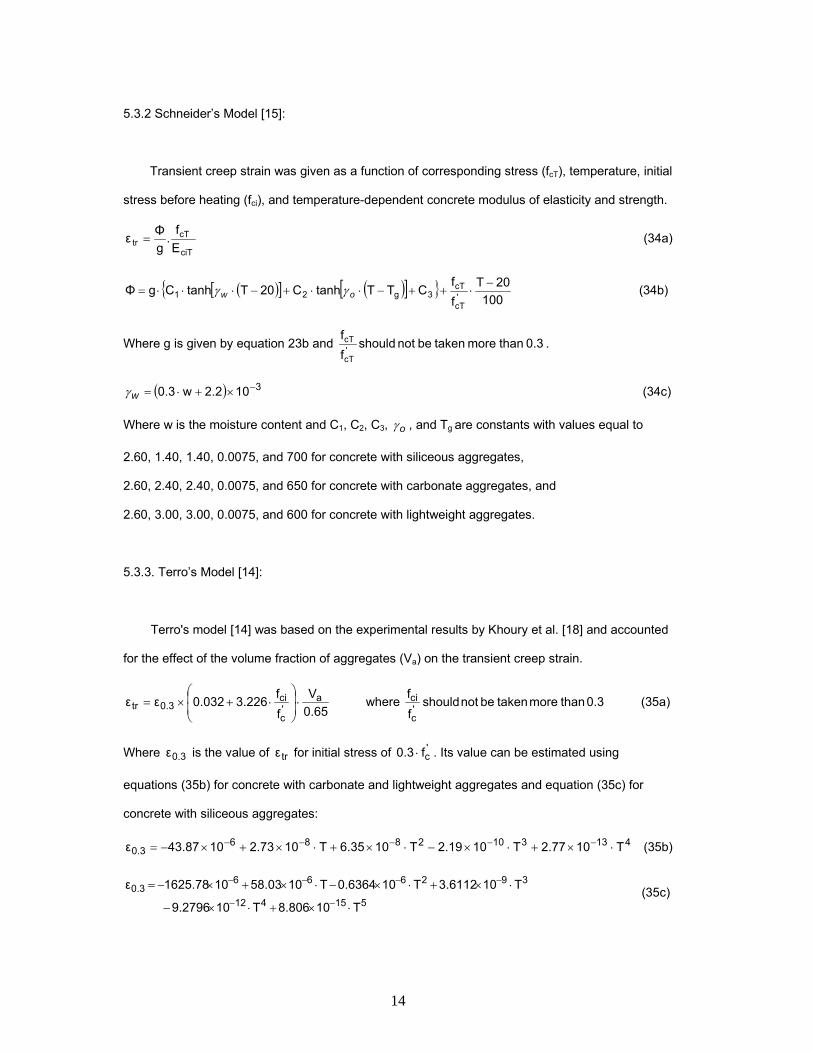
5.3.2 Schneider’s Model [15]:
Transient creep strain was given as a function of corresponding stress (fcT), temperature, initial
stress before heating (fci), and temperature-dependent concrete modulus of elasticity and strength.
ciT
cTtr E
f.
gΦε = (34a)
( )[ ] ( )[ ]{ }100
20Tff
CTTtanhC20TtanhCgΦ 'cT
cT3g21
−⋅++−⋅⋅+−⋅⋅⋅= ow γγ (34b)
Where g is given by equation 23b and 0.3 than more taken be not shouldff
'cT
cT .
( ) 3102.2w0.3 −×+⋅=wγ (34c)
Where w is the moisture content and C1, C2, C3, oγ , and Tg are constants with values equal to
2.60, 1.40, 1.40, 0.0075, and 700 for concrete with siliceous aggregates,
2.60, 2.40, 2.40, 0.0075, and 650 for concrete with carbonate aggregates, and
2.60, 3.00, 3.00, 0.0075, and 600 for concrete with lightweight aggregates.
5.3.3. Terro’s Model [14]:
Terro's model [14] was based on the experimental results by Khoury et al. [18] and accounted
for the effect of the volume fraction of aggregates (Va) on the transient creep strain.
0.65V
ff3.2260.032εε a
'c
ci0.3tr ⋅⎟
⎟⎠
⎞⎜⎜⎝
⎛⋅+×= where 0.3 than more taken be not should
ff
'c
ci (35a)
Where 0.3ε is the value of trε for initial stress of 'cf0.3 ⋅ . Its value can be estimated using
equations (35b) for concrete with carbonate and lightweight aggregates and equation (35c) for
concrete with siliceous aggregates:
41331028860.3 T102.77T102.19T106.35T102.731043.87ε ⋅×+⋅×−⋅×+⋅×+×−= −−−−− (35b)
515412
3926660.3
T108.806T109.2796
T103.6112T100.6364T1058.03101625.78ε
⋅×+⋅×−
⋅×+⋅×−⋅×+×−=−−
−−−− (35c)
15
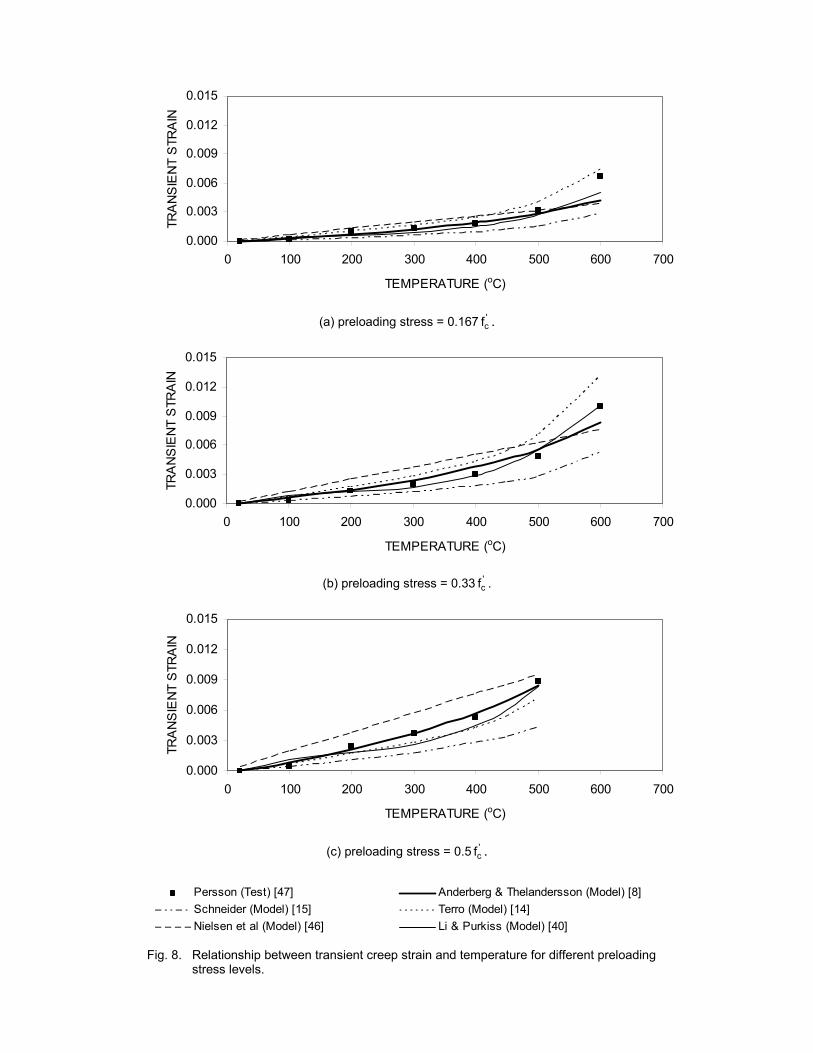
Comparisons between the predictions of presented transient creep models and the
experimental results by Fischer [reported in 47], Anderberg and Thelandersson [8], and Kordina et
al. [19] are given in Figs. 8a, 8b, and 8c. The experimental results show a nonlinear relationship
between the temperature and the transient creep strain. Although the relationship proposed by
Nielsen [46] is linear, it agrees well with the experimental results for temperatures less than 500°
Celsius. It can be used if simplified calculations are required. Schneider’s model [15] provided a
lower bound for the results. Models of Anderberg and Thelandersson [8], Terro [14], and
Diederichs [reported in 40] were found to provide good accuracy.
5.4. Maximum Compressive Strain at Elevated Temperature
Research in this area is limited. It is expected that the maximum compressive strain for
unconfined concrete, εuT, will decrease with increasing the temperature. Terro [14] proposed to use
(equation 1) to calculate εuT as a function of 'cTf .
6. Concrete Tensile Strength at Elevated Temperature:
Research in this area is limited. The tensile resistance of concrete at elevated temperature,
crTf , was recommend to be taking equal to 'c
'cT
crff.f by Terro [14] where fcr was assumed to be
equal to 10f 'c . Bazant and Chern [16] proposed a model based on the experimental results of
Anderberg and Thelandersson [8] to calculate the tensile resistance of concrete at elevated
temperature, crTf .
( )1.01052T0.000526ff crcrT +⋅−⋅= C400TC20 oo ≤≤ (36a)
( )1.8T0.0025ff crcrT +⋅−⋅= C600TC400 oo ≤≤ (36b)
( )0.6T0.0005ff crcrT +⋅−⋅= C1000TC600 oo ≤≤ (36c)
Li and Guo [reported in 9] suggested a simpler formula to calculate crTf .
16
( )T0.0011ff crcrT ⋅−⋅= C1000TC20 oo ≤≤ (37)
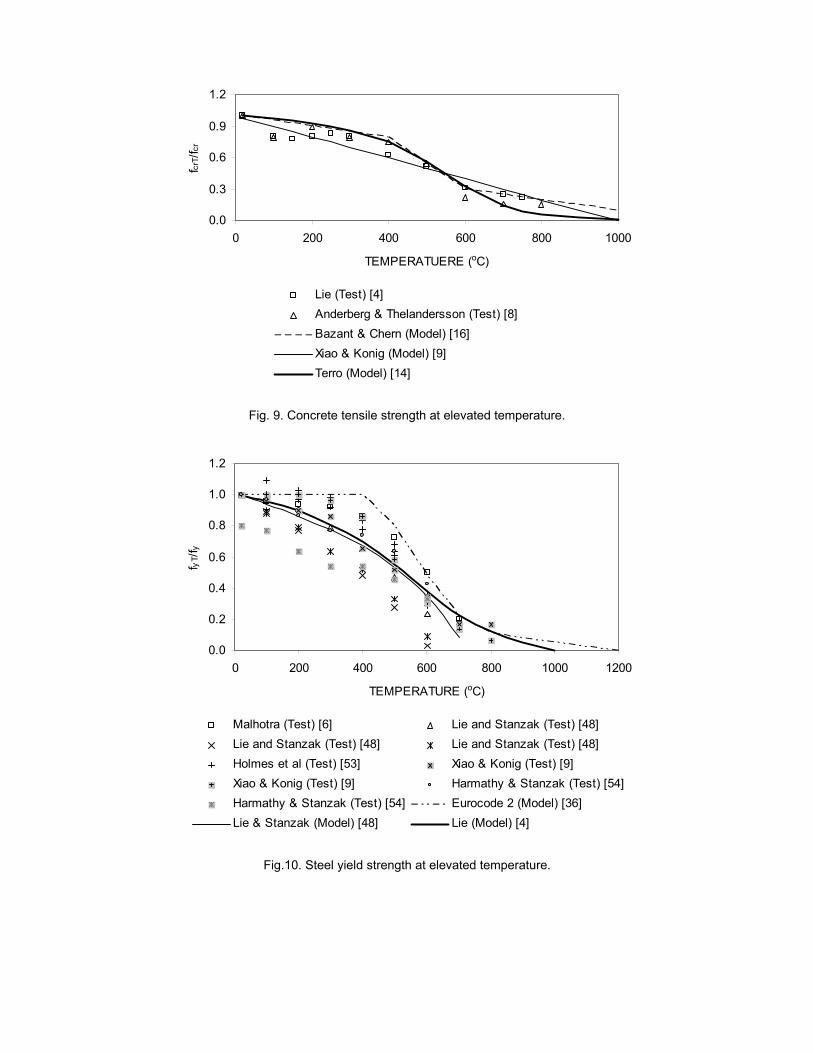
Fig. 9 shows a comparison between the predictions of these models and the experimental
results of CEB [reported in 4] and Anderberg and Thelandersson [8]. All models predicted a
decrease of crTf with temperature. Terro [14] model agrees well with the experimental results. It is
also a function of 'cTf and thus accounts indirectly for the effect of aggregate type on the tensile
resistance. Additional tensile tests at elevated temperature are needed to validate this model.
7. Yield Stress of Reinforcing Bars at Elevated Temperature
Elevated temperatures reduce the yield strength of the reinforcing bars and eliminate the
yielding plateau observed in tensile tests of mild steel specimens. Due to large strains exhibited at
elevated temperature, the yield strength ( yTf ) is usually evaluated using the 1.0% or 2.0% proof
stress rather than the conventional ambient value of 0.2% [7]. Two of the available models to
predict yield stress, yTf , of reinforcing bars at elevated temperature are given below.
Lie [4] yyT f
1750T
ln900
T1f ⋅
⎥⎥⎥⎥⎥
⎦
⎤
⎢⎢⎢⎢⎢
⎣
⎡
⎟⎟⎠
⎞⎜⎜⎝
⎛⋅
+= 0 < T ≤ 600 oC (38a)
yyT f240T
T0.34340f ⋅⎥⎦⎤
⎢⎣⎡
−⋅−
= 600 < T ≤ 1000 oC (38b)
Lie and Stanzak [48] ⎟⎠⎞
⎜⎝⎛ ⋅−⋅−=
4**yyT T1.89T0.781ff (39a)
1800
36T59
T*⎟⎠⎞
⎜⎝⎛ −⋅
= (39b)
Fig. 10 shows a comparison between the predictions of these models, the Eurocode [36]
recommended curve for yTf and the available experimental results. Predictions of Lie [4] model
were found to have good accuracy and it can be easily incorporated in a finite element code.
17
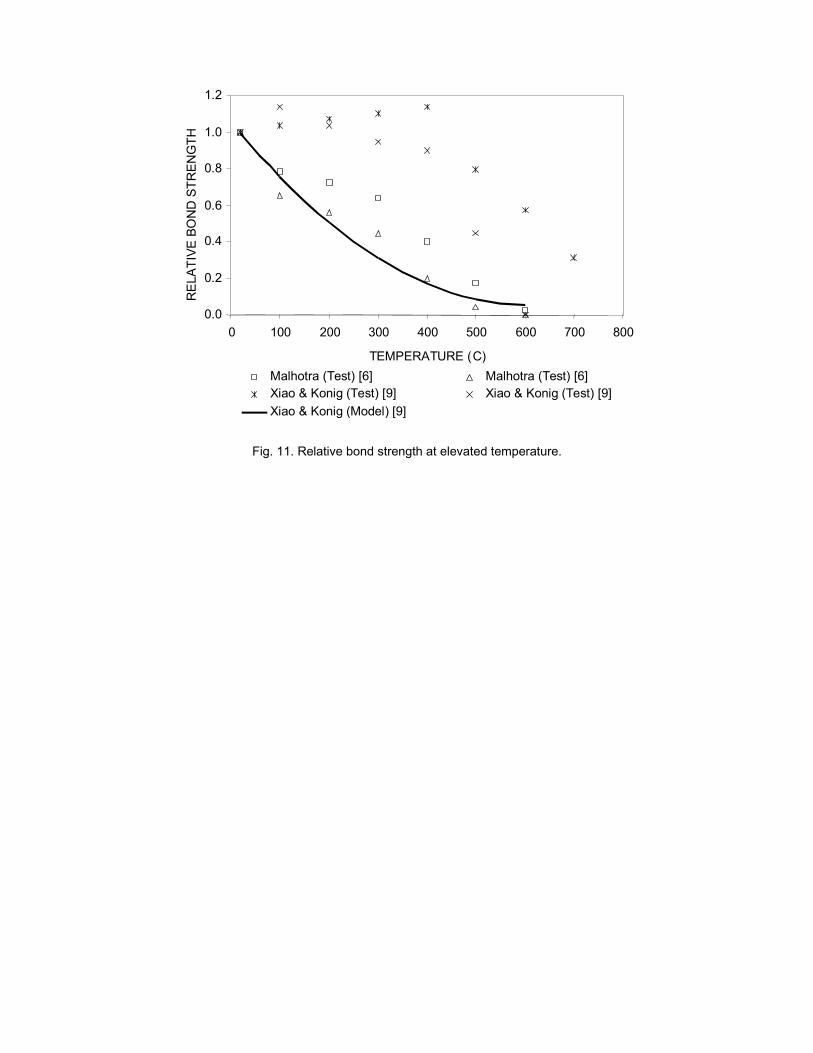
8. Bond Strength of Reinforcing Bars at Elevated Temperature
Bond strength between the concrete and steel decreases with increasing temperature. The
magnitude of the loss is a function of the type of concrete and the reinforcement surface's condition
(smooth, deformed, degree of rusting) [7]. Deformed or plain bars with rusted surface show higher
bond strength at high temperatures than smooth plain bars [6]. Models predicting the bond strength
at elevated temperature, uTτ , are limited. Xie and Qian Model [reported in 9] proposed equation 40
to calculate uTτ as a function of the bond strength at ambient temperature, uoτ , and the
temperature of the reinforcing bar, T. Fig. 11 shows the predictions given by this model against the
available experimental results. The scatter observed in the experimental results might be due to no
uniformity in test procedures [6].
22
uouT 10881.10510T322.3
100T7438.2. −×
⎥⎥⎦
⎤
⎢⎢⎣
⎡+⎟
⎠⎞
⎜⎝⎛⋅−⎟
⎠⎞
⎜⎝⎛⋅τ=τ (40)
9. Concrete Stress-Strain Relationships at Elevated Temperature:
This section summarizes the existing stress-strain relationships for concrete at elevated
temperature and provides a description of the proposed relationships. The formulations that were
recommended in the previous sections will be used to calculate the parameters affecting the
stress-strain relationships. These are equation 10 by Hertz [3] for concrete compressive strength
( 'cTf ), equation 17 by Terro [14] for strain at peak stress (εoT), equation 1 as a function of '
cTf by
Terro [14] for maximum compressive strain, 'c
'cT
crff.f by Terro [14] for concrete tensile strength,
equation 26 by Anderberg and Thelandersson [8] for initial concrete modulus of elasticity,
equations 29 and 30 by Eurocode [36] for unrestrained thermal strain, equation 38 by Lie [4] for
yield strength of reinforcing bars ( yTf ), equation 40 by Xie and Qian [reported in 9] for bond
strength ( uTτ ), and any of equations 31, 33, or 35 by Anderberg and Thelandersson [8], Diederichs
[reported in 40], and Terro [14], respectively, for transient creep strains (εtr). These recommended
formulations would be utilized in this section.
18
9.1 Compressive Stress-Strain relationship
Few models describing the compressive stress-strain relationship of unconfined concrete at
elevated temperature exist in the literature. Lie and Lin [38] proposed an instantaneous stress-
strain relation for concrete with parabolic ascending and descending branches.
⎥⎥
⎦
⎤
⎢⎢
⎣
⎡
⎟⎟⎠
⎞⎜⎜⎝
⎛ε
ε−ε−⋅=
2
oT
cToT'cTcT 1ff oTcT ε≤ε (41a)
⎥⎥
⎦
⎤
⎢⎢
⎣
⎡
⎟⎟⎠
⎞⎜⎜⎝
⎛ε
ε−ε−⋅=
2
oT
oTcT'cTcT 3
1ff oTcT ε≥ε (41b)
Anderberg and Thelandersson [8] relationships are parabolic for the ascending branch and
linear for the descending branch.
⎥⎥⎦
⎤
⎢⎢⎣
⎡
ε⋅ε
−ε⋅=oT
2cT
cTciTcT 2Ef εcT ≤ ε1
(42a)
( )1cT 1cT 880(MPa)f(MPa) f ε−ε⋅−= ε1 ≤ εcT (42b)
⎟⎟⎠
⎞⎜⎜⎝
⎛
ε⋅ε
−ε⋅=oT
21
1ciT1 2Ef (42c)
⎟⎟⎠
⎞⎜⎜⎝
⎛−⋅ε=ε
ciToT1 E
MPa 8801 (42d)
Schneider [15] proposed a model that accounts concrete weight on the shape of the stress-
strain curve by using a non-dimensional factor n. Its value was recommended to be taken equal to
2.5 and 3.0 for lightweight and normal-weight concrete, respectively.
ciT
cTn
oT
cTcT E
f1n
11 ⋅⎥⎥
⎦
⎤
⎢⎢
⎣
⎡
⎟⎟⎠
⎞⎜⎜⎝
⎛εε
⋅−
+=ε (43)
Terro [14] recommended using n equal 2 in Schneider model [15], which makes the model
similar to the model of Mander et al. [22] for Eci equal to oT
'cTf2
ε⋅
.
To account for transient creep effects, Anderberg and Thelandersson [8], Schneider [15],
Diedrichs [reported in 40], and Terro [14] considered that the total strain is composed of separate
strain components. The thermal strain is a function of the temperature and thus can be separated
19
easily from the total strain. To calculate the transient creep strain, an assumption has to be made
for the corresponding stress. This leads to an iterative solution.
9.2 Tensile Stress-Strain relationship
Research addressing the tensile stress-strain relationship for concrete at elevated
temperature is limited. A linear relationship is widely used to represent the pre-cracking behaviour.
After cracking, Terro [14] suggested using a linear degrading branch that joins the point of cracking
and a point on the horizontal axis with a strain of 0.004. Fracture toughness is often utilized to
define the softening branch. Zhang and Bicanic [49] assessed the residual fracture toughness of
cooled concrete after heating to 600oC. Similar research is needed to assess the fracture
toughness of concrete after heating to different temperatures and before cooling.
9.3 Proposed compressive stress-strain relationship
In this section two models are proposed. They are based on the models of Mander et al. [22]
and Scott et al. [29]. These models are proved to be successful in modelling the behaviour of
concrete at ambient temperature. The models are modified by replacing 'cf and ocε with the
temperature dependent terms 'cTf and oTcε . Transient creep is modelled by shifting the strain at
maximum stress by the transient creep strain similar to the approach proposed by Collins and
Mitchell [27]. This will remove the requirement for the iterations mentioned in section 9.1 and thus
will simplify the implementation of this model in a finite element code.
9.3.1 Analytical model number 1:
The modified Scott et al.’s model is given by the following equations. It is proposed to consider
the change in the strain ε50u (Fig. 1a) proportional to the change in εo.
20
⎥⎥
⎦
⎤
⎢⎢
⎣
⎡
⎟⎟⎠
⎞⎜⎜⎝
⎛+
−⎟⎟⎠
⎞⎜⎜⎝
⎛+
=2
troTc
cT
troTc
cT'cThTcT εε
εεε
ε0.2fKf εcT ≤ εoTc + εtr (44a)
( )[ ]troTccT'cThTcT εεεZ1fKf −−−= ≥ '
cThTfK2.0 εcT ≥ εoTc + εtr (44b)
'cT
yTshT
f
fρ1K += (44c)
εoTc = εoT x KhT (44d)
troTch50uT50 εεεε5.0Z
−−+ = (44e)
troc
oTc'c
'c
uT50 εεε.
1000f145f29.03ε +
−
+= (44f)
9.3.2 Analytical model number 2:
The modified Mander et al.’s model is given by the following equations. It is proposed to use
Eci equal to oT
'cTf2
ε⋅
and thus r will be equal to 2.
( )⎥⎥
⎦
⎤
⎢⎢
⎣
⎡⎟⎟⎠
⎞⎜⎜⎝
⎛ε+ε
ε+ε+ε
ε⋅=
2
trocT
cTtrocT
cT'ccT
cT
1.
f.2f (45a)
⎥⎥⎦
⎤
⎢⎢⎣
⎡
⎟⎟⎠
⎞⎜⎜⎝
⎛−⋅+⋅ε=ε 1
ff
51'cT
'ccT
oTocT (45b)
⎥⎥
⎦
⎤
⎢⎢
⎣
⎡−
⋅+⋅+−⋅=
'cT
'
'cT
'lT'
cT'ccT
flTf.2
ff94.71254.2254.1fsections circular for f (45c)
The value of 'lTf can be taken equal to
hs
syTe S.d
A.f2K
⋅⋅ . For rectangular sections, '
ccTf can
be determined from the graph provided by Mander et al. [22] or equations provided by Akkari and
Duan [32] based on the area of stirrups and their temperature dependent yield strength provided in
two perpendicular directions ( 'lxTf and '
lyTf ).
21
9.4 Proposed tensile stress-strain relationship
The uniaxial stress-strain relationship for concrete in tension can be modelled by a linear
branch until reaching the cracking stress, fcrT. The modulus of elasticity of the linear branch can be
taken equal to EciT. Recommended values for fcrT are 'cT
'c'
cff.fλ 0.33 ⎟
⎠⎞
⎜⎝⎛ (MPa) for cases of direct
tension and 'cT
'c'
cfffλ 0.60 ⎟
⎠⎞
⎜⎝⎛ (MPa) for cases of flexural tension. After cracking, the model of
Collins and Mitchell [27] can be modified by accounting for the reduction in the tensile resistance
and the bond strength.
) Ef (ε .
ε 5001f α α
fciT
crTcT
uo
uT
cT
crT21tT >
ττ
+= (46)
9.5 Comparisons
A Comparison between different instantaneous stress-strain models and the experimental
results of Purkiss and Dougill [11], Bazant and Chern [16], and Schneider [55] is given in Fig. 12. In
the figure, the modified Scott et al.’s model is referred as “Analytical 1” and the modified Mander et
al.’s model is referred as “Analytical 2”. For all models, 'cTf and εoT were calculated using the
formulations proposed by Hertz [3] and Terro [14], respectively. The predictions of the models of
Terro [14] and Schneider [15] were matching those represented by the modified Mander et al.’s
model for n equal to 2. All models represented the ascending branch with good accuracy. The
modified Scott et al.’s model provided the most accurate predictions for the descending branch at
different temperatures.
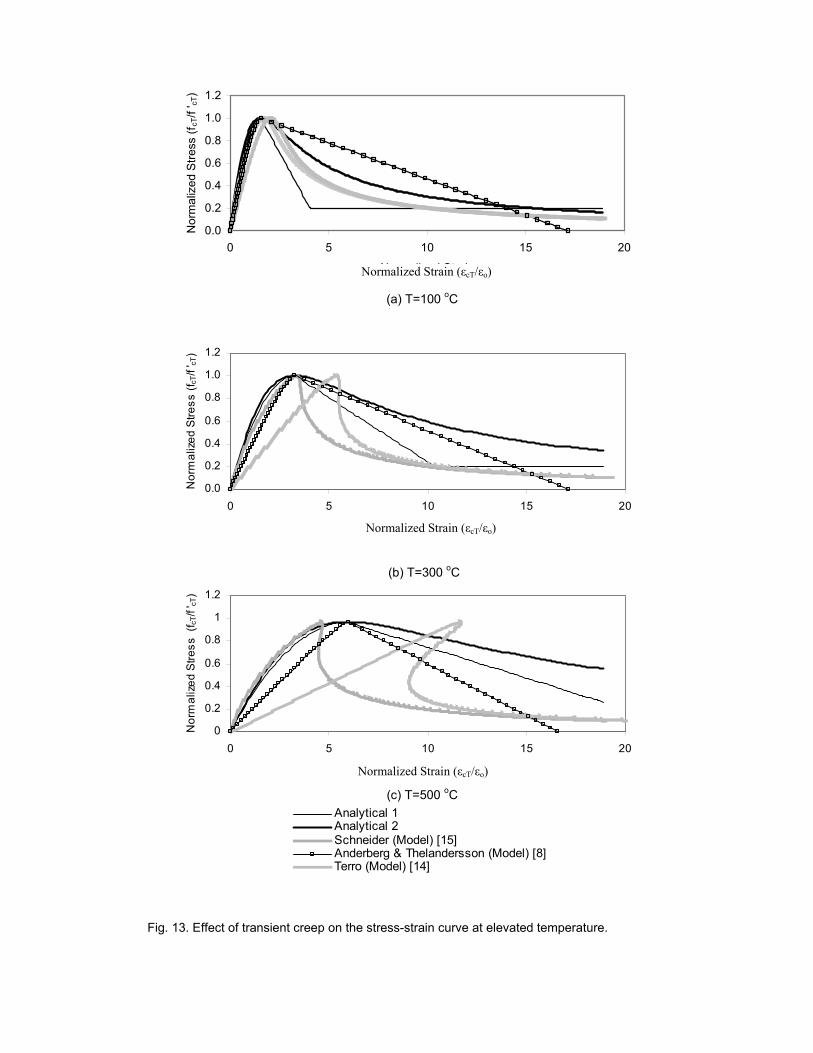
Due to the unavailability of the experimental data providing the full stress-strain curve
including transient creep effect, a comparison between different analytical models is given in Fig.
13. It was assumed that cif =0.2 'cf . The model of Anderberg and Thelandersson [8] was used to
calculate transient creep strains for the proposed models. The ascending branches for all models
with the exception of Terro’s model [14] are almost matching. This mainly due to the high values of
22
transient creep strains used in Terro’s model [14]. High variability exists in the predictions of the
descending branches. This requires experimental results to confirm the suitability of the proposed
models.
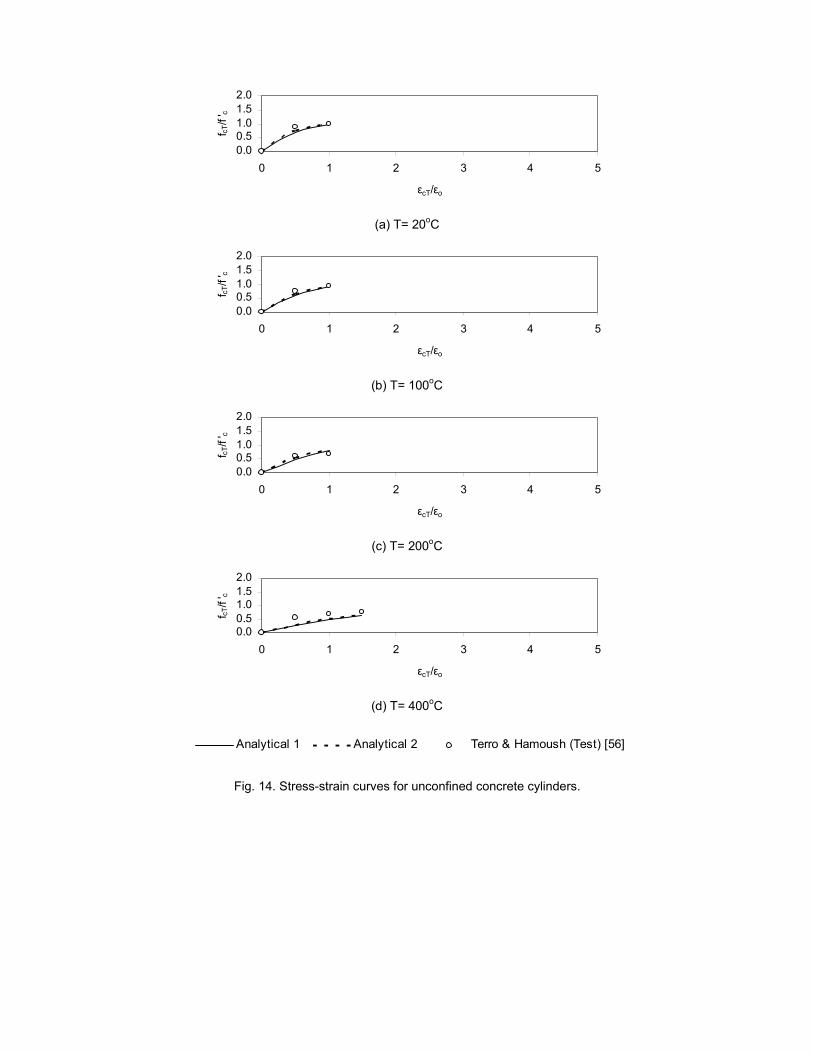
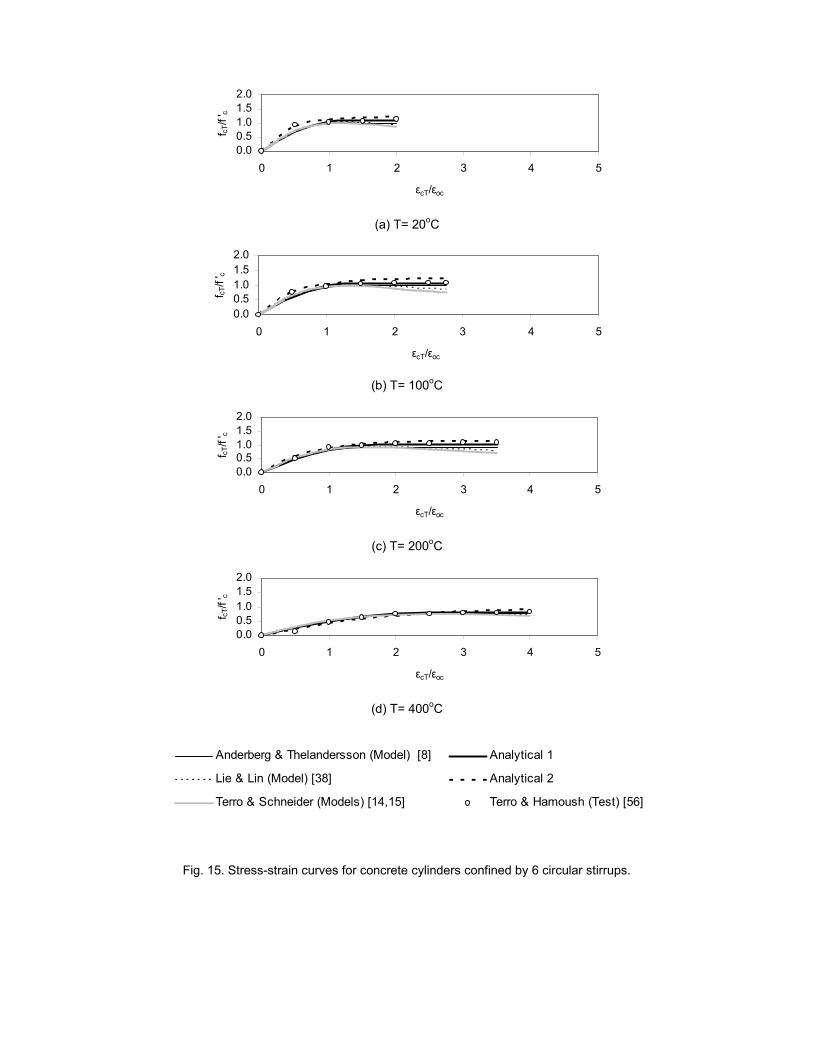
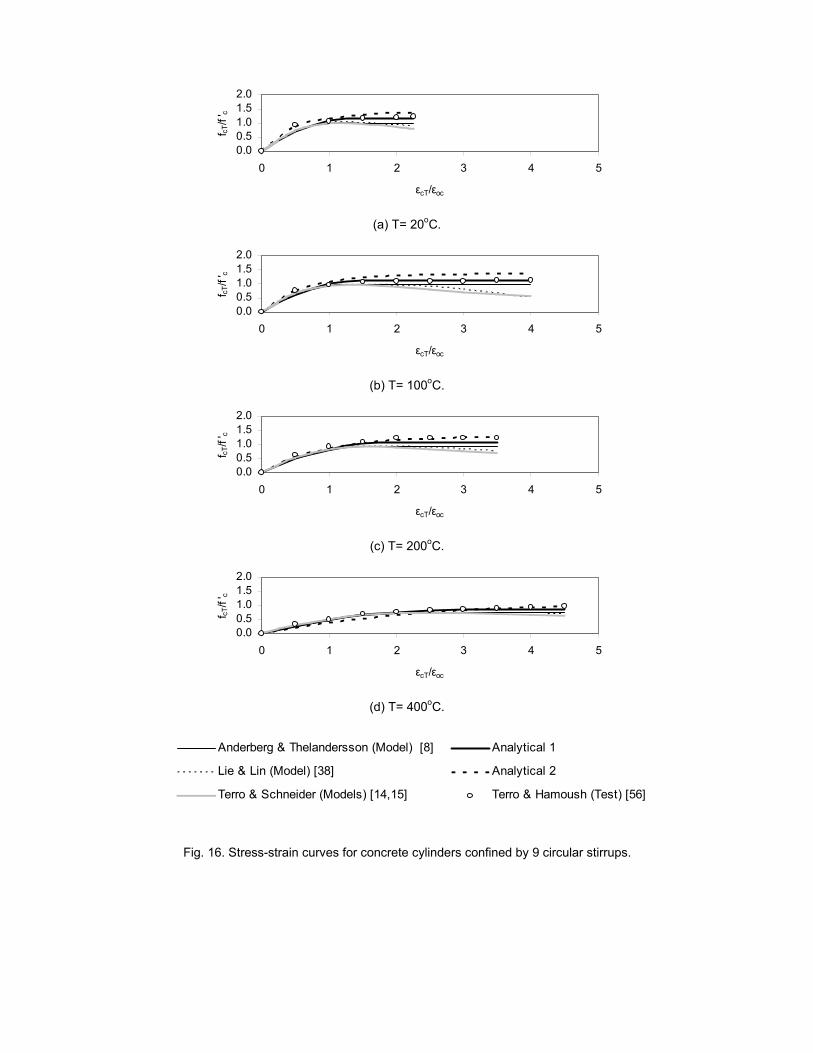
Figs. 14, 15, and 16 provide a comparison between the different models and the
experimental results provided by Terro and Hamoush [56] for compression tests on unconfined and
confined concrete cylinders. For unconfined concrete (Fig. 14), the ascending branches of
Anderberg and Thelandersson [8], Lie [4], and the modified Scott et al. models coincided. Also,
those of Schneider [15], Terro [14], and Mander [22] models coincided. The predictions of all
models were almost matching and were in good agreement with the experimental results. For
confined concrete cylinders, two confinement ratios (6 rings and 9 rings of high strength steel bars)
were used. From figs. 15 and 16, it can be noted that while all models predicted the ascending
branch with good accuracy, the modified Scott et al’s model and the modified Mander’s model were
superior in predicting the post peak behaviour.
10. Summary and Conclusions
The mechanical properties of concrete and reinforcing bars that affects the stress-strain
relationship of confined concrete are concrete strength, concrete initial modulus of elasticity,
concrete strain at maximum stress, thermal strain, transient creep strain, yield strength of
reinforcing bars, and bond strength of reinforcing bars. They experience significant changes at
elevated temperature. Concrete strength, concrete initial modulus of elasticity, yield strength of
reinforcing bars, and bond strength of reinforcing bars decrease while the absolute value of
concrete strain at peak stress increases. Initial compressive stresses reduce the effect of elevated
temperature on concrete strength and concrete strain at the peak stress but increases transient
creep strains. In this paper, comparisons between the predictions of available formulations to
estimate concrete and reinforcing bars mechanical properties at elevated temperature and
available experimental data were conducted. Specific formulations were recommended for different
parameters based on accuracy, generality, and simplicity, or unavailability of other models.
Stress-strain relationships describing the compressive and tensile behaviour of concrete
and utilizing the proposed formulations for estimating the mechanical properties of concrete and

23
reinforcing bars at elevated temperature are proposed. For the compressive behaviour, two models
are proposed; both are based on well-established models at ambient temperature. The proposed
models capture the changes that occur in the mechanical properties of concrete due to
confinement effects and high temperature. They also take into consideration transient creep using
a simplified but sufficiently accurate method. To model the stress-strain relationship for concrete in
tension, it is proposed to use a linear branch until reaching the cracking stress and after cracking
an existing tension softening model was modified by accounting for the reduction in the tensile
resistance of concrete and in the bond resistance of the reinforcing bars. The proposed
compressive models were found to have good accuracy when their predictions were compared
against the available experimental results.
The paper stressed on the fact that additional tests at different temperatures are needed to
investigate the role of initial compressive and tensile stresses on concrete compressive strength,
concrete strain at peak stress, and initial modulus of elasticity of concrete. Tests are also required
to evaluate the effect of elevated temperature on the: maximum compressive concrete strain,
tensile behaviour of concrete, bond strength of reinforcing bars, and stress-strain curve for confined
initially stressed concrete.
Acknowledgement
This research was funded by the Natural Sciences and Engineering Research Council of Canada
(NSERC).
24
References
[1] Phan LT, Carino NJ. Review of Mechanical Properties of HSC at Elevated Temperature. ASCE Journal of Materials in Civil Engineering 1998; 10(1): 58-64.
[2] Abrams MS. Compressive Strength of Concrete at Temperatures to 1600oF. Temperature and Concrete (Special Publication American Concrete Institute) 1971;SP-25:33-59. Detroit, MI.
[3] Hertz KD. Concrete strength for fire safety design. Mag Concrete Res 2005;57(8):445-53. [4] Lie TT. Structural Fire Protection. New York: American Society of Civil Engineers; 1992. [5] Malhotra HL. Effect of Temperature on the Compressive Strength of Concrete. Mag Concrete
Res 1956; 8:85-94. [6] Malhotra HL. Design of Fire-Resisting Structures. London: Surrey University Press; 1982 [7] Purkiss JA. Fire Safety Engineering Design of Structures. Oxford: Butterworth Heinemann;
1996. [8] Anderberg Y, Thelandersson S. Stress and Deformation Characteristics of Concrete at High
Temperatures: 2 Experimental Investigation and Material Behaviour Model. Bulletin 54. Sweden, Lund: Lund Institute of Technology 1976.
[9] Xiao J, Konig G. Study on Concrete at High Temperature in China an Overview. Fire Safety J 2004; 39: 89-103.
[10] Khennane A, Baker G. Uniaxial Model For Concrete Under Variable Temperature and Stress. J Eng Mech-ASCE 1993; 119(8): 1507-25.
[11] Purkiss JA, Dougill JW. Apparatus for Compression Tests on Concrete at High Temperatures. Mag Concrete Res 1973; 25(83): 102-8.
[12] Schneider U. Behavior of Concrete under Thermal Steady State and Non-Steady State Conditions. Fire Mater 1976; 1(3): 103-15.
[13] Schneider U. Properties of Material at High Temperatures-Concrete. RILEM-Committee 44-PHT. Department of Civil Engineering, University of Kassel; 1985.
[14] Terro MJ. Numerical Modeling of the Behavior of Concrete Structures in Fire. ACI Struct J 1998; 95(2): 183-93.
[15] Schneider U. Modelling of Concrete Behaviour at High Temperatures. In: Anchor RD, Malhotra HL, Purkiss JA. Proceeding of International Conference of Design of Structures against Fire. 1986. p. 53-69
[16] Bazant P, Chern JC. Stress-Induced Thermal and Shrinkage Strains in Concrete. J Eng Mech-ASCE 1987; 113(10): 1493-1511.
[17] Khoury GA, Grainger BN, Sullivan PJE. Transient Thermal Strain of Concrete Literature Review Conditions Within Specimen and Behaviour of Individual Constituents. Mag Concrete Res 1985; 37(132): 131-144.
[18] Khoury GA, Grainger BN, Sullivan PJE. Strain of Concrete during First Heating to 600 oC under Load. Mag Concrete Res 1985; 37(133): 195-215.
[19] Kordina K, Wydra W, Ehm C. Analysis of the Developing Damage of Concrete Due to Heating and Cooling. In: Harmathy TZ, editor. Symposium of Evaluation and Repair of Fire Damage to Concrete. 1986. p. 87-113.
[20] Felicetti R, Gambarova PG. Effects of High Temperature on the Residual Compressive Strength of High-Strength Siliceous Concretes. ACI Mater J 1998; 95(4): 395-406.
[21] Park R., Paulay T. Reinforced Concrete Structures. New York: John Wiley & Sons; 1975. [22] Mander JB, Priestley MJN, Park R, Theoretical Stress-Strain Model for Confined Concrete. J
Struct Eng-ASCE 1988; 114(8):1804-25. [23] MacGregor JG, Bartlett FM. Reinforced Concrete Mechanics and Design. Scarborough
Ontario: Prentice Hall; 2000. [24] ACI 318-05 Building Code Requirements for Structural Concrete and Commentary, 2005. [25] CSA Standard A23.3-04. Concrete Design Handbook. Cement Association of Canada; 2004. [26] Neville AM. Properties of Concrete, Essex: Longman Scientific and Technical; 1987. [27] Collins MP, Mitchell D. Prestressed Concrete Basics, Ottawa, ON, Canada: Canadian
Prestress Concrete Institute; 1987. [28] Kent DC, Park R. Flexural Members with Confined Concrete. J Struct Eng-ASCE 1971;
97(ST7): 1969-90. [29] Scott BD, Park R, Priestley MJN. Stress-Strain Behavior of Concrete Confined by Overlapping
Hoops at Low and High Strain Rates. ACI J 1982;79(1):13-27. [30] Karsan ID, Jirsa JO. Behavior of Concrete under Compressive Loadings. J Struct Eng-ASCE
1969; 95(ST12): 2543-63.
25
[31] Sheikh SA, Uzumeri SM. Strength and Ductility of Tied Concrete Columns. J Struct Eng-ASCE 1980; 106(5): 1079-102.
[32] Akkari M, Duan L. Chapter 36:Nonlinear Analysis of Bridge Structures. Bridge Engineering Handbook. Edited by Chen WF, Duan L. Boca Raton: CRC Press;2000.
[33] Paulay T, Priesley MJN. Seismic Design of Reinforced Concrete and Masonry Buildings, New York: John Wiley & Sons Inc; 1992.
[34] Lie TT, Rowe TJ, Lin TD. Residual Strength of Fire Exposed RC Columns Evaluation and Repair of Fire Damage to Concrete. American Concrete Institute 1986;SP-92: 153-74. Detroit.
[35] Lin CH, Chen ST, Yang CA. Repair of Fire Damaged Reinforced Concrete Columns. ACI Struct J 1995; 92(4): 406-11.
[36] Eurocode 2: Design of Concrete Structures ENV EC2, 1992. [37] Saafi M. Effect of fire on FRP Reinforced Concrete Members. Compos Struct 2002; 58:11-20. [38] Lie TT, Lin TD. Fire Performance of Reinforced Concrete Columns. Fire Safety Science and
Engineering ASTM 1985;Paper No.1352: 176-205 [39] Zha XX. Three-Dimensional Non-Linear Analysis of Reinforced Concrete Members in Fire.
Build Environ 2003; 38:297-307. [40] Li L, Purkiss JA. Stress-Strain Constitutive Equations of Concrete Material at Elevated
Temperatures. Fire Safety J 2005; 40:669-86. [41] BSI: Structural Use of Concrete. British Standards Institution. BS 8110; 1985. [42] Abrams M. S. Behaviour of Inorganic Materials in Fire. ASTM Symposium on Design of
Buildings for Fire Safety (Special publication 685). 1978. Boston MA. [43] Thelandersson S. Modeling of Combined Thermal and Mechanical Action in Concrete. J Eng
Mech 1987; 113(6): 893-906. [44] Gillen M. Short-term Creep of Concrete at Elevated Temperatures. Fire Mater 1981;5(4):142-
48. [45] England GL. Analyses for Creep in Heated Concrete Structures. Report No. CE 75-3. Canada:
Department of Civil Engineering, University of Calgary; 1975. [46] Nielsen CV, Pearce CJ, Bicanic N. Theoretical Model of High Temperature Effects on Uniaxial
Concrete Member Under Elastic Restraint. Mag Concrete Res 2002; 54(4): 239-49. [47] Persson B. Self-Compacting Concrete at Fire Temperature. TVBM-3110. Sweden, Lund:
Division of building materials, Lund Institute of Technology; 2003. [48] Lie TT, Stanzak WW. Empirical Method for Calculating Fire Resistance of Protected Steel
Columns. Eng J AISC (Transactions of the Canadian Society for Civil Engineering) 1974; 57. [49] Zhang B, Bicanic N. Residual Fracture Toughness of Normal- and High-Strength Gravel
Concrete after Heating to 600°C. ACI Mater J 2002; 99(3): 217-26. [50] Cruz CR. An Optical Method of Determining the Elastic Constants of Concrete. Journal of the
Portland Cement Association Research and Development Laboratories May 1962:24-32. [51] Philleo R. Some Physical Properties of Concrete at High Temperatures. Proceedings of the
American Concrete Institute 1958; 54:857-64. [52] Lie TT. Fire and Buildings. London: Applied Science Publishers Ltd; 1972. [53] Holmes M, Anchor RD, Cook GME, Crook RN. The Effect of Elevated Temperatures on the
strength Properties of Reinforcing and Prestressing Steels. Struct Eng 1982; 60B(1): 7-13. [54] Harmathy TZ, Stanzak WW. Elevated-Temperature Tensile and Creep Properties of Some
Structural and Prestressing Steels. American Society for Testing and Materials (Special Technical Publication) 1970; 464:186-208
[55] Schneider U. Behavior of Concrete at High Temperatures. Berlin: Deutscher Ausschuss fur Stahlbeton 1982; 337.
[56] Terro MJ, Hamoush SA. Effect of Confinement on Siliceous Aggregate Concrete Subjected to Elevated Temperatures and Cyclic Heating. ACI Mater J 1997; 94(2): 83-89.
26
Nomenclature As Cross sectional area of transverse reinforcement. C1, C2, C3 Constants to account for aggregate type in evaluating transient creep strain [14]. ds Diameter of the transverse reinforcing bars.
ciE Initial modulus of elasticity at ambient temperature.
ciTE Initial modulus of elasticity at elevated temperature.
1f Stress at the point of intersection of the two equations defining the stress strain curve of concrete [7].
cf Concrete compressive stress at ambient temperature. 'cf Concrete compressive strength at ambient temperature. 'ccf Compressive strength of confined concrete at ambient temperature. 'ccTf Compressive strength of confined concrete at elevated temperature.
cif Initial compressive stress before heating.
crf Cracking stress of concrete.
crTf Tensile resistance of concrete at elevated temperature.
cTf Concrete compressive stress at elevated temperature. 'cTf Concrete compressive strength at elevated temperature. 'lf Effective lateral confining stress at ambient temperature. 'lxf Effective lateral confining stress in the principal x-direction at ambient temperature. 'lyf Effective lateral confining stress in the principal y-direction at ambient temperature. 'lTf Effective lateral confining stress at elevated temperature. 'lxTf Effective lateral confining stress in the principal x-direction at elevated
temperature. 'lyTf Effective lateral confining stress in the principal y-direction at elevated
temperature. tf Concrete tensile stress at ambient temperature.
yf Yield strength of reinforcing bars at ambient temperature.
yTf Yield strength of reinforcing bars at elevated temperature. g Function to account for increase in modulus of elasticity due to external loads [14].
'h Width of the concrete core measured to outside of the transverse reinforcement. Ke Confinement effectiveness coefficient.
hK Confinement factor at ambient temperature.
hTK Confinement factor at elevated temperature.
trk Constant (1.8 to 2.35) used to evaluate transient creep strain [7]. n A non-dimensional factor that accounts for effect of the weight of concrete on the
shape of the stress-strain curve [14]. r Ratio between the initial tangent modulus of elasticity of concrete and its difference
from the secant modulus at peak stress [20]. hS Center-to-center spacing of the transverse reinforcement.
T Fire temperature in degree Celsius (≥ 20 oC). T1, T2, T8, T64 Constants describing the reduction in the concrete compressive strength for
different aggregate types [2]. gT Constant to account for aggregate type in evaluating transient creep strain [14].
Va Volume fraction of aggregate used to evaluate the transient creep strain [13]. w Moisture content in percent by weight. Z Slope of the decaying branch of the concrete stress-strain curve [26]. α Coefficient of thermal expansion of concrete.
27
1α Factor to account for bond characteristics of reinforcing bars on the concrete tension stiffening.
2α Factor to account for type of loading on the concrete tension stiffening.
oγ Constant to account for aggregate type in evaluating transient creep strain [14].
wγ Function to account for the effect of moisture content on transient creep strain [14].
cε Concrete strain at ambient temperature.
cTε Concrete strain at elevated temperature.
crε Creep strain of concrete at maximum stress.
cuε Ultimate or maximum strain of concrete.
fTε Instantaneous stress-related strain at elevated temperature.
oε Strain at maximum stress for unconfined concrete at ambient temperature.
ocε Strain at maximum stress for confined concrete at ambient temperature.
1oε , 2oε , 3oε Strain at maximum stress as function of temperature for 0%, 10%, and 20% initial stress level [13].
oTε Strain at maximum stress of unconfined concrete at elevated temperature.
oTcε Strain at maximum stress of confined concrete at elevated temperature.
smε Steel strain at maximum tensile stress.
thε Unrestrained thermal strain.
trε Transient creep strain.
uTε Maximum compressive strain for unconfined concrete at elevated temperature.
3.0ε Transient creep strain for initial stress of 0.3 'cf [13].
1ε Strain at point of intersection of the two equations defining the stress strain curve of concrete [7].
c20ε Concrete strain corresponding to a stress equal to 0.2 of the concrete strength at ambient temperature [26].
cT20ε Concrete strain corresponding to a stress equal to 0.2 of the concrete strength at elevated temperature.
h50ε Strain component that gives the additional ductility due to rectangular transverse reinforcement [26].
u50ε Strain component that takes into account effect of concrete strength on the slope of the descending branch of unconfined concrete at ambient temperature [26].
uT50ε Strain component that takes into account effect of concrete strength on the slope of the descending branch of unconfined concrete at elevated temperature.
λ Factor accounting for the density of the concrete. Lλ Factor accounting for the initial compressive stress level [13].
sρ Ratio of the volume of transverse reinforcement to the volume of concrete core measured to outside of the transverse reinforcement.
Φ Function to evaluate transient creep strain [14]. uoτ Bond strength at ambient temperature.
uTτ Bond strength at elevated temperature.
28
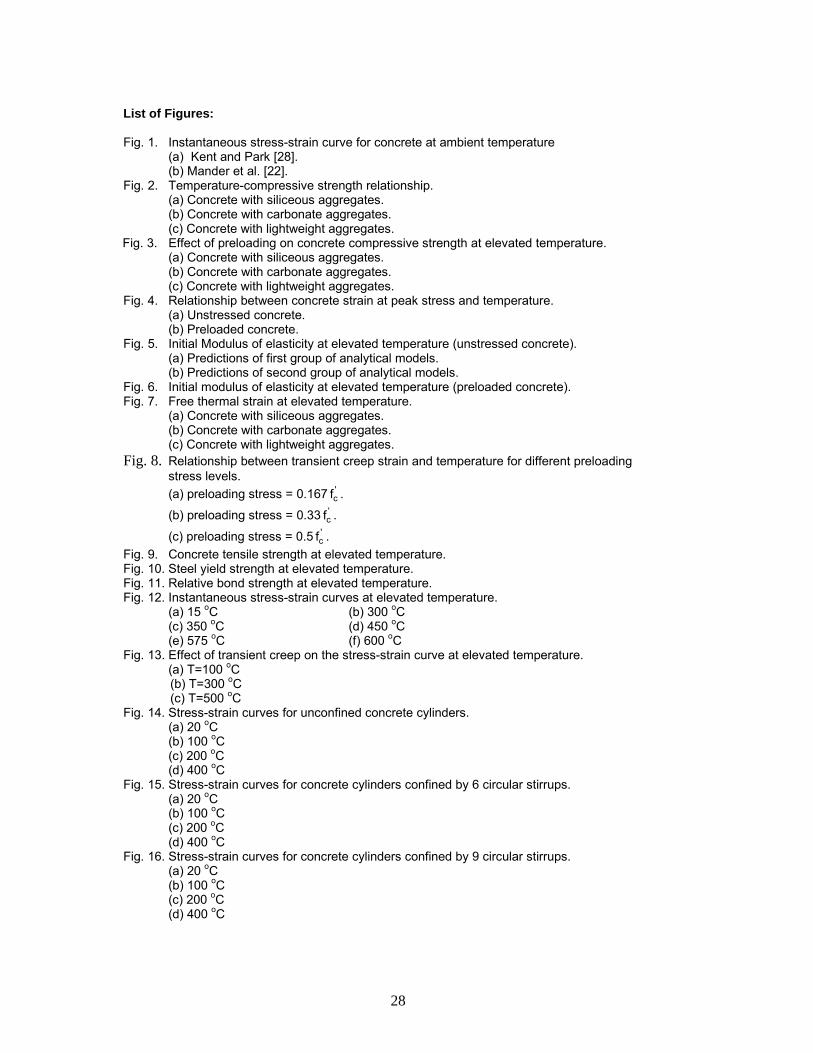
List of Figures: Fig. 1. Instantaneous stress-strain curve for concrete at ambient temperature
(a) Kent and Park [28]. (b) Mander et al. [22].
Fig. 2. Temperature-compressive strength relationship. (a) Concrete with siliceous aggregates. (b) Concrete with carbonate aggregates. (c) Concrete with lightweight aggregates.
Fig. 3. Effect of preloading on concrete compressive strength at elevated temperature. (a) Concrete with siliceous aggregates. (b) Concrete with carbonate aggregates. (c) Concrete with lightweight aggregates.
Fig. 4. Relationship between concrete strain at peak stress and temperature. (a) Unstressed concrete. (b) Preloaded concrete.
Fig. 5. Initial Modulus of elasticity at elevated temperature (unstressed concrete). (a) Predictions of first group of analytical models. (b) Predictions of second group of analytical models.
Fig. 6. Initial modulus of elasticity at elevated temperature (preloaded concrete). Fig. 7. Free thermal strain at elevated temperature.
(a) Concrete with siliceous aggregates. (b) Concrete with carbonate aggregates. (c) Concrete with lightweight aggregates.
Fig. 8. Relationship between transient creep strain and temperature for different preloading stress levels. (a) preloading stress = 0.167 '
cf .
(b) preloading stress = 0.33 'cf .
(c) preloading stress = 0.5 'cf .
Fig. 9. Concrete tensile strength at elevated temperature. Fig. 10. Steel yield strength at elevated temperature. Fig. 11. Relative bond strength at elevated temperature. Fig. 12. Instantaneous stress-strain curves at elevated temperature.
(a) 15 oC (b) 300 oC (c) 350 oC (d) 450 oC (e) 575 oC (f) 600 oC
Fig. 13. Effect of transient creep on the stress-strain curve at elevated temperature. (a) T=100 oC (b) T=300 oC (c) T=500 oC
Fig. 14. Stress-strain curves for unconfined concrete cylinders. (a) 20 oC (b) 100 oC (c) 200 oC (d) 400 oC
Fig. 15. Stress-strain curves for concrete cylinders confined by 6 circular stirrups. (a) 20 oC (b) 100 oC (c) 200 oC (d) 400 oC
Fig. 16. Stress-strain curves for concrete cylinders confined by 9 circular stirrups. (a) 20 oC (b) 100 oC (c) 200 oC (d) 400 oC
(a) Kent and Park [28].
(b) Mander et al. [22].
Fig. 1. Instantaneous stress-strain curve for concrete at ambient temperature.
εo εoc εc
'ccf
cf
'cf
Eci
ε50u εcεoc ε50c ε20c
'ch fK ⋅
fc
'ch fK5.0 ⋅⋅
'ch fK2.0 ⋅⋅
ε50h
'ch fK
tanZ θ=
θ
0.0
0.2
0.4
0.6
0.8
1.0
1.2
0 200 400 600 800 1000
TEMPERATURE (oC)
f 'cT
/f ' c
Lie (Test) [4] Malhotra (Test) [5] Abrams (Test) [2]
(a) Concrete with siliceous aggregates.
0.0
0.2
0.4
0.6
0.8
1.0
1.2
0 200 400 600 800 1000
TEMPERATURE (oC)
f 'cT
/f ' c
Abrams (Test) [2]
(b) Concrete with carbonate aggregates.
0.0
0.2
0.4
0.6
0.8
1.0
1.2
0 200 400 600 800 1000
TEMPERATURE (oC)
f 'cT
/f ' c
Abrams (Test) [2]
(c) Concrete with lightweight aggregates.
Lie, Rowe & Lin (Model) [34] Eurocode 2 (Model) [36] Lie & Lin (Model) [38] Li & Purkiss (Model) [40] Hertz (Model) [3]
Fig. 2. Temperature-compressive strength relationship.
0.0
0.2
0.40.6
0.8
1.0
1.2
0 100 200 300 400 500 600 700 800 900
TEMPERATURE (oC)
f 'cT
/f ' c
(a) Concrete with siliceous aggregates.
0.0
0.2
0.4
0.6
0.8
1.0
1.2
0 100 200 300 400 500 600 700 800 900
TEMPERATURE (oC)
f 'cT
/f ' c
(b) Concrete with carbonate aggregates.
0.0
0.2
0.4
0.6
0.8
1.0
1.2
0 100 200 300 400 500 600 700 800 900
TEMPERATURE (oC)
f 'cT
/f ' c
(c) Concrete with lightweight aggregates.
Hertz (Model)-Unloaded [3] Abrams (Test)-Unloaded [2]
Hertz (Model) Preloaded [3] Abrams (Test) Preloaded [2]
Fig. 3. Effect of preloading on concrete compressive strength at elevated temperature.
0.000
0.005
0.010
0.015
0.020
0.025
0.030
0.035
0 100 200 300 400 500 600 700 800 900
TEMPERATURE (oC)
STR
AIN
AT
PE
AK
STR
ES
S
(a) Unstressed concrete.
0.000
0.005
0.010
0.015
0.020
0.025
0.030
0.035
0 100 200 300 400 500 600 700 800 900
TEMPERATURE (oC)
STR
AIN
AT
PE
AK
STR
ES
S
(b) Preloaded concrete.
Anderberg & Thelandersson (Test) [8] Schneider (Test) [12]Bazant & Chern (Test) [16] Purkiss & Dougill (Test) [11]Lie (Model) [4] Li & Purkiss (Model) [40] Xiao & Konig (Model) [9] Bazant & Chern (Model) [16] Khennane & Baker (Model) [10] Terro (Model) [14]
Fig. 4. Relationship between concrete strain at peak stress and temperature.
0.0
0.2
0.4
0.6
0.8
1.0
1.2
0 200 400 600 800
TEMPERATURE (oC)
Eci
T/E
ci
Xiao & Konig (Model) [9]
Xiao & Konig (Model) [9]
Li & Purkiss (Model) [40]
BSI (Model) [41]
Cruz (Test) [50]
Schneider (Test) [15]
Schneider (Test) [15]
Schneider (Test) [15]
Schneider (Test) [15]
Lie (Test) [4]
Lie (Test) [4]
Lie (Test) [4]
Philleo (Test) [51]
Purkiss (Test) [7]
Anderberg (Test) [8]
(a) Predictions of first group of analytical models.
0.0
0.2
0.4
0.6
0.8
1.0
1.2
0 200 400 600 800
TEMPERATURE (oC)
Eci
T/E
ci
Schneider (Model) [15]
Schneider (Model) [15]
Khennane (Model) [10]
Anderberg (Model) [8]
Cruz (Test) [50]
Schneider (Test) [15]
Schneider (Test) [15]
Schneider (Test) [15]
Schneider (Test) [15]
Lie (Test) [4]
Lie (Test) [4]
Lie (Test) [4]
Philleo (Test) [51]
Purkiss (Test) [7]
Anderberg (Test) [8]
(b) Predictions of second group of analytical models.
Fig. 5. Initial Modulus of elasticity at elevated temperature (unstressed concrete).
0.0
0.2
0.4
0.6
0.8
1.0
1.2
0 100 200 300 400 500 600 700 800
TEMPERATURE (oC)
Eci
T/E
ci
Khennane & Baker (Model) [10]Anderberg & Thelandersson (Model) [8]Schneider (Model) [15]Anderberg & Thelandersson (Test)-Preloaded (10%) [8]Anderberg & Thelandersson (Test)-Preloaded (17-22.5%) [8]Anderberg & Thelandersson (Test)-Preloaded (45%) [8]
Fig. 6. Initial modulus of elasticity at elevated temperature (preloaded concrete).
0.000
0.003
0.006
0.009
0.012
0.015
0 100 200 300 400 500 600 700 800
TEMPERATURE (oC)
FRE
E T
HE
RM
AL
STR
AIN
(a) Concrete with siliceous aggregates.
0.000
0.003
0.006
0.009
0.012
0.015
0 100 200 300 400 500 600 700 800
TEMPERATURE (oC)
FRE
E T
HE
RM
AL
STR
AIN
(b) Concrete with carbonate aggregates.
0.000
0.003
0.006
0.009
0.012
0.015
0 100 200 300 400 500 600 700 800
TEMPERATURE (oC)
FRE
E T
HE
RM
AL
STR
AIN
(c) Concrete with lightweight aggregates.
Lie (Model) [4] Eurocode 2 (Model) [36]Abrams (Test) [42] Lie (Test) [4]Khoury et al (Test) [18]
Fig. 7. Free thermal strain at elevated temperature.
0.000
0.003
0.006
0.009
0.012
0.015
0 100 200 300 400 500 600 700
TEMPERATURE (oC)
TRA
NS
IEN
T S
TRA
IN
(a) preloading stress = 0.167 'cf .
0.000
0.003
0.006
0.009
0.012
0.015
0 100 200 300 400 500 600 700
TEMPERATURE (oC)
TRA
NS
IEN
T S
TRA
IN
(b) preloading stress = 0.33 'cf .
0.000
0.003
0.006
0.009
0.012
0.015
0 100 200 300 400 500 600 700
TEMPERATURE (oC)
TRA
NS
IEN
T S
TRA
IN
(c) preloading stress = 0.5 'cf .
Persson (Test) [47] Anderberg & Thelandersson (Model) [8]Schneider (Model) [15] Terro (Model) [14]Nielsen et al (Model) [46] Li & Purkiss (Model) [40]
Fig. 8. Relationship between transient creep strain and temperature for different preloading stress levels.
0.0
0.3
0.6
0.9
1.2
0 200 400 600 800 1000
TEMPERATUERE (oC)
fcrT/
f cr
Lie (Test) [4]Anderberg & Thelandersson (Test) [8]Bazant & Chern (Model) [16]Xiao & Konig (Model) [9]Terro (Model) [14]
Fig. 9. Concrete tensile strength at elevated temperature.
0.0
0.2
0.4
0.6
0.8
1.0
1.2
0 200 400 600 800 1000 1200
TEMPERATURE (oC)
fyT/
f y
Malhotra (Test) [6] Lie and Stanzak (Test) [48]Lie and Stanzak (Test) [48] Lie and Stanzak (Test) [48]Holmes et al (Test) [53] Xiao & Konig (Test) [9]Xiao & Konig (Test) [9] Harmathy & Stanzak (Test) [54]Harmathy & Stanzak (Test) [54] Eurocode 2 (Model) [36]Lie & Stanzak (Model) [48] Lie (Model) [4]
Fig.10. Steel yield strength at elevated temperature.
0.0
0.2
0.4
0.6
0.8
1.0
1.2
0 100 200 300 400 500 600 700 800
TEMPERATURE (C)
RE
LATI
VE B
ON
D S
TREN
GTH
Malhotra (Test) [6] Malhotra (Test) [6] Xiao & Konig (Test) [9] Xiao & Konig (Test) [9] Xiao & Konig (Model) [9]
Fig. 11. Relative bond strength at elevated temperature.
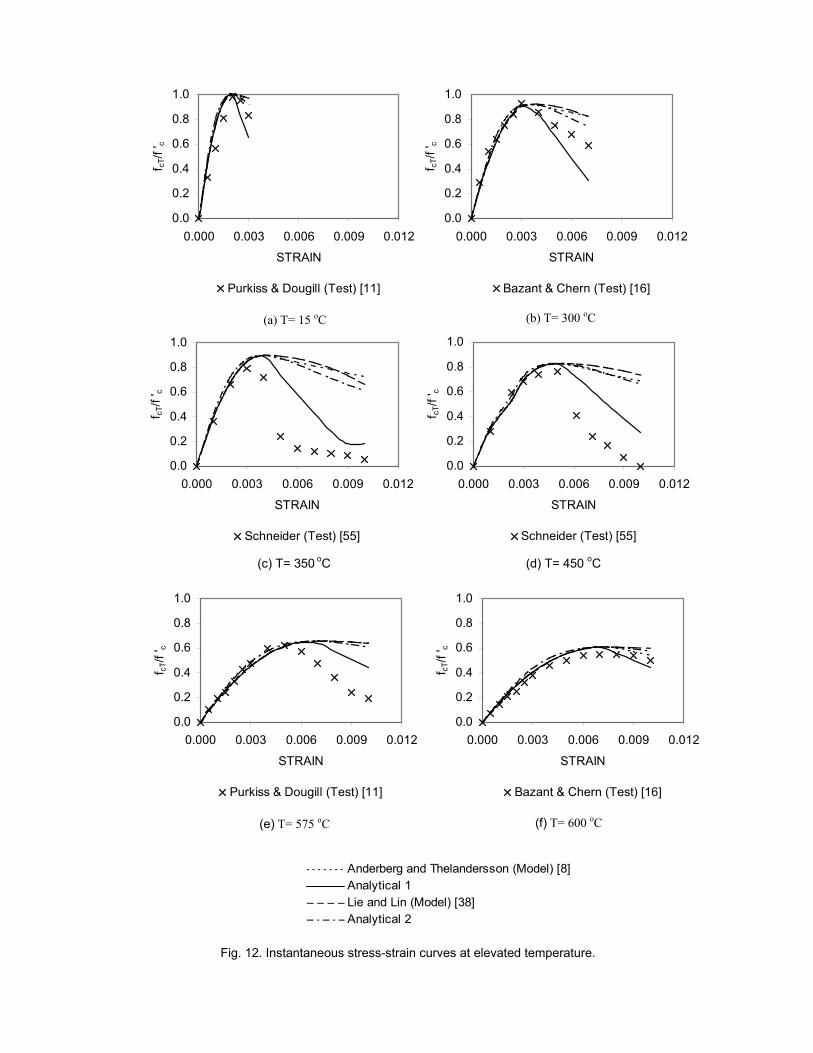
Fig. 12. Instantaneous stress-strain curves at elevated temperature.
0.0
0.2
0.4
0.6
0.8
1.0
0.000 0.003 0.006 0.009 0.012
STRAIN
f cT/f
' c
Purkiss & Dougill (Test) [11]
(a) T= 15 oC (b) T= 300 oC
(c) T= 350 oC
(d) T= 450 oC
(e) T= 575 oC (f) T= 600 oC
Anderberg and Thelandersson (Model) [8]Analytical 1Lie and Lin (Model) [38]Analytical 2
0.0
0.2
0.4
0.6
0.8
1.0
0.000 0.003 0.006 0.009 0.012
STRAIN
f cT/f
' c
Bazant & Chern (Test) [16]
0.0
0.2
0.4
0.6
0.8
1.0
0.000 0.003 0.006 0.009 0.012
STRAIN
f cT/f
' c
Schneider (Test) [55]
0.0
0.2
0.4
0.6
0.8
1.0
0.000 0.003 0.006 0.009 0.012
STRAIN
f cT/f
' c
Schneider (Test) [55]
0.0
0.2
0.4
0.6
0.8
1.0
0.000 0.003 0.006 0.009 0.012
STRAIN
f cT/f
' c
Purkiss & Dougill (Test) [11]
0.0
0.2
0.4
0.6
0.8
1.0
0.000 0.003 0.006 0.009 0.012
STRAIN
f cT/f
' c
Bazant & Chern (Test) [16]
0.0
0.2
0.4
0.6
0.8
1.0
1.2
0 5 10 15 20
Normalized Strain
Nor
mal
ized
Stre
ss (f
cT/f
' cT)
0.0
0.2
0.4
0.6
0.8
1.0
1.2
0 5 10 15 20
Normalized Strain
Nor
mal
ized
Stre
ss (f
cT/f
' cT)
0
0.2
0.4
0.6
0.8
1
1.2
0 5 10 15 20
Normalized Strain
Nor
mal
ized
Stre
ss (
f cT/f
' cT)
Analytical 1Analytical 2Schneider (Model) [15]Anderberg & Thelandersson (Model) [8]Terro (Model) [14]
Fig. 13. Effect of transient creep on the stress-strain curve at elevated temperature.
(a) T=100 oC
(b) T=300 oC
(c) T=500 oC
Normalized Strain (εcT/εo)
Normalized Strain (εcT/εo)
Normalized Strain (εcT/εo)
0.00.51.01.52.0
0 1 2 3 4 5
εcT/εo
f cT/f
' c
(a) T= 20oC
0.00.51.01.52.0
0 1 2 3 4 5
εcT/εo
f cT/f
' c
(b) T= 100oC
0.00.51.01.52.0
0 1 2 3 4 5
εcT/εo
f cT/f
' c
(c) T= 200oC
0.00.51.01.52.0
0 1 2 3 4 5
εcT/εo
f cT/f
' c
(d) T= 400oC
Analytical 1 Analytical 2 Terro & Hamoush (Test) [56]
Fig. 14. Stress-strain curves for unconfined concrete cylinders.
0.00.51.01.52.0
0 1 2 3 4 5
εcT/εoc
f cT/f
' c
(a) T= 20oC
0.00.51.01.52.0
0 1 2 3 4 5
εcT/εoc
f cT/f
' c
(b) T= 100oC
0.00.51.01.52.0
0 1 2 3 4 5
εcT/εoc
f cT/f
' c
(c) T= 200oC
0.00.51.01.52.0
0 1 2 3 4 5
εcT/εoc
f cT/f
' c
(d) T= 400oC
Anderberg & Thelandersson (Model) [8] Analytical 1
Lie & Lin (Model) [38] Analytical 2
Terro & Schneider (Models) [14,15] Terro & Hamoush (Test) [56]
Fig. 15. Stress-strain curves for concrete cylinders confined by 6 circular stirrups.
0.00.51.01.52.0
0 1 2 3 4 5
εcT/εoc
f cT/f
' c
(a) T= 20oC.
0.00.51.01.52.0
0 1 2 3 4 5
εcT/εoc
f cT/f
' c
(b) T= 100oC.
0.00.51.01.52.0
0 1 2 3 4 5
εcT/εoc
f cT/f
' c
(c) T= 200oC.
0.00.51.01.52.0
0 1 2 3 4 5
εcT/εoc
f cT/f
' c
(d) T= 400oC.
Anderberg & Thelandersson (Model) [8] Analytical 1
Lie & Lin (Model) [38] Analytical 2
Terro & Schneider (Models) [14,15] Terro & Hamoush (Test) [56]
Fig. 16. Stress-strain curves for concrete cylinders confined by 9 circular stirrups.