Embed Size (px)
Citation preview
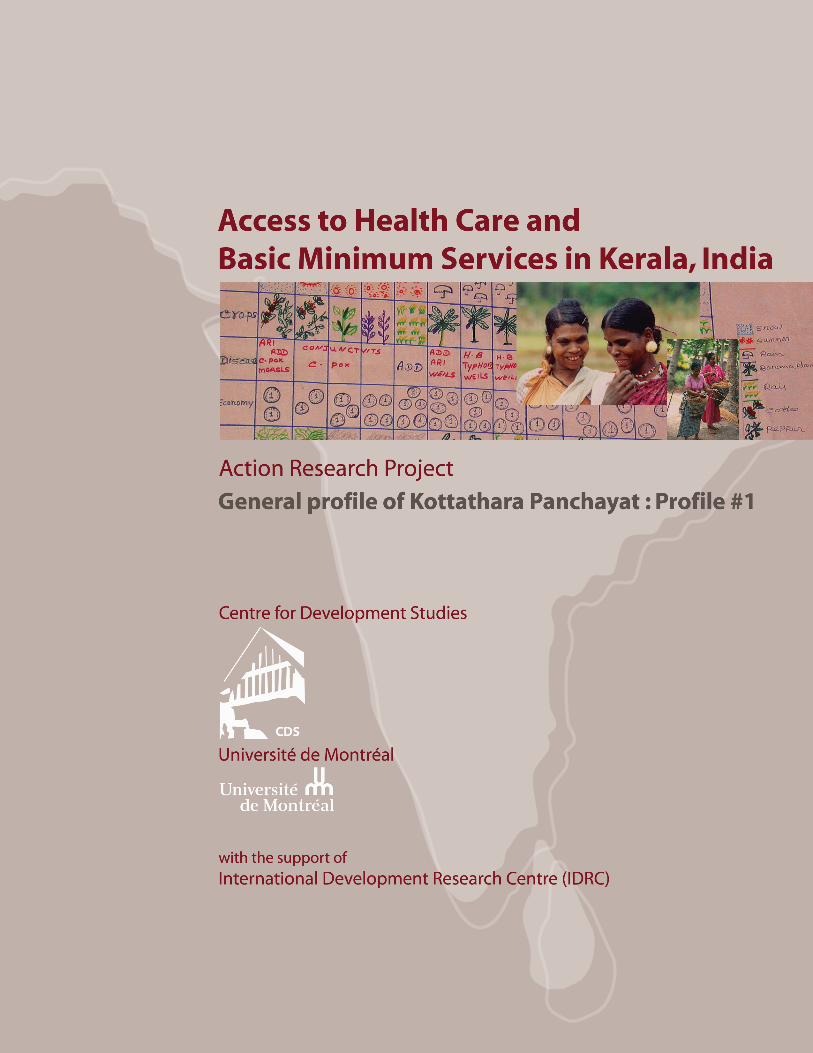
General profile of Kottathara Panchayat
Profile #1
D. Narayana, S. Haddad, K.S. Mohindra, and S. Aravind
December, 2005
Introduction to Profiles This report is the first of seven reports from the action research initiative, Access to Health Care
and Basic Minimum Services in Kerala, India, in Kottathara Panchayat, Wayanad. The series of
reports aim to serve as a planning tool for the design of community-based interventions and
policies, by providing economic, social, and health profiles of the 3352 households living in
Kottathara Panchayat.
The report highlights general trends, and disparities that exist within and between the 10 wards
of the Panchayat. Using a standardized approach, the report adopts a user-friendly format
(simple tables, graphs, and maps), which will be presented to and discussed in institutions of
participatory governance (e.g. Grama Sabha, Working groups) encouraging the appropriation of
the information.
Social groups will be compared according to their poverty status, gender, religious, caste and
tribal affiliation, in order to assess potential inequalities in needs, resources, and access to basic
services and schemes. Due to the presence of a high proportion of tribes in the total population
and large inter-tribal variation, information is presented separately for the most primitive and
deprived tribe, the Paniyas and the other social groups.
. In order to capture a broad spectrum of the welfare of the population, a series of seven reports
have been prepared. Each report is a stand-alone report, with a particular focus (see below)
designed to meet the needs of specific stakeholders. Consequently, replication of some
information may be expected across the reports. The reports are:
1) General Profile. This report provides an overview of the Panchayat, including
geopolitical and background features of the area, as well as socio-demographic, and
economic characteristics of the population, broad indicators of access to basic services,
social participation, and health.
2) Poverty Profile. This report analyses poverty and inequality in the Panchayat, adopting
a multidimensional approach to poverty measurement that emphasizes processes, and
not merely resources or outcomes. The specificities of the Kerala context are considered.
3) Health Profile: This report examines health from a population perspective that looks at
demographics of targeted populations of local public health programs, health needs,
health inputs, and access to health care. Social inequalities in health are also examined.
4) Access to Basic Services. This report examines access to basic services in the
Panchayat, such as water and sanitation, electricity, health care, and social security.
Barriers to these services are also considered.
5) Gender Profile : This report explores gender differences in the Panchayat, comparing
indicators of welfare according to gender at both the individual level (i.e. men and
women, boys and girls), and at the household level (i.e. male versus female headed
households). Also profiles of key vulnerable groups, such as widows, are highlighted.
6) Tribal Profile : This report focuses on the welfare of tribal groups in the Panchayat,
including their living conditions, basic needs, and access to resources and services. Data
is provided to highlight both differences between tribals and non tribals, and differences
among tribal groups.
7) Financial protection : Paying for Health Care : This reports assesses the economic
burden of health care, including health care costs, household coping strategies,
inequalities in accessing care, and preferences for a community based health insurance
scheme are included.
These reports draw heavily on preliminary findings of a household survey conducted in
Kottathara panchayat during April-June 2003. The survey evolved into a ‘census’ as a review of
the surveys carried out in Kottathara revealed that although a number of surveys had been
conducted in Kottathara, there was no complete listing of households, and thus, no baseline
data was available. Following pre-testing of the household survey questionnaire in April 2003,
the census was carried out by 20 trained investigators. This survey depended entirely on
surveyors, all from within the Panchayat, who were trained and supervised by the Centre for
Development Studies. The response rate of the census was 99.0% for full completion1. In
addition to census data, other sources of information, including complementary surveys
conducted by the research team, as well as local and national data are integrated.
These reports are working documents; comments and suggestions are welcome. The reports
aim to provide the local government with provisional data and ideas in their choice of indicators
to monitor, ways of reporting data, facilitating their ability to assess the felt needs of the people,
and to re-orient welfare schemes accordingly.
1 Among the total of 3352 households that were visited, there were 0 households that refused to participate, and 11 households for which the survey was incomplete.
Table of Content 1.0 Background on project area ............................................................................................... 1
1.1 Kerala state..................................................................................................................... 1 1.2 Wayanad district ............................................................................................................. 1 1.3 Kottathara Panchayat ..................................................................................................... 3
2.0 Socio-demographics........................................................................................................... 5 2.1 Population surveyed ....................................................................................................... 5 2.2 Age distribution ............................................................................................................... 5 2.3 Dependency ratios .......................................................................................................... 6 2.4 Female-headed households ........................................................................................... 6 2.5 Social groups : Religion, Caste, and Tribal affiliations.................................................... 6 2.6 Sex ratios ........................................................................................................................ 9 2.7 Household size ............................................................................................................. 10 2.8 Tribal colonies............................................................................................................... 11 2.9 Education ...................................................................................................................... 14
3.0 Economic characteristics.................................................................................................. 16 3.1 Employment .................................................................................................................. 16 3.2 Land .............................................................................................................................. 19 3.3 Income poverty and BPL status .................................................................................... 20
4.0 Access to amenities.......................................................................................................... 21 5.0 Social participation ........................................................................................................... 22 6.0 Health and disability ......................................................................................................... 23
6.1 Overview of child, adult, and elderly health .................................................................. 23 6.2 Reported health status among adults in the general population................................... 24
7.0 Gender gaps..................................................................................................................... 25 8.0 Scheduled Tribes and social gaps.................................................................................... 27 9.0 Inter-ward variation........................................................................................................... 28
iii
CDS-UdeM 2004 General Profile of Kottathara Panchayat
1.0 Background on project area
1.1 Kerala state
Kerala state, located on the south-western tip of India, is widely known for the superior social
and health achievements, at low levels of income. These achievements, among others, include
life expectancies comparable to industrialized countries, ‘universal literacy’ of the population,
and elevated women’s status compared to the rest of India. Historical specificities (e.g. two of
three regions were not occupied by British colonials), cultural practices (e.g. matrilineal
communities), and strong public action and progressive policies (e.g. land redistribution policies)
are some of the key factors behind these achievements.
Over the past three decades there have been two major, and possibly interrelated trends across
the state. The first trend involves emigration of Keralites; a large number of individuals
(especially men) left the state to work in other states, or outside the country, notably in the Gulf
region. The emigration has led to large current transfers that have had an important impact upon
the disposable income of households, and the economy more generally. The second trend is a
move away from agriculture (and agricultural labour) to non-agricultural activities. Over fifty
percent of the domestic income of the state now originates in the service sector.
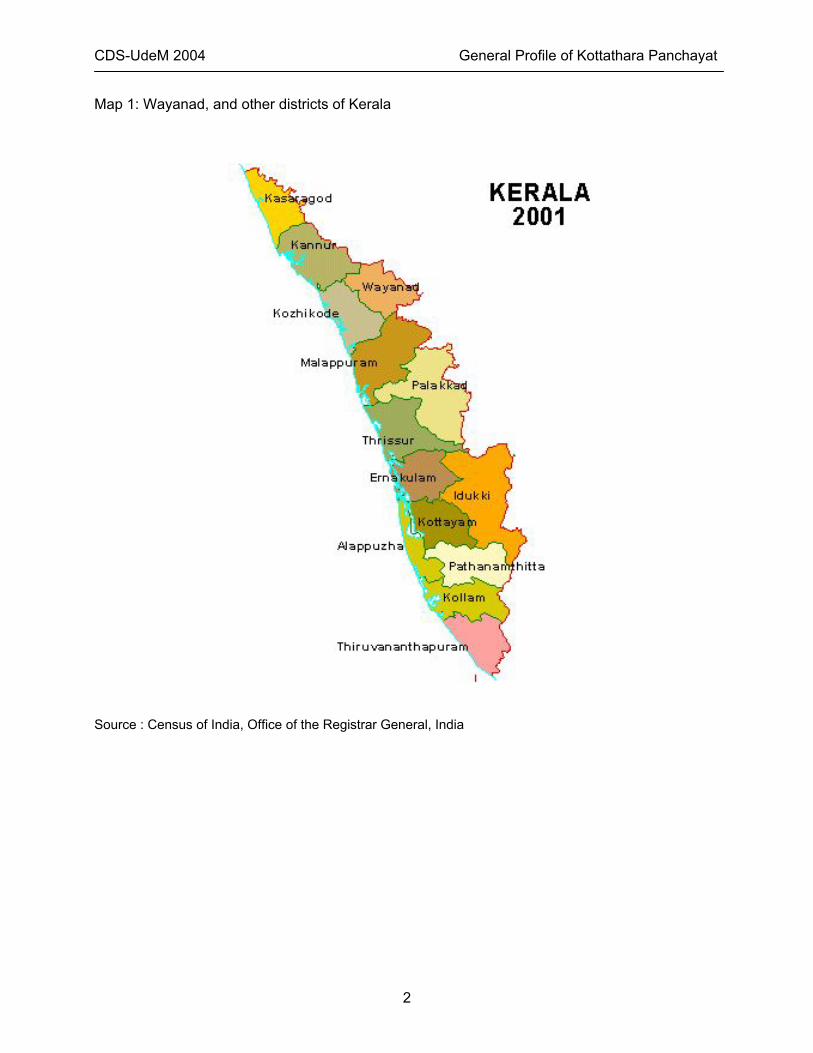
1.2 Wayanad district Wayanad is a mountainous district located in northern of Kerala (Map 1). Wayanad, covers an
area of 2, 131 sq. kms., and is essentially rural. The total population in 2001 is 786, 627, and the
percentage of urban population in Wayanad is 3.8 (the lowest among all 14 districts of Kerala),
with a population density of 369/sq.m (Census of India, 2001). Wayanad is also one of the
poorer districts in Kerala. The BPL census of 1998-99 of the Rural Development Department
which estimated the proportion of poor living in each district, found it to be considerably higher
in Wayanad (50%) compared to the state average (37%)2.
2 These results should be interpreted with some caution, as the estimates of poverty was 25% higher than the consumption (NSSO) based estimates.
1
CDS-UdeM 2004 General Profile of Kottathara Panchayat
Map 1: Wayanad, and other districts of Kerala
Source : Census of India, Office of the Registrar General, India
2
CDS-UdeM 2004 General Profile of Kottathara Panchayat
The transformation witnessed elsewhere in Kerala over the last three decades has bypassed
Wayanad, which continues to function as an agricultural economy. The majority of workers are
employed as cultivators or agricultural labourers. Recent declines in agricultural prices in the
state have negatively impacted on the economy. In Wayanad, pepper and coffee are the main
crops, which have been particularly hit hard. For example, pepper prices dropped from 20, 506
Rs per 100 kg in 1999/2000 to 7, 814 Rs per 100 kg in 2002/03 (GOK, various years). A severe
drought in 2003 has added to the hardships in the area.
Over one third of Kerala’s Scheduled Tribes (ST) live in Wayanad; the percentage of tribal
populations is 17%, compared to the state average at 1% (GOK, 1993). STs are the most
deprived group in Indian society, possessing little human and physical capital, often facing
economic and social exclusion. Poverty is higher among ST populations. The 1998-99 BPL
census identified that 80% of ST’s living in Wayanad were poor. There are a number of different
tribal populations living in Wayanad, including Paniyas, Kurichiar, Kurumas, Irulas, and
Kattunayakkas. These groups vary in terms of socio-economic status and quality of life. For
example, the Paniyas are landless, and have few assets, while the Kurichiars own land and are
considered to be at a higher level of 'modernisation'.
1.3 Kottathara Panchayat
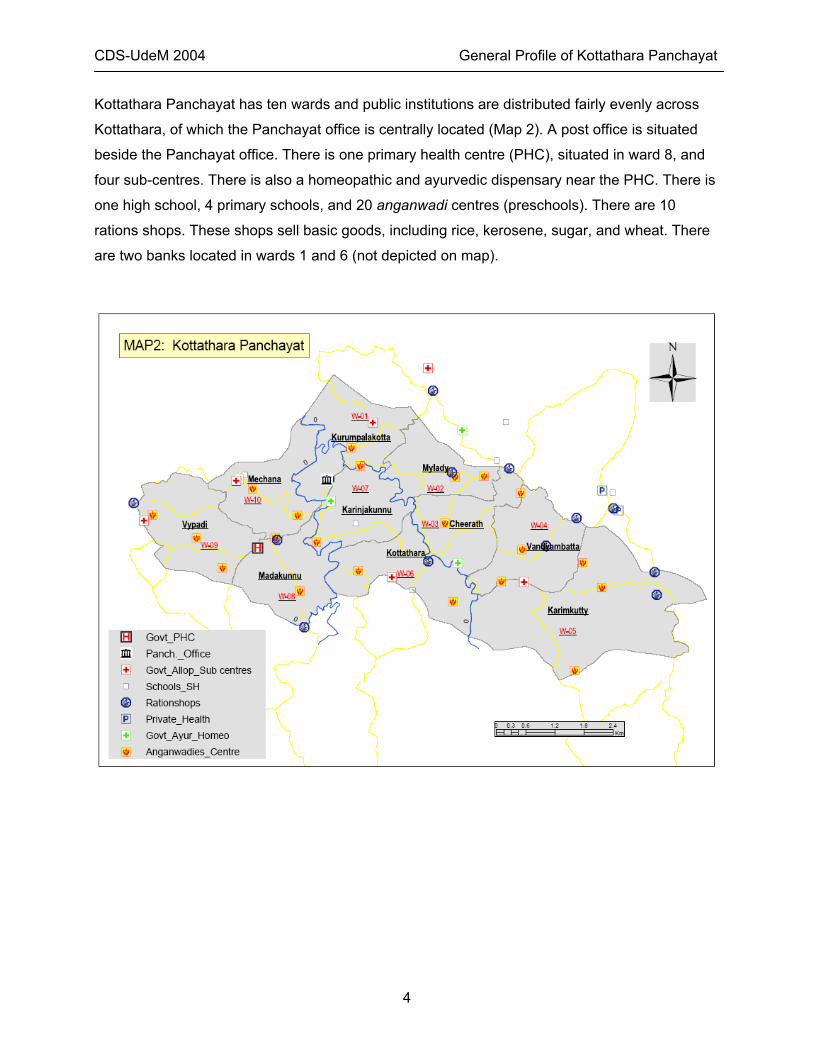
Map 2. The total land area of Kottathara is 31.75 sq. km, composed of 5628 acres of dry land,
and 1919 acres of wetland (2002-2007 Development Report, Kottathara Panchayat). The
Panchayat is situated 20 kms from Kalpetta, the district headquarter. The most recent data
available of the Panchayat comes from the 2001 Census. According to the census, the total
number of households in Kottathara was 3360. The total population is 16, 613 (8254 males, and
8359 females), with a population density of 523/sq.km. Kottathara is a multi-religious (Hindu,
Muslims, Christians, and Jains), multi-caste/tribe village. Among the more disadvantaged groups
in society, the percentage of Scheduled Castes is quite low (3%), while there is a high
percentage of Scheduled Tribes (28%), predominantly from the Paniya and Kurichiar tribes.
3
CDS-UdeM 2004 General Profile of Kottathara Panchayat
Kottathara Panchayat has ten wards and public institutions are distributed fairly evenly across
Kottathara, of which the Panchayat office is centrally located (Map 2). A post office is situated
beside the Panchayat office. There is one primary health centre (PHC), situated in ward 8, and
four sub-centres. There is also a homeopathic and ayurvedic dispensary near the PHC. There is
one high school, 4 primary schools, and 20 anganwadi centres (preschools). There are 10
rations shops. These shops sell basic goods, including rice, kerosene, sugar, and wheat. There
are two banks located in wards 1 and 6 (not depicted on map).
4
CDS-UdeM 2004 General Profile of Kottathara Panchayat
2.0 Socio-demographics
2.1 Population surveyed
The Kottathara survey covered the entire Panchayat. There were 3352 households identified
and surveyed. The following demographic information is based on information collected from
these households. The survey identified 16,110 individuals, 336 individuals who were ‘absent’ at
the time of the survey, and 108 who were ‘visitors’.
2.2 Age distribution
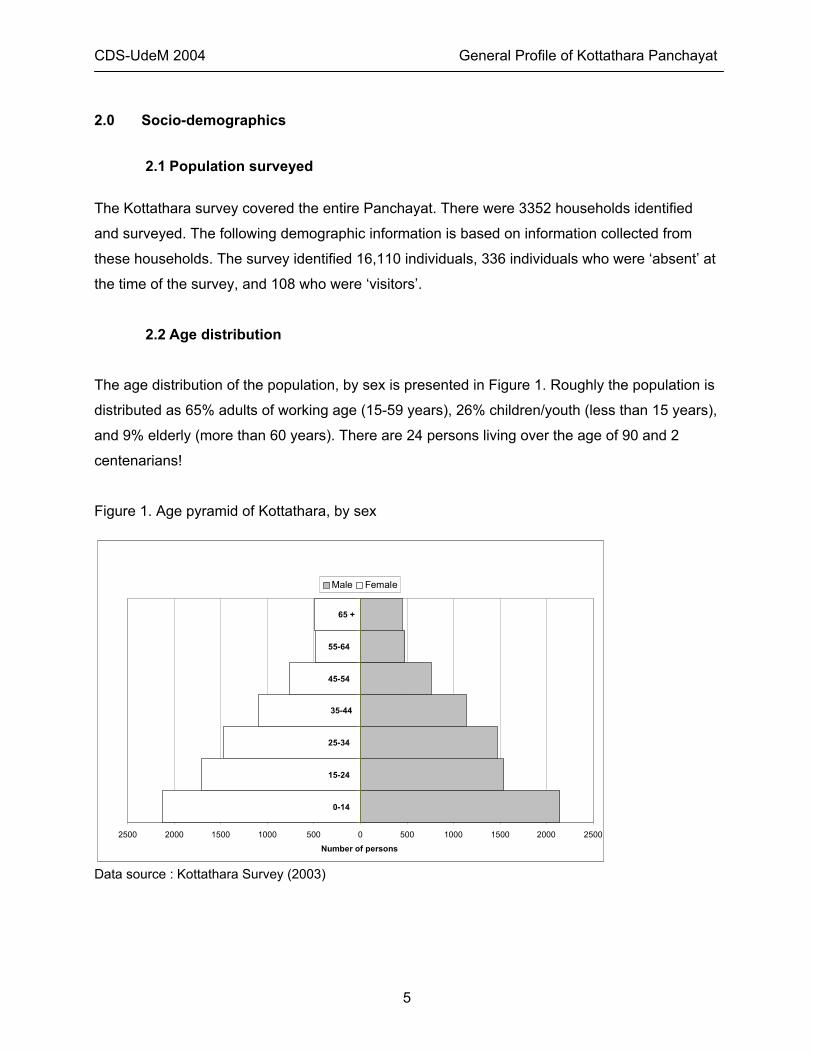
The age distribution of the population, by sex is presented in Figure 1. Roughly the population is
distributed as 65% adults of working age (15-59 years), 26% children/youth (less than 15 years),
and 9% elderly (more than 60 years). There are 24 persons living over the age of 90 and 2
centenarians!
Figure 1. Age pyramid of Kottathara, by sex
2500 2000 1500 1000 500 0 500 1000 1500 2000 2500
0-14
15-24
25-34
35-44
45-54
55-64
65 +
Number of persons
Male Female
Data source : Kottathara Survey (2003)
5
CDS-UdeM 2004 General Profile of Kottathara Panchayat
Kerala has the highest percentage of elderly population among the Indian states. Aging of the
population raises a number of issues, such as increasing health care needs, economic
dependency, particularly among vulnerable groups, such as widows. In Kottathara 13% of
females older than 15 years old are widows (See Gender Profile for a detailed discussion on
widows).
2.3 Dependency ratios
The dependency ratio is 544 per 1,000. The dependency ratio is the sum of the number of
children (younger than 15 years) and the number of elderly (older than 60 years) per 1,000
persons in the age group 15-59 years. The child/adult ratio is 409 per 1,000. The elderly/adult,
or ‘old age’ dependency ratio is 135 per 1,000.
2.4 Female-headed households
There are 559 female-headed households, representing 17% of all the households in the
Panchayat. Among these female-headed households, 54% are over the age of 60 years, and
88% are widows.
2.5 Social groups : Religion, Caste, and Tribal affiliations
2.5.1 Distribution of religious and caste/tribe according to India’s official classification
The religious groups in Kottathara include Hindus (54%), Christians (23%), Muslims (22%), and
Jains (1%). There are also multiple castes, which remains an important social stratification
system. The high castes or Forward Castes (FC) are derived from the traditional elites of Indian
society. Lower castes are divided into two categories. The first category is the Scheduled Castes (SC) who are at the bottom of the caste hierarchy, previously known as ‘untouchables’.
The second category is the Other Backward Castes (OBC). There are also Scheduled Tribes (ST), who do not fall within the caste system. The official classification system in India has three
categories, Scheduled Castes and Scheduled Tribes (SC/ST), OBC, and forward castes. We
use the caste/tribal affiliation of the head of the household as a proxy for the household, and
other household members throughout the profiles. The caste/tribe affiliations (hereafter called
social group) of the population in Kottathara is 31% SC/ST, 34% OBC, and 35% forward castes.
6
CDS-UdeM 2004 General Profile of Kottathara Panchayat
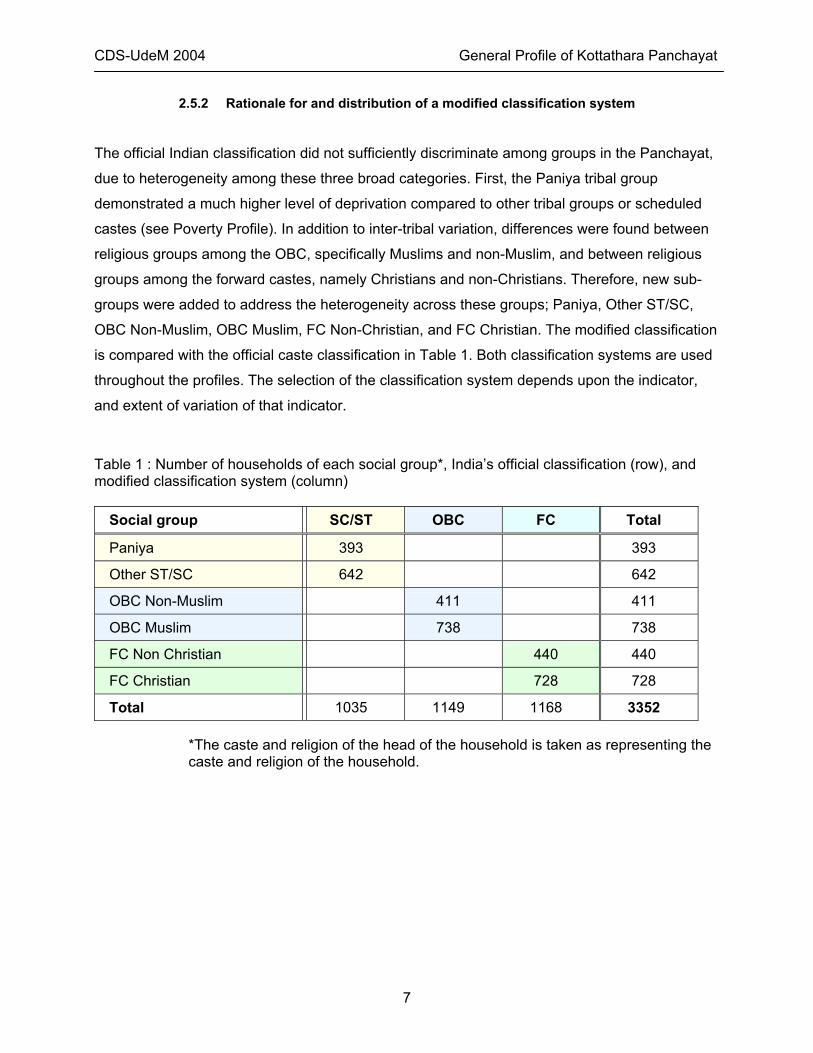
2.5.2 Rationale for and distribution of a modified classification system The official Indian classification did not sufficiently discriminate among groups in the Panchayat,
due to heterogeneity among these three broad categories. First, the Paniya tribal group
demonstrated a much higher level of deprivation compared to other tribal groups or scheduled
castes (see Poverty Profile). In addition to inter-tribal variation, differences were found between
religious groups among the OBC, specifically Muslims and non-Muslim, and between religious
groups among the forward castes, namely Christians and non-Christians. Therefore, new sub-
groups were added to address the heterogeneity across these groups; Paniya, Other ST/SC,
OBC Non-Muslim, OBC Muslim, FC Non-Christian, and FC Christian. The modified classification
is compared with the official caste classification in Table 1. Both classification systems are used
throughout the profiles. The selection of the classification system depends upon the indicator,
and extent of variation of that indicator.
Table 1 : Number of households of each social group*, India’s official classification (row), and modified classification system (column)
Social group SC/ST OBC FC Total
Paniya 393 393
Other ST/SC 642 642
OBC Non-Muslim 411 411
OBC Muslim 738 738
FC Non Christian 440 440
FC Christian 728 728
Total 1035 1149 1168 3352
*The caste and religion of the head of the household is taken as representing the caste and religion of the household.
7
CDS-UdeM 2004 General Profile of Kottathara Panchayat
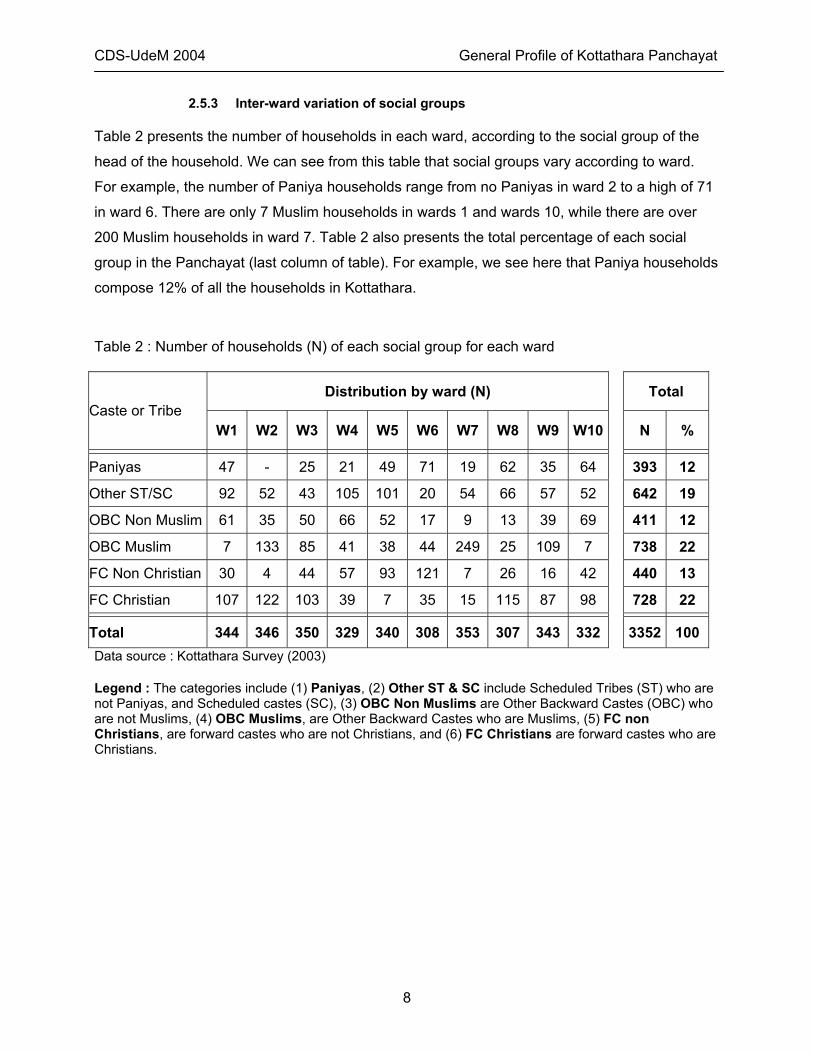
2.5.3 Inter-ward variation of social groups Table 2 presents the number of households in each ward, according to the social group of the
head of the household. We can see from this table that social groups vary according to ward.
For example, the number of Paniya households range from no Paniyas in ward 2 to a high of 71
in ward 6. There are only 7 Muslim households in wards 1 and wards 10, while there are over
200 Muslim households in ward 7. Table 2 also presents the total percentage of each social
group in the Panchayat (last column of table). For example, we see here that Paniya households
compose 12% of all the households in Kottathara.
Table 2 : Number of households (N) of each social group for each ward
Distribution by ward (N)
Total Caste or Tribe
W1 W2 W3 W4 W5 W6 W7 W8 W9 W10
N %
Paniyas 47 - 25 21 49 71 19 62 35 64 393 12
Other ST/SC 92 52 43 105 101 20 54 66 57 52 642 19
OBC Non Muslim 61 35 50 66 52 17 9 13 39 69 411 12
OBC Muslim 7 133 85 41 38 44 249 25 109 7 738 22
FC Non Christian 30 4 44 57 93 121 7 26 16 42 440 13
FC Christian 107 122 103 39 7 35 15 115 87 98 728 22
Total 344 346 350 329 340 308 353 307 343 332 3352 100 Data source : Kottathara Survey (2003) Legend : The categories include (1) Paniyas, (2) Other ST & SC include Scheduled Tribes (ST) who are not Paniyas, and Scheduled castes (SC), (3) OBC Non Muslims are Other Backward Castes (OBC) who are not Muslims, (4) OBC Muslims, are Other Backward Castes who are Muslims, (5) FC non Christians, are forward castes who are not Christians, and (6) FC Christians are forward castes who are Christians.
8
CDS-UdeM 2004 General Profile of Kottathara Panchayat
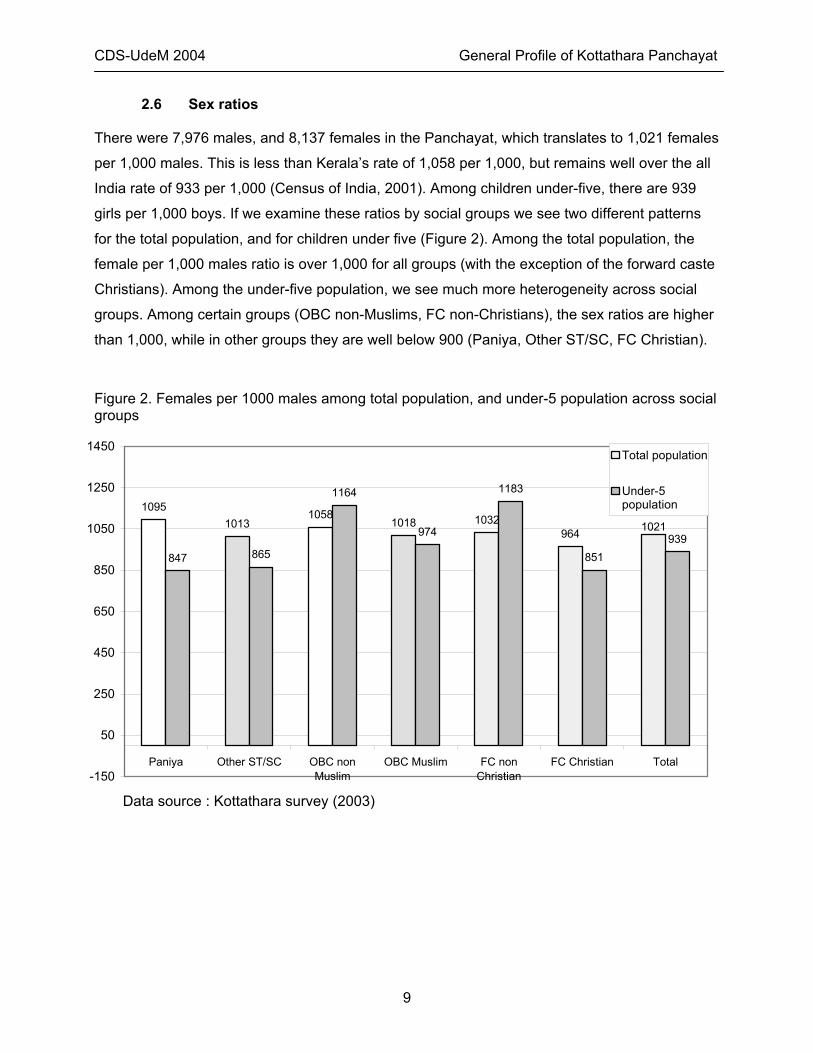
2.6 Sex ratios There were 7,976 males, and 8,137 females in the Panchayat, which translates to 1,021 females
per 1,000 males. This is less than Kerala’s rate of 1,058 per 1,000, but remains well over the all
India rate of 933 per 1,000 (Census of India, 2001). Among children under-five, there are 939
girls per 1,000 boys. If we examine these ratios by social groups we see two different patterns
for the total population, and for children under five (Figure 2). Among the total population, the
female per 1,000 males ratio is over 1,000 for all groups (with the exception of the forward caste
Christians). Among the under-five population, we see much more heterogeneity across social
groups. Among certain groups (OBC non-Muslims, FC non-Christians), the sex ratios are higher
than 1,000, while in other groups they are well below 900 (Paniya, Other ST/SC, FC Christian).
Figure 2. Females per 1000 males among total population, and under-5 population across social groups
10951013
10581018 1032
964
865
1164
974
1183
851939
1021
847
-150
50
250
450
650
850
1050
1250
1450
Paniya Other ST/SC OBC nonMuslim
OBC Muslim FC nonChristian
FC Christian Total
Under-5population
Total population
Data source : Kottathara survey (2003)
9
CDS-UdeM 2004 General Profile of Kottathara Panchayat
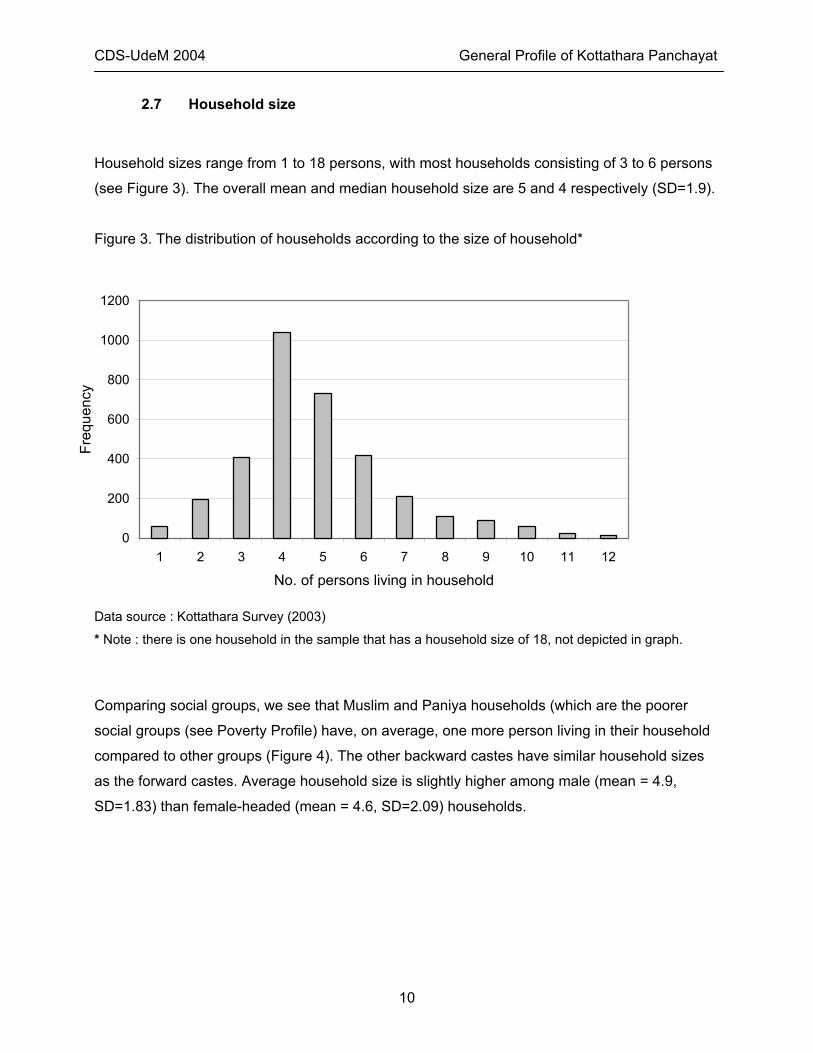
2.7 Household size
Household sizes range from 1 to 18 persons, with most households consisting of 3 to 6 persons
(see Figure 3). The overall mean and median household size are 5 and 4 respectively (SD=1.9).
Figure 3. The distribution of households according to the size of household*
0
200
400
600
800
1000
1200
1 2 3 4 5 6 7 8 9 10 11 12
No. of persons living in household
Freq
uenc
y
Data source : Kottathara Survey (2003)
* Note : there is one household in the sample that has a household size of 18, not depicted in graph.
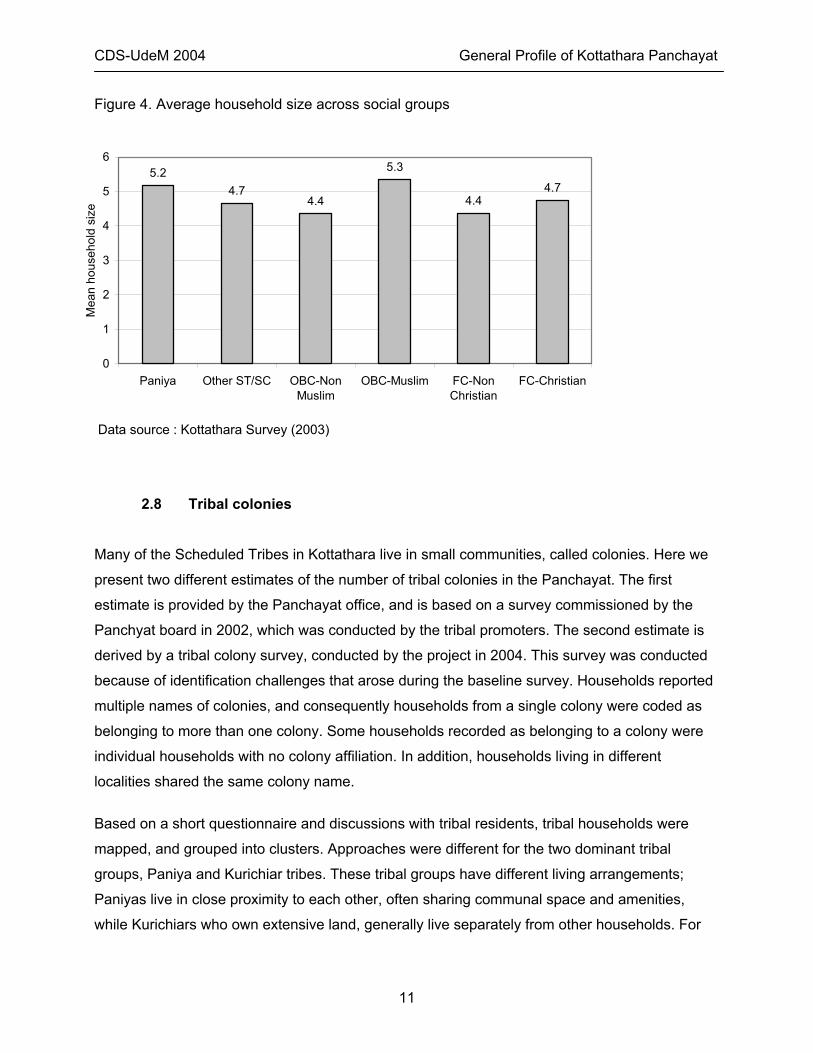
Comparing social groups, we see that Muslim and Paniya households (which are the poorer
social groups (see Poverty Profile) have, on average, one more person living in their household
compared to other groups (Figure 4). The other backward castes have similar household sizes
as the forward castes. Average household size is slightly higher among male (mean = 4.9,
SD=1.83) than female-headed (mean = 4.6, SD=2.09) households.
10
CDS-UdeM 2004 General Profile of Kottathara Panchayat
Figure 4. Average household size across social groups
5.24.7
4.4
5.3
4.44.7
0
1
2
3
4
5
6
Paniya Other ST/SC OBC-NonMuslim
OBC-Muslim FC-NonChristian
FC-Christian
Mea
n ho
useh
old
size
Data source : Kottathara Survey (2003)
2.8 Tribal colonies
Many of the Scheduled Tribes in Kottathara live in small communities, called colonies. Here we
present two different estimates of the number of tribal colonies in the Panchayat. The first
estimate is provided by the Panchayat office, and is based on a survey commissioned by the
Panchyat board in 2002, which was conducted by the tribal promoters. The second estimate is
derived by a tribal colony survey, conducted by the project in 2004. This survey was conducted
because of identification challenges that arose during the baseline survey. Households reported
multiple names of colonies, and consequently households from a single colony were coded as
belonging to more than one colony. Some households recorded as belonging to a colony were
individual households with no colony affiliation. In addition, households living in different
localities shared the same colony name.
Based on a short questionnaire and discussions with tribal residents, tribal households were
mapped, and grouped into clusters. Approaches were different for the two dominant tribal
groups, Paniya and Kurichiar tribes. These tribal groups have different living arrangements;
Paniyas live in close proximity to each other, often sharing communal space and amenities,
while Kurichiars who own extensive land, generally live separately from other households. For
11
CDS-UdeM 2004 General Profile of Kottathara Panchayat
Paniyas, households were grouped into ‘clusters’ according to the following criteria; a minimum
of three households, sharing of a common area, and basic facilities (e.g. sanitation facilities,
drinking water). Households that lived separately from colonies were coded as individual
households, and not as part of a colony. Kurichiar households were coded into clusters
according to the name of the colony reported by the household. There are four different types of tribal groups living in Kottathara Panchayat. In addition to the
two main tribes, Paniyas, and Kurichiars, there are smaller numbers of Kurumas and Naikka. As
described earlier, the Paniya tribes are a landless and deprived group, while the Kurichyas are
landowners, and whose living standards are similar to the general population. The Naikka are
similar to the Paniyas in terms of deprivation, traditionally their livelihood is dependent upon the
collection of forest products (e.g. honey), but as Kottathara has no forested areas, they are more
likely to earn a living through wage work. The Kurumas are agriculturalists, whose living
standards are similar to the Kurichiars.
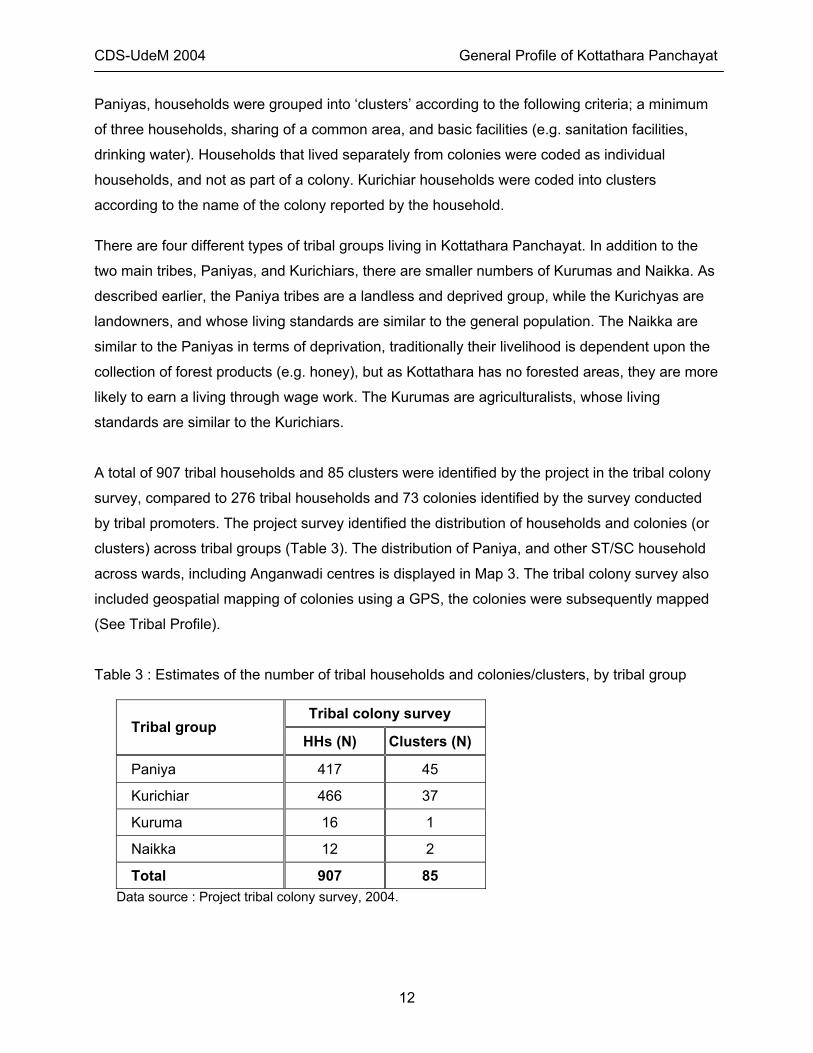
A total of 907 tribal households and 85 clusters were identified by the project in the tribal colony
survey, compared to 276 tribal households and 73 colonies identified by the survey conducted
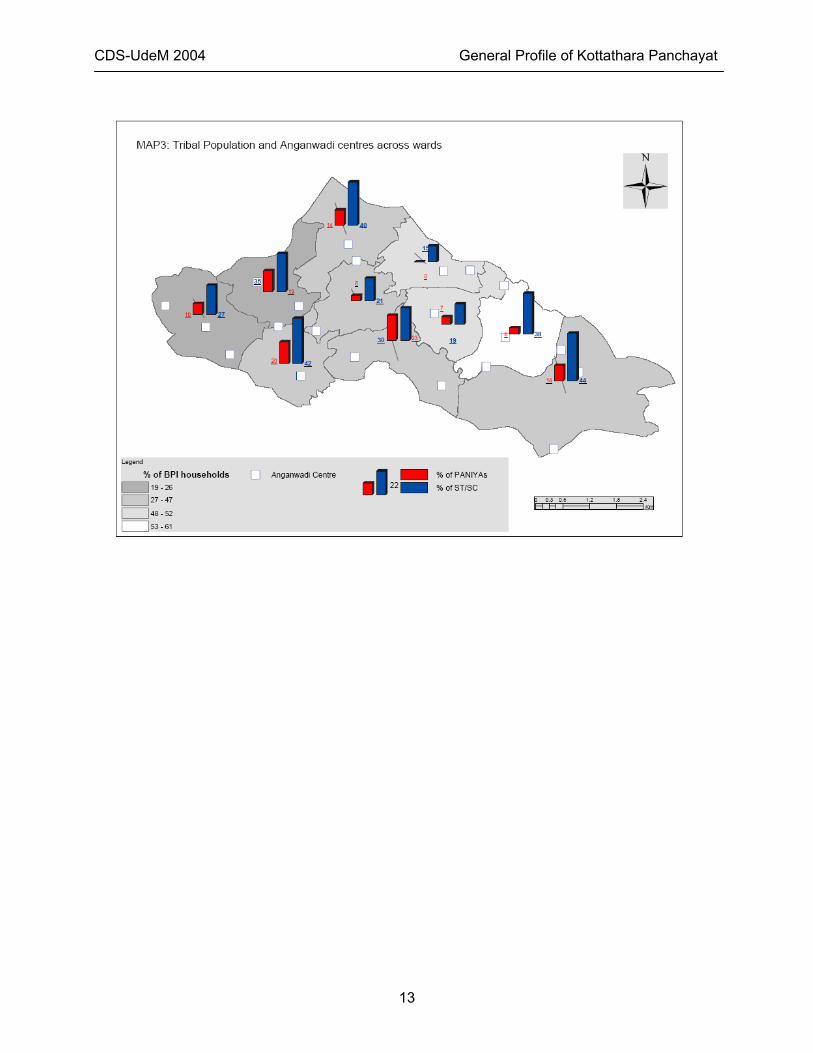
by tribal promoters. The project survey identified the distribution of households and colonies (or
clusters) across tribal groups (Table 3). The distribution of Paniya, and other ST/SC household
across wards, including Anganwadi centres is displayed in Map 3. The tribal colony survey also
included geospatial mapping of colonies using a GPS, the colonies were subsequently mapped
(See Tribal Profile).
Table 3 : Estimates of the number of tribal households and colonies/clusters, by tribal group
Tribal colony survey Tribal group
HHs (N) Clusters (N)
Paniya 417 45
Kurichiar 466 37
Kuruma 16 1
Naikka 12 2
Total 907 85 Data source : Project tribal colony survey, 2004.
12
CDS-UdeM 2004 General Profile of Kottathara Panchayat
13
CDS-UdeM 2004 General Profile of Kottathara Panchayat
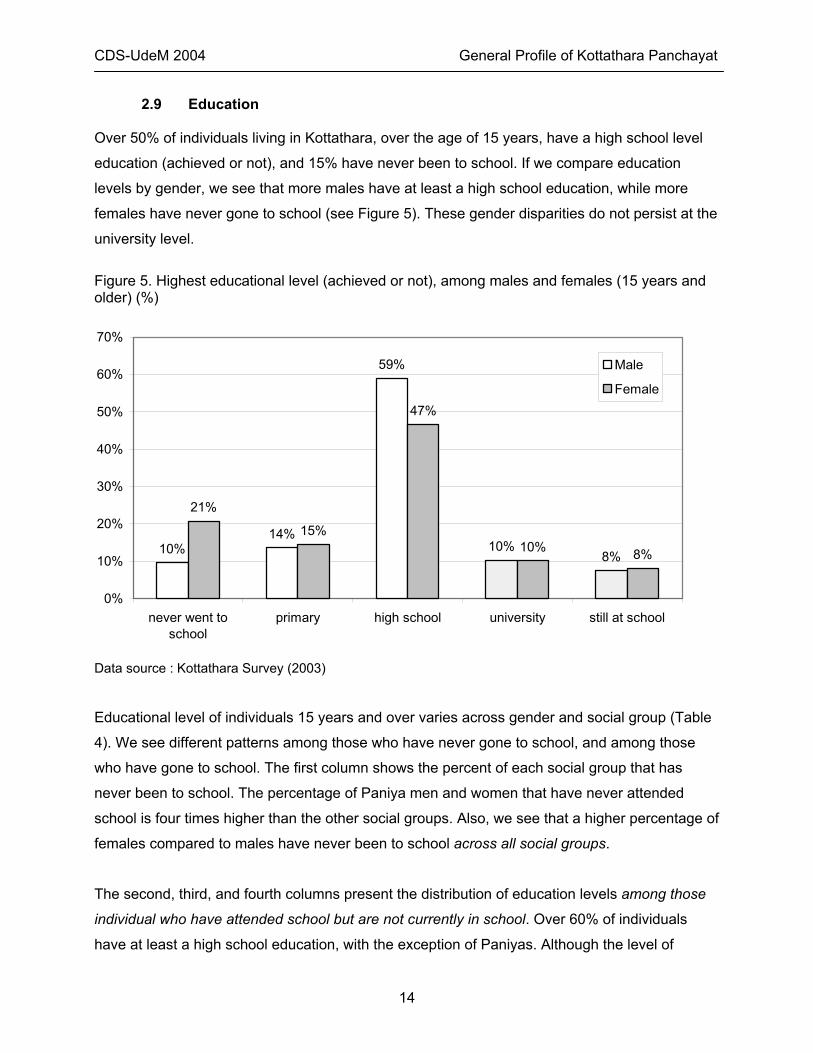
2.9 Education Over 50% of individuals living in Kottathara, over the age of 15 years, have a high school level
education (achieved or not), and 15% have never been to school. If we compare education
levels by gender, we see that more males have at least a high school education, while more
females have never gone to school (see Figure 5). These gender disparities do not persist at the
university level.
Figure 5. Highest educational level (achieved or not), among males and females (15 years and older) (%)
10%14%
59%
10%8%
21%
15%
47%
10% 8%
0%
10%
20%
30%
40%
50%
60%
70%
never went toschool
primary high school university still at school
Female
Male
Data source : Kottathara Survey (2003)
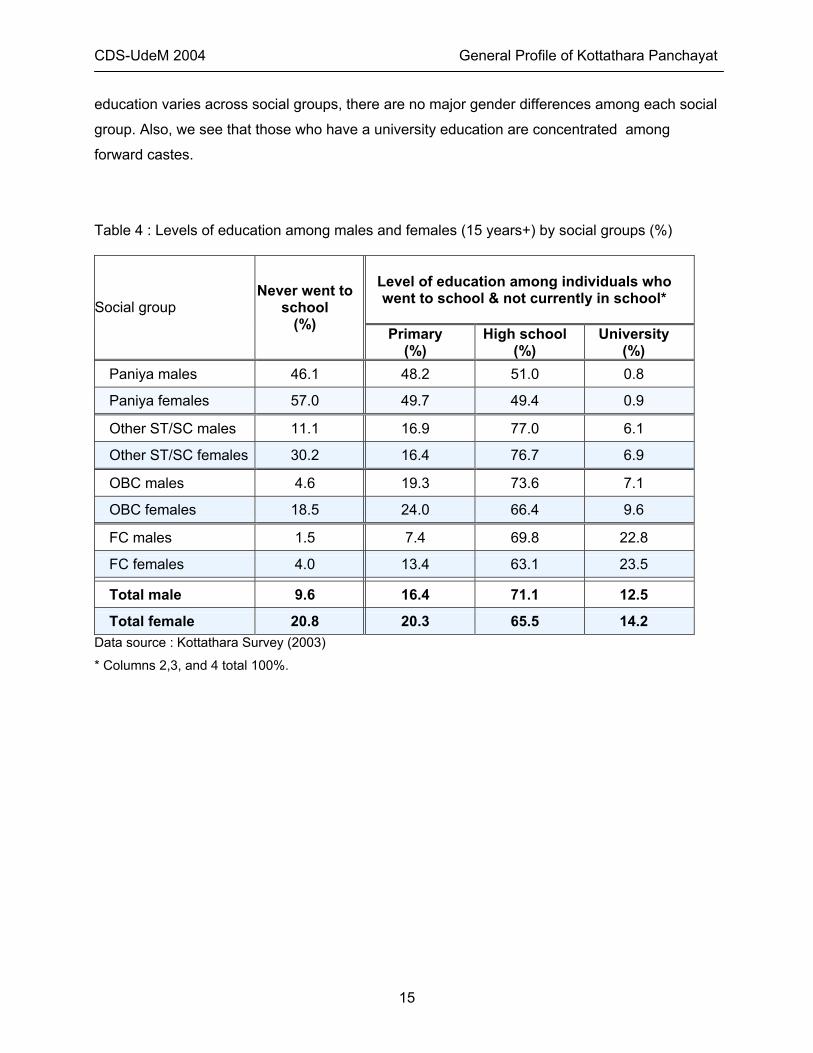
Educational level of individuals 15 years and over varies across gender and social group (Table
4). We see different patterns among those who have never gone to school, and among those
who have gone to school. The first column shows the percent of each social group that has
never been to school. The percentage of Paniya men and women that have never attended
school is four times higher than the other social groups. Also, we see that a higher percentage of
females compared to males have never been to school across all social groups.
The second, third, and fourth columns present the distribution of education levels among those
individual who have attended school but are not currently in school. Over 60% of individuals
have at least a high school education, with the exception of Paniyas. Although the level of
14
CDS-UdeM 2004 General Profile of Kottathara Panchayat
education varies across social groups, there are no major gender differences among each social
group. Also, we see that those who have a university education are concentrated among
forward castes.
Table 4 : Levels of education among males and females (15 years+) by social groups (%)
Level of education among individuals who went to school & not currently in school*
Social group Never went to
school (%) Primary
(%) High school
(%) University
(%) Paniya males 46.1 48.2 51.0 0.8
Paniya females 57.0 49.7 49.4 0.9
Other ST/SC males 11.1 16.9 77.0 6.1
Other ST/SC females 30.2 16.4 76.7 6.9
OBC males 4.6 19.3 73.6 7.1
OBC females 18.5 24.0 66.4 9.6
FC males 1.5 7.4 69.8 22.8
FC females 4.0 13.4 63.1 23.5
Total male 9.6 16.4 71.1 12.5
Total female 20.8 20.3 65.5 14.2 Data source : Kottathara Survey (2003)
* Columns 2,3, and 4 total 100%.
15
CDS-UdeM 2004 General Profile of Kottathara Panchayat
3.0 Economic characteristics
3.1 Employment
3.1.1 Labour force participation
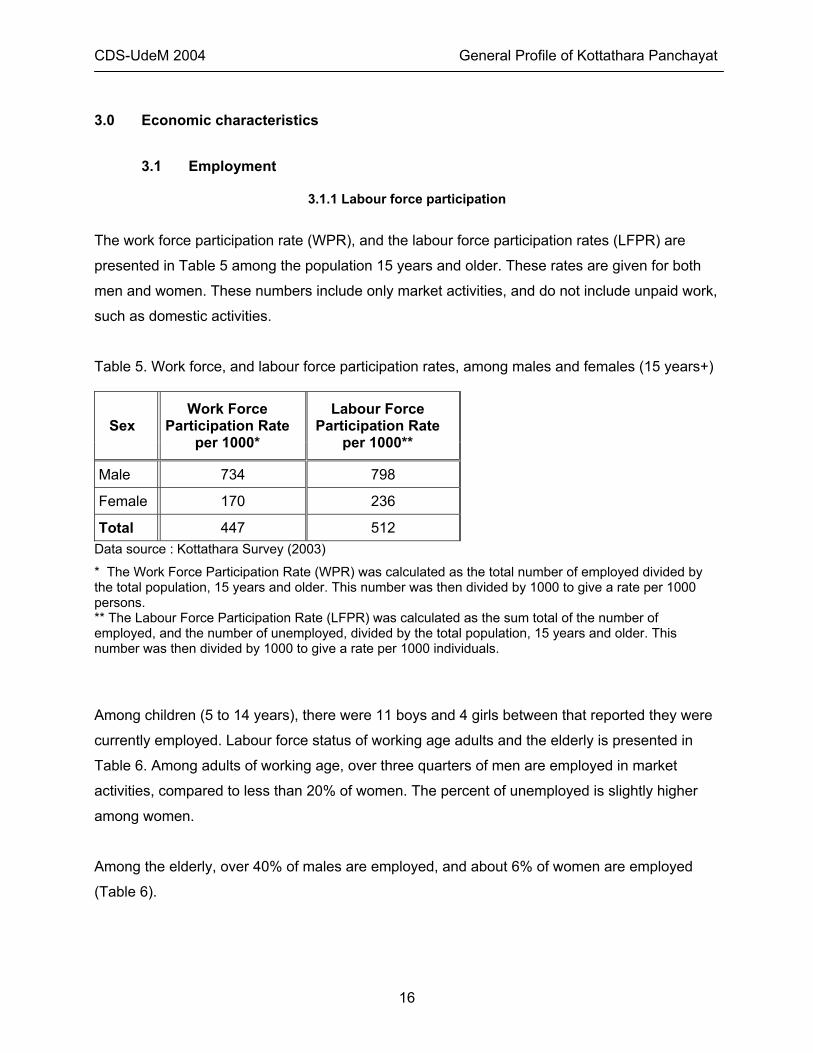
The work force participation rate (WPR), and the labour force participation rates (LFPR) are
presented in Table 5 among the population 15 years and older. These rates are given for both
men and women. These numbers include only market activities, and do not include unpaid work,
such as domestic activities.
Table 5. Work force, and labour force participation rates, among males and females (15 years+)
Sex Work Force
Participation Rate per 1000*
Labour Force Participation Rate
per 1000**
Male 734 798
Female 170 236
Total 447 512 Data source : Kottathara Survey (2003)
* The Work Force Participation Rate (WPR) was calculated as the total number of employed divided by the total population, 15 years and older. This number was then divided by 1000 to give a rate per 1000 persons. ** The Labour Force Participation Rate (LFPR) was calculated as the sum total of the number of employed, and the number of unemployed, divided by the total population, 15 years and older. This number was then divided by 1000 to give a rate per 1000 individuals. Among children (5 to 14 years), there were 11 boys and 4 girls between that reported they were
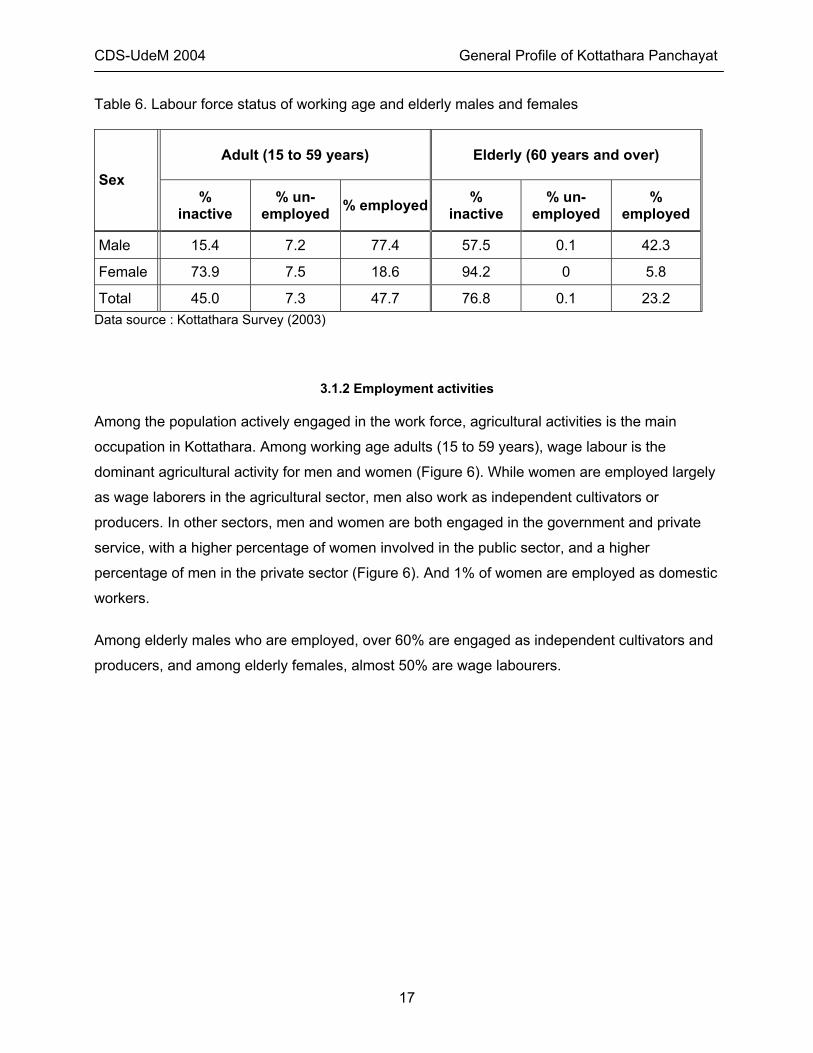
currently employed. Labour force status of working age adults and the elderly is presented in
Table 6. Among adults of working age, over three quarters of men are employed in market
activities, compared to less than 20% of women. The percent of unemployed is slightly higher
among women.
Among the elderly, over 40% of males are employed, and about 6% of women are employed
(Table 6).
16
CDS-UdeM 2004 General Profile of Kottathara Panchayat
Table 6. Labour force status of working age and elderly males and females
Adult (15 to 59 years) Elderly (60 years and over) Sex
% inactive
% un-employed % employed %
inactive % un-
employed %
employed
Male 15.4 7.2 77.4 57.5 0.1 42.3
Female 73.9 7.5 18.6 94.2 0 5.8
Total 45.0 7.3 47.7 76.8 0.1 23.2 Data source : Kottathara Survey (2003)
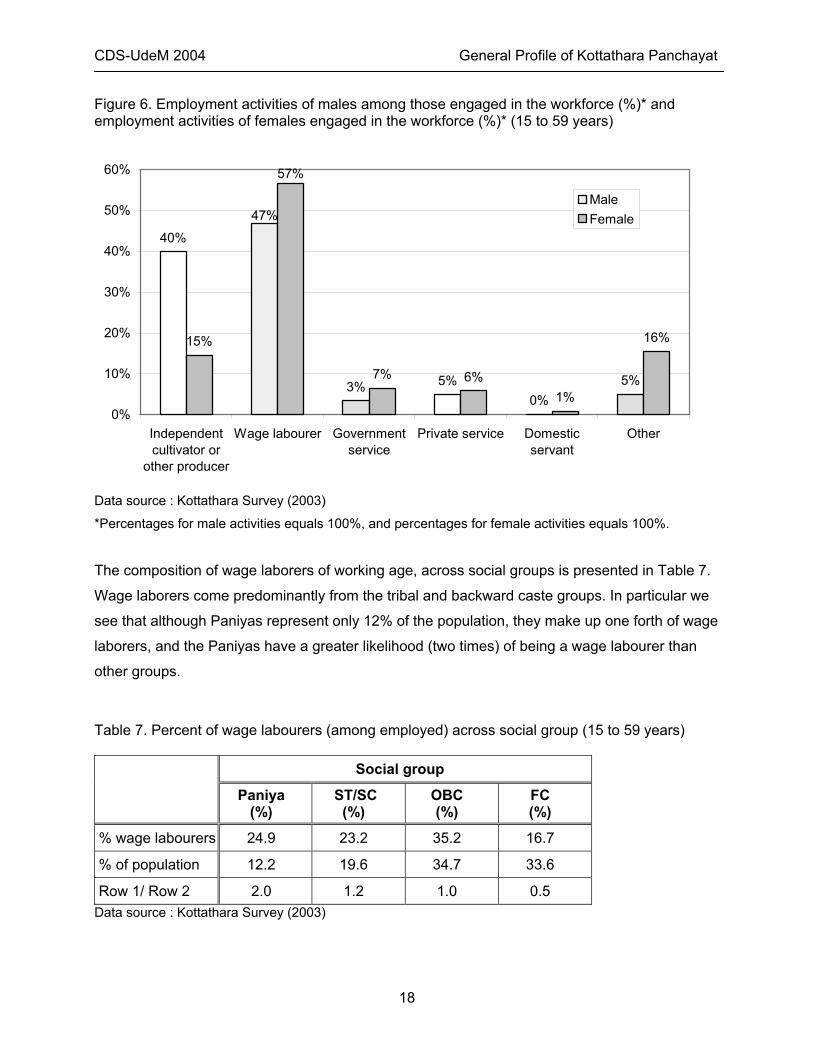
3.1.2 Employment activities Among the population actively engaged in the work force, agricultural activities is the main
occupation in Kottathara. Among working age adults (15 to 59 years), wage labour is the
dominant agricultural activity for men and women (Figure 6). While women are employed largely
as wage laborers in the agricultural sector, men also work as independent cultivators or
producers. In other sectors, men and women are both engaged in the government and private
service, with a higher percentage of women involved in the public sector, and a higher
percentage of men in the private sector (Figure 6). And 1% of women are employed as domestic
workers.
Among elderly males who are employed, over 60% are engaged as independent cultivators and
producers, and among elderly females, almost 50% are wage labourers.
17
CDS-UdeM 2004 General Profile of Kottathara Panchayat
Figure 6. Employment activities of males among those engaged in the workforce (%)* and employment activities of females engaged in the workforce (%)* (15 to 59 years)
40%
3% 5%0%
5%
15%
7% 6%1%
16%
47%
57%
0%
10%
20%
30%
40%
50%
60%
Independentcultivator or
other producer
Wage labourer Governmentservice
Private service Domesticservant
Other
FemaleMale
Data source : Kottathara Survey (2003)
*Percentages for male activities equals 100%, and percentages for female activities equals 100%.
The composition of wage laborers of working age, across social groups is presented in Table 7.
Wage laborers come predominantly from the tribal and backward caste groups. In particular we
see that although Paniyas represent only 12% of the population, they make up one forth of wage
laborers, and the Paniyas have a greater likelihood (two times) of being a wage labourer than
other groups.
Table 7. Percent of wage labourers (among employed) across social group (15 to 59 years)
Social group Paniya
(%) ST/SC
(%) OBC (%)
FC (%)
% wage labourers 24.9 23.2 35.2 16.7
% of population 12.2 19.6 34.7 33.6
Row 1/ Row 2 2.0 1.2 1.0 0.5 Data source : Kottathara Survey (2003)
18
CDS-UdeM 2004 General Profile of Kottathara Panchayat
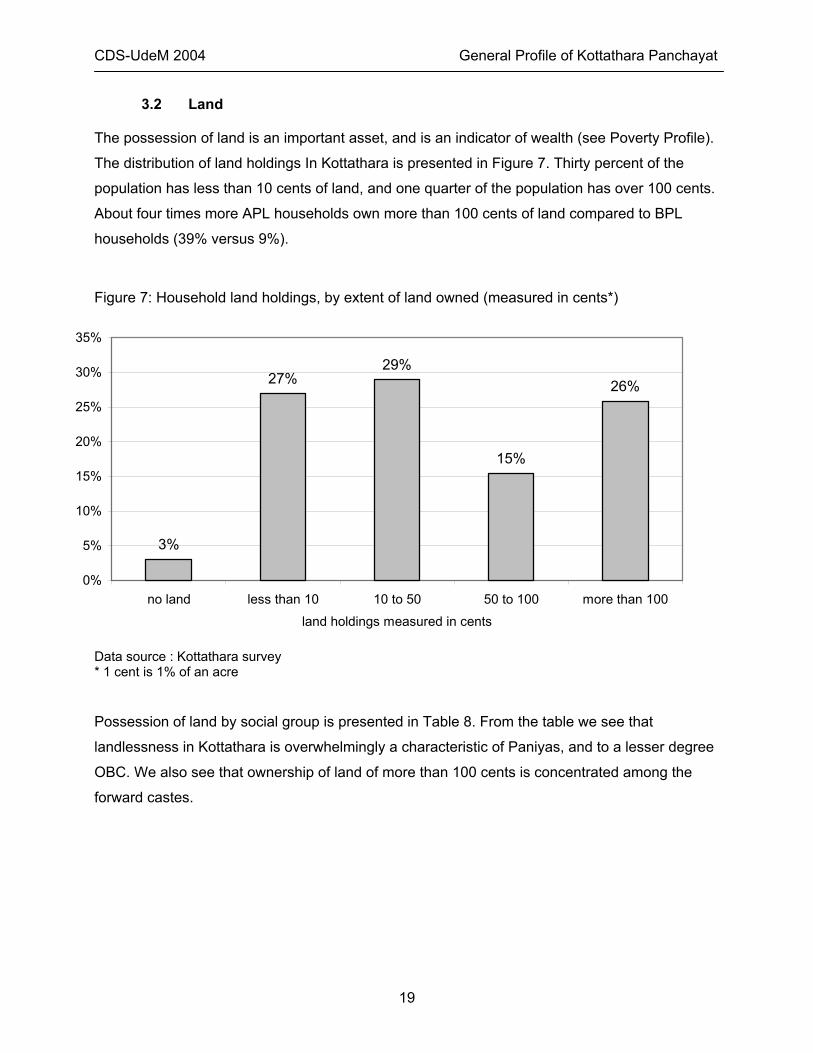
3.2 Land The possession of land is an important asset, and is an indicator of wealth (see Poverty Profile).
The distribution of land holdings In Kottathara is presented in Figure 7. Thirty percent of the
population has less than 10 cents of land, and one quarter of the population has over 100 cents.
About four times more APL households own more than 100 cents of land compared to BPL
households (39% versus 9%).
Figure 7: Household land holdings, by extent of land owned (measured in cents*)
3%
27%29%
15%
26%
0%
5%
10%
15%
20%
25%
30%
35%
no land less than 10 10 to 50 50 to 100 more than 100
land holdings measured in cents
Data source : Kottathara survey * 1 cent is 1% of an acre Possession of land by social group is presented in Table 8. From the table we see that
landlessness in Kottathara is overwhelmingly a characteristic of Paniyas, and to a lesser degree
OBC. We also see that ownership of land of more than 100 cents is concentrated among the
forward castes.
19
CDS-UdeM 2004 General Profile of Kottathara Panchayat
Table 8. Household land holdings, by social group : no land versus more than 100 cents*
Land ownership
% not owning land
% owning 100 cents and more
Paniyas 13.2 1.3 Other ST/SCs 0.9 22.6
OBC 2.1 15.4
Forward castes 1.5 46.1
Total 3.0 25.8 Data source : Kottathara Survey (2003)
3.3 Income poverty and BPL status Forty-three percent of households in the Panchayat are classified as BPL (Table 8). The
average income of the BPL households, as estimated by the annual per capita income, is about
6,743 rupees, almost 2 thousand rupees less than that of the APL households, and almost one
out of two BPL households earns an annual income per member that falls under 5,400 rupees,
the State Specific Poverty Line (SSPL) (Table 9). The SSPL is estimated from household survey
consumption data by the National Sample Survey Organisation (NSSO) is a defined poverty line
that is fixed for inter-temporal poverty comparisons. The SSPL used here (450 per capita per
month) considers price fluctuations since the last estimate provided in 1999-2000 by the Indian
Planning Commission (see Poverty Profile for details).
Table 9. Household poverty, and income among BPL and APL households
Poverty status Average income*
Poverty incidence
Poverty level Number of HH % of HH Rs per capita
per year % with income below SSPL
BPL 1,454 43.4% 6,743 44.7%
APL 1,898 56.6% 8,592 23.2%
Total 3,352 100% 7,790 32.5%
Data source : Kottathara Survey (2003) *as estimated by the annual per capita household’s consumption.
20
CDS-UdeM 2004 General Profile of Kottathara Panchayat
The distribution of BPL and APL households across social groups is presented in Table 9.
Compared to APL households, we see that Paniyas and other ST/SC make up more than 50%
of all of the BPL households. On the flip side, we see that the forward castes constitute almost
50% of the APL households.
Table 10. Social group composition of BPL and APL households Social group BPL HH APL HH All
Paniyas 22.6% 3.4% 11.7%
Other SC/ST 29.8% 11.0% 19.2%
OBC non Muslim 11.4% 12.9% 12.3%
OBC Muslims 18.0% 25.1% 22.0%
FC non Christians 8.4% 16.8% 13.1%
FC Christians 9.8% 30.8% 21.7%
Total 100% 100% 100%
Data source : Kottathara Survey (2003)
4.0 Access to amenities
The majority of households get their water from either a public or private well or pipe (96%), and
there is little variation across social groups (Table 11). Forty-six percent of houses are
electrified, and 20% of households have a telephone in the household. We see that in Table 10
these amenities are primarily among forward castes; Paniyas have only a quarter of their
households with electricity, and possess no phones.
21
CDS-UdeM 2004 General Profile of Kottathara Panchayat
Table 11. Access to amenities among Paniya, Other ST/SC, OBC, and FC households (%)
Amenity Paniyas Other ST/SC OBC FC
Total
Public, private well, Pipe (%) 96.2 93.1 97.8 96.7 96.4 Source of
drinking water Pond, River (%) 3.8 6.9 2.2 3.3 3.6
House electrified (%) 24.2 53.7 38.8 57.2 46.4
Telephone at home (%) 0.0 5.6 16.9 36.5 19.6
Data source : Kottathara Survey (2003)
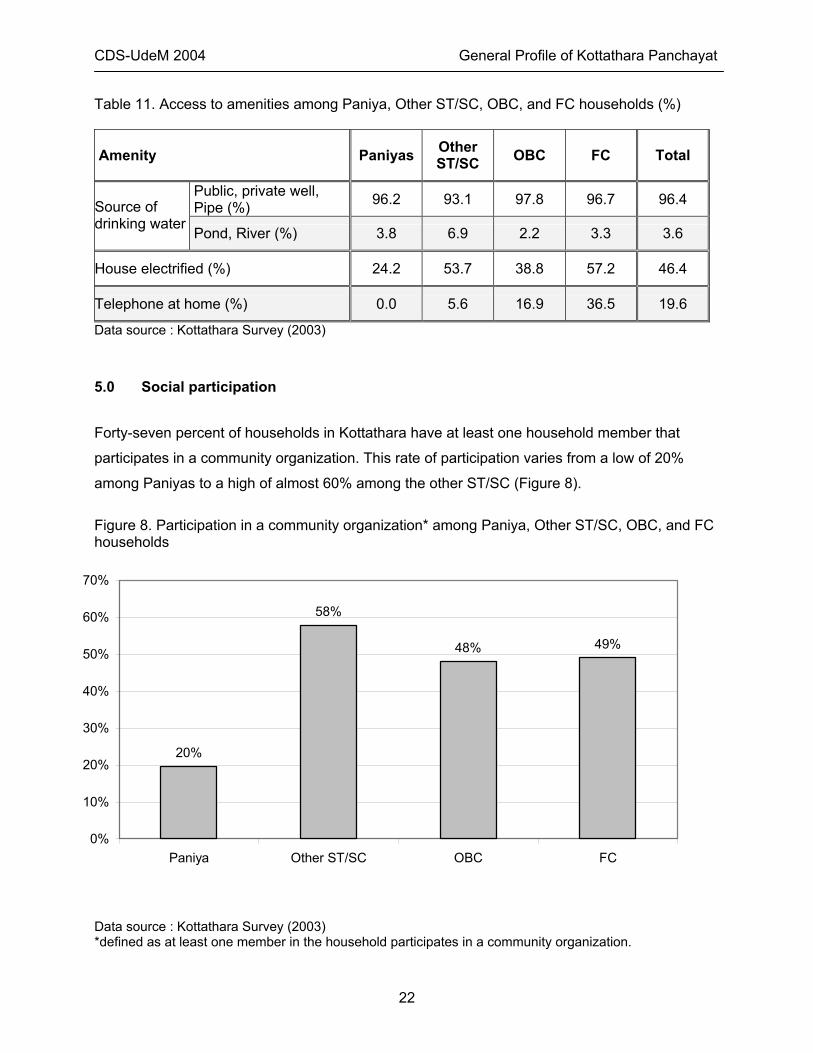
5.0 Social participation
Forty-seven percent of households in Kottathara have at least one household member that
participates in a community organization. This rate of participation varies from a low of 20%
among Paniyas to a high of almost 60% among the other ST/SC (Figure 8).
Figure 8. Participation in a community organization* among Paniya, Other ST/SC, OBC, and FC households
20%
58%
48% 49%
0%
10%
20%
30%
40%
50%
60%
70%
Paniya Other ST/SC OBC FC
Data source : Kottathara Survey (2003) *defined as at least one member in the household participates in a community organization.
22
CDS-UdeM 2004 General Profile of Kottathara Panchayat
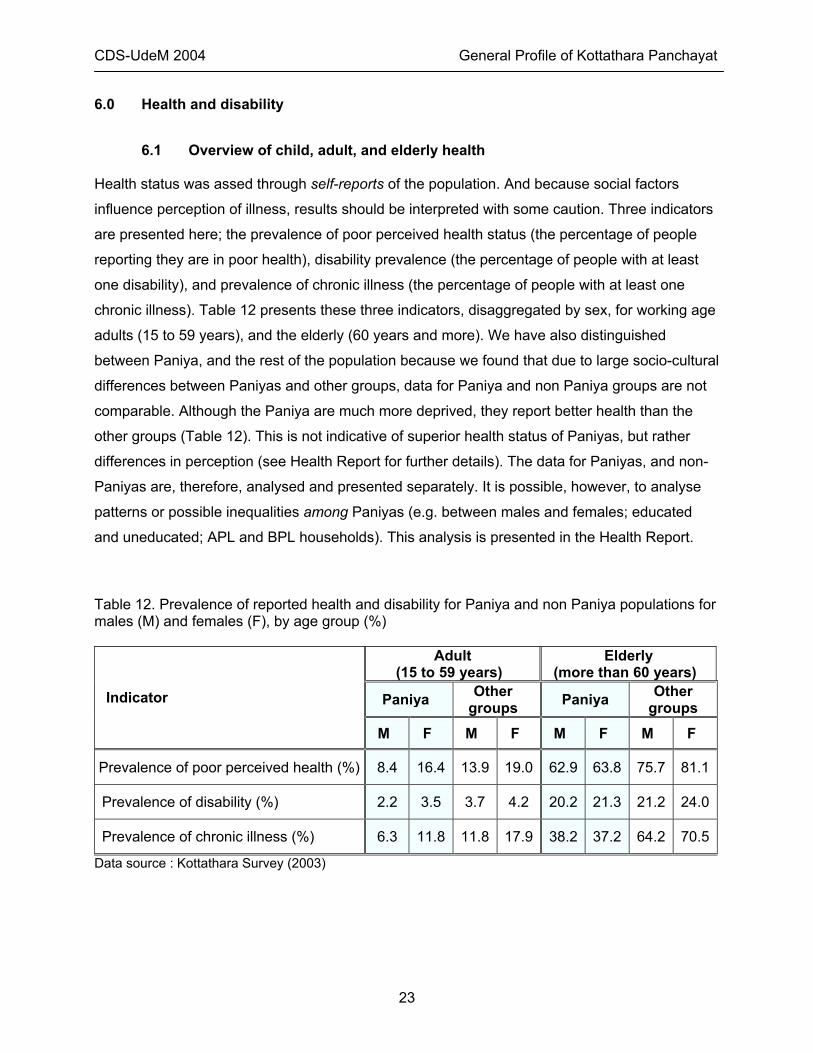
6.0 Health and disability
6.1 Overview of child, adult, and elderly health
Health status was assed through self-reports of the population. And because social factors
influence perception of illness, results should be interpreted with some caution. Three indicators
are presented here; the prevalence of poor perceived health status (the percentage of people
reporting they are in poor health), disability prevalence (the percentage of people with at least
one disability), and prevalence of chronic illness (the percentage of people with at least one
chronic illness). Table 12 presents these three indicators, disaggregated by sex, for working age
adults (15 to 59 years), and the elderly (60 years and more). We have also distinguished
between Paniya, and the rest of the population because we found that due to large socio-cultural
differences between Paniyas and other groups, data for Paniya and non Paniya groups are not
comparable. Although the Paniya are much more deprived, they report better health than the
other groups (Table 12). This is not indicative of superior health status of Paniyas, but rather
differences in perception (see Health Report for further details). The data for Paniyas, and non-
Paniyas are, therefore, analysed and presented separately. It is possible, however, to analyse
patterns or possible inequalities among Paniyas (e.g. between males and females; educated
and uneducated; APL and BPL households). This analysis is presented in the Health Report.
Table 12. Prevalence of reported health and disability for Paniya and non Paniya populations for males (M) and females (F), by age group (%)
Adult (15 to 59 years)
Elderly (more than 60 years)
Paniya Other groups Paniya Other
groups Indicator
M F M F M F M F
Prevalence of poor perceived health (%) 8.4 16.4 13.9 19.0 62.9 63.8 75.7 81.1
Prevalence of disability (%) 2.2 3.5 3.7 4.2 20.2 21.3 21.2 24.0
Prevalence of chronic illness (%) 6.3 11.8 11.8 17.9 38.2 37.2 64.2 70.5
Data source : Kottathara Survey (2003)
23
CDS-UdeM 2004 General Profile of Kottathara Panchayat
Among children under 15 years of age, the prevalence of disability was 1.2% for Paniya
children, and 1.6% for other social groups, and the prevalence of chronic illness was 0.9%
among Paniyas, and 3.2% among children from other social groups.
Globally, the burden of adult ill health and disability falls predominantly upon the elderly (Table
12). Among adults of working age, women report a higher prevalence of poorer health, disability,
and chronic illness, compared to men of the same age group. This pattern applies to both
Paniyas, and the other social groups.
Among the elderly, we also see that women report worse health outcomes compared to men,
but the magnitude of these disparities are much less than working age adults (Table 12).
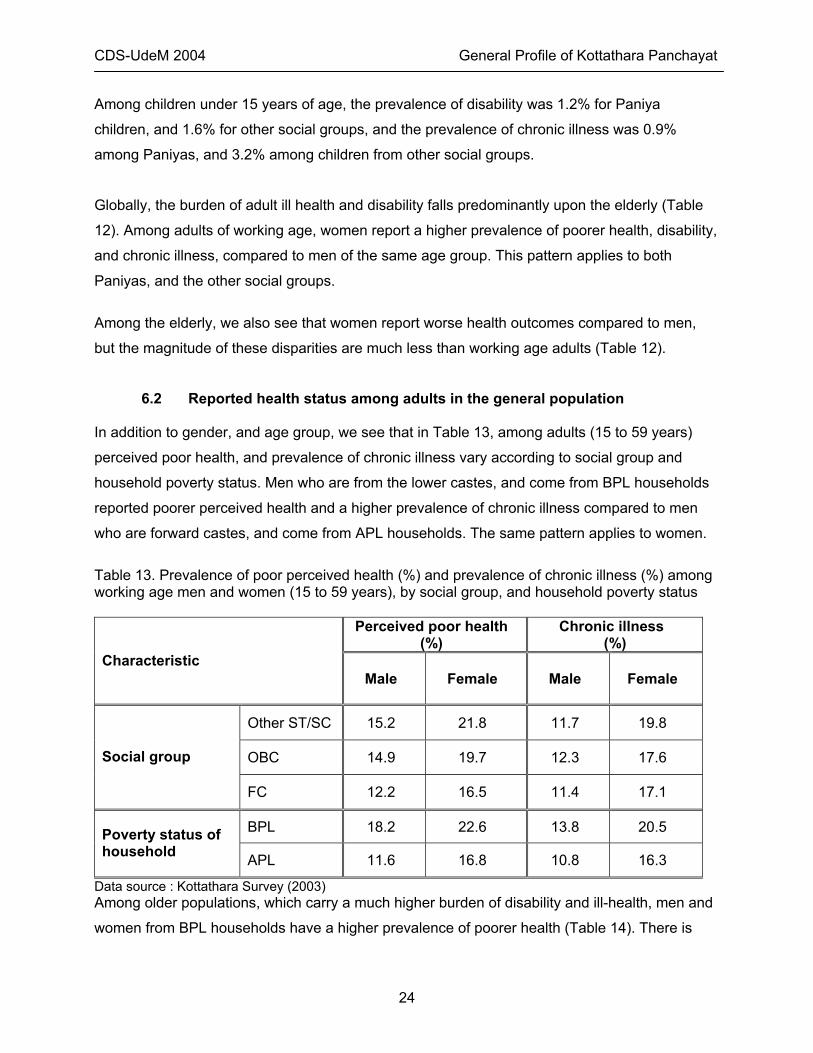
6.2 Reported health status among adults in the general population In addition to gender, and age group, we see that in Table 13, among adults (15 to 59 years)
perceived poor health, and prevalence of chronic illness vary according to social group and
household poverty status. Men who are from the lower castes, and come from BPL households
reported poorer perceived health and a higher prevalence of chronic illness compared to men
who are forward castes, and come from APL households. The same pattern applies to women.
Table 13. Prevalence of poor perceived health (%) and prevalence of chronic illness (%) among working age men and women (15 to 59 years), by social group, and household poverty status
Perceived poor health (%)
Chronic illness (%)
Characteristic Male
Female
Male
Female
Other ST/SC 15.2 21.8 11.7 19.8
OBC 14.9 19.7 12.3 17.6 Social group
FC 12.2 16.5 11.4 17.1
BPL 18.2 22.6 13.8 20.5 Poverty status of household APL 11.6 16.8 10.8 16.3
Data source : Kottathara Survey (2003) Among older populations, which carry a much higher burden of disability and ill-health, men and
women from BPL households have a higher prevalence of poorer health (Table 14). There is
24
CDS-UdeM 2004 General Profile of Kottathara Panchayat
more chronic illness reported among men from BPL households, but no difference between
women from BPL and APL households (Table 14). Men and women belonging to forward castes
have a lower prevalence of poorer health reported, but they do not report a superior health
advantage with respect to chronic illness.
Table 14. Prevalence of poor perceived health (%) and prevalence of chronic illness (%) among elderly men and women (60 years and older), by social group, and household poverty status
Perceived poor health (%)
Chronic illness (%)
Characteristic Male
Female
Male
Female
Other ST/SC 74.6 86.2 61.9 71.6
OBC 85.3 82.0 66.3 68.8 Social group
FC 69.5 78.7 63.8 71.3
BPL 82.5 84.8 69.0 70.0 Poverty status of household APL 72.9 79.4 62.3 70.7
Data source : Kottathara Survey (2003)
7.0 Gender gaps
Improving women’s status and well-being remains a priority issue in Kerala, and according to the
Kerala Women’s Commission, critical issues include, increasing women’s decision-making and
participation in development activities, ending violence against women, ensuring equality before
the law, and improving women’s economic opportunities (Kerala Women’s Commission, 2002).
The household data will not provide the necessary information needed to assess all dimensions
of women’s well-being3, but sex-disaggregated data of certain indicators may be used to arrive
at “gender gaps”.
3 For example, we do not have information on issues such as domestic violence. Furthermore, we do not have disaggregated data on household welfare, such as consumption patterns, or ownership of land and other major assets
25
CDS-UdeM 2004 General Profile of Kottathara Panchayat
A gender gap represents differences of opportunities or achievements at either the individual
level (between women and men), or at the household level (between female and male-headed
households). There are a number of different approaches to measuring intergroup disparities;
here we will adopt the use of simple range measures (Anand et al., 2000). Two different
measures are used among the different classes (this could be gender, social group, or socio-
economic class) rate ratios (lowest to highest), which measure the disparity in relative terms,
and rate differences (lowest minus highest), which measures the disparity in absolute terms.
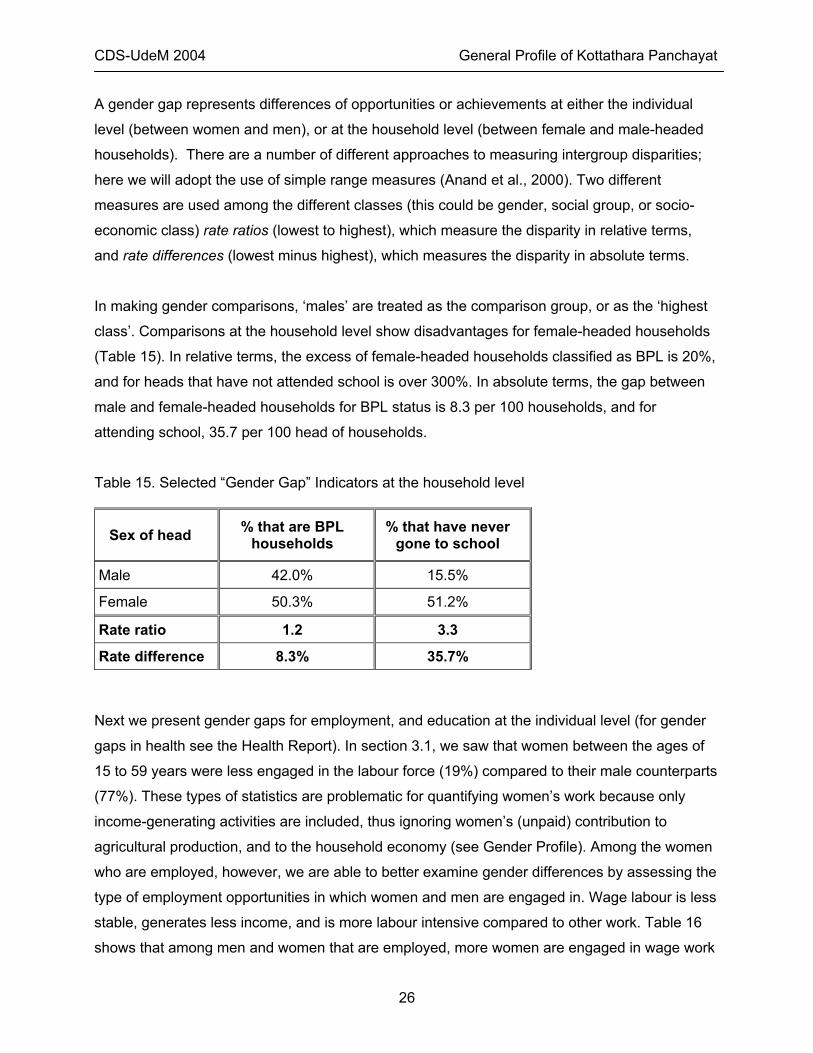
In making gender comparisons, ‘males’ are treated as the comparison group, or as the ‘highest
class’. Comparisons at the household level show disadvantages for female-headed households
(Table 15). In relative terms, the excess of female-headed households classified as BPL is 20%,
and for heads that have not attended school is over 300%. In absolute terms, the gap between
male and female-headed households for BPL status is 8.3 per 100 households, and for
attending school, 35.7 per 100 head of households.
Table 15. Selected “Gender Gap” Indicators at the household level
Sex of head
% that are BPL households
% that have never gone to school
Male 42.0% 15.5%
Female 50.3% 51.2%
Rate ratio 1.2 3.3
Rate difference 8.3% 35.7%
Next we present gender gaps for employment, and education at the individual level (for gender
gaps in health see the Health Report). In section 3.1, we saw that women between the ages of
15 to 59 years were less engaged in the labour force (19%) compared to their male counterparts
(77%). These types of statistics are problematic for quantifying women’s work because only
income-generating activities are included, thus ignoring women’s (unpaid) contribution to
agricultural production, and to the household economy (see Gender Profile). Among the women
who are employed, however, we are able to better examine gender differences by assessing the
type of employment opportunities in which women and men are engaged in. Wage labour is less
stable, generates less income, and is more labour intensive compared to other work. Table 16
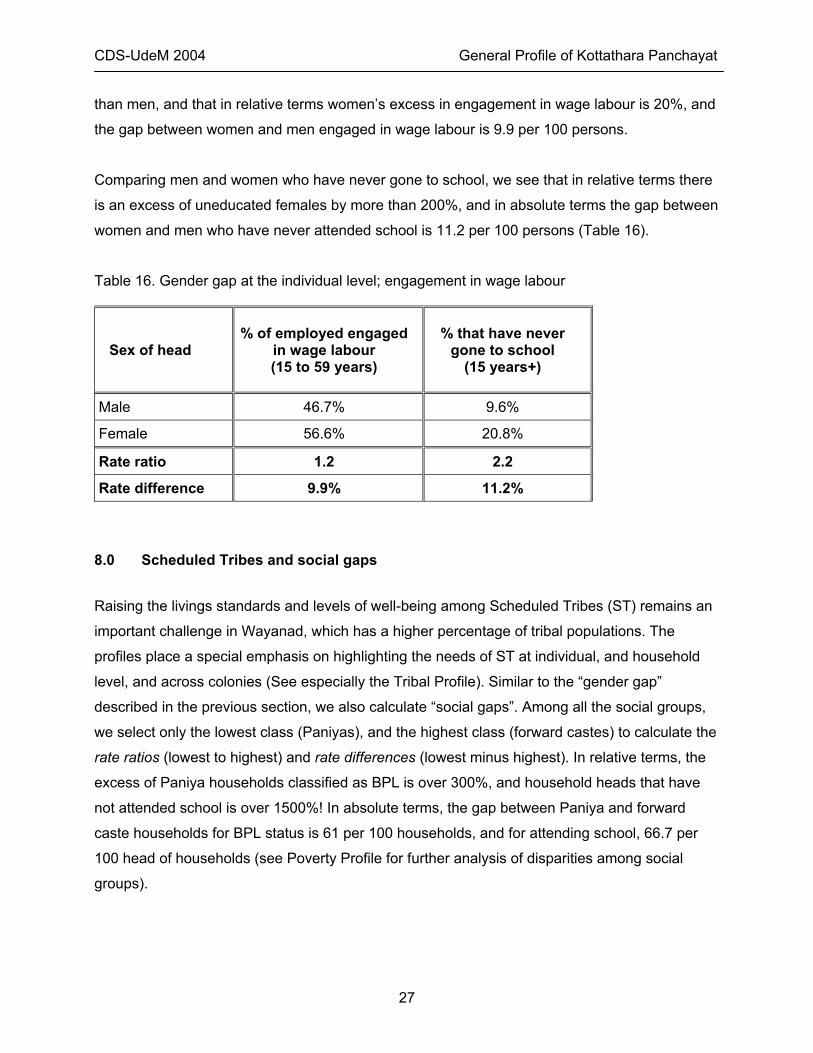
shows that among men and women that are employed, more women are engaged in wage work
26
CDS-UdeM 2004 General Profile of Kottathara Panchayat
than men, and that in relative terms women’s excess in engagement in wage labour is 20%, and
the gap between women and men engaged in wage labour is 9.9 per 100 persons.
Comparing men and women who have never gone to school, we see that in relative terms there
is an excess of uneducated females by more than 200%, and in absolute terms the gap between
women and men who have never attended school is 11.2 per 100 persons (Table 16).
Table 16. Gender gap at the individual level; engagement in wage labour
Sex of head
% of employed engaged
in wage labour (15 to 59 years)
% that have never gone to school
(15 years+)
Male 46.7% 9.6%
Female 56.6% 20.8%
Rate ratio 1.2 2.2
Rate difference 9.9% 11.2%
8.0 Scheduled Tribes and social gaps
Raising the livings standards and levels of well-being among Scheduled Tribes (ST) remains an
important challenge in Wayanad, which has a higher percentage of tribal populations. The
profiles place a special emphasis on highlighting the needs of ST at individual, and household
level, and across colonies (See especially the Tribal Profile). Similar to the “gender gap”
described in the previous section, we also calculate “social gaps”. Among all the social groups,
we select only the lowest class (Paniyas), and the highest class (forward castes) to calculate the
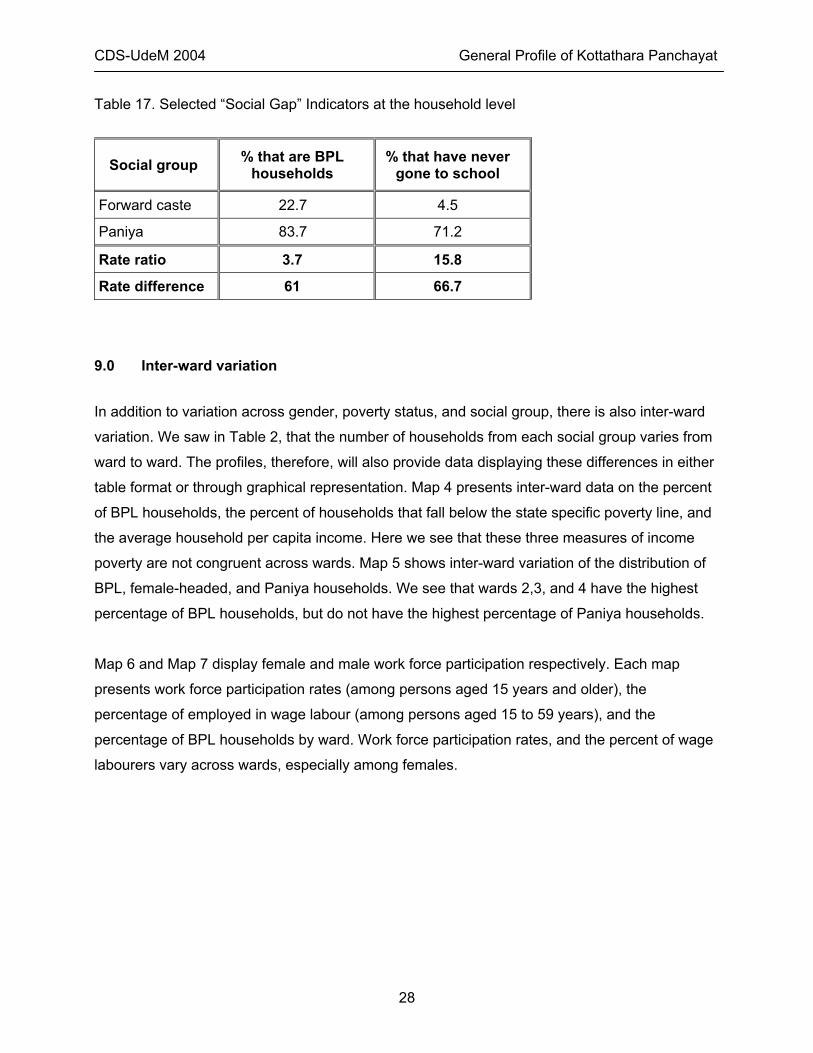
rate ratios (lowest to highest) and rate differences (lowest minus highest). In relative terms, the
excess of Paniya households classified as BPL is over 300%, and household heads that have
not attended school is over 1500%! In absolute terms, the gap between Paniya and forward
caste households for BPL status is 61 per 100 households, and for attending school, 66.7 per
100 head of households (see Poverty Profile for further analysis of disparities among social
groups).
27
CDS-UdeM 2004 General Profile of Kottathara Panchayat
Table 17. Selected “Social Gap” Indicators at the household level
Social group
% that are BPL households
% that have never gone to school
Forward caste 22.7 4.5
Paniya 83.7 71.2
Rate ratio 3.7 15.8
Rate difference 61 66.7
9.0 Inter-ward variation
In addition to variation across gender, poverty status, and social group, there is also inter-ward
variation. We saw in Table 2, that the number of households from each social group varies from
ward to ward. The profiles, therefore, will also provide data displaying these differences in either
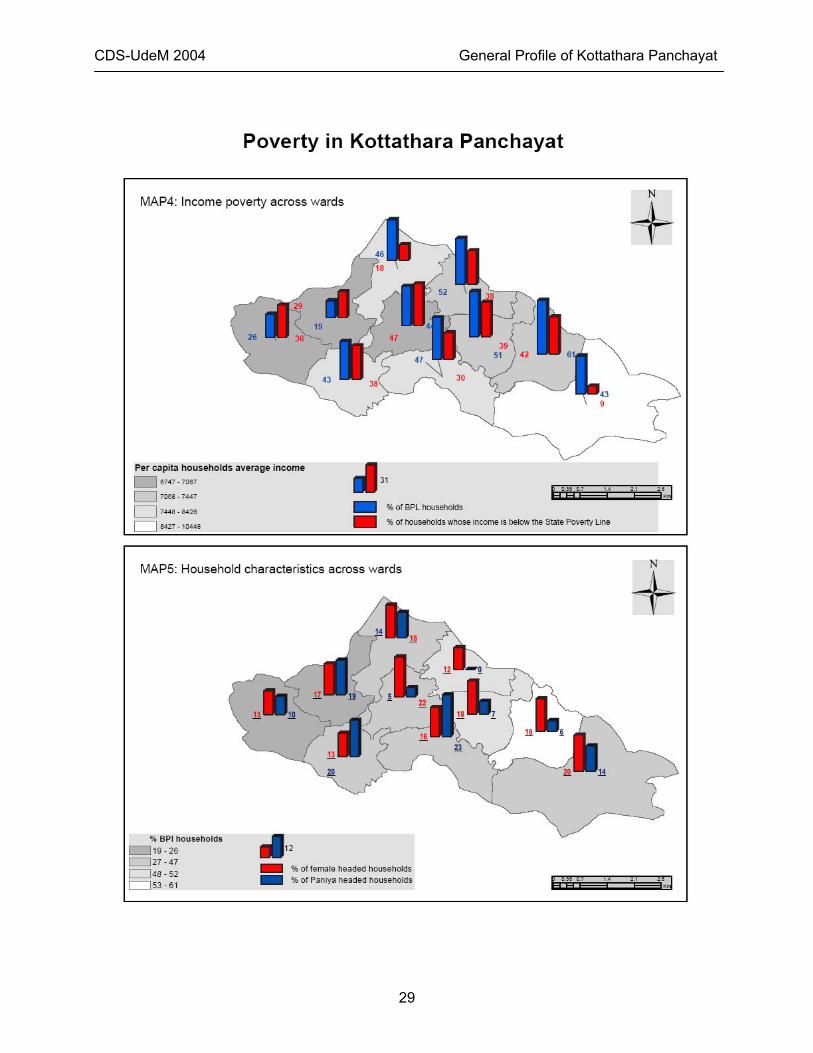
table format or through graphical representation. Map 4 presents inter-ward data on the percent
of BPL households, the percent of households that fall below the state specific poverty line, and
the average household per capita income. Here we see that these three measures of income
poverty are not congruent across wards. Map 5 shows inter-ward variation of the distribution of
BPL, female-headed, and Paniya households. We see that wards 2,3, and 4 have the highest
percentage of BPL households, but do not have the highest percentage of Paniya households.
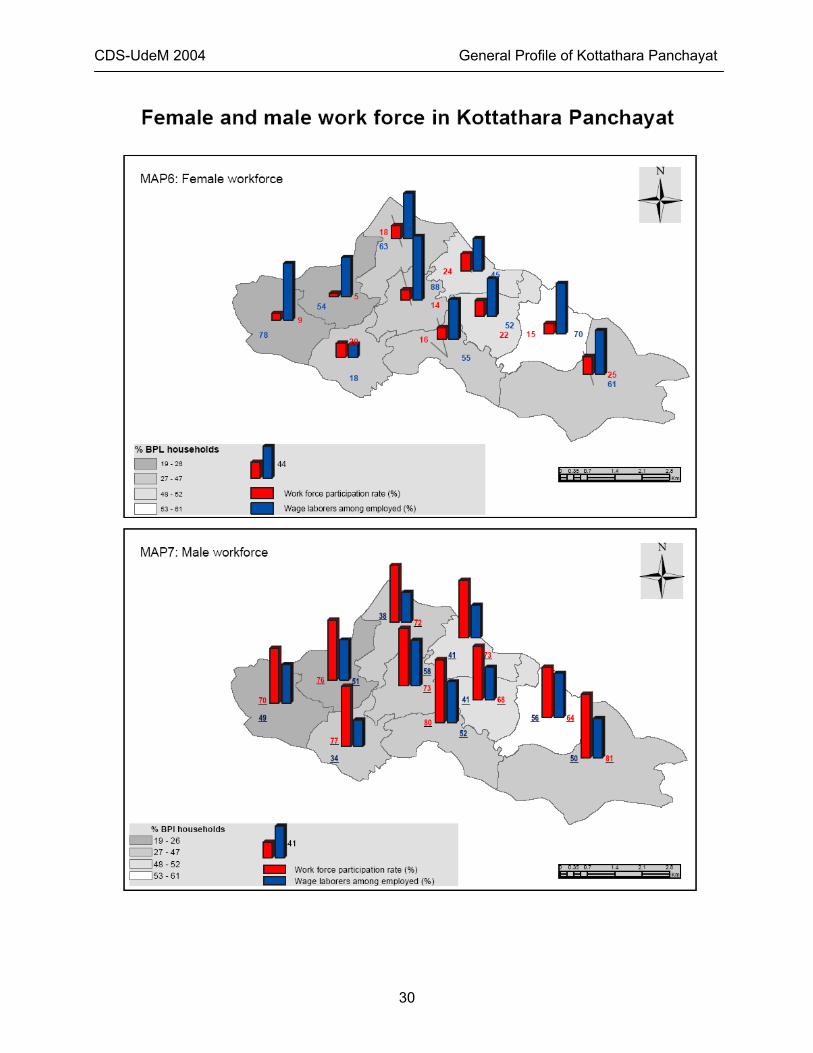
Map 6 and Map 7 display female and male work force participation respectively. Each map
presents work force participation rates (among persons aged 15 years and older), the
percentage of employed in wage labour (among persons aged 15 to 59 years), and the
percentage of BPL households by ward. Work force participation rates, and the percent of wage
labourers vary across wards, especially among females.
28
CDS-UdeM 2004 General Profile of Kottathara Panchayat
29
CDS-UdeM 2004 General Profile of Kottathara Panchayat
30


![THE KERALA PANCHAYAT RAJ ACT, 1994 - RGPRSdev.rgprs.in/contentfiles/resources/GOA_Final_Act.pdfTHE GOA PANCHAYAT RAJ ACT, 1994 (Goa Act No. 14 of 1994) [9-7-1994] (Amended upto Goa](https://img.pdfslide.us/doc/110x75/5ac4ce0d7f8b9aae1b8daab3/the-kerala-panchayat-raj-act-1994-goa-panchayat-raj-act-1994-goa-act-no-14.jpg)