Embed Size (px)
Citation preview
General Operating Revenue and Expense Reports Training Guide
General Operating Revenue and Expense
Reports Training Guide
For RAPS Support, send an e-mail message to [email protected], or call 935-3890.
K:\Raps\B-P\R&E Budgeting\Model Help Documentation\Proposed Sample Reports for GO Rev and Exp
Table of Contents
ii General Operating Revenue and Expense Reports Training Guide
This page has been intentionally otherwise left blank.
Table of Contents
General Operating Revenue and Expense Reports Training Guide iii
Table of Contents
Navigating to the GO Revenue & Expense Reports ...................................... 1
The Revenue and Expense Budgeting Page ................................................. 4
Navigating the Revenue and Expense Budgeting Page ..................................... 4
General Operating Revenue and Expense Report Prompts .......................... 6
Organization Selection Options ..................................................................... 6
Report Period Selection Options .................................................................... 8
Account Selection Options ............................................................................ 9
Additional Report Filter Options..................................................................... 9
Columns Available to Display ........................................................................ 9
Report Format Options .............................................................................. 10
Additional Display Options .......................................................................... 10
Navigating a Report .................................................................................. 11
Running a Report ...................................................................................... 11
Navigating the Report Screen ..................................................................... 15
Printing a Report ....................................................................................... 16
Model Updates Reflected in Reports .......................................................... 17
General Operating Revenue and Expense Reports ..................................... 18
Departmental Budget Analysis Report .......................................................... 20
Last Update by Node Report ....................................................................... 22
Allocation Balancing Report ........................................................................ 24
Allocation Detail Report ............................................................................. 26
CY Budget Submission Analysis................................................................... 28
Appendix A ................................................................................................ 31
Saving Prompt Selections ........................................................................... 31
Setting Personal Preferences ...................................................................... 36
Exporting to Excel Format .......................................................................... 38

Navigating to the General Operating Revenue and Expense Reports
General Operating Revenue and Expense Training Guide 1
Navigating to the GO Revenue & Expense Reports
□ In this section, you will be shown how to access RAPS by logging in and navigating to the
General Operating Revenue and Expense Reports page.
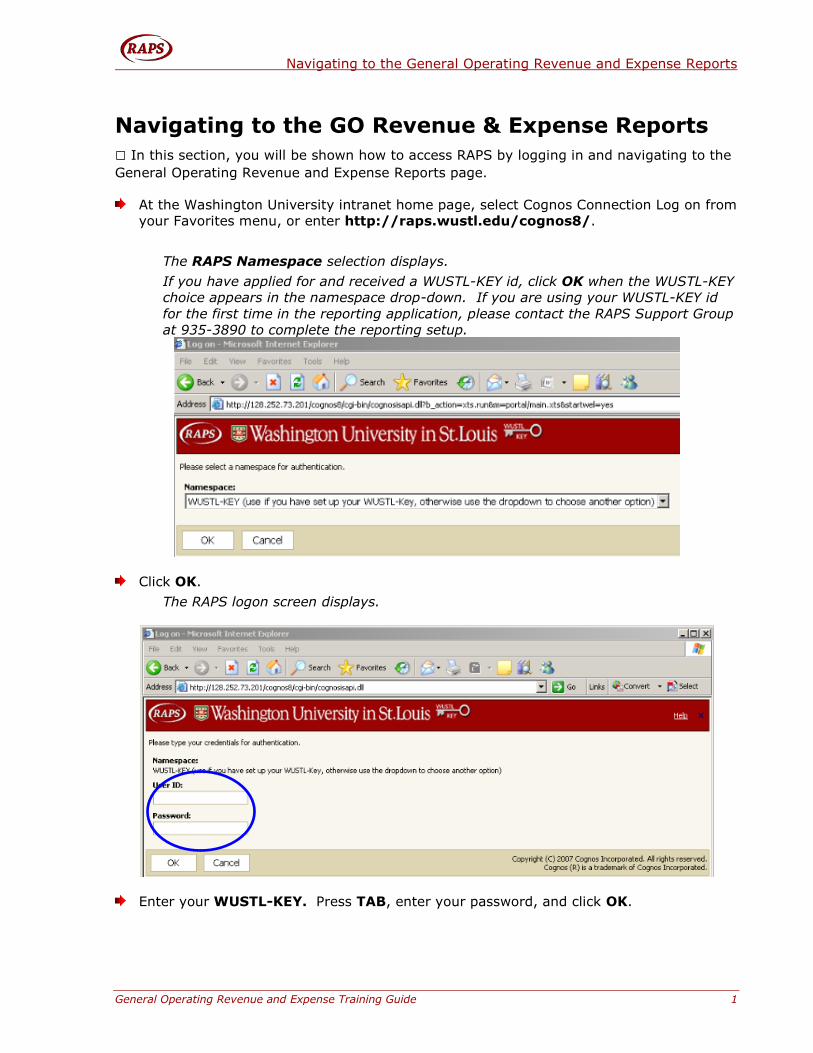
At the Washington University intranet home page, select Cognos Connection Log on from
your Favorites menu, or enter http://raps.wustl.edu/cognos8/.
The RAPS Namespace selection displays.
If you have applied for and received a WUSTL-KEY id, click OK when the WUSTL-KEY
choice appears in the namespace drop-down. If you are using your WUSTL-KEY id
for the first time in the reporting application, please contact the RAPS Support Group
at 935-3890 to complete the reporting setup.
Click OK.
The RAPS logon screen displays.
Enter your WUSTL-KEY. Press TAB, enter your password, and click OK.
Navigating to the General Operating Revenue and Expense Reports
2 General Operating Revenue and Expense Training Guide
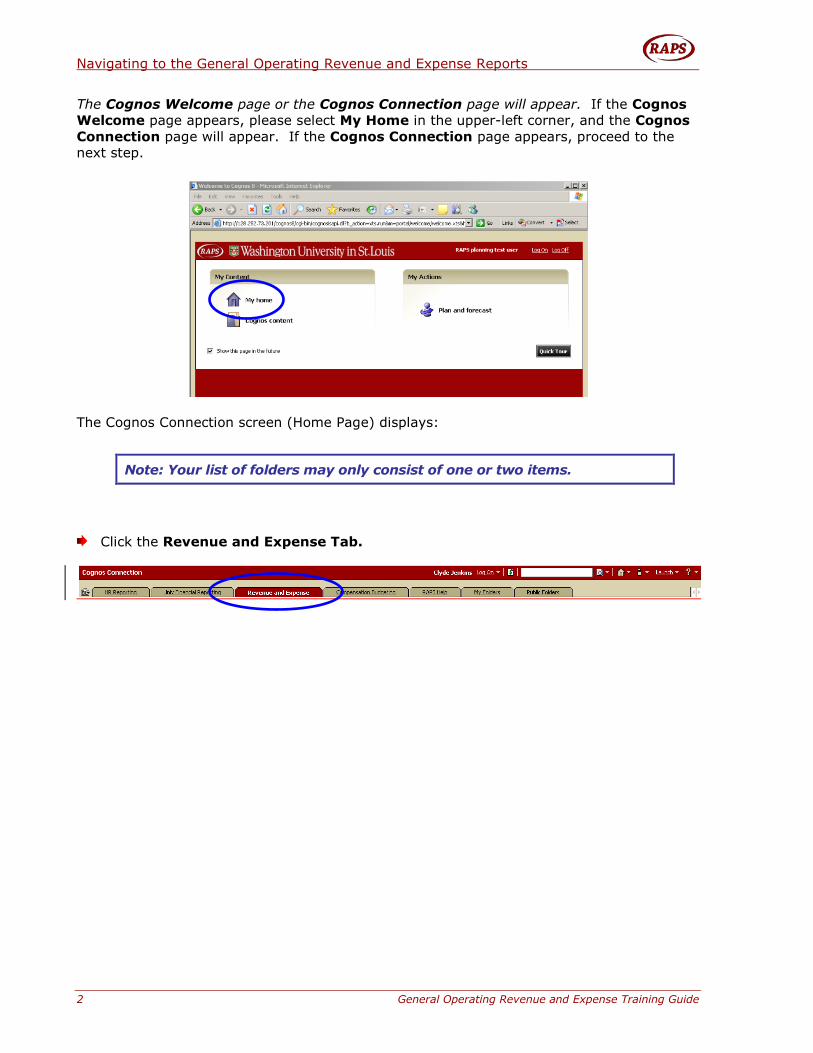
The Cognos Welcome page or the Cognos Connection page will appear. If the Cognos
Welcome page appears, please select My Home in the upper-left corner, and the Cognos
Connection page will appear. If the Cognos Connection page appears, proceed to the
next step.
The Cognos Connection screen (Home Page) displays:
Note: Your list of folders may only consist of one or two items.
Click the Revenue and Expense Tab.
Navigating to the General Operating Revenue and Expense Reports
General Operating Revenue and Expense Training Guide 3
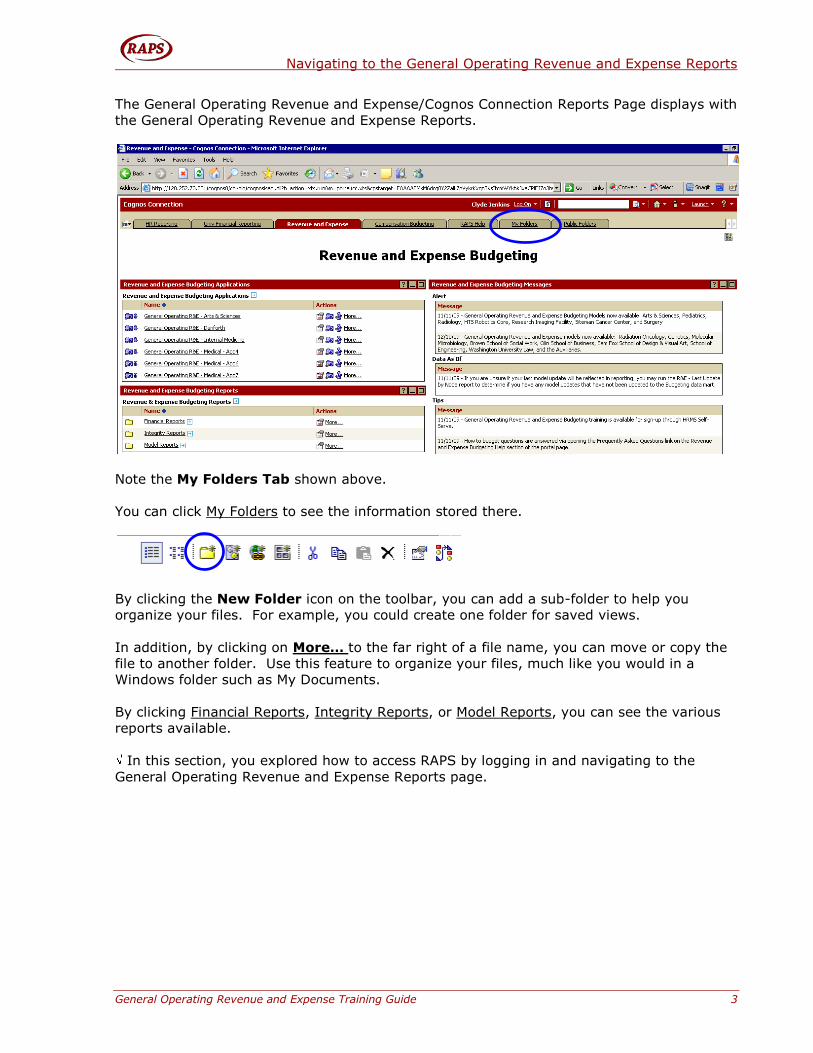
The General Operating Revenue and Expense/Cognos Connection Reports Page displays with
the General Operating Revenue and Expense Reports.
Note the My Folders Tab shown above.
You can click My Folders to see the information stored there.
By clicking the New Folder icon on the toolbar, you can add a sub-folder to help you
organize your files. For example, you could create one folder for saved views.
In addition, by clicking on More… to the far right of a file name, you can move or copy the
file to another folder. Use this feature to organize your files, much like you would in a
Windows folder such as My Documents.
By clicking Financial Reports, Integrity Reports, or Model Reports, you can see the various
reports available.
In this section, you explored how to access RAPS by logging in and navigating to the
General Operating Revenue and Expense Reports page.
The General Operating Revenue and Expense Reports Page
4 General Operating Revenue and Expense Training Guide
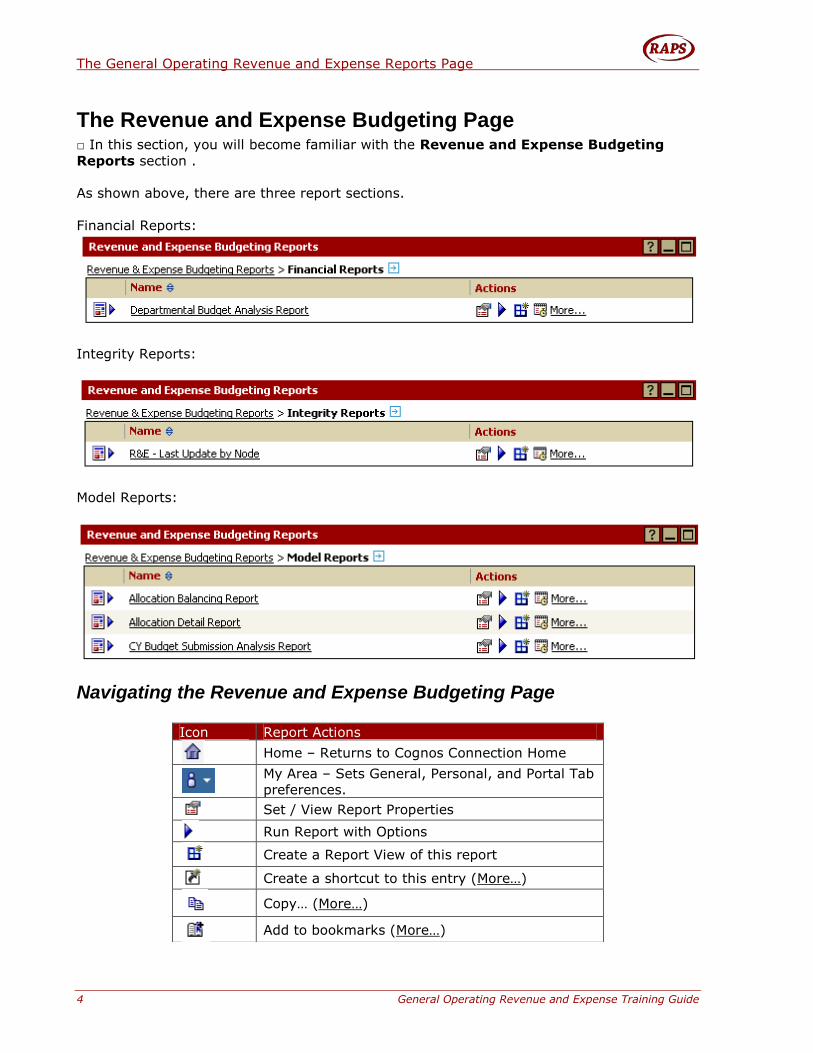
The Revenue and Expense Budgeting Page □ In this section, you will become familiar with the Revenue and Expense Budgeting
Reports section .
As shown above, there are three report sections.
Financial Reports:
Integrity Reports:
Model Reports:
Navigating the Revenue and Expense Budgeting Page
Icon Report Actions
Home – Returns to Cognos Connection Home
My Area – Sets General, Personal, and Portal Tab
preferences.
Set / View Report Properties
Run Report with Options
Create a Report View of this report
Create a shortcut to this entry (More…)
Copy… (More…)
Add to bookmarks (More…)
Navigating to the General Operating Revenue and Expense Reports
General Operating Revenue and Expense Training Guide 5
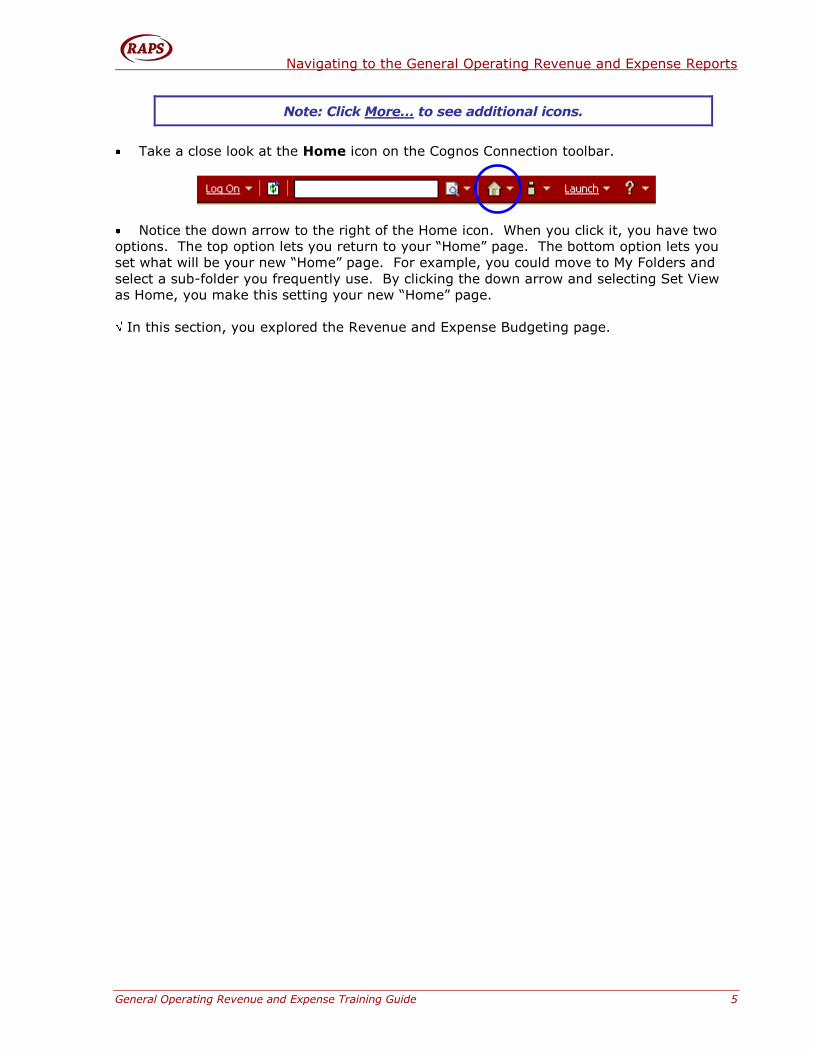
Note: Click More… to see additional icons.
Take a close look at the Home icon on the Cognos Connection toolbar.
Notice the down arrow to the right of the Home icon. When you click it, you have two
options. The top option lets you return to your “Home” page. The bottom option lets you
set what will be your new “Home” page. For example, you could move to My Folders and
select a sub-folder you frequently use. By clicking the down arrow and selecting Set View
as Home, you make this setting your new “Home” page.
In this section, you explored the Revenue and Expense Budgeting page.
General Operating Revenue and Expense Report Prompts
6 General Operating Revenue and Expense Reports Training Guide
General Operating Revenue and Expense Report
Prompts
□ In this section, you will learn about the General Operating Revenue and Expense Report
prompts you will utilize to get just the data you need.
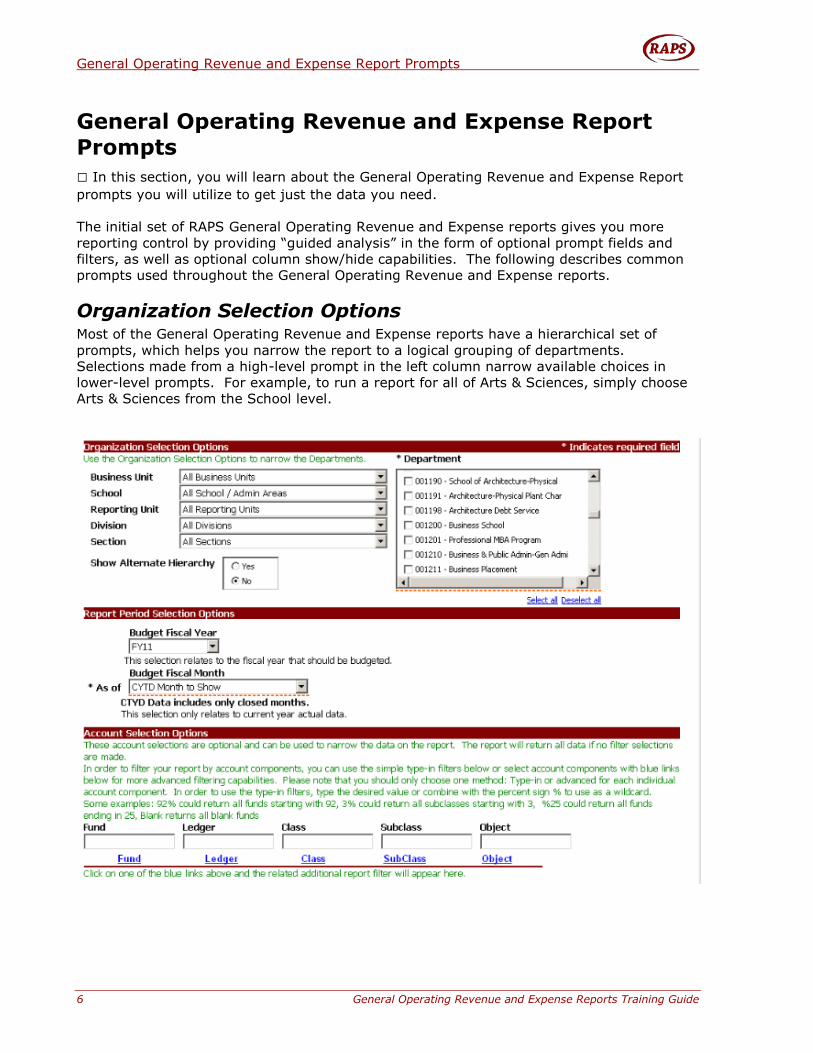
The initial set of RAPS General Operating Revenue and Expense reports gives you more
reporting control by providing “guided analysis” in the form of optional prompt fields and
filters, as well as optional column show/hide capabilities. The following describes common
prompts used throughout the General Operating Revenue and Expense reports.
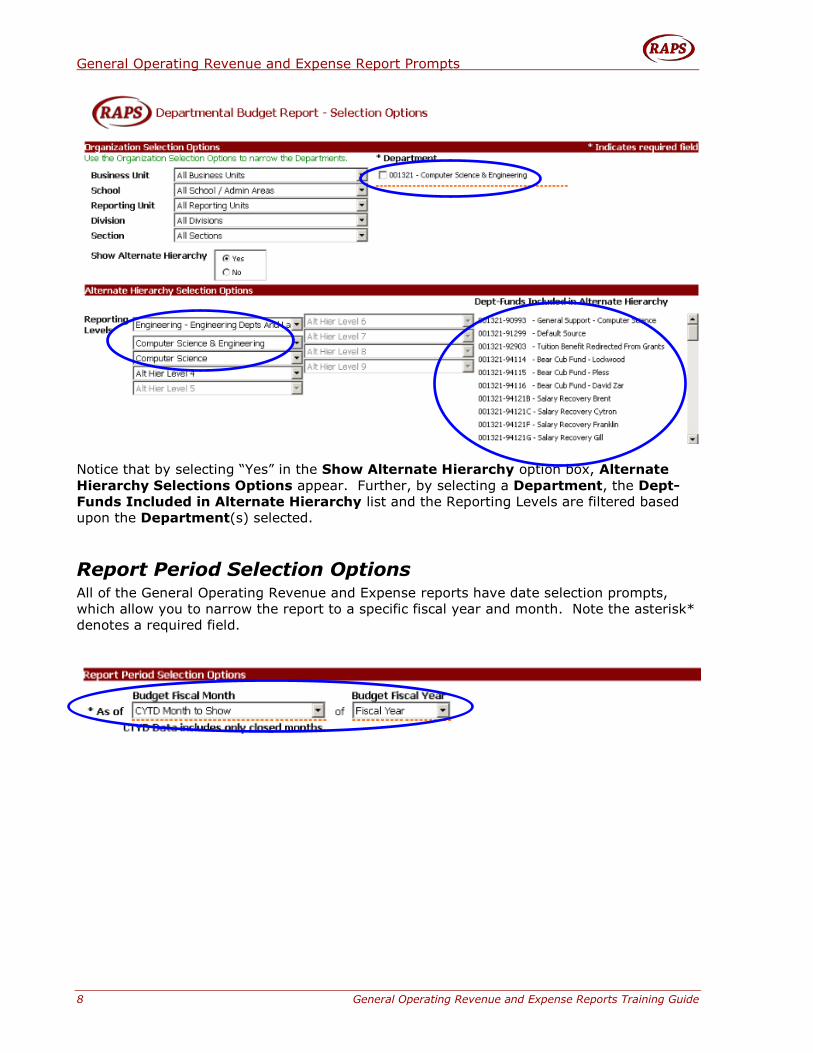
Organization Selection Options Most of the General Operating Revenue and Expense reports have a hierarchical set of
prompts, which helps you narrow the report to a logical grouping of departments.
Selections made from a high-level prompt in the left column narrow available choices in
lower-level prompts. For example, to run a report for all of Arts & Sciences, simply choose
Arts & Sciences from the School level.
General Operating Revenue and Expense Report Prompts
General Operating Revenue and Expense Training Guide 7
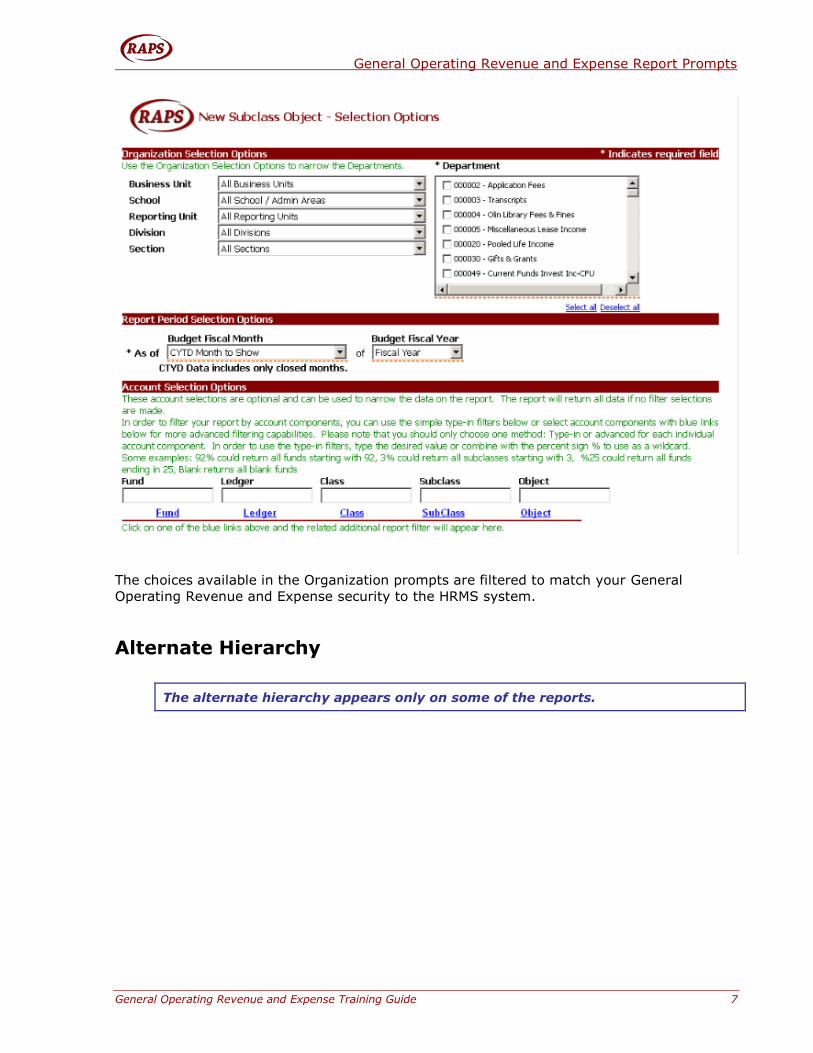
The choices available in the Organization prompts are filtered to match your General
Operating Revenue and Expense security to the HRMS system.
Alternate Hierarchy
The alternate hierarchy appears only on some of the reports.
General Operating Revenue and Expense Report Prompts
8 General Operating Revenue and Expense Reports Training Guide
Notice that by selecting “Yes” in the Show Alternate Hierarchy option box, Alternate
Hierarchy Selections Options appear. Further, by selecting a Department, the Dept-
Funds Included in Alternate Hierarchy list and the Reporting Levels are filtered based
upon the Department(s) selected.
Report Period Selection Options All of the General Operating Revenue and Expense reports have date selection prompts,
which allow you to narrow the report to a specific fiscal year and month. Note the asterisk*
denotes a required field.
General Operating Revenue and Expense Report Prompts
General Operating Revenue and Expense Training Guide 9
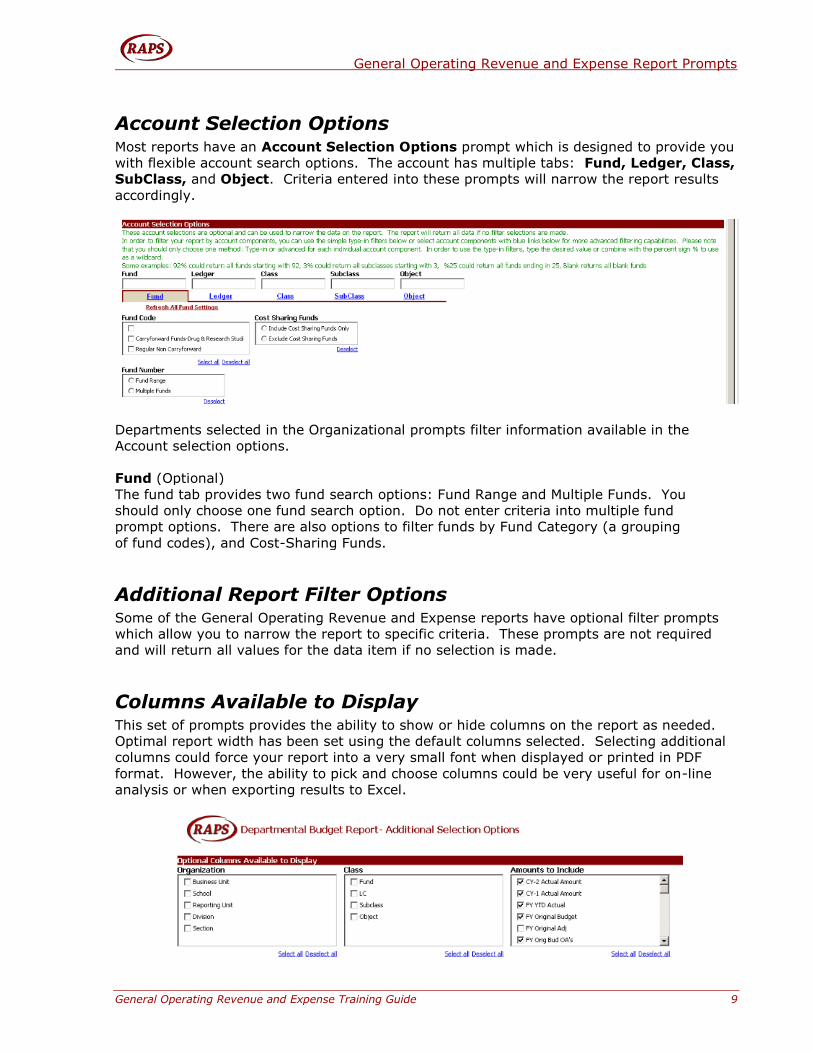
Account Selection Options Most reports have an Account Selection Options prompt which is designed to provide you
with flexible account search options. The account has multiple tabs: Fund, Ledger, Class,
SubClass, and Object. Criteria entered into these prompts will narrow the report results
accordingly.
Departments selected in the Organizational prompts filter information available in the
Account selection options.
Fund (Optional)
The fund tab provides two fund search options: Fund Range and Multiple Funds. You
should only choose one fund search option. Do not enter criteria into multiple fund
prompt options. There are also options to filter funds by Fund Category (a grouping
of fund codes), and Cost-Sharing Funds.
Additional Report Filter Options Some of the General Operating Revenue and Expense reports have optional filter prompts
which allow you to narrow the report to specific criteria. These prompts are not required
and will return all values for the data item if no selection is made.
Columns Available to Display This set of prompts provides the ability to show or hide columns on the report as needed.
Optimal report width has been set using the default columns selected. Selecting additional
columns could force your report into a very small font when displayed or printed in PDF
format. However, the ability to pick and choose columns could be very useful for on-line
analysis or when exporting results to Excel.
General Operating Revenue and Expense Report Prompts
10 General Operating Revenue and Expense Reports Training Guide
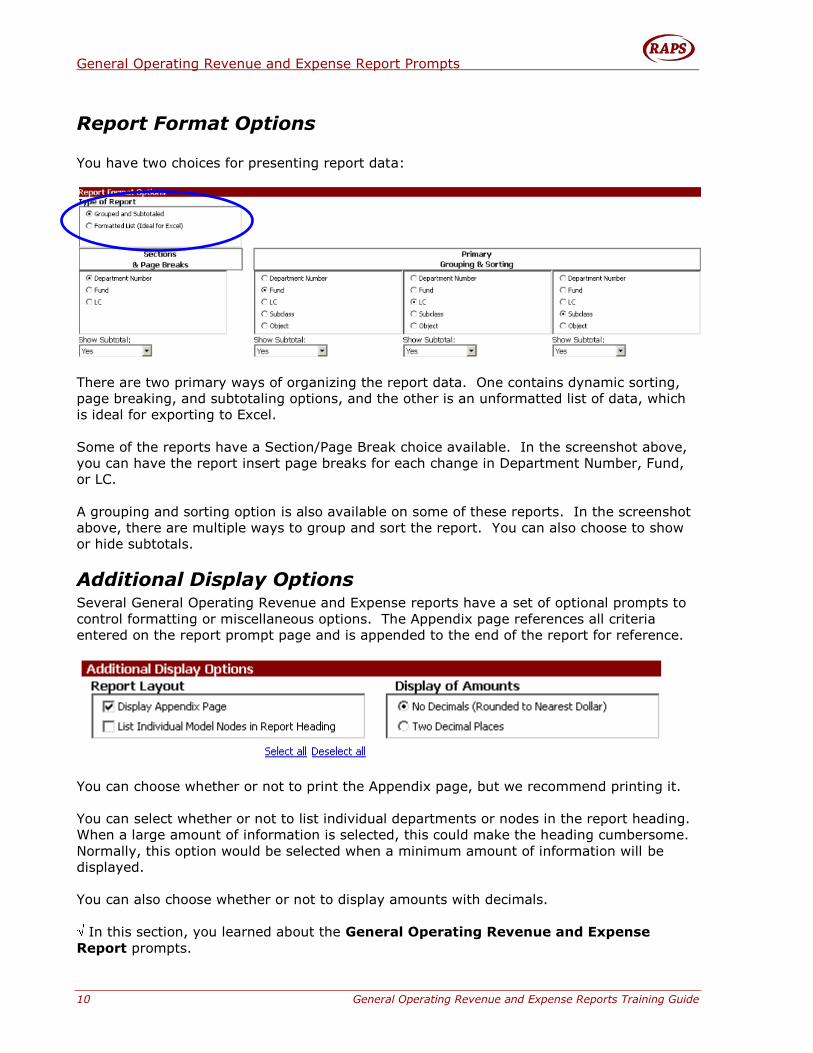
Report Format Options
You have two choices for presenting report data:
There are two primary ways of organizing the report data. One contains dynamic sorting,
page breaking, and subtotaling options, and the other is an unformatted list of data, which
is ideal for exporting to Excel.
Some of the reports have a Section/Page Break choice available. In the screenshot above,
you can have the report insert page breaks for each change in Department Number, Fund,
or LC.
A grouping and sorting option is also available on some of these reports. In the screenshot
above, there are multiple ways to group and sort the report. You can also choose to show
or hide subtotals.
Additional Display Options Several General Operating Revenue and Expense reports have a set of optional prompts to
control formatting or miscellaneous options. The Appendix page references all criteria
entered on the report prompt page and is appended to the end of the report for reference.
You can choose whether or not to print the Appendix page, but we recommend printing it.
You can select whether or not to list individual departments or nodes in the report heading.
When a large amount of information is selected, this could make the heading cumbersome.
Normally, this option would be selected when a minimum amount of information will be
displayed.
You can also choose whether or not to display amounts with decimals.
In this section, you learned about the General Operating Revenue and Expense
Report prompts.
Navigating a Report
General Operating Revenue and Expense Reports Training Guide 11
Navigating a Report
□ In this section, you will learn about running a report, navigating to the report screen, and
printing a report.
Running a Report
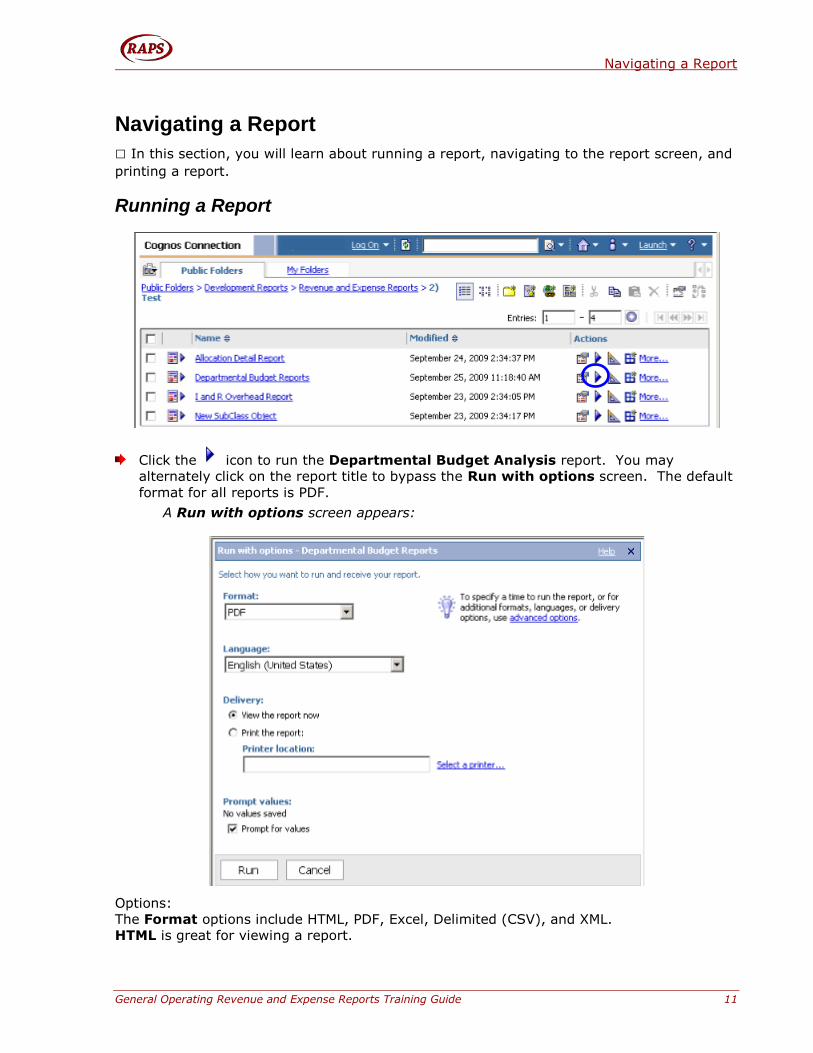
Click the icon to run the Departmental Budget Analysis report. You may
alternately click on the report title to bypass the Run with options screen. The default
format for all reports is PDF.
A Run with options screen appears:
Options:
The Format options include HTML, PDF, Excel, Delimited (CSV), and XML.
HTML is great for viewing a report.
Navigating a Report
12 General Operating Revenue and Expense Reports Training Guide
PDF is recommended for printing a report.
Choose Excel to download the report to Excel for further analysis.
Delimited allows downloading the report into other programs.
XML is used for report authors.
The Language option should use the default as English.
The Delivery options let you specify whether to view the report or print it. However, the
View the report now is the only functioning option. Do not select Print the report.
The print option is only available with the PDF Format. If you view the report
in HTML, you can convert the report to PDF to print it.
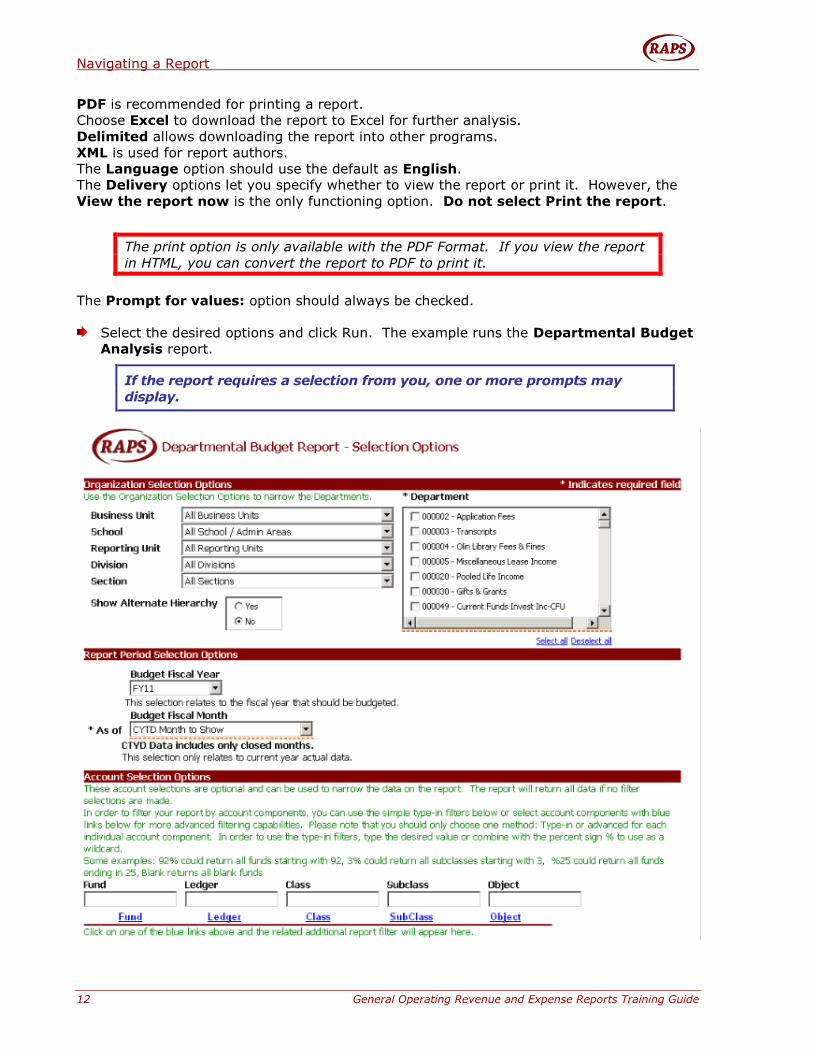
The Prompt for values: option should always be checked.
Select the desired options and click Run. The example runs the Departmental Budget
Analysis report.
If the report requires a selection from you, one or more prompts may
display.
Navigating a Report
General Operating Revenue and Expense Reports Training Guide 13
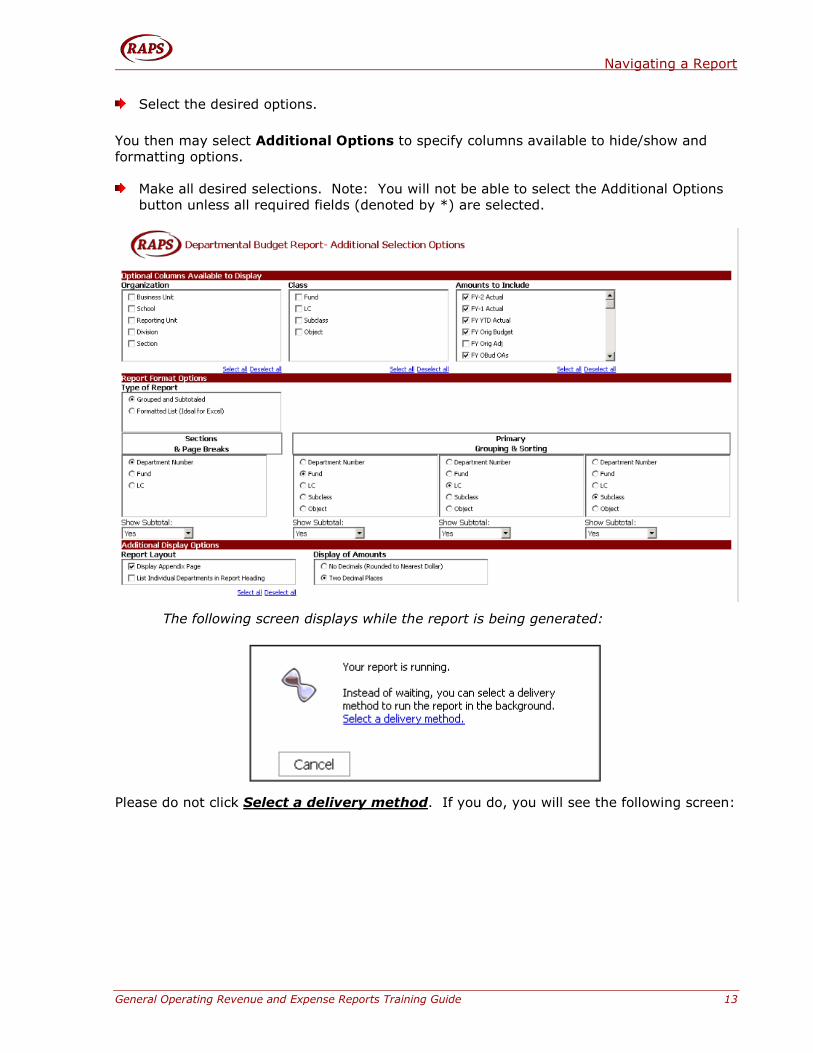
Select the desired options.
You then may select Additional Options to specify columns available to hide/show and
formatting options.
Make all desired selections. Note: You will not be able to select the Additional Options
button unless all required fields (denoted by *) are selected.
The following screen displays while the report is being generated:
Please do not click Select a delivery method. If you do, you will see the following screen:
Navigating a Report
14 General Operating Revenue and Expense Reports Training Guide
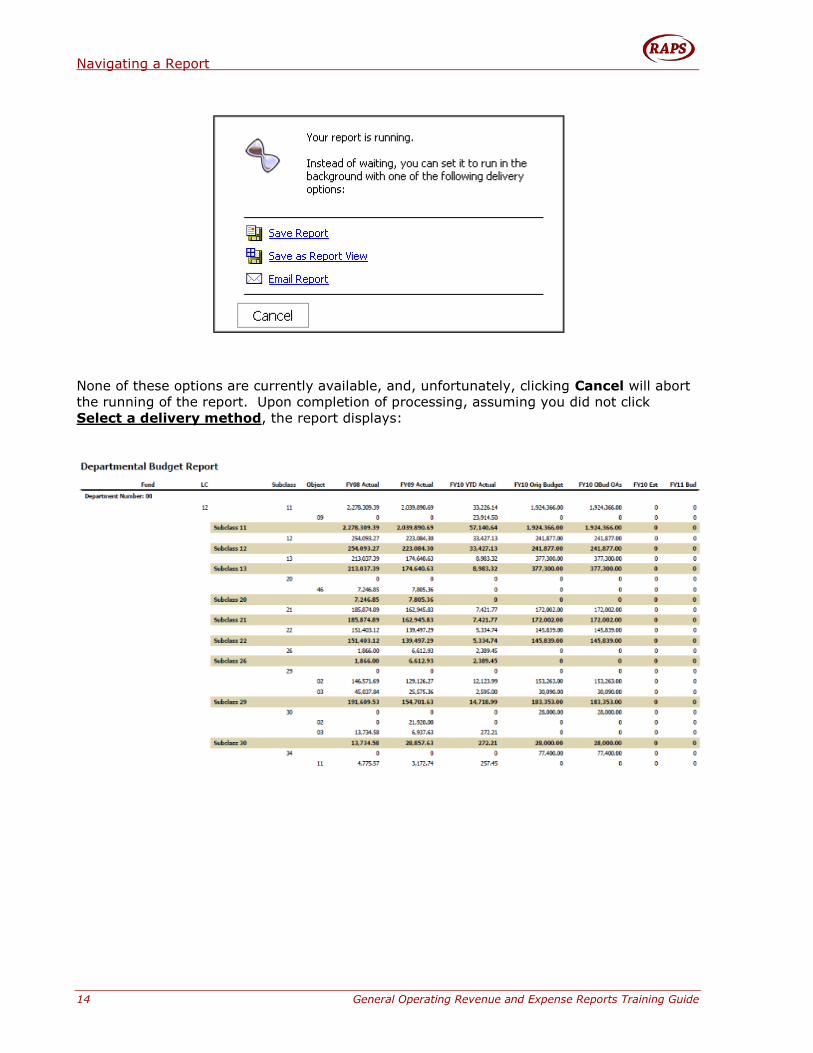
None of these options are currently available, and, unfortunately, clicking Cancel will abort
the running of the report. Upon completion of processing, assuming you did not click
Select a delivery method, the report displays:
Navigating a Report
General Operating Revenue and Expense Reports Training Guide 15
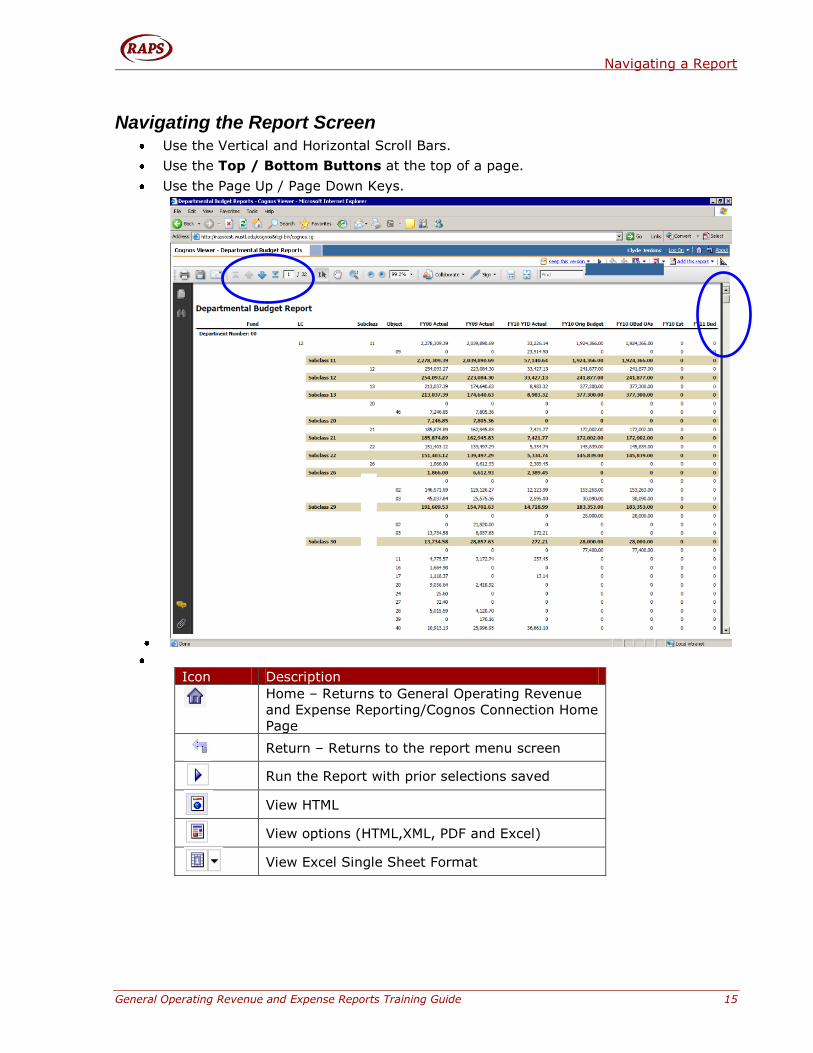
Navigating the Report Screen Use the Vertical and Horizontal Scroll Bars.
Use the Top / Bottom Buttons at the top of a page.
Use the Page Up / Page Down Keys.
Icon Description
Home – Returns to General Operating Revenue
and Expense Reporting/Cognos Connection Home
Page
Return – Returns to the report menu screen
Run the Report with prior selections saved
View HTML
View options (HTML,XML, PDF and Excel)
View Excel Single Sheet Format
Navigating a Report
16 General Operating Revenue and Expense Reports Training Guide
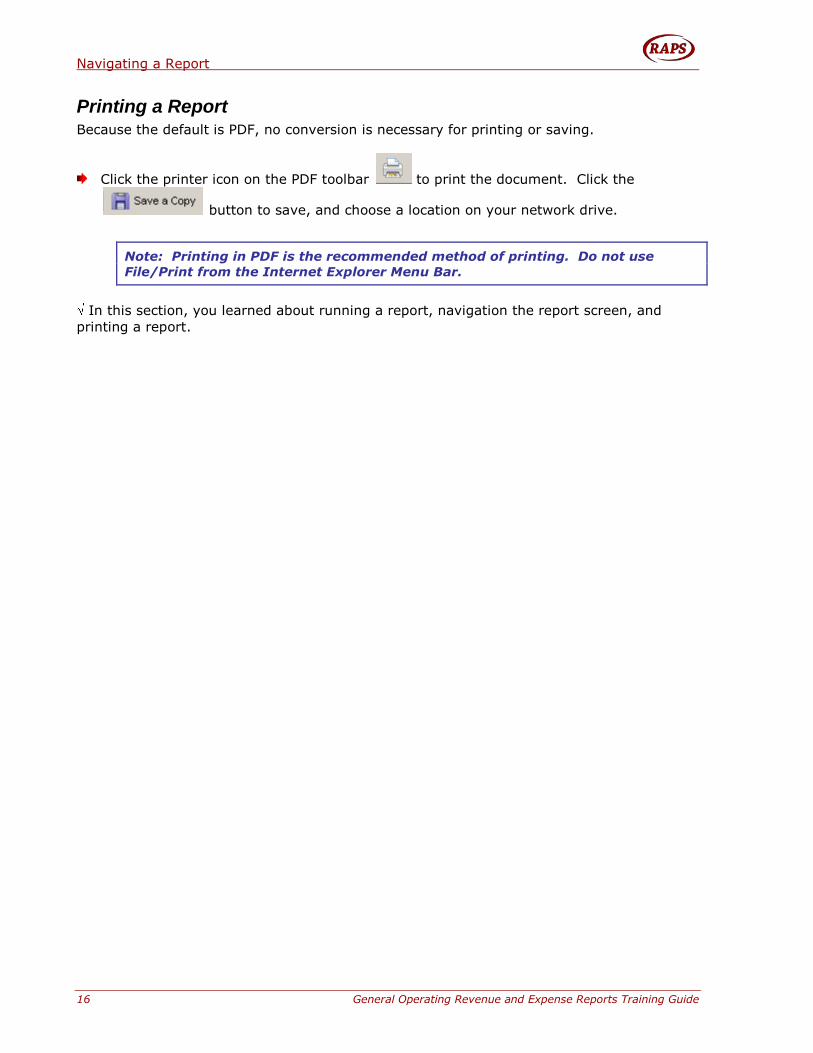
Printing a Report Because the default is PDF, no conversion is necessary for printing or saving.
Click the printer icon on the PDF toolbar to print the document. Click the
button to save, and choose a location on your network drive.
Note: Printing in PDF is the recommended method of printing. Do not use
File/Print from the Internet Explorer Menu Bar.
In this section, you learned about running a report, navigation the report screen, and
printing a report.
Model Updates
General Operating Revenue and Expense Reports Training Guide 17
Model Updates Reflected in Reports □ In this section, you will learn how Model data is updated in reports.
Changes to model data are not immediately reflected in reports. A process needs to run to
move data from the model into the General Operating Revenue and Expense Datamart, at
which time the updated data is available for reporting.
At present, the General Operating Revenue and Expense model publishes to the reporting
database every hour, except for a nightly maintenance window.
If you want to know for sure that your data has been refreshed you can run the RE - Last
Update by Node report.
Another method to verify the data refresh is to look on the Appendix page of a report. The
Published Date indicates the time data was last moved out of the model. If the last save to
the model data was prior to this date, then the data in the report would reflect those
updates.
In this section, you learned how Model data is updated in reports.
General Operating Revenue and Expense Reports
18 General Operating Revenue and Expense Reports Training Guide
General Operating Revenue and Expense Reports
□ In this section, you will be given a tour of the General Operating Revenue and
Expense Reports that are available.
Financial:
Departmental Budget Analysis
Integrity:
Last Update by Node
Model:
Allocation Balancing
Allocation Detail
CY Budget Submission Analysis
These reports present the General Operating Revenue and Expense data that is organized
and displayed based on the data structure presented in the model. Where indicated in the
description below, the totals on these reports match the total lines on model tabs. Some of
these reports include additional options that allow you to sort or group in ways that the
model does not allow.
When should these reports be used?
All of the reports can be used at different times during or after the budgeting process.
You can use the some of the reports to look at the budget information that was
imported and/or entered into the model.
Once the budget has been prepared, you can verify the correct amount has been
budgeted by using a number of different views and measures.
Some reports can be used after the budget has been finalized to write annual
variance explanations
General Operating Revenue and Expense Reports
General Operating Revenue and Expense Reports Training Guide 19
This page is intentionally left blank.
General Operating Revenue and Expense Reports
20 General Operating Revenue and Expense Reports Training Guide
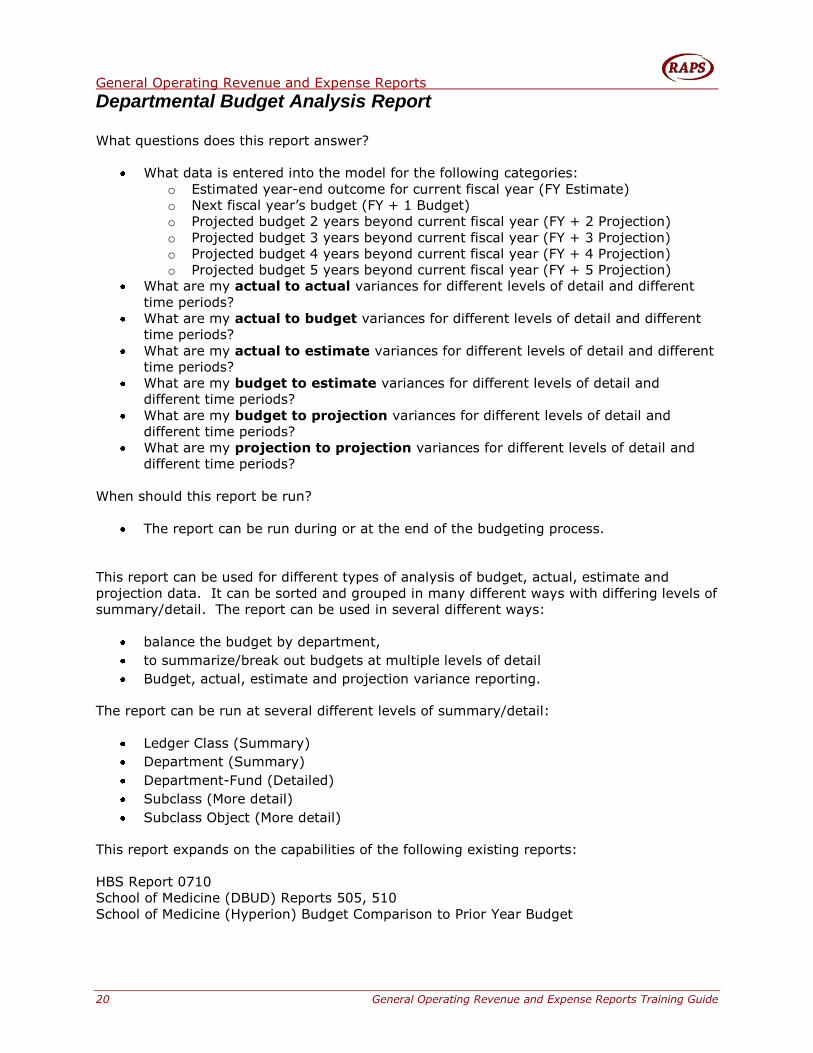
Departmental Budget Analysis Report
What questions does this report answer?
What data is entered into the model for the following categories:
o Estimated year-end outcome for current fiscal year (FY Estimate)
o Next fiscal year’s budget (FY + 1 Budget)
o Projected budget 2 years beyond current fiscal year (FY + 2 Projection)
o Projected budget 3 years beyond current fiscal year (FY + 3 Projection)
o Projected budget 4 years beyond current fiscal year (FY + 4 Projection)
o Projected budget 5 years beyond current fiscal year (FY + 5 Projection)
What are my actual to actual variances for different levels of detail and different
time periods?
What are my actual to budget variances for different levels of detail and different
time periods?
What are my actual to estimate variances for different levels of detail and different
time periods?
What are my budget to estimate variances for different levels of detail and
different time periods?
What are my budget to projection variances for different levels of detail and
different time periods?
What are my projection to projection variances for different levels of detail and
different time periods?
When should this report be run?
The report can be run during or at the end of the budgeting process.
This report can be used for different types of analysis of budget, actual, estimate and
projection data. It can be sorted and grouped in many different ways with differing levels of
summary/detail. The report can be used in several different ways:
balance the budget by department,
to summarize/break out budgets at multiple levels of detail
Budget, actual, estimate and projection variance reporting.
The report can be run at several different levels of summary/detail:
Ledger Class (Summary)
Department (Summary)
Department-Fund (Detailed)
Subclass (More detail)
Subclass Object (More detail)
This report expands on the capabilities of the following existing reports:
HBS Report 0710
School of Medicine (DBUD) Reports 505, 510
School of Medicine (Hyperion) Budget Comparison to Prior Year Budget
General Operating Revenue and Expense Reports
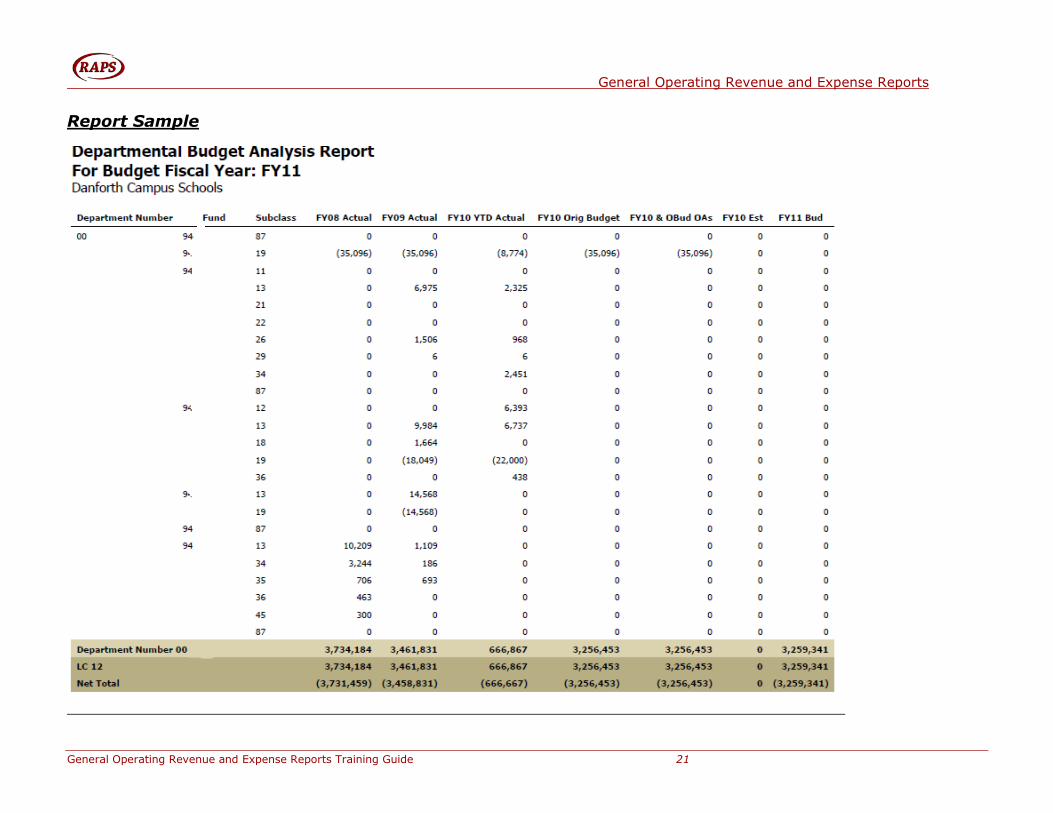
General Operating Revenue and Expense Reports Training Guide 21
Report Sample
General Operating Revenue and Expense Reports
22 General Operating Revenue and Expense Reports Training Guide
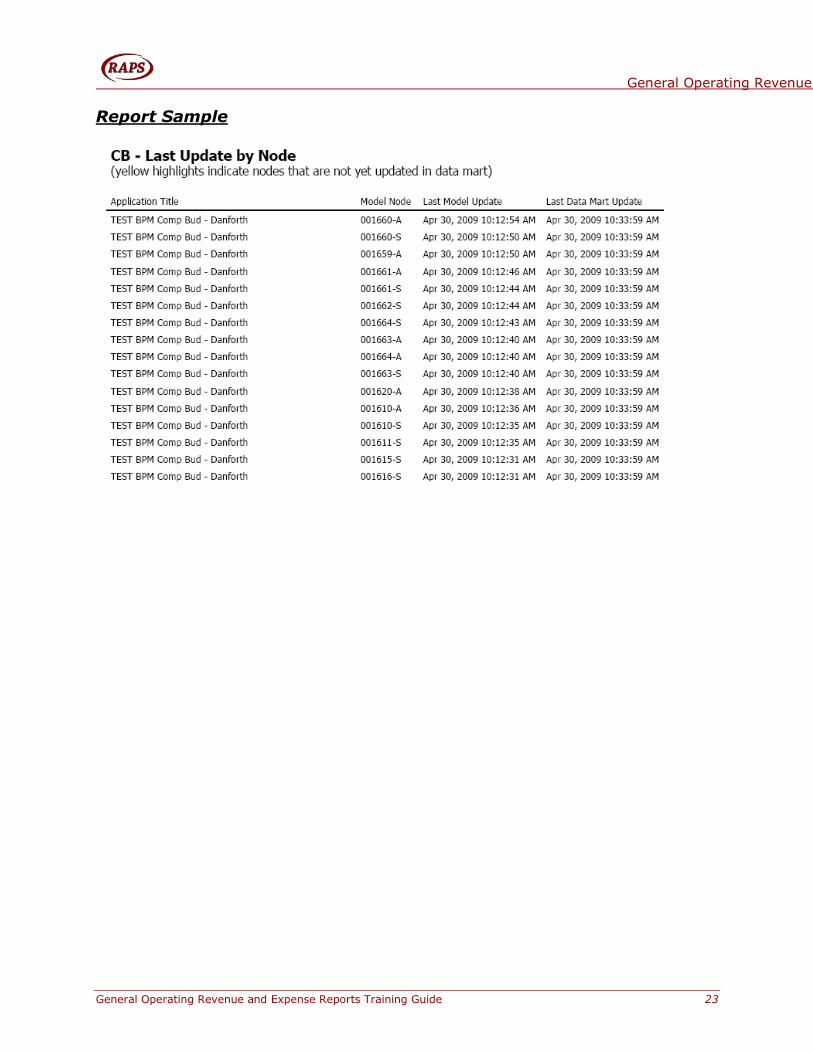
Last Update by Node Report
What question does this report answer?
Did the latest Model update successfully transfer to the Data Mart?
When should this report be used?
The report can be used during the budget development process to see when your
model changes will be reflected in reporting.
This report displays the latest Model and Data Mart updates by Node. The report is sorted
by Last Data Mart Update.
General Operating Revenue and Expense Reports
General Operating Revenue and Expense Reports Training Guide 23
Report Sample
General Operating Revenue and Expense Reports
24 General Operating Revenue and Expense Reports Training Guide
Allocation Balancing Report
What question does this report answer?
How do I know if allocations are properly balanced across the University?
o Note: This report has no selection prompts for Department or Fund. The
report will return data to the extent of your individual security.
When should this report be used?
This report is meant to be used by central areas (Financial Services areas and School
of Medicine Budget Office) at the end of the budgeting process.
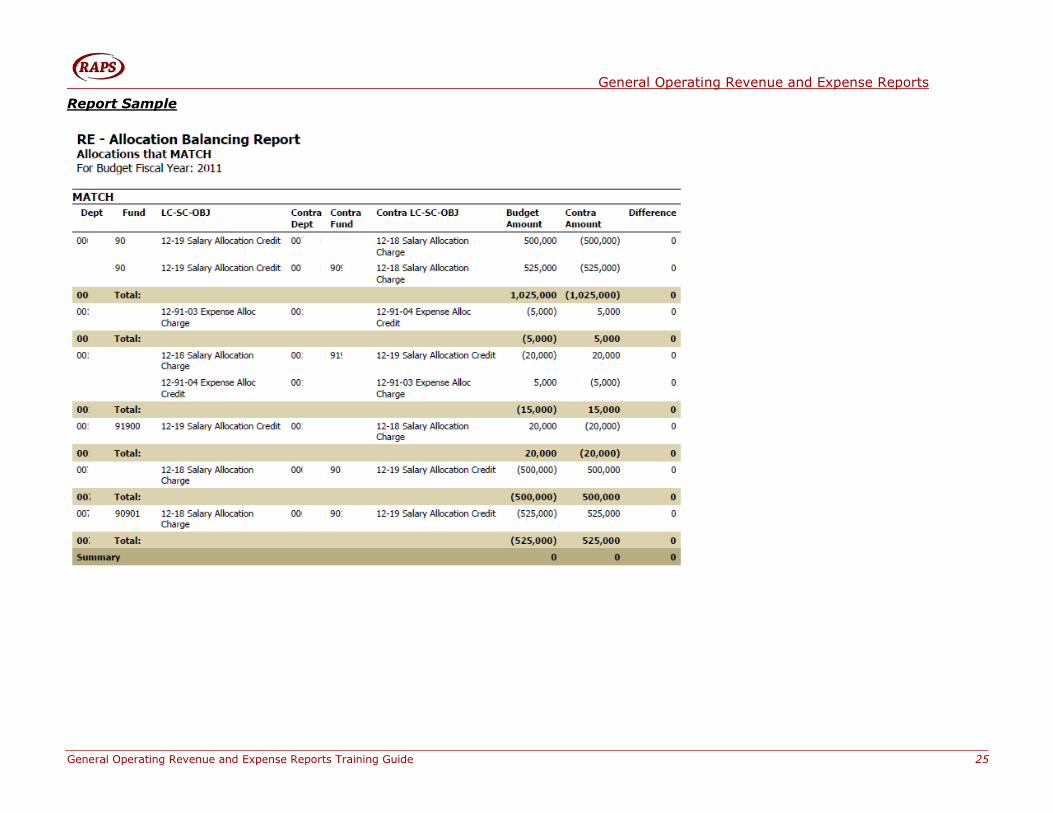
This report is used to balance allocations between departments across the University. The
report will compare the Allocation Detail tab from all models and produce accounts that
match and accounts that do not match.
The report will primarily be run by central areas (Financial Services areas and the School of
Medicine Budget Office) at the end of the budgeting process – it is one of the last steps
before the budget is finalized and loaded into AIS. There are no rollups for this report. The
report can be run for all departments since the primary purpose is to make sure that
allocations are in balance across the University.
General Operating Revenue and Expense Reports
General Operating Revenue and Expense Reports Training Guide 25
Report Sample
General Operating Revenue and Expense Reports
26 General Operating Revenue and Expense Reports Training Guide
Allocation Detail Report
What questions does this report answer?
What is the detail behind the allocation amounts in the model?
When should this report be used?
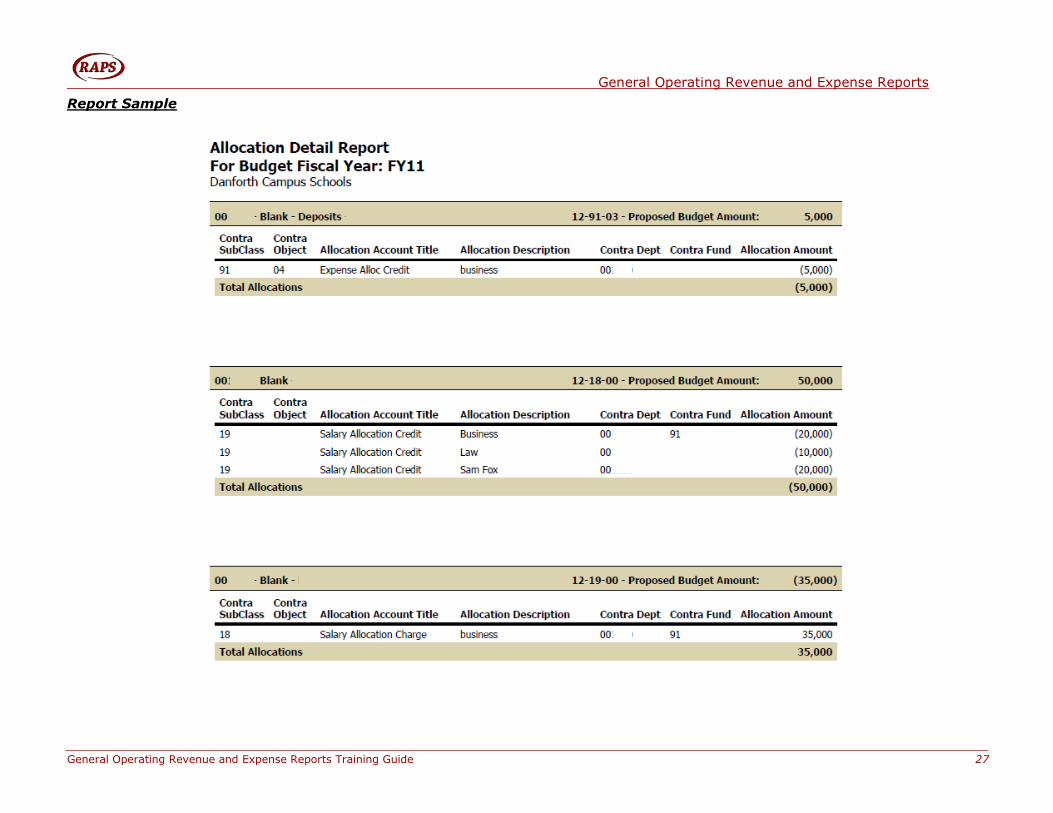
The report can be run during or at the end of the budgeting process This report is primarily
a data listing of everything in the Allocation Detail tab of the R&E models. It will serve as a
record of the detail behind allocations, which will help in the next year budget. It can also
be used to verify the content of an allocation in case of disagreements between
departments.
General Operating Revenue and Expense Reports
General Operating Revenue and Expense Reports Training Guide 27
Report Sample
General Operating Revenue and Expense Reports
28 General Operating Revenue and Expense Reports Training Guide
CY Budget Submission Analysis
What question does this report answer?
What budget data will be loaded to AIS for 94xxx funds and non-94xxx funds?
What is the difference between next year’s fiscal year budget and the budget loaded
to AIS for 94xxx funds
What is the total budget that will be loaded to AIS versus the total fiscal year budget
for all department funds
When should this report be run?
The report can be run during or at the end of the budgeting process.
The purpose of this report is to differentiate between data loaded to AIS and next year’s
fiscal year budget. The difference exists for 94xxx funds only.
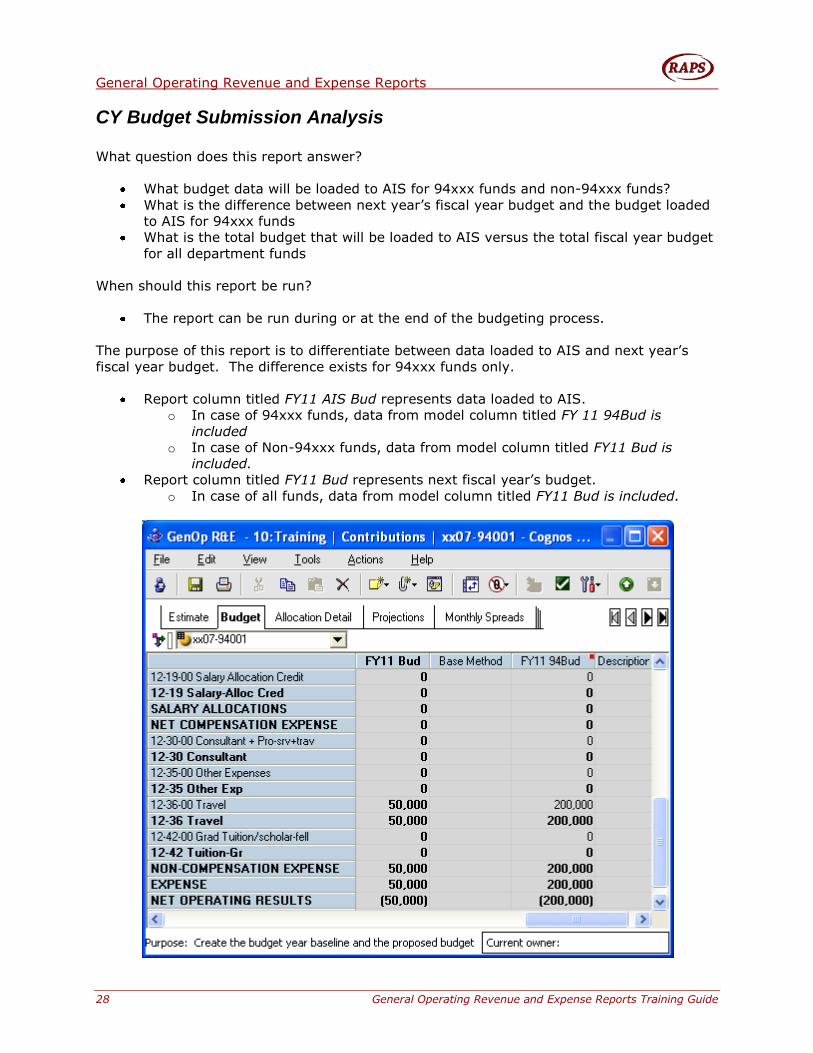
Report column titled FY11 AIS Bud represents data loaded to AIS.
o In case of 94xxx funds, data from model column titled FY 11 94Bud is
included
o In case of Non-94xxx funds, data from model column titled FY11 Bud is
included.
Report column titled FY11 Bud represents next fiscal year’s budget.
o In case of all funds, data from model column titled FY11 Bud is included.
General Operating Revenue and Expense Reports
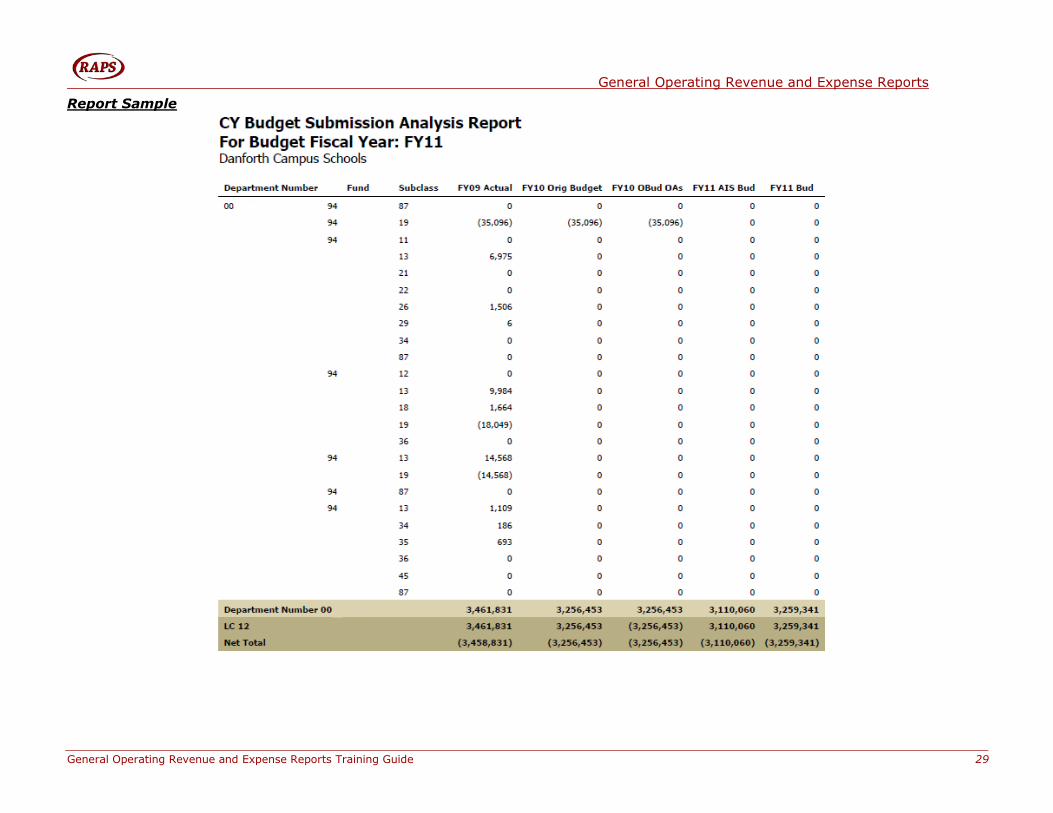
General Operating Revenue and Expense Reports Training Guide 29
Report Sample
General Operating Revenue and Expense Reports
30 General Operating Revenue and Expense Reports Training Guide
The report can be run at several different levels of summary/detail:
Ledger Class (Summary)
Department (Summary)
Department-Fund (Detailed)
Subclass (More detail)
Subclass Object (More detail)
This completes the report training.
Appendix A
General Operating Revenue and Expense Training Guide 31
Appendix A
Saving Prompt Selections □ In this section, you will be shown how to save prompt selections to save time running
reports.
A Report View saves the responses to the various prompts that were used to generate the
report. This allows you to avoid responding to the prompts every time you run the report.
You will essentially save the prompt responses.
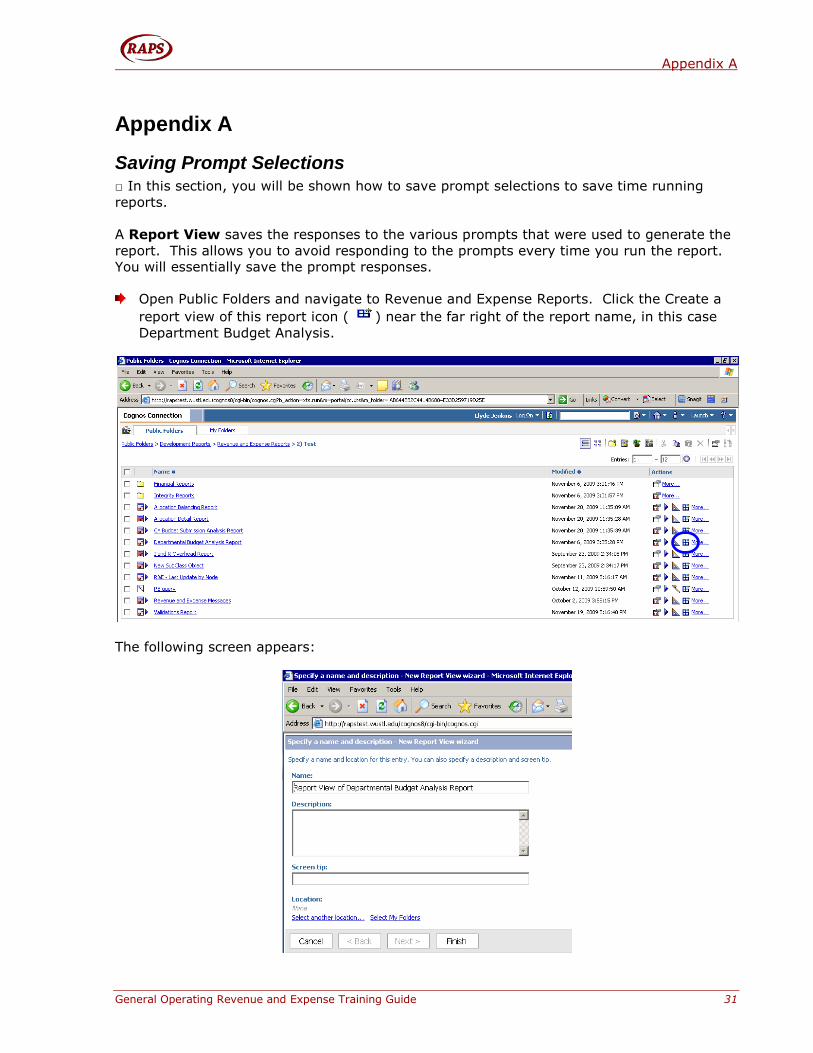
Open Public Folders and navigate to Revenue and Expense Reports. Click the Create a
report view of this report icon ( ) near the far right of the report name, in this case
Department Budget Analysis.
The following screen appears:
Appendix A
32 General Operating Revenue and Expense Training Guide
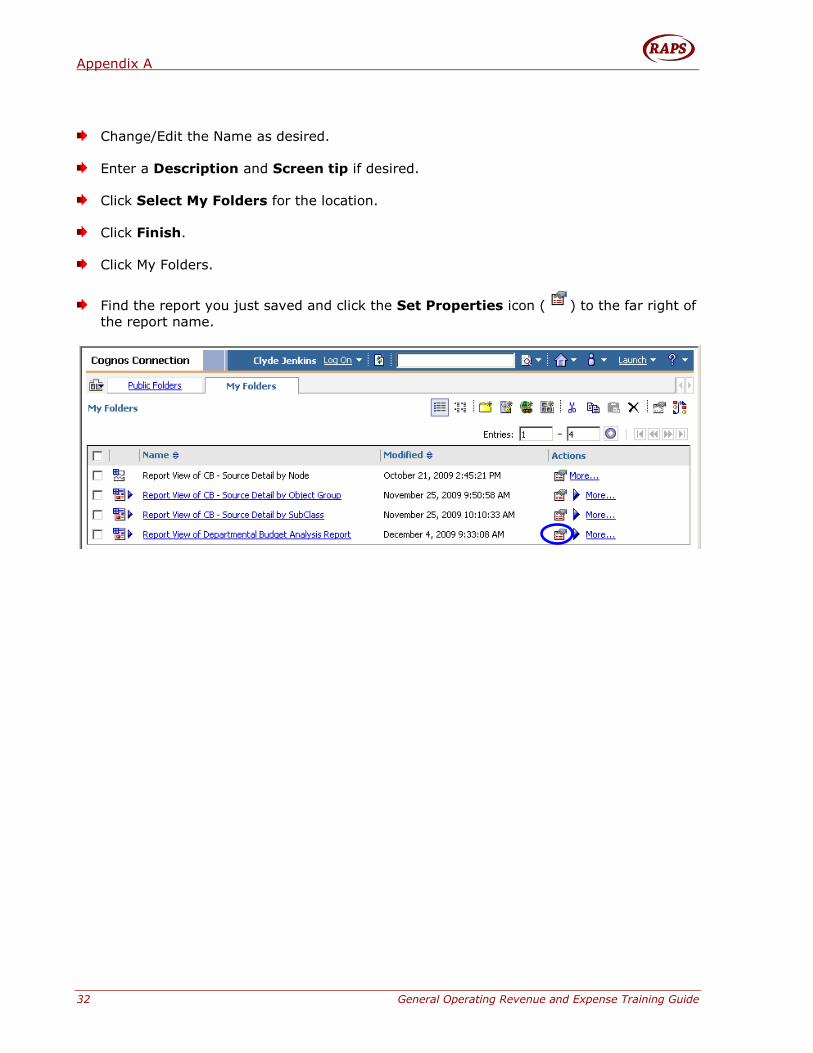
Change/Edit the Name as desired.
Enter a Description and Screen tip if desired.
Click Select My Folders for the location.
Click Finish.
Click My Folders.
Find the report you just saved and click the Set Properties icon ( ) to the far right of
the report name.
Appendix A
General Operating Revenue and Expense Training Guide 33
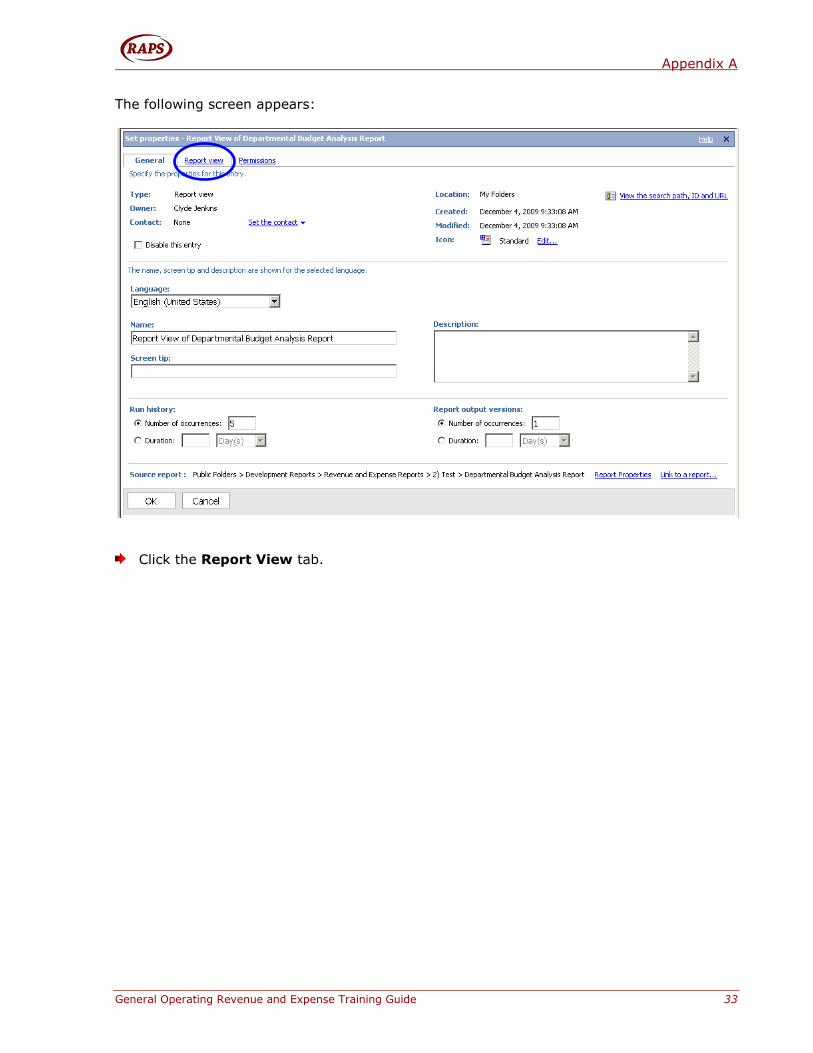
The following screen appears:
Click the Report View tab.
Appendix A
34 General Operating Revenue and Expense Training Guide
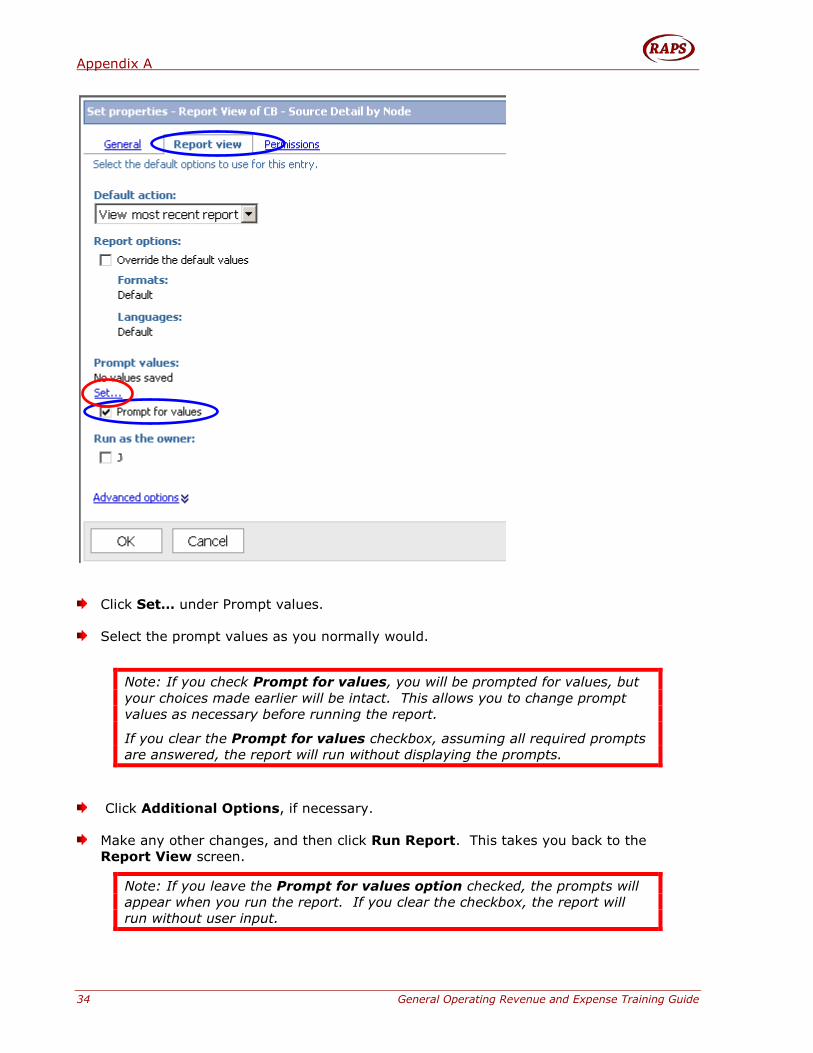
Click Set… under Prompt values.
Select the prompt values as you normally would.
Note: If you check Prompt for values, you will be prompted for values, but
your choices made earlier will be intact. This allows you to change prompt
values as necessary before running the report.
If you clear the Prompt for values checkbox, assuming all required prompts
are answered, the report will run without displaying the prompts.
Click Additional Options, if necessary.
Make any other changes, and then click Run Report. This takes you back to the
Report View screen.
Note: If you leave the Prompt for values option checked, the prompts will
appear when you run the report. If you clear the checkbox, the report will
run without user input.
Appendix A
General Operating Revenue and Expense Training Guide 35
Click OK.
Now, when you click this report in My Folders, the report will run using the saved prompts.
In this section, you were shown how to save prompt selections to save time when running
repetitive reports.
Appendix A
36 General Operating Revenue and Expense Training Guide
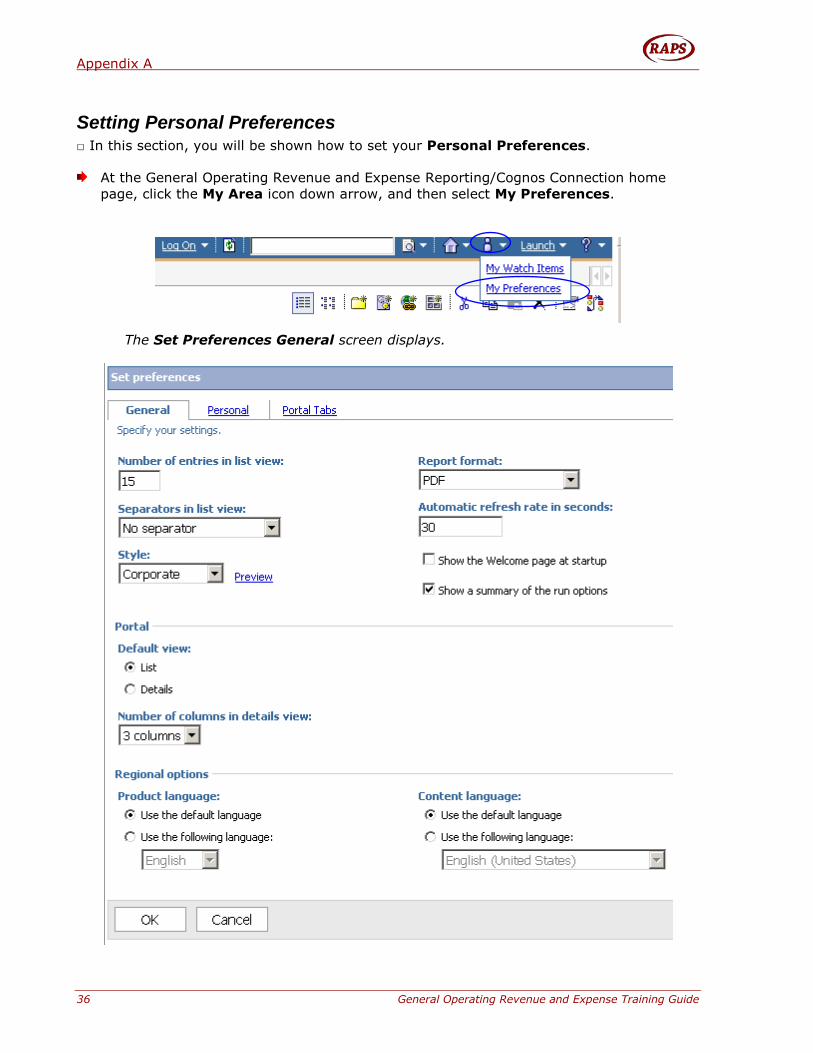
Setting Personal Preferences □ In this section, you will be shown how to set your Personal Preferences.
At the General Operating Revenue and Expense Reporting/Cognos Connection home
page, click the My Area icon down arrow, and then select My Preferences.
The Set Preferences General screen displays.
Appendix A
General Operating Revenue and Expense Training Guide 37
Enter and select your Report Preferences.
Preference Description
Number of entries in list view Enter the number of reports to display on the List
View. Recommend: 30.
Report Format Select your default report format preference.
Reports will always display in this format.
Recommend: PDF.
Separators in List View Select your preference for viewing the reports in
List View. Grid Lines and Alternating Backgrounds
separate the reports. Recommend: No
Separator.
Automatic Refresh Rate Refresh Rate for system checking for reports.
Recommend: 30 seconds.
Style Select the style preference for displaying the BI
Reports Homepage. Select Preview to view the
style. Recommend: Corporate.
Show Welcome Page at Startup Select to display the Cognos Welcome Page at
start up. Recommend: Unselecting.
Show a summary of run option Select to show a summary of run options.
Recommend: Selecting.
Default View Select List or Details.
Recommend: List.
Number of columns in details
view
Enter the number of columns for the Detail View.
Recommend: 3.
Product Language Use Default.
Content Language Use Default.
Time Zone The default time zone is Mountain Standard Time.
Select the correct time zone for your
location.
NOTE: CST = GMT-6
Click OK.
The changes are in effect.
In this section, you learned how to set Personal Preferences.
Appendix A
38 General Operating Revenue and Expense Training Guide
Exporting to Excel Format
□ In this section, you will be shown how to export the data in a report to Excel for further
analysis.
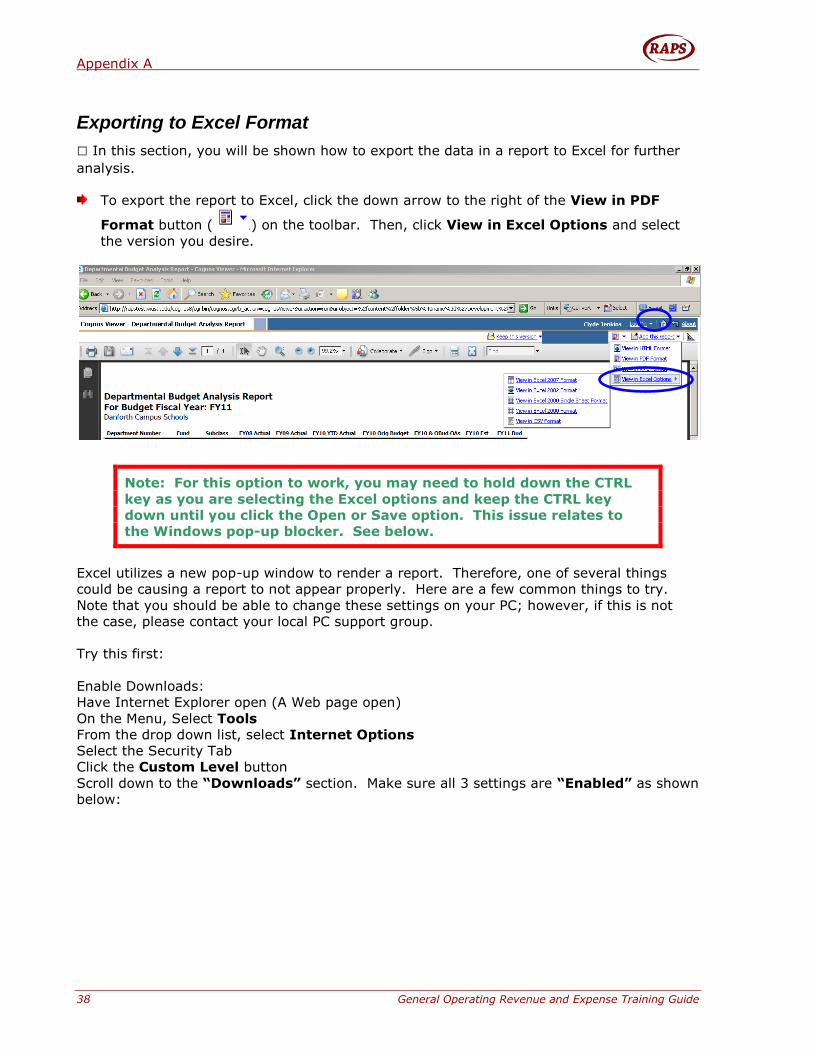
To export the report to Excel, click the down arrow to the right of the View in PDF
Format button ( ) on the toolbar. Then, click View in Excel Options and select
the version you desire.
Note: For this option to work, you may need to hold down the CTRL
key as you are selecting the Excel options and keep the CTRL key
down until you click the Open or Save option. This issue relates to
the Windows pop-up blocker. See below.
Excel utilizes a new pop-up window to render a report. Therefore, one of several things
could be causing a report to not appear properly. Here are a few common things to try.
Note that you should be able to change these settings on your PC; however, if this is not
the case, please contact your local PC support group.
Try this first:
Enable Downloads:
Have Internet Explorer open (A Web page open)
On the Menu, Select Tools
From the drop down list, select Internet Options
Select the Security Tab
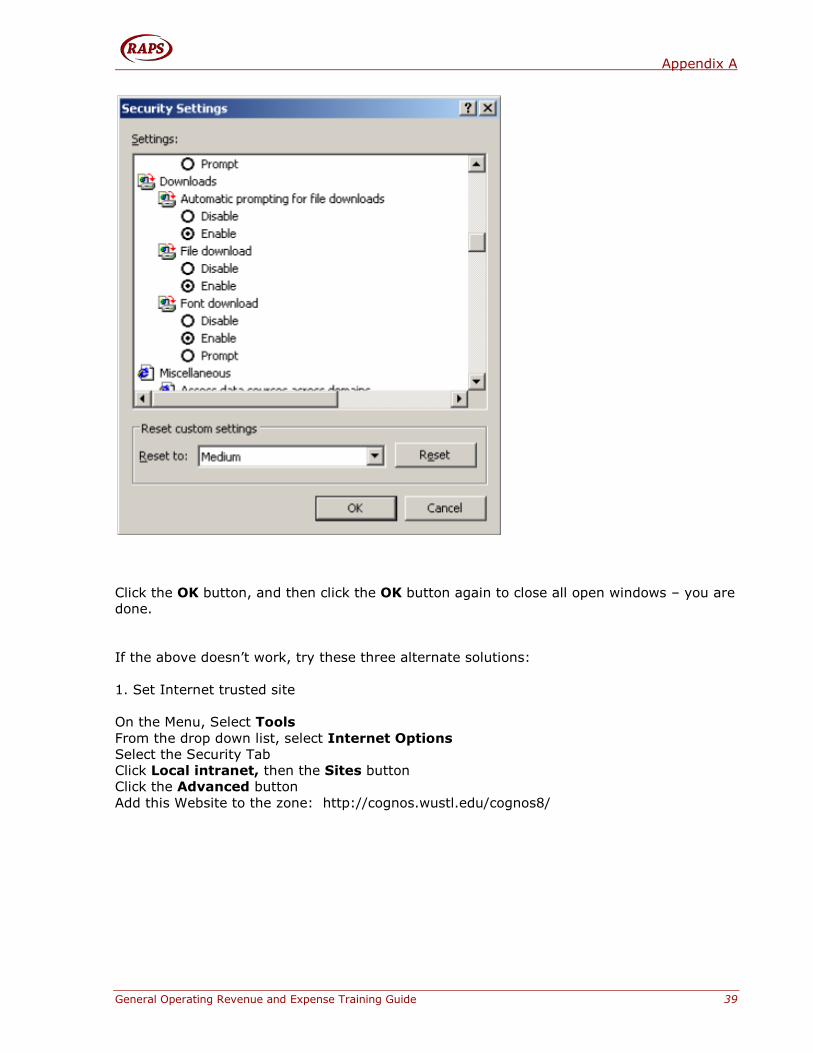
Click the Custom Level button
Scroll down to the “Downloads” section. Make sure all 3 settings are “Enabled” as shown
below:
Appendix A
General Operating Revenue and Expense Training Guide 39
Click the OK button, and then click the OK button again to close all open windows – you are
done.
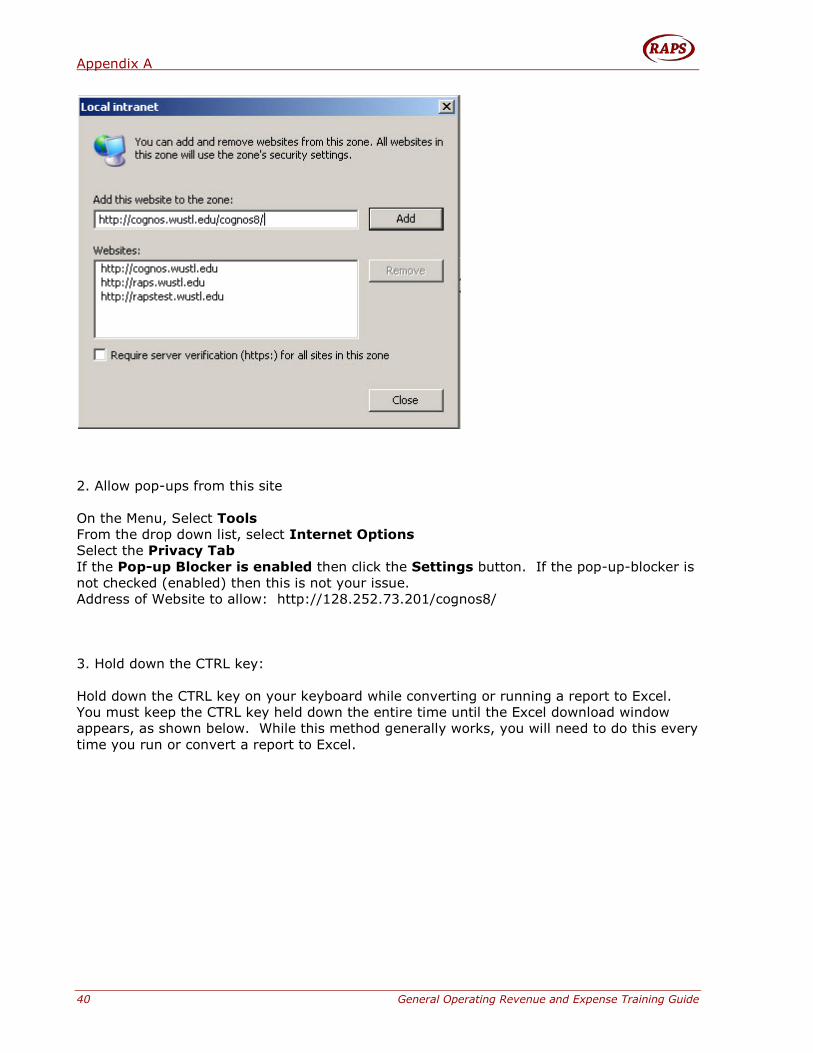
If the above doesn’t work, try these three alternate solutions:
1. Set Internet trusted site
On the Menu, Select Tools
From the drop down list, select Internet Options
Select the Security Tab
Click Local intranet, then the Sites button
Click the Advanced button
Add this Website to the zone: http://cognos.wustl.edu/cognos8/
Appendix A
40 General Operating Revenue and Expense Training Guide
2. Allow pop-ups from this site
On the Menu, Select Tools
From the drop down list, select Internet Options
Select the Privacy Tab
If the Pop-up Blocker is enabled then click the Settings button. If the pop-up-blocker is
not checked (enabled) then this is not your issue.
Address of Website to allow: http://128.252.73.201/cognos8/
3. Hold down the CTRL key:
Hold down the CTRL key on your keyboard while converting or running a report to Excel.
You must keep the CTRL key held down the entire time until the Excel download window
appears, as shown below. While this method generally works, you will need to do this every
time you run or convert a report to Excel.
Appendix A
General Operating Revenue and Expense Training Guide 41
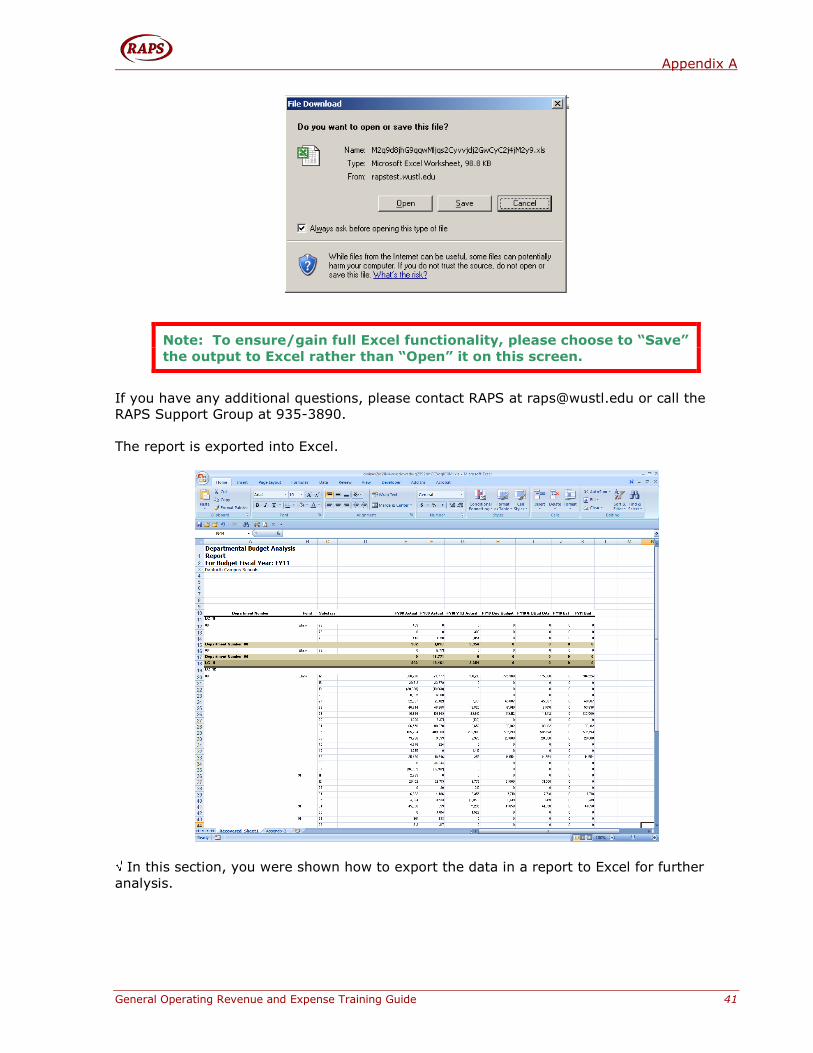
Note: To ensure/gain full Excel functionality, please choose to “Save”
the output to Excel rather than “Open” it on this screen.
If you have any additional questions, please contact RAPS at [email protected] or call the
RAPS Support Group at 935-3890.
The report is exported into Excel.
In this section, you were shown how to export the data in a report to Excel for further
analysis.
Appendix A
42 General Operating Revenue and Expense Training Guide
That "wRAPS" it up!