Embed Size (px)
Citation preview
GENERAL MOTORS DYNAMOMETER INTRODUCTION AND BRAKE COOLING
DISCUSSION
Matt Robere – 14 Dec 2017

Overview
2
• Prior GM brake wear debris study
• GM brake dynamometer overview
• Brake cooling study

Prior GM Brake Wear Debris Study
3

Dynamometer Description
4
“East” dyno “West” dyno
Dynamometer Description
5
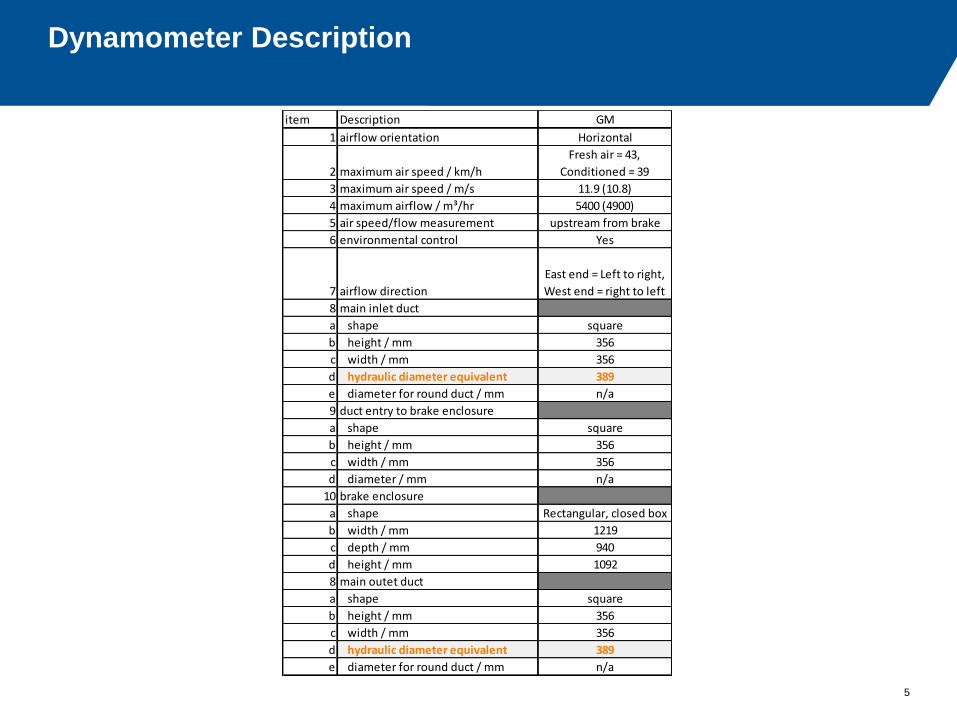
item Description GM
1 airflow orientation Horizontal
2 maximum air speed / km/h
Fresh air = 43,
Conditioned = 39
3 maximum air speed / m/s 11.9 (10.8)
4 maximum airflow / m³/hr 5400 (4900)
5 air speed/flow measurement upstream from brake
6 environmental control Yes
7 airflow direction
East end = Left to right,
West end = right to left
8 main inlet duct
a shape square
b height / mm 356
c width / mm 356
d hydraulic diameter equivalent 389
e diameter for round duct / mm n/a
9 duct entry to brake enclosure
a shape square
b height / mm 356
c width / mm 356
d diameter / mm n/a
10 brake enclosure
a shape Rectangular, closed box
b width / mm 1219
c depth / mm 940
d height / mm 1092
8 main outet duct
a shape square
b height / mm 356
c width / mm 356
d hydraulic diameter equivalent 389
e diameter for round duct / mm n/a

Dynamometer benefits:
• Better repeatability
• More data channels typically available (torque, displacement, etc)
• Fewer development resources required (vehicle properties, test
materials, employee resources)
• Data can be used in CAE modeling to predict vehicle-level
performance
Dynamometer drawbacks:
• Cooling airflow into brake corner is difficult to accurately represent
• Variations due to wheel influences are difficult to represent
• Brake balance interaction/effects between left/right and front/rear
brakes are difficult to represent
• Typically don’t include chassis control interactions or other vehicle
integration concerns
Dynamometer Testing
6

Project Information
• This project was initiated to improve correlation between dyno and
vehicle cooling, especially for schedule based testing where
equilibrium temperatures and fade behavior need to be understood
• Initial dyno scripts used 50% of initial speed as the “rule” for air speed; (For example – 100 kph initial braking speed 50 kph cooling air speed during apply)
– What should the cooling air set point rule be for schedule driven testing?
– Which fixture/setup factors increase cooling accuracy?
• Two midsize vehicle brake corners were used in this study, both fit a
16” wheel envelope:
• Single piston front sliding (colette) caliper, NAO lining material on a vented
brake disc
• Single piston rear sliding caliper, NAO lining material on a solid brake disc
Dynamometer Cooling Air Settings
7
Test procedure
• Schedule based heating cycle was performed
– Repeated brake energy inputs until brake temperature equalizes
– Cycle time driven
• Constant speed cooling period (record temperature decay)
– 50 kph
– 80 kph
• Testing was repeated on:
– Two different dynamometers (with and without inertia simulation)
– Two corner designs: Solid brake disc and vented brake disc
– With and without a wheel simulation
– With caliper in “design intent” position relative to airflow and in the opposite
“mirrored” position
– Using two different methods for determining inertia setting
Test Procedure
8

Test Control Strategy - DOE
9
Factor Name Level 1 Level 2 Explanation
A: Wheel Profile in
Place
None Simulated wheel profile
between brake and dyno
cooling duct outlet
Wheel has strong influence on
airflow, and can be simulated in
dyno
B: Caliper Clock
Position
Design Intent (with dyno
cooling duct outlet
representing front of vehicle)
Caliper rotated to mirror the
design intent position
Clock position (forward or
rearward of axle) has strong
influence on cooling
D: Inertia Calculation According to Fixed Decel
Standard Traction
Distribution inertia
According to Brake Force
Distribution
Affects how much energy brake
must absorb, and therefore
BET temperatures
Each of the 8 test
configurations noted were
run on two brake corners,
on two dynamometers,
with two speeds, and at
three different air speed
settings (5%, 25% and
50% of initial braking
speeds)
A B D
Test
Configura
tion
Wheel?Caliper
PositionC Inertia Setting
1 None Design Intent 1 Traction based
2 None Design Intent 1 Brake force
3 None Mirrored 2 Traction based
4 None Mirrored 2 Brake force
5 Yes Design Intent 2 Traction based
6 Yes Design Intent 2 Brake force
7 Yes Mirrored 1 Traction based
8 Yes Mirrored 1 Brake force

Example Test Set-up
11
Rear Brake, With Wheel
Front Brake, No Wheel
NOTE: Wheel was cut in half through the
circumference for two key reasons: 1) The full wheel would come very close to the dyno test
chamber wall, likely resulting in unrealistic restriction
2) The dyno could not accommodate a tire, and the full
wheel would add considerable convective cooling air
normally covered by the tire.
The half wheel was viewed as the best compromise for
including the wheel factor.

Simulated Wheel Effect
12
BLUE = No Wheel
GOLD = With Wheel
Presence of wheel
has no significant
impact on correlation
Target
is 0%
Error

Caliper Position Effect
13
BLUE = Design Position
GOLD = Mirrored Position
Caliper position has
no significant impact
on correlation
Corner Design Effects
14
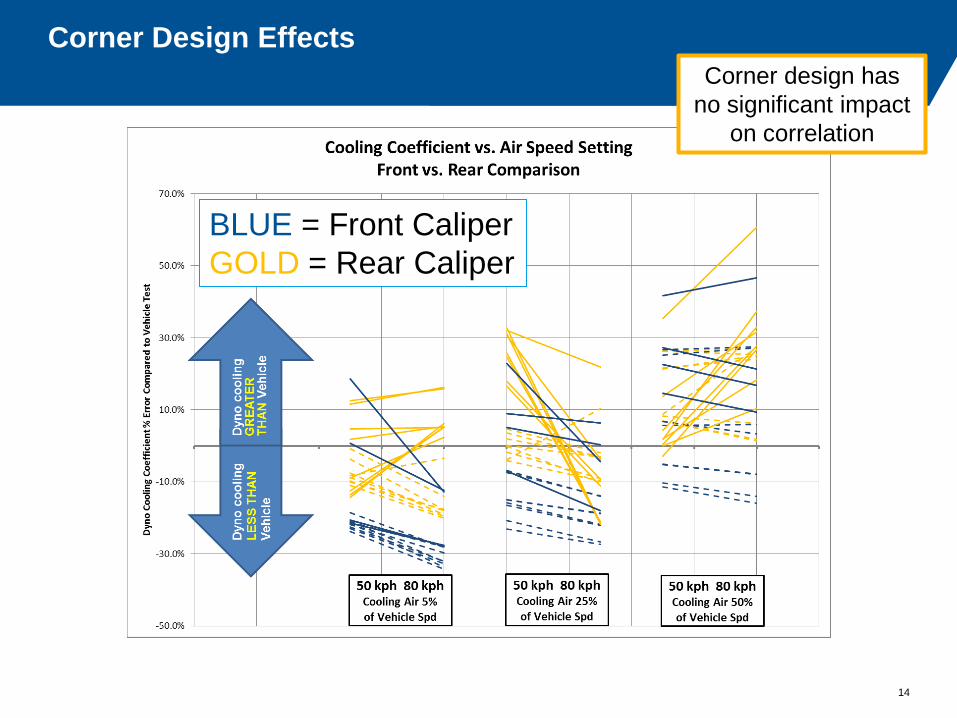
BLUE = Front Caliper
GOLD = Rear Caliper
Corner design has
no significant impact
on correlation

Overall Test Results
15
Dyn
o c
oo
lin
g
LE
SS
TH
AN
Ve
hic
le
Dyn
o c
oo
lin
g
GR
EA
TE
R
TH
AN
Ve
hic
le
If you consider all possible combinations,
the best “rule” for cooling air set point is
25% of initial speed