Embed Size (px)
Citation preview

General M
ills A
nnual Report 2013
General Mills
Annual Report 2013Healthy Growth
Number One General Mills Boulevard Minneapolis, MN 55426-1347GeneralMills.com
Our Fiscal 2013 Financial Highlights
52 weeks 52 weeks In millions, except per share and ended endedreturn on capital data May 26, 2013 May 27, 2012 Change
Net Sales $ 17,774 $ 16,658 + 7%
Segment Operating Profita 3,198 3,012 + 6%
Net Earnings Attributable to General Mills 1,855 1,567 + 18%
Diluted Earnings per Share (EPS) 2.79 2.35 + 19%
Adjusted Diluted EPS, Excluding Certain ItemsAffecting Comparabilityb 2.69 2.56 + 5%
Return on Average Total Capitala 11.9% 12.7% – 80 basis pts.
Average Diluted Shares Outstanding 666 667 – 0%
Dividends per Share $ 1.32 $ 1.22 + 8%
a See page 89 for discussion of non-GAAP measures.b Results exclude certain items affecting comparability. See page 89 for discussion of non-GAAP measures.
Segment Operating Profita
Dollars in millions
Net SalesDollars in millions
Adjusted Diluted Earnings per Shareb
Dollars
Dividends per ShareDollars
13,5
48
131211100908
17,7
7416
,658
14,8
80
14,6
3614
,556
1312111009
3,19
83,
012
2,94
62,
84
02,
624
2,39
4
08 1312111009
2.69
2.56
2.4
82.
301.
991.
76
08 1312111009
1.32
1.22
1.12
0.9
60
.86
0.7
8
08
We believe that doing well for our shareholders goes hand in hand with doing well for our consumers, our communities and our planet. Our efforts include providing convenient, nutritious food around the world, building strong communities through philanthropy and volunteerism, and developing sustainable business practices that reduce our environ-mental footprint.
For a comprehensive overview of our commitment to stand among the most socially responsible food companies in the world, see our Global Responsibility Report available online at GeneralMills.com/Responsibility.
This Report Is Printed on Recycled Paper.
©2013 General Mills
General Mills Gift Boxes are a part of many shareholders’ December holiday traditions. To request an order form, call us toll-free at (888) 496-7809 or write, including your name, street address, city, state, zip code and phone number (including area code) to:
2013 General Mills Holiday Gift Box Department 8907 P.O. Box 5013 Stacy, MN 55078-5013
Or you can place an order online at: GMIHolidayGiftBox.com
Please contact us after October 1, 2013.
Holiday Gift Boxes
Our Mission at General Mills Is Nourishing Lives
Des
ign
by A
ddis
on
ww
w.a
ddis
on.c
om
Prin
ting
by G
LS C
ompa
nies
10%
Healthy Growth
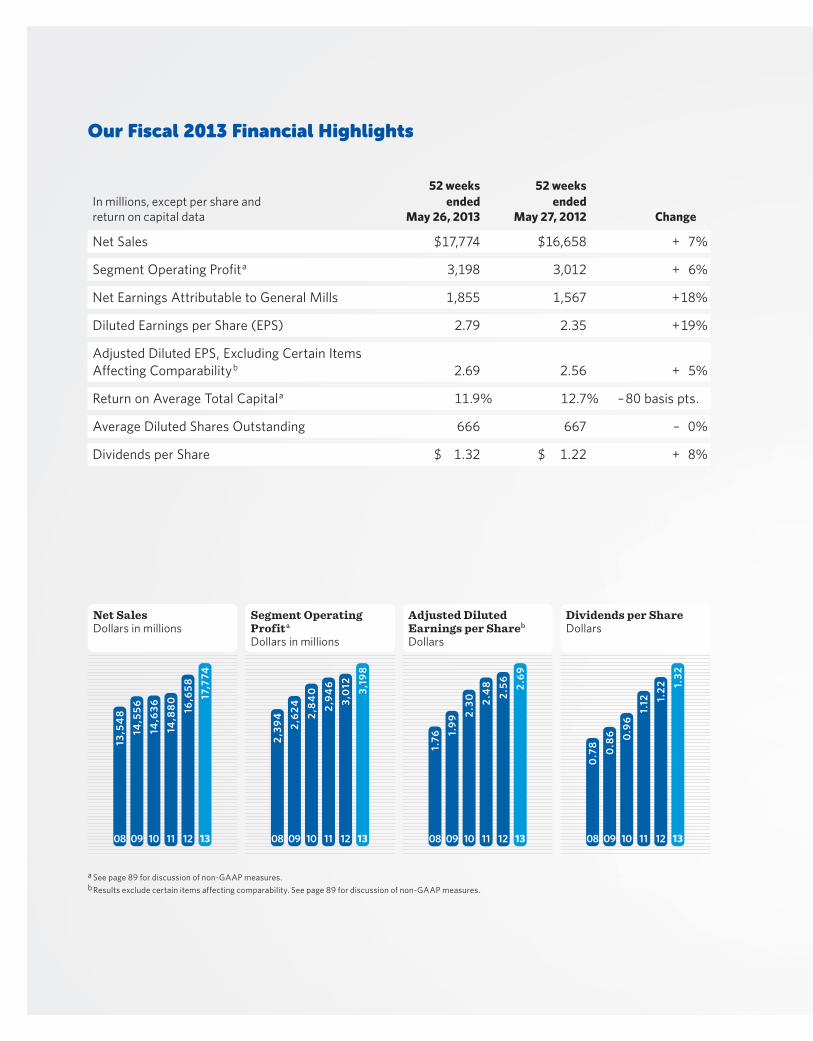
We have a broad portfolio of well-known brands that provide great taste, nutrition, convenience and value for consumers around the world. These leading brands have driven healthy growth across our food categories over the years, while generating strong returns for shareholders.
General Mills at a Glance
InternationalNet Sales by Region
$5.2 Billion 43% Europe* 23% Canada 17% Asia/Pacific 17% Latin America * Includes Australia and New Zealand
Joint VenturesNet Sales by Joint Venture(not consolidated, proportionate share)
$1.3 Billion 84% Cereal Partners
Worldwide (CPW) 16% Häagen-Dazs Japan (HDJ)
U.S. RetailNet Sales by Division
$10.6 Billion 22% Big G Cereals 17% Baking Products 16% Snacks 15% Frozen Foods 14% Meals 13% Yoplait USA 3% Small Planet Foods
Bakeries and FoodserviceNet Sales by Brand Type
$2.0 Billion 54% Branded to Foodservice
Operators 31% Branded to Consumers 15% Unbranded
54%15%
31%
43%
23%
17%
17%
84%
16%
17%
16%
15%
14%
13%3%
22%
Annual Report 2013 1

To Our Shareholders
General Mills had a good year in fiscal 2013, posting solid gains in sales and earnings. We completed a two-year period of significant investment that strengthened our business portfolio overall and meaningfully expanded our
base in international markets. And we finalized plans for fiscal 2014 that call for faster earnings growth and increased cash returns to our shareholders.
Ken PowellChairman and Chief Executive Officer
General Mills net sales for fiscal 2013 grew 7 percent to $17.8 billion. New businesses — particularly Yoplait yogurt operations in various international markets and Yoki Alimentos in Brazil — contributed 6 percentage points of this growth. And sales on our base business increased 2 percent before a one percentage point drag from foreign exchange translation. Segment operating profit rose 6 percent to $3.2 billion, with each of our three operating segments posting growth. And diluted earnings per share (EPS) totaled $2.79, up 19 percent from a year ago. These EPS results include restructuring costs, changes in mark-to-market valuation of commodity positions, and
certain other items affecting comparability of results year to year. Adjusted diluted EPS, which excludes these items, grew 5 percent to $2.69.
The operating environment for food manufacturers slowly improved during fiscal 2013 as input cost inflation moderated. For General Mills, inflation eased from the 10 percent rate we experienced in fiscal 2012 to a more manageable 3 percent for the year just ended. In our core market — the United States — consumer sentiment improved and food prices, which moved broadly higher in 2012, generally stabilized as the year concluded.
Net sales for our U.S. Retail operating segment grew 1 percent to $10.6 billion. The Snacks, Small Planet Foods (organic and natural products), Baking Products and Meals divisions led this sales performance. New products generated 5 percent of U.S. Retail segment sales, with particularly strong contributions from Honey Nut Cheerios Medley Crunch cereal, Yoplait Greek 100 calorie yogurt and Nature Valley Protein bars. We maintained our companywide focus on Holistic Margin Management (HMM) and reflecting those efforts, U.S. Retail segment operating profit rose faster than sales, increasing 4 percent to $2.4 billion.
2 Healthy Growth
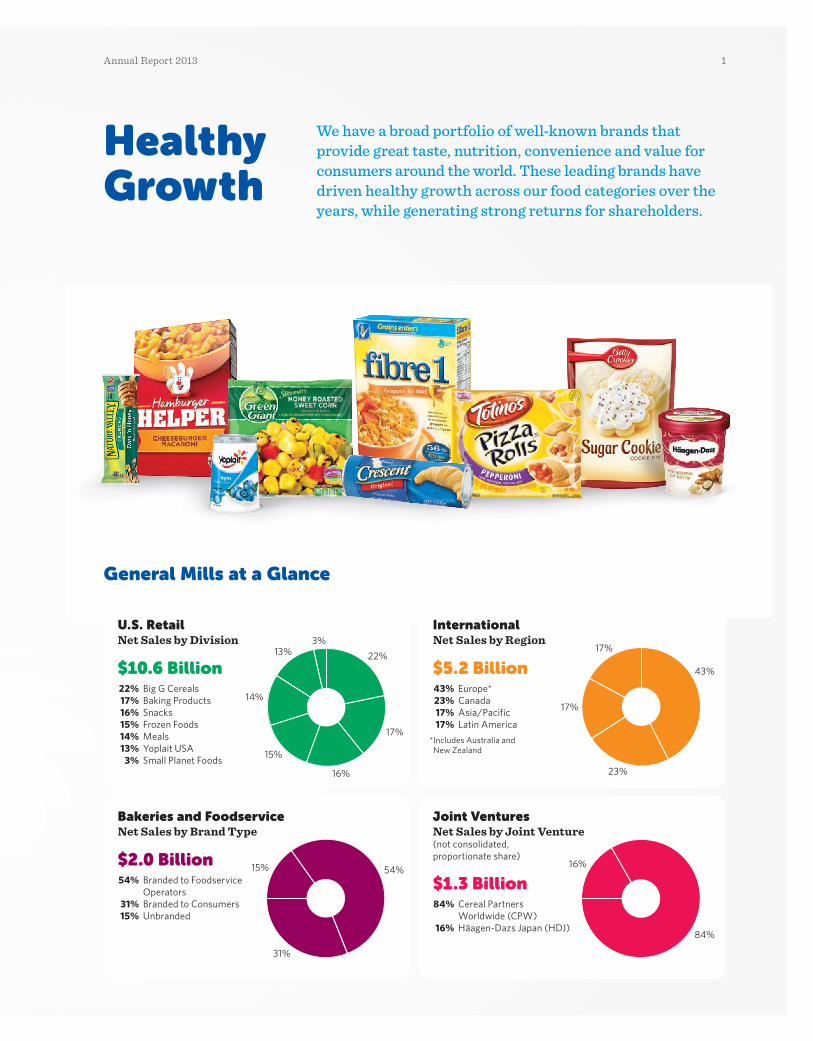
in Europe and the Asia/Pacific region each grew 11 percent. And our net sales in Latin America more than doubled as we added Yoki. On a constant-currency basis, our interna-tional net sales grew 28 percent for the year.
We also hold 50-percent interests in two joint ventures outside North America. Our $1.3 billion proportionate share of net sales by Cereal Partners Worldwide (CPW) and Häagen-Dazs Japan (HDJ) is not consolidated in General Mills results. However, the joint ventures contributed a combined $99 million in after-tax earnings in 2013, up 12 percent from prior-year results.
Net Sales Performance
2013 Net Sales % ChangeInternational Segment* + 28
Latin America* + 139
Canada* + 22
Europe* + 15
Asia/Pacific* + 11
U.S. Retail Segment + 1
Small Planet Foods + 35
Snacks + 9
Baking Products + 3
Meals + 2
Big G Cereals – 2
Frozen Foods – 3
Yoplait USA – 5
Bakeries and Foodservice Segment – 1 * Does not include the impact of foreign currency translation. See page 89 of our
2013 Annual Report for a reconciliation to reported results.
We returned $1.9 billion in cash to shareholders in 2013 through dividends and share repurchase activity. Our dividend rate grew 8 percent last year, and the new quarterly rate effective with the Aug. 1, 2013, payment represents a 15 percent increase for fiscal 2014. General Mills and its predecessor firm have now paid dividends
Our Bakeries and Foodservice segment competes primarily in U.S. channels for food eaten away from home. In fiscal 2013, net sales declined slightly as expected, but segment operating profit increased at a double-digit rate to $315 million — a record level. This profit growth reflects our ongoing strategy of focusing on key branded product lines, and targeting the most resilient customer channels, such as school cafeterias, healthcare outlets and convenience stores. In fact, we recently renamed this organization Convenience Stores and Foodservice to align with its portfolio focus.
Net sales for our International segment grew 24 percent in 2013 to exceed $5.2 billion. Segment operating profit rose 14 percent to $490 million, including a strong increase in advertising and media investment as well as the negative effects of Venezuelan currency devaluation that occurred during the year. Our double-digit sales increase included mid-single-digit growth for our base business and strong contributions from new businesses. We posted good growth across all four of our geographic regions in fiscal 2013. Net sales in Canada increased 22 percent, reflecting the addition of Yoplait. Our net sales
1412
1.52
1.32
1.22
13
Dividends per Share Dollars
Average Diluted Shares OutstandingShares in millions
Current Annualized Rate
131211
666
667
665
Annual Report 2013 3

A Selection of Our New Products
without interruption or reduction for 114 years. Stock repurchase activity modestly reduced our average number of diluted shares outstanding in 2013. In 2014, our plans call for repurchasing shares sufficient to reduce the average diluted share balance by 2 percent.
Our financial results in 2013 extend a track record of consistent growth in recent years. Since 2008, General Mills net sales have grown at a 6 percent compound annual rate, segment operating profit has compounded at 6 percent and adjusted diluted EPS have increased at a 9 percent annual rate. Net cash generated from operations over the last five years totaled over $10.8 billion. This strong cash flow supported significant share repurchases and 11 percent compound annual growth in dividends per share. This performance record aligns with our long-term model for growth and shareholder returns, shown below.
General Mills Long-term Growth Model
Growth Factor Compound Annual Growth TargetNet Sales Low single-digit
Segment Operating Profit Mid single-digit
Adjusted Diluted Earnings per Share High single-digit
Dividend Yield 2 to 3 percent
Total Return to Shareholders Double-digit
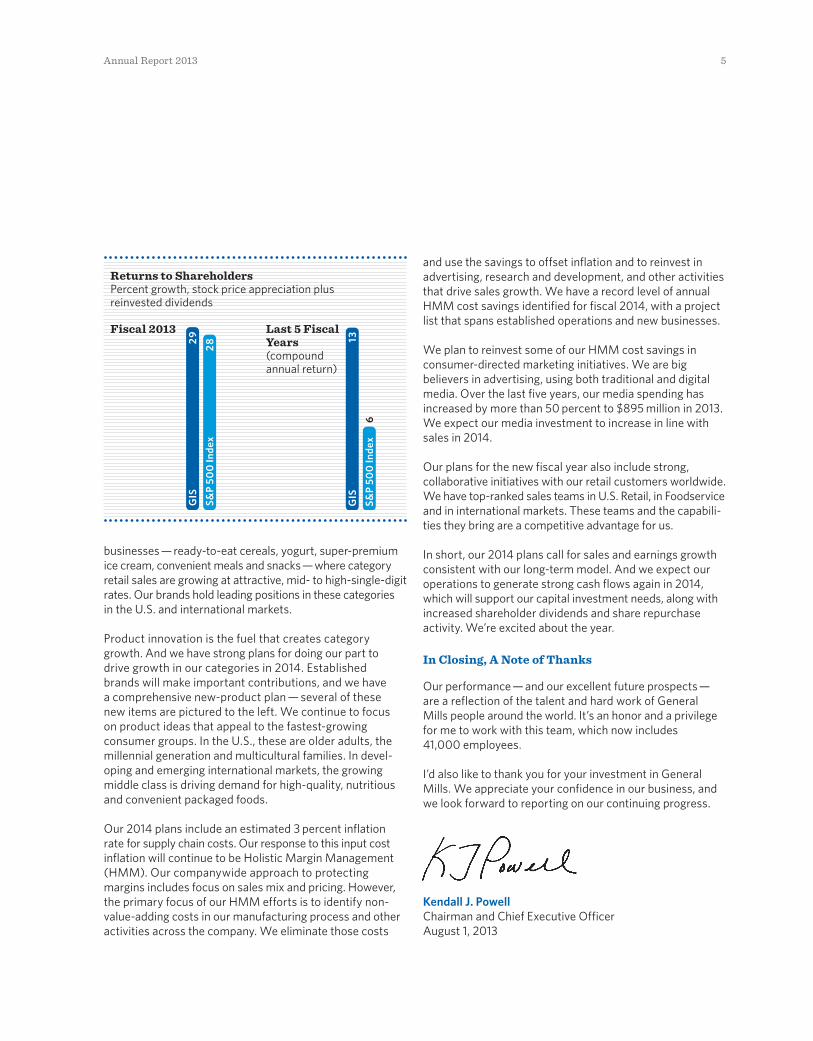
We’ve met our goal of delivering double-digit returns to shareholders over this same time period. Total return to General Mills shareholders through stock price perfor-mance and dividends was a robust 29 percent in 2013. Over the past five years, which was a challenging period for the economy and for the capital markets overall, the average annual return to General Mills shareholders was 13 percent. This was more than double the overall market’s average annual return over that period, as represented by the S&P 500 Index. Looking ahead, we remain committed to delivering superior returns for General Mills shareholders.
We See Healthy Growth Prospects Ahead
We have strong confidence in our growth plans for 2014. Our strategic actions in recent years have focused and enhanced our business mix. We now compete in five global
4 Healthy Growth
businesses — ready-to-eat cereals, yogurt, super-premium ice cream, convenient meals and snacks — where category retail sales are growing at attractive, mid- to high-single-digit rates. Our brands hold leading positions in these categories in the U.S. and international markets.
Product innovation is the fuel that creates category growth. And we have strong plans for doing our part to drive growth in our categories in 2014. Established brands will make important contributions, and we have a comprehensive new-product plan — several of these new items are pictured to the left. We continue to focus on product ideas that appeal to the fastest-growing consumer groups. In the U.S., these are older adults, the millennial generation and multicultural families. In devel-oping and emerging international markets, the growing middle class is driving demand for high-quality, nutritious and convenient packaged foods.
Our 2014 plans include an estimated 3 percent inflation rate for supply chain costs. Our response to this input cost inflation will continue to be Holistic Margin Management (HMM). Our companywide approach to protecting margins includes focus on sales mix and pricing. However, the primary focus of our HMM efforts is to identify non- value-adding costs in our manufacturing process and other activities across the company. We eliminate those costs
and use the savings to offset inflation and to reinvest in advertising, research and development, and other activities that drive sales growth. We have a record level of annual HMM cost savings identified for fiscal 2014, with a project list that spans established operations and new businesses.
We plan to reinvest some of our HMM cost savings in consumer-directed marketing initiatives. We are big believers in advertising, using both traditional and digital media. Over the last five years, our media spending has increased by more than 50 percent to $895 million in 2013. We expect our media investment to increase in line with sales in 2014.
Our plans for the new fiscal year also include strong, collaborative initiatives with our retail customers worldwide. We have top-ranked sales teams in U.S. Retail, in Foodservice and in international markets. These teams and the capabili-ties they bring are a competitive advantage for us.
In short, our 2014 plans call for sales and earnings growth consistent with our long-term model. And we expect our operations to generate strong cash flows again in 2014, which will support our capital investment needs, along with increased shareholder dividends and share repurchase activity. We’re excited about the year.
In Closing, A Note of Thanks
Our performance — and our excellent future prospects — are a reflection of the talent and hard work of General Mills people around the world. It’s an honor and a privilege for me to work with this team, which now includes 41,000 employees.
I’d also like to thank you for your investment in General Mills. We appreciate your confidence in our business, and we look forward to reporting on our continuing progress.
Kendall J. Powell Chairman and Chief Executive Officer August 1, 2013
Returns to Shareholders Percent growth, stock price appreciation plus reinvested dividends
Fiscal 2013 Last 5 Fiscal Years(compound annual return)
S&P
500
Inde
xG
IS13
6
S&P
500
Inde
xG
IS29
28
Annual Report 2013 5
Our Five Global Categories Are Large — and Growing
2012 Retail SalesCategory in Billions Growth†
Ready Meals $92 + 4%
Yogurt $76 + 8%
Ice Cream $72 + 6%
Ready-to-eat Cereal $26 + 5%
Snack Bars $12 + 6%† Projected five-year compound rate Source: Euromonitor calendar 2012
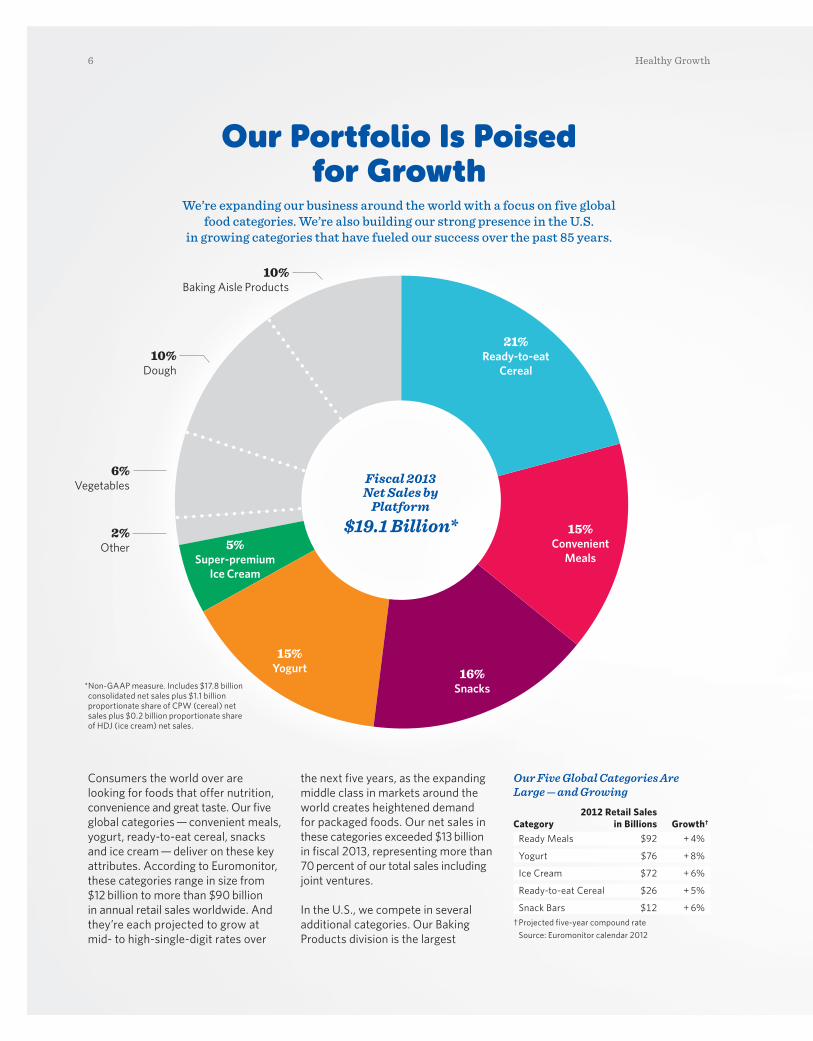
Consumers the world over are looking for foods that offer nutrition, convenience and great taste. Our five global categories — convenient meals, yogurt, ready-to-eat cereal, snacks and ice cream — deliver on these key attributes. According to Euromonitor, these categories range in size from $12 billion to more than $90 billion in annual retail sales worldwide. And they’re each projected to grow at mid- to high-single-digit rates over
the next five years, as the expanding middle class in markets around the world creates heightened demand for packaged foods. Our net sales in these categories exceeded $13 billion in fiscal 2013, representing more than 70 percent of our total sales including joint ventures.
In the U.S., we compete in several additional categories. Our Baking Products division is the largest
Our Portfolio Is Poised for Growth
We’re expanding our business around the world with a focus on five global food categories. We’re also building our strong presence in the U.S.
in growing categories that have fueled our success over the past 85 years.
15%Yogurt
15%Convenient
Meals
16%Snacks
Fiscal 2013 Net Sales by
Platform$19.1 Billion*
21%Ready-to-eat
Cereal
10%Baking Aisle Products
10%Dough
2%Other
6%Vegetables
5%Super-premium
Ice Cream
* Non-GAAP measure. Includes $17.8 billion consolidated net sales plus $1.1 billion proportionate share of CPW (cereal) net sales plus $0.2 billion proportionate share of HDJ (ice cream) net sales.
6 Healthy Growth

branded baking products business in the U.S. We’re the market leader in the $1.9 billion dessert mix category with the iconic Betty Crocker brand, and Pillsbury is the leading brand in the $2 billion refrigerated baked goods category. And Green Giant competes in the $3 billion frozen vegetables category.
At General Mills, we’re well- positioned to help drive growth in our categories with our portfolio of well-known brands. Household penetration for our products is high in developed markets — at least one of our brands can be found in 97 percent of U.S. homes — and our penetration is growing in emerging markets around the world. We bring strong levels of
advertising and product news to our brands, which stimulates sales for our categories and limits competition from store brands. We see great opportunities for future growth as we develop new products and enhance existing ones for consumers everywhere. You can read about our progress in our five global categories on the following pages.
Super-premium Ice Cream$930 Million in Net Sales*We market our Häagen-Dazs brand in shops and retail outlets in more than 80 countries outside of North America, including China, India and Brazil.
Wholesome Snack Bars$1.5 Billion in Net Sales
Nature Valley, Cascadian Farm, Fiber One and Lärabar offer nutritious options for great-tasting, grab-and-go snacks.
Ready-to-eat Cereal$4.0 Billion in Net Sales*We market cereal through our wholly owned businesses in North America and elsewhere through Cereal Partners Worldwide, our joint venture with Nestlé.
Refrigerated Yogurt$2.9 Billion in Net Sales
We market Yoplait yogurt globally in partnership with Sodiaal, a dairy cooperative in France. Our other yogurt brands include Liberté, Go-GURT and Mountain High.
Convenient Meals$2.8 Billion in Net Sales
Old El Paso dinner kits, Wanchai Ferry frozen foods, Progresso soups and Helper dinner mixes give consumers many options for quick and easy meals.
Our Sales in Global Categories
* Includes our proportionate share of joint venture sales.
Annual Report 2013 7
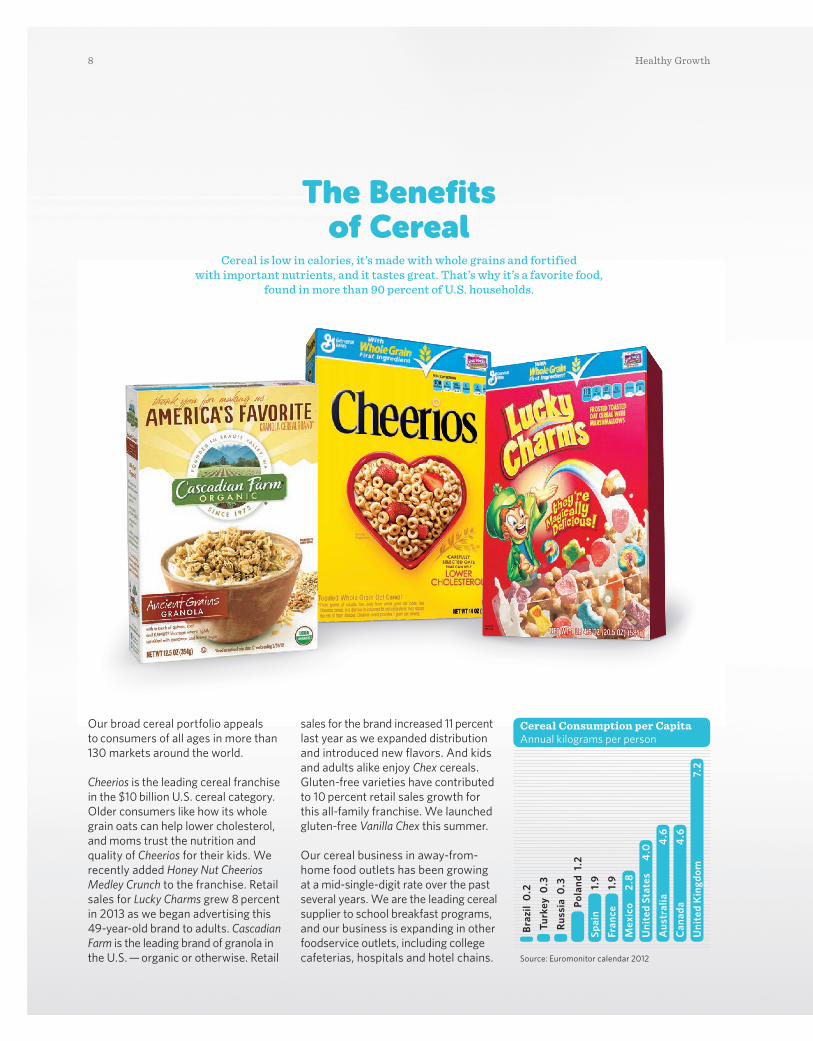
Our broad cereal portfolio appeals to consumers of all ages in more than 130 markets around the world.
Cheerios is the leading cereal franchise in the $10 billion U.S. cereal category. Older consumers like how its whole grain oats can help lower cholesterol, and moms trust the nutrition and quality of Cheerios for their kids. We recently added Honey Nut Cheerios Medley Crunch to the franchise. Retail sales for Lucky Charms grew 8 percent in 2013 as we began advertising this 49-year-old brand to adults. Cascadian Farm is the leading brand of granola in the U.S. — organic or otherwise. Retail
sales for the brand increased 11 percent last year as we expanded distribution and introduced new flavors. And kids and adults alike enjoy Chex cereals. Gluten-free varieties have contributed to 10 percent retail sales growth for this all-family franchise. We launched gluten-free Vanilla Chex this summer.
Our cereal business in away-from-home food outlets has been growing at a mid-single-digit rate over the past several years. We are the leading cereal supplier to school breakfast programs, and our business is expanding in other foodservice outlets, including college cafeterias, hospitals and hotel chains.
The Benefits of Cereal
Cereal is low in calories, it’s made with whole grains and fortified with important nutrients, and it tastes great. That’s why it’s a favorite food,
found in more than 90 percent of U.S. households.
Cereal Consumption per CapitaAnnual kilograms per person
Source: Euromonitor calendar 2012
Uni
ted
Kin
gdom
Can
ada
Aus
tral
iaU
nite
d St
ates
Mex
ico
Fran
ceSp
ain
Braz
il 0
.2Tu
rkey
0.3
Russ
ia 0
.3Po
land
1.2
1.9
1.9
2.8
4.0
4.6
4.6
7.2
8 Healthy Growth

In Canada, we hold the No. 2 share position in the $1 billion Canadian cereal category. We’re bringing news to the category in 2014 with the launch of Honey Nut Cheerios Hearty Oat Crunch and Fibre 1 Almond and Clusters cereal.
The majority of cereal sales today occur outside of North America, and cereal continues to gain popularity in many international markets. Cereal Partners Worldwide (CPW), our joint venture with Nestlé, competes in 130 countries and is the No. 2 cereal manufacturer in these combined markets. Constant-currency net sales
for CPW grew 2 percent in fiscal 2013, including growth in developed markets like the UK and France. Sales grew even faster in many emerging markets where CPW holds the leading market position, includ-ing Russia, Turkey and Indonesia. This summer, we’re bringing more innovation to growing markets, such as Fitness Fibre in Mexico and Nesquik Pillows in Russia.
Per capita consumption of cereal is still low in many international markets and it continues to rise, so we see great opportunities to grow our cereal business worldwide.
Strong Cereal Growth Ahead in Global Markets
Ready-to-eat cereal sales are growing in markets around the world. Cereal Partners Worldwide, our joint venture with Nestlé, holds a 22 percent
value share of cereal sales outside North America.
Annual Report 2013 9

Nature Valley granola bars, launched almost 40 years ago, can be found in nearly 80 markets outside the U.S., and sales have been growing at a healthy pace. Introduced in January 2012, Nature Valley Protein bars generated more than $100 million in U.S. retail sales in their first year. In 2014, we’ll launch Nature Valley Soft Baked Oatmeal Squares, a great option for a mid-morning snack. We acquired the Food Should Taste Good brand in 2012, and retail sales for these all-natural snack chips grew 6 percent in measured channels alone in 2013. We’ll continue to increase distribution
in a variety of outlets, from grocery stores to drug and convenience stores. Sales for Lärabar fruit and nut bars have been growing at a double-digit pace. ALT protein bars are the newest addition to the Lärabar line.
In Canada, retail sales for Fibre 1 snacks grew 9 percent in fiscal 2013 with the launch of Fibre 1 brownies, containing just 110 calories per serving. In 2014, we’ll add Fibre 1 Protein bars, with 7 grams of protein per bar, to the lineup. And in Brazil, we see great growth opportunities for Yoki popcorn and other Yoki snack products.
Snacking Anytime, Anywhere
In the U.S., over half of all eating occasions involve a snack. And more consumers around the world are looking for quick and healthy ways to refuel.
Our snack products now generate $3 billion in annual net sales.
Global Snacks Net SalesDollars in millions
131211
3,0
242,
650
2,37
2
10 Healthy Growth

Consumers worldwide enjoy gather-ing around a family meal. Old El Paso dinner kits make it easy to prepare a Mexican meal in 60 countries. Sales for this brand are higher outside the U.S. than inside the U.S. In Europe, we’re launching one-pan Mexican rice dinners, and in the U.S., we’ll intro-duce frozen versions of Old El Paso Mexican entrees. Wanchai Ferry frozen foods are growing at a double-digit rate in 130 cities across China. We’ll introduce dumplings with regional flavors, such as mushrooms from the Yunnan Plateau, in 2014. And in Brazil, we recently introduced Yoki Kit Fácil, a
Meals Made Convenient Everywhere
Consumer demand for great-tasting, easy-to-prepare meals is growing around the world. From Wanchai Ferry dumplings in China to Progresso soup
in the U.S., our pantry of convenient meals has been growing at an 8 percent compound rate over the past couple of years.
Brazilian version of convenient dinner kits that incorporate Yoki side dishes and seasonings.
In the U.S., over 1 million families sit down to a Helper dinner mix every night. In 2014, we have new products, new packaging and new advertising coming on this 42-year-old brand. Progresso ready-to-serve soup has posted steady sales and share gains in recent years. We offer a variety of great-tasting, good-for-you options like our newest Light cream-based soups.
Annual Report 2013 11

Yogurt is our largest category in Europe. We posted good sales and share gains in the UK and France in fiscal 2013 and have strong product news coming in 2014. In France, we’ll introduce Calin beverages, expanding our Calin line of yogurts that are high in calcium and vita-min D for bone strength. In the UK, we recently launched Liberté Greek yogurt varieties.
Liberté is the top-selling organic and natural yogurt in Canada and is a leading player in the fast-growing Greek segment, too. Yoplait is the
leader in both the reduced-calorie and kid segments. Combined, Yoplait and Liberté account for around one-third of the nearly $1.5 billion Canadian yogurt category.
We’ve invested strongly in our U.S. yogurt business in 2013 with new product introductions, including Yoplait Greek 100 calorie yogurt. Retail sales for this reduced-calorie yogurt will reach $140 million in its first year. Go-GURT is the leading brand in the kid yogurt segment, and we’ll launch Go-GURT Protein with 5 grams of protein per tube in 2014.
Yogurt Sales Show Global Growth
The health benefits of yogurt have made this a $76 billion global category. We’re now the second-largest yogurt company in the world with
a portfolio of leading brands, including Yoplait, Liberté and Go-GURT.
Fran
ceIr
elan
dC
anad
aU
nite
d K
ingd
omA
ustr
alia
Braz
il
Indo
nesi
a 0
.3In
dia
0.4
Chin
a 3
.4Ru
ssia
4.4
Uni
ted
Stat
es 6
.77.
09.
9 10.2
12.4 13
.221
.2
Yogurt Consumption per CapitaAnnual kilograms per person
Source: Euromonitor calendar 2012
12 Healthy Growth

Häagen-Dazs ice cream is available in cafes and retail outlets in 80 markets around the world. In China, our ice cream sales grew 15 percent on a constant-currency basis in 2013. We now have more than 260 shops in that market and plan to open nearly 80 more in 2014. Our sales in retail outlets are growing nicely, too. We’re introducing new seasonal flavors, like Mango and Raspberry, in our shops and retail outlets across China.
In Europe, Häagen-Dazs Secret Sensations ice cream treats contributed to 6 percent constant-currency sales growth for
Super-premium Ice Cream Has Worldwide Appeal
Häagen-Dazs is a leading global brand of super-premium ice cream. Its high quality and decadent flavors have driven 9 percent constant-currency
sales growth over the past five years.
the brand. We’ll launch new varieties in 2014. We’re also launching new flavors of Häagen-Dazs ice cream sandwiches in Japan, where constant-currency net sales for our Häagen-Dazs joint venture grew 5 percent in 2013.
We recently launched a new global advertising campaign for the brand, featuring print, TV and online ads, inviting consumers everywhere into the House of Häagen-Dazs.
Annual Report 2013 13
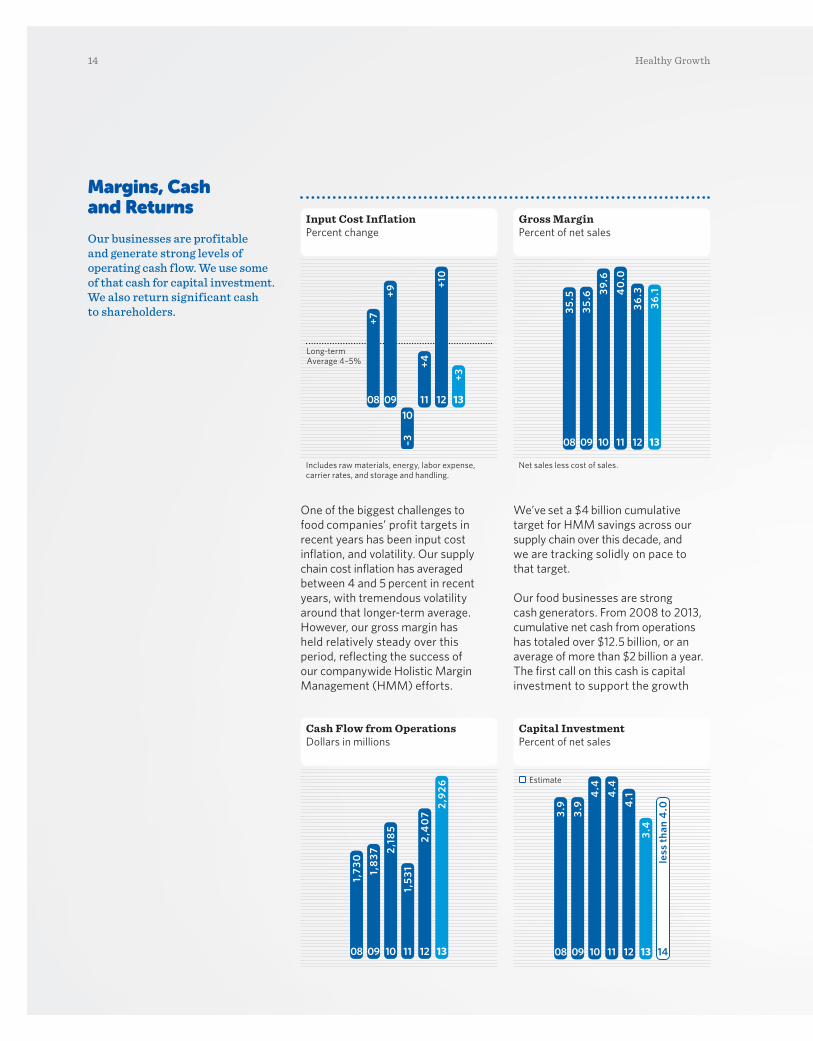
Margins, Cash and Returns
Our businesses are profitable and generate strong levels of operating cash flow. We use some of that cash for capital investment. We also return significant cash to shareholders.
One of the biggest challenges to food companies’ profit targets in recent years has been input cost inflation, and volatility. Our supply chain cost inflation has averaged between 4 and 5 percent in recent years, with tremendous volatility around that longer-term average. However, our gross margin has held relatively steady over this period, reflecting the success of our companywide Holistic Margin Management (HMM) efforts.
We’ve set a $4 billion cumulative target for HMM savings across our supply chain over this decade, and we are tracking solidly on pace to that target.
Our food businesses are strong cash generators. From 2008 to 2013, cumulative net cash from operations has totaled over $12.5 billion, or an average of more than $2 billion a year. The first call on this cash is capital investment to support the growth
08
+7
Long-term Average 4–5%
13121110
09
+3+1
0+4
–3+9
131211100908
35.6
35.5 39
.64
0.0
36.3
36.1
131211100908
1,8
371,
730
2,18
51,
531
2,4
07
2,92
6
131211
4.4
4.1
3.4
less
than
4.0
14100908
4.4
3.9
3.9
Input Cost InflationPercent change
Gross MarginPercent of net sales
Cash Flow from OperationsDollars in millions
Capital InvestmentPercent of net sales
Includes raw materials, energy, labor expense, carrier rates, and storage and handling.
Net sales less cost of sales.
Estimate
14 Healthy Growth
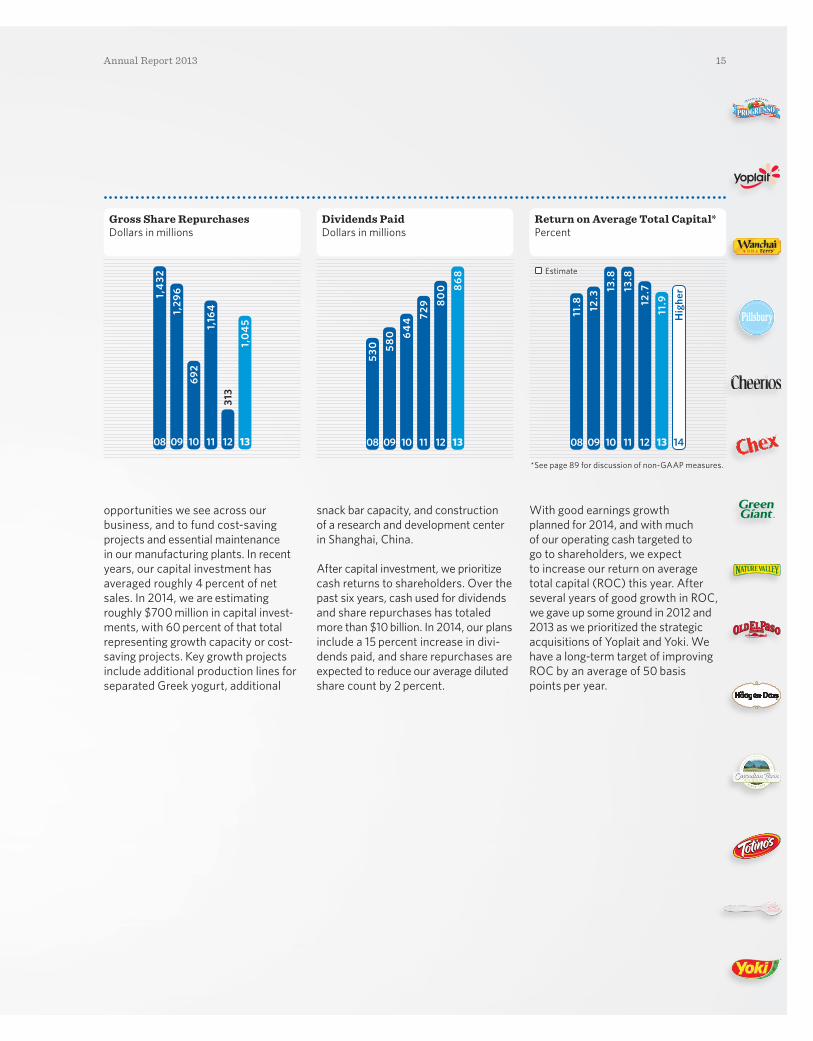
opportunities we see across our business, and to fund cost-saving projects and essential maintenance in our manufacturing plants. In recent years, our capital investment has averaged roughly 4 percent of net sales. In 2014, we are estimating roughly $700 million in capital invest-ments, with 60 percent of that total representing growth capacity or cost-saving projects. Key growth projects include additional production lines for separated Greek yogurt, additional
snack bar capacity, and construction of a research and development center in Shanghai, China.
After capital investment, we prioritize cash returns to shareholders. Over the past six years, cash used for dividends and share repurchases has totaled more than $10 billion. In 2014, our plans include a 15 percent increase in divi-dends paid, and share repurchases are expected to reduce our average diluted share count by 2 percent.
With good earnings growth planned for 2014, and with much of our operating cash targeted to go to shareholders, we expect to increase our return on average total capital (ROC) this year. After several years of good growth in ROC, we gave up some ground in 2012 and 2013 as we prioritized the strategic acquisitions of Yoplait and Yoki. We have a long-term target of improving ROC by an average of 50 basis points per year.
08
530
1312111009
580 6
44 72
9 80
0 86
808
1,4
32
1312111009
1,0
45
313
1,16
469
21,
296
Gross Share RepurchasesDollars in millions
Dividends PaidDollars in millions
131211100908
13.8
12.3
13.8
12.7
11.9
Hig
her
14
11.8
Return on Average Total Capital*Percent
*See page 89 for discussion of non-GAAP measures.
Estimate
Annual Report 2013 15

Senior ManagementAs of August 1, 2013
Mark W. AddicksSenior Vice President; Chief Marketing Officer
Y. Marc BeltonExecutive Vice President, Global Strategy, Growth and Marketing Innovation
Kofi A. BruceVice President; Treasurer
Gary ChuSenior Vice President; President, Greater China
Juliana L. ChuggSenior Vice President; President, Meals
John R. ChurchExecutive Vice President, Supply Chain
David V. ClarkVice President; President, Häagen-Dazs Strategic Business Unit
Michael L. DavisSenior Vice President, Global Human Resources
David E. Dudick Sr.Senior Vice President; President, Convenience Stores and Foodservice
Peter C. EricksonExecutive Vice President, Innovation, Technology and Quality
Olivier FaujourVice President; President, Yoplait International
Ian R. FriendlyExecutive Vice President; Chief Operating Officer, U.S. Retail
Jeffrey L. HarmeningSenior Vice President; Chief Executive Officer, Cereal Partners Worldwide
David P. HomerSenior Vice President; President, General Mills Canada
Christina LawVice President; President, Asia, Middle East and Africa
Luis Gabriel MerizaldeSenior Vice President; President, Europe, Australia and New Zealand
Michele S. MeyerVice President; President, Small Planet Foods
Donal L. MulliganExecutive Vice President; Chief Financial Officer
James H. MurphySenior Vice President; President, Big G Cereals
Kimberly A. NelsonSenior Vice President, External Relations; President, General Mills Foundation
Jonathon J. NudiVice President; President, Snacks
Rebecca L. O’GradyVice President; President, Yoplait USA
Shawn P. O’GradySenior Vice President; President, Sales and Channel Development
Christopher D. O’LearyExecutive Vice President; Chief Operating Officer, International
Roderick A. PalmoreExecutive Vice President; General Counsel; Chief Compliance and Risk Management Officer and Secretary
Kendall J. PowellChairman of the Board and Chief Executive Officer
Ann W. H. SimondsSenior Vice President; President, Baking
Christi L. Strauss*Senior Vice President
Anton V. VincentVice President; President, Frozen Foods
Sean N. WalkerSenior Vice President; President, Latin America
Kristen S. WenkerSenior Vice President, Investor Relations
Keith A. WoodwardSenior Vice President, Financial Operations
Jerald A. YoungVice President; Controller
*On leave of absence
Board of DirectorsAs of August 1, 2013
Bradbury H. Anderson 2, 5
Retired Chief Executive Officer and Vice Chairman, Best Buy Co., Inc. (electronics retailer)
R. Kerry Clark 3, 4
Retired Chairman and Chief Executive Officer, Cardinal Health, Inc. (medical services and supplies)
Paul Danos 3, 5
Dean, Tuck School of Business and Laurence F. Whittemore Professor of Business Administration, Dartmouth College
William T. Esrey 1, 3
Chairman of the Board, Spectra Energy Corp. (natural gas infra-structure provider) and Chairman Emeritus, Sprint Nextel Corporation (telecommunications systems)
Raymond V. Gilmartin 2, 4*Retired Chairman, President and Chief Executive Officer, Merck & Company, Inc. (pharmaceuticals)
Judith Richards Hope 1*, 2
Retired Distinguished Visitor from Practice and Professor of Law, Georgetown University Law Center
Heidi G. Miller 1, 3
Retired President, JPMorgan International, JPMorgan Chase & Co. (banking and financial services)
Hilda Ochoa-Brillembourg 1, 5
Founder, President and Chief Executive Officer, Strategic Investment Group (investment management)
Steve Odland 2, 4
President and Chief Executive Officer, Committee for Economic Development (public policy) and Former Chairman of the Board and Chief Executive Officer, Office Depot, Inc. (office products retailer)
Kendall J. PowellChairman of the Board and Chief Executive Officer, General Mills, Inc.
Michael D. Rose 2*, 4
Retired Chairman of the Board, First Horizon National Corporation (banking and financial services)
Robert L. Ryan 1, 3*Retired Senior Vice President and Chief Financial Officer, Medtronic, Inc. (medical technology)
Dorothy A. Terrell 4, 5*Managing Partner, FirstCap Advisors (venture capital)
Board Committees1 Audit2 Compensation3 Finance4 Corporate
Governance5 Public Responsibility* Denotes
Committee Chair
16 Healthy Growth
PB Healthy Growth Annual Report 2013 17Annual Report 2013 17
Financial Review
Contents
Financial Summary 18
Management’s Discussion and Analysis of Financial Condition and Results of Operations 19
Reports of Management and Independent Registered Public Accounting Firm 43
Consolidated Financial Statements 45
Notes to Consolidated Financial Statements
1 BasisofPresentationandReclassifications 50
2 SummaryofSignificantAccountingPolicies 50
3 Acquisitions 54
4 Restructuring,Impairment,andOtherExitCosts 54
5 InvestmentsinJointVentures 56
6 GoodwillandOtherIntangibleAssets 56
7 FinancialInstruments,RiskManagementActivitiesandFairValues 58
8 Debt 65
9 RedeemableandNoncontrollingInterests 66
10 Stockholders’Equity 67
11 StockPlans 69
12 EarningsperShare 72
13 RetirementBenefitsandPostemploymentBenefits 72
14 IncomeTaxes 80
15 Leases,OtherCommitments,andContingencies 82
16 BusinessSegmentandGeographicInformation 83
17 SupplementalInformation 84
18 QuarterlyData 86
Glossary 87
Non-GAAP Measures 89
Total Return to Stockholders 92
18 Healthy Growth Annual Report 2013 19
Fiscal Year In Millions, Except Per Share Data, Percentages and Ratios 2013 2012 2011 2010 2009(a)
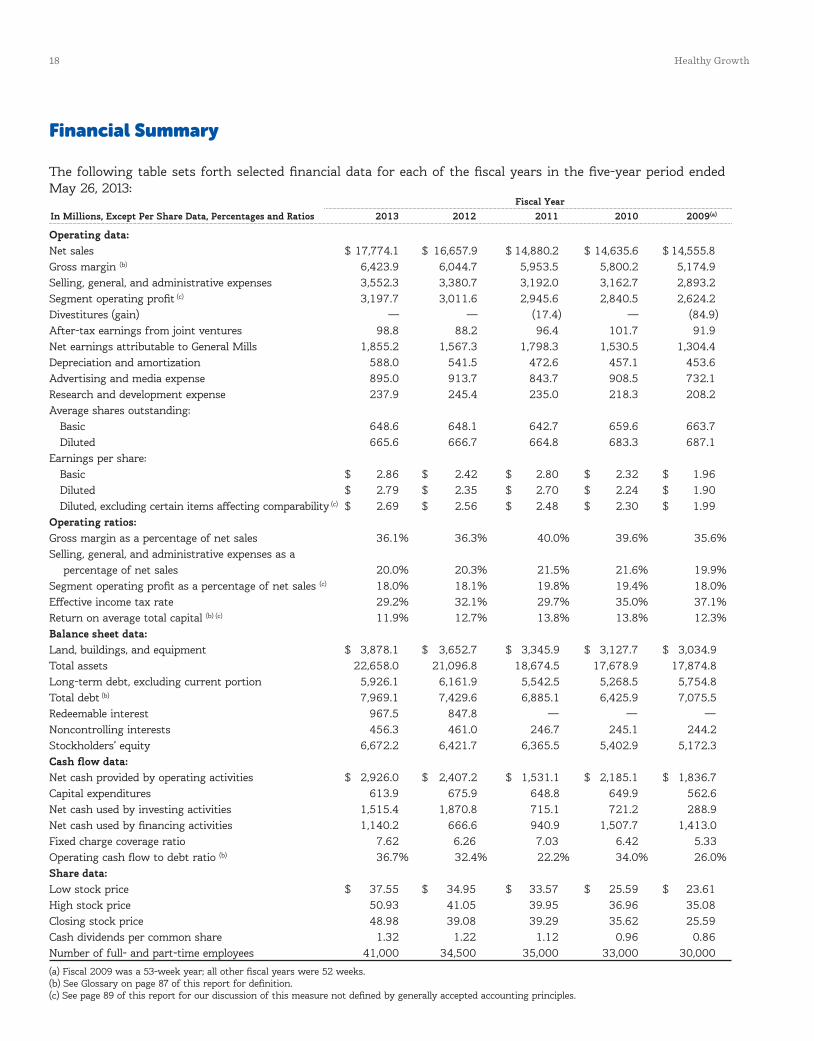
Operating data:Net sales $ 17,774.1 $ 16,657.9 $ 14,880.2 $ 14,635.6 $ 14,555.8 Gross margin (b) 6,423.9 6,044.7 5,953.5 5,800.2 5,174.9 Selling, general, and administrative expenses 3,552.3 3,380.7 3,192.0 3,162.7 2,893.2 Segment operating profit (c) 3,197.7 3,011.6 2,945.6 2,840.5 2,624.2Divestitures (gain) — — (17.4) — (84.9) After-tax earnings from joint ventures 98.8 88.2 96.4 101.7 91.9 Net earnings attributable to General Mills 1,855.2 1,567.3 1,798.3 1,530.5 1,304.4 Depreciation and amortization 588.0 541.5 472.6 457.1 453.6 Advertising and media expense 895.0 913.7 843.7 908.5 732.1 Research and development expense 237.9 245.4 235.0 218.3 208.2 Average shares outstanding: Basic 648.6 648.1 642.7 659.6 663.7 Diluted 665.6 666.7 664.8 683.3 687.1 Earnings per share: Basic $ 2.86 $ 2.42 $ 2.80 $ 2.32 $ 1.96 Diluted $ 2.79 $ 2.35 $ 2.70 $ 2.24 $ 1.90 Diluted, excluding certain items affecting comparability (c) $ 2.69 $ 2.56 $ 2.48 $ 2.30 $ 1.99 Operating ratios:Gross margin as a percentage of net sales 36.1% 36.3% 40.0% 39.6% 35.6%Selling, general, and administrative expenses as a percentage of net sales 20.0% 20.3% 21.5% 21.6% 19.9%Segment operating profit as a percentage of net sales (c) 18.0% 18.1% 19.8% 19.4% 18.0%Effective income tax rate 29.2% 32.1% 29.7% 35.0% 37.1%Return on average total capital (b) (c) 11.9% 12.7% 13.8% 13.8% 12.3%Balance sheet data:Land, buildings, and equipment $ 3,878.1 $ 3,652.7 $ 3,345.9 $ 3,127.7 $ 3,034.9 Total assets 22,658.0 21,096.8 18,674.5 17,678.9 17,874.8 Long-term debt, excluding current portion 5,926.1 6,161.9 5,542.5 5,268.5 5,754.8 Total debt (b) 7,969.1 7,429.6 6,885.1 6,425.9 7,075.5 Redeemable interest 967.5 847.8 — — — Noncontrolling interests 456.3 461.0 246.7 245.1 244.2 Stockholders’ equity 6,672.2 6,421.7 6,365.5 5,402.9 5,172.3 Cash flow data:Net cash provided by operating activities $ 2,926.0 $ 2,407.2 $ 1,531.1 $ 2,185.1 $ 1,836.7 Capital expenditures 613.9 675.9 648.8 649.9 562.6 Net cash used by investing activities 1,515.4 1,870.8 715.1 721.2 288.9 Net cash used by financing activities 1,140.2 666.6 940.9 1,507.7 1,413.0 Fixed charge coverage ratio 7.62 6.26 7.03 6.42 5.33 Operating cash flow to debt ratio (b) 36.7% 32.4% 22.2% 34.0% 26.0%Share data:Low stock price $ 37.55 $ 34.95 $ 33.57 $ 25.59 $ 23.61 High stock price 50.93 41.05 39.95 36.96 35.08 Closing stock price 48.98 39.08 39.29 35.62 25.59 Cash dividends per common share 1.32 1.22 1.12 0.96 0.86 Number of full- and part-time employees 41,000 34,500 35,000 33,000 30,000
(a) Fiscal 2009 was a 53-week year; all other fiscal years were 52 weeks. (b) See Glossary on page 87 of this report for definition. (c) See page 89 of this report for our discussion of this measure not defined by generally accepted accounting principles.
Financial Summary
The following table sets forth selected financial data for each of the fiscal years in the five-year period ended May 26, 2013:
18 Healthy Growth Annual Report 2013 19
Management’s Discussion and Analysis of Financial Condition and Results of Operations
ExEcutivE OvErviEw
We are a global consumer foods company. We develop distinctive value-added food products and market them under unique brand names. We work continuously to improve our established products and to create new products that meet consumers’ evolving needs and preferences. In addition, we build the equity of our brands over time with strong consumer-directed marketing and innovative new products and effective merchandising. We believe our brand-building strategy is the key to winning and sustaining leading share positions in markets around the globe.
Our fundamental business goal is to generate supe-rior returns for our stockholders over the long term. We believe that increases in net sales, segment operating profit, earnings per share (EPS), and return on average total capital are the key measures of financial perfor-mance for our business.
Our specific growth objectives are to consistently deliver:• low single-digit annual growth in net sales; • mid single-digit annual growth in total segment oper-
ating profit; • high single-digit annual growth in diluted EPS
excluding certain items affecting comparability; and • improvement in return on average total capital.
We believe that this financial performance, coupled with an attractive dividend yield, should result in long-term value creation for stockholders. We return a sub-stantial amount of cash to stockholders through share repurchases and dividends.
In fiscal 2013 we maintained focus on our core strategies of brand building investment, international expansion, customer partnerships, product innovation and holistic margin management (HMM) initiatives, and we continued to invest for future growth. For the fiscal year ended May 26, 2013, our net sales grew 7 percent and total segment operating profit grew 6 percent. Our return on average total capital declined by 80 basis points primarily due to the acquisitions of Yoplait S.A.S., Yoplait Marques S.A.S., and Yoki Alimentos S.A. (Yoki). Diluted EPS grew 19 percent and diluted EPS excluding certain items affecting comparability increased 5 percent (See the “Non-GAAP Measures” section on page 89 for a description of our discussion of total segment operating profit, diluted EPS excluding certain items affecting comparability and return on average total capital,
which are not defined by generally accepted accounting principles (GAAP)). Net cash provided by operations totaled $2.9 billion in fiscal 2013, enabling us to partially fund the acquisition of Yoki and to increase our annual dividend payments per share by 8 percent from fiscal 2012. We also made significant capital investments totaling $614 million in fiscal 2013 and repurchased $1.0 billion of shares of common stock.
We achieved the following related to our key operating objectives for fiscal 2013: • We increased our worldwide sales base and strengthened our portfolio by making key strategic acquisitions that expanded our participation in fast-growing food categories and emerging markets, and grew net sales by 7 percent. • We sustained a high level of new product activity, and executed effective marketing and merchandising actions in support of our leading brands and global platforms around the world.• We achieved a 6 percent increase in total segment operating profit driven by our ongoing HMM program, the effect of our restructuring plan announced in May 2012, volume growth from existing businesses, and contributions from new businesses.• Our strong cash flows allowed us to fund the acquisition of new businesses in fiscal 2013 and also repurchase sufficient shares of company stock to more than offset stock option exercises during the year.
Details of our financial results are provided in the “Fiscal 2013 Consolidated Results of Operations” section below.
In fiscal 2014, we expect to generate growth consistent with our long-term model:• We have a strong line-up of consumer marketing, merchandising, and innovation planned to support our leading brands. We will continue to build our global platforms in markets around the world, accelerating our efforts in rapidly growing emerging markets.• We are targeting low single-digit growth in net sales driven by volume growth, with incremental contributions from new businesses added in fiscal 2013.• We are targeting mid single-digit growth in total segment operating profit in fiscal 2014 including incremental contributions from new businesses. We expect our HMM discipline of cost savings and mix management to more than offset expected input cost inflation. • We are targeting high single-digit growth in diluted EPS excluding certain items affecting comparability.
20 Healthy Growth Annual Report 2013 21
• We expect to deliver increased cash returns to shareholders in fiscal 2014, including a 15 percent dividend increase and share repurchases that are expected to result in a 2 percent net reduction in shares outstanding.
Our businesses generate strong levels of cash flows and we will use some of this cash to reinvest in our business. Our fiscal 2014 plans call for approximately $700 million of expenditures for capital projects.
Certain terms used throughout this report are defined in a glossary on page 87 and 88 of this report.
FISCAL 2013 CONSOLIDATED RESULTS OF OPERATIONS
Our consolidated results for fiscal 2013 include operat-ing activity from the acquisitions of Yoki in Brazil, Yoplait Ireland, Food Should Taste Good in the United States, Parampara Foods in India, Immaculate Baking Company in the United States, and the assumption of the Canadian Yoplait franchise license (Yoplait Canada). Also included in the first quarter of fiscal 2013 are two additional months of results from the acquisition of Yoplait S.A.S. Collectively, these items are referred to as “new businesses.”
Fiscal 2013 net sales grew 7 percent to $17,774 million. In fiscal 2013, net earnings attributable to General Mills was $1,855 million, up 18 percent from $1,567 million in fiscal 2012, and we reported diluted EPS of $2.79 in fiscal 2013, up 19 percent from $2.35 in fiscal 2012. Fiscal 2013 results include the effects from various discrete tax items, restructuring charges related to our fiscal 2012 productivity and cost savings plan, integration costs resulting from the acquisition of Yoki, and gains from the mark-to-market valuation of certain commodity positions and grain inventories. Fiscal 2012 results include losses from the mark-to-market valuation of certain commodity positions and grain inventories, restructuring charges related to our 2012 productivity and cost savings plan, and integration costs resulting from the acquisitions of Yoplait S.A.S. and Yoplait Marques S.A.S. Diluted EPS excluding these items affecting comparability totaled $2.69 in fiscal 2013, up 5 percent from $2.56 in fiscal 2012 (see the “Non-GAAP Measures” section on page 89 for a description of our use of this measure and our discussion of the items affecting comparability).
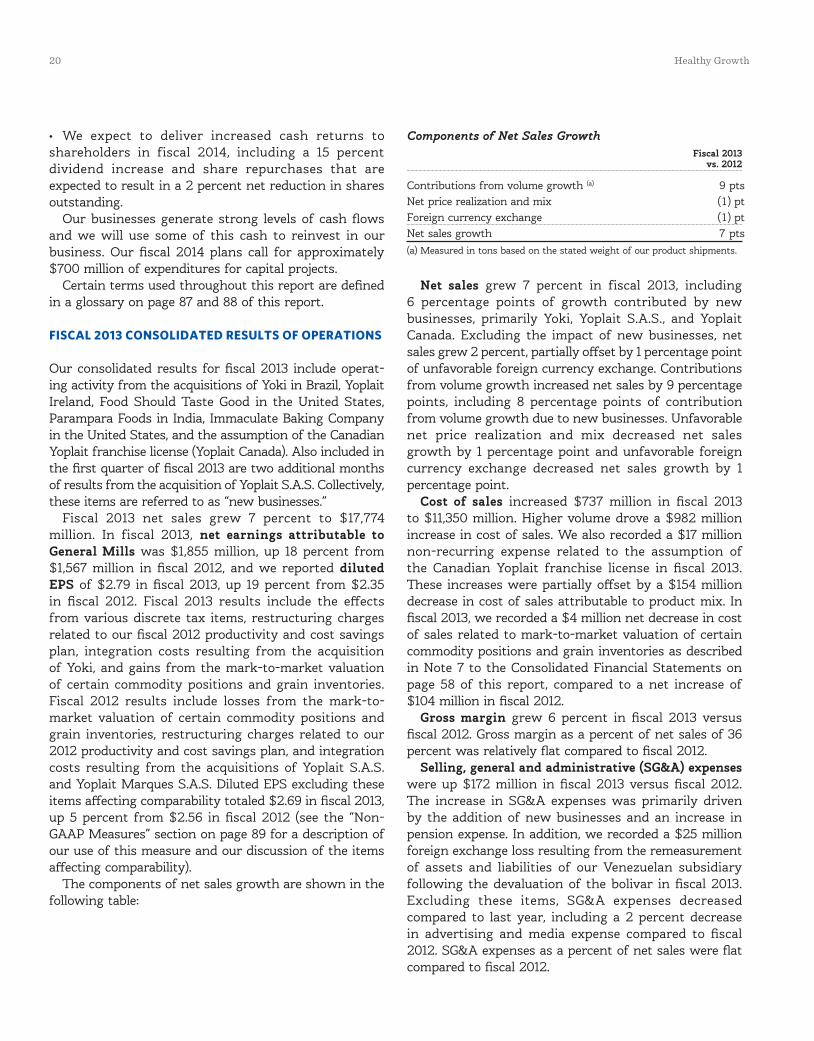
The components of net sales growth are shown in the following table:
Components of Net Sales GrowthFiscal 2013
vs. 2012
Contributions from volume growth (a) 9 ptsNet price realization and mix (1) ptForeign currency exchange (1) ptNet sales growth 7 pts(a) Measured in tons based on the stated weight of our product shipments.
Net sales grew 7 percent in fiscal 2013, including 6 percentage points of growth contributed by new businesses, primarily Yoki, Yoplait S.A.S., and Yoplait Canada. Excluding the impact of new businesses, net sales grew 2 percent, partially offset by 1 percentage point of unfavorable foreign currency exchange. Contributions from volume growth increased net sales by 9 percentage points, including 8 percentage points of contribution from volume growth due to new businesses. Unfavorable net price realization and mix decreased net sales growth by 1 percentage point and unfavorable foreign currency exchange decreased net sales growth by 1 percentage point.
Cost of sales increased $737 million in fiscal 2013 to $11,350 million. Higher volume drove a $982 million increase in cost of sales. We also recorded a $17 million non-recurring expense related to the assumption of the Canadian Yoplait franchise license in fiscal 2013. These increases were partially offset by a $154 million decrease in cost of sales attributable to product mix. In fiscal 2013, we recorded a $4 million net decrease in cost of sales related to mark-to-market valuation of certain commodity positions and grain inventories as described in Note 7 to the Consolidated Financial Statements on page 58 of this report, compared to a net increase of $104 million in fiscal 2012.
Gross margin grew 6 percent in fiscal 2013 versus fiscal 2012. Gross margin as a percent of net sales of 36 percent was relatively flat compared to fiscal 2012.
Selling, general and administrative (SG&A) expenses were up $172 million in fiscal 2013 versus fiscal 2012. The increase in SG&A expenses was primarily driven by the addition of new businesses and an increase in pension expense. In addition, we recorded a $25 million foreign exchange loss resulting from the remeasurement of assets and liabilities of our Venezuelan subsidiary following the devaluation of the bolivar in fiscal 2013. Excluding these items, SG&A expenses decreased compared to last year, including a 2 percent decrease in advertising and media expense compared to fiscal 2012. SG&A expenses as a percent of net sales were flat compared to fiscal 2012.
20 Healthy Growth Annual Report 2013 21
Restructuring, impairment, and other exit costs totaled $20 million in fiscal 2013 as follows:
Expense, in Millions
Charges associated with restructuring actions previously announced $19.8
Total $19.8
In fiscal 2013, we recorded a $19 million restructuring charge related to a productivity and cost savings plan approved in the fourth quarter of fiscal 2012, consisting of $11 million of employee severance expense and other exit costs of $8 million. All of our operating segments were affected by these actions including $16 million related to our International segment, $2 million related to our U.S. Retail segment, and $1 million related to our Bakeries and Foodservice segment. These restructuring actions are expected to be completed by the end of fiscal 2014. In addition, we recorded $1 million of charges associated with other previously announced restructuring actions. In fiscal 2013, we paid $80 million in cash related to restructuring actions.
Interest, net for fiscal 2013 totaled $317 million, $35 million lower than fiscal 2012. The average interest rate decreased 60 basis points, including the effect of the mix of debt, generating a $43 million decrease in net interest. Average interest bearing instruments increased $167 million, primarily from an increase in incremental borrowing to fund the acquisition of Yoki, generating an $8 million increase in net interest.
Our consolidated effective tax rate for fiscal 2013 was 29.2 percent compared to 32.1 percent in fiscal 2012. The 2.9 percentage point decrease was primarily related to the restructuring of our General Mills Cereals, LLC (GMC) subsidiary during the first quarter of fiscal 2013 which resulted in a $63 million decrease to deferred income tax liabilities related to the tax basis of the investment in GMC and certain distributed assets, with a corresponding discrete non-cash reduction to income taxes. During fiscal 2013, we also recorded a $34 million discrete decrease in income tax expense and an increase in our deferred tax assets related to certain actions taken to restore part of the tax benefits associated with Medicare Part D subsidies which had previously been reduced in fiscal 2010 with the enactment of the Patient Protection and Affordable Care Act, as amended by the Health Care and Education Reconciliation Act of 2010. Our fiscal 2013 tax expense also includes a $12 million charge associated with the liquidation of a corporate investment.
After-tax earnings from joint ventures for fiscal 2013 increased to $99 million compared to $88 million in fiscal 2012 primarily due to higher tax rates in fiscal 2012 as a result of discrete tax items and higher operating profit offset by unfavorable foreign currency exchange in fiscal 2013.
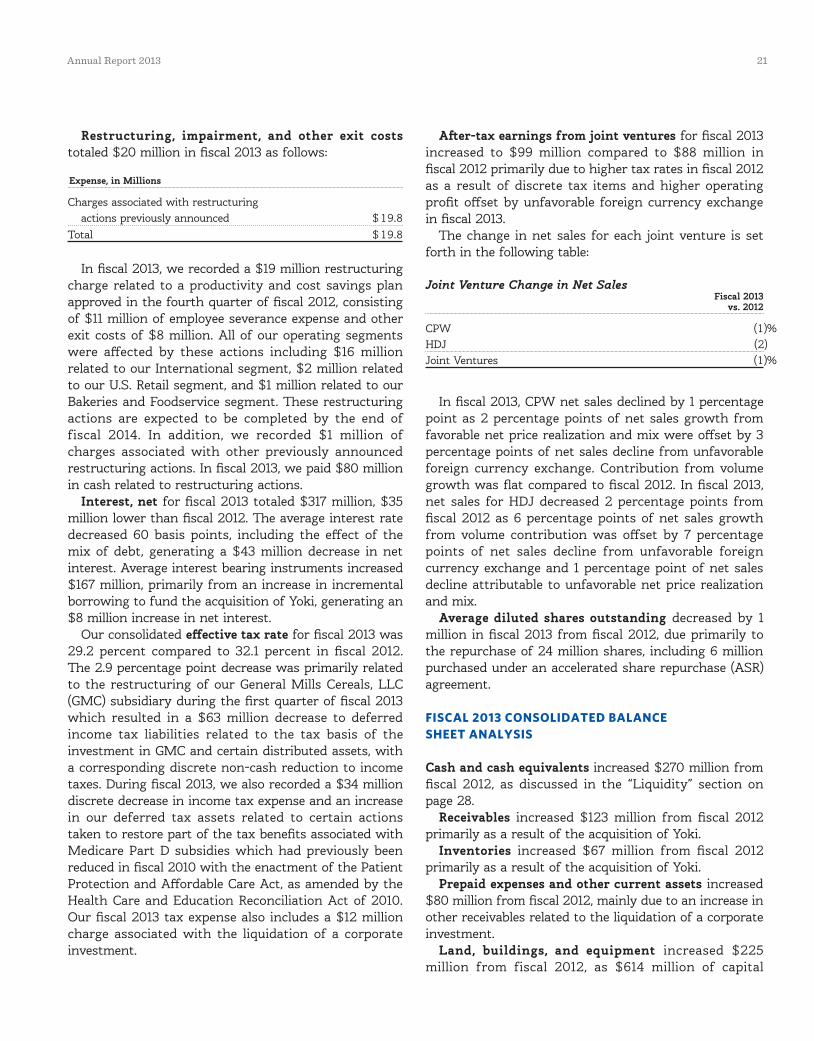
The change in net sales for each joint venture is set forth in the following table:
Joint Venture Change in Net SalesFiscal 2013
vs. 2012
CPW (1)%HDJ (2)Joint Ventures (1)%
In fiscal 2013, CPW net sales declined by 1 percentage point as 2 percentage points of net sales growth from favorable net price realization and mix were offset by 3 percentage points of net sales decline from unfavorable foreign currency exchange. Contribution from volume growth was flat compared to fiscal 2012. In fiscal 2013, net sales for HDJ decreased 2 percentage points from fiscal 2012 as 6 percentage points of net sales growth from volume contribution was offset by 7 percentage points of net sales decline from unfavorable foreign currency exchange and 1 percentage point of net sales decline attributable to unfavorable net price realization and mix.
Average diluted shares outstanding decreased by 1 million in fiscal 2013 from fiscal 2012, due primarily to the repurchase of 24 million shares, including 6 million purchased under an accelerated share repurchase (ASR) agreement.
FISCAL 2013 CONSOLIDATED BALANCE SHEET ANALYSIS
Cash and cash equivalents increased $270 million from fiscal 2012, as discussed in the “Liquidity” section on page 28.
Receivables increased $123 million from fiscal 2012 primarily as a result of the acquisition of Yoki.
Inventories increased $67 million from fiscal 2012 primarily as a result of the acquisition of Yoki.
Prepaid expenses and other current assets increased $80 million from fiscal 2012, mainly due to an increase in other receivables related to the liquidation of a corporate investment.
Land, buildings, and equipment increased $225 million from fiscal 2012, as $614 million of capital
22 Healthy Growth Annual Report 2013 23
expenditures and $216 million of additions from acquired businesses were partially offset by depreciation expense of $552 million.
Goodwill and other intangible assets increased $750 million from fiscal 2012. We recorded $407 million of goodwill and $311 million of other intangible assets related to acquisitions in fiscal 2013.
Other assets decreased $22 million from fiscal 2012, primarily related to the liquidation of a corporate investment.
Accounts payable increased $274 million from fiscal 2012, primarily due to the acquisition of Yoki and the extension of payment terms.
Long-term debt, including current portion, and notes payable increased $540 million from fiscal 2012 primarily due to $1.0 billion of debt issuances, partially offset by $587 million of debt and commercial paper repayments.
The current and noncurrent portions of net deferred income taxes liability increased $149 million from fiscal 2012 primarily as a result of contributions to our pension plan in fiscal 2013.
Other current liabilities increased $401 million from fiscal 2012, primarily driven by increases in dividend accruals and trade and consumer accruals.
Other liabilities decreased $237 million from fiscal 2012, primarily driven by a decrease in pension, postemployment, and postretirement liabilities.
Redeemable interest increased $120 million from fiscal 2012, primarily due to a $104 million increase in the redemption value of the redeemable interest.
Retained earnings increased $744 million from fiscal 2012, reflecting fiscal 2013 net earnings of $1,855 million less dividends paid of $868 million and dividends declared of $243 million. Treasury stock increased $510 million from fiscal 2012, due to $1,015 million of share repurchases, including $270 million related to an ASR agreement, partially offset by $505 million related to stock-based compensation plans. Additional paid in capital decreased $142 million from fiscal 2012, including $30 million related to an ASR agreement. Accumulated other comprehensive loss (AOCI) decreased by $158 million after-tax from fiscal 2012, primarily driven by pension and postemployment activity of $144 million.
Noncontrolling interests decreased $5 million in fiscal 2013.
FISCAL 2012 CONSOLIDATED RESULTS OF OPERATIONS
Fiscal 2012 net sales grew 12 percent to $16,658 million. In fiscal 2012, net earnings attributable to General
Mills was $1,567 million, down 13 percent from $1,798 million in fiscal 2011, and we reported diluted EPS of $2.35 in fiscal 2012, down 13 percent from $2.70 in fiscal 2011. Fiscal 2012 results include losses from the mark-to-market valuation of certain commodity positions and grain inventories versus fiscal 2011 which included gains. Fiscal 2012 results also include restructuring charges reflecting employee severance expense and the write-off of certain long-lived assets related to our 2012 productivity and cost savings plan and integration costs resulting from the acquisitions of Yoplait S.A.S. and Yoplait Marques S.A.S. Fiscal 2011 results include the net benefit from the resolution of uncertain tax matters. Diluted EPS excluding these items affecting comparability was $2.56 in fiscal 2012, up 3 percent from $2.48 in fiscal 2011 (see the “Non-GAAP Measures” section on page 89 for our use of this measure and our discussion of the items affecting comparability).
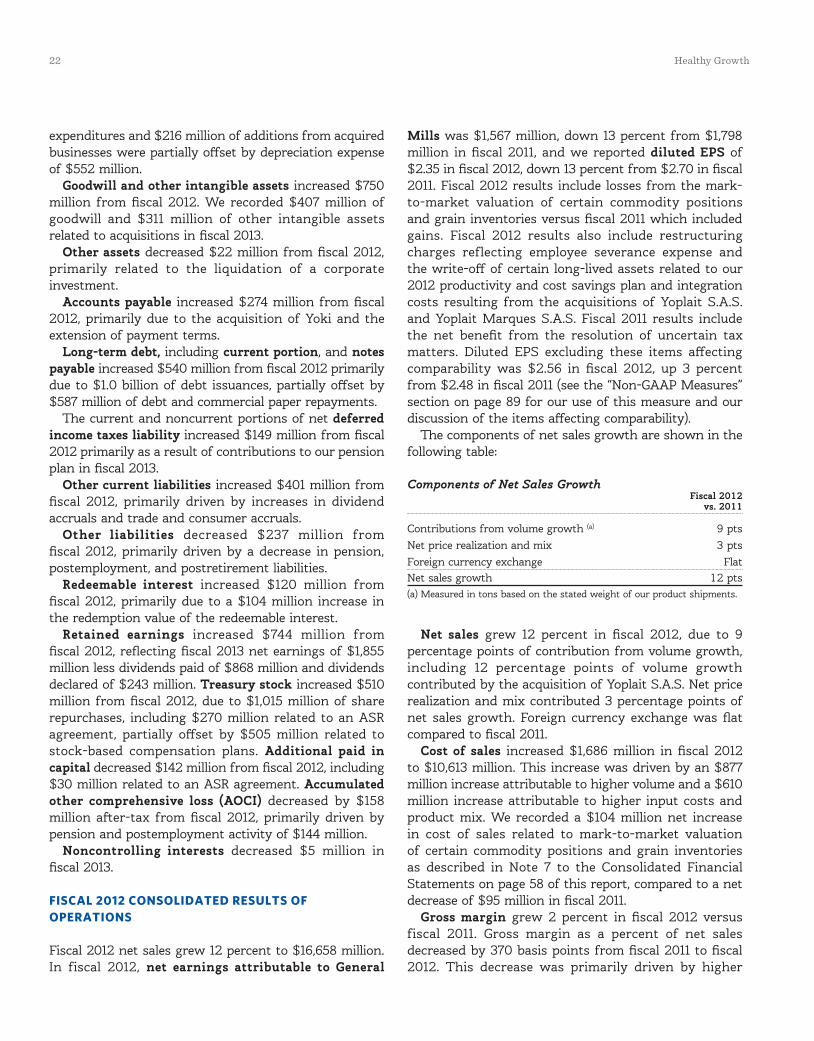
The components of net sales growth are shown in the following table:
Components of Net Sales Growth Fiscal 2012 vs. 2011
Contributions from volume growth (a) 9 ptsNet price realization and mix 3 ptsForeign currency exchange FlatNet sales growth 12 pts(a) Measured in tons based on the stated weight of our product shipments.
Net sales grew 12 percent in fiscal 2012, due to 9 percentage points of contribution from volume growth, including 12 percentage points of volume growth contributed by the acquisition of Yoplait S.A.S. Net price realization and mix contributed 3 percentage points of net sales growth. Foreign currency exchange was flat compared to fiscal 2011.
Cost of sales increased $1,686 million in fiscal 2012 to $10,613 million. This increase was driven by an $877 million increase attributable to higher volume and a $610 million increase attributable to higher input costs and product mix. We recorded a $104 million net increase in cost of sales related to mark-to-market valuation of certain commodity positions and grain inventories as described in Note 7 to the Consolidated Financial Statements on page 58 of this report, compared to a net decrease of $95 million in fiscal 2011.
Gross margin grew 2 percent in fiscal 2012 versus fiscal 2011. Gross margin as a percent of net sales decreased by 370 basis points from fiscal 2011 to fiscal 2012. This decrease was primarily driven by higher
22 Healthy Growth Annual Report 2013 23
input costs and losses from mark-to-market valuation of certain commodity positions and grain inventories in fiscal 2012 versus gains in fiscal 2011.
Selling, general and administrative (SG&A) expenses were up $189 million in fiscal 2012 versus fiscal 2011. SG&A expenses as a percent of net sales in fiscal 2012 decreased by 1 percentage point compared to fiscal 2011. The increase in SG&A expenses was primarily driven by the acquisition of Yoplait S.A.S. and an 8 percent increase in advertising and media expense.
There were no divestitures in fiscal 2012. In fiscal 2011, we recorded a net divestiture gain of $17 million consisting of a gain of $14 million related to the sale of a foodservice frozen baked goods product line in our International segment and a gain of $3 million related to the sale of a pie shell product line in our Bakeries and Foodservice segment.
Restructuring, impairment, and other exit costs totaled $102 million in fiscal 2012 as follows:
Expense, in Millions
Productivity and cost savings plan $100.6 Charges associated with restructuring actions
previously announced 1.0 Total $101.6
In fiscal 2012, we approved a major productivity and cost savings plan designed to improve organizational effectiveness and focus on key growth strategies. The plan included organizational changes to strengthen business alignment, and actions to accelerate administrative efficiencies across all of our operating segments and support functions. In connection with this initiative, we eliminated approximately 850 positions globally and recorded a $101 million restructuring charge, consisting of $88 million of employee severance expense and a non-cash charge of $13 million related to the write-off of certain long-lived assets in our U.S. Retail segment. All of our operating segments and support functions were affected by these actions including $70 million related to our U.S. Retail segment, $12 million related to our Bakeries and Foodservice segment, $10 million related to our International segment, and $9 million related to our administrative functions. These restructuring actions are expected to be completed by the end of fiscal 2014. In fiscal 2012, we paid $4 million in cash related to restructuring actions taken in fiscal 2012 and previous years.
Interest, net for fiscal 2012 totaled $352 million, $6 million higher than fiscal 2011. Average interest bearing instruments increased $792 million in fiscal 2012, primarily due to the acquisitions of Yoplait S.A.S. and
Yoplait Marques S.A.S., generating a $46 million increase in net interest. The average interest rate decreased 55 basis points, including the effect of the mix of debt, generating a $40 million decrease in net interest.
Our consolidated effective tax rate for fiscal 2012 was 32.1 percent compared to 29.7 percent in fiscal 2011. The 2.4 percentage point increase was primarily due to a $100 million reduction to tax expense recorded in fiscal 2011 related to a settlement with the Internal Revenue Service (IRS) concerning corporate income tax adjustments for fiscal years 2002 to 2008.
After-tax earnings from joint ventures for fiscal 2012 decreased to $88 million compared to $96 million in fiscal 2011 primarily due to higher effective tax rates as a result of discrete tax items in fiscal 2012.
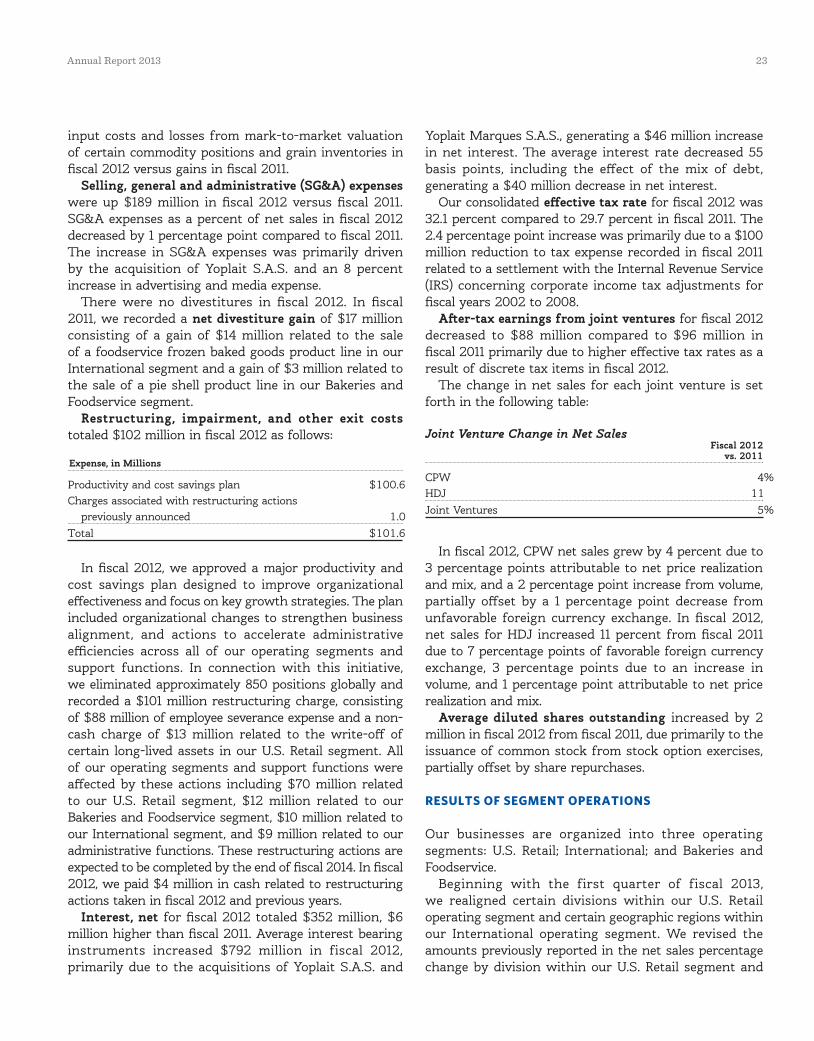
The change in net sales for each joint venture is set forth in the following table:
Joint Venture Change in Net Sales Fiscal 2012 vs. 2011
CPW 4%HDJ 11Joint Ventures 5%
In fiscal 2012, CPW net sales grew by 4 percent due to 3 percentage points attributable to net price realization and mix, and a 2 percentage point increase from volume, partially offset by a 1 percentage point decrease from unfavorable foreign currency exchange. In fiscal 2012, net sales for HDJ increased 11 percent from fiscal 2011 due to 7 percentage points of favorable foreign currency exchange, 3 percentage points due to an increase in volume, and 1 percentage point attributable to net price realization and mix.
Average diluted shares outstanding increased by 2 million in fiscal 2012 from fiscal 2011, due primarily to the issuance of common stock from stock option exercises, partially offset by share repurchases.
RESULTS OF SEGMENT OPERATIONS
Our businesses are organized into three operating segments: U.S. Retail; International; and Bakeries and Foodservice.
Beginning with the first quarter of fiscal 2013, we realigned certain divisions within our U.S. Retail operating segment and certain geographic regions within our International operating segment. We revised the amounts previously reported in the net sales percentage change by division within our U.S. Retail segment and
24 Healthy Growth Annual Report 2013 25
geographic regions within our International segment. These realignments had no effect on previously reported consolidated net sales, operating segments’ net sales, operating profit, segment operating profit, net earnings attributable to General Mills, or earnings per share.
In the U.S. Retail segment, Big G, Snacks, Yoplait, and Small Planet Foods were unchanged. Baking Products combines our baking aisle and refrigerated dough products. Frozen Foods includes our frozen products, as well as Green Giant canned vegetables. Meals
includes dinner mixes, side dishes, Mexican products, and Progresso soups. In the International segment, Canada was unchanged. The Australia and New Zealand businesses were realigned with our Europe region. The Turkey, North Africa, South Africa, and Middle East businesses were realigned with our Asia/Pacific region.
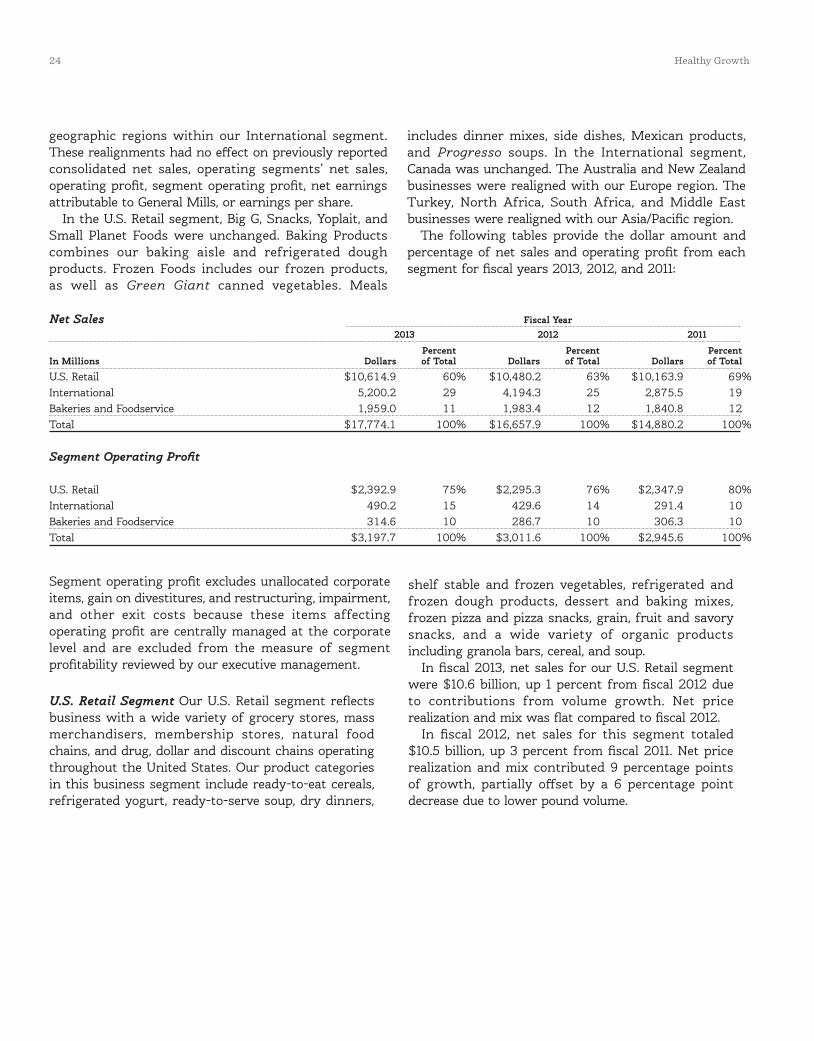
The following tables provide the dollar amount and percentage of net sales and operating profit from each segment for fiscal years 2013, 2012, and 2011:
Net Sales Fiscal Year 2013 2012 2011
Percent Percent PercentIn Millions Dollars of Total Dollars of Total Dollars of Total
U.S. Retail $10,614.9 60% $10,480.2 63% $10,163.9 69%International 5,200.2 29 4,194.3 25 2,875.5 19 Bakeries and Foodservice 1,959.0 11 1,983.4 12 1,840.8 12 Total $17,774.1 100% $16,657.9 100% $14,880.2 100%
Segment Operating Profit
U.S. Retail $2,392.9 75% $2,295.3 76% $2,347.9 80%International 490.2 15 429.6 14 291.4 10Bakeries and Foodservice 314.6 10 286.7 10 306.3 10Total $3,197.7 100% $3,011.6 100% $2,945.6 100%
Segment operating profit excludes unallocated corporate items, gain on divestitures, and restructuring, impairment, and other exit costs because these items affecting operating profit are centrally managed at the corporate level and are excluded from the measure of segment profitability reviewed by our executive management.
U.S. Retail Segment Our U.S. Retail segment reflects business with a wide variety of grocery stores, mass merchandisers, membership stores, natural food chains, and drug, dollar and discount chains operating throughout the United States. Our product categories in this business segment include ready-to-eat cereals, refrigerated yogurt, ready-to-serve soup, dry dinners,
shelf stable and frozen vegetables, refrigerated and frozen dough products, dessert and baking mixes, frozen pizza and pizza snacks, grain, fruit and savory snacks, and a wide variety of organic products including granola bars, cereal, and soup.
In fiscal 2013, net sales for our U.S. Retail segment were $10.6 billion, up 1 percent from fiscal 2012 due to contributions from volume growth. Net price realization and mix was flat compared to fiscal 2012.
In fiscal 2012, net sales for this segment totaled $10.5 billion, up 3 percent from fiscal 2011. Net price realization and mix contributed 9 percentage points of growth, partially offset by a 6 percentage point decrease due to lower pound volume.
24 Healthy Growth Annual Report 2013 25
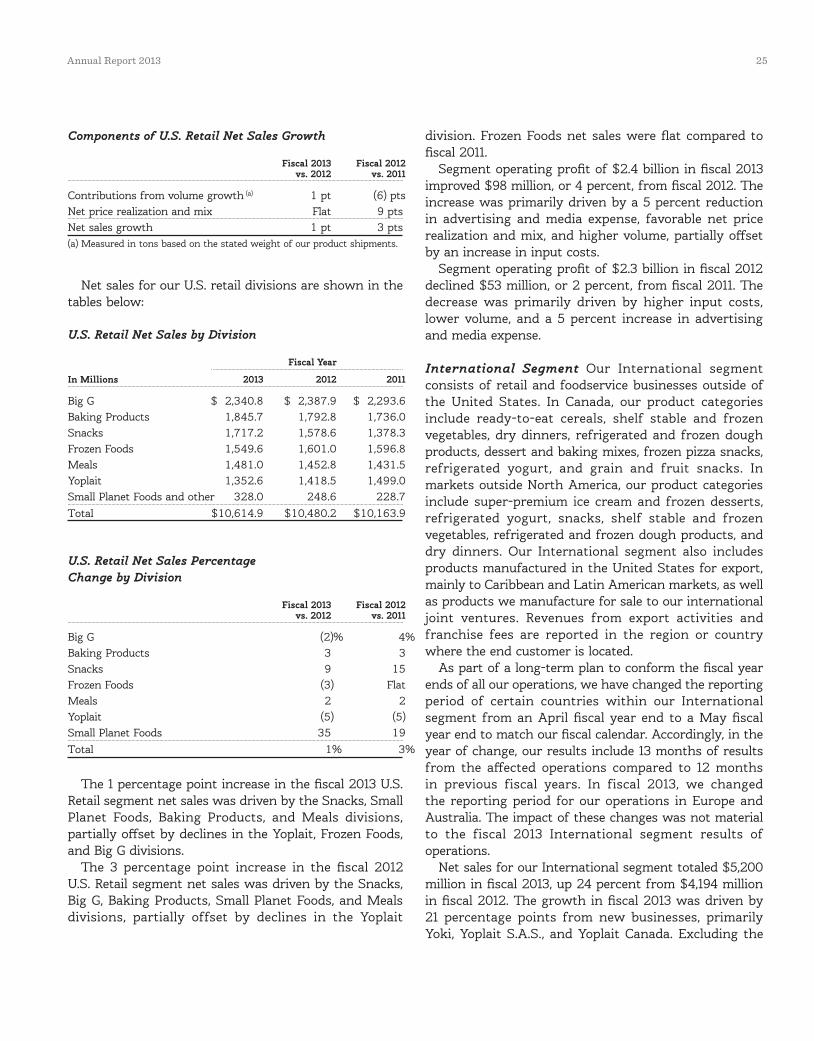
Components of U.S. Retail Net Sales Growth
Fiscal 2013 Fiscal 2012vs. 2012 vs. 2011
Contributions from volume growth (a) 1 pt (6) ptsNet price realization and mix Flat 9 ptsNet sales growth 1 pt 3 pts(a) Measured in tons based on the stated weight of our product shipments.
Net sales for our U.S. retail divisions are shown in the tables below:
U.S. Retail Net Sales by Division
Fiscal Year
In Millions 2013 2012 2011
Big G $ 2,340.8 $ 2,387.9 $ 2,293.6 Baking Products 1,845.7 1,792.8 1,736.0 Snacks 1,717.2 1,578.6 1,378.3 Frozen Foods 1,549.6 1,601.0 1,596.8 Meals 1,481.0 1,452.8 1,431.5 Yoplait 1,352.6 1,418.5 1,499.0 Small Planet Foods and other 328.0 248.6 228.7 Total $10,614.9 $10,480.2 $10,163.9
U.S. Retail Net Sales Percentage Change by Division
Fiscal 2013 Fiscal 2012vs. 2012 vs. 2011
Big G (2)% 4%Baking Products 3 3 Snacks 9 15 Frozen Foods (3) FlatMeals 2 2 Yoplait (5) (5)Small Planet Foods 35 19 Total 1% 3%
The 1 percentage point increase in the fiscal 2013 U.S. Retail segment net sales was driven by the Snacks, Small Planet Foods, Baking Products, and Meals divisions, partially offset by declines in the Yoplait, Frozen Foods, and Big G divisions.
The 3 percentage point increase in the fiscal 2012 U.S. Retail segment net sales was driven by the Snacks, Big G, Baking Products, Small Planet Foods, and Meals divisions, partially offset by declines in the Yoplait
division. Frozen Foods net sales were flat compared to fiscal 2011.
Segment operating profit of $2.4 billion in fiscal 2013 improved $98 million, or 4 percent, from fiscal 2012. The increase was primarily driven by a 5 percent reduction in advertising and media expense, favorable net price realization and mix, and higher volume, partially offset by an increase in input costs.
Segment operating profit of $2.3 billion in fiscal 2012 declined $53 million, or 2 percent, from fiscal 2011. The decrease was primarily driven by higher input costs, lower volume, and a 5 percent increase in advertising and media expense.
International Segment Our International segment consists of retail and foodservice businesses outside of the United States. In Canada, our product categories include ready-to-eat cereals, shelf stable and frozen vegetables, dry dinners, refrigerated and frozen dough products, dessert and baking mixes, frozen pizza snacks, refrigerated yogurt, and grain and fruit snacks. In markets outside North America, our product categories include super-premium ice cream and frozen desserts, refrigerated yogurt, snacks, shelf stable and frozen vegetables, refrigerated and frozen dough products, and dry dinners. Our International segment also includes products manufactured in the United States for export, mainly to Caribbean and Latin American markets, as well as products we manufacture for sale to our international joint ventures. Revenues from export activities and franchise fees are reported in the region or country where the end customer is located.
As part of a long-term plan to conform the fiscal year ends of all our operations, we have changed the reporting period of certain countries within our International segment from an April fiscal year end to a May fiscal year end to match our fiscal calendar. Accordingly, in the year of change, our results include 13 months of results from the affected operations compared to 12 months in previous fiscal years. In fiscal 2013, we changed the reporting period for our operations in Europe and Australia. The impact of these changes was not material to the fiscal 2013 International segment results of operations.
Net sales for our International segment totaled $5,200 million in fiscal 2013, up 24 percent from $4,194 million in fiscal 2012. The growth in fiscal 2013 was driven by 21 percentage points from new businesses, primarily Yoki, Yoplait S.A.S., and Yoplait Canada. Excluding the
26 Healthy Growth Annual Report 2013 27
impact of new businesses, net sales were up 3 percent. Volume contributed 34 percentage points of net sales growth, including 32 percentage points resulting from new businesses, partially offset by 6 percentage points of unfavorable net price realization and mix and 4 percentage points of unfavorable foreign currency exchange.
Net sales totaled $4,194 million in fiscal 2012, up 46 percent from $2,876 million in fiscal 2011. The growth in fiscal 2012 was driven by 36 percentage points contributed by the acquisition of Yoplait S.A.S. Volume contributed 65 percentage points of net sales growth, including 63 percentage points resulting from the acquisition of Yoplait S.A.S., and favorable foreign currency exchange contributed 1 percentage point of net sales growth. These gains were partially offset by a decrease of 20 percentage points due to unfavorable net price realization and mix resulting from the acquisition of Yoplait S.A.S.
Components of International Net Sales Growth
Fiscal 2013 Fiscal 2012 vs. 2012 vs. 2011
Contributions from volume growth (a) 34 pts 65 ptsNet price realization and mix (6) pts (20) ptsForeign currency exchange (4) pts 1 ptNet sales growth 24 pts 46 pts(a) Measured in tons based on the stated weight of our product shipments.
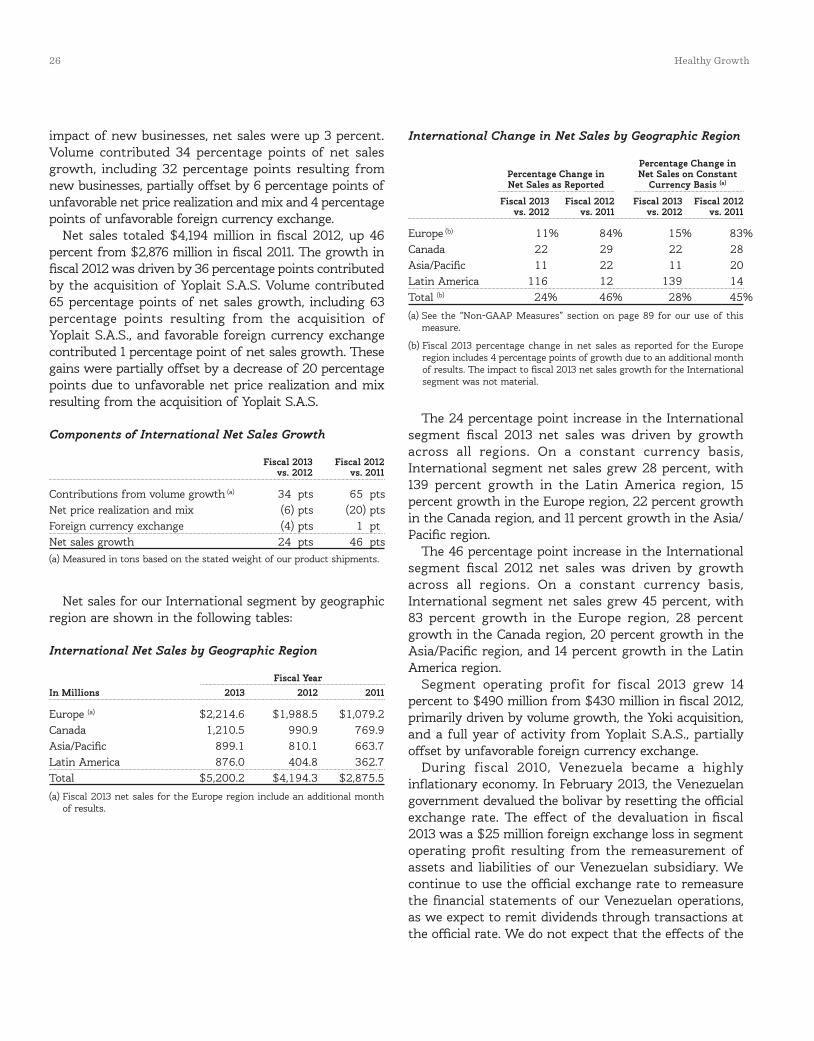
Net sales for our International segment by geographic region are shown in the following tables:
International Net Sales by Geographic Region
Fiscal YearIn Millions 2013 2012 2011
Europe (a) $2,214.6 $1,988.5 $1,079.2 Canada 1,210.5 990.9 769.9 Asia/Pacific 899.1 810.1 663.7 Latin America 876.0 404.8 362.7 Total $5,200.2 $4,194.3 $2,875.5
(a) Fiscal 2013 net sales for the Europe region include an additional month of results.
International Change in Net Sales by Geographic Region
Percentage Change in Percentage Change in Net Sales on Constant
Net Sales as Reported Currency Basis (a)
Fiscal 2013 Fiscal 2012 Fiscal 2013 Fiscal 2012 vs. 2012 vs. 2011 vs. 2012 vs. 2011
Europe (b) 11% 84% 15% 83%Canada 22 29 22 28 Asia/Pacific 11 22 11 20 Latin America 116 12 139 14 Total (b) 24% 46% 28% 45%
(a) See the “Non-GAAP Measures” section on page 89 for our use of this measure.
(b) Fiscal 2013 percentage change in net sales as reported for the Europe region includes 4 percentage points of growth due to an additional month of results. The impact to fiscal 2013 net sales growth for the International segment was not material.
The 24 percentage point increase in the International segment fiscal 2013 net sales was driven by growth across all regions. On a constant currency basis, International segment net sales grew 28 percent, with 139 percent growth in the Latin America region, 15 percent growth in the Europe region, 22 percent growth in the Canada region, and 11 percent growth in the Asia/Pacific region.
The 46 percentage point increase in the International segment fiscal 2012 net sales was driven by growth across all regions. On a constant currency basis, International segment net sales grew 45 percent, with 83 percent growth in the Europe region, 28 percent growth in the Canada region, 20 percent growth in the Asia/Pacific region, and 14 percent growth in the Latin America region.
Segment operating profit for fiscal 2013 grew 14 percent to $490 million from $430 million in fiscal 2012, primarily driven by volume growth, the Yoki acquisition, and a full year of activity from Yoplait S.A.S., partially offset by unfavorable foreign currency exchange.
During fiscal 2010, Venezuela became a highly inflationary economy. In February 2013, the Venezuelan government devalued the bolivar by resetting the official exchange rate. The effect of the devaluation in fiscal 2013 was a $25 million foreign exchange loss in segment operating profit resulting from the remeasurement of assets and liabilities of our Venezuelan subsidiary. We continue to use the official exchange rate to remeasure the financial statements of our Venezuelan operations, as we expect to remit dividends through transactions at the official rate. We do not expect that the effects of the
26 Healthy Growth Annual Report 2013 27
devaluation will have a material impact on our results in the future.
Segment operating profit for fiscal 2012 grew 47 percent to $430 million, from $291 million in fiscal 2011, primarily driven by the acquisition of Yoplait S.A.S., higher volume, and favorable foreign currency effects.
Bakeries and Foodservice Segment In our Bakeries and Foodservice segment our product categories include ready-to-eat cereals, snacks, refrigerated yogurt, unbaked and fully baked frozen dough products, baking mixes, and flour. Many products we sell are branded to the consumer and nearly all are branded to our customers. We sell to distributors and operators in many customer channels including foodservice, convenience stores, vending, and supermarket bakeries. Substantially all of this segment’s operations are located in the United States.
For fiscal 2013, net sales for our Bakeries and Foodservice segment decreased 1 percent to $1,959 million due to lower pound volume. Net price realization and mix was flat compared to fiscal 2012 as gains from favorable product mix were offset by declines in commodity index priced items.
For fiscal 2012, net sales for our Bakeries and Foodservice segment increased 8 percent to $1,983 million. The increase in fiscal 2012 was driven by an increase in net price realization and mix of 7 percentage points and 1 percentage point contributed by volume growth.
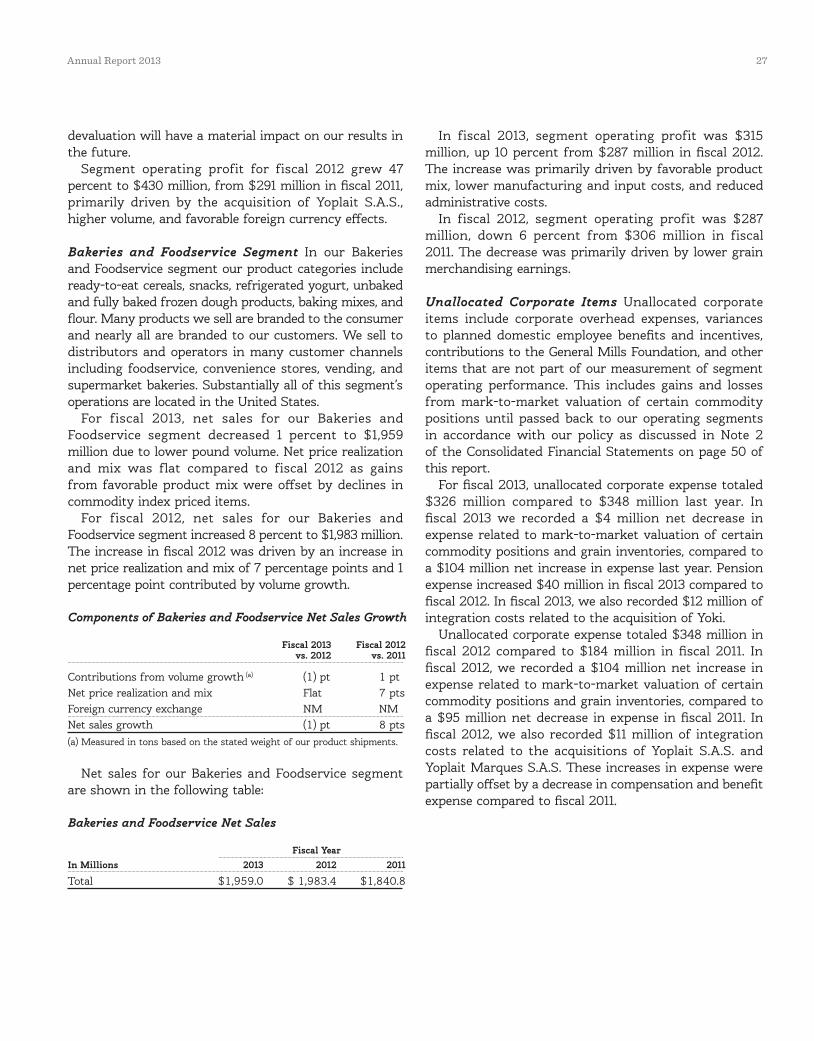
Components of Bakeries and Foodservice Net Sales Growth
Fiscal 2013 Fiscal 2012vs. 2012 vs. 2011
Contributions from volume growth (a) (1) pt 1 ptNet price realization and mix Flat 7 ptsForeign currency exchange NM NMNet sales growth (1) pt 8 pts(a) Measured in tons based on the stated weight of our product shipments.
Net sales for our Bakeries and Foodservice segment are shown in the following table:
Bakeries and Foodservice Net Sales
Fiscal YearIn Millions 2013 2012 2011
Total $1,959.0 $ 1,983.4 $1,840.8
In fiscal 2013, segment operating profit was $315 million, up 10 percent from $287 million in fiscal 2012. The increase was primarily driven by favorable product mix, lower manufacturing and input costs, and reduced administrative costs.
In fiscal 2012, segment operating profit was $287 million, down 6 percent from $306 million in fiscal 2011. The decrease was primarily driven by lower grain merchandising earnings.
Unallocated Corporate Items Unallocated corporate items include corporate overhead expenses, variances to planned domestic employee benefits and incentives, contributions to the General Mills Foundation, and other items that are not part of our measurement of segment operating performance. This includes gains and losses from mark-to-market valuation of certain commodity positions until passed back to our operating segments in accordance with our policy as discussed in Note 2 of the Consolidated Financial Statements on page 50 of this report.
For fiscal 2013, unallocated corporate expense totaled $326 million compared to $348 million last year. In fiscal 2013 we recorded a $4 million net decrease in expense related to mark-to-market valuation of certain commodity positions and grain inventories, compared to a $104 million net increase in expense last year. Pension expense increased $40 million in fiscal 2013 compared to fiscal 2012. In fiscal 2013, we also recorded $12 million of integration costs related to the acquisition of Yoki.
Unallocated corporate expense totaled $348 million in fiscal 2012 compared to $184 million in fiscal 2011. In fiscal 2012, we recorded a $104 million net increase in expense related to mark-to-market valuation of certain commodity positions and grain inventories, compared to a $95 million net decrease in expense in fiscal 2011. In fiscal 2012, we also recorded $11 million of integration costs related to the acquisitions of Yoplait S.A.S. and Yoplait Marques S.A.S. These increases in expense were partially offset by a decrease in compensation and benefit expense compared to fiscal 2011.
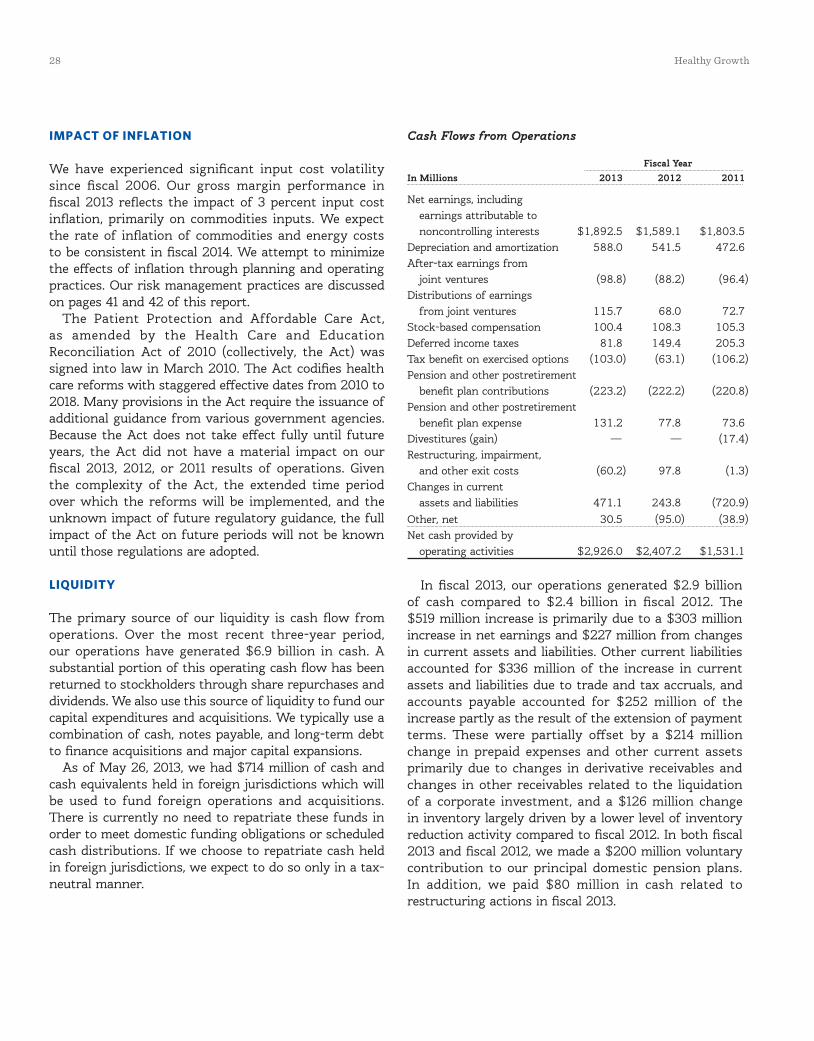
28 Healthy Growth Annual Report 2013 29
IMPACT OF INFLATION
We have experienced significant input cost volatility since fiscal 2006. Our gross margin performance in fiscal 2013 reflects the impact of 3 percent input cost inflation, primarily on commodities inputs. We expect the rate of inflation of commodities and energy costs to be consistent in fiscal 2014. We attempt to minimize the effects of inflation through planning and operating practices. Our risk management practices are discussed on pages 41 and 42 of this report.
The Patient Protection and Affordable Care Act, as amended by the Health Care and Education Reconciliation Act of 2010 (collectively, the Act) was signed into law in March 2010. The Act codifies health care reforms with staggered effective dates from 2010 to 2018. Many provisions in the Act require the issuance of additional guidance from various government agencies. Because the Act does not take effect fully until future years, the Act did not have a material impact on our fiscal 2013, 2012, or 2011 results of operations. Given the complexity of the Act, the extended time period over which the reforms will be implemented, and the unknown impact of future regulatory guidance, the full impact of the Act on future periods will not be known until those regulations are adopted.
LIQUIDITY
The primary source of our liquidity is cash flow from operations. Over the most recent three-year period, our operations have generated $6.9 billion in cash. A substantial portion of this operating cash flow has been returned to stockholders through share repurchases and dividends. We also use this source of liquidity to fund our capital expenditures and acquisitions. We typically use a combination of cash, notes payable, and long-term debt to finance acquisitions and major capital expansions.
As of May 26, 2013, we had $714 million of cash and cash equivalents held in foreign jurisdictions which will be used to fund foreign operations and acquisitions. There is currently no need to repatriate these funds in order to meet domestic funding obligations or scheduled cash distributions. If we choose to repatriate cash held in foreign jurisdictions, we expect to do so only in a tax-neutral manner.
Cash Flows from Operations
Fiscal YearIn Millions 2013 2012 2011
Net earnings, including earnings attributable to noncontrolling interests $1,892.5 $1,589.1 $1,803.5 Depreciation and amortization 588.0 541.5 472.6 After-tax earnings from joint ventures (98.8) (88.2) (96.4)Distributions of earnings from joint ventures 115.7 68.0 72.7 Stock-based compensation 100.4 108.3 105.3 Deferred income taxes 81.8 149.4 205.3 Tax benefit on exercised options (103.0) (63.1) (106.2)Pension and other postretirement benefit plan contributions (223.2) (222.2) (220.8)Pension and other postretirement benefit plan expense 131.2 77.8 73.6 Divestitures (gain) — — (17.4)Restructuring, impairment, and other exit costs (60.2) 97.8 (1.3)Changes in current assets and liabilities 471.1 243.8 (720.9)Other, net 30.5 (95.0) (38.9)Net cash provided by operating activities $2,926.0 $2,407.2 $1,531.1
In fiscal 2013, our operations generated $2.9 billion of cash compared to $2.4 billion in fiscal 2012. The $519 million increase is primarily due to a $303 million increase in net earnings and $227 million from changes in current assets and liabilities. Other current liabilities accounted for $336 million of the increase in current assets and liabilities due to trade and tax accruals, and accounts payable accounted for $252 million of the increase partly as the result of the extension of payment terms. These were partially offset by a $214 million change in prepaid expenses and other current assets primarily due to changes in derivative receivables and changes in other receivables related to the liquidation of a corporate investment, and a $126 million change in inventory largely driven by a lower level of inventory reduction activity compared to fiscal 2012. In both fiscal 2013 and fiscal 2012, we made a $200 million voluntary contribution to our principal domestic pension plans. In addition, we paid $80 million in cash related to restructuring actions in fiscal 2013.
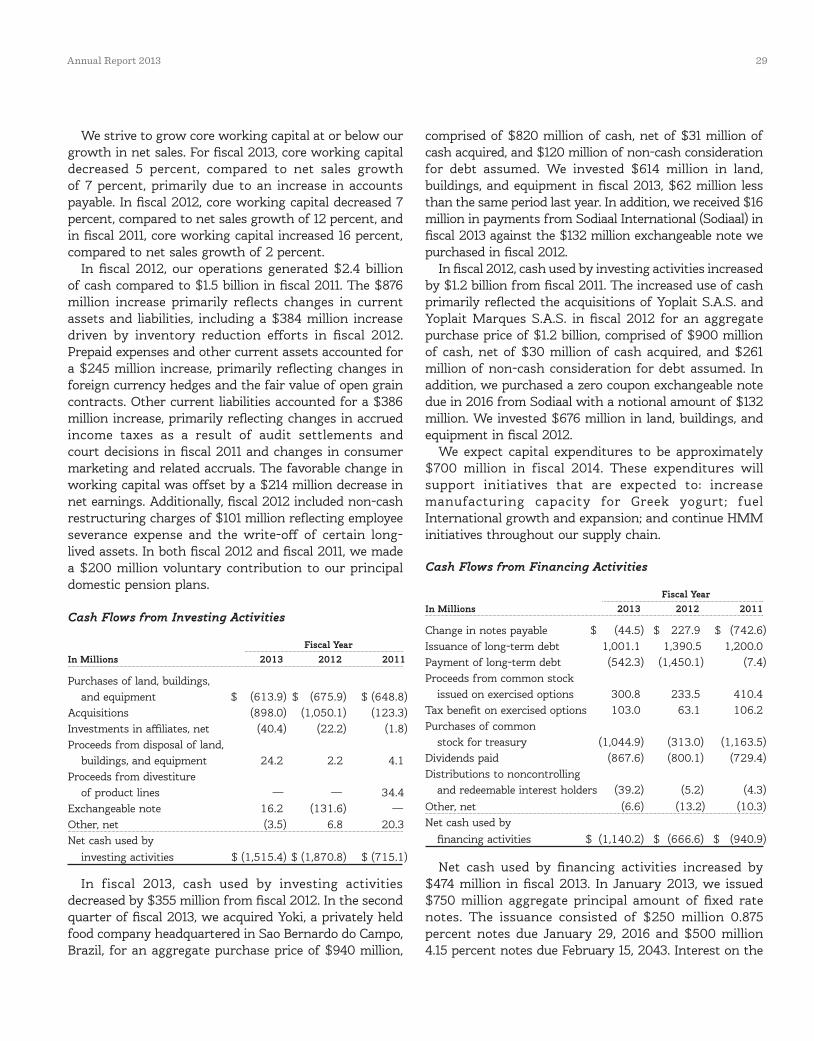
28 Healthy Growth Annual Report 2013 29
We strive to grow core working capital at or below our growth in net sales. For fiscal 2013, core working capital decreased 5 percent, compared to net sales growth of 7 percent, primarily due to an increase in accounts payable. In fiscal 2012, core working capital decreased 7 percent, compared to net sales growth of 12 percent, and in fiscal 2011, core working capital increased 16 percent, compared to net sales growth of 2 percent.
In fiscal 2012, our operations generated $2.4 billion of cash compared to $1.5 billion in fiscal 2011. The $876 million increase primarily reflects changes in current assets and liabilities, including a $384 million increase driven by inventory reduction efforts in fiscal 2012. Prepaid expenses and other current assets accounted for a $245 million increase, primarily reflecting changes in foreign currency hedges and the fair value of open grain contracts. Other current liabilities accounted for a $386 million increase, primarily reflecting changes in accrued income taxes as a result of audit settlements and court decisions in fiscal 2011 and changes in consumer marketing and related accruals. The favorable change in working capital was offset by a $214 million decrease in net earnings. Additionally, fiscal 2012 included non-cash restructuring charges of $101 million reflecting employee severance expense and the write-off of certain long-lived assets. In both fiscal 2012 and fiscal 2011, we made a $200 million voluntary contribution to our principal domestic pension plans.
Cash Flows from Investing Activities
Fiscal YearIn Millions 2013 2012 2011
Purchases of land, buildings, and equipment $ (613.9) $ (675.9) $ (648.8)
Acquisitions (898.0) (1,050.1) (123.3)Investments in affiliates, net (40.4) (22.2) (1.8)Proceeds from disposal of land, buildings, and equipment 24.2 2.2 4.1 Proceeds from divestiture of product lines — — 34.4 Exchangeable note 16.2 (131.6) —Other, net (3.5) 6.8 20.3 Net cash used by investing activities $ (1,515.4) $ (1,870.8) $ (715.1)
In fiscal 2013, cash used by investing activities decreased by $355 million from fiscal 2012. In the second quarter of fiscal 2013, we acquired Yoki, a privately held food company headquartered in Sao Bernardo do Campo, Brazil, for an aggregate purchase price of $940 million,
comprised of $820 million of cash, net of $31 million of cash acquired, and $120 million of non-cash consideration for debt assumed. We invested $614 million in land, buildings, and equipment in fiscal 2013, $62 million less than the same period last year. In addition, we received $16 million in payments from Sodiaal International (Sodiaal) in fiscal 2013 against the $132 million exchangeable note we purchased in fiscal 2012.
In fiscal 2012, cash used by investing activities increased by $1.2 billion from fiscal 2011. The increased use of cash primarily reflected the acquisitions of Yoplait S.A.S. and Yoplait Marques S.A.S. in fiscal 2012 for an aggregate purchase price of $1.2 billion, comprised of $900 million of cash, net of $30 million of cash acquired, and $261 million of non-cash consideration for debt assumed. In addition, we purchased a zero coupon exchangeable note due in 2016 from Sodiaal with a notional amount of $132 million. We invested $676 million in land, buildings, and equipment in fiscal 2012.
We expect capital expenditures to be approximately $700 million in fiscal 2014. These expenditures will support initiatives that are expected to: increase manufacturing capacity for Greek yogurt; fuel International growth and expansion; and continue HMM initiatives throughout our supply chain.
Cash Flows from Financing Activities
Fiscal YearIn Millions 2013 2012 2011
Change in notes payable $ (44.5) $ 227.9 $ (742.6)Issuance of long-term debt 1,001.1 1,390.5 1,200.0 Payment of long-term debt (542.3) (1,450.1) (7.4)Proceeds from common stock issued on exercised options 300.8 233.5 410.4 Tax benefit on exercised options 103.0 63.1 106.2 Purchases of common stock for treasury (1,044.9) (313.0) (1,163.5)Dividends paid (867.6) (800.1) (729.4)Distributions to noncontrolling and redeemable interest holders (39.2) (5.2) (4.3)Other, net (6.6) (13.2) (10.3)Net cash used by financing activities $ (1,140.2) $ (666.6) $ (940.9)
Net cash used by financing activities increased by $474 million in fiscal 2013. In January 2013, we issued $750 million aggregate principal amount of fixed rate notes. The issuance consisted of $250 million 0.875 percent notes due January 29, 2016 and $500 million 4.15 percent notes due February 15, 2043. Interest on the
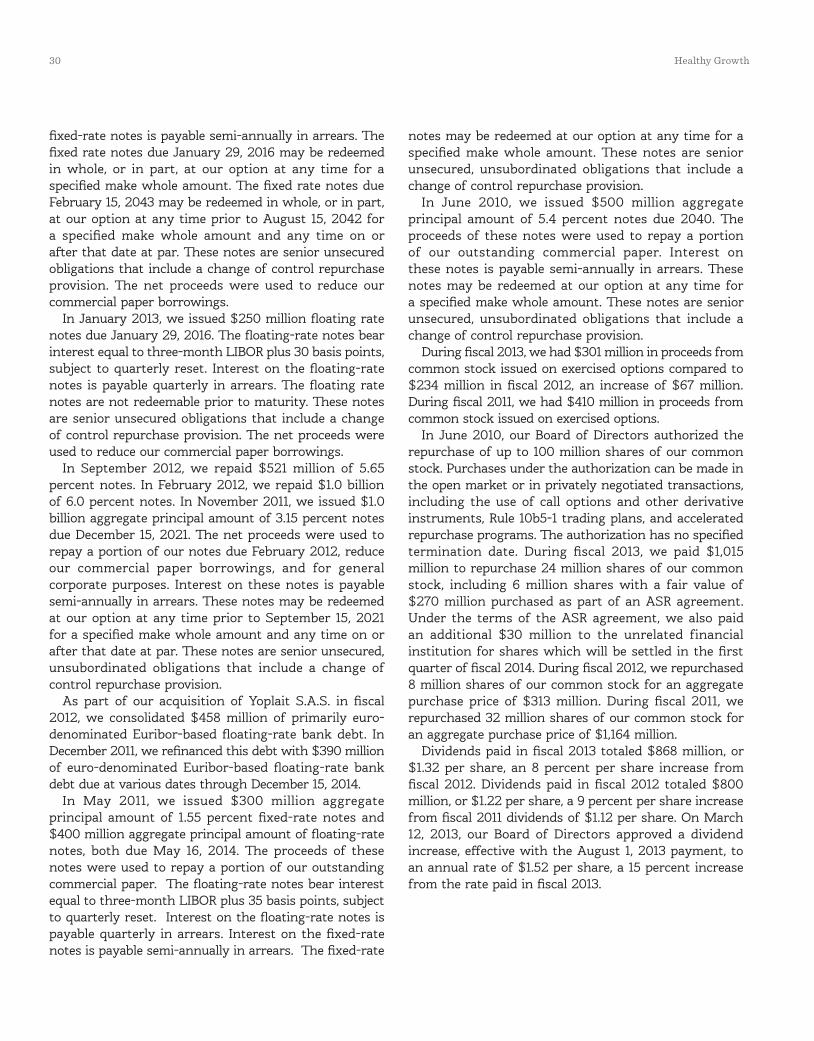
30 Healthy Growth Annual Report 2013 31
fixed-rate notes is payable semi-annually in arrears. The fixed rate notes due January 29, 2016 may be redeemed in whole, or in part, at our option at any time for a specified make whole amount. The fixed rate notes due February 15, 2043 may be redeemed in whole, or in part, at our option at any time prior to August 15, 2042 for a specified make whole amount and any time on or after that date at par. These notes are senior unsecured obligations that include a change of control repurchase provision. The net proceeds were used to reduce our commercial paper borrowings.
In January 2013, we issued $250 million floating rate notes due January 29, 2016. The floating-rate notes bear interest equal to three-month LIBOR plus 30 basis points, subject to quarterly reset. Interest on the floating-rate notes is payable quarterly in arrears. The floating rate notes are not redeemable prior to maturity. These notes are senior unsecured obligations that include a change of control repurchase provision. The net proceeds were used to reduce our commercial paper borrowings.
In September 2012, we repaid $521 million of 5.65 percent notes. In February 2012, we repaid $1.0 billion of 6.0 percent notes. In November 2011, we issued $1.0 billion aggregate principal amount of 3.15 percent notes due December 15, 2021. The net proceeds were used to repay a portion of our notes due February 2012, reduce our commercial paper borrowings, and for general corporate purposes. Interest on these notes is payable semi-annually in arrears. These notes may be redeemed at our option at any time prior to September 15, 2021 for a specified make whole amount and any time on or after that date at par. These notes are senior unsecured, unsubordinated obligations that include a change of control repurchase provision.
As part of our acquisition of Yoplait S.A.S. in fiscal 2012, we consolidated $458 million of primarily euro-denominated Euribor-based floating-rate bank debt. In December 2011, we refinanced this debt with $390 million of euro-denominated Euribor-based floating-rate bank debt due at various dates through December 15, 2014.
In May 2011, we issued $300 million aggregate principal amount of 1.55 percent fixed-rate notes and $400 million aggregate principal amount of floating-rate notes, both due May 16, 2014. The proceeds of these notes were used to repay a portion of our outstanding commercial paper. The floating-rate notes bear interest equal to three-month LIBOR plus 35 basis points, subject to quarterly reset. Interest on the floating-rate notes is payable quarterly in arrears. Interest on the fixed-rate notes is payable semi-annually in arrears. The fixed-rate
notes may be redeemed at our option at any time for a specified make whole amount. These notes are senior unsecured, unsubordinated obligations that include a change of control repurchase provision.
In June 2010, we issued $500 million aggregate principal amount of 5.4 percent notes due 2040. The proceeds of these notes were used to repay a portion of our outstanding commercial paper. Interest on these notes is payable semi-annually in arrears. These notes may be redeemed at our option at any time for a specified make whole amount. These notes are senior unsecured, unsubordinated obligations that include a change of control repurchase provision.
During fiscal 2013, we had $301 million in proceeds from common stock issued on exercised options compared to $234 million in fiscal 2012, an increase of $67 million. During fiscal 2011, we had $410 million in proceeds from common stock issued on exercised options.
In June 2010, our Board of Directors authorized the repurchase of up to 100 million shares of our common stock. Purchases under the authorization can be made in the open market or in privately negotiated transactions, including the use of call options and other derivative instruments, Rule 10b5-1 trading plans, and accelerated repurchase programs. The authorization has no specified termination date. During fiscal 2013, we paid $1,015 million to repurchase 24 million shares of our common stock, including 6 million shares with a fair value of $270 million purchased as part of an ASR agreement. Under the terms of the ASR agreement, we also paid an additional $30 million to the unrelated financial institution for shares which will be settled in the first quarter of fiscal 2014. During fiscal 2012, we repurchased 8 million shares of our common stock for an aggregate purchase price of $313 million. During fiscal 2011, we repurchased 32 million shares of our common stock for an aggregate purchase price of $1,164 million.
Dividends paid in fiscal 2013 totaled $868 million, or $1.32 per share, an 8 percent per share increase from fiscal 2012. Dividends paid in fiscal 2012 totaled $800 million, or $1.22 per share, a 9 percent per share increase from fiscal 2011 dividends of $1.12 per share. On March 12, 2013, our Board of Directors approved a dividend increase, effective with the August 1, 2013 payment, to an annual rate of $1.52 per share, a 15 percent increase from the rate paid in fiscal 2013.
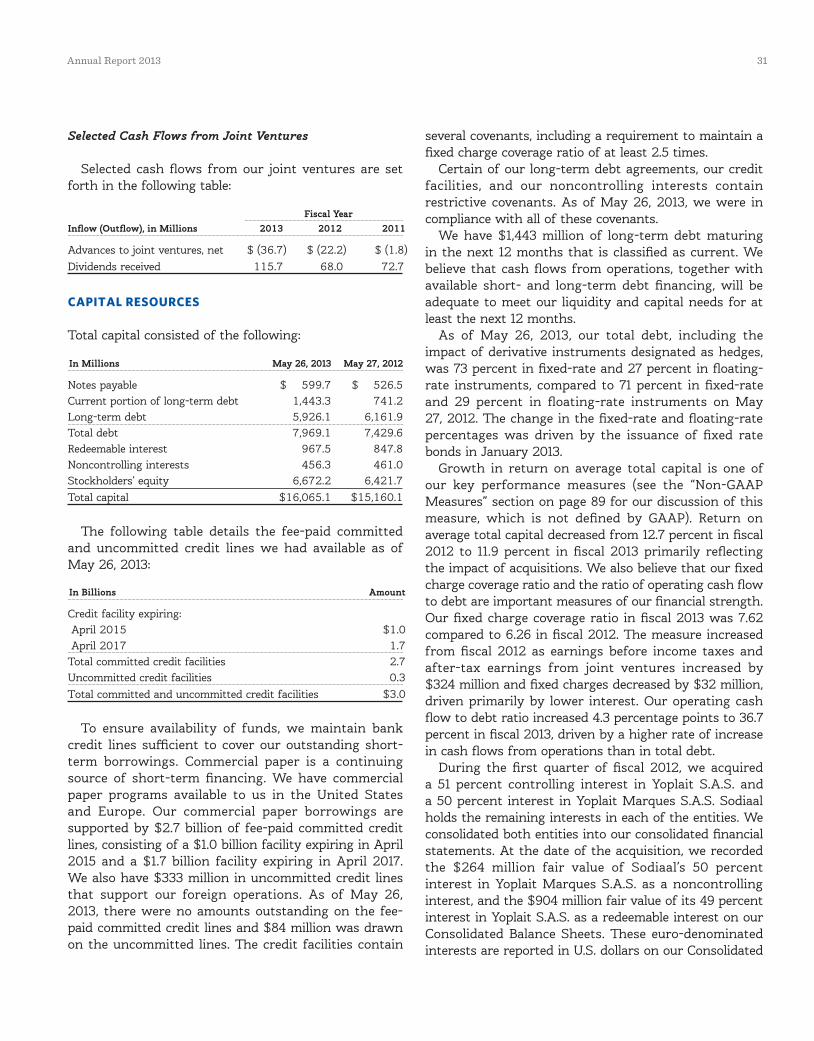
30 Healthy Growth Annual Report 2013 31
Selected Cash Flows from Joint Ventures
Selected cash flows from our joint ventures are set forth in the following table:
Fiscal YearInflow (Outflow), in Millions 2013 2012 2011
Advances to joint ventures, net $ (36.7) $ (22.2) $ (1.8)Dividends received 115.7 68.0 72.7
CAPITAL RESOURCES
Total capital consisted of the following:
In Millions May 26, 2013 May 27, 2012
Notes payable $ 599.7 $ 526.5 Current portion of long-term debt 1,443.3 741.2 Long-term debt 5,926.1 6,161.9 Total debt 7,969.1 7,429.6 Redeemable interest 967.5 847.8 Noncontrolling interests 456.3 461.0 Stockholders’ equity 6,672.2 6,421.7 Total capital $16,065.1 $15,160.1
The following table details the fee-paid committed and uncommitted credit lines we had available as of May 26, 2013:
In Billions Amount
Credit facility expiring: April 2015 $1.0 April 2017 1.7Total committed credit facilities 2.7Uncommitted credit facilities 0.3 Total committed and uncommitted credit facilities $3.0
To ensure availability of funds, we maintain bank credit lines sufficient to cover our outstanding short-term borrowings. Commercial paper is a continuing source of short-term financing. We have commercial paper programs available to us in the United States and Europe. Our commercial paper borrowings are supported by $2.7 billion of fee-paid committed credit lines, consisting of a $1.0 billion facility expiring in April 2015 and a $1.7 billion facility expiring in April 2017. We also have $333 million in uncommitted credit lines that support our foreign operations. As of May 26, 2013, there were no amounts outstanding on the fee-paid committed credit lines and $84 million was drawn on the uncommitted lines. The credit facilities contain
several covenants, including a requirement to maintain a fixed charge coverage ratio of at least 2.5 times.
Certain of our long-term debt agreements, our credit facilities, and our noncontrolling interests contain restrictive covenants. As of May 26, 2013, we were in compliance with all of these covenants.
We have $1,443 million of long-term debt maturing in the next 12 months that is classified as current. We believe that cash flows from operations, together with available short- and long-term debt financing, will be adequate to meet our liquidity and capital needs for at least the next 12 months.
As of May 26, 2013, our total debt, including the impact of derivative instruments designated as hedges, was 73 percent in fixed-rate and 27 percent in floating-rate instruments, compared to 71 percent in fixed-rate and 29 percent in floating-rate instruments on May 27, 2012. The change in the fixed-rate and floating-rate percentages was driven by the issuance of fixed rate bonds in January 2013.
Growth in return on average total capital is one of our key performance measures (see the “Non-GAAP Measures” section on page 89 for our discussion of this measure, which is not defined by GAAP). Return on average total capital decreased from 12.7 percent in fiscal 2012 to 11.9 percent in fiscal 2013 primarily reflecting the impact of acquisitions. We also believe that our fixed charge coverage ratio and the ratio of operating cash flow to debt are important measures of our financial strength. Our fixed charge coverage ratio in fiscal 2013 was 7.62 compared to 6.26 in fiscal 2012. The measure increased from fiscal 2012 as earnings before income taxes and after-tax earnings from joint ventures increased by $324 million and fixed charges decreased by $32 million, driven primarily by lower interest. Our operating cash flow to debt ratio increased 4.3 percentage points to 36.7 percent in fiscal 2013, driven by a higher rate of increase in cash flows from operations than in total debt.
During the first quarter of fiscal 2012, we acquired a 51 percent controlling interest in Yoplait S.A.S. and a 50 percent interest in Yoplait Marques S.A.S. Sodiaal holds the remaining interests in each of the entities. We consolidated both entities into our consolidated financial statements. At the date of the acquisition, we recorded the $264 million fair value of Sodiaal’s 50 percent interest in Yoplait Marques S.A.S. as a noncontrolling interest, and the $904 million fair value of its 49 percent interest in Yoplait S.A.S. as a redeemable interest on our Consolidated Balance Sheets. These euro-denominated interests are reported in U.S. dollars on our Consolidated
32 Healthy Growth Annual Report 2013 33
Balance Sheets. Sodiaal has the ability to put a limited portion of its redeemable interest to us at fair value once per year up to a maximum of 9 years. As of May 26, 2013, the redemption value of the redeemable interest was $968 million which approximates its fair value.
During the first quarter of fiscal 2013, in conjunction with the consent of the Class A investor, we restructured GMC through the distribution of its manufacturing assets, stock, inventory, cash and certain intellectual property to a wholly owned subsidiary. GMC retained the remaining intellectual property. Immediately following the restructuring, the Class A Interests of GMC were sold by the then current holder to another unrelated third-party investor.
The third-party holder of the GMC Class A Interests receives quarterly preferred distributions from available net income based on the application of a floating preferred return rate, currently equal to the sum of three-month LIBOR plus 110 basis points, to the holder’s capital account balance established in the most recent mark-to-market valuation (currently $252 million). The preferred return rate is adjusted every three years through a negotiated agreement with the Class A Interest holder or through a remarketing auction.
The holder of the Class A Interests may initiate a liquidation of GMC under certain circumstances, including, without limitation, the bankruptcy of GMC or its subsidiaries, GMC’s failure to deliver the preferred distributions on the Class A Interests, GMC’s failure to comply with portfolio requirements, breaches of certain covenants, lowering of our senior debt rating below either Baa3 by Moody’s or BBB- by Standard & Poor’s, and a failed attempt to remarket the Class A Interests. In the event of a liquidation of GMC, each member of GMC will receive the amount of its then current capital account balance. We may avoid liquidation by exercising our option to purchase the Class A Interests.
We may exercise our option to purchase the Class A Interests for consideration equal to the then current capital account value, plus any unpaid preferred return and the prescribed make-whole amount. If we purchase these interests, any change in the unrelated third-party investor’s capital account from its original value will be charged directly to retained earnings and will increase or decrease the net earnings used to calculate EPS in that period.
OFF-BALANCE SHEET ARRANGEMENTS AND CONTRACTUAL OBLIGATIONS
As of May 26, 2013, we have issued guarantees and comfort letters of $356 million for the debt and other obligations of consolidated subsidiaries, and guarantees and comfort letters of $259 million for the debt and other obligations of non-consolidated affiliates, mainly CPW. In addition, off-balance sheet arrangements are generally limited to the future payments under non-cancelable operating leases, which totaled $438 million as of May 26, 2013.
As of May 26, 2013, we had invested in four variable interest entities (VIEs). None of our VIEs are material to our results of operations, financial condition, or liquidity as of and for the year ended May 26, 2013. We determined whether or not we were the primary beneficiary (PB) of each VIE using a qualitative assessment that considered the VIE’s purpose and design, the involvement of each of the interest holders, and the risks and benefits of the VIE. We are the PB of three of the VIEs. We provided minimal financial or other support to our VIEs during fiscal 2013, and there are no arrangements related to VIEs that would require us to provide significant financial support in the future.
Our defined benefit plans in the United States are subject to the requirements of the Pension Protection Act (PPA). The PPA revised the basis and methodology for determining defined benefit plan minimum funding requirements as well as maximum contributions to and benefits paid from tax-qualified plans. The PPA may ultimately require us to make additional contributions to our domestic plans. We made $200 million of voluntary contributions to our principal U.S. plans in each of fiscal 2013 and fiscal 2012. We do not expect to be required to make any contributions in fiscal 2014. Actual fiscal 2014 contributions could exceed our current projections, and may be influenced by our decision to undertake discretionary funding of our benefit trusts or by changes in regulatory requirements. Additionally, our projections concerning timing of the PPA funding requirements are subject to change and may be influenced by factors such as general market conditions affecting trust asset performance, interest rates, and our future decisions regarding certain elective provisions of the PPA.
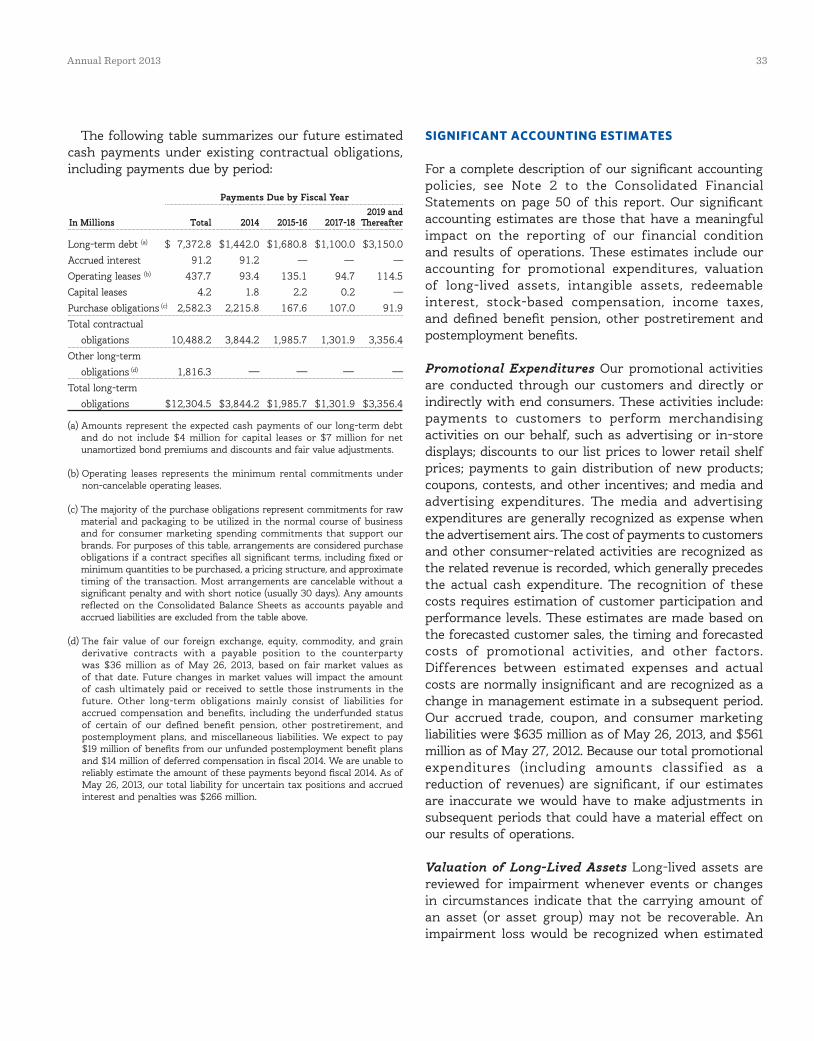
32 Healthy Growth Annual Report 2013 33
The following table summarizes our future estimated cash payments under existing contractual obligations, including payments due by period:
Payments Due by Fiscal Year 2019 andIn Millions Total 2014 2015-16 2017-18 Thereafter
Long-term debt (a) $ 7,372.8 $1,442.0 $1,680.8 $1,100.0 $3,150.0 Accrued interest 91.2 91.2 — — — Operating leases (b) 437.7 93.4 135.1 94.7 114.5 Capital leases 4.2 1.8 2.2 0.2 — Purchase obligations (c) 2,582.3 2,215.8 167.6 107.0 91.9 Total contractual obligations 10,488.2 3,844.2 1,985.7 1,301.9 3,356.4 Other long-term obligations (d) 1,816.3 — — — — Total long-term
obligations $12,304.5 $3,844.2 $1,985.7 $1,301.9 $3,356.4
(a) Amounts represent the expected cash payments of our long-term debt and do not include $4 million for capital leases or $7 million for net unamortized bond premiums and discounts and fair value adjustments.
(b) Operating leases represents the minimum rental commitments under non-cancelable operating leases.
(c) The majority of the purchase obligations represent commitments for raw material and packaging to be utilized in the normal course of business and for consumer marketing spending commitments that support our brands. For purposes of this table, arrangements are considered purchase obligations if a contract specifies all significant terms, including fixed or minimum quantities to be purchased, a pricing structure, and approximate timing of the transaction. Most arrangements are cancelable without a significant penalty and with short notice (usually 30 days). Any amounts reflected on the Consolidated Balance Sheets as accounts payable and accrued liabilities are excluded from the table above.
(d) The fair value of our foreign exchange, equity, commodity, and grain derivative contracts with a payable position to the counterparty was $36 million as of May 26, 2013, based on fair market values as of that date. Future changes in market values will impact the amount of cash ultimately paid or received to settle those instruments in the future. Other long-term obligations mainly consist of liabilities for accrued compensation and benefits, including the underfunded status of certain of our defined benefit pension, other postretirement, and postemployment plans, and miscellaneous liabilities. We expect to pay $19 million of benefits from our unfunded postemployment benefit plans and $14 million of deferred compensation in fiscal 2014. We are unable to reliably estimate the amount of these payments beyond fiscal 2014. As of May 26, 2013, our total liability for uncertain tax positions and accrued interest and penalties was $266 million.
SIGNIFICANT ACCOUNTING ESTIMATES
For a complete description of our significant accounting policies, see Note 2 to the Consolidated Financial Statements on page 50 of this report. Our significant accounting estimates are those that have a meaningful impact on the reporting of our financial condition and results of operations. These estimates include our accounting for promotional expenditures, valuation of long-lived assets, intangible assets, redeemable interest, stock-based compensation, income taxes, and defined benefit pension, other postretirement and postemployment benefits.
Promotional Expenditures Our promotional activities are conducted through our customers and directly or indirectly with end consumers. These activities include: payments to customers to perform merchandising activities on our behalf, such as advertising or in-store displays; discounts to our list prices to lower retail shelf prices; payments to gain distribution of new products; coupons, contests, and other incentives; and media and advertising expenditures. The media and advertising expenditures are generally recognized as expense when the advertisement airs. The cost of payments to customers and other consumer-related activities are recognized as the related revenue is recorded, which generally precedes the actual cash expenditure. The recognition of these costs requires estimation of customer participation and performance levels. These estimates are made based on the forecasted customer sales, the timing and forecasted costs of promotional activities, and other factors. Differences between estimated expenses and actual costs are normally insignificant and are recognized as a change in management estimate in a subsequent period. Our accrued trade, coupon, and consumer marketing liabilities were $635 million as of May 26, 2013, and $561 million as of May 27, 2012. Because our total promotional expenditures (including amounts classified as a reduction of revenues) are significant, if our estimates are inaccurate we would have to make adjustments in subsequent periods that could have a material effect on our results of operations.
Valuation of Long-Lived Assets Long-lived assets are reviewed for impairment whenever events or changes in circumstances indicate that the carrying amount of an asset (or asset group) may not be recoverable. An impairment loss would be recognized when estimated
34 Healthy Growth Annual Report 2013 35
undiscounted future cash flows from the operation and disposition of the asset group are less than the carrying amount of the asset group. Asset groups have identifiable cash flows independent of other asset groups. Measurement of an impairment loss would be based on the excess of the carrying amount of the asset or asset group over its fair value. Fair value is measured using discounted cash flows or independent appraisals, as appropriate.
Intangible Assets Goodwill is not subject to amortization and is tested for impairment annually and whenever events or changes in circumstances indicate that impairment may have occurred. Impairment testing is performed for each of our reporting units. We compare the carrying value of a reporting unit, including goodwill, to the fair value of the unit. Carrying value is based on the assets and liabilities associated with the operations of that reporting unit, which often requires allocation of shared or corporate items among reporting units. If the carrying amount of a reporting unit exceeds its fair value, we revalue all assets and liabilities of the reporting unit, excluding goodwill, to determine if the fair value of the net assets is greater than the net assets including goodwill. If the fair value of the net assets is less than the carrying amount of net assets including goodwill, impairment has occurred. Our estimates of fair value are determined based on a discounted cash flow model. Growth rates for sales and profits are determined using inputs from our annual long-range planning process. We also make estimates of discount rates, perpetuity growth assumptions, market comparables, and other factors. We performed our fiscal 2013 assessment as of November 26, 2012, and determined there was no impairment of goodwill for any of our reporting units as their related fair values were substantially in excess of their carrying values.
We evaluate the useful lives of our other intangible assets, mainly brands, to determine if they are finite or indefinite-lived. Reaching a determination on useful life requires significant judgments and assumptions regarding the future effects of obsolescence, demand, competition, other economic factors (such as the stability of the industry, known technological advances, legislative action that results in an uncertain or changing regulatory environment, and expected changes in distribution channels), the level of required maintenance expenditures, and the expected lives of other related groups of assets. Intangible assets that are deemed to have definite lives are amortized on a straight-line basis, over their useful lives, generally ranging from 4 to 30 years.
Our indefinite-lived intangible assets, mainly intangible assets primarily associated with the Pillsbury, Totino’s, Progresso, Green Giant, Yoplait, Old El Paso, Yoki, and Häagen-Dazs brands, are also tested for impairment annually and whenever events or changes in circumstances indicate that their carrying value may not be recoverable. We performed our fiscal 2013 assessment of our brand intangibles as of November 26, 2012. Our estimate of the fair value of the brands was based on a discounted cash flow model using inputs which included projected revenues from our annual long-range plan, assumed royalty rates that could be payable if we did not own the brands, and a discount rate. As of our assessment date, there was no impairment of any of our indefinite-lived intangible assets as their related fair values were substantially in excess of the carrying values.
As of May 26, 2013, we had $13.1 billion of goodwill and indefinite-lived intangible assets. While we currently believe that the fair value of each intangible exceeds its carrying value and that those intangibles so classified will contribute indefinitely to our cash flows, materially different assumptions regarding future performance of our businesses or a different weighted-average cost of capital could result in significant impairment losses and amortization expense.
In addition, we assess our investments in our joint ventures if we have reason to believe an impairment may have occurred including, but not limited to, ongoing operating losses, projected decreases in earnings, increases in the weighted average cost of capital or significant business disruptions. The significant assumptions used to estimate fair value include revenue growth and profitability, royalty rates, capital spending, depreciation and taxes, foreign currency exchange rates and a discount rate. By their nature, these projections and assumptions are uncertain. If we were to determine the current fair value of our investment was less than the carrying value of the investment, then we would assess if the shortfall was of a temporary or permanent nature and write down the investment to its fair value if we concluded the impairment is other than temporary.
Redeemable Interest On July 1, 2011, we acquired a 51 percent controlling interest in Yoplait S.A.S., a consolidated entity. Sodiaal holds the remaining 49 percent interest in Yoplait S.A.S. Sodiaal has the ability to put a limited portion of its redeemable interest to us at fair value once per year up to a maximum of 9 years. This put option requires us to classify Sodiaal’s interest as a redeemable interest outside of equity on our Consolidated Balance Sheets for as long as the put
34 Healthy Growth Annual Report 2013 35
is exercisable by Sodiaal. When the put is no longer exercisable, the redeemable interest will be reclassified to noncontrolling interests on our Consolidated Balance Sheets. We adjust the value of the redeemable interest through additional paid-in capital on our Consolidated Balance Sheets quarterly to the redeemable interest’s redemption value, which approximates its fair value. During the third quarter of fiscal 2013, we adjusted the redeemable interest’s redemption value based on a discounted cash flow model. The significant assumptions used to estimate the redemption value include projected revenue growth and profitability from our long range plan, capital spending, depreciation and taxes, foreign currency rates, and a discount rate.
Stock-based Compensation The valuation of stock options is a significant accounting estimate that requires us to use judgments and assumptions that are likely to have a material impact on our financial statements. Annually, we make predictive assumptions regarding future stock price volatility, employee exercise behavior, dividend yield, and the forfeiture rate.
We estimate our future stock price volatility using the historical volatility over the expected term of the option, excluding time periods of volatility we believe a marketplace participant would exclude in estimating our stock price volatility. We also have considered, but did not use, implied volatility in our estimate, because trading activity in options on our stock, especially those with tenors of greater than 6 months, is insufficient to provide a reliable measure of expected volatility. If all other assumptions are held constant, a one percentage point increase in our fiscal 2013 volatility assumption would increase the grant-date fair value of our fiscal 2013 option awards by 9 percent.
Our expected term represents the period of time that options granted are expected to be outstanding based on historical data to estimate option exercises and employee terminations within the valuation model. Separate groups of employees have similar historical exercise behavior and therefore were aggregated into a single pool for valuation purposes. The weighted-average expected term for all employee groups is presented in the table below. An increase in the expected term by 1 year, leaving all other assumptions constant, would increase the grant date fair value by 22 percent.
The risk-free interest rate for periods during the expected term of the options is based on the U.S. Treasury zero-coupon yield curve in effect at the time of grant.
The estimated fair values of stock options granted and the assumptions used for the Black-Scholes option-pricing model were as follows:
Fiscal Year 2013 2012 2011
Estimated fair values of stock options granted $ 3.65 $ 5.88 $ 4.12Assumptions: Risk-free interest rate 1.6% 2.9% 2.9% Expected term 9.0 years 8.5 years 8.5 years Expected volatility 17.3% 17.6% 18.5%
Dividend yield 3.5% 3.3% 3.0%
To the extent that actual outcomes differ from our assumptions, we are not required to true up grant-date fair value-based expense to final intrinsic values. However, these differences can impact the classification of cash tax benefits realized upon exercise of stock options, as explained in the following two paragraphs. Furthermore, historical data has a significant bearing on our forward-looking assumptions. Significant variances between actual and predicted experience could lead to prospective revisions in our assumptions, which could then significantly impact the year-over-year comparability of stock-based compensation expense.
Any corporate income tax benefit realized upon exercise or vesting of an award in excess of that previously recognized in earnings (referred to as a windfall tax benefit) is presented in the Consolidated Statements of Cash Flows as a financing cash flow. The actual impact on future years’ financing cash flows will depend, in part, on the volume of employee stock option exercises during a particular year and the relationship between the exercise-date market value of the underlying stock and the original grant-date fair value previously determined for financial reporting purposes.
Realized windfall tax benefits are credited to additional paid-in capital within the Consolidated Balance Sheets. Realized shortfall tax benefits (amounts which are less than that previously recognized in earnings) are first offset against the cumulative balance of windfall tax benefits, if any, and then charged directly to income tax expense, potentially resulting in volatility in our consolidated effective income tax rate. We calculated a cumulative amount of windfall tax benefits for the purpose of accounting for future shortfall tax benefits and currently have sufficient cumulative windfall tax benefits to absorb projected arising shortfalls, such that we do not currently expect future earnings to be affected by this provision. However, as employee stock option
36 Healthy Growth Annual Report 2013 37
exercise behavior is not within our control, it is possible that materially different reported results could occur if different assumptions or conditions were to prevail.
Income Taxes We apply a more-likely-than-not threshold to the recognition and derecognition of uncertain tax positions. Accordingly, we recognize the amount of tax benefit that has a greater than 50 percent likelihood of being ultimately realized upon settlement. Future changes in judgment related to the expected ultimate resolution of uncertain tax positions will affect earnings in the quarter of such change.
We are subject to federal income taxes in the United States as well as various state, local, and foreign jurisdictions. A number of years may elapse before an uncertain tax position is audited and finally resolved. While it is often difficult to predict the final outcome or the timing of resolution of any particular uncertain tax position, we believe that our liabilities for income taxes reflect the most likely outcome. We adjust these liabilities, as well as the related interest, in light of changing facts and circumstances. Settlement of any particular position would usually require the use of cash.
The number of years with open tax audits varies depending on the tax jurisdiction. Our major taxing jurisdictions include the United States (federal and state) and Canada. Various tax examinations by United States state taxing authorities could be conducted for any open tax year, which vary by jurisdiction, but are generally from 3 to 5 years.
The IRS initiated its audit of our fiscal 2011 and fiscal 2012 tax years during fiscal 2013. Currently, several state examinations are in progress.
During fiscal 2013, the IRS concluded its field examination of our 2009 and 2010 tax years. The IRS has proposed adjustments related to the timing for deducting accrued bonus expenses. We believe our position is supported by substantial technical authority and have filed an appeal with the IRS Appeals Division. The audit closure and related proposed adjustments did not have a material impact on our current year results of operations or financial position. If we are unsuccessful in defending our position with respect to accrued bonuses, we will incur a one-time cash tax payment of approximately $80 million. As of May 26, 2013, we have effectively settled all issues with the IRS for fiscal years 2008 and prior.
Also during fiscal 2013, the California Court of Appeal issued an adverse decision concerning our state income tax apportionment calculations. We had previously
recorded a $12 million increase in our total liabilities for uncertain tax positions in fiscal 2011 following an unfavorable decision by the Superior Court of the State of California related to this matter. We expect to pay a majority of the tax due related to this issue in fiscal 2014.
The Canadian Revenue Agency (CRA) reviewed our Canadian income tax returns for fiscal years 2003 to 2005 and raised assessments for these years to which we have objected. During fiscal 2013, the issue related to our 2003 fiscal year was resolved with no adjustment. The issue for fiscal years 2004 and 2005 is currently under review by the U.S. and Canadian competent authority divisions. The CRA initiated its audit of our fiscal years 2008 through 2011 during fiscal year 2013. The CRA audit for fiscal 2008 was closed with no significant adjustments. The audit for fiscal years 2009 through 2011 is ongoing.
We do not anticipate that any United States or Canadian tax adjustments will have a significant impact on our financial position or results of operations.
As of May 26, 2013, our total liability for uncertain tax positions and accrued interest and penalties was $266 million. We expect to pay approximately $12 million related to uncertain tax positions and accrued interest in the next 12 months. We are not able to reasonably estimate the timing of future cash flows beyond 12 months due to uncertainties in the timing of tax audit outcomes.
Defined Benefit Pension, Other Postretirement and Postemployment Benefit Plans
Defined Benefit Pension Plans We have defined benefit pension plans covering most employees in the United States, Canada, France, and the United Kingdom. Benefits for salaried employees are based on length of service and final average compensation. Benefits for hourly employees include various monthly amounts for each year of credited service. Our funding policy is consistent with the requirements of applicable laws. We made $200 million of voluntary contributions to our principal U.S. plans in each of fiscal 2013 and fiscal 2012. We do not expect to be required to make any contributions in fiscal 2014. Our principal domestic retirement plan covering salaried employees has a provision that any excess pension assets would be allocated to active participants if the plan is terminated within five years of a change in control. In fiscal 2012, we announced changes to our U.S. defined benefit pension plans. All new salaried employees hired on or after June 1, 2013 are eligible for a new retirement program that does not include a
36 Healthy Growth Annual Report 2013 37
defined benefit pension plan. Current salaried employees remain in the existing defined benefit pension plan with adjustments to benefits.
Other Postretirement Benefit Plans We also sponsor plans that provide health care benefits to the majority of our retirees in the United States, Canada, and Brazil. The United States salaried health care benefit plan is contributory, with retiree contributions based on years of service. We make decisions to fund related trusts for certain employees and retirees on an annual basis. We did not make voluntary contributions to these plans in fiscal 2013. The Patient Protection and Affordable Care Act, as amended by the Health Care and Education Reconciliation Act of 2010 (collectively, the Act), was signed into law in March 2010. We continue to evaluate the effect of the Act, including its potential impact on the future cost of our benefit plans.
Postemployment Benefit Plans Under certain circumstances, we also provide accruable benefits to former or inactive employees in the United States, Canada, and Mexico, and members of our Board of Directors, including severance and certain other benefits payable upon death. We recognize an obligation for any of these benefits that vest or accumulate with service. Postemployment benefits that do not vest or accumulate with service (such as severance based solely on annual pay rather than years of service) are charged to expense when incurred. Our postemployment benefit plans are unfunded.
We recognize benefits provided during retirement or following employment over the plan participants’ active working life. Accordingly, we make various assumptions to predict and measure costs and obligations many years prior to the settlement of our obligations. Assumptions that require significant management judgment and have a material impact on the measurement of our net periodic benefit expense or income and accumulated benefit obligations include the long-term rates of return on plan assets, the interest rates used to discount the obligations for our benefit plans, and the health care cost trend rates.
Expected Rate of Return on Plan Assets Our expected rate of return on plan assets is determined by our asset allocation, our historical long-term investment performance, our estimate of future long-term returns by asset class (using input from our actuaries, investment services, and investment managers), and long-term
inflation assumptions. We review this assumption annually for each plan, however, our annual investment performance for one particular year does not, by itself, significantly influence our evaluation.
The investment objective for our defined benefit pension and other postretirement benefit plans is to secure the benefit obligations to participants at a reasonable cost to us. Our goal is to optimize the long-term return on plan assets at a moderate level of risk. The defined benefit pension plan and other postretirement benefit plan portfolios are broadly diversified across asset classes. Within asset classes, the portfolios are further diversified across investment styles and investment organizations. For the defined benefit pension plans, the long-term investment policy allocation is: 25 percent to equities in the United States; 15 percent to international equities; 10 percent to private equities; 35 percent to fixed income; and 15 percent to real assets (real estate, energy, and timber). For other postretirement benefit plans, the long-term investment policy allocations are: 30 percent to equities in the United States; 20 percent to international equities; 10 percent to private equities; 30 percent to fixed income; and 10 percent to real assets (real estate, energy, and timber). The actual allocations to these asset classes may vary tactically around the long-term policy allocations based on relative market valuations.
Our historical investment returns (compound annual growth rates) for our United States defined benefit pension and other postretirement plan assets were 16.5 percent, 4.5 percent, 9.5 percent, 7.9 percent, and 9.5 percent for the 1, 5, 10, 15, and 20 year periods ended May 26, 2013.
On a weighted-average basis, the expected rate of return for all defined benefit plans was 8.53 percent for fiscal 2013, 9.52 percent for fiscal 2012, and 9.53 percent for fiscal 2011. During fiscal 2012, we lowered our weighted-average expected rate of return on plan assets for our principal defined benefit pension and other postretirement plans in the United States to 8.6 percent due to generally lower expectations for long-term rates of return across our asset classes due to the recent global economic slowdown and our expectation of an extended time frame for recovery.
Lowering the expected long-term rate of return on assets by 100 basis points would increase our net pension and postretirement expense by $56 million for fiscal 2014. A market-related valuation basis is used to reduce year-to-year expense volatility. The market-related valuation recognizes certain investment gains or losses over a five-year period from the year in which they
38 Healthy Growth Annual Report 2013 39
occur. Investment gains or losses for this purpose are the difference between the expected return calculated using the market-related value of assets and the actual return based on the market-related value of assets. Our outside actuaries perform these calculations as part of our determination of annual expense or income.
Discount Rates Our discount rate assumptions are determined annually as of the last day of our fiscal year for our defined benefit pension, other postretirement, and postemployment benefit plan obligations. We also use the same discount rates to determine defined benefit pension, other postretirement, and postemployment benefit plan income and expense for the following fiscal year. We work with our outside actuaries to determine the timing and amount of expected future cash outflows to plan participants and, using the Aa Above Median corporate bond yield, to develop a forward interest rate curve, including a margin to that index based on our credit risk. This forward interest rate curve is applied to our expected future cash outflows to determine our discount rate assumptions.
Our weighted-average discount rates were as follows:
Defined Other Benefit Postretirement Postemployment Pension Benefit Benefit Plans Plans Plans
Obligations as of May 26, 2013, and fiscal 2014 expense 4.54% 4.50% 3.70%
Obligations as of May 27, 2012, and fiscal 2013 expense 4.85% 4.70% 3.86%
Fiscal 2012 expense 5.45% 5.35% 4.77%
Lowering the discount rates by 100 basis points would increase our net defined benefit pension, other postretirement, and postemployment benefit plan expense for fiscal 2014 by approximately $89 million. All obligation-related experience gains and losses are amortized using a straight-line method over the average remaining service period of active plan participants.
Health Care Cost Trend Rates We review our health care cost trend rates annually. Our review is based on data we collect about our health care claims experience and information provided by our actuaries. This information includes recent plan experience, plan design, overall industry experience and projections, and assumptions used by other similar organizations.
Our initial health care cost trend rate is adjusted as necessary to remain consistent with this review, recent experiences, and short-term expectations. Our initial health care cost trend rate assumption is 8.0 percent for all retirees at the end of fiscal 2013. Rates are graded down annually until the ultimate trend rate of 5.2 percent is reached in 2019 for all retirees. The trend rates are applicable for calculations only if the retirees’ benefits increase as a result of health care inflation. The ultimate trend rate is adjusted annually, as necessary, to approximate the current economic view on the rate of long-term inflation plus an appropriate health care cost premium. Assumed trend rates for health care costs have an important effect on the amounts reported for the other postretirement benefit plans.
A one percentage point change in the health care cost trend rate would have the following effects:
One One Percentage Percentage Point PointIn Millions Increase Decrease
Effect on the aggregate of the service and interest cost components in fiscal 2014 $ 5.2 $ (4.4)Effect on the other postretirement accumulated benefit obligation as of May 26, 2013 93.8 (82.9)
Any arising health care claims cost-related experience gain or loss is recognized in the calculation of expected future claims. Once recognized, experience gains and losses are amortized using a straight-line method over 15 years, resulting in at least the minimum amortization required being recorded.
Financial Statement Impact In fiscal 2013, we recorded net defined benefit pension, other postretirement, and postemployment benefit plan expense of $159 million compared to $106 million of expense in fiscal 2012 and $95 million of expense in fiscal 2011. As of May 26, 2013, we had cumulative unrecognized actuarial net losses of $1.6 billion on our defined benefit pension plans and $176 million on our postretirement and postemployment benefit plans, mainly as the result of liability increases from lower interest rates, partially offset by recent increases in the values of plan assets. These unrecognized actuarial net losses will result in increases in our future pension expense and increases in postretirement expense since they currently exceed the corridors defined by GAAP.
38 Healthy Growth Annual Report 2013 39
We use the 2013 IRS Static Mortality Table projected forward to our plans’ measurement dates to calculate the year-end defined benefit pension, other postretirement, and postemployment benefit obligations and annual expense.
Actual future net defined benefit pension, other postretirement, and postemployment benefit plan income or expense will depend on investment performance, changes in future discount rates, changes in health care cost trend rates, and other factors related to the populations participating in these plans.
The Patient Protection and Affordable Care Act, as amended by the Health Care and Education Reconciliation Act of 2010 (collectively, the Act), was signed into law in March 2010. The Act codifies health care reforms with staggered effective dates from 2010 to 2018 with many provisions in the Act requiring the issuance of additional guidance from various government agencies. Estimates of the future impacts of several of the Act’s provisions are incorporated into our postretirement benefit liability. Given the complexity of the Act, the extended time period over which the reforms will be implemented, and the unknown impact of future regulatory guidance, further financial impacts to our postretirement benefit liability and related future expense may occur.
RECENTLY ISSUED ACCOUNTING PRONOUNCEMENTS
In December 2011, the Financial Accounting Standards Board (FASB) issued new accounting disclosure requirements about the nature and exposure of offsetting arrangements related to financial and derivative instruments. The requirements are effective for fiscal years beginning after January 1, 2013, which for us is the first quarter of fiscal 2014. The requirements will not impact our results of operations or financial position.
In February 2013, the FASB issued new disclosure requirements for items reclassified out of accumulated other comprehensive income (AOCI). The requirements do not change the existing accounting and reporting for net income or other comprehensive income (OCI). The requirements are effective for annual reporting periods beginning after December 15, 2012, and interim periods within those annual periods, which for us is the first quarter of fiscal 2014. The requirements will not impact our results of operations or financial position.
CAUTIONARY STATEMENT RELEVANT TO FORWARD-LOOKING INFORMATION FOR THE PURPOSE OF “SAFE HARBOR” PROVISIONS OF THE PRIVATE SECURITIES LITIGATION REFORM ACT OF 1995
This report contains or incorporates by reference forward-looking statements within the meaning of the Private Securities Litigation Reform Act of 1995 that are based on our current expectations and assumptions. We also may make written or oral forward-looking statements, including statements contained in our filings with the SEC and in our reports to stockholders.
The words or phrases “will likely result,” “are expected to,” “will continue,” “is anticipated,” “estimate,” “plan,” “project,” or similar expressions identify “forward-looking statements” within the meaning of the Private Securities Litigation Reform Act of 1995. Such statements are subject to certain risks and uncertainties that could cause actual results to differ materially from historical results and those currently anticipated or projected. We wish to caution you not to place undue reliance on any such forward-looking statements.
In connection with the “safe harbor” provisions of the Private Securities Litigation Reform Act of 1995, we are identifying important factors that could affect our financial performance and could cause our actual results in future periods to differ materially from any current opinions or statements.
Our future results could be affected by a variety of factors, such as: competitive dynamics in the consumer foods industry and the markets for our products, including new product introductions, advertising activities, pricing actions, and promotional activities of our competitors; economic conditions, including changes in inflation rates, interest rates, tax rates, or the availability of capital; product development and innovation; consumer acceptance of new products and product improvements; consumer reaction to pricing actions and changes in promotion levels; acquisitions or dispositions of businesses or assets; changes in capital structure; changes in laws and regulations, including labeling and advertising regulations; impairments in the carrying value of goodwill, other intangible assets, or other long-lived assets, or changes in the useful lives of other intangible assets; changes in accounting standards and the impact of significant accounting estimates; product quality and safety issues, including recalls and product liability; changes in consumer demand for our products; effectiveness of advertising, marketing, and promotional programs; changes in consumer behavior,
40 Healthy Growth Annual Report 2013 41
trends, and preferences, including weight loss trends; consumer perception of health-related issues, including obesity; consolidation in the retail environment; changes in purchasing and inventory levels of significant customers; fluctuations in the cost and availability of supply chain resources, including raw materials, packaging, and energy; disruptions or inefficiencies in the supply chain; volatility in the market value of derivatives used to manage price risk for certain commodities; benefit plan expenses due to changes in plan asset values and discount rates used to determine plan liabilities; failure or breach of our information technology systems;
foreign economic conditions, including currency rate fluctuations; and political unrest in foreign markets and economic uncertainty due to terrorism or war.
You should also consider the risk factors that we identify in Item 1A of our 2013 Form 10-K, which could also affect our future results.
We undertake no obligation to publicly revise any forward-looking statements to reflect events or circumstances after the date of those statements or to reflect the occurrence of anticipated or unanticipated events.
40 Healthy Growth Annual Report 2013 41
Quantitative and Qualitative Disclosures About Market Risk We are exposed to market risk stemming from changes in interest and foreign exchange rates and commodity and equity prices. Changes in these factors could cause fluctuations in our earnings and cash flows. In the normal course of business, we actively manage our exposure to these market risks by entering into various hedging transactions, authorized under established policies that place clear controls on these activities. The counterparties in these transactions are generally highly rated institutions. We establish credit limits for each counterparty. Our hedging transactions include but are not limited to a variety of derivative financial instruments.
INTEREST RATE RISK
We are exposed to interest rate volatility with regard to future issuances of fixed-rate debt, and existing and future issuances of floating-rate debt. Primary exposures include U.S. Treasury rates, LIBOR, Euribor, and commercial paper rates in the United States and Europe. We use interest rate swaps, forward-starting interest rate swaps, and treasury locks to hedge our exposure to interest rate changes, to reduce the volatility of our financing costs, and to achieve a desired proportion of fixed versus floating-rate debt, based on current and projected market conditions. Generally under these swaps, we agree with a counterparty to exchange the difference between fixed-rate and floating-rate interest amounts based on an agreed upon notional principal amount.
As of May 26, 2013, we had interest rate swaps with $550 million of aggregate notional principal amount outstanding, all of which converts fixed-rate notes to floating-rate notes. In advance of a planned debt refinancing, we had $250 million net notional amount of treasury locks as of May 26, 2013.
FOREIGN EXCHANGE RISK
Foreign currency fluctuations affect our net investments in foreign subsidiaries and foreign currency cash flows related to third party purchases, intercompany loans, product shipments, and foreign-denominated commercial paper. We are also exposed to the translation of foreign currency earnings to the U.S. dollar. Our principal exposures are to the Australian dollar, Brazilian real, British pound sterling, Canadian
dollar, Chinese renminbi, euro, Japanese yen, Mexican peso, and Swiss franc. We mainly use foreign currency forward contracts to selectively hedge our foreign currency cash flow exposures. We also generally swap our foreign-denominated commercial paper borrowings and nonfunctional currency intercompany loans back to U.S. dollars or the functional currency of the entity with foreign exchange exposure; the gains or losses on these derivatives offset the foreign currency revaluation gains or losses recorded in earnings on the associated borrowings. We generally do not hedge more than 18 months forward.
We also have many net investments in foreign subsidiaries that are denominated in euros. We previously hedged a portion of these net investments by issuing euro-denominated commercial paper and foreign exchange forward contracts. As of May 26, 2013, we had deferred net foreign currency transaction losses of $96 million in AOCI associated with hedging activity.
COMMODITY PRICE RISK
Many commodities we use in the production and distribution of our products are exposed to market price risks. We utilize derivatives to manage price risk for our principal ingredients and energy costs, including grains (oats, wheat, and corn), oils (principally soybean), non-fat dry milk, natural gas, and diesel fuel. Our primary objective when entering into these derivative contracts is to achieve certainty with regard to the future price of commodities purchased for use in our supply chain. We manage our exposures through a combination of purchase orders, long-term contracts with suppliers, exchange-traded futures and options, and over-the-counter options and swaps. We offset our exposures based on current and projected market conditions and generally seek to acquire the inputs at as close to our planned cost as possible.
As of May 26, 2013, the net notional value of commodity derivatives was $526 million, of which $297 million related to agricultural inputs and $229 million related to energy inputs. These contracts relate to inputs that generally will be utilized within the next 12 months.
EQUITY INSTRUMENTS
Equity price movements affect our compensation expense as certain investments made by our employees in our deferred compensation plan are revalued. We use equity swaps to manage this risk. As of May 26, 2013, the net notional amount of our equity swaps was $57 million.
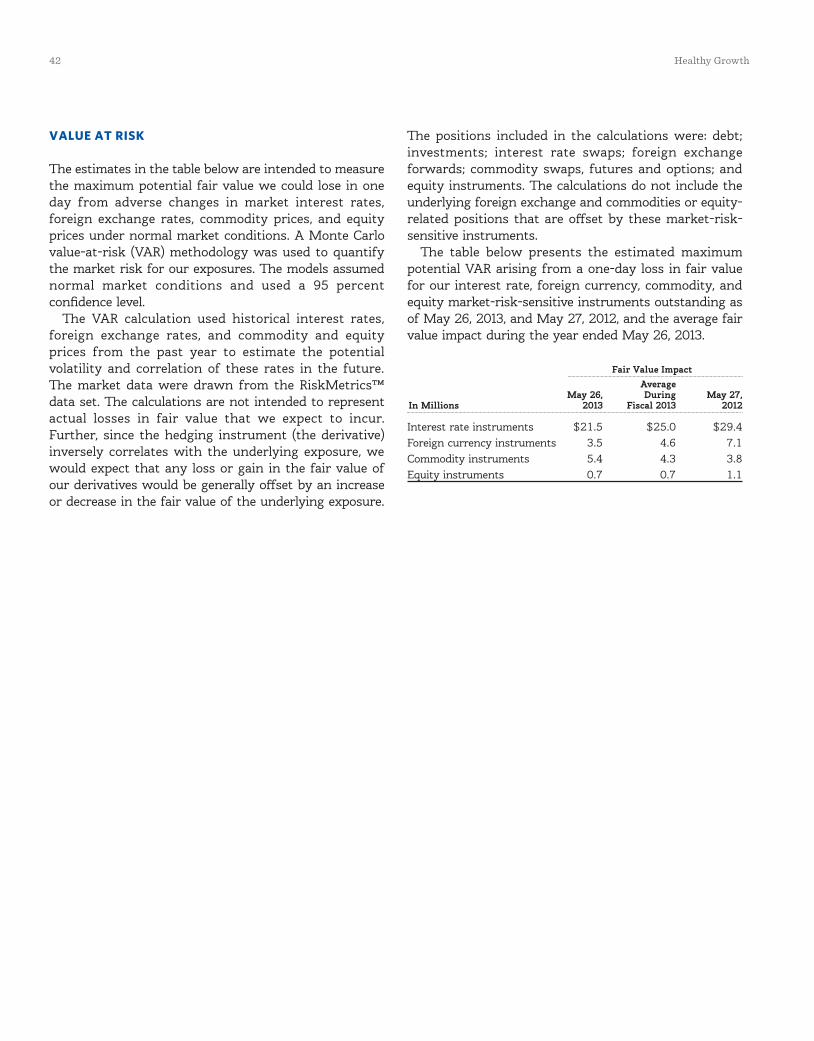
42 Healthy Growth Annual Report 2013 43
VALUE AT RISK
The estimates in the table below are intended to measure the maximum potential fair value we could lose in one day from adverse changes in market interest rates, foreign exchange rates, commodity prices, and equity prices under normal market conditions. A Monte Carlo value-at-risk (VAR) methodology was used to quantify the market risk for our exposures. The models assumed normal market conditions and used a 95 percent confidence level.
The VAR calculation used historical interest rates, foreign exchange rates, and commodity and equity prices from the past year to estimate the potential volatility and correlation of these rates in the future. The market data were drawn from the RiskMetrics™ data set. The calculations are not intended to represent actual losses in fair value that we expect to incur. Further, since the hedging instrument (the derivative) inversely correlates with the underlying exposure, we would expect that any loss or gain in the fair value of our derivatives would be generally offset by an increase or decrease in the fair value of the underlying exposure.
The positions included in the calculations were: debt; investments; interest rate swaps; foreign exchange forwards; commodity swaps, futures and options; and equity instruments. The calculations do not include the underlying foreign exchange and commodities or equity-related positions that are offset by these market-risk-sensitive instruments.
The table below presents the estimated maximum potential VAR arising from a one-day loss in fair value for our interest rate, foreign currency, commodity, and equity market-risk-sensitive instruments outstanding as of May 26, 2013, and May 27, 2012, and the average fair value impact during the year ended May 26, 2013.
Fair Value Impact Average May 26, During May 27,In Millions 2013 Fiscal 2013 2012
Interest rate instruments $21.5 $25.0 $29.4 Foreign currency instruments 3.5 4.6 7.1 Commodity instruments 5.4 4.3 3.8 Equity instruments 0.7 0.7 1.1
42 Healthy Growth Annual Report 2013 43
REPORT OF MANAGEMENT RESPONSIBILITIES
The management of General Mills, Inc. is responsible for the fairness and accuracy of the consolidated financial statements. The statements have been prepared in accordance with accounting principles that are generally accepted in the United States, using management’s best estimates and judgments where appropriate. The financial information throughout the Annual Report on Form 10-K is consistent with our consolidated financial statements.
Management has established a system of internal controls that provides reasonable assurance that assets are adequately safeguarded and transactions are recorded accurately in all material respects, in accordance with management’s authorization. We maintain a strong audit program that independently evaluates the adequacy and effectiveness of internal controls. Our internal controls provide for appropriate separation of duties and responsibilities, and there are documented policies regarding use of our assets and proper financial reporting. These formally stated and regularly communicated policies demand highly ethical conduct from all employees.
The Audit Committee of the Board of Directors meets regularly with management, internal auditors, and our independent registered public accounting firm to review internal control, auditing, and financial reporting matters. The independent registered public accounting firm, internal auditors, and employees have full and free access to the Audit Committee at any time.
The Audit Committee reviewed and approved the Company’s annual financial statements. The Audit Committee recommended, and the Board of Directors approved, that the consolidated financial statements be included in the Annual Report. The Audit Committee also appointed KPMG LLP to serve as the Company’s independent registered public accounting firm for fiscal 2014, subject to ratification by the stockholders at the annual meeting.
K. J. Powell D. L. Mulligan Chairman of the Board Executive Vice President and Chief Executive Officer and Chief Financial
Officer July 3, 2013
REPORT OF INdEPENdENT REGISTEREd PuBLIc AccOuNTING FIRM
The Board of Directors and Stockholders General Mills, Inc.:
We have audited the accompanying consolidated balance sheets of General Mills, Inc. and subsidiaries as of May 26, 2013 and May 27, 2012, and the related consolidated statements of earnings, comprehensive income, total equity and redeemable interest, and cash flows for each of the fiscal years in the three-year period ended May 26, 2013. In connection with our audits of the consolidated financial statements, we have audited the accompanying financial statement schedule. We also have audited General Mills, Inc.’s internal control over financial reporting as of May 26, 2013, based on criteria established in Internal Control – Integrated Framework (1992) issued by the Committee of Sponsoring Organizations of the Treadway Commission (COSO). General Mills, Inc.’s management is responsible for these consolidated financial statements and financial statement schedule, for maintaining effective internal control over financial reporting, and for its assessment of the effectiveness of internal control over financial reporting, included in Management’s Report on Internal Control over Financial Reporting. Our responsibility is to express an opinion on these consolidated financial statements and financial statement schedule and an opinion on the Company’s internal control over financial reporting based on our audits.
We conducted our audits in accordance with the standards of the Public Company Accounting Oversight Board (United States). Those standards require that we plan and perform the audits to obtain reasonable assurance about whether the financial statements are free of material misstatement and whether effective internal control over financial reporting was maintained in all material respects. Our audits of the consolidated financial statements included examining, on a test basis, evidence supporting the amounts and disclosures in the financial statements, assessing the accounting principles used and significant estimates made by management, and evaluating the overall financial statement presentation. Our audit of internal control over financial reporting included obtaining an understanding of internal control over financial reporting, assessing the risk that a material
Reports of Management and Independent Registered Public Accounting Firm
44 Healthy Growth Annual Report 2013 PB
weakness exists, and testing and evaluating the design and operating effectiveness of internal control based on the assessed risk. Our audits also included performing such other procedures as we considered necessary in the circumstances. We believe that our audits provide a reasonable basis for our opinions.
A company’s internal control over financial reporting is a process designed to provide reasonable assurance regarding the reliability of financial reporting and the preparation of financial statements for external purposes in accordance with generally accepted accounting principles. A company’s internal control over financial reporting includes those policies and procedures that (1) pertain to the maintenance of records that, in reasonable detail, accurately and fairly reflect the transactions and dispositions of the assets of the company; (2) provide reasonable assurance that transactions are recorded as necessary to permit preparation of financial statements in accordance with generally accepted accounting principles, and that receipts and expenditures of the company are being made only in accordance with authorizations of management and directors of the company; and (3) provide reasonable assurance regarding prevention or timely detection of unauthorized acquisition, use, or disposition of the company’s assets that could have a material effect on the financial statements.
Because of its inherent limitations, internal control over financial reporting may not prevent or detect misstatements. Also, projections of any evaluation of
effectiveness to future periods are subject to the risk that controls may become inadequate because of changes in conditions, or that the degree of compliance with the policies or procedures may deteriorate.
In our opinion, the consolidated financial statements referred to above present fairly, in all material respects, the financial position of General Mills, Inc. and subsidiar-ies as of May 26, 2013 and May 27, 2012, and the results of their operations and their cash flows for each of the fiscal years in the three-year period ended May 26, 2013, in conformity with U.S. generally accepted accounting principles. Also in our opinion, the accompanying finan-cial statement schedule, when considered in relation to the basic consolidated financial statements taken as a whole, presents fairly, in all material respects, the infor-mation set forth therein. Also in our opinion, General Mills, Inc. maintained, in all material respects, effective internal control over financial reporting as of May 26, 2013, based on criteria established in Internal Control – Integrated Framework (1992) issued by the Committee of Sponsoring Organizations of the Treadway Commission.
Minneapolis, MinnesotaJuly 3, 2013
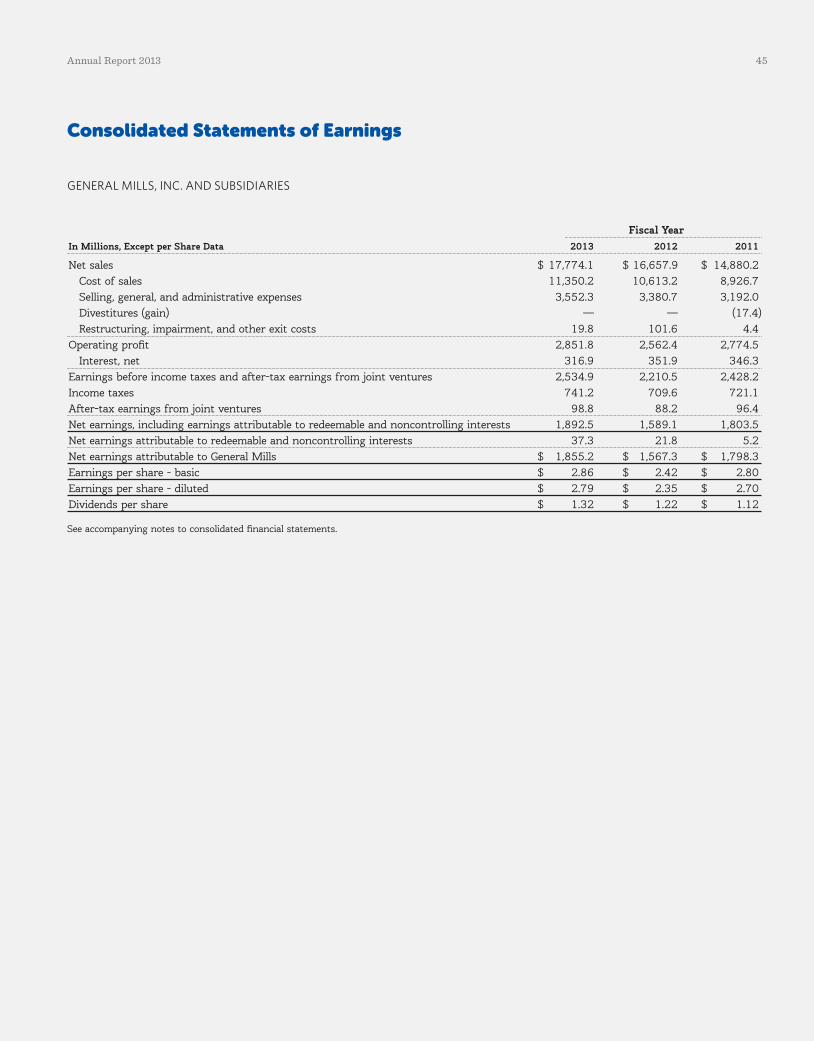
Annual Report 2013 45
Fiscal YearIn Millions, Except per Share Data 2013 2012 2011
Net sales $ 17,774.1 $ 16,657.9 $ 14,880.2 Cost of sales 11,350.2 10,613.2 8,926.7 Selling, general, and administrative expenses 3,552.3 3,380.7 3,192.0 Divestitures (gain) — — (17.4) Restructuring, impairment, and other exit costs 19.8 101.6 4.4 Operating profit 2,851.8 2,562.4 2,774.5 Interest, net 316.9 351.9 346.3 Earnings before income taxes and after-tax earnings from joint ventures 2,534.9 2,210.5 2,428.2 Income taxes 741.2 709.6 721.1 After-tax earnings from joint ventures 98.8 88.2 96.4 Net earnings, including earnings attributable to redeemable and noncontrolling interests 1,892.5 1,589.1 1,803.5 Net earnings attributable to redeemable and noncontrolling interests 37.3 21.8 5.2 Net earnings attributable to General Mills $ 1,855.2 $ 1,567.3 $ 1,798.3 Earnings per share - basic $ 2.86 $ 2.42 $ 2.80 Earnings per share - diluted $ 2.79 $ 2.35 $ 2.70Dividends per share $ 1.32 $ 1.22 $ 1.12
See accompanying notes to consolidated financial statements.
Consolidated Statements of Earnings
GENERAL MILLS, INC. AND SUBSIDIARIES
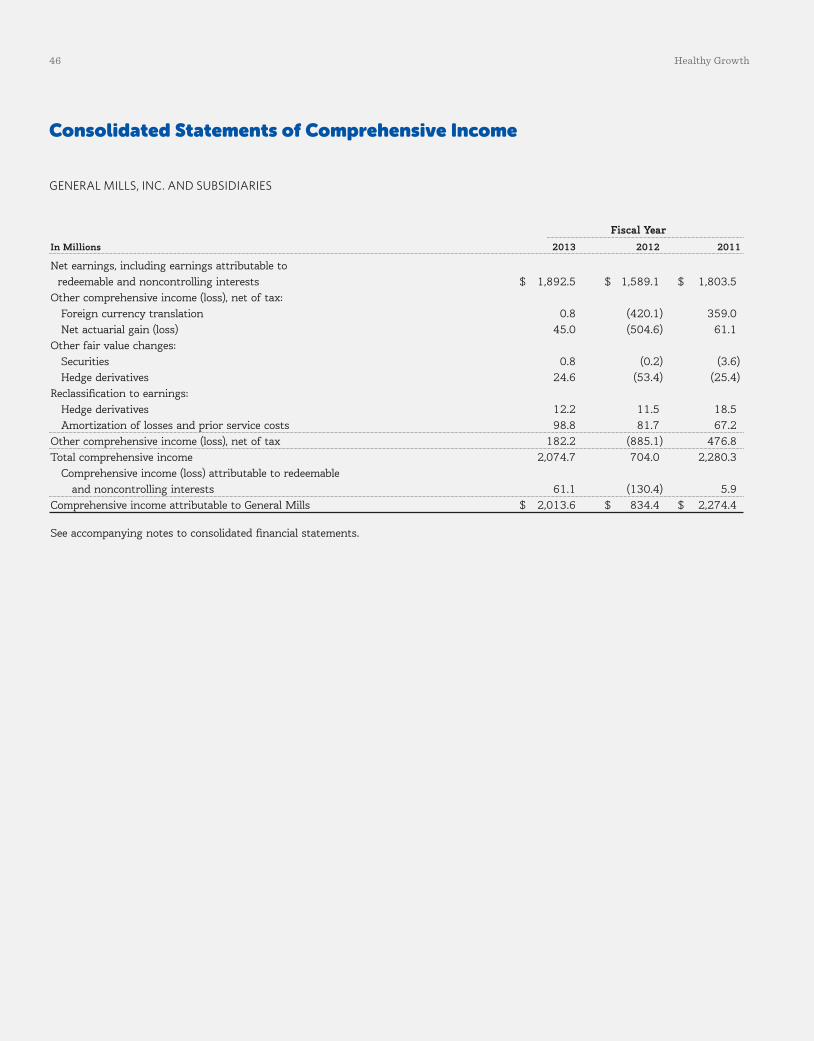
46 Healthy Growth46 Healthy Growth
Fiscal YearIn Millions 2013 2012 2011
Net earnings, including earnings attributable to redeemable and noncontrolling interests $ 1,892.5 $ 1,589.1 $ 1,803.5 Other comprehensive income (loss), net of tax: Foreign currency translation 0.8 (420.1) 359.0 Net actuarial gain (loss) 45.0 (504.6) 61.1 Other fair value changes: Securities 0.8 (0.2) (3.6) Hedge derivatives 24.6 (53.4) (25.4)Reclassification to earnings: Hedge derivatives 12.2 11.5 18.5 Amortization of losses and prior service costs 98.8 81.7 67.2 Other comprehensive income (loss), net of tax 182.2 (885.1) 476.8 Total comprehensive income 2,074.7 704.0 2,280.3 Comprehensive income (loss) attributable to redeemable and noncontrolling interests 61.1 (130.4) 5.9 Comprehensive income attributable to General Mills $ 2,013.6 $ 834.4 $ 2,274.4
See accompanying notes to consolidated financial statements.
Consolidated Statements of Comprehensive Income
GENERAL MILLS, INC. AND SUBSIDIARIES
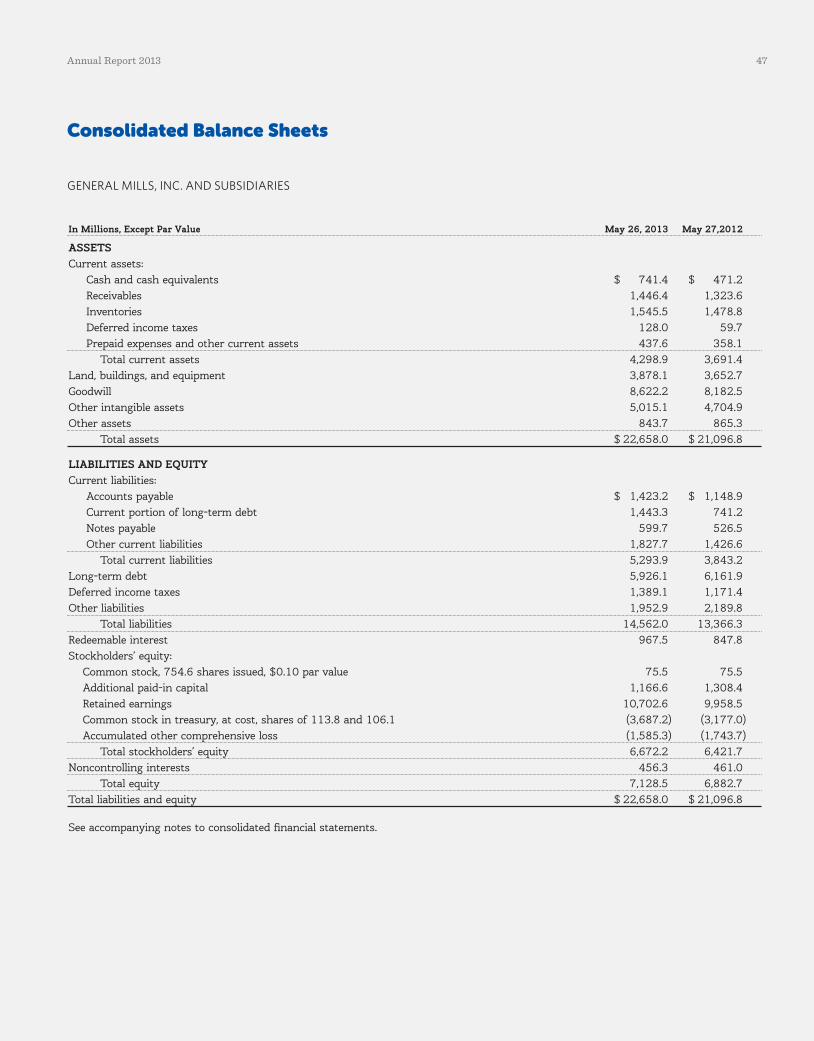
Annual Report 2013 47
Consolidated Balance Sheets
GENERAL MILLS, INC. AND SUBSIDIARIES
In Millions, Except Par Value May 26, 2013 May 27,2012
ASSETS Current assets: Cash and cash equivalents $ 741.4 $ 471.2 Receivables 1,446.4 1,323.6 Inventories 1,545.5 1,478.8 Deferred income taxes 128.0 59.7 Prepaid expenses and other current assets 437.6 358.1 Total current assets 4,298.9 3,691.4 Land, buildings, and equipment 3,878.1 3,652.7 Goodwill 8,622.2 8,182.5 Other intangible assets 5,015.1 4,704.9 Other assets 843.7 865.3 Total assets $ 22,658.0 $ 21,096.8
LIABILITIES AND EQUITY Current liabilities: Accounts payable $ 1,423.2 $ 1,148.9 Current portion of long-term debt 1,443.3 741.2 Notes payable 599.7 526.5 Other current liabilities 1,827.7 1,426.6 Total current liabilities 5,293.9 3,843.2 Long-term debt 5,926.1 6,161.9 Deferred income taxes 1,389.1 1,171.4 Other liabilities 1,952.9 2,189.8 Total liabilities 14,562.0 13,366.3 Redeemable interest 967.5 847.8 Stockholders’ equity: Common stock, 754.6 shares issued, $0.10 par value 75.5 75.5 Additional paid-in capital 1,166.6 1,308.4 Retained earnings 10,702.6 9,958.5 Common stock in treasury, at cost, shares of 113.8 and 106.1 (3,687.2) (3,177.0) Accumulated other comprehensive loss (1,585.3) (1,743.7) Total stockholders’ equity 6,672.2 6,421.7 Noncontrolling interests 456.3 461.0 Total equity 7,128.5 6,882.7 Total liabilities and equity $ 22,658.0 $ 21,096.8
See accompanying notes to consolidated financial statements.

48 Healthy Growth48 Healthy Growth
Consolidated Statements of Total Equity and Redeemable Interest
GENERAL MILLS, INC. AND SUBSIDIARIES
$.10 Par Value Common Stock (One Billion Shares Authorized) Issued Treasury
Accumulated Additional Other Par Paid-In Retained Comprehensive Noncontrolling Total RedeemableIn Millions, Except per Share Data Shares Amount Capital Shares Amount Earnings Income (Loss) Interests Equity Interest
Balance as of May 30, 2010 754.6 $75.5 $1,307.1 (98.1) $(2,615.2) $8,122.4 $(1,486.9) $245.1 $5,648.0 Total comprehensive income 1,798.3 476.1 5.9 2,280.3 Cash dividends declared ($1.12 per share) (729.4) (729.4) Shares purchased (31.8) (1,163.5) (1,163.5) Stock compensation plans (includes income tax benefits of $106.2) (22.2) 20.1 568.4 546.2 Unearned compensation related to restricted stock unit awards (70.4) (70.4) Earned compensation 105.3 105.3 Distributions to noncontrolling interest holders (4.3) (4.3) Balance as of May 29, 2011 754.6 $75.5 $1,319.8 (109.8) $(3,210.3) $9,191.3 $(1,010.8) $246.7 $6,612.2 Total comprehensive income (loss) 1,567.3 (732.9) (44.3) 790.1 (86.1)Cash dividends declared ($1.22 per share) (800.1) (800.1) Shares purchased (8.3) (313.0) (313.0) Stock compensation plans (includes income tax benefits of $63.1) 3.2 12.0 346.3 349.5 Unearned compensation related to restricted stock unit awards (93.4) (93.4) Earned compensation 108.3 108.3 Addition of redeemable and noncontrolling interest from acquisitions 263.8 263.8 904.4 Increase in redemption value of redeemable interest (29.5) (29.5) 29.5 Distributions to noncontrolling interest holders (5.2) (5.2) Balance as of May 27, 2012 754.6 $75.5 $1,308.4 (106.1) $(3,177.0) $9,958.5 $(1,743.7) $461.0 $6,882.7 $847.8 Total comprehensive income 1,855.2 158.4 18.3 2,031.9 42.8 Cash dividends declared ($1.70 per share) (1,111.1) (1,111.1) Shares purchased (30.0) (24.2) (1,014.9) (1,044.9) Stock compensation plans (includes income tax benefits of $103.0) (38.6) 16.5 504.7 466.1 Unearned compensation related to restricted stock unit awards (80.5) (80.5) Earned compensation 100.4 100.4 Increase in redemption value of redeemable interest (93.1) (93.1) 93.1 Distributions to redeemable and noncontrolling interest holders (23.0) (23.0) (16.2)Balance as of May 26, 2013 754.6 $75.5 $1,166.6 (113.8) $(3,687.2) $10,702.6 $(1,585.3) $456.3 $7,128.5 $967.5
See accompanying notes to consolidated financial statements.
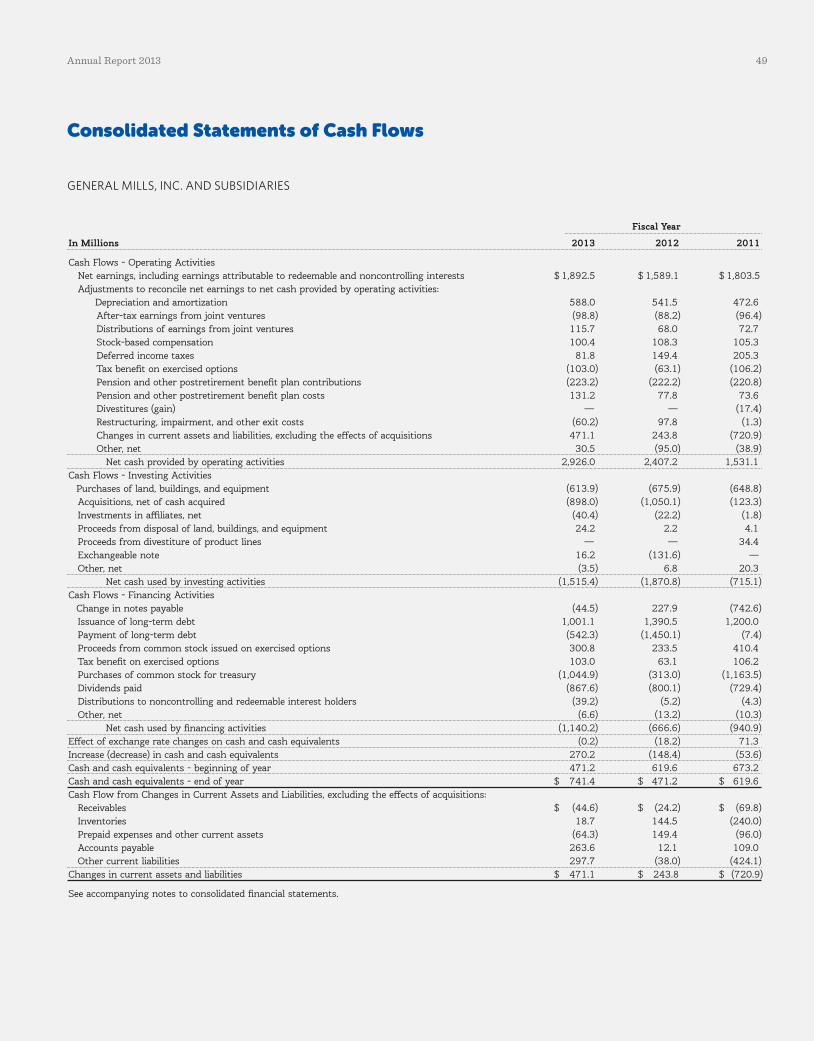
Annual Report 2013 49
Consolidated Statements of Cash Flows
GENERAL MILLS, INC. AND SUBSIDIARIES
Fiscal Year
In Millions 2013 2012 2011
Cash Flows - Operating Activities Net earnings, including earnings attributable to redeemable and noncontrolling interests $ 1,892.5 $ 1,589.1 $ 1,803.5 Adjustments to reconcile net earnings to net cash provided by operating activities: Depreciation and amortization 588.0 541.5 472.6 After-tax earnings from joint ventures (98.8) (88.2) (96.4) Distributions of earnings from joint ventures 115.7 68.0 72.7 Stock-based compensation 100.4 108.3 105.3 Deferred income taxes 81.8 149.4 205.3 Tax benefit on exercised options (103.0) (63.1) (106.2) Pension and other postretirement benefit plan contributions (223.2) (222.2) (220.8) Pension and other postretirement benefit plan costs 131.2 77.8 73.6 Divestitures (gain) — — (17.4) Restructuring, impairment, and other exit costs (60.2) 97.8 (1.3) Changes in current assets and liabilities, excluding the effects of acquisitions 471.1 243.8 (720.9) Other, net 30.5 (95.0) (38.9) Net cash provided by operating activities 2,926.0 2,407.2 1,531.1 Cash Flows - Investing Activities Purchases of land, buildings, and equipment (613.9) (675.9) (648.8) Acquisitions, net of cash acquired (898.0) (1,050.1) (123.3) Investments in affiliates, net (40.4) (22.2) (1.8) Proceeds from disposal of land, buildings, and equipment 24.2 2.2 4.1 Proceeds from divestiture of product lines — — 34.4 Exchangeable note 16.2 (131.6) — Other, net (3.5) 6.8 20.3 Net cash used by investing activities (1,515.4) (1,870.8) (715.1)Cash Flows - Financing Activities Change in notes payable (44.5) 227.9 (742.6) Issuance of long-term debt 1,001.1 1,390.5 1,200.0 Payment of long-term debt (542.3) (1,450.1) (7.4) Proceeds from common stock issued on exercised options 300.8 233.5 410.4 Tax benefit on exercised options 103.0 63.1 106.2 Purchases of common stock for treasury (1,044.9) (313.0) (1,163.5) Dividends paid (867.6) (800.1) (729.4) Distributions to noncontrolling and redeemable interest holders (39.2) (5.2) (4.3) Other, net (6.6) (13.2) (10.3) Net cash used by financing activities (1,140.2) (666.6) (940.9)Effect of exchange rate changes on cash and cash equivalents (0.2) (18.2) 71.3 Increase (decrease) in cash and cash equivalents 270.2 (148.4) (53.6)Cash and cash equivalents - beginning of year 471.2 619.6 673.2 Cash and cash equivalents - end of year $ 741.4 $ 471.2 $ 619.6 Cash Flow from Changes in Current Assets and Liabilities, excluding the effects of acquisitions: Receivables $ (44.6) $ (24.2) $ (69.8) Inventories 18.7 144.5 (240.0) Prepaid expenses and other current assets (64.3) 149.4 (96.0) Accounts payable 263.6 12.1 109.0 Other current liabilities 297.7 (38.0) (424.1)Changes in current assets and liabilities $ 471.1 $ 243.8 $ (720.9)
See accompanying notes to consolidated financial statements.
50 Healthy Growth
Notes to Consolidated Financial Statements
GENERAL MILLS, INC. AND SUBSIDIARIES
NOTE 1. BASIS OF PRESENTATION AND RECLASSIFICATIONS
Basis of Presentation Our Consolidated Financial Statements include the accounts of General Mills, Inc. and all subsidiaries in which we have a control-ling financial interest. Intercompany transactions and accounts, including any noncontrolling and redeemable interests’ share of those transactions, are eliminated in consolidation.
Our fiscal year ends on the last Sunday in May. Fiscal years 2013, 2012 and 2011 each consisted of 52 weeks.
Change in Reporting Period As part of a long-term plan to conform the fiscal year ends of all our operations, we have changed the reporting period of certain countries within our International segment from an April fiscal year end to a May fiscal year end to match our fiscal calendar. Accordingly, in the year of change, our results include 13 months of results from the affected opera-tions compared to 12 months in previous fiscal years. We changed the reporting period for our operations in Europe and Australia in fiscal 2013, and we changed the reporting period for our operations in China in fis-cal 2012. The impact of these changes was not material to our consolidated results of operations and, therefore, we did not restate prior period financial statements for comparability. Our Yoplait S.A.S., Yoplait Marques S.A.S., Yoki Alimentos S.A. (Yoki), and India businesses remain on an April fiscal year end.
Certain reclassifications to our previously reported financial information have been made to conform to the current period presentation.
NOTE 2. SUMMARY OF SIGNIFICANT ACCOUNTING POLICIES
Cash and Cash Equivalents We consider all invest-ments purchased with an original maturity of three months or less to be cash equivalents.
Inventories All inventories in the United States other than grain are valued at the lower of cost, using the last-in, first-out (LIFO) method, or market. Grain
inventories and all related cash contracts and derivatives are valued at market with all net changes in value recorded in earnings currently.
Inventories outside of the United States are generally valued at the lower of cost, using the first-in, first-out (FIFO) method, or market.
Shipping costs associated with the distribution of finished product to our customers are recorded as cost of sales, and are recognized when the related finished product is shipped to and accepted by the customer.
Land, Buildings, Equipment, and Depreciation Land is recorded at historical cost. Buildings and equipment, including capitalized interest and internal engineer-ing costs, are recorded at cost and depreciated over estimated useful lives, primarily using the straight-line method. Ordinary maintenance and repairs are charged to cost of sales. Buildings are usually depreciated over 40 to 50 years, and equipment, furniture, and software are usually depreciated over 3 to 10 years. Fully depreciated assets are retained in buildings and equipment until dis-posal. When an item is sold or retired, the accounts are relieved of its cost and related accumulated depreciation and the resulting gains and losses, if any, are recognized in earnings. As of May 26, 2013, assets held for sale were insignificant.
Long-lived assets are reviewed for impairment when-ever events or changes in circumstances indicate that the carrying amount of an asset (or asset group) may not be recoverable. An impairment loss would be recog-nized when estimated undiscounted future cash flows from the operation and disposition of the asset group are less than the carrying amount of the asset group. Asset groups have identifiable cash flows and are largely independent of other asset groups. Measurement of an impairment loss would be based on the excess of the car-rying amount of the asset group over its fair value. Fair value is measured using a discounted cash flow model or independent appraisals, as appropriate.
Goodwill and Other Intangible Assets Goodwill is not subject to amortization and is tested for impairment annually and whenever events or changes in circumstances indicate that impairment may have
Annual Report 2013 51
occurred. Impairment testing is performed for each of our reporting units. We compare the carrying value of a reporting unit, including goodwill, to the fair value of the unit. Carrying value is based on the assets and liabilities associated with the operations of that reporting unit, which often requires allocation of shared or corporate items among reporting units. If the carrying amount of a reporting unit exceeds its fair value, we revalue all assets and liabilities of the reporting unit, excluding goodwill, to determine if the fair value of the net assets is greater than the net assets including goodwill. If the fair value of the net assets is less than the carrying amount of net assets including goodwill, impairment has occurred. Our estimates of fair value are determined based on a discounted cash flow model. Growth rates for sales and profits are determined using inputs from our annual long-range planning process. We also make estimates of discount rates, perpetuity growth assumptions, market comparables, and other factors. We performed our fiscal 2013 assessment as of November 26, 2012, and determined there was no impairment of goodwill for any of our reporting units as their related fair values were substantially in excess of their carrying values.
We evaluate the useful lives of our other intangible assets, mainly brands, to determine if they are finite or indefinite-lived. Reaching a determination on useful life requires significant judgments and assumptions regard-ing the future effects of obsolescence, demand, compe-tition, other economic factors (such as the stability of the industry, known technological advances, legislative action that results in an uncertain or changing regula-tory environment, and expected changes in distribution channels), the level of required maintenance expendi-tures, and the expected lives of other related groups of assets. Intangible assets that are deemed to have definite lives are amortized on a straight-line basis, over their useful lives, generally ranging from 4 to 30 years.
Our indefinite-lived intangible assets, mainly intan-gible assets primarily associated with the Pillsbury, Totino’s, Progresso, Green Giant, Yoplait, Old El Paso, Yoki, and Häagen-Dazs brands, are also tested for impairment annually and whenever events or changes in circumstances indicate that their carrying value may not be recoverable. We performed our fiscal 2013 assess-ment of our brand intangibles as of November 26, 2012. Our estimate of the fair value of the brands was based on a discounted cash flow model using inputs which included projected revenues from our annual long-range plan, assumed royalty rates that could be payable if we did not own the brands, and a discount rate. As of our
assessment date, there was no impairment of any of our indefinite-lived intangible assets as their related fair val-ues were substantially in excess of the carrying values.
Our finite-lived intangible assets, primarily acquired franchise agreements and customer relationships, are reviewed for impairment whenever events or changes in circumstances indicate that the carrying amount of an asset may not be recoverable. An impairment loss would be recognized when estimated undiscounted future cash flows from the operation and disposition of the asset are less than the carrying amount of the asset. Assets generally have identifiable cash flows and are largely independent of other assets. Measurement of an impair-ment loss would be based on the excess of the carry-ing amount of the asset over its fair value. Fair value is measured using a discounted cash flow model or other similar valuation model, as appropriate.
Investments in Joint Ventures Our investments in companies over which we have the ability to exercise significant influence are stated at cost plus our share of undistributed earnings or losses. We receive roy-alty income from certain joint ventures, incur various expenses (primarily research and development), and record the tax impact of certain joint venture opera-tions that are structured as partnerships. In addition, we make advances to our joint ventures in the form of loans or capital investments. We also sell certain raw materi-als, semi-finished goods, and finished goods to the joint ventures, generally at market prices.
In addition, we assess our investments in our joint ventures if we have reason to believe an impairment may have occurred including, but not limited to, ongoing operating losses, projected decreases in earnings, increases in the weighted average cost of capital or significant business disruptions. The significant assumptions used to estimate fair value include revenue growth and profitability, royalty rates, capital spending, depreciation and taxes, foreign currency exchange rates and a discount rate. By their nature, these projections and assumptions are uncertain. If we were to determine the current fair value of our investment was less than the carrying value of the investment, then we would assess if the shortfall was of a temporary or permanent nature and write down the investment to its fair value if we concluded the impairment is other than temporary.
Redeemable Interest On July 1, 2011, we acquired a 51 percent controlling interest in Yoplait S.A.S., a consolidated entity. Sodiaal International (Sodiaal) holds
52 Healthy Growth
the remaining 49 percent interest in Yoplait S.A.S. Sodiaal has the ability to put a limited portion of its redeemable interest to us at fair value once per year up to a maximum of 9 years. This put option requires us to classify Sodiaal’s interest as a redeemable interest outside of equity on our Consolidated Balance Sheets for as long as the put is exercisable by Sodiaal. When the put is no longer exercisable, the redeemable interest will be reclassified to noncontrolling interests on our Consolidated Balance Sheets. We adjust the value of the redeemable interest through additional paid-in capital on our Consolidated Balance Sheets quarterly to the redeemable interest’s redemption value, which approximates its fair value. During the third quarter of fiscal 2013, we adjusted the redeemable interest’s redemption value based on a discounted cash flow model. The significant assumptions used to estimate the redemption value include projected revenue growth and profitability from our long range plan, capital spending, depreciation and taxes, foreign currency rates, and a discount rate.
Variable Interest Entities As of May 26, 2013, we had invested in four variable interest entities (VIEs). None of our VIEs are material to our results of operations, finan-cial condition, or liquidity as of and for the year ended May 26, 2013. We determined whether or not we were the primary beneficiary (PB) of each VIE using a qualita-tive assessment that considered the VIE’s purpose and design, the involvement of each of the interest holders, and the risks and benefits of the VIE. We are the PB of three of the VIEs. We provided minimal financial or other support to our VIEs during fiscal 2013, and there are no arrangements related to VIEs that would require us to provide significant financial support in the future.
Revenue Recognition We recognize sales revenue when the shipment is accepted by our customer. Sales include shipping and handling charges billed to the customer and are reported net of consumer coupon redemption, trade promotion and other costs, including estimated allowances for returns, unsalable product, and prompt pay discounts. Sales, use, value-added, and other excise taxes are not recognized in revenue. Coupons are recorded when distributed, based on estimated redemption rates. Trade promotions are recorded based on estimated participation and performance levels for offered programs at the time of sale. We generally do not allow a right of return. However, on a limited case-by-case basis with prior approval, we may allow customers
to return product. In limited circumstances, product returned in saleable condition is resold to other customers or outlets. Receivables from customers generally do not bear interest. Terms and collection patterns vary around the world and by channel. The allowance for doubtful accounts represents our estimate of probable non-payments and credit losses in our existing receivables, as determined based on a review of past due balances and other specific account data. Account balances are written off against the allowance when we deem the amount is uncollectible.
Environmental Environmental costs relating to exist-ing conditions caused by past operations that do not contribute to current or future revenues are expensed. Liabilities for anticipated remediation costs are recorded on an undiscounted basis when they are probable and reasonably estimable, generally no later than the com-pletion of feasibility studies or our commitment to a plan of action.
Advertising Production Costs We expense the produc-tion costs of advertising the first time that the advertis-ing takes place.
Research and Development All expenditures for research and development (R&D) are charged against earnings in the year incurred. R&D includes expenditures for new product and manufacturing process innovation, and the annual expenditures are comprised primarily of internal salaries, wages, consulting, and other supplies attributable to time spent on R&D activities. Other costs include depreciation and maintenance of research facili-ties, including assets at facilities that are engaged in pilot plant activities.
Foreign Currency Translation For all significant foreign operations, the functional currency is the local currency. Assets and liabilities of these operations are translated at the period-end exchange rates. Income statement accounts are translated using the average exchange rates prevailing during the year. Translation adjustments are reflected within accumulated other comprehensive loss (AOCI) in stockholders’ equity. Gains and losses from foreign currency transactions are included in net earnings for the period, except for gains and losses on investments in subsidiaries for which settlement is not planned for the foreseeable future and foreign exchange gains and losses on instruments designated as net investment hedges. These gains and losses are recorded in AOCI.
Annual Report 2013 53
Derivative Instruments All derivatives are recognized on the Consolidated Balance Sheets at fair value based on quoted market prices or our estimate of their fair value, and are recorded in either current or noncurrent assets or liabilities based on their maturity. Changes in the fair values of derivatives are recorded in net earnings or other comprehensive income, based on whether the instrument is designated and effective as a hedge transaction and, if so, the type of hedge transaction. Gains or losses on derivative instruments reported in AOCI are reclassified to earnings in the period the hedged item affects earnings. If the underlying hedged transaction ceases to exist, any associated amounts reported in AOCI are reclassified to earnings at that time. Any ineffectiveness is recognized in earnings in the current period.
Stock-based Compensation We generally measure compensation expense for grants of restricted stock units using the value of a share of our stock on the date of grant. We estimate the value of stock option grants using a Black-Scholes valuation model. Stock compensation is recognized straight line over the vesting period. Our stock compensation expense is recorded in selling, general and administrative (SG&A) expenses and cost of sales in the Consolidated Statements of Earnings and allocated to each reportable segment in our segment results.
Certain equity-based compensation plans contain pro-visions that accelerate vesting of awards upon retire-ment, termination or death of eligible employees and directors. We consider a stock-based award to be vested when the employee’s retention of the award is no longer contingent on providing subsequent service. Accordingly, the related compensation cost is recognized immediately for awards granted to retirement-eligible individuals or over the period from the grant date to the date retire-ment eligibility is achieved, if less than the stated vest-ing period.
We report the benefits of tax deductions in excess of recognized compensation cost as a financing cash flow, thereby reducing net operating cash flows and increasing net financing cash flows.
Defined Benefit Pension, Other Postretirement, and Postemployment Benefit Plans We sponsor several domestic and foreign defined benefit plans to provide pension, health care, and other welfare benefits to retired employees. Under certain circumstances, we also provide accruable benefits to former or inactive employees in the United States and Canada and members of our Board of
Directors, including severance and certain other benefits payable upon death. We recognize an obligation for any of these benefits that vest or accumulate with service. Postemployment benefits that do not vest or accumulate with service (such as severance based solely on annual pay rather than years of service) are charged to expense when incurred. Our postemployment benefit plans are unfunded.
We recognize the underfunded or overfunded status of a defined benefit postretirement plan as an asset or liability and recognize changes in the funded status in the year in which the changes occur through AOCI.
Use of Estimates Preparing our Consolidated Financial Statements in conformity with accounting principles generally accepted in the United States requires us to make estimates and assumptions that affect reported amounts of assets and liabilities, disclosures of contin-gent assets and liabilities at the date of the financial statements, and the reported amounts of revenues and expenses during the reporting period. These estimates include our accounting for promotional expenditures, valuation of long-lived assets, intangible assets, redeem-able interest, stock-based compensation, income taxes, and defined benefit pension, post-retirement and post-employment benefits. Actual results could differ from our estimates.
Other New Accounting Standards In fiscal 2013, we adopted new accounting guidance for the presentation of other comprehensive income (OCI). This guidance requires entities to present net income and OCI in either a single continuous statement or in separate consecutive statements. The guidance does not change the compo-nents of net income or OCI, when OCI should be reclas-sified to net income, or the earnings per share (EPS) calculation. This guidance did not have an impact our results of operations or financial position.
In fiscal 2013, we adopted new accounting guidance intended to simplify indefinite-lived intangible asset impairment testing. Entities are allowed to perform a qualitative assessment of indefinite-lived intangible asset impairment to determine whether a quantitative assessment is necessary. We adopted this guidance for our annual indefinite-lived intangible asset impairment test for fiscal 2013, which was conducted as of the first day of the third quarter. The adoption of this guidance did not have an impact on our results of operations or financial position.
54 Healthy Growth
In fiscal 2012, we adopted new accounting guidance for fair value measurements providing common fair value measurement and disclosure requirements. The adoption of the guidance did not have an impact on our results of operations or financial condition.
In fiscal 2012, we adopted new accounting guidance on employer’s disclosures about participation in multi-employer benefit plans. The adoption of the guidance did not have an impact on our results of operations or financial condition.
In fiscal 2012, we adopted new accounting guid-ance intended to simplify goodwill impairment testing. Entities are allowed to perform a qualitative assessment of goodwill impairment to determine whether a quan-titative assessment is necessary. We adopted this guid-ance for our annual goodwill impairment test for fiscal 2012. The adoption of this guidance did not have an impact on our results of operations or financial position.
In fiscal 2011, we adopted new accounting guidance on the consolidation model for VIEs. The guidance requires companies to qualitatively assess the determination of the primary beneficiary of a VIE based on whether the com-pany (1) has the power to direct matters that most sig-nificantly impact the VIE’s economic performance, and (2) has the obligation to absorb losses or the right to receive benefits of the VIE that could potentially be significant to the VIE. The adoption of the guidance did not have an impact on our results of operations or financial condition.
NOTE 3. ACQUISITIONS
On August 1, 2012, we acquired Yoki, a privately held food company headquartered in Sao Bernardo do Campo, Brazil, for an aggregate purchase price of $939.8 million, including $88.8 million of non-cash consideration for net debt assumed. Yoki operates in several food categories, including snacks, convenient meals, basic foods, and seasonings. We consolidated Yoki into our Consolidated Balance Sheets and recorded goodwill of $363.0 million. Indefinite lived intangible assets acquired include brands of $253.0 million. Finite lived intangible assets acquired primarily include customer relationships of $17.5 million. The pro forma effects of this acquisition were not material.
During the first quarter of fiscal 2012, we acquired a 51 percent controlling interest in Yoplait S.A.S. and a 50 percent interest in Yoplait Marques S.A.S. from PAI Partners and Sodiaal for an aggregate purchase price of $1.2 billion, including $261.3 million of non-cash consideration for debt assumed. We consolidated
both entities into our Consolidated Balance Sheets and recorded goodwill of $1.5 billion. Indefinite lived intangible assets acquired primarily include brands of $476.0 million. Finite lived intangible assets acquired primarily include franchise agreements of $440.2 million and customer relationships of $107.3 million. In addition, we purchased a zero coupon exchangeable note due in 2016 from Sodiaal with a notional amount of $131.6 million and a fair value of $110.9 million. As of May 26, 2013, $16.2 million of the exchangeable note has been repaid. The pro forma effects of this acquisition were not material.
NOTE 4. RESTRUCTURING, IMPAIRMENT, AND OTHER EXIT COSTS
We view our restructuring activities as actions that help us meet our long-term growth targets. Activities we undertake must meet internal rate of return and net present value targets. Each restructuring action normally takes one to two years to complete. At completion (or as each major stage is completed in the case of multi-year programs), the project begins to deliver cash sav-ings and/or reduced depreciation. These activities result in various restructuring costs, including asset write-offs, exit charges including severance, contract termination fees, and decommissioning and other costs. Depreciation associated with restructured assets, as used in the con-text of our disclosures regarding restructuring activity, refers to the increase in depreciation expense caused by shortening the useful life or updating the salvage value of depreciable fixed assets to coincide with the end of production under an approved restructuring plan. Any impairment of the asset is recognized immediately in the period the plan is approved.
In fiscal 2013, we recorded restructuring, impairment, and other exit costs pursuant to approved plans as follows:
Expense, in Millions
Charges associated with restructuring actions previously announced $19.8 Total $19.8
In fiscal 2013, we recorded an $18.6 million restructuring charge related to a productivity and cost savings plan approved in the fourth quarter of fiscal 2012, consisting of $10.6 million of employee severance expense and other exit costs of $8.0 million. All of our operating segments were affected by these actions including $15.9 million related to our International segment, $1.8 million

Annual Report 2013 55
related to our U.S. Retail segment, and $0.9 million related to our Bakeries and Foodservice segment. These restructuring actions are expected to be completed by the end of fiscal 2014. In addition, we recorded $1.2 million of charges associated with other previously announced restructuring actions. In fiscal 2013, we paid $79.9 million in cash related to restructuring actions.
In fiscal 2012, we recorded restructuring, impairment, and other exit costs pursuant to approved plans as follows:
Expense, in Millions
Productivity and cost savings plan $100.6 Charges associated with restructuring actions previously announced 1.0 Total $101.6
In fiscal 2012, we recorded a $100.6 million restructuring charge related to a productivity and cost savings plan approved in the fourth quarter of fiscal 2012. The plan was designed to improve organizational effectiveness and focus on key growth strategies, and included organizational changes to strengthen business alignment and actions to accelerate administrative efficiencies across all of our operating segments and support functions. In connection with this initiative, we eliminated approximately 850 positions globally. The restructuring charge consisted of $87.6 million of employee severance expense and a non-cash charge of $13.0 million related to the write-off of certain long-lived assets in our U.S. Retail segment. All of our operating segments and support functions were affected by these actions including $69.9 million related to our U.S. Retail segment, $12.2 million related to our Bakeries and Foodservice segment, $9.5 million related to our International segment, and $9.0 million related to our administrative functions. In fiscal 2012, we paid $3.8 million in cash related to restructuring actions taken in fiscal 2012 and previous years.
In fiscal 2011, we recorded restructuring, impairment, and other exit costs pursuant to approved plans as follows:
Expense, in Millions
Discontinuation of fruit-flavored snack product line $1.7 Charges associated with restructuring actions previously announced 2.7 Total $4.4
The roll forward of our restructuring and other exit cost reserves, included in other current liabilities, is as follows: Other Contract ExitIn Millions Severance Termination Costs Total
Reserve balance as of May 30, 2010 $ 2.6 $ 8.1 $ 0.1 $ 10.82011 charges, including foreign currency translation — — — — Utilized in 2011 (0.9) (2.6) (0.1) (3.6)Reserve balance as of May 29, 2011 1.7 5.5 — 7.2 2012 charges, including foreign currency translation 82.4 — — 82.4 Utilized in 2012 (1.0) (2.8) 0.1 (3.7)Reserve balance as of May 27, 2012 83.1 2.7 0.1 85.9 2013 charges, including foreign currency translation 10.6 — — 10.6 Utilized in 2013 (74.2) (2.7) (0.1) (77.0)Reserve balance as of May 26, 2013 $ 19.5 $ — $ — $ 19.5
The charges recognized in the roll forward of our reserves for restructuring and other exit costs do not include items charged directly to expense (e.g., asset impairment charges, the gain or loss on the sale of restructured assets, and the write-off of spare parts) and other periodic exit costs recognized as incurred, as those items are not reflected in our restructuring and other exit cost reserves on our Consolidated Balance Sheets.
56 Healthy Growth
NOTE 5. INVESTMENTS IN JOINT VENTURES
We have a 50 percent equity interest in Cereal Partners Worldwide (CPW), which manufactures and markets ready-to-eat cereal products in more than 130 countries and republics outside the United States and Canada. CPW also markets cereal bars in several European countries and manufactures private label cereals for customers in the United Kingdom. We have guaranteed a portion of CPW’s debt and its pension obligation in the United Kingdom.
We also have a 50 percent equity interest in Häagen-Dazs Japan, Inc. (HDJ). This joint venture manufactures, distributes, and markets Häagen-Dazs ice cream products and frozen novelties.
Results from our CPW and HDJ joint ventures are reported for the 12 months ended March 31.
Joint venture related balance sheet activity follows:
May 26, May 27,In Millions 2013 2012
Cumulative investments $ 478.5 $ 529.0 Goodwill and other intangibles 537.2 522.1 Aggregate advances 291.5 268.1
Joint venture earnings and cash flow activity follows:
Fiscal YearIn Millions 2013 2012 2011
Sales to joint ventures $12.3 $10.4 $10.2 Net advances 36.7 22.2 1.8 Dividends received 115.7 68.0 72.7
Summary combined financial information for the joint ventures on a 100 percent basis follows:
Fiscal YearIn Millions 2013 2012 2011
Net sales: CPW $2,132.2 $2,152.6 $2,067.2 HDJ 420.5 428.9 385.0 Total net sales 2,552.7 2,581.5 2,452.2 Gross margin 1,057.3 1,084.1 1,073.6 Earnings before income taxes 260.3 250.3 233.4 Earnings after income taxes 201.6 189.0 164.2
May 26, May 27,In Millions 2013 2012
Current assets $ 976.7 $ 934.8 Noncurrent assets 1,088.2 1,078.0 Current liabilities 1,717.4 1,671.0 Noncurrent liabilities 115.1 91.0
NOTE 6. GOODWILL AND OTHER INTANGIBLE ASSETS
The components of goodwill and other intangible assets are as follows: May 26, May 27,In Millions 2013 2012
Goodwill $ 8,622.2 $8,182.5 Other intangible assets: Intangible assets not subject to amortization: Brands and other indefinite-lived intangibles 4,499.5 4,217.1 Intangible assets subject to amortization: Franchise agreements, customer relationships, and other finite-lived intangibles 602.6 544.7 Less accumulated amortization (87.0) (56.9) Intangible assets subject to amortization 515.6 487.8 Other intangible assets 5,015.1 4,704.9 Total $13,637.3 $12,887.4
Based on the carrying value of finite-lived intangible assets as of May 26, 2013, amortization expense for each of the next five fiscal years is estimated to be approximately $30 million.
Annual Report 2013 57
The changes in the carrying amount of goodwill for fiscal 2011, 2012, and 2013 are as follows:
Bakeries U.S. and Joint In Millions Retail International Foodservice Ventures Total
Balance as of May 30, 2010 $5,098.3 $ 122.0 $923.0 $449.5 $6,592.8 Acquisitions 44.6 26.9 — — 71.5 Divestitures — (0.5) (1.9) — (2.4)Other activity, primarily foreign currency translation — 14.2 — 74.7 88.9 Balance as of May 29, 2011 5,142.9 162.6 921.1 524.2 6,750.8 Acquisitions 670.3 946.4 — — 1,616.7 Other activity, primarily foreign currency translation — (119.1) — (65.9) (185.0)Balance as of May 27, 2012 5,813.2 989.9 921.1 458.3 8,182.5 Acquisitions 28.2 378.8 — — 407.0 Other activity, primarily foreign currency translation — 18.3 — 14.4 32.7 Balance as of May 26, 2013 $5,841.4 $1,387.0 $921.1 $472.7 $8,622.2
The changes in the carrying amount of other intangible assets for fiscal 2011, 2012, and 2013 are as follows:
U.S. Joint In Millions Retail International Ventures Total
Balance as of May 30, 2010 $3,206.6 $ 445.3 $63.1 $3,715.0 Acquisitions 39.3 6.0 — 45.3 Other activity, primarily foreign currency translation (3.4) 46.6 9.8 53.0 Balance as of May 29, 2011 3,242.5 497.9 72.9 3,813.3 Acquisitions 58.2 1,050.3 — 1,108.5 Other activity, primarily foreign currency translation (3.7) (204.1) (9.1) (216.9)Balance as of May 27, 2012 3,297.0 1,344.1 63.8 4,704.9 Acquisitions 20.0 290.7 — 310.7 Other activity, primarily foreign currency translation (4.6) 3.4 0.7 (0.5)Balance as of May 26, 2013 $3,312.4 $1,638.2 $64.5 $5,015.1
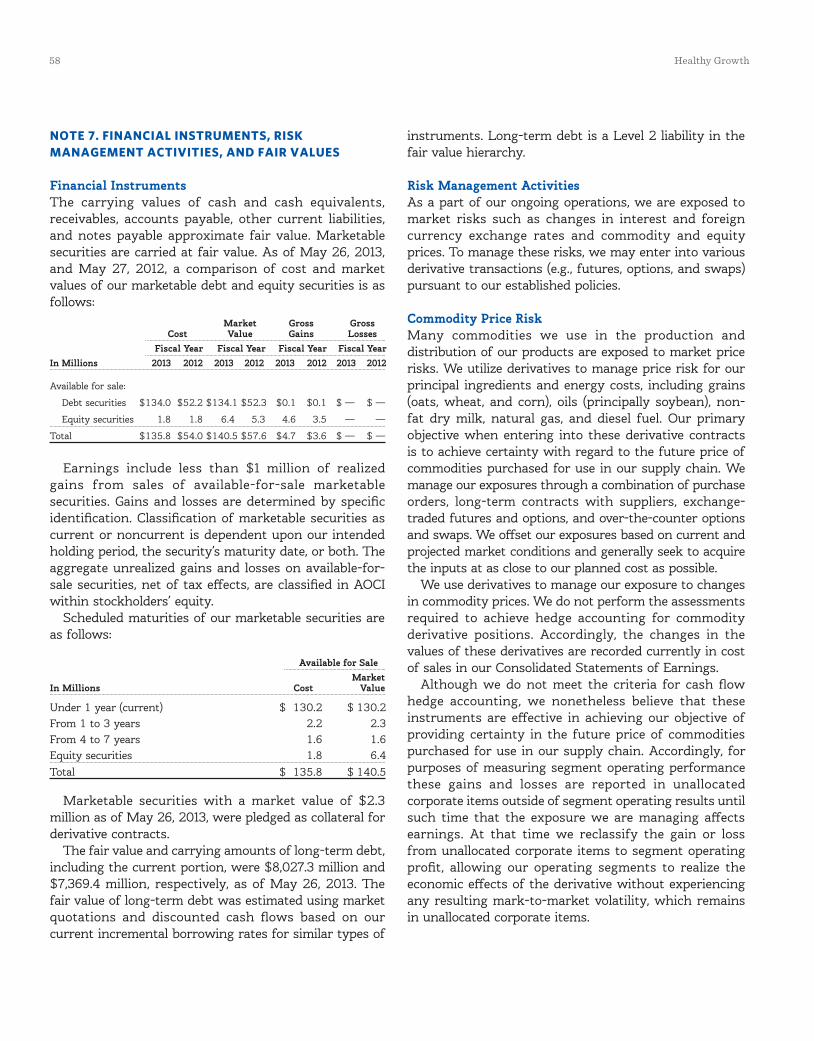
58 Healthy Growth
NOTE 7. FINANCIAL INSTRUMENTS, RISK MANAGEMENT ACTIVITIES, AND FAIR VALUES
Financial InstrumentsThe carrying values of cash and cash equivalents, receivables, accounts payable, other current liabilities, and notes payable approximate fair value. Marketable securities are carried at fair value. As of May 26, 2013, and May 27, 2012, a comparison of cost and market values of our marketable debt and equity securities is as follows: Market Gross Gross Cost Value Gains Losses Fiscal Year Fiscal Year Fiscal Year Fiscal YearIn Millions 2013 2012 2013 2012 2013 2012 2013 2012
Available for sale:
Debt securities $134.0 $52.2 $134.1 $52.3 $0.1 $0.1 $ — $ —
Equity securities 1.8 1.8 6.4 5.3 4.6 3.5 — —
Total $135.8 $54.0 $140.5 $57.6 $4.7 $3.6 $ — $ —
Earnings include less than $1 million of realized gains from sales of available-for-sale marketable securities. Gains and losses are determined by specific identification. Classification of marketable securities as current or noncurrent is dependent upon our intended holding period, the security’s maturity date, or both. The aggregate unrealized gains and losses on available-for-sale securities, net of tax effects, are classified in AOCI within stockholders’ equity.
Scheduled maturities of our marketable securities are as follows:
Available for Sale Market In Millions Cost Value
Under 1 year (current) $ 130.2 $ 130.2 From 1 to 3 years 2.2 2.3 From 4 to 7 years 1.6 1.6 Equity securities 1.8 6.4 Total $ 135.8 $ 140.5
Marketable securities with a market value of $2.3 million as of May 26, 2013, were pledged as collateral for derivative contracts.
The fair value and carrying amounts of long-term debt, including the current portion, were $8,027.3 million and $7,369.4 million, respectively, as of May 26, 2013. The fair value of long-term debt was estimated using market quotations and discounted cash flows based on our current incremental borrowing rates for similar types of
instruments. Long-term debt is a Level 2 liability in the fair value hierarchy.
Risk Management ActivitiesAs a part of our ongoing operations, we are exposed to market risks such as changes in interest and foreign currency exchange rates and commodity and equity prices. To manage these risks, we may enter into various derivative transactions (e.g., futures, options, and swaps) pursuant to our established policies.
Commodity Price RiskMany commodities we use in the production and distribution of our products are exposed to market price risks. We utilize derivatives to manage price risk for our principal ingredients and energy costs, including grains (oats, wheat, and corn), oils (principally soybean), non-fat dry milk, natural gas, and diesel fuel. Our primary objective when entering into these derivative contracts is to achieve certainty with regard to the future price of commodities purchased for use in our supply chain. We manage our exposures through a combination of purchase orders, long-term contracts with suppliers, exchange-traded futures and options, and over-the-counter options and swaps. We offset our exposures based on current and projected market conditions and generally seek to acquire the inputs at as close to our planned cost as possible.
We use derivatives to manage our exposure to changes in commodity prices. We do not perform the assessments required to achieve hedge accounting for commodity derivative positions. Accordingly, the changes in the values of these derivatives are recorded currently in cost of sales in our Consolidated Statements of Earnings.
Although we do not meet the criteria for cash flow hedge accounting, we nonetheless believe that these instruments are effective in achieving our objective of providing certainty in the future price of commodities purchased for use in our supply chain. Accordingly, for purposes of measuring segment operating performance these gains and losses are reported in unallocated corporate items outside of segment operating results until such time that the exposure we are managing affects earnings. At that time we reclassify the gain or loss from unallocated corporate items to segment operating profit, allowing our operating segments to realize the economic effects of the derivative without experiencing any resulting mark-to-market volatility, which remains in unallocated corporate items.
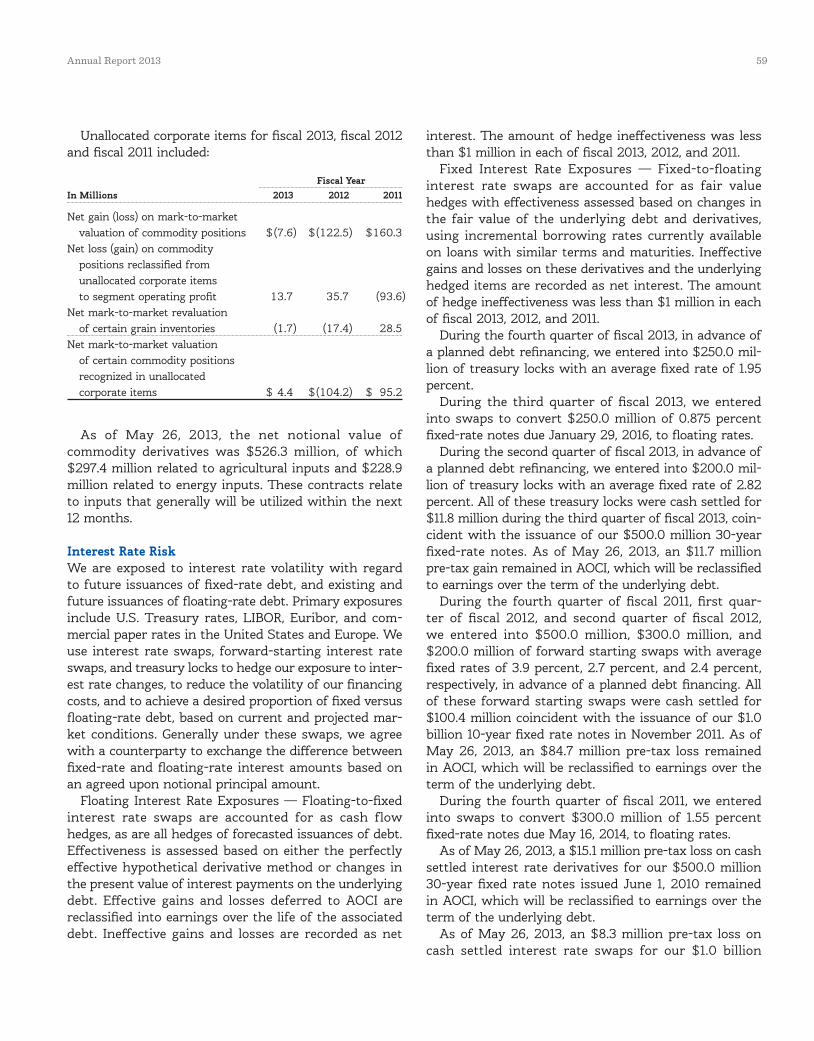
Annual Report 2013 59
Unallocated corporate items for fiscal 2013, fiscal 2012 and fiscal 2011 included:
Fiscal YearIn Millions 2013 2012 2011
Net gain (loss) on mark-to-market valuation of commodity positions $ (7.6) $ (122.5) $ 160.3 Net loss (gain) on commodity positions reclassified from unallocated corporate items to segment operating profit 13.7 35.7 (93.6)Net mark-to-market revaluation of certain grain inventories (1.7) (17.4) 28.5 Net mark-to-market valuation of certain commodity positions recognized in unallocated corporate items $ 4.4 $ (104.2) $ 95.2
As of May 26, 2013, the net notional value of commodity derivatives was $526.3 million, of which $297.4 million related to agricultural inputs and $228.9 million related to energy inputs. These contracts relate to inputs that generally will be utilized within the next 12 months.
Interest Rate RiskWe are exposed to interest rate volatility with regard to future issuances of fixed-rate debt, and existing and future issuances of floating-rate debt. Primary exposures include U.S. Treasury rates, LIBOR, Euribor, and com-mercial paper rates in the United States and Europe. We use interest rate swaps, forward-starting interest rate swaps, and treasury locks to hedge our exposure to inter-est rate changes, to reduce the volatility of our financing costs, and to achieve a desired proportion of fixed versus floating-rate debt, based on current and projected mar-ket conditions. Generally under these swaps, we agree with a counterparty to exchange the difference between fixed-rate and floating-rate interest amounts based on an agreed upon notional principal amount.
Floating Interest Rate Exposures — Floating-to-fixed interest rate swaps are accounted for as cash flow hedges, as are all hedges of forecasted issuances of debt. Effectiveness is assessed based on either the perfectly effective hypothetical derivative method or changes in the present value of interest payments on the underlying debt. Effective gains and losses deferred to AOCI are reclassified into earnings over the life of the associated debt. Ineffective gains and losses are recorded as net
interest. The amount of hedge ineffectiveness was less than $1 million in each of fiscal 2013, 2012, and 2011.
Fixed Interest Rate Exposures — Fixed-to-floating interest rate swaps are accounted for as fair value hedges with effectiveness assessed based on changes in the fair value of the underlying debt and derivatives, using incremental borrowing rates currently available on loans with similar terms and maturities. Ineffective gains and losses on these derivatives and the underlying hedged items are recorded as net interest. The amount of hedge ineffectiveness was less than $1 million in each of fiscal 2013, 2012, and 2011.
During the fourth quarter of fiscal 2013, in advance of a planned debt refinancing, we entered into $250.0 mil-lion of treasury locks with an average fixed rate of 1.95 percent.
During the third quarter of fiscal 2013, we entered into swaps to convert $250.0 million of 0.875 percent fixed-rate notes due January 29, 2016, to floating rates.
During the second quarter of fiscal 2013, in advance of a planned debt refinancing, we entered into $200.0 mil-lion of treasury locks with an average fixed rate of 2.82 percent. All of these treasury locks were cash settled for $11.8 million during the third quarter of fiscal 2013, coin-cident with the issuance of our $500.0 million 30-year fixed-rate notes. As of May 26, 2013, an $11.7 million pre-tax gain remained in AOCI, which will be reclassified to earnings over the term of the underlying debt.
During the fourth quarter of fiscal 2011, first quar-ter of fiscal 2012, and second quarter of fiscal 2012, we entered into $500.0 million, $300.0 million, and $200.0 million of forward starting swaps with average fixed rates of 3.9 percent, 2.7 percent, and 2.4 percent, respectively, in advance of a planned debt financing. All of these forward starting swaps were cash settled for $100.4 million coincident with the issuance of our $1.0 billion 10-year fixed rate notes in November 2011. As of May 26, 2013, an $84.7 million pre-tax loss remained in AOCI, which will be reclassified to earnings over the term of the underlying debt.
During the fourth quarter of fiscal 2011, we entered into swaps to convert $300.0 million of 1.55 percent fixed-rate notes due May 16, 2014, to floating rates.
As of May 26, 2013, a $15.1 million pre-tax loss on cash settled interest rate derivatives for our $500.0 million 30-year fixed rate notes issued June 1, 2010 remained in AOCI, which will be reclassified to earnings over the term of the underlying debt.
As of May 26, 2013, an $8.3 million pre-tax loss on cash settled interest rate swaps for our $1.0 billion
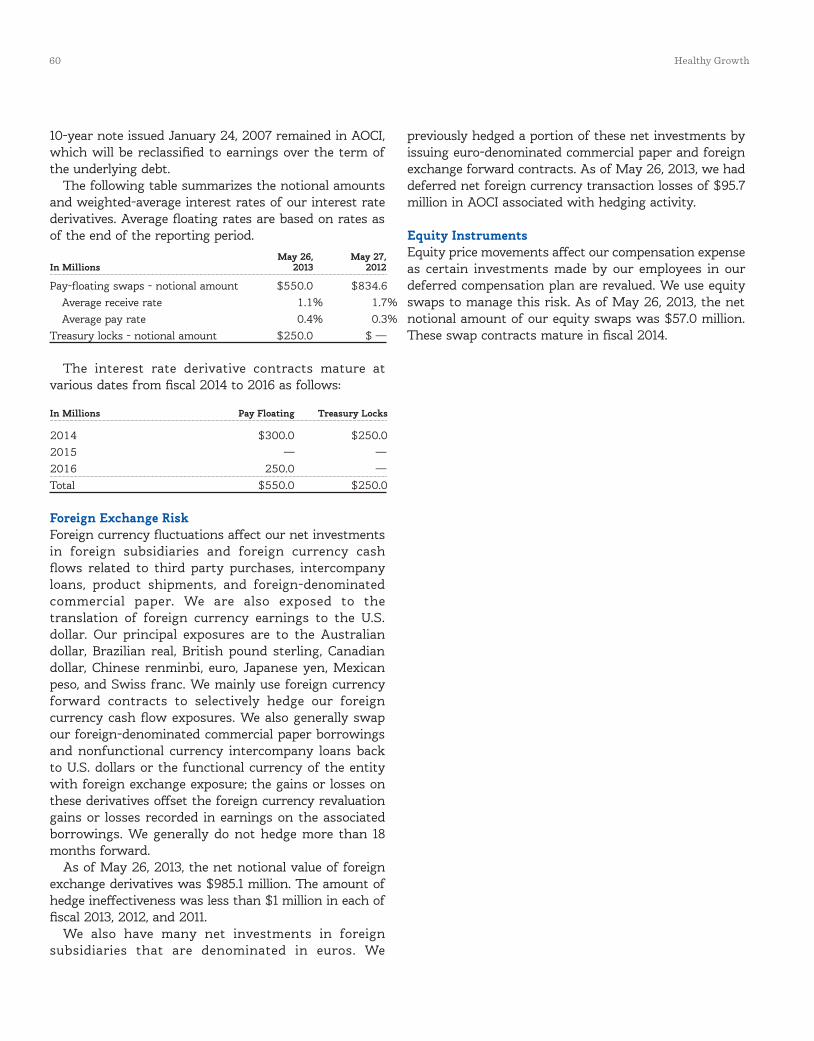
60 Healthy Growth
10-year note issued January 24, 2007 remained in AOCI, which will be reclassified to earnings over the term of the underlying debt.
The following table summarizes the notional amounts and weighted-average interest rates of our interest rate derivatives. Average floating rates are based on rates as of the end of the reporting period. May 26, May 27,In Millions 2013 2012
Pay-floating swaps - notional amount $550.0 $834.6 Average receive rate 1.1% 1.7% Average pay rate 0.4% 0.3%Treasury locks - notional amount $250.0 $ —
The interest rate derivative contracts mature at various dates from fiscal 2014 to 2016 as follows:
In Millions Pay Floating Treasury Locks
2014 $300.0 $250.0 2015 — — 2016 250.0 — Total $550.0 $250.0
Foreign Exchange RiskForeign currency fluctuations affect our net investments in foreign subsidiaries and foreign currency cash flows related to third party purchases, intercompany loans, product shipments, and foreign-denominated commercial paper. We are also exposed to the translation of foreign currency earnings to the U.S. dollar. Our principal exposures are to the Australian dollar, Brazilian real, British pound sterling, Canadian dollar, Chinese renminbi, euro, Japanese yen, Mexican peso, and Swiss franc. We mainly use foreign currency forward contracts to selectively hedge our foreign currency cash flow exposures. We also generally swap our foreign-denominated commercial paper borrowings and nonfunctional currency intercompany loans back to U.S. dollars or the functional currency of the entity with foreign exchange exposure; the gains or losses on these derivatives offset the foreign currency revaluation gains or losses recorded in earnings on the associated borrowings. We generally do not hedge more than 18 months forward.
As of May 26, 2013, the net notional value of foreign exchange derivatives was $985.1 million. The amount of hedge ineffectiveness was less than $1 million in each of fiscal 2013, 2012, and 2011.
We also have many net investments in foreign subsidiaries that are denominated in euros. We
previously hedged a portion of these net investments by issuing euro-denominated commercial paper and foreign exchange forward contracts. As of May 26, 2013, we had deferred net foreign currency transaction losses of $95.7 million in AOCI associated with hedging activity.
Equity InstrumentsEquity price movements affect our compensation expense as certain investments made by our employees in our deferred compensation plan are revalued. We use equity swaps to manage this risk. As of May 26, 2013, the net notional amount of our equity swaps was $57.0 million. These swap contracts mature in fiscal 2014.

Annual Report 2013 61
Fair Value Measurements And Financial Statement PresentationThe fair values of our assets, liabilities, and derivative positions recorded at fair value and their respective levels in the fair value hierarchy as of May 26, 2013 and May 27, 2012, were as follows:
May 26, 2013 May 26, 2013 Fair Values of Assets Fair Values of LiabilitiesIn Millions Level 1 Level 2 Level 3 Total Level 1 Level 2 Level 3 Total
Derivatives designated as hedging instruments: Interest rate contracts (a) (b) $ — $ 10.3 $ — $ 10.3 $ — $ — $ — $ — Foreign exchange contracts (c) (d) — 15.7 — 15.7 — (1.6) — (1.6)Total — 26.0 — 26.0 — (1.6) — (1.6)Derivatives not designated as hedging instruments: Foreign exchange contracts (c) (d) — 6.7 — 6.7 — (0.1) — (0.1) Equity contracts (a) (e) — — — — — (0.2) — (0.2) Commodity contracts (c) (e) 10.3 3.1 — 13.4 — (3.9) — (3.9) Grain contracts (c) (e) — 7.5 — 7.5 — (30.4) — (30.4)Total 10.3 17.3 — 27.6 — (34.6) — (34.6)Other assets and liabilities reported at fair value: Marketable investments (a) (f) 6.4 134.1 — 140.5 — — — — Total 6.4 134.1 — 140.5 — — — — Total assets, liabilities, and derivative positions recorded at fair value $ 16.7 $ 177.4 $ — $ 194.1 $ — $ (36.2) $ — $ (36.2)
(a) These contracts and investments are recorded as prepaid expenses and other current assets, other assets, other current liabilities or other liabilities, as appropriate, based on whether in a gain or loss position. Certain marketable investments are recorded as cash and cash equivalents.
(b) Based on LIBOR and swap rates.
(c) These contracts are recorded as prepaid expenses and other current assets or as other current liabilities, as appropriate, based on whether in a gain or loss position.
(d) Based on observable market transactions of spot currency rates and forward currency prices.
(e) Based on prices of futures exchanges and recently reported transactions in the marketplace.
(f) Based on prices of common stock and bond matrix pricing.
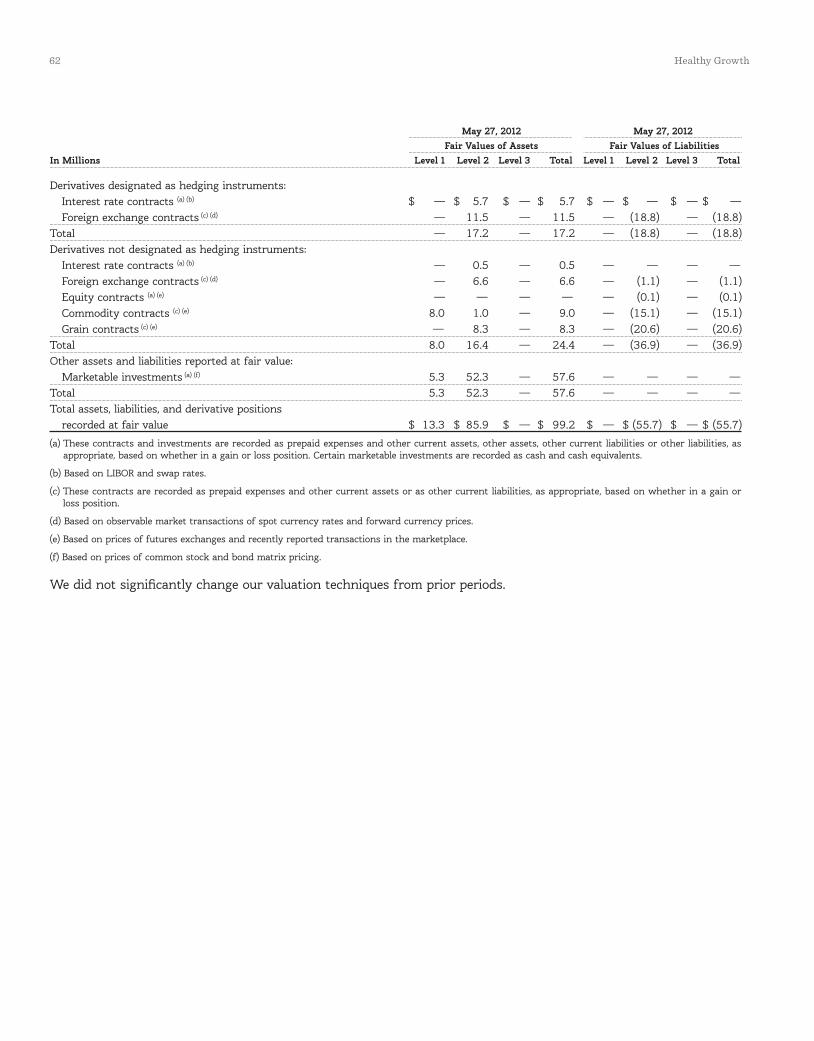
62 Healthy Growth
May 27, 2012 May 27, 2012 Fair Values of Assets Fair Values of LiabilitiesIn Millions Level 1 Level 2 Level 3 Total Level 1 Level 2 Level 3 Total
Derivatives designated as hedging instruments: Interest rate contracts (a) (b) $ — $ 5.7 $ — $ 5.7 $ — $ — $ — $ — Foreign exchange contracts (c) (d) — 11.5 — 11.5 — (18.8) — (18.8)Total — 17.2 — 17.2 — (18.8) — (18.8)Derivatives not designated as hedging instruments: Interest rate contracts (a) (b) — 0.5 — 0.5 — — — — Foreign exchange contracts (c) (d) — 6.6 — 6.6 — (1.1) — (1.1) Equity contracts (a) (e) — — — — — (0.1) — (0.1) Commodity contracts (c) (e) 8.0 1.0 — 9.0 — (15.1) — (15.1) Grain contracts (c) (e) — 8.3 — 8.3 — (20.6) — (20.6)Total 8.0 16.4 — 24.4 — (36.9) — (36.9)Other assets and liabilities reported at fair value: Marketable investments (a) (f) 5.3 52.3 — 57.6 — — — — Total 5.3 52.3 — 57.6 — — — — Total assets, liabilities, and derivative positions recorded at fair value $ 13.3 $ 85.9 $ — $ 99.2 $ — $ (55.7) $ — $ (55.7)
(a) These contracts and investments are recorded as prepaid expenses and other current assets, other assets, other current liabilities or other liabilities, as appropriate, based on whether in a gain or loss position. Certain marketable investments are recorded as cash and cash equivalents.
(b) Based on LIBOR and swap rates.
(c) These contracts are recorded as prepaid expenses and other current assets or as other current liabilities, as appropriate, based on whether in a gain or loss position.
(d) Based on observable market transactions of spot currency rates and forward currency prices.
(e) Based on prices of futures exchanges and recently reported transactions in the marketplace.
(f) Based on prices of common stock and bond matrix pricing.
We did not significantly change our valuation techniques from prior periods.
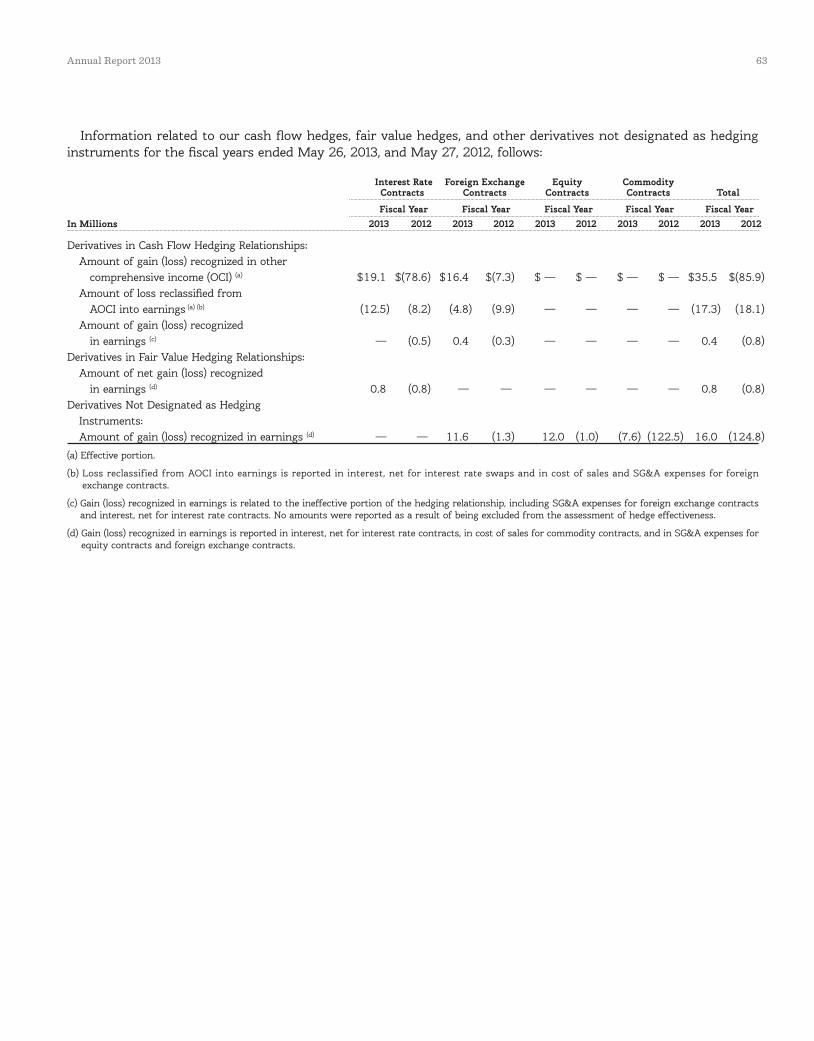
Annual Report 2013 63
Information related to our cash flow hedges, fair value hedges, and other derivatives not designated as hedging instruments for the fiscal years ended May 26, 2013, and May 27, 2012, follows:
Interest Rate Foreign Exchange Equity Commodity Contracts Contracts Contracts Contracts Total
Fiscal Year Fiscal Year Fiscal Year Fiscal Year Fiscal YearIn Millions 2013 2012 2013 2012 2013 2012 2013 2012 2013 2012
Derivatives in Cash Flow Hedging Relationships: Amount of gain (loss) recognized in other comprehensive income (OCI) (a) $19.1 $(78.6) $16.4 $(7.3) $ — $ — $ — $ — $35.5 $(85.9) Amount of loss reclassified from AOCI into earnings (a) (b) (12.5) (8.2) (4.8) (9.9) — — — — (17.3) (18.1) Amount of gain (loss) recognized in earnings (c) — (0.5) 0.4 (0.3) — — — — 0.4 (0.8)Derivatives in Fair Value Hedging Relationships: Amount of net gain (loss) recognized in earnings (d) 0.8 (0.8) — — — — — — 0.8 (0.8)Derivatives Not Designated as Hedging Instruments: Amount of gain (loss) recognized in earnings (d) — — 11.6 (1.3) 12.0 (1.0) (7.6) (122.5) 16.0 (124.8)
(a) Effective portion.
(b) Loss reclassified from AOCI into earnings is reported in interest, net for interest rate swaps and in cost of sales and SG&A expenses for foreign exchange contracts.
(c) Gain (loss) recognized in earnings is related to the ineffective portion of the hedging relationship, including SG&A expenses for foreign exchange contracts and interest, net for interest rate contracts. No amounts were reported as a result of being excluded from the assessment of hedge effectiveness.
(d) Gain (loss) recognized in earnings is reported in interest, net for interest rate contracts, in cost of sales for commodity contracts, and in SG&A expenses for equity contracts and foreign exchange contracts.
64 Healthy Growth
Amounts Recorded In Accumulated Other Comprehensive Loss Unrealized losses from interest rate cash flow hedges recorded in AOCI as of May 26, 2013, totaled $53.5 million after tax. These deferred losses are primarily related to interest rate swaps that we entered into in contemplation of future borrowings and other financ-ing requirements and that are being reclassified into net interest over the lives of the hedged forecasted transac-tions. Unrealized gains from foreign currency cash flow hedges recorded in AOCI as of May 26, 2013, were $11.8 million after-tax. The net amount of pre-tax gains and losses in AOCI as of May 26, 2013, that we expect to be reclassified into net earnings within the next 12 months is $3.5 million of income.
Credit-Risk-Related Contingent FeaturesCertain of our derivative instruments contain provisions that require us to maintain an investment grade credit rating on our debt from each of the major credit rating agencies. If our debt were to fall below investment grade, the counterparties to the derivative instruments could request full collateralization on derivative instruments in net liability positions. The aggregate fair value of all derivative instruments with credit-risk-related contin-gent features that were in a liability position on May 26, 2013, was $3.9 million. We have posted no collateral under these contracts. If the credit-risk-related contin-gent features underlying these agreements had been triggered on May 26, 2013, we would have been required to post $3.9 million of collateral to counterparties.
Concentrations Of Credit And Counterparty Credit RiskDuring fiscal 2013, Wal-Mart Stores, Inc. and its affiliates (Wal-Mart) accounted for 21 percent of our consolidated net sales and 31 percent of our net sales in the U.S. Retail segment. No other customer accounted for 10 percent or more of our consolidated net sales. Wal-Mart also represented 6 percent of our net sales in the International segment and 7 percent of our net sales in the Bakeries and Foodservice segment. As of May 26, 2013, Wal-Mart accounted for 28 percent of our U.S. Retail receivables, 5 percent of our International receivables, and 7 percent of our Bakeries and Foodservice receivables. The five largest customers in our U.S. Retail segment accounted for 54 percent of its fiscal 2013 net sales, the five largest customers in our International segment accounted for 24 percent of its fiscal 2013 net sales, and the five largest customers in our Bakeries and Foodservice segment accounted for 41 percent of its fiscal 2013 net sales.
We enter into interest rate, foreign exchange, and cer-tain commodity and equity derivatives, primarily with a diversified group of highly rated counterparties. We continually monitor our positions and the credit ratings of the counterparties involved and, by policy, limit the amount of credit exposure to any one party. These trans-actions may expose us to potential losses due to the risk of nonperformance by these counterparties; however, we have not incurred a material loss. We also enter into commodity futures transactions through various regu-lated exchanges.
The amount of loss due to the credit risk of the coun-terparties, should the counterparties fail to perform according to the terms of the contracts, is $30.9 million against which we do not hold collateral. Under the terms of master swap agreements, some of our transactions require collateral or other security to support financial instruments subject to threshold levels of exposure and counterparty credit risk. Collateral assets are either cash or U.S. Treasury instruments and are held in a trust account that we may access if the counterparty defaults.
We offer certain suppliers access to a third party ser-vice that allows them to view our scheduled payments online. The third party service also allows suppliers to finance advances on our scheduled payments at the sole discretion of the supplier and the third party. We have no economic interest in these financing arrangements and no direct relationship with the suppliers, the third party, or any financial institutions concerning this ser-vice. All of our accounts payable remain as obligations to our suppliers as stated in our supplier agreements. As of May 26, 2013, $178.3 million of our total accounts payable is payable to suppliers who utilize this third party service.
Annual Report 2013 65
NOTE 8. DEBT
Notes Payable The components of notes payable and their respective weighted-average interest rates at the end of the periods were as follows: May 26, 2013 May 27, 2012
Weighted- Weighted- average average Notes Interest Notes InterestIn Millions Payable Rate Payable Rate
U.S. commercial paper $515.5 0.2% $412.0 0.2%Financial institutions 84.2 13.0 114.5 10.0Total $ 599.7 2.0% $526.5 2.4%
To ensure availability of funds, we maintain bank credit lines sufficient to cover our outstanding short-term borrowings. Commercial paper is a continuing source of short-term financing. We have commercial paper programs available to us in the United States and Europe. In April 2012, we entered into fee-paid commit-ted credit lines, consisting of a $1.0 billion facility sched-uled to expire in April 2015 and a $1.7 billion facility scheduled to expire in April 2017. We also have $332.8 million in uncommitted credit lines that support our foreign operations. As of May 26, 2013, there were no amounts outstanding on the fee-paid committed credit lines and $84.2 million was drawn on the uncommit-ted lines. The credit facilities contain several covenants, including a requirement to maintain a fixed charge cov-erage ratio of at least 2.5 times. We were in compliance with all credit facility covenants as of May 26, 2013.
Long-Term Debt In January 2013, we issued $750.0 mil-lion aggregate principal amount of fixed rate notes. The issuance consisted of $250.0 million 0.875 percent notes due January 29, 2016 and $500.0 million 4.15 percent notes due February 15, 2043. Interest on the fixed-rate notes is payable semi-annually in arrears. The fixed rate notes due January 29, 2016 may be redeemed in whole, or in part, at our option at any time for a specified make whole amount. The fixed rate notes due February 15, 2043 may be redeemed in whole, or in part, at our option at any time prior to August 15, 2042 for a speci-fied make whole amount and any time on or after that date at par. These notes are senior unsecured obligations that include a change of control repurchase provision. The net proceeds were used to reduce our commercial paper borrowings.
In January 2013, we issued $250.0 million float-ing rate notes due January 29, 2016. The floating-rate notes bear interest equal to three-month LIBOR plus 30
basis points, subject to quarterly reset. Interest on the floating-rate notes is payable quarterly in arrears. The floating rate notes are not redeemable prior to matu-rity. These notes are senior unsecured obligations that include a change of control repurchase provision. The net proceeds were used to reduce our commercial paper borrowings.
In September 2012, we repaid $520.8 million of 5.65 percent notes. In February 2012, we repaid $1.0 billion of 6.0 percent notes. In November 2011, we issued $1.0 billion aggregate principal amount of 3.15 percent notes due December 15, 2021. The net proceeds were used to repay a portion of our notes due February 2012, reduce our commercial paper borrowings, and for general cor-porate purposes. Interest on these notes is payable semi-annually in arrears. These notes may be redeemed at our option at any time prior to September 15, 2021 for a specified make whole amount and any time on or after that date at par. These notes are senior unse-cured, unsubordinated obligations that include a change of control repurchase provision.
As part of our acquisition of Yoplait S.A.S., we con-solidated $457.9 million of primarily euro-denominated Euribor-based floating-rate bank debt. In December 2011, we refinanced this debt with $390.5 million of euro-denominated Euribor-based floating-rate bank debt due at various dates through December 15, 2014.
Certain of our long-term debt agreements contain restrictive covenants. As of May 26, 2013, we were in compliance with all of these covenants.
As of May 26, 2013, the $87.1 million pre-tax loss recorded in AOCI associated with our previously des-ignated interest rate swaps will be reclassified to net interest over the remaining lives of the hedged transac-tions. The amount expected to be reclassified from AOCI to net interest in fiscal 2014 is $11.6 million pre-tax.
66 Healthy Growth
A summary of our long-term debt is as follows:In Millions May 26, 2013 May 27,2012
5.65% notes due February 15, 2019 $1,150.0 $1,150.0 5.7% notes due February 15, 2017 1,000.0 1,000.0 3.15% notes due December 15, 2021 1,000.0 1,000.0 5.2% notes due March 17, 2015 750.0 750.0 5.25% notes due August 15, 2013 700.0 700.0 5.4% notes due June 15, 2040 500.0 500.0 4.15% notes due February 15, 2043 500.0 — Floating-rate notes due May 16, 2014 400.0 400.0 Euribor-based floating-rate note
due December 15, 2014 368.6 375.5 1.55% notes due May 16, 2014 300.0 300.0 0.875% notes due January 29, 2016 250.0 — Floating-rate notes due January 29, 2016 250.0 — Medium-term notes, 0.1% to 6.4%,
due fiscal 2014 or later 204.2 204.2 5.65% notes due September 10, 2012 — 520.8 Other, including capital leases (3.4) 2.6 7,369.4 6,903.1 Less amount due within one year (1,443.3) (741.2)Total long-term debt $5,926.1 $6,161.9
Principal payments due on long-term debt in the next five years based on stated contractual maturities, our intent to redeem, or put rights of certain note holders are $1,443.3 million in fiscal 2014, $1,181.9 million in fis-cal 2015, $500.5 million in fiscal 2016, $1,000.0 million in fiscal 2017, and $100.0 million in fiscal 2018.
NOTE 9. REDEEMABLE AND NONCONTROLLING INTERESTS
Our principal redeemable and noncontrolling inter-ests relate to our Yoplait S.A.S., Yoplait Marques S.A.S., and General Mills Cereals, LLC (GMC) subsidiaries. In addition, we have seven foreign subsidiaries that have noncontrolling interests totaling $8.0 million as of May 26, 2013.
We have a 51 percent controlling interest in Yoplait S.A.S. and a 50 percent interest in Yoplait Marques S.A.S. Sodiaal holds the remaining interests in each of the entities. On the acquisition date, we recorded the $904.4 million fair value of Sodiaal’s 49 percent euro-denominated interest in Yoplait S.A.S. as a redeemable interest on our Consolidated Balance Sheets. Sodiaal has the ability to put a limited portion of its redeemable interest to us once per year at fair value up to a maximum of 9 years. We adjust the value of the redeemable interest through additional paid-in capital on our Consolidated
Balance Sheets quarterly to the redeemable interest’s redemption value, which approximates its fair value. Yoplait S.A.S. pays dividends annually if it meets certain financial metrics set forth in its shareholders agreement. As of May 26, 2013, the redemption value of the euro-denominated redeemable interest was $967.5 million.
On the acquisition date, we recorded the $263.8 million fair value of Sodiaal’s 50 percent euro-denominated interest in Yoplait Marques S.A.S. as a noncontrolling interest on our Consolidated Balance Sheets. Yoplait Marques S.A.S. earns a royalty stream through a licensing agreement with Yoplait S.A.S. for the rights to Yoplait and related trademarks. Yoplait Marques S.A.S. pays dividends annually based on its available cash as of its fiscal year end.
In addition, a subsidiary of Yoplait S.A.S. has entered into an exclusive milk supply agreement for its European operations with Sodiaal at market-determined prices through July 1, 2021. Net purchases totaled $263.5 million for fiscal 2013 and $235.7 million for fiscal 2012.
During fiscal 2013, we paid $32.5 million of dividends to Sodiaal under the terms of the Yoplait S.A.S. and Yoplait Marques S.A.S. shareholder agreements.
During the first quarter of fiscal 2013, in conjunction with the consent of the Class A investor, we restructured GMC through the distribution of its manufacturing assets, stock, inventory, cash and certain intellectual property to a wholly owned subsidiary. GMC retained the remaining intellectual property. Immediately following the restructuring, the Class A Interests of GMC were sold by the then current holder to another unrelated third-party investor.
The holder of the GMC Class A Interests receives quarterly preferred distributions from available net income based on the application of a floating preferred return rate, currently equal to the sum of three-month LIBOR plus 110 basis points, to the holder’s capital account balance established in the most recent mark-to-market valuation (currently $251.5 million). The preferred return rate is adjusted every three years through a negotiated agreement with the Class A Interest holder or through a remarketing auction.
For financial reporting purposes, the assets, liabilities, results of operations, and cash flows of our non-wholly owned subsidiaries are included in our Consolidated Financial Statements. The third-party investor’s share of the net earnings of these subsidiaries is reflected in net earnings attributable to redeemable and noncontrolling interests in the Consolidated Statements of Earnings.
Annual Report 2013 67
Our noncontrolling interests contain restrictive covenants. As of May 26, 2013, we were in compliance with all of these covenants.
NOTE 10. STOCKHOLDERS’ EQUITY
Cumulative preference stock of 5.0 million shares, with-out par value, is authorized but unissued.
On June 28, 2010, our Board of Directors authorized the repurchase of up to 100 million shares of our com-mon stock. Purchases under the authorization can be made in the open market or in privately negotiated transactions, including the use of call options and other derivative instruments, Rule 10b5-1 trading plans, and accelerated repurchase programs. The authorization has no specified termination date.
During fiscal 2013, we repurchased 24.2 million shares of common stock for an aggregate purchase price of $1,014.9 million. During fiscal 2012, we repurchased 8.3 million shares of common stock for an aggregate purchase price of $313.0 million. During fiscal 2011, we repurchased 31.8 million shares of common stock for an aggregate purchase price of $1,163.5 million.
During the fourth quarter of fiscal 2013, we entered into an accelerated share repurchase (ASR) agreement with an unrelated third party financial institution to repurchase an aggregate of $300.0 million of our outstanding common stock. The total aggregate number of shares to be repurchased pursuant to this agreement will be determined based on the volume weighted average price of our common stock during the purchase period, less a fixed discount. Under the ASR agreement, we paid $300.0 million to the financial institution and received 5.5 million shares of common stock with a fair value of $270.0 million during the fourth quarter of 2013, which represents approximately 90 percent of the total shares expected to be repurchased under the agreement. We will settle the remaining shares upon the completion of the ASR agreement in the first quarter of fiscal 2014. We recorded this transaction as an increase in treasury stock of $270.0 million, and recorded the remaining $30.0 million as a decrease to additional paid in capital on our Consolidated Balance Sheets as of May 26, 2013. We will reclassify the $30.0 million recorded in additional paid in capital to treasury stock at completion of the ASR. This forward contract is indexed to, and potentially settled in, our common stock. In accordance with the terms of the ASR agreement, we have the option to settle our delivery obligation, if
any, under the forward contract in cash or shares and we may be required to settle in cash in very limited circumstances that are under our control or that require the delivery of cash to all shareholders. Furthermore, the contract specifies a maximum number of shares that we could be required to deliver to the counterparty, and we have sufficient authorized and unissued shares available to deliver the maximum share amount. Based on these circumstances, the forward contract meets the requirements to be classified as permanent equity. The forward contract is accounted for as an equity instrument and does not require hedge or derivative accounting treatment. As long as the forward contract continues to meet the requirements to be classified as permanent equity, we will not record future changes in its fair value. The forward contract continued to meet those requirements as of May 26, 2013, and we expect it will continue to meet those requirements through the settlement date in the first quarter of fiscal 2014.
The initial delivery of 5.5 million shares of our com-mon stock reduced our outstanding shares used to determine our weighted average shares outstanding for purposes of calculating basic and diluted EPS for fiscal 2013. We have also evaluated the ASR agreement for the potential dilutive effects of any shares remaining to be received upon settlement and determined that the addi-tional shares would be anti-dilutive and therefore were not included in our EPS calculation for fiscal 2013.
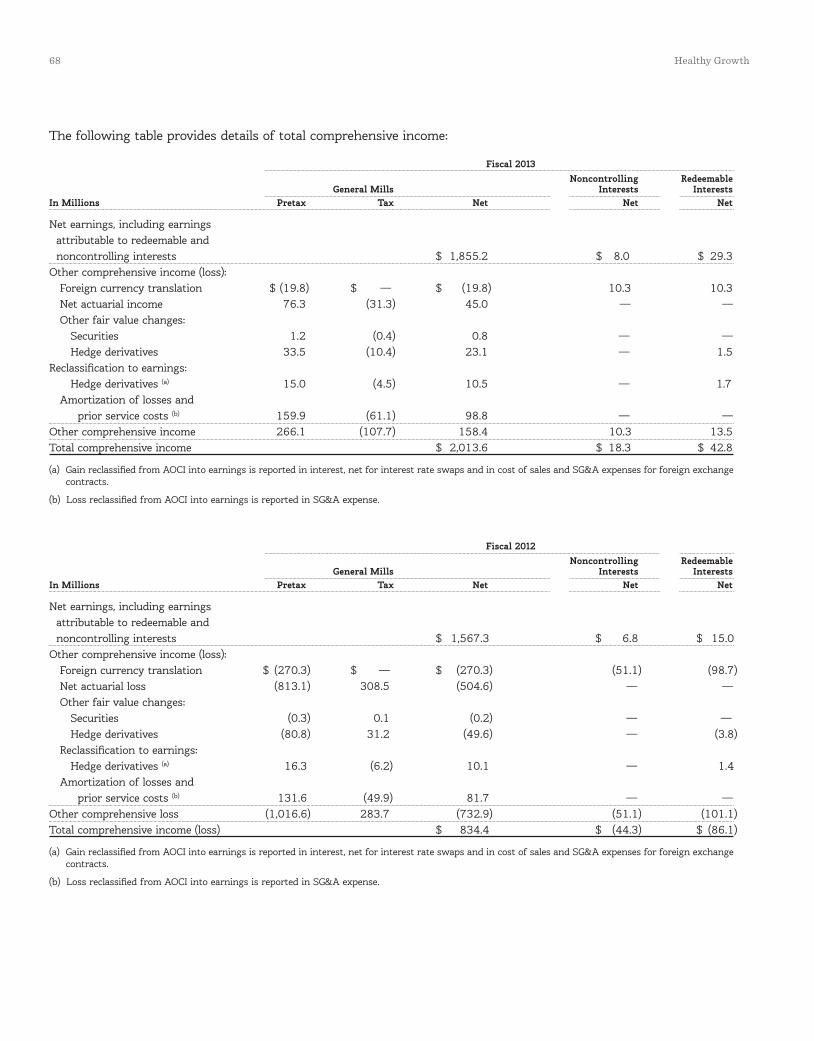
68 Healthy Growth
The following table provides details of total comprehensive income:
Fiscal 2013 Noncontrolling Redeemable
General Mills Interests Interests In Millions Pretax Tax Net Net Net
Net earnings, including earnings attributable to redeemable and noncontrolling interests $ 1,855.2 $ 8.0 $ 29.3 Other comprehensive income (loss): Foreign currency translation $ (19.8) $ — $ (19.8) 10.3 10.3 Net actuarial income 76.3 (31.3) 45.0 — — Other fair value changes: Securities 1.2 (0.4) 0.8 — — Hedge derivatives 33.5 (10.4) 23.1 — 1.5 Reclassification to earnings: Hedge derivatives (a) 15.0 (4.5) 10.5 — 1.7 Amortization of losses and prior service costs (b) 159.9 (61.1) 98.8 — — Other comprehensive income 266.1 (107.7) 158.4 10.3 13.5 Total comprehensive income $ 2,013.6 $ 18.3 $ 42.8
(a) Gain reclassified from AOCI into earnings is reported in interest, net for interest rate swaps and in cost of sales and SG&A expenses for foreign exchange contracts.
(b) Loss reclassified from AOCI into earnings is reported in SG&A expense.
Fiscal 2012 Noncontrolling Redeemable
General Mills Interests Interests In Millions Pretax Tax Net Net Net
Net earnings, including earnings attributable to redeemable and noncontrolling interests $ 1,567.3 $ 6.8 $ 15.0 Other comprehensive income (loss): Foreign currency translation $ (270.3) $ — $ (270.3) (51.1) (98.7) Net actuarial loss (813.1) 308.5 (504.6) — — Other fair value changes: Securities (0.3) 0.1 (0.2) — — Hedge derivatives (80.8) 31.2 (49.6) — (3.8) Reclassification to earnings: Hedge derivatives (a) 16.3 (6.2) 10.1 — 1.4 Amortization of losses and prior service costs (b) 131.6 (49.9) 81.7 — — Other comprehensive loss (1,016.6) 283.7 (732.9) (51.1) (101.1) Total comprehensive income (loss) $ 834.4 $ (44.3) $ (86.1)
(a) Gain reclassified from AOCI into earnings is reported in interest, net for interest rate swaps and in cost of sales and SG&A expenses for foreign exchange contracts.
(b) Loss reclassified from AOCI into earnings is reported in SG&A expense.
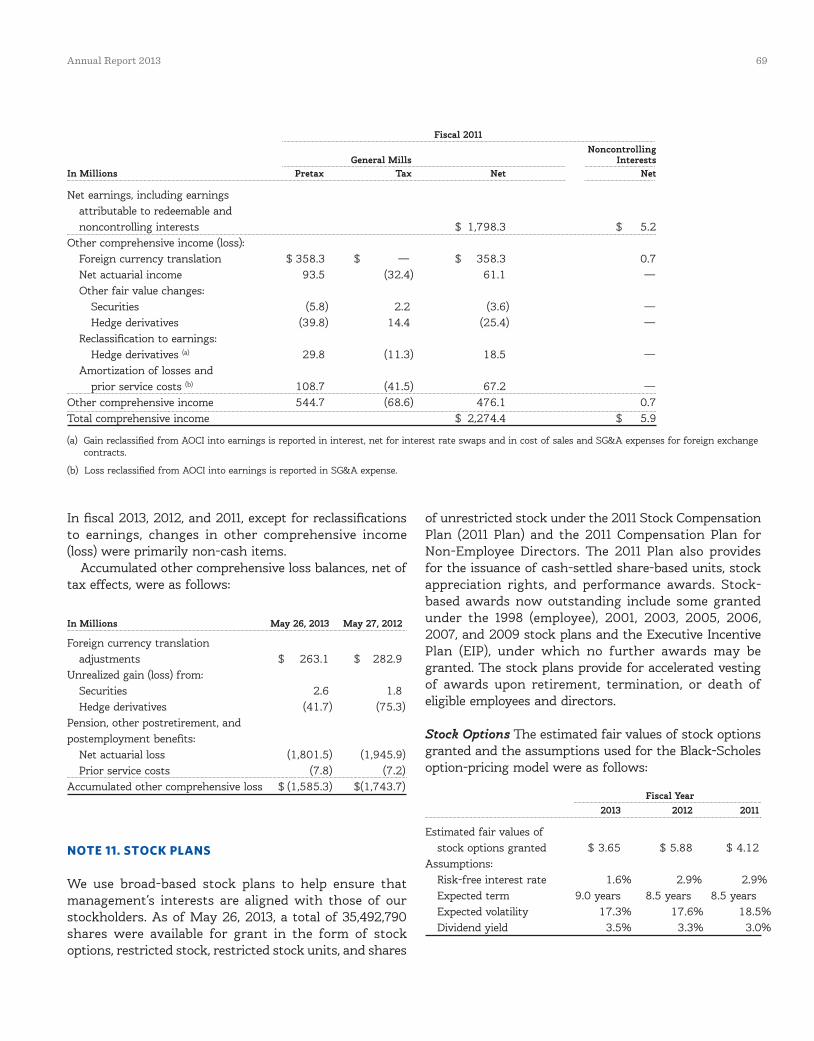
Annual Report 2013 69
Fiscal 2011 Noncontrolling General Mills Interests In Millions Pretax Tax Net Net
Net earnings, including earnings attributable to redeemable and noncontrolling interests $ 1,798.3 $ 5.2 Other comprehensive income (loss): Foreign currency translation $ 358.3 $ — $ 358.3 0.7 Net actuarial income 93.5 (32.4) 61.1 — Other fair value changes: Securities (5.8) 2.2 (3.6) — Hedge derivatives (39.8) 14.4 (25.4) — Reclassification to earnings: Hedge derivatives (a) 29.8 (11.3) 18.5 — Amortization of losses and prior service costs (b) 108.7 (41.5) 67.2 — Other comprehensive income 544.7 (68.6) 476.1 0.7 Total comprehensive income $ 2,274.4 $ 5.9
(a) Gain reclassified from AOCI into earnings is reported in interest, net for interest rate swaps and in cost of sales and SG&A expenses for foreign exchange contracts.
(b) Loss reclassified from AOCI into earnings is reported in SG&A expense.
In fiscal 2013, 2012, and 2011, except for reclassifications to earnings, changes in other comprehensive income (loss) were primarily non-cash items.
Accumulated other comprehensive loss balances, net of tax effects, were as follows:
In Millions May 26, 2013 May 27, 2012
Foreign currency translation adjustments $ 263.1 $ 282.9 Unrealized gain (loss) from: Securities 2.6 1.8 Hedge derivatives (41.7) (75.3)Pension, other postretirement, and postemployment benefits: Net actuarial loss (1,801.5) (1,945.9) Prior service costs (7.8) (7.2)Accumulated other comprehensive loss $ (1,585.3) $ (1,743.7)
NOTE 11. STOCK PLANS
We use broad-based stock plans to help ensure that management’s interests are aligned with those of our stockholders. As of May 26, 2013, a total of 35,492,790 shares were available for grant in the form of stock options, restricted stock, restricted stock units, and shares
of unrestricted stock under the 2011 Stock Compensation Plan (2011 Plan) and the 2011 Compensation Plan for Non-Employee Directors. The 2011 Plan also provides for the issuance of cash-settled share-based units, stock appreciation rights, and performance awards. Stock-based awards now outstanding include some granted under the 1998 (employee), 2001, 2003, 2005, 2006, 2007, and 2009 stock plans and the Executive Incentive Plan (EIP), under which no further awards may be granted. The stock plans provide for accelerated vesting of awards upon retirement, termination, or death of eligible employees and directors.
Stock Options The estimated fair values of stock options granted and the assumptions used for the Black-Scholes option-pricing model were as follows:
Fiscal Year 2013 2012 2011
Estimated fair values of stock options granted $ 3.65 $ 5.88 $ 4.12 Assumptions: Risk-free interest rate 1.6% 2.9% 2.9% Expected term 9.0 years 8.5 years 8.5 years Expected volatility 17.3% 17.6% 18.5% Dividend yield 3.5% 3.3% 3.0%

70 Healthy Growth
The valuation of stock options is a significant account-ing estimate that requires us to use judgments and assumptions that are likely to have a material impact on our financial statements. Annually, we make predic-tive assumptions regarding future stock price volatility, employee exercise behavior, dividend yield, and the for-feiture rate.
We estimate the fair value of each option on the grant date using a Black-Scholes option-pricing model, which requires us to make predictive assumptions regarding future stock price volatility, employee exercise behavior, and dividend yield. We estimate our future stock price volatility using the historical volatility over the expected term of the option, excluding time periods of volatility we believe a marketplace participant would exclude in esti-mating our stock price volatility. We also have considered, but did not use, implied volatility in our estimate, because trading activity in options on our stock, especially those with tenors of greater than 6 months, is insufficient to provide a reliable measure of expected volatility.
Our expected term represents the period of time that options granted are expected to be outstanding based on historical data to estimate option exercises and employee terminations within the valuation model. Separate groups of employees have similar historical exercise behavior and therefore were aggregated into a single pool for valuation purposes. The weighted-average expected term for all employee groups is presented in the table above. The risk-free interest rate for periods during the expected term of the options is based on the U.S. Treasury zero-coupon yield curve in effect at the time of grant.
Any corporate income tax benefit realized upon exer-cise or vesting of an award in excess of that previously recognized in earnings (referred to as a windfall tax ben-efit) is presented in the Consolidated Statements of Cash Flows as a financing cash flow.
Realized windfall tax benefits are credited to additional paid-in capital within the Consolidated Balance Sheets. Realized shortfall tax benefits (amounts which are less than that previously recognized in earnings) are first offset against the cumulative balance of windfall tax benefits, if any, and then charged directly to income tax expense, potentially resulting in volatility in our consoli-dated effective income tax rate. We calculated a cumu-lative memo balance of windfall tax benefits for the purpose of accounting for future shortfall tax benefits.
Options may be priced at 100 percent or more of the fair market value on the date of grant, and generally vest four years after the date of grant. Options generally expire within 10 years and one month after the date of grant.
Information on stock option activity follows:
Weighted- Weighted- Average Average Options Exercise Options Exercise Exercisable Price Per Outstanding Price Per (Thousands) Share (Thousands) Share
Balance as of May 30, 2010 47,726.6 $22.89 81,104.6 $25.17 Granted 5,234.3 37.38 Exercised (18,665.4) 22.59 Forfeited or expired (126.2) 31.26 Balance as of May 29, 2011 39,221.7 23.78 67,547.3 26.82 Granted 4,069.0 37.29 Exercised (10,279.3) 24.12 Forfeited or expired (394.3) 27.88 Balance as of May 27, 2012 39,564.9 25.27 60,942.7 27.96 Granted 3,407.7 38.15 Exercised (16,534.6) 23.49 Forfeited or expired (143.7) 34.06 Balance as of May 26, 2013 29,290.3 $27.69 47,672.1 $30.22
Stock-based compensation expense related to stock option awards was $17.5 million in fiscal 2013, $23.9 million in fiscal 2012, and $26.8 million in fiscal 2011.
Net cash proceeds from the exercise of stock options less shares used for withholding taxes and the intrinsic value of options exercised were as follows:
Fiscal YearIn Millions 2013 2012 2011
Net cash proceeds $300.8 $233.5 $410.4 Intrinsic value of options exercised $297.2 $156.7 $275.6
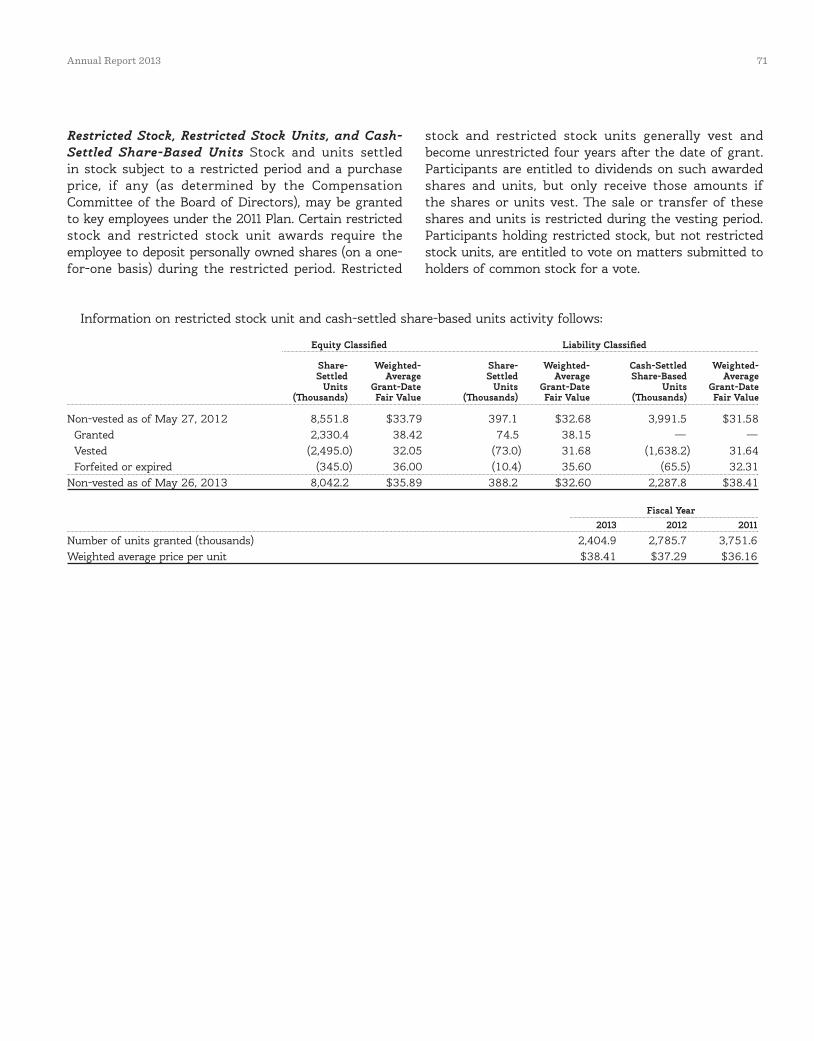
Annual Report 2013 71
Restricted Stock, Restricted Stock Units, and Cash-Settled Share-Based Units Stock and units settled in stock subject to a restricted period and a purchase price, if any (as determined by the Compensation Committee of the Board of Directors), may be granted to key employees under the 2011 Plan. Certain restricted stock and restricted stock unit awards require the employee to deposit personally owned shares (on a one-for-one basis) during the restricted period. Restricted
stock and restricted stock units generally vest and become unrestricted four years after the date of grant. Participants are entitled to dividends on such awarded shares and units, but only receive those amounts if the shares or units vest. The sale or transfer of these shares and units is restricted during the vesting period. Participants holding restricted stock, but not restricted stock units, are entitled to vote on matters submitted to holders of common stock for a vote.
Information on restricted stock unit and cash-settled share-based units activity follows:
Equity Classified Liability Classified
Share- Weighted- Share- Weighted- Cash-Settled Weighted- Settled Average Settled Average Share-Based Average Units Grant-Date Units Grant-Date Units Grant-Date (Thousands) Fair Value (Thousands) Fair Value (Thousands) Fair Value
Non-vested as of May 27, 2012 8,551.8 $33.79 397.1 $32.68 3,991.5 $31.58 Granted 2,330.4 38.42 74.5 38.15 — — Vested (2,495.0) 32.05 (73.0) 31.68 (1,638.2) 31.64 Forfeited or expired (345.0) 36.00 (10.4) 35.60 (65.5) 32.31 Non-vested as of May 26, 2013 8,042.2 $35.89 388.2 $32.60 2,287.8 $38.41
Fiscal YearIn Millions 2013 2012 2011
Number of units granted (thousands) 2,404.9 2,785.7 3,751.6Weighted average price per unit $38.41 $37.29 $36.16
72 Healthy Growth
The total grant-date fair value of restricted stock unit awards that vested during fiscal 2013 was $134.1 million, and $106.0 million vested during fiscal 2012.
As of May 26, 2013, unrecognized compensation expense related to non-vested stock options and restricted stock units was $125.4 million. This expense will be recognized over 17 months, on average.
Stock-based compensation expense related to restricted stock units and cash-settled share-based pay-ment awards was $128.9 million for fiscal 2013, $124.3 million for fiscal 2012, and $141.2 million for fiscal 2011.
NOTE 12. EARNINGS PER SHARE
Basic and diluted EPS were calculated using the following:
Fiscal YearIn Millions, Except per Share Data 2013 2012 2011
Net earnings attributable to General Mills $1,855.2 $1,567.3 $1,798.3
Average number of common shares - basic EPS 648.6 648.1 642.7
Incremental share effect from: (a) Stock options 12.0 13.9 16.6 Restricted stock, restricted stock units, and other 5.0 4.7 5.5 Average number of common shares - diluted EPS 665.6 666.7 664.8 Earnings per share - basic $ 2.86 $ 2.42 $ 2.80 Earnings per share - diluted $ 2.79 $ 2.35 $ 2.70
(a) Incremental shares from stock options and restricted stock units are computed by the treasury stock method. Stock options and restricted stock units excluded from our computation of diluted EPS because they were not dilutive were as follows:
Fiscal YearIn Millions 2013 2012 2011
Anti-dilutive stock options and restricted stock units 0.6 5.8 4.8
NOTE 13. RETIREMENT BENEFITS AND POSTEMPLOYMENT BENEFITS
Defined Benefit Pension Plans We have defined ben-efit pension plans covering most employees in the United States, Canada, France, and the United Kingdom. Benefits for salaried employees are based on length of service and final average compensation. Benefits for hourly employees include various monthly amounts for each year of credited service. Our funding policy is con-sistent with the requirements of applicable laws. We made $200.0 million of voluntary contributions to our principal U.S. plans in each of fiscal 2013 and fiscal 2012. We do not expect to be required to make any contribu-tions in fiscal 2014. Our principal domestic retirement plan covering salaried employees has a provision that any excess pension assets would be allocated to active participants if the plan is terminated within five years of a change in control. In fiscal 2012, we announced changes to our U.S. defined benefit pension plans. All new salaried employees hired on or after June 1, 2013 are eligible for a new retirement program that does not include a defined benefit pension plan. Current salaried employees remain in the existing defined benefit pen-sion plan with adjustments to benefits.
Other Postretirement Benefit Plans We also sponsor plans that provide health care benefits to the majority of our retirees in the United States, Canada, and Brazil. The United States salaried health care benefit plan is contributory, with retiree contributions based on years of service. We make decisions to fund related trusts for certain employees and retirees on an annual basis. We did not make voluntary contributions to these plans in fiscal 2013 or fiscal 2012.
Health Care Cost Trend Rates Assumed health care cost trends are as follows: Fiscal Year 2013 2012
Health care cost trend rate for next year 8.0% 8.5%Rate to which the cost trend rate is
assumed to decline (ultimate rate) 5.2% 5.2%Year that the rate reaches the
ultimate trend rate 2019 2019
Annual Report 2013 73
We review our health care cost trend rates annually. Our review is based on data we collect about our health care claims experience and information provided by our actuaries. This information includes recent plan experience, plan design, overall industry experience and projections, and assumptions used by other similar organizations. Our initial health care cost trend rate is adjusted as necessary to remain consistent with this review, recent experiences, and short-term expectations. Our initial health care cost trend rate assumption is 8.0 percent for all retirees at the end of fiscal 2013. Rates are graded down annually until the ultimate trend rate of 5.2 percent is reached in 2019 for all retirees. The trend rates are applicable for calculations only if the retirees’ benefits increase as a result of health care inflation. The ultimate trend rate is adjusted annually, as necessary, to approximate the current economic view on the rate of long-term inflation plus an appropriate health care cost premium. Assumed trend rates for health care costs have an important effect on the amounts reported for the other postretirement benefit plans.
A one percentage point change in the health care cost trend rate would have the following effects: One One Percentage Percentage Point PointIn Millions Increase Decrease
Effect on the aggregate of the service and interest cost components in fiscal 2014 $ 5.2 $ (4.4)Effect on the other postretirement accumulated benefit obligation as of May 26, 2013 93.8 (82.9)
The Patient Protection and Affordable Care Act, as amended by the Health Care and Education Reconciliation Act of 2010 (collectively, the Act) was signed into law in March 2010. The Act codifies health care reforms with staggered effective dates from 2010 to 2018. Estimates of the future impacts of several of the Act’s provisions are incorporated into our postre-tirement benefit liability.
Postemployment Benefit Plans Under certain circum-stances, we also provide accruable benefits to former or inactive employees in the United States, Canada, and Mexico, and members of our Board of Directors, including severance and certain other benefits pay-able upon death. We recognize an obligation for any of these benefits that vest or accumulate with service. Postemployment benefits that do not vest or accumu-late with service (such as severance based solely on annual pay rather than years of service) are charged to expense when incurred. Our postemployment ben-efit plans are unfunded.
We use our fiscal year end as the measurement date for our defined benefit pension and other postretire-ment benefit plans.
74 Healthy Growth
Summarized financial information about defined benefit pension, other postretirement, and postemployment benefit plans is presented below:
OtherDefined Benefit Postretirement PostemploymentPension Plans Benefit Plans Benefit Plans
Fiscal Year Fiscal Year Fiscal Year
In Millions 2013 2012 2013 2012 2013 2012
Change in Plan Assets: Fair value at beginning of year $4,353.9 $4,264.0 $ 358.8 $ 353.8 Actual return on assets 698.7 56.3 67.9 (4.8) Employer contributions 223.1 222.1 0.1 0.1 Plan participant contributions 15.2 20.3 13.0 12.2 Benefits payments (222.6) (203.3) (2.9) (2.5)Foreign currency (2.2) (5.5) — —
Fair value at end of year $5,066.1 $4,353.9 $ 436.9 $ 358.8 Change in Projected Benefit Obligation:
Benefit obligation at beginning of year $4,991.5 $4,458.4 $ 1,129.0 $ 1,065.8 $ 141.3 $ 131.3 Service cost 124.4 114.3 21.6 18.0 7.8 7.5 Interest cost 237.3 237.9 52.1 55.6 4.4 4.8
Plan amendment 0.2 (13.4) — — 4.5 — Curtailment/other — (27.1) — 0.1 11.4 11.9 Plan participant contributions 15.2 20.3 13.0 12.2 — — Medicare Part D reimbursements — — 4.1 4.7 — — Actuarial loss (gain) 237.5 405.7 (23.0) 28.4 (10.4) 5.5 Benefits payments (222.8) (203.5) (58.9) (55.5) (13.6) (19.6)
Foreign currency (1.9) (5.9) (0.1) (0.3) — (0.1) Acquisitions — 4.8 10.4 — — — Projected benefit obligation at end of year $5,381.4 $4,991.5 $ 1,148.2 $ 1,129.0 $ 145.4 $ 141.3 Plan assets less than benefit obligation as of fiscal year end $ (315.3) $ (637.6) $ (711.3) $ (770.2) $ (145.4) $ (141.3)
The accumulated benefit obligation for all defined benefit pension plans was $4,888.8 million as of May 26, 2013, and $4,504.7 million as of May 27, 2012.
Amounts recognized in AOCI as of May 26, 2013, and May 27, 2012, are as follows:
Other Defined Benefit Postretirement Postemployment Pension Plans Benefit Plans Benefit Plans Total
Fiscal Year Fiscal Year Fiscal Year Fiscal Year
In Millions 2013 2012 2013 2012 2013 2012 2013 2012
Net actuarial loss $(1,625.1) $(1,714.1) $(168.2) $(215.0) $ (8.2) $(16.8) $(1,801.5) $ (1,945.9)Prior service (costs) credits (18.5) (22.0) 16.6 19.0 (5.9) (4.2) (7.8) (7.2)Amounts recorded in accumulated
other comprehensive loss $(1,643.6) $(1,736.1) $(151.6) $(196.0) $(14.1) $(21.0) $(1,809.3) $ (1,953.1)
Annual Report 2013 75
Plans with accumulated benefit obligations in excess of plan assets are as follows:
Other Defined Benefit Postretirement Postemployment Pension Plans Benefit Plans Benefit Plans
Fiscal Year Fiscal Year Fiscal Year
In Millions 2013 2012 2013 2012 2013 2012
Projected benefit obligation $396.9 $423.4 $ — $ — $ — $ — Accumulated benefit obligation 346.6 361.5 1,132.9 1,129.0 145.4 141.3 Plan assets at fair value 9.5 53.0 436.9 358.8 — —
Components of net periodic benefit expense are as follows: Other Defined Benefit Postretirement Postemployment Pension Plans Benefit Plans Benefit Plans
Fiscal Year Fiscal Year Fiscal Year
In Millions 2013 2012 2011 2013 2012 2011 2013 2012 2011
Service cost $ 124.4 $ 114.3 $ 101.4 $ 21.6 $ 18.0 $ 18.7 $ 7.8 $ 7.5 $ 8.0 Interest cost 237.3 237.9 230.9 52.1 55.6 60.1 4.4 4.8 5.1 Expected return on plan assets (428.0) (440.3) (408.5) (32.1) (35.5) (33.2) — — — Amortization of losses 136.0 108.1 81.4 17.1 14.5 14.4 2.1 1.7 2.1 Amortization of prior service costs (credits) 6.2 8.6 9.0 (3.4) (3.4) (0.6) 1.9 2.1 2.4 Other adjustments — — — — — — 11.4 12.0 4.2 Net expense $ 75.9 $ 28.6 $ 14.2 $ 55.3 $ 49.2 $ 59.4 $ 27.6 $ 28.1 $ 21.8
We expect to recognize the following amounts in net periodic benefit expense in fiscal 2014:
Defined Benefit Other Postretirement PostemploymentIn Millions Pension Plans Benefit Plans Benefit Plans
Amortization of losses $ 151.1 $ 15.4 $ 0.6Amortization of prior service costs (credits) 5.6 (3.4) 2.4
Assumptions Weighted-average assumptions used to determine fiscal year-end benefit obligations are as follows:
Other Defined Benefit Postretirement Postemployment Pension Plans Benefit Plans Benefit Plans
Fiscal Year Fiscal Year Fiscal Year
2013 2012 2013 2012 2013 2012
Discount rate 4.54% 4.85% 4.50% 4.70% 3.70% 3.86%Rate of salary increases 4.44 4.44 — — 4.44 4.45

76 Healthy Growth
Weighted-average assumptions used to determine fiscal year net periodic benefit expense are as follows:
Other Defined Benefit Postretirement Postemployment
Pension Plans Benefit Plans Benefit Plans
Fiscal Year Fiscal Year Fiscal Year
2013 2012 2011 2013 2012 2011 2013 2012 2011
Discount rate 4.85% 5.45% 5.85% 4.70% 5.35% 5.80% 3.86% 4.77% 5.12%Rate of salary increases 4.44 4.92 4.93 — — — 4.45 4.92 4.93 Expected long-term rate of
return on plan assets 8.53 9.52 9.53 8.13 9.32 9.33 — — —
Discount Rates Our discount rate assumptions are determined annually as of the last day of our fiscal year for our defined benefit pension, other postretire-ment, and postemployment benefit plan obligations. We also use the same discount rates to determine defined benefit pension, other postretirement, and pos-temployment benefit plan income and expense for the following fiscal year. We work with our outside actuar-ies to determine the timing and amount of expected future cash outflows to plan participants and, using the Aa Above Median corporate bond yield, to develop
a forward interest rate curve, including a margin to that index based on our credit risk. This forward interest rate curve is applied to our expected future cash out-flows to determine our discount rate assumptions.
Fair Value of Plan Assets The fair values of our pension and postretirement benefit plans’ assets and their respec-tive levels in the fair value hierarchy at May 26, 2013 and May 27, 2012, by asset category were as follows:
May 26, 2013In Millions Level 1 Level 2 Level 3 Total Assets
Fair value measurement of pension plan assets: Equity (a) $ 1,439.4 $ 828.3 $ 559.3 $ 2,827.0
Fixed income (b) 476.6 801.0 — 1,277.6 Real asset investments (c) 131.1 169.1 430.4 730.6 Other investments (d) — 60.9 0.3 61.2 Cash and accruals 169.7 — — 169.7
Total fair value measurement of pension plan assets $ 2,216.8 $ 1,859.3 $ 990.0 $ 5,066.1 Fair value measurement of postretirement benefit plan assets: Equity (a) $ 93.1 $ 92.0 $ 20.2 $ 205.3 Fixed income (b) 17.2 50.3 — 67.5 Real asset investments (c) 1.8 7.1 14.5 23.4 Other investments (d) — 130.9 — 130.9 Cash and accruals 9.8 — — 9.8 Fair value measurement of postretirement benefit plan assets $ 121.9 $ 280.3 $ 34.7 $ 436.9
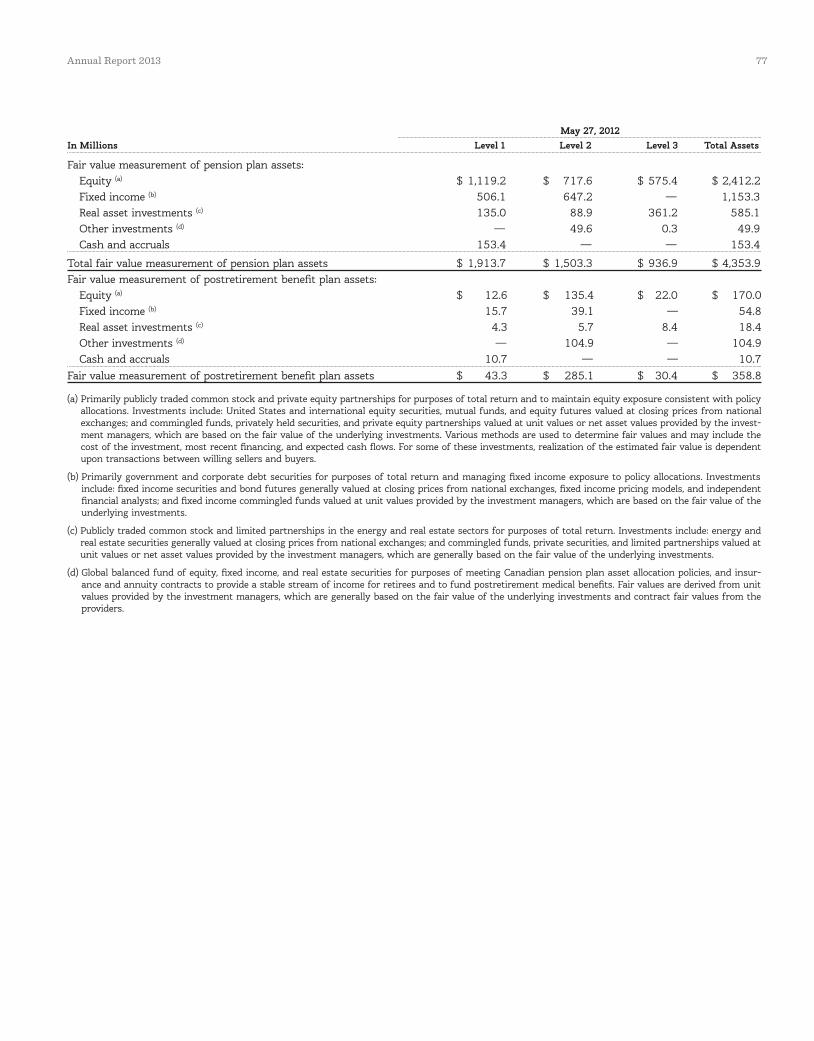
Annual Report 2013 77
May 27, 2012In Millions Level 1 Level 2 Level 3 Total Assets
Fair value measurement of pension plan assets: Equity (a) $ 1,119.2 $ 717.6 $ 575.4 $ 2,412.2 Fixed income (b) 506.1 647.2 — 1,153.3 Real asset investments (c) 135.0 88.9 361.2 585.1 Other investments (d) — 49.6 0.3 49.9 Cash and accruals 153.4 — — 153.4
Total fair value measurement of pension plan assets $ 1,913.7 $ 1,503.3 $ 936.9 $ 4,353.9 Fair value measurement of postretirement benefit plan assets: Equity (a) $ 12.6 $ 135.4 $ 22.0 $ 170.0 Fixed income (b) 15.7 39.1 — 54.8 Real asset investments (c) 4.3 5.7 8.4 18.4 Other investments (d) — 104.9 — 104.9 Cash and accruals 10.7 — — 10.7 Fair value measurement of postretirement benefit plan assets $ 43.3 $ 285.1 $ 30.4 $ 358.8
(a) Primarily publicly traded common stock and private equity partnerships for purposes of total return and to maintain equity exposure consistent with policy allocations. Investments include: United States and international equity securities, mutual funds, and equity futures valued at closing prices from national exchanges; and commingled funds, privately held securities, and private equity partnerships valued at unit values or net asset values provided by the invest-ment managers, which are based on the fair value of the underlying investments. Various methods are used to determine fair values and may include the cost of the investment, most recent financing, and expected cash flows. For some of these investments, realization of the estimated fair value is dependent upon transactions between willing sellers and buyers.
(b) Primarily government and corporate debt securities for purposes of total return and managing fixed income exposure to policy allocations. Investments include: fixed income securities and bond futures generally valued at closing prices from national exchanges, fixed income pricing models, and independent financial analysts; and fixed income commingled funds valued at unit values provided by the investment managers, which are based on the fair value of the underlying investments.
(c) Publicly traded common stock and limited partnerships in the energy and real estate sectors for purposes of total return. Investments include: energy and real estate securities generally valued at closing prices from national exchanges; and commingled funds, private securities, and limited partnerships valued at unit values or net asset values provided by the investment managers, which are generally based on the fair value of the underlying investments.
(d) Global balanced fund of equity, fixed income, and real estate securities for purposes of meeting Canadian pension plan asset allocation policies, and insur-ance and annuity contracts to provide a stable stream of income for retirees and to fund postretirement medical benefits. Fair values are derived from unit values provided by the investment managers, which are generally based on the fair value of the underlying investments and contract fair values from the providers.
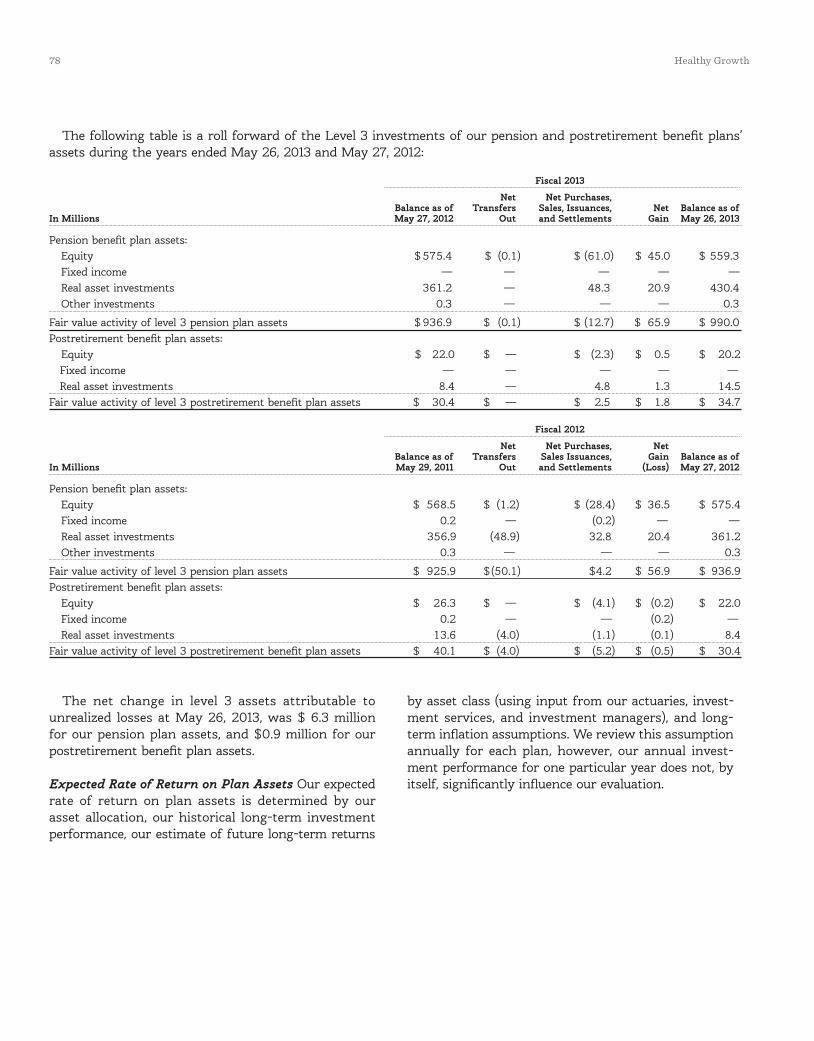
78 Healthy Growth
The following table is a roll forward of the Level 3 investments of our pension and postretirement benefit plans’ assets during the years ended May 26, 2013 and May 27, 2012:
Fiscal 2013
Net Net Purchases, Balance as of Transfers Sales, Issuances, Net Balance as of
In Millions May 27, 2012 Out and Settlements Gain May 26, 2013
Pension benefit plan assets:Equity $ 575.4 $ (0.1) $ (61.0) $ 45.0 $ 559.3
Fixed income — — — — — Real asset investments 361.2 — 48.3 20.9 430.4 Other investments 0.3 — — — 0.3
Fair value activity of level 3 pension plan assets $ 936.9 $ (0.1) $ (12.7) $ 65.9 $ 990.0 Postretirement benefit plan assets: Equity $ 22.0 $ — $ (2.3) $ 0.5 $ 20.2 Fixed income — — — — — Real asset investments 8.4 — 4.8 1.3 14.5 Fair value activity of level 3 postretirement benefit plan assets $ 30.4 $ — $ 2.5 $ 1.8 $ 34.7
Fiscal 2012
Net Net Purchases, Net Balance as of Transfers Sales Issuances, Gain Balance as of
In Millions May 29, 2011 Out and Settlements (Loss) May 27, 2012
Pension benefit plan assets:Equity $ 568.5 $ (1.2) $ (28.4) $ 36.5 $ 575.4
Fixed income 0.2 — (0.2) — — Real asset investments 356.9 (48.9) 32.8 20.4 361.2 Other investments 0.3 — — — 0.3
Fair value activity of level 3 pension plan assets $ 925.9 $ (50.1) $4.2 $ 56.9 $ 936.9 Postretirement benefit plan assets: Equity $ 26.3 $ — $ (4.1) $ (0.2) $ 22.0 Fixed income 0.2 — — (0.2) — Real asset investments 13.6 (4.0) (1.1) (0.1) 8.4 Fair value activity of level 3 postretirement benefit plan assets $ 40.1 $ (4.0) $ (5.2) $ (0.5) $ 30.4
The net change in level 3 assets attributable to unrealized losses at May 26, 2013, was $ 6.3 million for our pension plan assets, and $0.9 million for our postretirement benefit plan assets.
Expected Rate of Return on Plan Assets Our expected rate of return on plan assets is determined by our asset allocation, our historical long-term investment performance, our estimate of future long-term returns
by asset class (using input from our actuaries, invest-ment services, and investment managers), and long-term inflation assumptions. We review this assumption annually for each plan, however, our annual invest-ment performance for one particular year does not, by itself, significantly influence our evaluation.
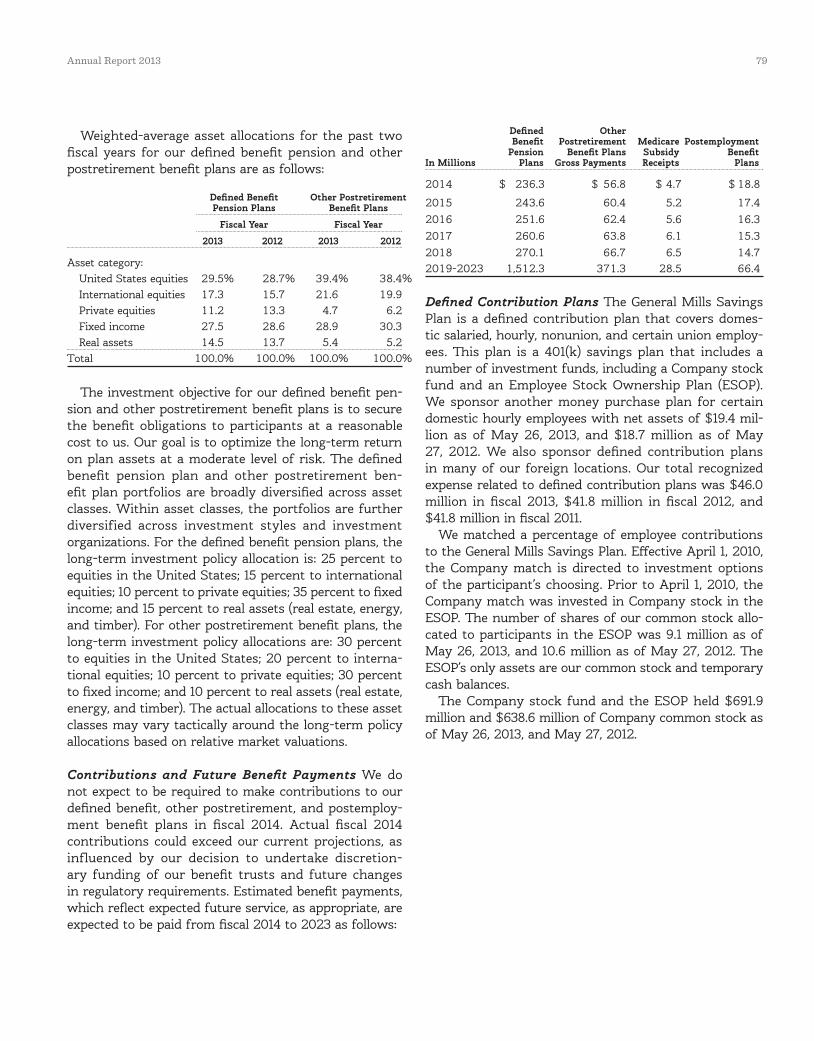
Annual Report 2013 79
Weighted-average asset allocations for the past two fiscal years for our defined benefit pension and other postretirement benefit plans are as follows:
Defined Benefit Other Postretirement Pension Plans Benefit Plans
Fiscal Year Fiscal Year
2013 2012 2013 2012
Asset category: United States equities 29.5% 28.7% 39.4% 38.4% International equities 17.3 15.7 21.6 19.9 Private equities 11.2 13.3 4.7 6.2 Fixed income 27.5 28.6 28.9 30.3 Real assets 14.5 13.7 5.4 5.2 Total 100.0% 100.0% 100.0% 100.0%
The investment objective for our defined benefit pen-sion and other postretirement benefit plans is to secure the benefit obligations to participants at a reasonable cost to us. Our goal is to optimize the long-term return on plan assets at a moderate level of risk. The defined benefit pension plan and other postretirement ben-efit plan portfolios are broadly diversified across asset classes. Within asset classes, the portfolios are further diversified across investment styles and investment organizations. For the defined benefit pension plans, the long-term investment policy allocation is: 25 percent to equities in the United States; 15 percent to international equities; 10 percent to private equities; 35 percent to fixed income; and 15 percent to real assets (real estate, energy, and timber). For other postretirement benefit plans, the long-term investment policy allocations are: 30 percent to equities in the United States; 20 percent to interna-tional equities; 10 percent to private equities; 30 percent to fixed income; and 10 percent to real assets (real estate, energy, and timber). The actual allocations to these asset classes may vary tactically around the long-term policy allocations based on relative market valuations.
Contributions and Future Benefit Payments We do not expect to be required to make contributions to our defined benefit, other postretirement, and postemploy-ment benefit plans in fiscal 2014. Actual fiscal 2014 contributions could exceed our current projections, as influenced by our decision to undertake discretion-ary funding of our benefit trusts and future changes in regulatory requirements. Estimated benefit payments, which reflect expected future service, as appropriate, are expected to be paid from fiscal 2014 to 2023 as follows:
Defined Other Benefit Postretirement Medicare Postemployment Pension Benefit Plans Subsidy BenefitIn Millions Plans Gross Payments Receipts Plans
2014 $ 236.3 $ 56.8 $ 4.7 $ 18.8
2015 243.6 60.4 5.2 17.4 2016 251.6 62.4 5.6 16.3 2017 260.6 63.8 6.1 15.3 2018 270.1 66.7 6.5 14.7 2019-2023 1,512.3 371.3 28.5 66.4
Defined Contribution Plans The General Mills Savings Plan is a defined contribution plan that covers domes-tic salaried, hourly, nonunion, and certain union employ-ees. This plan is a 401(k) savings plan that includes a number of investment funds, including a Company stock fund and an Employee Stock Ownership Plan (ESOP). We sponsor another money purchase plan for certain domestic hourly employees with net assets of $19.4 mil-lion as of May 26, 2013, and $18.7 million as of May 27, 2012. We also sponsor defined contribution plans in many of our foreign locations. Our total recognized expense related to defined contribution plans was $46.0 million in fiscal 2013, $41.8 million in fiscal 2012, and $41.8 million in fiscal 2011.
We matched a percentage of employee contributions to the General Mills Savings Plan. Effective April 1, 2010, the Company match is directed to investment options of the participant’s choosing. Prior to April 1, 2010, the Company match was invested in Company stock in the ESOP. The number of shares of our common stock allo-cated to participants in the ESOP was 9.1 million as of May 26, 2013, and 10.6 million as of May 27, 2012. The ESOP’s only assets are our common stock and temporary cash balances.
The Company stock fund and the ESOP held $691.9 million and $638.6 million of Company common stock as of May 26, 2013, and May 27, 2012.

80 Healthy Growth
NOTE 14. INCOME TAXES
The components of earnings before income taxes and after-tax earnings from joint ventures and the corre-sponding income taxes thereon are as follows:
Fiscal YearIn Millions 2013 2012 2011
Earnings before income taxes and after-tax earnings from joint ventures: United States $2,051.2 $1,816.5 $2,144.8 Foreign 483.7 394.0 283.4
Total earnings before income taxes and after-tax earnings from joint ventures $2,534.9 $2,210.5 $2,428.2
Income taxes:Currently payable: Federal $ 493.4 $ 399.1 $ 370.0
State and local 39.5 52.0 76.9 Foreign 126.5 109.1 68.9 Total current 659.4 560.2 515.8 Deferred: Federal 68.8 167.9 178.9 State and local 19.2 (1.3) 30.8 Foreign (6.2) (17.2) (4.4) Total deferred 81.8 149.4 205.3 Total income taxes $ 741.2 $ 709.6 $ 721.1
The following table reconciles the United States statu-tory income tax rate with our effective income tax rate:
Fiscal Year 2013 2012 2011
United States statutory rate 35.0% 35.0% 35.0%State and local income taxes,
net of federal tax benefits 1.3 1.4 2.7 Foreign rate differences (0.6) (2.0) (2.0) Deferred taxes for Medicare subsidies (1.3) — — GMC subsidiary restructure (2.5) — — Court decisions and audit settlements — — (3.7)Domestic manufacturing deduction (2.1) (1.8) (1.6)Other, net (0.6) (0.5) (0.7)Effective income tax rate 29.2% 32.1% 29.7%
The tax effects of temporary differences that give rise to deferred tax assets and liabilities are as follows:
In Millions May 26, 2013 May 27, 2012
Accrued liabilities $ 154.6 $ 86.9 Compensation and employee benefits 619.2 635.4 Unrealized hedge losses 6.9 26.4Pension liability 112.5 240.1 Tax credit carryforwards 78.0 86.5 Stock, partnership, and miscellaneous investments 461.1 534.3 Capital losses 13.6 90.7 Net operating losses 65.1 130.6 Other 138.8 151.9 Gross deferred tax assets 1,649.8 1,982.8 Valuation allowance 232.8 384.4 Net deferred tax assets 1,417.0 1,598.4 Brands 1,380.4 1,292.8 Fixed assets 537.4 500.1 Intangible assets 168.3 289.1 Tax lease transactions 55.1 56.5 Inventories 52.0 55.9 Stock, partnership, and miscellaneous investments 456.7 468.2 Unrealized hedges — — Other 28.2 47.5 Gross deferred tax liabilities 2,678.1 2,710.1 Net deferred tax liability $ 1,261.1 $ 1,111.7
We have established a valuation allowance against certain of the categories of deferred tax assets described above as current evidence does not suggest we will realize sufficient taxable income of the appropriate character (e.g., ordinary income versus capital gain income) within the carryforward period to allow us to realize these deferred tax benefits.
Of the total valuation allowance of $232.8 million, $161.8 million relates to a deferred tax asset for losses recorded as part of the Pillsbury acquisition. Of the remaining valuation allowance, $67.1 million relates to state net operating loss carryforwards and various foreign loss carryforwards. During fiscal 2013, we reversed deferred tax assets and related valuation allowances of $85.6 million due to the expiration of certain capital loss carryovers. We have approximately $72 million of U.S. foreign tax credit carryforwards for which no valuation allowance has been recorded. As of May 26, 2013, we believe it is more-likely-than-not that the remainder of our deferred tax assets are realizable.
Annual Report 2013 81
The carryforward periods on our foreign loss carry-forwards are as follows: $33.4 million do not expire; $4.6 million expire in fiscal 2014 and 2015; and $21.6 million expire in fiscal 2016 and beyond.
We have not recognized a deferred tax liability for unremitted earnings of approximately $2.7 billion from our foreign operations because our subsidiaries have invested or will invest the undistributed earnings indefi-nitely, or the earnings will be remitted in a tax-neutral transaction. It is not practicable for us to determine the amount of unrecognized deferred tax liabilities on these indefinitely reinvested earnings. Deferred taxes are recorded for earnings of our foreign operations when we determine that such earnings are no longer indefi-nitely reinvested.
In fiscal 2010, we recorded a non-cash income tax charge and decrease to our deferred tax assets of $35.0 million related to a reduction of the tax deductibility of retiree health cost to the extent of any Medicare Part D subsidy received beginning in fiscal 2013 under the enactment of the Patient Protection and Affordable Care Act, as amended by the Health Care and Education Reconciliation Act of 2010. During fiscal 2013, we took certain actions to restore part of the tax benefits asso-ciated with Medicare Part D subsidies and recorded a $33.7 million discrete decrease to income tax expense and an increase to our deferred tax assets.
During the first quarter of fiscal 2013, in conjunction with the consent of the Class A investor, we restruc-tured GMC through the distribution of its manufactur-ing assets, stock, inventory, cash and certain intellectual property to a wholly owned subsidiary. GMC retained the remaining intellectual property. Immediately follow-ing this restructuring, the Class A Interests were sold by the then current holder to another unrelated third party investor. As a result of these transactions, we recorded a $63.3 million decrease to deferred income tax liabilities related to the tax basis of the investment in GMC and certain distributed assets, with a corresponding discrete non-cash reduction to income taxes in fiscal 2013.
We are subject to federal income taxes in the United States as well as various state, local, and foreign jurisdictions. A number of years may elapse before an uncertain tax position is audited and finally resolved. While it is often difficult to predict the final outcome or the timing of resolution of any particular uncertain tax position, we believe that our liabilities for income taxes reflect the most likely outcome. We adjust these liabilities, as well as the related interest, in light of
changing facts and circumstances. Settlement of any particular position would usually require the use of cash.
The number of years with open tax audits varies depending on the tax jurisdiction. Our major taxing juris-dictions include the United States (federal and state) and Canada. Various tax examinations by United States state taxing authorities could be conducted for any open tax year, which vary by jurisdiction, but are generally from 3 to 5 years.
The Internal Revenue Service (IRS) initiated its audit of our fiscal 2011 and fiscal 2012 tax years during fiscal 2013. Currently, several state examinations are in progress.
During fiscal 2013, the IRS concluded its field exami-nation of our 2009 and 2010 tax years. The IRS has proposed adjustments related to the timing for deducting accrued bonus expenses. We believe our position is sup-ported by substantial technical authority and have filed an appeal with the IRS Appeals Division (IRS Appeals). The audit closure and related proposed adjustments did not have a material impact on our current year results of operations or financial position. If we are unsuccess-ful in defending our position with respect to accrued bonuses, we will incur a one-time cash tax payment of approximately $80 million. As of May 26, 2013, we have effectively settled all issues with the IRS for fiscal years 2008 and prior.
Also during fiscal 2013, the California Court of Appeal issued an adverse decision concerning our state income tax apportionment calculations. We had previously recorded an $11.5 million increase in our total liabilities for uncertain tax positions in fiscal 2011 following an unfavorable decision by the Superior Court of the State of California related to this matter. We expect to pay a majority of the tax due related to this issue in fiscal 2014.
During fiscal 2012, we reached a settlement with IRS Appeals concerning research and development tax cred-its claimed for fiscal years 2002 to 2008. This settlement did not have a material impact on our results of opera-tions or financial position.
During fiscal 2011, we reached a settlement with IRS Appeals concerning certain corporate income tax adjust-ments for fiscal years 2002 to 2008. The adjustments primarily relate to the amount of capital loss, deprecia-tion, and amortization we reported as a result of the sale of noncontrolling interests in our GMC subsidiary. As a result, we recorded a $108.1 million reduction in our total liabilities for uncertain tax positions in fiscal 2011. We made payments totaling $385.3 million in fiscal 2011 related to this settlement.
82 Healthy Growth
The Canadian Revenue Agency (CRA) reviewed our Canadian income tax returns for fiscal years 2003 to 2005 and raised assessments for these years to which we have objected. During fiscal 2013, the issue related to our 2003 fiscal year was resolved with no adjustment. The issue for fiscal years 2004 and 2005 is currently under review by the U.S. and Canadian competent authority divisions. The CRA initiated its audit of our fiscal years 2008 through 2011 during fiscal year 2013. The CRA audit for fiscal 2008 was closed with no significant adjustments. The audit for fiscal years 2009 through 2011 is ongoing.
We do not anticipate that any United States or Canadian tax adjustments will have a significant impact on our financial position or results of operations.
We apply a more-likely-than-not threshold to the rec-ognition and derecognition of uncertain tax positions. Accordingly, we recognize the amount of tax benefit that has a greater than 50 percent likelihood of being ultimately realized upon settlement. Future changes in judgment related to the expected ultimate resolution of uncertain tax positions will affect earnings in the quar-ter of such change.
The following table sets forth changes in our total gross unrecognized tax benefit liabilities, excluding accrued interest, for fiscal 2013. Approximately $92 mil-lion of this total represents the amount that, if recog-nized, would affect our effective income tax rate in future periods. This amount differs from the gross unrecog-nized tax benefits presented in the table because certain of the liabilities below would impact deferred taxes if recognized or are the result of stock compensation items impacting additional paid-in capital. We also would record a decrease in U.S. federal income taxes upon rec-ognition of the state tax benefits included therein.
Fiscal YearIn Millions 2013 2012
Balance, beginning of year $231.3 $226.2Tax positions related to current year:
Additions 38.5 23.8 Tax positions related to prior years: Additions 69.6 24.3 Reductions (74.0) (13.4) Settlements (39.0) (6.6)Lapses in statutes of limitations (10.2) (23.0)Balance, end of year $216.2 $231.3
As of May 26, 2013, we expect to pay approximately $12 million of unrecognized tax benefit liabilities and accrued interest within the next 12 months. We are not able to reasonably estimate the timing of future cash flows beyond 12 months due to uncertainties in the timing of tax audit outcomes. The remaining amount of our unrecognized tax liability was classified in other liabilities.
We report accrued interest and penalties related to unrecognized tax benefit liabilities in income tax expense. For fiscal 2013, we recognized a net benefit of $3.0 mil-lion of tax-related net interest and penalties, and had $53.1 million of accrued interest and penalties as of May 26, 2013. For fiscal 2012, we recognized $0.2 million asso-ciated with tax-related interest and penalties, and had $49.3 million of accrued interest and penalties as of May 27, 2012.
NOTE 15. LEASES, OTHER COMMITMENTS, ANd CONTINgENCIES
An analysis of rent expense by type of property for oper-ating leases follows:
Fiscal YearIn Millions 2013 2012 2011
Warehouse space $ 82.8 $ 72.6 $ 63.4 Equipment 33.5 34.8 32.1 Other 71.6 68.1 56.9 Total rent expense $ 187.9 $ 175.5 $ 152.4
Some operating leases require payment of property taxes, insurance, and maintenance costs in addition to the rent payments. Contingent and escalation rent in excess of minimum rent payments and sublease income netted in rent expense were insignificant.
Noncancelable future lease commitments are: Operating Capital
In Millions Leases Leases
2014 $ 93.4 $ 1.8 2015 74.0 1.5 2016 61.1 0.7 2017 45.1 0.2 2018 49.6 — After 2018 114.5 — Total noncancelable future lease commitments $ 437.7 $ 4.2 Less: interest (0.2)Present value of obligations under capital leases $ 4.0
Annual Report 2013 83
These future lease commitments will be partially offset by estimated future sublease receipts of approximately $8.3 million. Depreciation on capital leases is recorded as depreciation expense in our results of operations.
As of May 26, 2013, we have issued guarantees and comfort letters of $356.3 million for the debt and other obligations of consolidated subsidiaries, and guarantees and comfort letters of $258.7 million for the debt and other obligations of non-consolidated affiliates, mainly CPW. In addition, off-balance sheet arrangements are generally limited to the future payments under non-can-celable operating leases, which totaled $437.7 million as of May 26, 2013.
Contingencies We are party to various pending or threat-ened legal actions in the ordinary course of our business. In our opinion, there were no claims or litigation pending as of May 26, 2013, that were reasonably likely to have a material adverse effect on our consolidated financial posi-tion or results of operations.
NOTE 16. BUSINESS SEGMENT AND GEOGRAPHIC INFORMATION
We operate in the consumer foods industry. We have three operating segments by type of customer and geo-graphic region as follows: U.S. Retail, 59.7 percent of our fiscal 2013 consolidated net sales; International, 29.3 percent of our fiscal 2013 consolidated net sales; and Bakeries and Foodservice, 11.0 percent of our fiscal 2013 consolidated net sales.
Our U.S. Retail segment reflects business with a wide variety of grocery stores, mass merchandisers, member-ship stores, natural food chains, and drug, dollar and discount chains operating throughout the United States. Our product categories in this business segment include ready-to-eat cereals, refrigerated yogurt, ready-to-serve soup, dry dinners, shelf stable and frozen vegetables, refrigerated and frozen dough products, dessert and baking mixes, frozen pizza and pizza snacks, grain, fruit and savory snacks, and a wide variety of organic prod-ucts including granola bars, cereal, and soup.
Our International segment consists of retail and foodservice businesses outside of the United States. In Canada, our product categories include ready-to-eat cereals, shelf stable and frozen vegetables, dry dinners, refrigerated and frozen dough products, dessert and baking mixes, frozen pizza snacks, refrigerated yogurt, and grain and fruit snacks. In markets outside North
America, our product categories include super-premium ice cream and frozen desserts, refrigerated yogurt, snacks, shelf stable and frozen vegetables, refrigerated and frozen dough products, and dry dinners. Our International segment also includes products manufactured in the United States for export, mainly to Caribbean and Latin American markets, as well as products we manufacture for sale to our international joint ventures. Revenues from export activities and franchise fees are reported in the region or country where the end customer is located.
In our Bakeries and Foodservice segment our product categories include ready-to-eat cereals, snacks, refriger-ated yogurt, unbaked and fully baked frozen dough prod-ucts, baking mixes, and flour. Many products we sell are branded to the consumer and nearly all are branded to our customers. We sell to distributors and opera-tors in many customer channels including foodservice, convenience stores, vending, and supermarket bakeries. Substantially all of this segment’s operations are located in the United States.
Operating profit for these segments excludes unallocated corporate items and restructuring, impairment, and other exit costs. Unallocated corporate items include corporate overhead expenses, variances to planned domestic employee benefits and incentives, contributions to the General Mills Foundation, and other items that are not part of our measurement of segment operating performance. These include gains and losses arising from the revaluation of certain grain inventories and gains and losses from mark-to-market valuation of certain commodity positions until passed back to our operating segments. These items affecting operating profit are centrally managed at the corporate level and are excluded from the measure of segment profitability reviewed by executive management. Under our supply chain organization, our manufacturing, warehouse, and distribution activities are substantially integrated across our operations in order to maximize efficiency and productivity. As a result, fixed assets and depreciation and amortization expenses are neither maintained nor available by operating segment.
84 Healthy Growth
Our operating segment results were as follows:
Fiscal YearIn Millions 2013 2012 2011
Net sales:U.S. Retail $ 10,614.9 $ 10,480.2 $ 10,163.9
International 5,200.2 4,194.3 2,875.5 Bakeries and Foodservice 1,959.0 1,983.4 1,840.8 Total $ 17,774.1 $ 16,657.9 $ 14,880.2 Operating profit: U.S. Retail $ 2,392.9 $ 2,295.3 $ 2,347.9 International 490.2 429.6 291.4 Bakeries and Foodservice 314.6 286.7 306.3 Total segment operating profit 3,197.7 3,011.6 2,945.6 Unallocated corporate items 326.1 347.6 184.1 Divestitures (gain) — — (17.4)Restructuring, impairment, and other exit costs 19.8 101.6 4.4 Operating profit $ 2,851.8 $ 2,562.4 $ 2,774.5
Net sales by class of similar products were as follows:
Fiscal YearIn Millions 2013 2012 2011
Net sales: Snacks $ 3,024.0 $ 2,649.6 $ 2,371.9 Yogurt 2,908.4 2,595.7 1,625.1 Cereal 2,889.2 2,935.2 2,812.6 Convenient meals 2,802.9 2,611.8 2,437.6 Baking mixes and ingredients 1,999.5 1,902.9 1,789.7 Dough 1,944.7 1,925.5 1,895.4 Vegetables 1,089.5 1,082.5 1,095.6 Super-premium ice cream 717.1 664.6 563.7 Other 398.8 290.1 288.6 Total $ 17,774.1 $ 16,657.9 $ 14,880.2
The following table provides financial information by geographic area:
Fiscal YearIn Millions 2013 2012 2011
Net sales:United States $12,573.1 $12,462.1 $11,987.8 Non-United States 5,201.0 4,195.8 2,892.4
Total $17,774.1 $16,657.9 $14,880.2
May 26, May 27,In Millions 2013 2012
Cash and cash equivalents:United States $ 26.9 $ 25.7
Non-United States 714.5 445.5 Total $ 741.4 $ 471.2
May 26, May 27,In Millions 2013 2012
Land, buildings, and equipment:United States $ 2,752.7 $ 2,804.9 Non-United States 1,125.4 847.8
Total $ 3,878.1 $ 3,652.7
NOTE 17. SUPPLEMENTAL INFORMATION
The components of certain Consolidated Balance Sheet accounts are as follows:
May 26, May 27,In Millions 2013 2012
Receivables: From customers $ 1,466.3 $ 1,345.3 Less allowance for doubtful accounts (19.9) (21.7)
Total $ 1,446.4 $ 1,323.6
May 26, May 27,In Millions 2013 2012
Inventories:Raw materials and packaging $ 403.0 $ 334.4 Finished goods 1,228.7 1,211.8 Grain 135.6 155.3 Excess of FIFO over LIFO cost (a) (221.8) (222.7)
Total $ 1,545.5 $ 1,478.8
(a) Inventories of $897.8 million as of May 26, 2013, and $930.2 million as of May 27, 2012, were valued at LIFO. During fiscal 2013 and fiscal 2012, LIFO inventory layers were reduced. Results of operations were not materially affected by these liquidations of LIFO inventory. The difference between replacement cost and the stated LIFO inventory value is not materially different from the reserve for the LIFO valuation method.
Annual Report 2013 85
May 26, May 27,In Millions 2013 2012
Prepaid expenses and other current assets: Other receivables $193.1 $103.8 Prepaid expenses 168.6 178.3 Derivative receivables, primarily commodity-related 47.6 34.5 Grain contracts 7.5 8.3 Miscellaneous 20.8 33.2 Total $437.6 $358.1
May 26, May 27,In Millions 2013 2012
Land, buildings, and equipment: Land $ 101.2 $ 75.9 Buildings 2,168.3 1,980.6 Buildings under capital lease 0.3 0.3 Equipment 5,731.1 5,257.2 Equipment under capital lease 9.0 9.0 Capitalized software 427.9 419.1 Construction in progress 495.1 542.6 Total land, buildings, and equipment 8,932.9 8,284.7 Less accumulated depreciation (5,054.8) (4,632.0)Total $3,878.1 $3,652.7
May 26, May 27,In Millions 2013 2012
Other assets: Investments in and advances to joint ventures $478.5 $529.0 Pension assets 131.8 42.7 Exchangeable note with related party 88.8 98.9 Life insurance 24.4 86.7 Miscellaneous 120.2 108.0 Total $843.7 $865.3
May 26, May 27,In Millions 2013 2012
Other current liabilities: Accrued trade and consumer promotions $ 635.3 $ 560.7 Accrued payroll 417.3 367.4 Dividends payable 279.6 24.5 Accrued taxes 88.0 39.2 Accrued interest, including interest rate swaps 91.2 100.2 Grain contracts 30.0 20.6 Restructuring and other exit costs reserve 19.5 85.9 Derivative payable 4.1 26.1 Miscellaneous 262.7 202.0 Total $1,827.7 $1,426.6
May 26, May 27,In Millions 2013 2012
Other noncurrent liabilities: Accrued compensation and benefits, including obligations for underfunded other postretirement and postemployment benefit plans $1,560.2 $ 1,853.1 Accrued taxes 277.1 230.9 Miscellaneous 115.6 105.8 Total $1,952.9 $ 2,189.8
Certain Consolidated Statements of Earnings amounts are as follows: Fiscal YearIn Millions 2013 2012 2011
Depreciation and amortization $588.0 $541.5 $472.6 Research and development expense 237.9 245.4 235.0 Advertising and media expense (including production and communication costs) $895.0 $913.7 $843.7
The components of interest, net are as follows:
Fiscal YearExpense (Income), in Millions 2013 2012 2011
Interest expense $333.8 $370.7 $360.9 Capitalized interest (4.3) (8.9) (7.2)Interest income (12.6) (9.9) (7.4)Interest, net $316.9 $351.9 $346.3
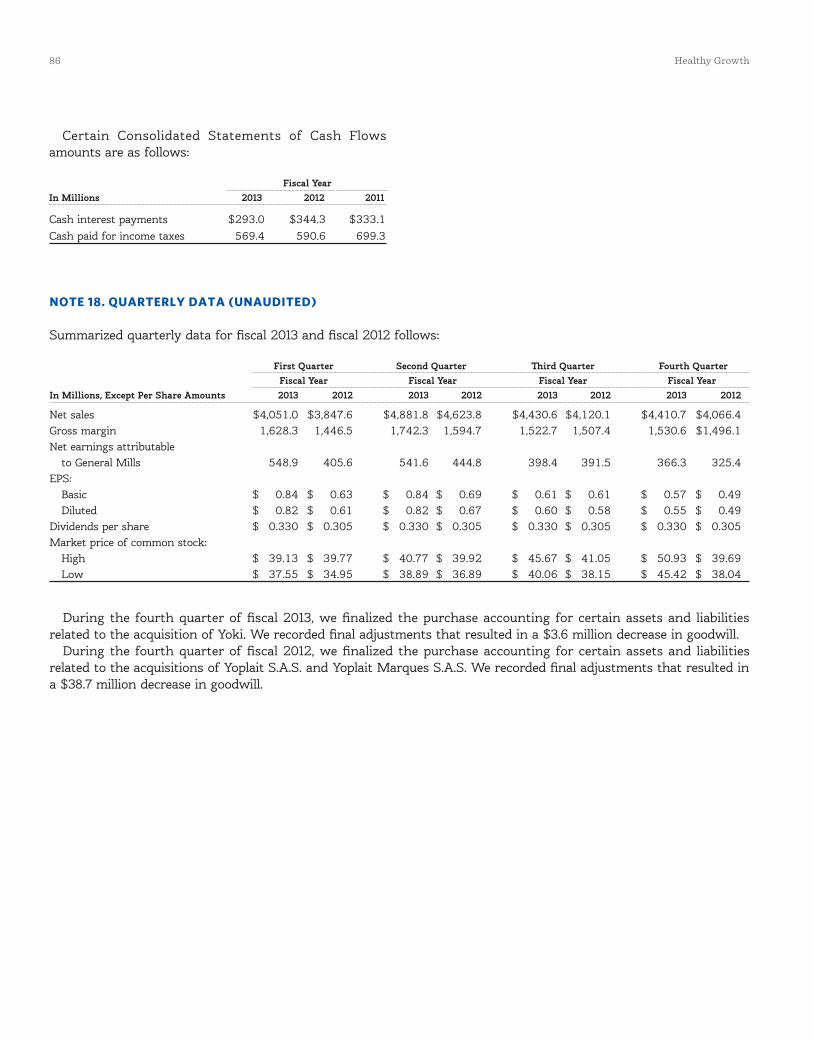
86 Healthy Growth
Certain Consolidated Statements of Cash Flows amounts are as follows:
Fiscal YearIn Millions 2013 2012 2011
Cash interest payments $293.0 $344.3 $333.1 Cash paid for income taxes 569.4 590.6 699.3
NOTE 18. QUARTERLY DATA (UNAUDITED)
Summarized quarterly data for fiscal 2013 and fiscal 2012 follows:
First Quarter Second Quarter Third Quarter Fourth Quarter Fiscal Year Fiscal Year Fiscal Year Fiscal YearIn Millions, Except Per Share Amounts 2013 2012 2013 2012 2013 2012 2013 2012
Net sales $4,051.0 $3,847.6 $4,881.8 $4,623.8 $4,430.6 $4,120.1 $4,410.7 $4,066.4 Gross margin 1,628.3 1,446.5 1,742.3 1,594.7 1,522.7 1,507.4 1,530.6 $1,496.1 Net earnings attributable to General Mills 548.9 405.6 541.6 444.8 398.4 391.5 366.3 325.4EPS: Basic $ 0.84 $ 0.63 $ 0.84 $ 0.69 $ 0.61 $ 0.61 $ 0.57 $ 0.49 Diluted $ 0.82 $ 0.61 $ 0.82 $ 0.67 $ 0.60 $ 0.58 $ 0.55 $ 0.49 Dividends per share $ 0.330 $ 0.305 $ 0.330 $ 0.305 $ 0.330 $ 0.305 $ 0.330 $ 0.305 Market price of common stock: High $ 39.13 $ 39.77 $ 40.77 $ 39.92 $ 45.67 $ 41.05 $ 50.93 $ 39.69 Low $ 37.55 $ 34.95 $ 38.89 $ 36.89 $ 40.06 $ 38.15 $ 45.42 $ 38.04
During the fourth quarter of fiscal 2013, we finalized the purchase accounting for certain assets and liabilities related to the acquisition of Yoki. We recorded final adjustments that resulted in a $3.6 million decrease in goodwill.
During the fourth quarter of fiscal 2012, we finalized the purchase accounting for certain assets and liabilities related to the acquisitions of Yoplait S.A.S. and Yoplait Marques S.A.S. We recorded final adjustments that resulted in a $38.7 million decrease in goodwill.
Annual Report 2013 87
AOCI. Accumulated other comprehensive income (loss).
Average total capital. Notes payable, long-term debt including current portion, redeemable interest, noncon-trolling interests, and stockholders’ equity excluding AOCI, and certain after-tax earnings adjustments are used to calculate return on average total capital. The average is calculated using the average of the beginning of fiscal year and end of fiscal year Consolidated Balance Sheet amounts for these line items.
Core working capital. Accounts receivable plus inven-tories less accounts payable, all as of the last day of our fiscal year.
Depreciation associated with restructured assets. The increase in depreciation expense caused by updat-ing the salvage value and shortening the useful life of depreciable fixed assets to coincide with the end of pro-duction under an approved restructuring plan, but only if impairment is not present.
Derivatives. Financial instruments such as futures, swaps, options, and forward contracts that we use to man-age our risk arising from changes in commodity prices, interest rates, foreign exchange rates, and stock prices.
Fair value hierarchy. For purposes of fair value mea-surement, we categorize assets and liabilities into one of three levels based on the assumptions (inputs) used in valuing the asset or liability. Level 1 provides the most reliable measure of fair value, while Level 3 generally requires significant management judgment. The three levels are defined as follows:
Level 1: Unadjusted quoted prices in active markets for identical assets or liabilities.
Level 2: Observable inputs other than quoted prices included in Level 1, such as quoted prices for similar assets or liabilities in active markets or quoted prices for identical assets or liabilities in inactive markets.
Level 3: Unobservable inputs reflecting management’s assumptions about the inputs used in pricing the asset or liability.
Fixed charge coverage ratio. The sum of earnings before income taxes and fixed charges (before tax), divided by the sum of the fixed charges (before tax) and interest.
Generally Accepted Accounting Principles (GAAP). Guidelines, procedures, and practices that we are required to use in recording and reporting accounting information in our financial statements.
Goodwill. The difference between the purchase price of acquired companies plus the fair value of any non-controlling and redeemable interests and the related fair values of net assets acquired.
Gross margin. Net sales less cost of sales.
Hedge accounting. Accounting for qualifying hedges that allows changes in a hedging instrument’s fair value to offset corresponding changes in the hedged item in the same reporting period. Hedge accounting is permit-ted for certain hedging instruments and hedged items only if the hedging relationship is highly effective, and only prospectively from the date a hedging relationship is formally documented.
Interest bearing instruments. Notes payable, long-term debt, including current portion, cash and cash equivalents, and certain interest bearing investments classified within prepaid expenses and other current assets and other assets.
LIBOR. London Interbank Offered Rate.
Mark-to-market. The act of determining a value for financial instruments, commodity contracts, and related assets or liabilities based on the current market price for that item.
Net mark-to-market valuation of certain commod-ity positions. Realized and unrealized gains and losses on derivative contracts that will be allocated to segment operating profit when the exposure we are hedging affects earnings.
Net price realization. The impact of list and promoted price changes, net of trade and other price promotion costs.
Glossary
88 Healthy Growth
New businesses. Our consolidated results for fiscal 2013 include operating activity from the acquisitions of Yoki Alimentos S.A. in Brazil (second quarter of fiscal 2013), Yoplait Ireland (first quarter of fiscal 2013), Food Should Taste Good in the United States (fourth quarter of fiscal 2012), Parampara Foods in India (first quarter of fiscal 2013), Immaculate Baking Company in the United States (third quarter of fiscal 2013), and the assumption of the Canadian Yoplait franchise license (second quarter of fiscal 2013). Also included in the first quarter of fiscal 2013 are two additional months of results from the acquisition of Yoplait S.A.S. (first quarter of fiscal 2012). Collectively, these items are referred to as “new businesses” in comparing our fiscal 2013 results to fiscal 2012.
Noncontrolling interests. Interests of subsidiaries held by third parties.
Notional principal amount. The principal amount on which fixed-rate or floating-rate interest payments are calculated.
OCI. Other comprehensive income (loss).
Operating cash flow to debt ratio. Net cash provided by operating activities, divided by the sum of notes pay-able and long-term debt, including current portion.
Redeemable interest. Interest of subsidiaries held by a third party that can be redeemed outside of our control and therefore cannot be classified as a noncontrolling interest in equity.
Reporting unit. An operating segment or a business one level below an operating segment
Return on average total capital. Net earnings attributable to General Mills, excluding after-tax net interest, and adjusted for certain items affecting year-over-year comparability, divided by average total capital.
Segment operating profit margin. Segment operating profit divided by net sales for the segment.
Supply chain input costs. Costs incurred to produce and deliver product, including costs for ingredients and conversion, inventory management, logistics, and warehousing.
Total debt. Notes payable and long-term debt, includ-ing current portion.
Transaction gains and losses. The impact on our Consolidated Financial Statements of foreign exchange rate changes arising from specific transactions.
Translation adjustments. The impact of the conver-sion of our foreign affiliates’ financial statements to U.S. dollars for the purpose of consolidating our financial statements.
Variable interest entities (VIEs). A legal structure that is used for business purposes that either (1) does not have equity investors that have voting rights and share in all the entity’s profits and losses or (2) has equity investors that do not provide sufficient financial resources to support the entity’s activities.
Working capital. Current assets and current liabilities, all as of the last day of our fiscal year.
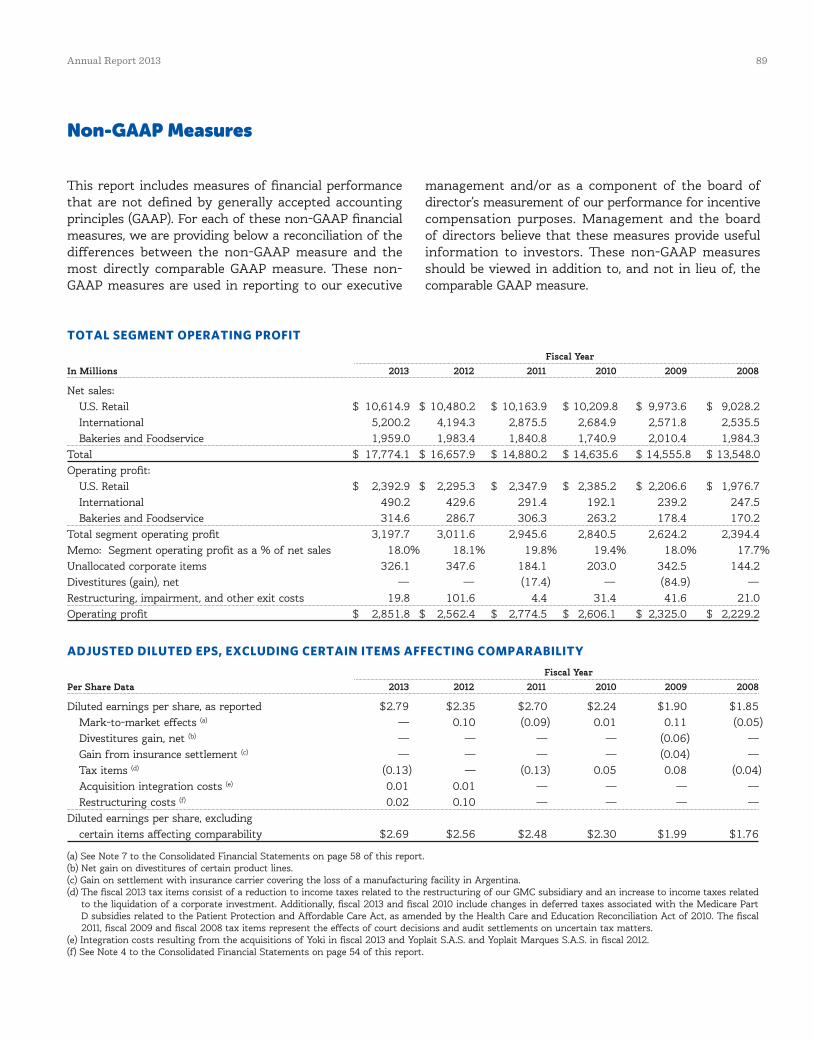
Annual Report 2013 89
This report includes measures of financial performance that are not defined by generally accepted accounting principles (GAAP). For each of these non-GAAP financial measures, we are providing below a reconciliation of the differences between the non-GAAP measure and the most directly comparable GAAP measure. These non-GAAP measures are used in reporting to our executive
management and/or as a component of the board of director’s measurement of our performance for incentive compensation purposes. Management and the board of directors believe that these measures provide useful information to investors. These non-GAAP measures should be viewed in addition to, and not in lieu of, the comparable GAAP measure.
Non-Gaap Measures
ToTal SegmenT operaTing profiT
Fiscal YearIn Millions 2013 2012 2011 2010 2009 2008
Net sales: U.S. Retail $ 10,614.9 $ 10,480.2 $ 10,163.9 $ 10,209.8 $ 9,973.6 $ 9,028.2 International 5,200.2 4,194.3 2,875.5 2,684.9 2,571.8 2,535.5 Bakeries and Foodservice 1,959.0 1,983.4 1,840.8 1,740.9 2,010.4 1,984.3 Total $ 17,774.1 $ 16,657.9 $ 14,880.2 $ 14,635.6 $ 14,555.8 $ 13,548.0 Operating profit: U.S. Retail $ 2,392.9 $ 2,295.3 $ 2,347.9 $ 2,385.2 $ 2,206.6 $ 1,976.7 International 490.2 429.6 291.4 192.1 239.2 247.5 Bakeries and Foodservice 314.6 286.7 306.3 263.2 178.4 170.2 Total segment operating profit 3,197.7 3,011.6 2,945.6 2,840.5 2,624.2 2,394.4Memo: Segment operating profit as a % of net sales 18.0% 18.1% 19.8% 19.4% 18.0% 17.7% Unallocated corporate items 326.1 347.6 184.1 203.0 342.5 144.2 Divestitures (gain), net — — (17.4) — (84.9) —Restructuring, impairment, and other exit costs 19.8 101.6 4.4 31.4 41.6 21.0 Operating profit $ 2,851.8 $ 2,562.4 $ 2,774.5 $ 2,606.1 $ 2,325.0 $ 2,229.2
adjuSTed diluTed epS, excluding cerTain iTemS affecTing comparabiliTy
Fiscal YearPer Share Data 2013 2012 2011 2010 2009 2008
Diluted earnings per share, as reported $2.79 $2.35 $2.70 $2.24 $1.90 $1.85 Mark-to-market effects (a) — 0.10 (0.09) 0.01 0.11 (0.05) Divestitures gain, net (b) — — — — (0.06) — Gain from insurance settlement (c) — — — — (0.04) — Tax items (d) (0.13) — (0.13) 0.05 0.08 (0.04) Acquisition integration costs (e) 0.01 0.01 — — — — Restructuring costs (f) 0.02 0.10 — — — — Diluted earnings per share, excluding certain items affecting comparability $2.69 $2.56 $2.48 $2.30 $1.99 $1.76
(a) See Note 7 to the Consolidated Financial Statements on page 58 of this report.(b) Net gain on divestitures of certain product lines.(c) Gain on settlement with insurance carrier covering the loss of a manufacturing facility in Argentina.(d) The fiscal 2013 tax items consist of a reduction to income taxes related to the restructuring of our GMC subsidiary and an increase to income taxes related
to the liquidation of a corporate investment. Additionally, fiscal 2013 and fiscal 2010 include changes in deferred taxes associated with the Medicare Part D subsidies related to the Patient Protection and Affordable Care Act, as amended by the Health Care and Education Reconciliation Act of 2010. The fiscal 2011, fiscal 2009 and fiscal 2008 tax items represent the effects of court decisions and audit settlements on uncertain tax matters.
(e) Integration costs resulting from the acquisitions of Yoki in fiscal 2013 and Yoplait S.A.S. and Yoplait Marques S.A.S. in fiscal 2012.(f) See Note 4 to the Consolidated Financial Statements on page 54 of this report.
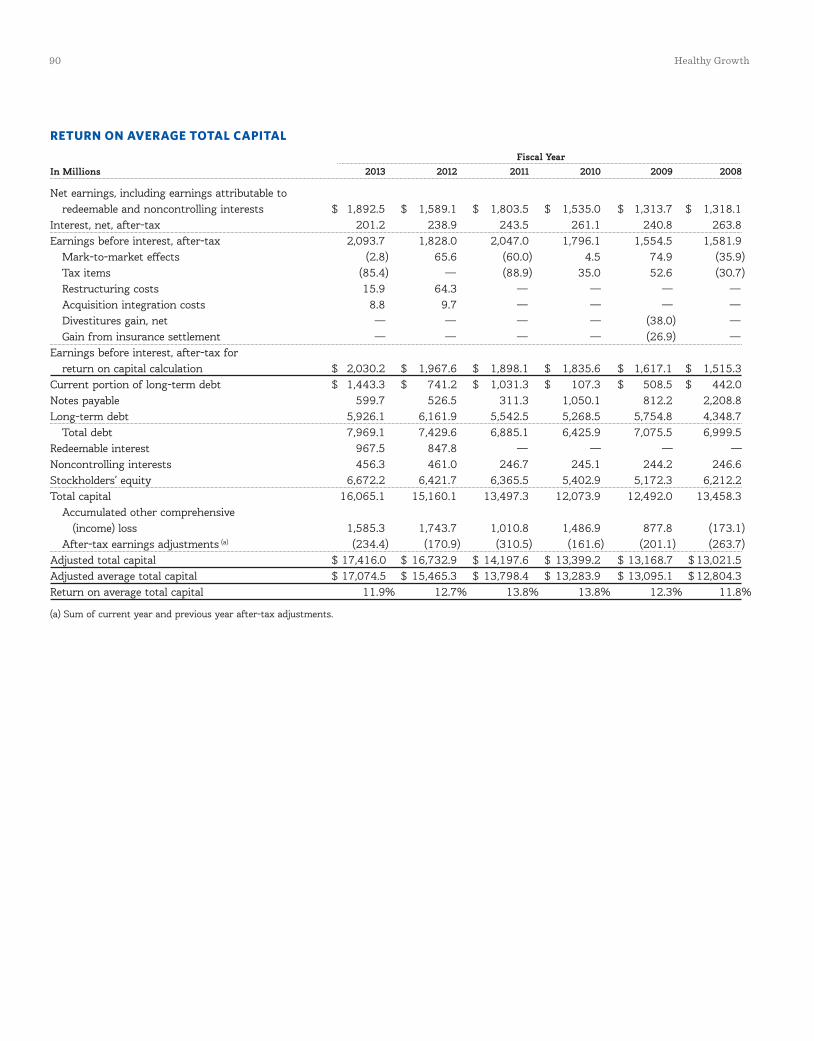
90 Healthy Growth
RetuRn on aveRage total capital
Fiscal YearIn Millions 2013 2012 2011 2010 2009 2008
Net earnings, including earnings attributable to redeemable and noncontrolling interests $ 1,892.5 $ 1,589.1 $ 1,803.5 $ 1,535.0 $ 1,313.7 $ 1,318.1Interest, net, after-tax 201.2 238.9 243.5 261.1 240.8 263.8Earnings before interest, after-tax 2,093.7 1,828.0 2,047.0 1,796.1 1,554.5 1,581.9 Mark-to-market effects (2.8) 65.6 (60.0) 4.5 74.9 (35.9) Tax items (85.4) — (88.9) 35.0 52.6 (30.7) Restructuring costs 15.9 64.3 — — — — Acquisition integration costs 8.8 9.7 — — — — Divestitures gain, net — — — — (38.0) — Gain from insurance settlement — — — — (26.9) —Earnings before interest, after-tax for return on capital calculation $ 2,030.2 $ 1,967.6 $ 1,898.1 $ 1,835.6 $ 1,617.1 $ 1,515.3Current portion of long-term debt $ 1,443.3 $ 741.2 $ 1,031.3 $ 107.3 $ 508.5 $ 442.0 Notes payable 599.7 526.5 311.3 1,050.1 812.2 2,208.8 Long-term debt 5,926.1 6,161.9 5,542.5 5,268.5 5,754.8 4,348.7 Total debt 7,969.1 7,429.6 6,885.1 6,425.9 7,075.5 6,999.5 Redeemable interest 967.5 847.8 — — — — Noncontrolling interests 456.3 461.0 246.7 245.1 244.2 246.6 Stockholders’ equity 6,672.2 6,421.7 6,365.5 5,402.9 5,172.3 6,212.2 Total capital 16,065.1 15,160.1 13,497.3 12,073.9 12,492.0 13,458.3 Accumulated other comprehensive (income) loss 1,585.3 1,743.7 1,010.8 1,486.9 877.8 (173.1) After-tax earnings adjustments (a) (234.4) (170.9) (310.5) (161.6) (201.1) (263.7)Adjusted total capital $ 17,416.0 $ 16,732.9 $ 14,197.6 $ 13,399.2 $ 13,168.7 $ 13,021.5 Adjusted average total capital $ 17,074.5 $ 15,465.3 $ 13,798.4 $ 13,283.9 $ 13,095.1 $ 12,804.3Return on average total capital 11.9% 12.7% 13.8% 13.8% 12.3% 11.8%
(a) Sum of current year and previous year after-tax adjustments.
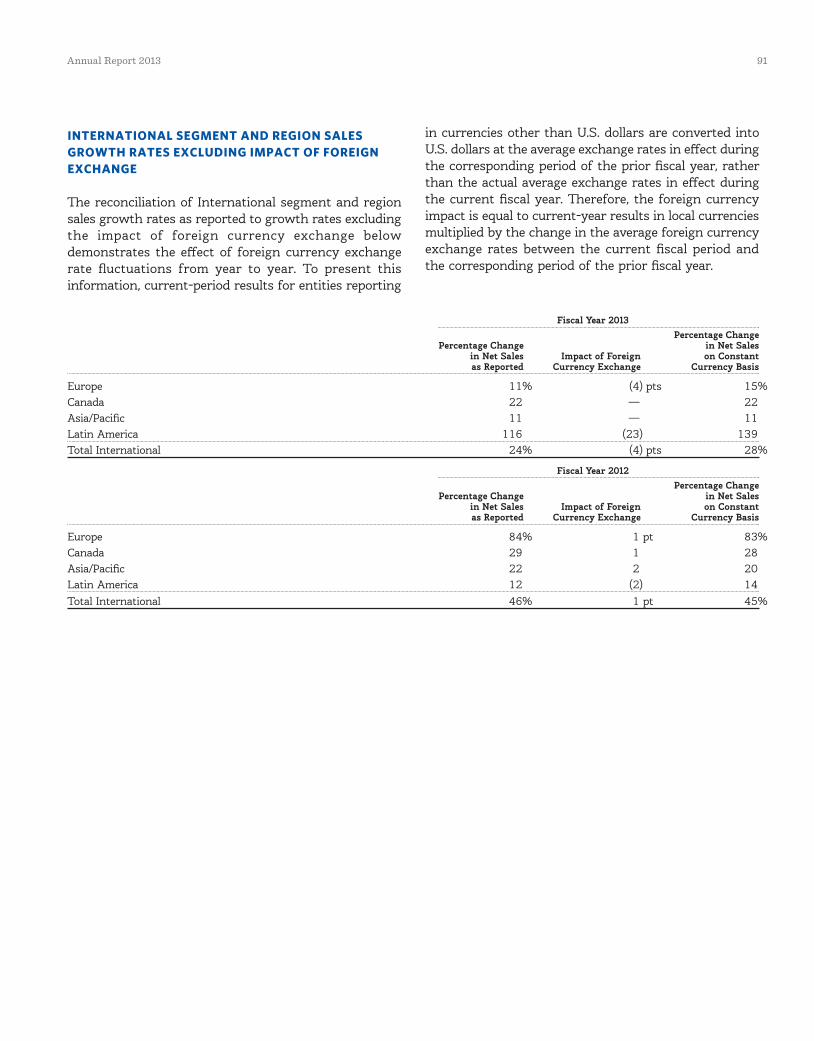
Annual Report 2013 91
INTERNATIONAL SEGMENT AND REGION SALES GROWTH RATES EXCLUDING IMPACT OF FOREIGN EXCHANGE
The reconciliation of International segment and region sales growth rates as reported to growth rates excluding the impact of foreign currency exchange below demonstrates the effect of foreign currency exchange rate fluctuations from year to year. To present this information, current-period results for entities reporting
in currencies other than U.S. dollars are converted into U.S. dollars at the average exchange rates in effect during the corresponding period of the prior fiscal year, rather than the actual average exchange rates in effect during the current fiscal year. Therefore, the foreign currency impact is equal to current-year results in local currencies multiplied by the change in the average foreign currency exchange rates between the current fiscal period and the corresponding period of the prior fiscal year.
Fiscal Year 2013 Percentage Change Percentage Change in Net Sales in Net Sales Impact of Foreign on Constant as Reported Currency Exchange Currency Basis
Europe 11% (4) pts 15%Canada 22 — 22 Asia/Pacific 11 — 11 Latin America 116 (23) 139 Total International 24% (4) pts 28%
Fiscal Year 2012 Percentage Change Percentage Change in Net Sales in Net Sales Impact of Foreign on Constant as Reported Currency Exchange Currency Basis
Europe 84% 1 pt 83%Canada 29 1 28 Asia/Pacific 22 2 20 Latin America 12 (2) 14 Total International 46% 1 pt 45%
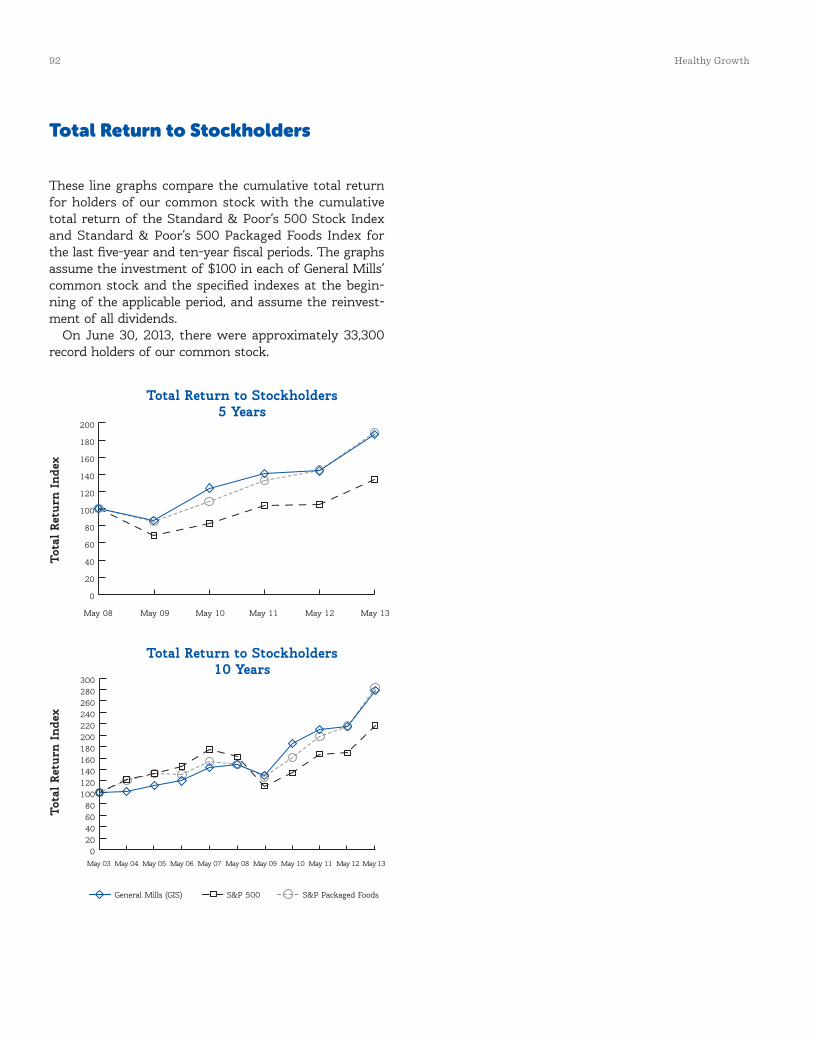
92 Healthy Growth
Total Return to Stockholders
These line graphs compare the cumulative total return for holders of our common stock with the cumulative total return of the Standard & Poor’s 500 Stock Index and Standard & Poor’s 500 Packaged Foods Index for the last five-year and ten-year fiscal periods. The graphs assume the investment of $100 in each of General Mills’ common stock and the specified indexes at the begin-ning of the applicable period, and assume the reinvest-ment of all dividends.
On June 30, 2013, there were approximately 33,300 record holders of our common stock.
Tota
l Ret
urn
Inde
x
Total Return to Stockholders5 Years
May 08 May 09 May 10 May 11 May 12 May 13
Tota
l Ret
urn
Inde
x
Total Return to Stockholders10 Years
May 03 May 04 May 05 May 06 May 07 May 08 May 09 May 10 May 11 May 12 May 13
General Mills (GIS) S&P 500 S&P Packaged Foods
0
20
40
60
80
100
120
140
160
180
200
020406080
100120140160180200220240260280300
Tota
l Ret
urn
Inde
x
Total Return to Stockholders5 Years
May 08 May 09 May 10 May 11 May 12 May 13
Tota
l Ret
urn
Inde
x
Total Return to Stockholders10 Years
May 03 May 04 May 05 May 06 May 07 May 08 May 09 May 10 May 11 May 12 May 13
General Mills (GIS) S&P 500 S&P Packaged Foods
0
20
40
60
80
100
120
140
160
180
200
020406080
100120140160180200220240260280300

Annual Report 2013 93

World HeadquartersNumber One General Mills Boulevard Minneapolis, MN 55426-1347 Phone: (763) 764-7600
WebsiteGeneralMills.com
MarketsNew York Stock Exchange Trading Symbol: GIS
Independent AuditorKPMG LLP 4200 Wells Fargo Center 90 South Seventh Street Minneapolis, MN 55402-3900 Phone: (612) 305-5000
Investor InquiriesGeneral Shareholder Information: Investor Relations Department (800) 245-5703 or (763) 764-3202
Analysts/Investors:Kris Wenker (763) 764-2607
Transfer Agent and RegistrarOur transfer agent can assist you with a variety of services, including change of address or questions about dividend checks:
Wells Fargo Bank, N.A. 1110 Centre Pointe Curve Mendota Heights, MN 55120-4100 Phone: (800) 670-4763 or (651) 450-4084 WellsFargo.com/shareownerservices
Electronic Access to Proxy Statement, Annual Report and Form 10-KShareholders who have access to the Internet are encouraged to enroll in the electronic delivery program. Please see the Investors section of our website, GeneralMills.com, or go directly to the website, ICSDelivery.com/GIS and follow the instructions to enroll. If your General Mills shares are not registered in your name, contact your bank or broker to enroll in this program.
Notice of Annual MeetingThe annual meeting of shareholders will be held at 10 a.m., Central Daylight Time, Tuesday, Sept. 24, 2013, at the Children’s Theatre Company, 2400 Third Avenue South, Minneapolis, MN 55404-3597. Proof of share ownership is required for admission. Please refer to the Proxy Statement for information concerning admission to the meeting.
General Mills Direct Stock Purchase PlanThis plan provides a convenient and economical way to invest in General Mills stock. You can increase your ownership over time through purchases of common stock and reinvestment of cash dividends, without paying brokerage commissions and other fees on your purchases and reinvest-ments. For more information and a copy of a plan prospectus, go to the Investors section of our website at GeneralMills.com.
Visit Us on the Web
U.S. SitesCheerios.com
Pillsbury.com
Yoplait.com
Larabar.com
BettyCrocker.com Get recipes, cooking tips and view instruction videos.
BoxTops4Education.com Sign up to support your school.
LiveBetterAmerica.com Simple ways to maintain a healthy lifestyle.
International SitesHaagenDazs.com.cn (China)
Yoplait.net (France)
NatureValley.co.uk (United Kingdom)
OldElPaso.com.au (Australia)
LifeMadeDelicious.ca (Canada) Get recipes, promotions and entertaining ideas for many of our brands.
We have a variety of websites that appeal to consumers around the world. Below is a selection of our most popular sites. For a more complete list, see the “Our websites” page under the Company tab on GeneralMills.com.
QueRicaVida.com Recipes and nutritional information for Hispanic consumers.
Tablespoon.com Download coupons, recipes and more for a variety of our brands.
Blog.GeneralMills.com Get a unique perspective on recent news and stories about our brands and our company.
You also can visit many of our brands on Facebook or follow us on Twitter.
Shareholder Information
Healthy Growth94

Our Fiscal 2013 Financial Highlights
52 weeks 52 weeks In millions, except per share and ended endedreturn on capital data May 26, 2013 May 27, 2012 Change
Net Sales $ 17,774 $ 16,658 + 7%
Segment Operating Profita 3,198 3,012 + 6%
Net Earnings Attributable to General Mills 1,855 1,567 + 18%
Diluted Earnings per Share (EPS) 2.79 2.35 + 19%
Adjusted Diluted EPS, Excluding Certain ItemsAffecting Comparabilityb 2.69 2.56 + 5%
Return on Average Total Capitala 11.9% 12.7% – 80 basis pts.
Average Diluted Shares Outstanding 666 667 – 0%
Dividends per Share $ 1.32 $ 1.22 + 8%
a See page 89 for discussion of non-GAAP measures.b Results exclude certain items affecting comparability. See page 89 for discussion of non-GAAP measures.
Segment Operating Profita
Dollars in millions
Net SalesDollars in millions
Adjusted Diluted Earnings per Shareb
Dollars
Dividends per ShareDollars
13,5
48
131211100908
17,7
7416
,658
14,8
80
14,6
3614
,556
1312111009
3,19
83,
012
2,94
62,
84
02,
624
2,39
4
08 1312111009
2.69
2.56
2.4
82.
301.
991.
76
08 1312111009
1.32
1.22
1.12
0.9
60
.86
0.7
8
08
We believe that doing well for our shareholders goes hand in hand with doing well for our consumers, our communities and our planet. Our efforts include providing convenient, nutritious food around the world, building strong communities through philanthropy and volunteerism, and developing sustainable business practices that reduce our environ-mental footprint.
For a comprehensive overview of our commitment to stand among the most socially responsible food companies in the world, see our Global Responsibility Report available online at GeneralMills.com/Responsibility.
This Report Is Printed on Recycled Paper.
©2013 General Mills
General Mills Gift Boxes are a part of many shareholders’ December holiday traditions. To request an order form, call us toll-free at (888) 496-7809 or write, including your name, street address, city, state, zip code and phone number (including area code) to:
2013 General Mills Holiday Gift Box Department 8907 P.O. Box 5013 Stacy, MN 55078-5013
Or you can place an order online at: GMIHolidayGiftBox.com
Please contact us after October 1, 2013.
Holiday Gift Boxes
Our Mission at General Mills Is Nourishing Lives
Des
ign
by A
ddis
on
ww
w.a
ddis
on.c
om
Prin
ting
by G
LS C
ompa
nies
10%

General M
ills A
nnual Report 2013
General Mills
Annual Report 2013Healthy Growth
Number One General Mills Boulevard Minneapolis, MN 55426-1347GeneralMills.com