Embed Size (px)
Citation preview
General Government Securities Money Market Fund
ANNUAL REPORT November 30, 2017
Save time. Save paper. View your next shareholder report onlineas soon as it’s available. Log into www.dreyfus.com and sign upfor Dreyfus eCommunications. It’s simple and only takes a fewminutes.
The views expressed in this report reflect those of the portfolio manager(s) only through the end of the period covered and do notnecessarily represent the views of Dreyfus or any other person in theDreyfus organization. Any such views are subject to change at anytime based upon market or other conditions and Dreyfus disclaims any responsibility to update such views. These views may not berelied on as investment advice and, because investment decisions fora Dreyfus fund are based on numerous factors, may not be relied onas an indication of trading intent on behalf of any Dreyfus fund.
Not FDIC-Insured • Not Bank-Guaranteed • May Lose Value
Contents T H E F U N D
A Letter from the President 2 Discussion of Fund Performance 3 Understanding Your Fund’s Expenses 5 Comparing Your Fund’s Expenses With Those of Other Funds 5 Statement of Investments 6 Statement of Assets and Liabilities 10 Statement of Operations 11 Statement of Changes in Net Assets 12 Financial Highlights 13 Notes to Financial Statements 16 Report of Independent Registered Public Accounting Firm 24 Important Tax Information 25 Information About the Renewal of the Fund’s Management Agreement 26 Board Members Information 29 Officers of the Fund 31
F O R M O R E I N F O R M AT I O N
Back Cover
2
A LETTER FROM THE PRESIDENT
Dear Shareholder:
We are pleased to present this annual report for General Government Securities Money Market Fund, covering the 12-month period from December 1, 2016 through November 30, 2017. For information about how the fund performed during the reporting period, as well as general market perspectives, we provide a Discussion of Fund Performance on the pages that follow.
Stocks set a series of new record highs and bonds produced mixed results over the past year in response to changing economic and political conditions. Financial markets at the start of the reporting period were dominated by the election of a new U.S. presidential administration. Equities and corporate-backed bonds surged higher in anticipation of more business-friendly regulatory, tax, and fiscal policies, but high-quality bonds generally lost value due to expectations of rising interest rates and accelerating inflation in a stronger economy. U.S. and international stocks continued to rally in 2017 as corporate earnings grew, global economic conditions improved, and tax reform legislation appeared to make progress. Despite a series of short-term interest-rate hikes, bonds recovered their previous losses over much of 2017.
The markets’ recent strong performance has been supported by solid underlying fundamentals. While we currently expect these favorable conditions to persist, we remain watchful for economic and political developments that could derail the markets. As always, we encourage you to discuss the risks and opportunities of today’s investment environment with your financial advisor.
Thank you for your continued confidence and support.
Sincerely,
Renee Laroche-Morris President The Dreyfus Corporation December 15, 2017
General Government Securities
Money Market Fund The Fund
DISCUSSION OF FUND PERFORMANCE
3
For the period from December 1, 2016 through November 30, 2017, as provided by Bernard W. Kiernan, Jr., Senior Portfolio Manager
Market and Fund Performance Overview For the 12-month period ended November 30, 2017, General Government Securities Money Market Fund’s Class A shares produced a yield of 0.13%, Class B shares yielded 0.04%, and Dreyfus Class shares yielded 0.31%. Taking into account the effects of compounding, the fund’s Class A shares, Class B shares, and Dreyfus Class shares produced effective yields of 0.13%, 0.04%, and 0.31%, respectively.1
Yields of money market instruments climbed over the reporting period in response to three increases in short-term interest rates by the Federal Reserve Board (the “Fed”).
The Fund’s Investment Approach The fund seeks as high a level of current income as is consistent with the preservation of capital and the maintenance of liquidity. The fund pursues its investment objective by investing only in government securities (i.e., securities issued or guaranteed as to principal and interest by the U.S. government or its agencies or instrumentalities, including those with floating or variable rates of interest), repurchase agreements collateralized solely by government securities and/or cash, and cash. The fund is a money market fund subject to the maturity, quality, liquidity, and diversification requirements of Rule 2a-7 under the Investment Company Act of 1940, as amended, and seeks to maintain a stable share price of $1.00.
The fund is a “government money market fund,” as that term is defined in Rule 2a-7, and as such is required to invest at least 99.5% of its total assets in securities issued or guaranteed as to principal and interest by the U.S. government or its agencies or instrumentalities, repurchase agreements collateralized solely by cash and/or government securities, and cash. The fund normally invests at least 80% of its net assets, plus any borrowings for investment purposes, in government securities and repurchase agreements collateralized solely by government securities (i.e., under normal circumstances, the fund will not invest more than 20% of its net assets in cash and/or repurchase agreements collateralized by cash). The securities in which the fund invests include those backed by the full faith and credit of the U.S. government, which include U.S. Treasury securities as well as securities issued by certain agencies of the U.S. government, and those that are neither insured nor guaranteed by the U.S. government.
Short-Term Interest Rates Moved Higher The Fed raised the target for the federal funds rate by 0.25 percentage points to between 0.50% and 0.75% in December 2016 and 155,000 jobs were created during the month, and the unemployment rate stood at 4.7%. In January 2017, the economy added 216,000 new jobs, but the unemployment rate rose to 4.8%. Meanwhile, manufacturing and non-manufacturing activity expanded. February 2017 saw 232,000 new jobs and a 4.7% unemployment rate. In March 2017, the Fed raised the federal funds rate to between 0.75% and 1.00%. The unemployment rate fell to 4.5%, but only 50,000 new jobs were added.
DISCUSSION OF FUND PERFORMANCE (continued)
4
Corporate earnings continued to grow in April 2017. The labor market produced 207,000 new jobs and a 4.4% unemployment rate. In May 2017, 145,000 new jobs were created, and the unemployment rate slid to 4.3%. Manufacturing activity continued to expand in June 2017. The unemployment rate ticked higher to 4.4%, with 210,000 new jobs. The Fed again raised short-term rates, sending the federal funds rate to between 1.00% and 1.25%. The U.S. economy grew at a 3.1% annualized rate during the second quarter of 2017.
The economy generated 138,000 new jobs in July 2017, and the unemployment rate returned to 4.3%. Activity in the manufacturing and services sectors continued to grow. In August 2017, 208,000 jobs were added, and the unemployment rate rose to 4.4%. Housing starts exceeded forecasts, but retail sales disappointed. September 2017 saw U.S. factory activity climb to a 13-year high. The labor market produced only 38,000 new jobs, in part due to hurricanes affecting Florida and Texas. Yet, the unemployment rate fell to 4.2%. The U.S. economy expanded at a 3.3% annualized rate over the third quarter of 2017.
The unemployment rate declined to 4.1% in October 2017, its lowest level since December 2000, and 244,000 jobs were created. Automobile purchases increased 0.7% as Gulf Coast residents replaced flood-damaged vehicles. The holiday shopping season got off to a strong start in November 2017 with a 0.8% increase in retail sales. The U.S. economy added an estimated 228,000 jobs, and the unemployment rate remained at 4.1%.
Additional Rate Hikes Expected The Fed has begun to further moderate its accommodative monetary policy by unwinding its balance sheet through the sale of U.S. government securities. Although outside of the reporting period, in mid-December, the Fed raised the federal funds rate to between 1.25% and 1.5%. Additional interest-rate hikes are anticipated in 2018.
In the rising interest-rate environment, we have maintained the fund’s weighted average maturity in a range that is modestly shorter than industry averages. This strategy is intended to capture higher yields as they become available. As always, we have retained our longstanding focus on liquidity.
December 15, 2017 1 Effective yield is based upon dividends declared daily and reinvested monthly. Past performance is no guarantee of future results.
Yields fluctuate. Yields provided for the funds reflect the absorption of certain fund expenses by The Dreyfus Corporation pursuant to an undertaking in effect that may be extended, terminated, or modified at any time. Had these expenses not been absorbed, the fund’s yields would have been lower and, in some cases, seven-day yields during the reporting period would have been negative absent the expense absorption.
You could lose money by investing in a money market fund. Although the fund seeks to preserve the value of your investment at $1.00 per share, it cannot guarantee it will do so. An investment in the fund is not insured or guaranteed by the Federal Deposit Insurance Corporation or any other government agency. The fund’s sponsor has no legal obligation to provide financial support to the fund, and you should not expect that the sponsor will provide financial support to the fund at any time. Although the fund’s board has no current intention to impose a fee upon the sale of shares or temporarily suspend redemptions if the fund’s liquidity falls below certain levels, the board reserves the ability to do so after providing at least 60 days’ prior written notice to shareholders.
UNDERSTANDING YOUR FUND’S EXPENSES (Unaudited)
5
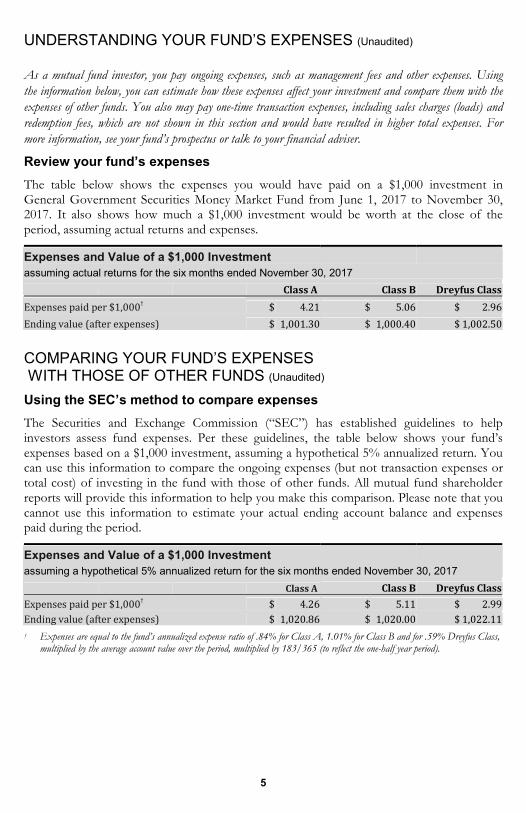
As a mutual fund investor, you pay ongoing expenses, such as management fees and other expenses. Using the information below, you can estimate how these expenses affect your investment and compare them with the expenses of other funds. You also may pay one-time transaction expenses, including sales charges (loads) and redemption fees, which are not shown in this section and would have resulted in higher total expenses. For more information, see your fund’s prospectus or talk to your financial adviser.
Review your fund’s expenses The table below shows the expenses you would have paid on a $1,000 investment in General Government Securities Money Market Fund from June 1, 2017 to November 30, 2017. It also shows how much a $1,000 investment would be worth at the close of the period, assuming actual returns and expenses.
Expenses and Value of a $1,000 Investment assuming actual returns for the six months ended November 30, 2017
Class A Class B Dreyfus ClassExpenses paid per $1,000† $ 4.21 $ 5.06 $ 2.96Ending value (after expenses) $ 1,001.30 $ 1,000.40 $ 1,002.50
COMPARING YOUR FUND’S EXPENSES WITH THOSE OF OTHER FUNDS (Unaudited) Using the SEC’s method to compare expenses The Securities and Exchange Commission (“SEC”) has established guidelines to help investors assess fund expenses. Per these guidelines, the table below shows your fund’s expenses based on a $1,000 investment, assuming a hypothetical 5% annualized return. You can use this information to compare the ongoing expenses (but not transaction expenses or total cost) of investing in the fund with those of other funds. All mutual fund shareholder reports will provide this information to help you make this comparison. Please note that you cannot use this information to estimate your actual ending account balance and expenses paid during the period.
Expenses and Value of a $1,000 Investment
assuming a hypothetical 5% annualized return for the six months ended November 30, 2017 Class A Class B Dreyfus ClassExpenses paid per $1,000† $ 4.26 $ 5.11 $ 2.99Ending value (after expenses) $ 1,020.86 $ 1,020.00 $ 1,022.11
† Expenses are equal to the fund’s annualized expense ratio of .84% for Class A, 1.01% for Class B and for .59% Dreyfus Class, multiplied by the average account value over the period, multiplied by 183/365 (to reflect the one-half year period).
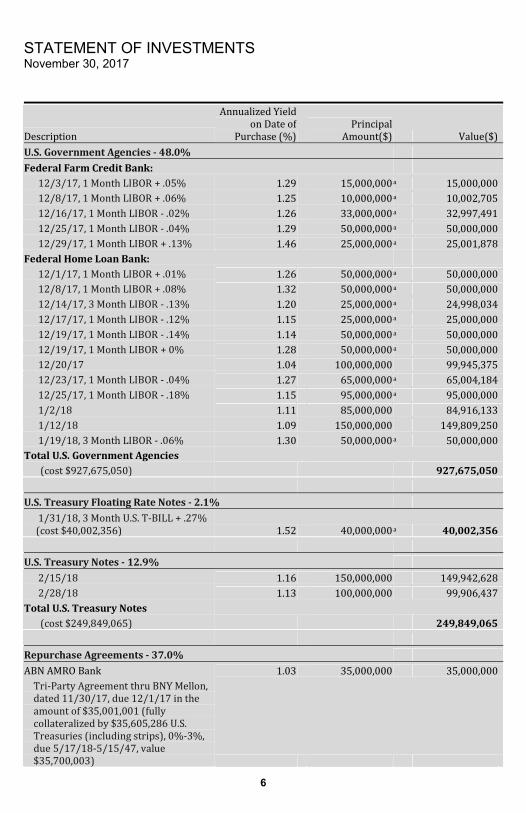
STATEMENT OF INVESTMENTS November 30, 2017
6
Description
Annualized Yield on Date of Purchase (%) Principal Amount($) Value($)U.S. Government Agencies - 48.0%
Federal Farm Credit Bank: 12/3/17, 1 Month LIBOR + .05% 1.29 15,000,000a 15,000,000 12/8/17, 1 Month LIBOR + .06% 1.25 10,000,000a 10,002,705 12/16/17, 1 Month LIBOR - .02% 1.26 33,000,000a 32,997,491 12/25/17, 1 Month LIBOR - .04% 1.29 50,000,000a 50,000,000 12/29/17, 1 Month LIBOR + .13% 1.46 25,000,000a 25,001,878Federal Home Loan Bank: 12/1/17, 1 Month LIBOR + .01% 1.26 50,000,000a 50,000,000 12/8/17, 1 Month LIBOR + .08% 1.32 50,000,000a 50,000,000 12/14/17, 3 Month LIBOR - .13% 1.20 25,000,000a 24,998,034 12/17/17, 1 Month LIBOR - .12% 1.15 25,000,000a 25,000,000 12/19/17, 1 Month LIBOR - .14% 1.14 50,000,000a 50,000,000 12/19/17, 1 Month LIBOR + 0% 1.28 50,000,000a 50,000,000 12/20/17 1.04 100,000,000 99,945,375 12/23/17, 1 Month LIBOR - .04% 1.27 65,000,000a 65,004,184 12/25/17, 1 Month LIBOR - .18% 1.15 95,000,000a 95,000,000 1/2/18 1.11 85,000,000 84,916,133 1/12/18 1.09 150,000,000 149,809,250 1/19/18, 3 Month LIBOR - .06% 1.30 50,000,000a 50,000,000Total U.S. Government Agencies (cost $927,675,050) 927,675,050
U.S. Treasury Floating Rate Notes - 2.1% 1/31/18, 3 Month U.S. T-BILL + .27% (cost $40,002,356) 1.52 40,000,000a 40,002,356
U.S. Treasury Notes - 12.9% 2/15/18 1.16 150,000,000 149,942,628 2/28/18 1.13 100,000,000 99,906,437Total U.S. Treasury Notes (cost $249,849,065) 249,849,065
Repurchase Agreements - 37.0% ABN AMRO Bank 1.03 35,000,000 35,000,000Tri-Party Agreement thru BNY Mellon, dated 11/30/17, due 12/1/17 in the amount of $35,001,001 (fully collateralized by $35,605,286 U.S. Treasuries (including strips), 0%-3%, due 5/17/18-5/15/47, value $35,700,003)
7
Description
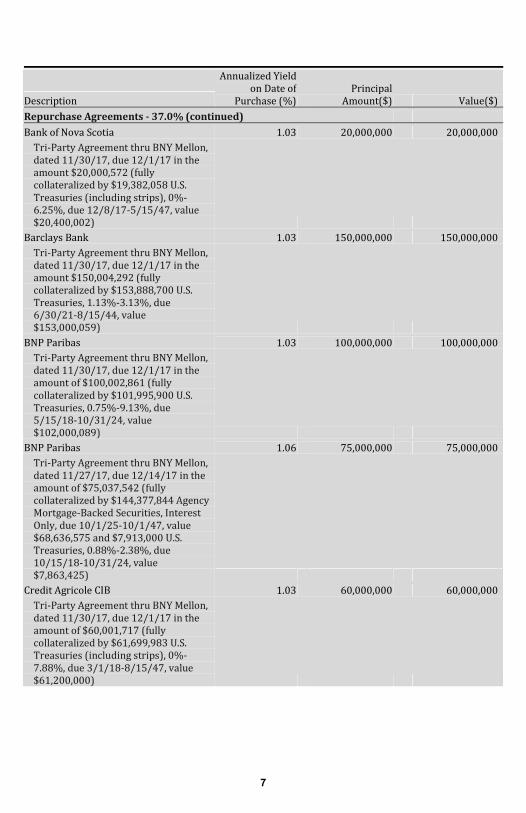
Annualized Yield on Date of Purchase (%) Principal Amount($) Value($)Repurchase Agreements - 37.0% (continued) Bank of Nova Scotia 1.03 20,000,000 20,000,000Tri-Party Agreement thru BNY Mellon, dated 11/30/17, due 12/1/17 in the amount $20,000,572 (fully collateralized by $19,382,058 U.S. Treasuries (including strips), 0%-6.25%, due 12/8/17-5/15/47, value $20,400,002) Barclays Bank 1.03 150,000,000 150,000,000Tri-Party Agreement thru BNY Mellon, dated 11/30/17, due 12/1/17 in the amount $150,004,292 (fully collateralized by $153,888,700 U.S. Treasuries, 1.13%-3.13%, due 6/30/21-8/15/44, value $153,000,059) BNP Paribas 1.03 100,000,000 100,000,000Tri-Party Agreement thru BNY Mellon, dated 11/30/17, due 12/1/17 in the amount of $100,002,861 (fully collateralized by $101,995,900 U.S. Treasuries, 0.75%-9.13%, due 5/15/18-10/31/24, value $102,000,089) BNP Paribas 1.06 75,000,000 75,000,000Tri-Party Agreement thru BNY Mellon, dated 11/27/17, due 12/14/17 in the amount of $75,037,542 (fully collateralized by $144,377,844 Agency Mortgage-Backed Securities, Interest Only, due 10/1/25-10/1/47, value $68,636,575 and $7,913,000 U.S. Treasuries, 0.88%-2.38%, due 10/15/18-10/31/24, value $7,863,425) Credit Agricole CIB 1.03 60,000,000 60,000,000Tri-Party Agreement thru BNY Mellon, dated 11/30/17, due 12/1/17 in the amount of $60,001,717 (fully collateralized by $61,699,983 U.S. Treasuries (including strips), 0%-7.88%, due 3/1/18-8/15/47, value $61,200,000)
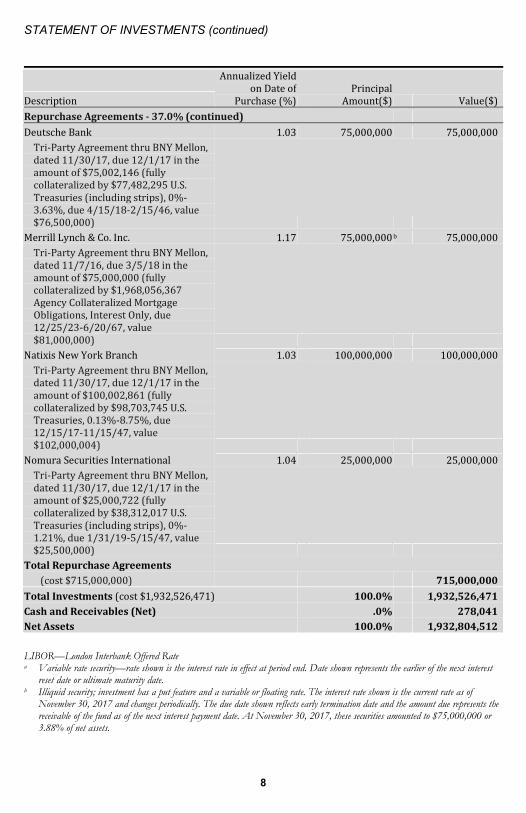
STATEMENT OF INVESTMENTS (continued)
8
Description
Annualized Yield on Date of Purchase (%) Principal Amount($) Value($)Repurchase Agreements - 37.0% (continued) Deutsche Bank 1.03 75,000,000 75,000,000Tri-Party Agreement thru BNY Mellon, dated 11/30/17, due 12/1/17 in the amount of $75,002,146 (fully collateralized by $77,482,295 U.S. Treasuries (including strips), 0%-3.63%, due 4/15/18-2/15/46, value $76,500,000) Merrill Lynch & Co. Inc. 1.17 75,000,000b 75,000,000Tri-Party Agreement thru BNY Mellon, dated 11/7/16, due 3/5/18 in the amount of $75,000,000 (fully collateralized by $1,968,056,367 Agency Collateralized Mortgage Obligations, Interest Only, due 12/25/23-6/20/67, value $81,000,000) Natixis New York Branch 1.03 100,000,000 100,000,000Tri-Party Agreement thru BNY Mellon, dated 11/30/17, due 12/1/17 in the amount of $100,002,861 (fully collateralized by $98,703,745 U.S. Treasuries, 0.13%-8.75%, due 12/15/17-11/15/47, value $102,000,004) Nomura Securities International 1.04 25,000,000 25,000,000Tri-Party Agreement thru BNY Mellon, dated 11/30/17, due 12/1/17 in the amount of $25,000,722 (fully collateralized by $38,312,017 U.S. Treasuries (including strips), 0%-1.21%, due 1/31/19-5/15/47, value $25,500,000) Total Repurchase Agreements (cost $715,000,000) 715,000,000
Total Investments (cost $1,932,526,471) 100.0% 1,932,526,471Cash and Receivables (Net) .0% 278,041Net Assets 100.0% 1,932,804,512 LIBOR—London Interbank Offered Rate a Variable rate security—rate shown is the interest rate in effect at period end. Date shown represents the earlier of the next interest
reset date or ultimate maturity date. b Illiquid security; investment has a put feature and a variable or floating rate. The interest rate shown is the current rate as of
November 30, 2017 and changes periodically. The due date shown reflects early termination date and the amount due represents the receivable of the fund as of the next interest payment date. At November 30, 2017, these securities amounted to $75,000,000 or 3.88% of net assets.
9
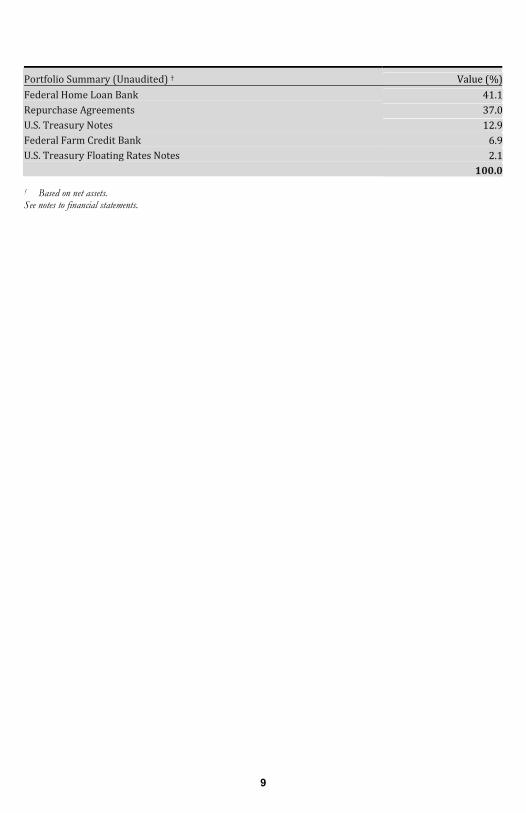
Portfolio Summary (Unaudited) † Value (%)Federal Home Loan Bank 41.1Repurchase Agreements 37.0U.S. Treasury Notes 12.9Federal Farm Credit Bank 6.9U.S. Treasury Floating Rates Notes 2.1 100.0
† Based on net assets. See notes to financial statements.
STATEMENT OF ASSETS AND LIABILITIES November 30, 2017
10
Cost Value
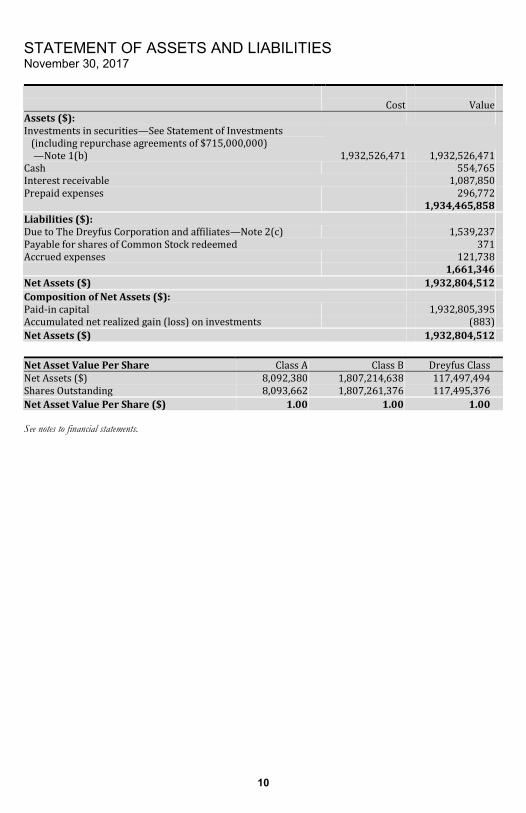
Assets ($): Investments in securities—See Statement of Investments (including repurchase agreements of $715,000,000) —Note 1(b) 1,932,526,471 1,932,526,471 Cash 554,765 Interest receivable 1,087,850 Prepaid expenses 296,772 1,934,465,858 Liabilities ($): Due to The Dreyfus Corporation and affiliates—Note 2(c) 1,539,237 Payable for shares of Common Stock redeemed 371 Accrued expenses 121,738 1,661,346 Net Assets ($) 1,932,804,512 Composition of Net Assets ($): Paid-in capital 1,932,805,395 Accumulated net realized gain (loss) on investments (883) Net Assets ($) 1,932,804,512 Net Asset Value Per Share Class A Class B Dreyfus Class Net Assets ($) 8,092,380 1,807,214,638 117,497,494 Shares Outstanding 8,093,662 1,807,261,376 117,495,376 Net Asset Value Per Share ($) 1.00 1.00 1.00 See notes to financial statements.
STATEMENT OF OPERATIONS Year Ended November 30, 2017
11
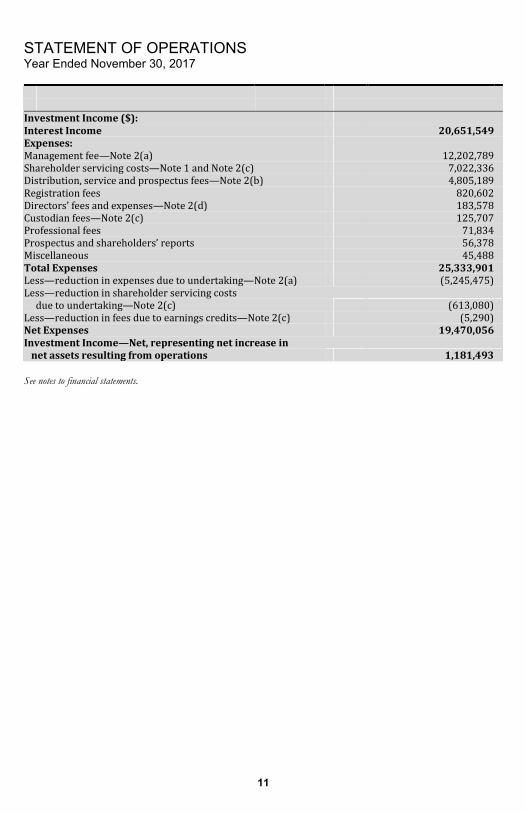
Investment Income ($): Interest Income 20,651,549 Expenses: Management fee—Note 2(a) 12,202,789 Shareholder servicing costs—Note 1 and Note 2(c) 7,022,336 Distribution, service and prospectus fees—Note 2(b) 4,805,189 Registration fees 820,602 Directors’ fees and expenses—Note 2(d) 183,578 Custodian fees—Note 2(c) 125,707 Professional fees 71,834 Prospectus and shareholders’ reports 56,378 Miscellaneous 45,488 Total Expenses 25,333,901 Less—reduction in expenses due to undertaking—Note 2(a) (5,245,475) Less—reduction in shareholder servicing costs due to undertaking—Note 2(c) (613,080) Less—reduction in fees due to earnings credits—Note 2(c) (5,290) Net Expenses 19,470,056 Investment Income—Net, representing net increase in net assets resulting from operations 1,181,493 See notes to financial statements.
STATEMENT OF CHANGES IN NET ASSETS
12
Year Ended November 30, 2017 2016
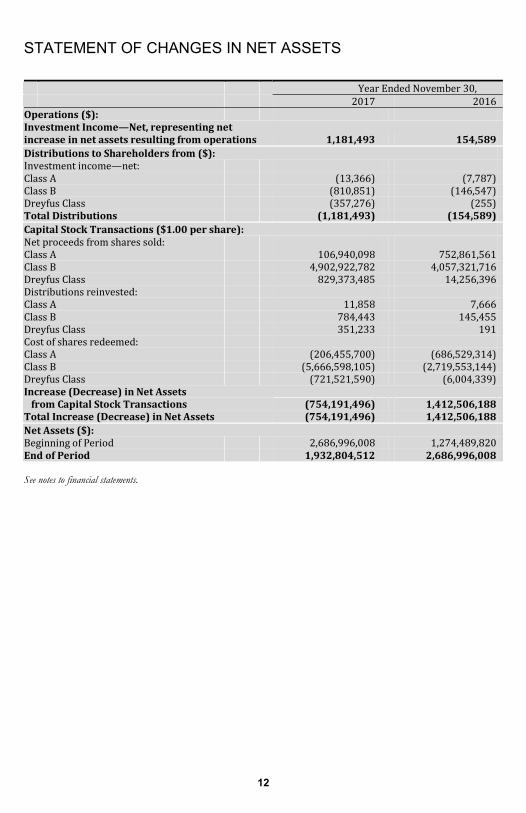
Operations ($): Investment Income—Net, representing net increase in net assets resulting from operations 1,181,493 154,589 Distributions to Shareholders from ($): Investment income—net: Class A (13,366) (7,787) Class B (810,851) (146,547) Dreyfus Class (357,276) (255) Total Distributions (1,181,493) (154,589) Capital Stock Transactions ($1.00 per share): Net proceeds from shares sold: Class A 106,940,098 752,861,561 Class B 4,902,922,782 4,057,321,716 Dreyfus Class 829,373,485 14,256,396 Distributions reinvested: Class A 11,858 7,666 Class B 784,443 145,455 Dreyfus Class 351,233 191 Cost of shares redeemed: Class A (206,455,700) (686,529,314) Class B (5,666,598,105) (2,719,553,144) Dreyfus Class (721,521,590) (6,004,339) Increase (Decrease) in Net Assets from Capital Stock Transactions (754,191,496) 1,412,506,188 Total Increase (Decrease) in Net Assets (754,191,496) 1,412,506,188 Net Assets ($): Beginning of Period 2,686,996,008 1,274,489,820 End of Period 1,932,804,512 2,686,996,008 See notes to financial statements.
FINANCIAL HIGHLIGHTS
13
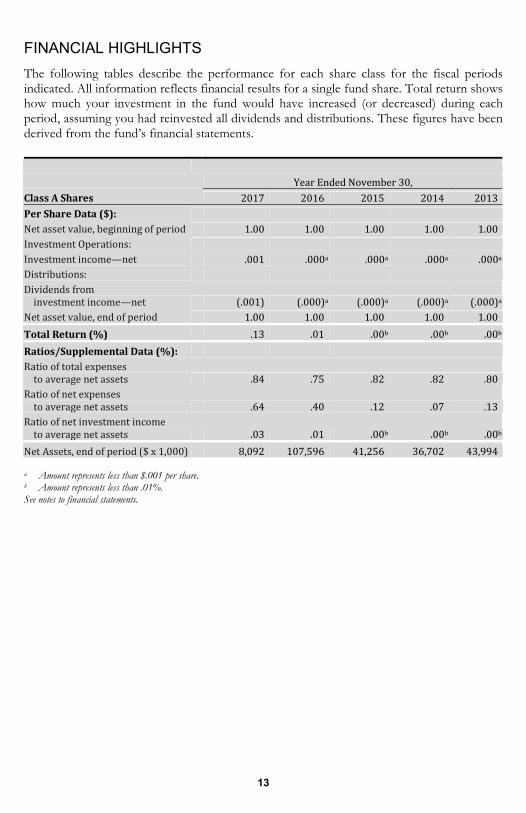
The following tables describe the performance for each share class for the fiscal periods indicated. All information reflects financial results for a single fund share. Total return shows how much your investment in the fund would have increased (or decreased) during each period, assuming you had reinvested all dividends and distributions. These figures have been derived from the fund’s financial statements.
Year Ended November 30, Class A Shares 2017 2016 2015 2014 2013Per Share Data ($): Net asset value, beginning of period 1.00 1.00 1.00 1.00 1.00Investment Operations: Investment income—net .001 .000a .000a .000a .000aDistributions: Dividends from investment income—net (.001) (.000)a (.000)a (.000)a (.000)aNet asset value, end of period 1.00 1.00 1.00 1.00 1.00Total Return (%) .13 .01 .00b .00b .00bRatios/Supplemental Data (%): Ratio of total expenses to average net assets .84 .75 .82 .82 .80Ratio of net expenses to average net assets .64 .40 .12 .07 .13Ratio of net investment income to average net assets .03 .01 .00b .00b .00bNet Assets, end of period ($ x 1,000) 8,092 107,596 41,256 36,702 43,994
a Amount represents less than $.001 per share. b Amount represents less than .01%. See notes to financial statements.
FINANCIAL HIGHLIGHTS (continued)
14
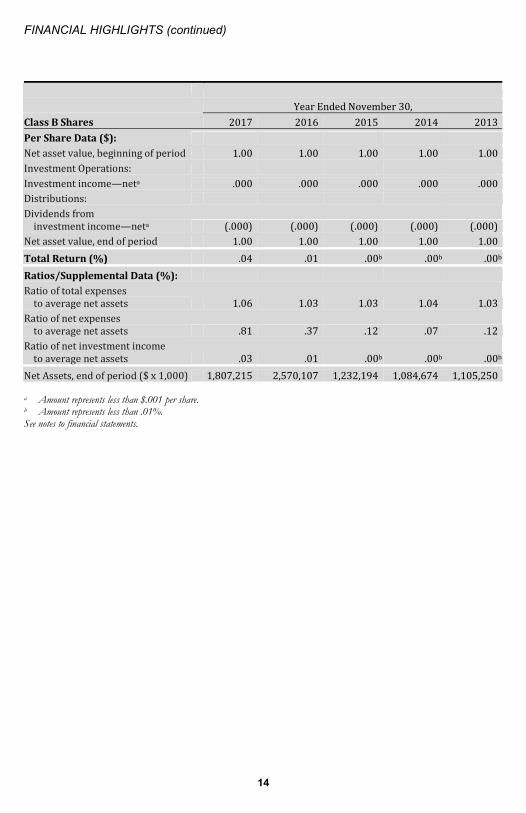
Year Ended November 30, Class B Shares 2017 2016 2015 2014 2013Per Share Data ($): Net asset value, beginning of period 1.00 1.00 1.00 1.00 1.00Investment Operations: Investment income—neta .000 .000 .000 .000 .000 Distributions: Dividends from investment income—neta (.000) (.000) (.000) (.000) (.000) Net asset value, end of period 1.00 1.00 1.00 1.00 1.00Total Return (%) .04 .01 .00b .00b .00bRatios/Supplemental Data (%): Ratio of total expenses to average net assets 1.06 1.03 1.03 1.04 1.03Ratio of net expenses to average net assets .81 .37 .12 .07 .12Ratio of net investment income to average net assets .03 .01 .00b .00b .00bNet Assets, end of period ($ x 1,000) 1,807,215 2,570,107 1,232,194 1,084,674 1,105,250
a Amount represents less than $.001 per share. b Amount represents less than .01%. See notes to financial statements.
15
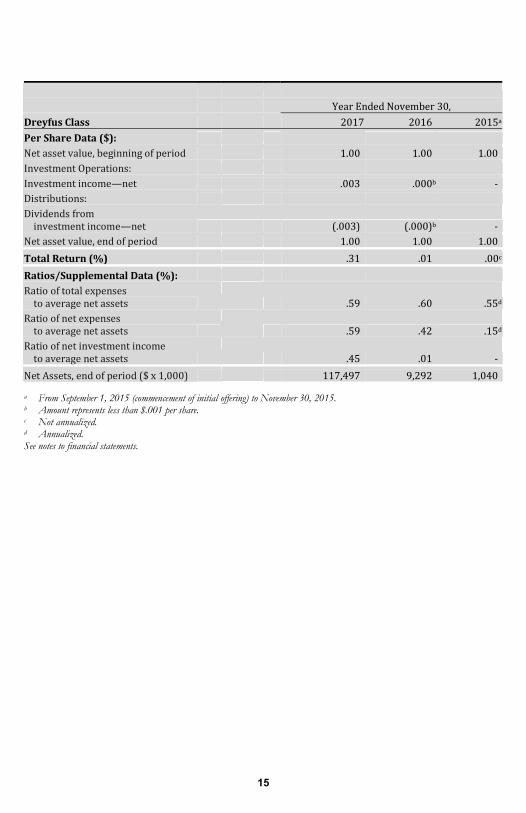
Year Ended November 30, Dreyfus Class 2017 2016 2015aPer Share Data ($): Net asset value, beginning of period 1.00 1.00 1.00Investment Operations: Investment income—net .003 .000b -Distributions: Dividends from investment income—net (.003) (.000)b -Net asset value, end of period 1.00 1.00 1.00Total Return (%) .31 .01 .00cRatios/Supplemental Data (%): Ratio of total expenses to average net assets .59 .60 .55dRatio of net expenses to average net assets .59 .42 .15dRatio of net investment income to average net assets .45 .01 -Net Assets, end of period ($ x 1,000) 117,497 9,292 1,040
a From September 1, 2015 (commencement of initial offering) to November 30, 2015. b Amount represents less than $.001 per share. c Not annualized. d Annualized. See notes to financial statements.
NOTES TO FINANCIAL STATEMENTS
16
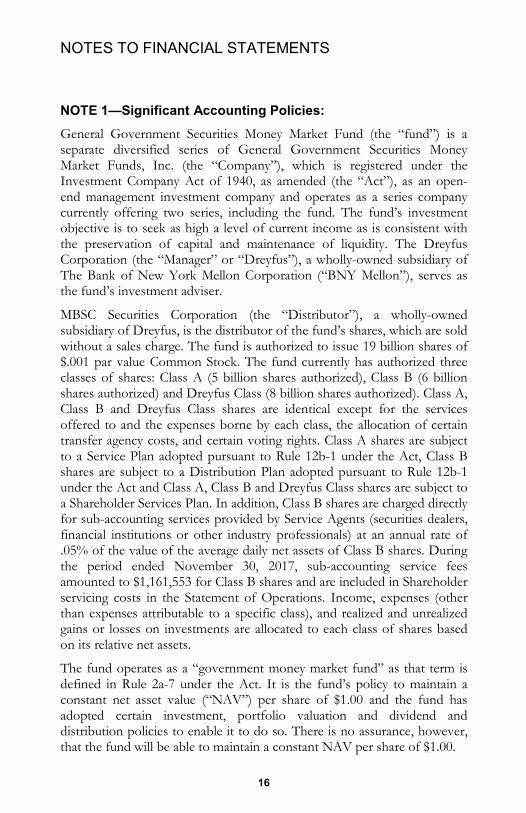
NOTE 1—Significant Accounting Policies:
General Government Securities Money Market Fund (the “fund”) is a separate diversified series of General Government Securities Money Market Funds, Inc. (the “Company”), which is registered under the Investment Company Act of 1940, as amended (the “Act”), as an open-end management investment company and operates as a series company currently offering two series, including the fund. The fund’s investment objective is to seek as high a level of current income as is consistent with the preservation of capital and maintenance of liquidity. The Dreyfus Corporation (the “Manager” or “Dreyfus”), a wholly-owned subsidiary of The Bank of New York Mellon Corporation (“BNY Mellon”), serves as the fund’s investment adviser.
MBSC Securities Corporation (the “Distributor”), a wholly-owned subsidiary of Dreyfus, is the distributor of the fund’s shares, which are sold without a sales charge. The fund is authorized to issue 19 billion shares of $.001 par value Common Stock. The fund currently has authorized three classes of shares: Class A (5 billion shares authorized), Class B (6 billion shares authorized) and Dreyfus Class (8 billion shares authorized). Class A, Class B and Dreyfus Class shares are identical except for the services offered to and the expenses borne by each class, the allocation of certain transfer agency costs, and certain voting rights. Class A shares are subject to a Service Plan adopted pursuant to Rule 12b-1 under the Act, Class B shares are subject to a Distribution Plan adopted pursuant to Rule 12b-1 under the Act and Class A, Class B and Dreyfus Class shares are subject to a Shareholder Services Plan. In addition, Class B shares are charged directly for sub-accounting services provided by Service Agents (securities dealers, financial institutions or other industry professionals) at an annual rate of .05% of the value of the average daily net assets of Class B shares. During the period ended November 30, 2017, sub-accounting service fees amounted to $1,161,553 for Class B shares and are included in Shareholder servicing costs in the Statement of Operations. Income, expenses (other than expenses attributable to a specific class), and realized and unrealized gains or losses on investments are allocated to each class of shares based on its relative net assets.
The fund operates as a “government money market fund” as that term is defined in Rule 2a-7 under the Act. It is the fund’s policy to maintain a constant net asset value (“NAV”) per share of $1.00 and the fund has adopted certain investment, portfolio valuation and dividend and distribution policies to enable it to do so. There is no assurance, however, that the fund will be able to maintain a constant NAV per share of $1.00.
17
The Company accounts separately for the assets, liabilities and operations of each series. Expenses directly attributable to each series are charged to that series’ operations; expenses which are applicable to all series are allocated among them on a pro rata basis.
The Financial Accounting Standards Board (“FASB”) Accounting Standards Codification is the exclusive reference of authoritative U.S. generally accepted accounting principles (“GAAP”) recognized by the FASB to be applied by nongovernmental entities. Rules and interpretive releases of the Securities and Exchange Commission (“SEC”) under authority of federal laws are also sources of authoritative GAAP for SEC registrants. The fund’s financial statements are prepared in accordance with GAAP, which may require the use of management estimates and assumptions. Actual results could differ from those estimates.
The Company enters into contracts that contain a variety of indemnifications. The fund’s maximum exposure under these arrangements is unknown. The fund does not anticipate recognizing any loss related to these arrangements.
(a) Portfolio valuation: Investments in securities are valued at amortized cost in accordance with Rule 2a-7 under the Act. If amortized cost is determined not to approximate market value, the fair value of the portfolio securities will be determined by procedures established by and under the general supervision of the Company’s Board of Directors (the “Board”).
The fair value of a financial instrument is the amount that would be received to sell an asset or paid to transfer a liability in an orderly transaction between market participants at the measurement date (i.e., the exit price). GAAP establishes a fair value hierarchy that prioritizes the inputs of valuation techniques used to measure fair value. This hierarchy gives the highest priority to unadjusted quoted prices in active markets for identical assets or liabilities (Level 1 measurements) and the lowest priority to unobservable inputs (Level 3 measurements).
Additionally, GAAP provides guidance on determining whether the volume and activity in a market has decreased significantly and whether such a decrease in activity results in transactions that are not orderly. GAAP requires enhanced disclosures around valuation inputs and techniques used during annual and interim periods.
Various inputs are used in determining the value of the fund’s investments relating to fair value measurements. These inputs are summarized in the three broad levels listed below:
NOTES TO FINANCIAL STATEMENTS (continued)
18
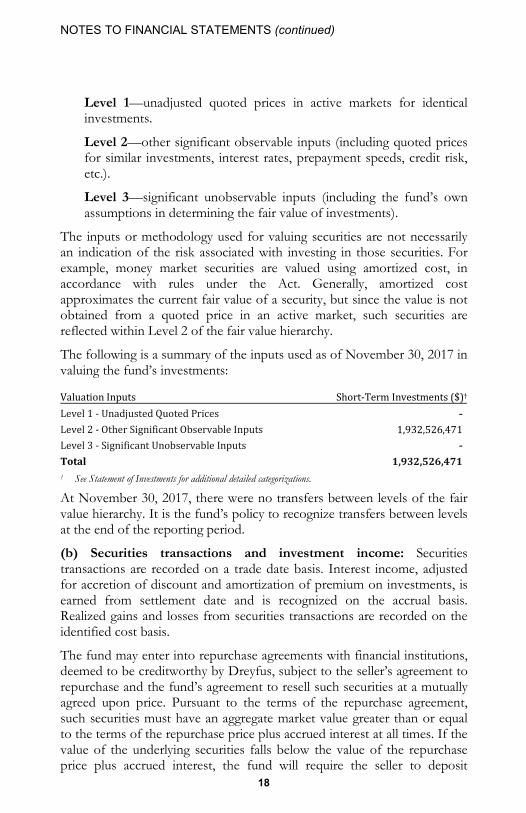
Level 1—unadjusted quoted prices in active markets for identical investments.
Level 2—other significant observable inputs (including quoted prices for similar investments, interest rates, prepayment speeds, credit risk, etc.).
Level 3—significant unobservable inputs (including the fund’s own assumptions in determining the fair value of investments).
The inputs or methodology used for valuing securities are not necessarily an indication of the risk associated with investing in those securities. For example, money market securities are valued using amortized cost, in accordance with rules under the Act. Generally, amortized cost approximates the current fair value of a security, but since the value is not obtained from a quoted price in an active market, such securities are reflected within Level 2 of the fair value hierarchy.
The following is a summary of the inputs used as of November 30, 2017 in valuing the fund’s investments: Valuation Inputs Short-Term Investments ($)†Level 1 - Unadjusted Quoted Prices -Level 2 - Other Significant Observable Inputs 1,932,526,471 Level 3 - Significant Unobservable Inputs -Total 1,932,526,471 † See Statement of Investments for additional detailed categorizations.
At November 30, 2017, there were no transfers between levels of the fair value hierarchy. It is the fund’s policy to recognize transfers between levels at the end of the reporting period.
(b) Securities transactions and investment income: Securities transactions are recorded on a trade date basis. Interest income, adjusted for accretion of discount and amortization of premium on investments, is earned from settlement date and is recognized on the accrual basis. Realized gains and losses from securities transactions are recorded on the identified cost basis.
The fund may enter into repurchase agreements with financial institutions, deemed to be creditworthy by Dreyfus, subject to the seller’s agreement to repurchase and the fund’s agreement to resell such securities at a mutually agreed upon price. Pursuant to the terms of the repurchase agreement, such securities must have an aggregate market value greater than or equal to the terms of the repurchase price plus accrued interest at all times. If the value of the underlying securities falls below the value of the repurchase price plus accrued interest, the fund will require the seller to deposit
19
additional collateral by the next business day. If the request for additional collateral is not met, or the seller defaults on its repurchase obligation, the fund maintains its right to sell the underlying securities at market value and may claim any resulting loss against the seller. The collateral is held on behalf of the fund by the tri-party administrator with respect to any tri-party agreement. The fund may also jointly enter into one or more repurchase agreements with other Dreyfus-managed funds in accordance with an exemptive order granted by the SEC pursuant to section 17(d) and Rule 17d-1 under the Act. Any joint repurchase agreements must be collateralized fully by U.S. Government securities.
(c) Dividends and distributions to shareholders: It is the policy of the fund to declare dividends daily from investment income-net. Such dividends are paid monthly. Dividends from net realized capital gains, if any, are normally declared and paid annually, but the fund may make distributions on a more frequent basis to comply with the distribution requirements of the Internal Revenue Code of 1986, as amended (the “Code”). To the extent that net realized capital gains can be offset by capital loss carryovers, it is the policy of the fund not to distribute such gains.
(d) Federal income taxes: It is the policy of the fund to continue to qualify as a regulated investment company, if such qualification is in the best interests of its shareholders, by complying with the applicable provisions of the Code, and to make distributions of taxable income sufficient to relieve it from substantially all federal income and excise taxes.
As of and during the period ended November 30, 2017, the fund did not have any liabilities for any uncertain tax positions. The fund recognizes interest and penalties, if any, related to uncertain tax positions as income tax expense in the Statement of Operations. During the period ended November 30, 2017, the fund did not incur any interest or penalties.
Each tax year in the four-year period ended November 30, 2017 remains subject to examination by the Internal Revenue Service and state taxing authorities.
At November 30, 2017, the components of accumulated earnings on a tax basis were substantially the same as for financial reporting purposes.
Under the Regulated Investment Company Modernization Act of 2010, the fund is permitted to carry forward capital losses for an unlimited period. Furthermore, capital loss carryovers retain their character as either short-term or long-term capital losses.
NOTES TO FINANCIAL STATEMENTS (continued)
20
The accumulated capital loss carryover is available for federal income tax purposes to be applied against future net realized capital gains, if any, realized subsequent to November 30, 2017. The fund has $883 of short-term capital losses can be carried forward for an unlimited period.
The tax character of distributions paid to shareholders during the fiscal periods ended November 30, 2017 and November 30, 2016 were all ordinary income.
At November 30, 2017, the cost of investments for federal income tax purposes was substantially the same as the cost for financial reporting purposes (see the Statement of Investments).
NOTE 2—Management Fee and Other Transactions with Affiliates:
(a) Pursuant to a management agreement (the “Agreement”) with Dreyfus, the management fee is computed at the annual rate of .50% of the value of the fund’s average daily net assets and is payable monthly. The Agreement provides that if in any full fiscal year the aggregate expenses of the fund (excluding taxes, brokerage commissions and extraordinary expenses) exceed 1½% of the value of the fund’s average daily net assets, the fund may deduct from payments to be made to Dreyfus, or Dreyfus will bear, such excess expense. During the period ended November 30, 2017, there was no expense reimbursement pursuant to the Agreement.
Dreyfus has undertaken to waive receipt of the management fee and/or reimburse operating expenses in order to facilitate a daily yield at or above a certain level which may change from time to time. This undertaking is voluntary and not contractual, and may be terminated at any time. The reduction in expenses, pursuant to the undertaking, amounted to $5,245,475 during the period ended November 30, 2017.
(b) Under the Service Plan with respect to Class A, adopted pursuant to Rule 12b-1 under the Act, Class A shares bear directly the costs of preparing, printing and distributing prospectuses and statements of additional information and of implementing and operating the Service Plan, such aggregate amount not to exceed in any fiscal year of the fund, the greater of $100,000 or .005% of the average daily net assets of Class A. In addition, Class A shares pay the Distributor for distributing its shares, servicing shareholder accounts (“Servicing”) and advertising and marketing relating to Class A shares at an annual rate of .20% of the value of its average daily net assets. The Distributor may pay one or more Service Agents a fee with respect to Class A shares owned by shareholders with whom the Service Agent has a Servicing relationship or for whom the Service Agent is the dealer or holder of record. The schedule of such fees
21
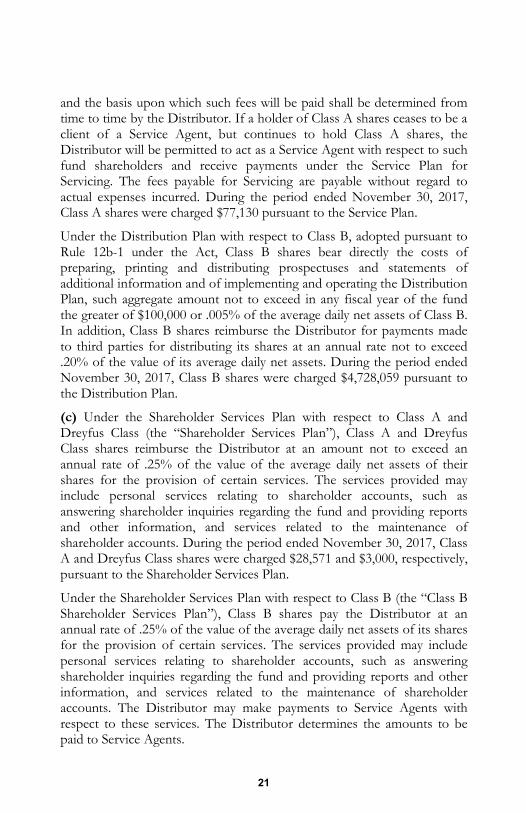
and the basis upon which such fees will be paid shall be determined from time to time by the Distributor. If a holder of Class A shares ceases to be a client of a Service Agent, but continues to hold Class A shares, the Distributor will be permitted to act as a Service Agent with respect to such fund shareholders and receive payments under the Service Plan for Servicing. The fees payable for Servicing are payable without regard to actual expenses incurred. During the period ended November 30, 2017, Class A shares were charged $77,130 pursuant to the Service Plan.
Under the Distribution Plan with respect to Class B, adopted pursuant to Rule 12b-1 under the Act, Class B shares bear directly the costs of preparing, printing and distributing prospectuses and statements of additional information and of implementing and operating the Distribution Plan, such aggregate amount not to exceed in any fiscal year of the fund the greater of $100,000 or .005% of the average daily net assets of Class B. In addition, Class B shares reimburse the Distributor for payments made to third parties for distributing its shares at an annual rate not to exceed .20% of the value of its average daily net assets. During the period ended November 30, 2017, Class B shares were charged $4,728,059 pursuant to the Distribution Plan.
(c) Under the Shareholder Services Plan with respect to Class A and Dreyfus Class (the “Shareholder Services Plan”), Class A and Dreyfus Class shares reimburse the Distributor at an amount not to exceed an annual rate of .25% of the value of the average daily net assets of their shares for the provision of certain services. The services provided may include personal services relating to shareholder accounts, such as answering shareholder inquiries regarding the fund and providing reports and other information, and services related to the maintenance of shareholder accounts. During the period ended November 30, 2017, Class A and Dreyfus Class shares were charged $28,571 and $3,000, respectively, pursuant to the Shareholder Services Plan.
Under the Shareholder Services Plan with respect to Class B (the “Class B Shareholder Services Plan”), Class B shares pay the Distributor at an annual rate of .25% of the value of the average daily net assets of its shares for the provision of certain services. The services provided may include personal services relating to shareholder accounts, such as answering shareholder inquiries regarding the fund and providing reports and other information, and services related to the maintenance of shareholder accounts. The Distributor may make payments to Service Agents with respect to these services. The Distributor determines the amounts to be paid to Service Agents.
NOTES TO FINANCIAL STATEMENTS (continued)
22
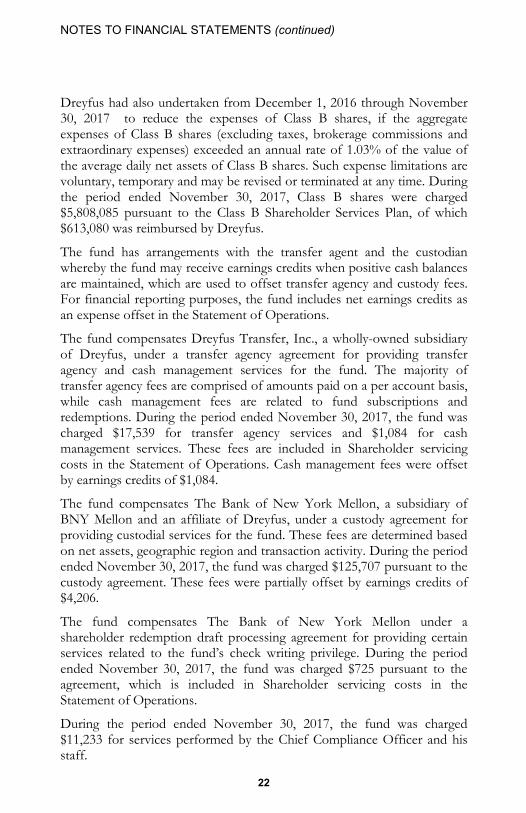
Dreyfus had also undertaken from December 1, 2016 through November 30, 2017 to reduce the expenses of Class B shares, if the aggregate expenses of Class B shares (excluding taxes, brokerage commissions and extraordinary expenses) exceeded an annual rate of 1.03% of the value of the average daily net assets of Class B shares. Such expense limitations are voluntary, temporary and may be revised or terminated at any time. During the period ended November 30, 2017, Class B shares were charged $5,808,085 pursuant to the Class B Shareholder Services Plan, of which $613,080 was reimbursed by Dreyfus.
The fund has arrangements with the transfer agent and the custodian whereby the fund may receive earnings credits when positive cash balances are maintained, which are used to offset transfer agency and custody fees. For financial reporting purposes, the fund includes net earnings credits as an expense offset in the Statement of Operations.
The fund compensates Dreyfus Transfer, Inc., a wholly-owned subsidiary of Dreyfus, under a transfer agency agreement for providing transfer agency and cash management services for the fund. The majority of transfer agency fees are comprised of amounts paid on a per account basis, while cash management fees are related to fund subscriptions and redemptions. During the period ended November 30, 2017, the fund was charged $17,539 for transfer agency services and $1,084 for cash management services. These fees are included in Shareholder servicing costs in the Statement of Operations. Cash management fees were offset by earnings credits of $1,084.
The fund compensates The Bank of New York Mellon, a subsidiary of BNY Mellon and an affiliate of Dreyfus, under a custody agreement for providing custodial services for the fund. These fees are determined based on net assets, geographic region and transaction activity. During the period ended November 30, 2017, the fund was charged $125,707 pursuant to the custody agreement. These fees were partially offset by earnings credits of $4,206.
The fund compensates The Bank of New York Mellon under a shareholder redemption draft processing agreement for providing certain services related to the fund’s check writing privilege. During the period ended November 30, 2017, the fund was charged $725 pursuant to the agreement, which is included in Shareholder servicing costs in the Statement of Operations.
During the period ended November 30, 2017, the fund was charged $11,233 for services performed by the Chief Compliance Officer and his staff.
23
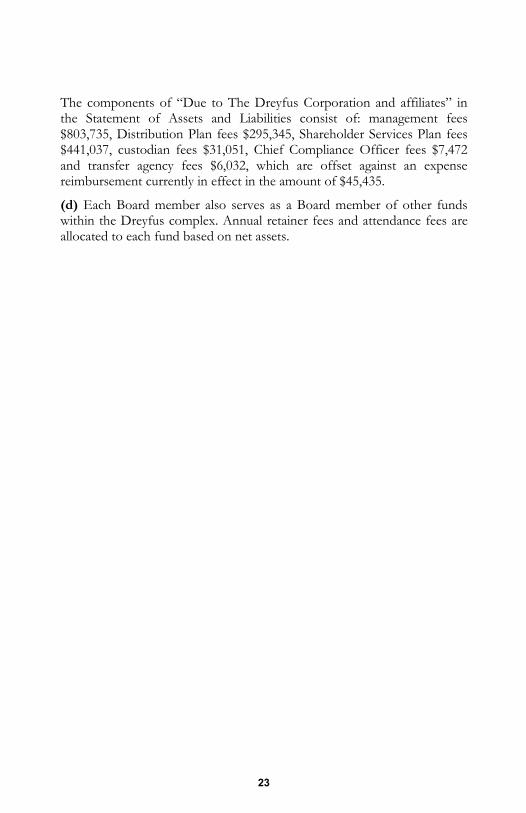
The components of “Due to The Dreyfus Corporation and affiliates” in the Statement of Assets and Liabilities consist of: management fees $803,735, Distribution Plan fees $295,345, Shareholder Services Plan fees $441,037, custodian fees $31,051, Chief Compliance Officer fees $7,472 and transfer agency fees $6,032, which are offset against an expense reimbursement currently in effect in the amount of $45,435.
(d) Each Board member also serves as a Board member of other funds within the Dreyfus complex. Annual retainer fees and attendance fees are allocated to each fund based on net assets.
REPORT OF INDEPENDENT REGISTERED PUBLIC ACCOUNTING FIRM
24
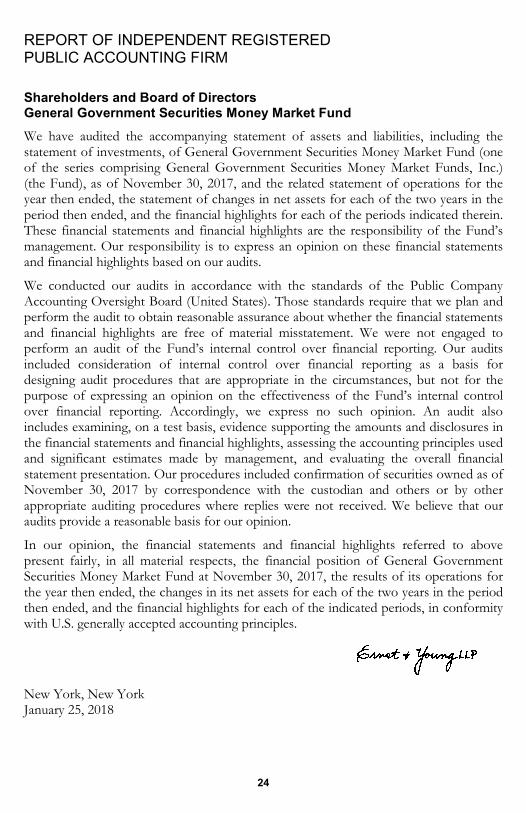
Shareholders and Board of Directors General Government Securities Money Market Fund
We have audited the accompanying statement of assets and liabilities, including the statement of investments, of General Government Securities Money Market Fund (one of the series comprising General Government Securities Money Market Funds, Inc.) (the Fund), as of November 30, 2017, and the related statement of operations for the year then ended, the statement of changes in net assets for each of the two years in the period then ended, and the financial highlights for each of the periods indicated therein. These financial statements and financial highlights are the responsibility of the Fund’s management. Our responsibility is to express an opinion on these financial statements and financial highlights based on our audits.
We conducted our audits in accordance with the standards of the Public Company Accounting Oversight Board (United States). Those standards require that we plan and perform the audit to obtain reasonable assurance about whether the financial statements and financial highlights are free of material misstatement. We were not engaged to perform an audit of the Fund’s internal control over financial reporting. Our audits included consideration of internal control over financial reporting as a basis for designing audit procedures that are appropriate in the circumstances, but not for the purpose of expressing an opinion on the effectiveness of the Fund’s internal control over financial reporting. Accordingly, we express no such opinion. An audit also includes examining, on a test basis, evidence supporting the amounts and disclosures in the financial statements and financial highlights, assessing the accounting principles used and significant estimates made by management, and evaluating the overall financial statement presentation. Our procedures included confirmation of securities owned as of November 30, 2017 by correspondence with the custodian and others or by other appropriate auditing procedures where replies were not received. We believe that our audits provide a reasonable basis for our opinion.
In our opinion, the financial statements and financial highlights referred to above present fairly, in all material respects, the financial position of General Government Securities Money Market Fund at November 30, 2017, the results of its operations for the year then ended, the changes in its net assets for each of the two years in the period then ended, and the financial highlights for each of the indicated periods, in conformity with U.S. generally accepted accounting principles.
New York, New York January 25, 2018

IMPORTANT TAX INFORMATION (Unaudited)
25
For federal tax purposes the fund hereby reports 100% of ordinary income dividends paid during the fiscal year ended November 30, 2017 as qualifying interest related dividends.
INFORMATION ABOUT THE RENEWAL OF THE FUND’S MANAGEMENT AGREEMENT (Unaudited)
26
At a meeting of the fund’s Board of Directors held on July 20, 2017, the Board considered the renewal of the fund’s Management Agreement pursuant to which Dreyfus provides the fund with investment advisory and administrative services (the “Agreement”). The Board members, none of whom are “interested persons” (as defined in the Investment Company Act of 1940, as amended) of the fund, were assisted in their review by independent legal counsel and met with counsel in executive session separate from Dreyfus representatives. In considering the renewal of the Agreement, the Board considered all factors that it believed to be relevant, including those discussed below. The Board did not identify any one factor as dispositive, and each Board member may have attributed different weights to the factors considered.
Analysis of Nature, Extent, and Quality of Services Provided to the Fund. The Board considered information provided to them at the meeting and in previous presentations from Dreyfus representatives regarding the nature, extent, and quality of the services provided to funds in the Dreyfus fund complex. Dreyfus provided the number of open accounts in the fund, the fund’s asset size and the allocation of fund assets among distribution channels. Dreyfus also had previously provided information regarding the diverse intermediary relationships and distribution channels of funds in the Dreyfus fund complex (such as retail direct or intermediary, in which intermediaries typically are paid by the fund and/or Dreyfus) and Dreyfus’ corresponding need for broad, deep, and diverse resources to be able to provide ongoing shareholder services to each intermediary or distribution channel, as applicable to the fund.
The Board also considered research support available to, and portfolio management capabilities of, the fund’s portfolio management personnel and that Dreyfus also provides oversight of day-to-day fund operations, including fund accounting and administration and assistance in meeting legal and regulatory requirements. The Board also considered Dreyfus’ extensive administrative, accounting and compliance infrastructures.
Comparative Analysis of the Fund’s Performance and Management Fee and Expense Ratio. The Board reviewed reports prepared by Broadridge Financial Solutions, Inc. (“Broadridge”), an independent provider of investment company data, which included information comparing (1) the fund’s performance with the performance of a group of comparable funds (the “Performance Group”) and with a broader group of funds (the “Performance Universe”), all for various periods ended May 31, 2017, and (2) the fund’s actual and contractual management fees and total expenses with those of a group of comparable funds (the “Expense Group”) and with a broader group of funds (the “Expense Universe”), the information for which was derived in part from fund financial statements available to Broadridge as of the date of its analysis. Dreyfus previously had furnished the Board with a description of the methodology Broadridge used to select the Performance Group and Performance Universe and the Expense Group and Expense Universe.
Dreyfus representatives stated that the usefulness of performance comparisons may be affected by a number of factors, including different investment limitations that may be applicable to the fund and comparison funds. The Board discussed with representatives of Dreyfus and/or its affiliates the results of the comparisons and considered that the fund’s
27
total return performance was at or within one or two basis points of the Performance Group and Performance Universe medians for all periods.
The Board also reviewed the range of actual and contractual management fees and total expenses of the Expense Group and Expense Universe funds and discussed the results of the comparisons. The Board considered that the fund’s contractual management fee was above the Expense Group median, the fund’s actual management fee was above the Expense Group median and below the Expense Universe median and the fund’s total expense ratio was above the Expense Group and Expense Universe medians. The Board also considered the current fee waiver and expense reimbursement arrangement undertaken by Dreyfus.
Dreyfus representatives reviewed with the Board the management or investment advisory fees paid by funds advised or administered by Dreyfus that are in the same Lipper category as the fund (the “Similar Funds”), and explained the nature of the Similar Funds. They discussed differences in fees paid and the relationship of the fees paid in light of any differences in the services provided and other relevant factors. The Board considered the relevance of the fee information provided for the Similar Funds to evaluate the appropriateness of the fund’s management fee.
Analysis of Profitability and Economies of Scale. Dreyfus representatives reviewed the expenses allocated and profit received by Dreyfus and its affiliates and the resulting profitability percentage for managing the fund and the aggregate profitability percentage to Dreyfus and its affiliates for managing the funds in the Dreyfus fund complex, and the method used to determine the expenses and profit. The Board concluded that the profitability results were not unreasonable given the services rendered and service levels provided by Dreyfus. The Board also considered the fee waiver and expense reimbursement arrangement and its effect on the profitability of Dreyfus and its affiliates. The Board also had been provided with information prepared by an independent consulting firm regarding Dreyfus’ approach to allocating costs to, and determining the profitability of, individual funds and the entire Dreyfus fund complex. The consulting firm also had analyzed where any economies of scale might emerge in connection with the management of a fund.
The Board considered, on the advice of its counsel, the profitability analysis (1) as part of its evaluation of whether the fees under the Agreement, considered in relation to the mix of services provided by Dreyfus, including the nature, extent and quality of such services, supported the renewal of the Agreement and (2) in light of the relevant circumstances for the fund and the extent to which economies of scale would be realized if the fund grows and whether fee levels reflect these economies of scale for the benefit of fund shareholders. Dreyfus representatives stated that, as a result of shared and allocated costs among funds in the Dreyfus fund complex, the extent of economies of scale could depend substantially on the level of assets in the complex as a whole, so that increases and decreases in complex-wide assets can affect potential economies of scale in a manner that is disproportionate to, or even in the opposite direction from, changes in the fund’s asset level. The Board also considered potential benefits to Dreyfus from acting as investment adviser and took into consideration that there were no soft dollar arrangements in effect for trading the fund’s investments.

INFORMATION ABOUT THE RENEWAL OF THE FUND’S MANAGEMENT AGREEMENT (Unaudited) (continued)
28
At the conclusion of these discussions, the Board agreed that it had been furnished with sufficient information to make an informed business decision with respect to the renewal of the Agreement. Based on the discussions and considerations as described above, the Board concluded and determined as follows.
• The Board concluded that the nature, extent and quality of the services provided by Dreyfus are adequate and appropriate.
• The Board generally was satisfied with the fund’s relative performance.
• The Board concluded that the fee paid to Dreyfus continued to be appropriate under the circumstances and in light of the factors and the totality of the services provided as discussed above.
• The Board determined that the economies of scale which may accrue to Dreyfus and its affiliates in connection with the management of the fund had been adequately considered by Dreyfus in connection with the fee rate charged to the fund pursuant to the Agreement and that, to the extent in the future it were determined that material economies of scale had not been shared with the fund, the Board would seek to have those economies of scale shared with the fund.
In evaluating the Agreement, the Board considered these conclusions and determinations and also relied on its previous knowledge, gained through meetings and other interactions with Dreyfus and its affiliates, of Dreyfus and the services provided to the fund by Dreyfus. The Board also relied on information received on a routine and regular basis throughout the year relating to the operations of the fund and the investment management and other services provided under the Agreement, including information on the investment performance of the fund in comparison to similar mutual funds and benchmark performance measures; general market outlook as applicable to the fund; and compliance reports. In addition, the Board’s consideration of the contractual fee arrangements for this fund had the benefit of a number of years of reviews of the Agreement for the fund, or substantially similar agreements for other Dreyfus funds that the Board oversees, during which lengthy discussions took place between the Board and Dreyfus representatives. Certain aspects of the arrangements may receive greater scrutiny in some years than in others, and the Board’s conclusions may be based, in part, on their consideration of the fund’s arrangements, or similar arrangements for other Dreyfus funds that the Board oversees, in prior years. The Board determined to renew the Agreement.
BOARD MEMBERS INFORMATION (Unaudited) INDEPENDENT BOARD MEMBERS
29
Joseph S. DiMartino (74) Chairman of the Board (1995) Principal Occupation During Past 5 Years: • Corporate Director and Trustee (1995-present)
Other Public Company Board Memberships During Past 5 Years: • CBIZ (formerly, Century Business Services, Inc.), a provider of outsourcing functions for small and
medium size companies, Director (1997-present)
No. of Portfolios for which Board Member Serves: 126 ———————
Francine J. Bovich (66) Board Member (2012) Principal Occupation During Past 5 Years: • Trustee, The Bradley Trusts, private trust funds (2011-present)
Other Public Company Board Memberships During Past 5 Years: • Annaly Capital Management, Inc., Director (May 2014-present)
No. of Portfolios for which Board Member Serves: 72 ———————
Peggy C. Davis (74) Board Member (1990) Principal Occupation During Past 5 Years: • Shad Professor of Law, New York University School of Law (1983-present)
No. of Portfolios for which Board Member Serves: 46 ———————
Diane Dunst (78) Board Member (2007) Principal Occupation During Past 5 Years: • President of Huntting House Antiques (1999-present)
No. of Portfolios for which Board Member Serves: 14 ———————
BOARD MEMBERS INFORMATION (Unaudited) (continued) INDEPENDENT BOARD MEMBERS (continued)
30
Nathan Leventhal (74) Board Member (1989) Principal Occupation During Past 5 Years: • President Emeritus of Lincoln Center for the Performing Arts (2001-present) • Chairman of the Avery Fisher Artist Program (1997-2014) • Commissioner, NYC Planning Commission (2007-2011)
Other Public Company Board Memberships During Past 5 Years: • Movado Group, Inc., Director (2003-present)
No. of Portfolios for which Board Member Serves: 46 ———————
Robin A. Melvin (54) Board Member (2012) Principal Occupation During Past 5 Years: • Co-chairman, Illinois Mentoring Partnership, non-profit organization dedicated to increasing the
quantity and quality of mentoring services in Illinois (2014-present; board member since 2013) • Director, Boisi Family Foundation, a private family foundation that supports
youth-serving organizations that promote the self sufficiency of youth from disadvantaged circumstances (1995-2012)
No. of Portfolios for which Board Member Serves: 100 ———————
Once elected all Board Members serve for an indefinite term, but achieve Emeritus status upon reaching age 80. The address of the Board Members and Officers is c/o The Dreyfus Corporation, 200 Park Avenue, New York, New York 10166. Additional information about the Board Member is available in the fund’s Statement of Additional Information which can be obtained from Dreyfus free of charge by calling this toll free number: 1-800-DREYFUS.
Clifford L. Alexander, Jr., Emeritus Board Member Ernest Kafka, Emeritus Board Member Jay I. Meltzer, Emeritus Board Member Daniel Rose, Emeritus Board Member Sander Vanocur, Emeritus Board Member
OFFICERS OF THE FUND (Unaudited)
31
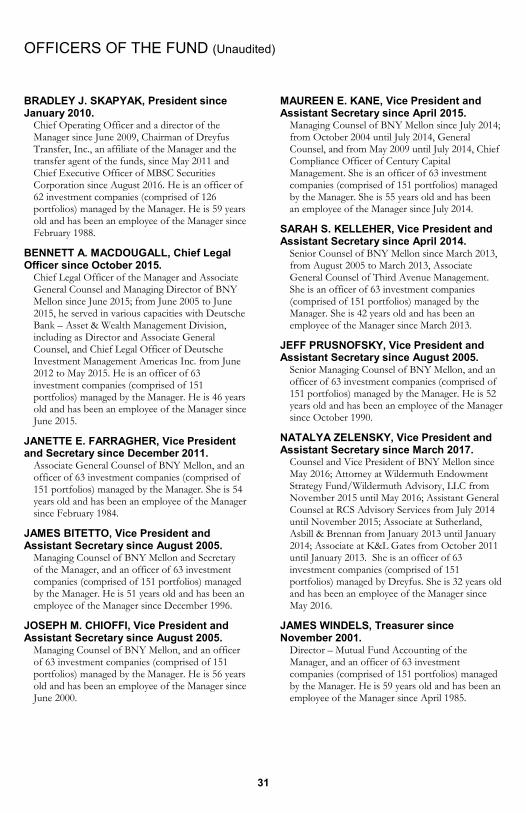
BRADLEY J. SKAPYAK, President since January 2010.
Chief Operating Officer and a director of the Manager since June 2009, Chairman of Dreyfus Transfer, Inc., an affiliate of the Manager and the transfer agent of the funds, since May 2011 and Chief Executive Officer of MBSC Securities Corporation since August 2016. He is an officer of 62 investment companies (comprised of 126 portfolios) managed by the Manager. He is 59 years old and has been an employee of the Manager since February 1988.
BENNETT A. MACDOUGALL, Chief Legal Officer since October 2015.
Chief Legal Officer of the Manager and Associate General Counsel and Managing Director of BNY Mellon since June 2015; from June 2005 to June 2015, he served in various capacities with Deutsche Bank – Asset & Wealth Management Division, including as Director and Associate General Counsel, and Chief Legal Officer of Deutsche Investment Management Americas Inc. from June 2012 to May 2015. He is an officer of 63 investment companies (comprised of 151 portfolios) managed by the Manager. He is 46 years old and has been an employee of the Manager since June 2015.
JANETTE E. FARRAGHER, Vice President and Secretary since December 2011.
Associate General Counsel of BNY Mellon, and an officer of 63 investment companies (comprised of 151 portfolios) managed by the Manager. She is 54 years old and has been an employee of the Manager since February 1984.
JAMES BITETTO, Vice President and Assistant Secretary since August 2005.
Managing Counsel of BNY Mellon and Secretary of the Manager, and an officer of 63 investment companies (comprised of 151 portfolios) managed by the Manager. He is 51 years old and has been an employee of the Manager since December 1996.
JOSEPH M. CHIOFFI, Vice President and Assistant Secretary since August 2005.
Managing Counsel of BNY Mellon, and an officer of 63 investment companies (comprised of 151 portfolios) managed by the Manager. He is 56 years old and has been an employee of the Manager since June 2000.
MAUREEN E. KANE, Vice President and Assistant Secretary since April 2015.
Managing Counsel of BNY Mellon since July 2014; from October 2004 until July 2014, General Counsel, and from May 2009 until July 2014, Chief Compliance Officer of Century Capital Management. She is an officer of 63 investment companies (comprised of 151 portfolios) managed by the Manager. She is 55 years old and has been an employee of the Manager since July 2014.
SARAH S. KELLEHER, Vice President and Assistant Secretary since April 2014.
Senior Counsel of BNY Mellon since March 2013, from August 2005 to March 2013, Associate General Counsel of Third Avenue Management. She is an officer of 63 investment companies (comprised of 151 portfolios) managed by the Manager. She is 42 years old and has been an employee of the Manager since March 2013.
JEFF PRUSNOFSKY, Vice President and Assistant Secretary since August 2005.
Senior Managing Counsel of BNY Mellon, and an officer of 63 investment companies (comprised of 151 portfolios) managed by the Manager. He is 52 years old and has been an employee of the Manager since October 1990.
NATALYA ZELENSKY, Vice President and Assistant Secretary since March 2017.
Counsel and Vice President of BNY Mellon since May 2016; Attorney at Wildermuth Endowment Strategy Fund/Wildermuth Advisory, LLC from November 2015 until May 2016; Assistant General Counsel at RCS Advisory Services from July 2014 until November 2015; Associate at Sutherland, Asbill & Brennan from January 2013 until January 2014; Associate at K&L Gates from October 2011 until January 2013. She is an officer of 63 investment companies (comprised of 151 portfolios) managed by Dreyfus. She is 32 years old and has been an employee of the Manager since May 2016.
JAMES WINDELS, Treasurer since November 2001.
Director – Mutual Fund Accounting of the Manager, and an officer of 63 investment companies (comprised of 151 portfolios) managed by the Manager. He is 59 years old and has been an employee of the Manager since April 1985.
OFFICERS OF THE FUND (Unaudited) (continued)
32
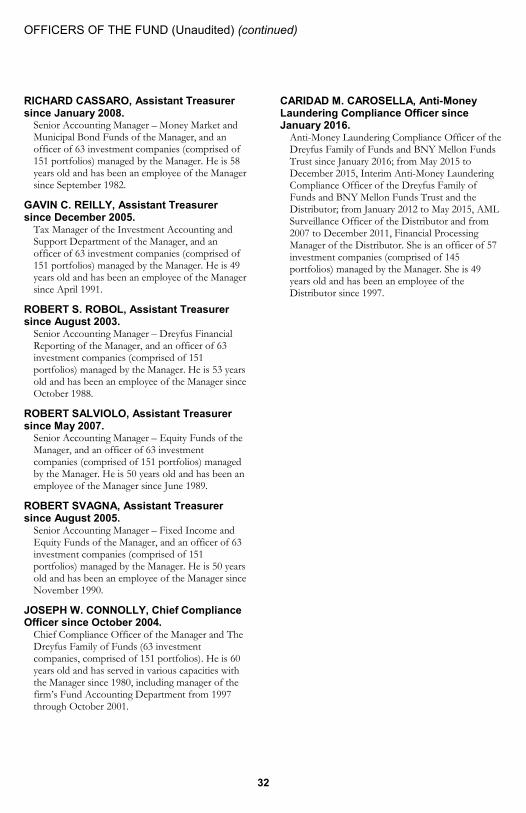
RICHARD CASSARO, Assistant Treasurer since January 2008.
Senior Accounting Manager – Money Market and Municipal Bond Funds of the Manager, and an officer of 63 investment companies (comprised of 151 portfolios) managed by the Manager. He is 58 years old and has been an employee of the Manager since September 1982.
GAVIN C. REILLY, Assistant Treasurer since December 2005.
Tax Manager of the Investment Accounting and Support Department of the Manager, and an officer of 63 investment companies (comprised of 151 portfolios) managed by the Manager. He is 49 years old and has been an employee of the Manager since April 1991.
ROBERT S. ROBOL, Assistant Treasurer since August 2003.
Senior Accounting Manager – Dreyfus Financial Reporting of the Manager, and an officer of 63 investment companies (comprised of 151 portfolios) managed by the Manager. He is 53 years old and has been an employee of the Manager since October 1988.
ROBERT SALVIOLO, Assistant Treasurer since May 2007.
Senior Accounting Manager – Equity Funds of the Manager, and an officer of 63 investment companies (comprised of 151 portfolios) managed by the Manager. He is 50 years old and has been an employee of the Manager since June 1989.
ROBERT SVAGNA, Assistant Treasurer since August 2005.
Senior Accounting Manager – Fixed Income and Equity Funds of the Manager, and an officer of 63 investment companies (comprised of 151 portfolios) managed by the Manager. He is 50 years old and has been an employee of the Manager since November 1990.
JOSEPH W. CONNOLLY, Chief Compliance Officer since October 2004.
Chief Compliance Officer of the Manager and The Dreyfus Family of Funds (63 investment companies, comprised of 151 portfolios). He is 60 years old and has served in various capacities with the Manager since 1980, including manager of the firm’s Fund Accounting Department from 1997 through October 2001.
CARIDAD M. CAROSELLA, Anti-Money Laundering Compliance Officer since January 2016.
Anti-Money Laundering Compliance Officer of the Dreyfus Family of Funds and BNY Mellon Funds Trust since January 2016; from May 2015 to December 2015, Interim Anti-Money Laundering Compliance Officer of the Dreyfus Family of Funds and BNY Mellon Funds Trust and the Distributor; from January 2012 to May 2015, AML Surveillance Officer of the Distributor and from 2007 to December 2011, Financial Processing Manager of the Distributor. She is an officer of 57 investment companies (comprised of 145 portfolios) managed by the Manager. She is 49 years old and has been an employee of the Distributor since 1997.

NOTES
33
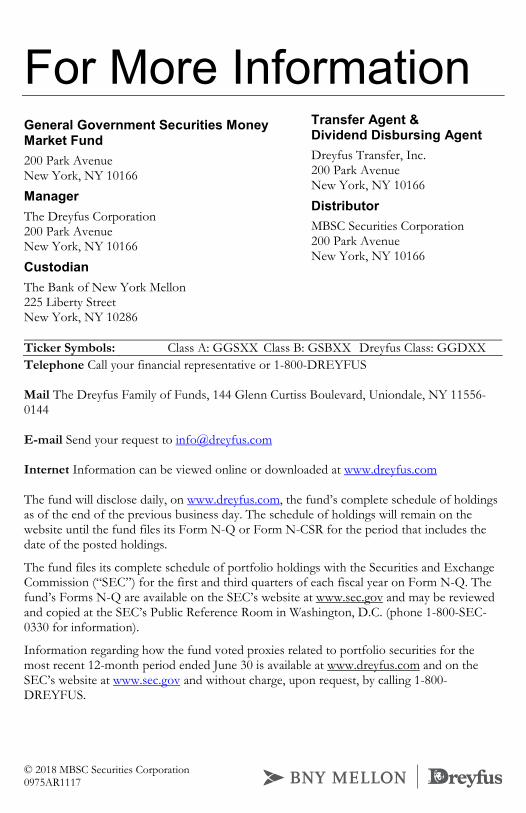
For More Information
General Government Securities Money Market Fund 200 Park Avenue New York, NY 10166 Manager The Dreyfus Corporation 200 Park Avenue New York, NY 10166 Custodian The Bank of New York Mellon 225 Liberty Street New York, NY 10286
Transfer Agent & Dividend Disbursing Agent Dreyfus Transfer, Inc. 200 Park Avenue New York, NY 10166 Distributor MBSC Securities Corporation 200 Park Avenue New York, NY 10166
Ticker Symbols: Class A: GGSXX Class B: GSBXX Dreyfus Class: GGDXX
Telephone Call your financial representative or 1-800-DREYFUS Mail The Dreyfus Family of Funds, 144 Glenn Curtiss Boulevard, Uniondale, NY 11556-0144 E-mail Send your request to [email protected] Internet Information can be viewed online or downloaded at www.dreyfus.com The fund will disclose daily, on www.dreyfus.com, the fund’s complete schedule of holdings as of the end of the previous business day. The schedule of holdings will remain on the website until the fund files its Form N-Q or Form N-CSR for the period that includes the date of the posted holdings.
The fund files its complete schedule of portfolio holdings with the Securities and Exchange Commission (“SEC”) for the first and third quarters of each fiscal year on Form N-Q. The fund’s Forms N-Q are available on the SEC’s website at www.sec.gov and may be reviewed and copied at the SEC’s Public Reference Room in Washington, D.C. (phone 1-800-SEC-0330 for information).
Information regarding how the fund voted proxies related to portfolio securities for the most recent 12-month period ended June 30 is available at www.dreyfus.com and on the SEC’s website at www.sec.gov and without charge, upon request, by calling 1-800-DREYFUS.
© 2018 MBSC Securities Corporation 0975AR1117