Embed Size (px)
Citation preview

Cobb County – Monthly Report July 2017
08/15/2017 Page 1
General Fund Tax Digest
22,000,000,000
23,000,000,000
24,000,000,000
25,000,000,000
26,000,000,000
27,000,000,000
28,000,000,000
29,000,000,000
30,000,000,000
2008 2009 2010 2011 2012 2013 2014 2015 2016 2017
General Fund Net Tax Digest
2014 2015 2016 2017
General Fund General Fund General Fund General Fund
Actual Actual Actual Draft
Millage rate 7.32 7.12 6.66 6.76
Collection rate 97.0% 97.0% 97.5% 97.5%
Digest:
Real Property
Residential Digest 16,821,521,929 18,080,929,352 20,124,950,954 21,967,122,232
Commercial 7,047,426,440 7,453,159,045 7,643,949,575 8,275,688,219
Other Real - -
Industrial 212,868,277 219,091,876 223,473,714 226,974,936
Historic 511,992 417,632 478,812 500,596
Agricultural 25,843,468 26,808,432 30,170,268 31,195,200
Conservation Use 58,208,920 59,803,816 66,313,920 72,710,408
Environmentally Sensitive 821,640 821,640 917,956 917,956
Brownfield/Other 1990's 1,578,308 1,588,428 10,139,664 8,999,576
Real Total 24,168,780,974 25,842,620,221 28,100,394,863 30,584,109,123
Personal 3,072,303,669 3,285,988,674 3,505,481,019 3,073,458,137
Digest Total 27,241,084,643 29,128,608,895 31,605,875,882 33,657,567,260
Percentage change 5.18% 6.93% 8.50% 6.49%
Public Utilities 928,432,959 909,689,631 895,140,282 891,594,200
Motor Vehicle 1,738,380,920 1,225,041,260 893,639,020 635,437,210
Mobile Home 13,163,520 13,174,352 12,811,522 12,260,801
Timber 25,813 - 23,000 73,877
Heavy Duty Equipment 2,575,170 2,543,288 3,157,986 3,464,230
Gross Digest 29,923,663,025 31,279,057,426 33,410,647,692 35,200,397,578
Exemptions (4,314,078,151) (4,843,979,462) (5,801,833,742) (6,019,419,127)
Taxable Digest 25,609,584,874 26,435,077,964 27,608,813,950 29,180,978,451
% Change from Prior Year Digest 3.60% 3.22% 4.44% 5.69%
General Fund

Cobb County – Monthly Report July 2017
08/15/2017 Page 2
General Fund Revenue Analysis
As of the month ended July 2017, General Fund revenues were $5.3M more than July 2016. The
largest driver of that variance was the increase of $4.7M to transfers in, which was caused by restoring
the Water Fund’s subsidy to the General Fund to 10% and transfer in to cover the Stadium Bond’s debt
service payments. Despite the overall increase in revenue, there are several revenue sources that are
under performing. In the Other Taxes category, the Title Ad Valorem Tax is currently $1.9M less than the
prior year’s collections. The County has anticipated this decrease and has set aside a 3% fund balance
reserve to help soften the decline. The County will use half of that reserve in 2017, but it will continue to
closely monitor this revenue source. Licenses and Permits are down due to a decrease in commercial
building permits, which were elevated in the prior year due to the Braves development. Additionally, the
Fines and Forfeitures category is down $1.2M from the prior year, and all but one of the revenue sources
in this category are down.
July 2017 July 2016 Inc/(Dec) % Change
Property Taxes 21,171,202.60 21,157,662.46 13,540.14 0.06%
Penalties & Interest on Taxes 2,894,948.48 2,691,901.33 203,063.02 7.54%
Other Taxes 46,030,571.84 47,196,625.26 (1,166,053.42) -2.47%
License and Permits 25,936,311.41 26,267,866.65 (331,555.24) -1.26%
Intergovernmental 2,734,758.01 3,064,699.13 (329,941.12) -10.77%
Charges for Services 33,819,771.73 32,518,280.16 1,301,491.57 4.00%
Fines and forfeitures 8,062,058.30 9,224,465.55 (1,162,407.25) -12.60%
Interest Earnings 365,214.98 217,808.13 147,406.85 67.68%
Miscellaneous 7,502,793.01 4,940,546.25 2,562,246.76 51.86%
Transfers In 29,593,925.67 24,898,131.04 4,695,794.63 18.86%
Other Sources 1,352,708.38 1,963,954.79 (611,246.41) -31.12%
Total General Fund Revenues 179,464,264.41 174,141,940.75 5,322,339.53 3.06%
Selected Accounts
Account Account Description July 2017 July 2016 Inc/(Dec) % Change
010-4225 4225 Insurance Premium Tax 28,405,029.46 26,709,770.19 1,695,259.27 6.35%
010-4235 4235 Real Estate Transfer Tax 1,164,059.91 1,242,140.02 (78,080.11) -6.29%
010-4322 4322 Commercial Permits 3,322,137.35 4,571,617.89 (1,249,480.54) -27.33%
010-4324 4324 Residential Permits 1,765,978.03 1,651,173.47 114,804.56 6.95%
010-4632 4632 Deed-Recording Fees 1,494,638.50 1,364,439.50 130,199.00 9.54%
010-4634 4634 Intangible Recording Fees 3,283,313.23 3,182,503.75 100,809.48 3.17%
010-4636 4636 Subdivision Record Fees 6,739.00 7,992.00 (1,253.00) -15.68%
010-4638 4638 Misc Recording/Filing Fee 137,496.62 210,550.55 (73,053.93) -34.70%
39,579,392.10 38,940,187.37 639,204.73 1.64%
Revenue Source

Cobb County – Monthly Report July 2017
08/15/2017 Page 3
As of the month-ended July 31, 2017, General Fund expenditures were approximately $25.1
million more than July 31, 2016. The largest components of the increase were personnel services, debt
service, and transfers out.
Personnel services for July FY17 were $9.8 million more than July FY16. Salaries, including part-
time hourly and per day positions, were $4.6 million higher than in July FY16. A majority of the variance
in full-time salaries is the result of a merit increase that was awarded in March of 2017. Also, a pay study
was implemented for the second payroll in June 2017. The pay study is expected to increase General Fund
and General Fund supported funds payroll by $2.7 million for the remainder of FY 2017. The full year
impact of the pay study implementation is estimated to by $10.3 million.
Full-time salaries can also be affected by the number of vacancies on the roster. The General Fund
had 272 vacant positions on July 28, 2017. The large increase in vacancies can also be attributed to the
additional positions added to the General Fund with the FY16 and FY17 Adopted Budgets. A vacancy
report from the last payroll of July 28, 2017 to June 24, 2016 can be found below:
Lastly, personnel services were also affected by a $5.2 million increase in various benefit
expenditure accounts with the largest increase coming from medical interfund transfers for employee
health benefits. Also, the County’s pension contribution is trending higher as the contribution rate
stepped up from 19.31% to 19.68% in FY17 in order to reach the Annual Required Contribution. The
increases in both medical Interfund transfers and pension contributions in FY17 were expected and
budgeted accordingly.
Debt service expenditures are $6.5 million more than in July 2017. The main driver of this are the
escalating debt service payments in relation to the Cobb Marietta Exhibit Hall Authority Revenue Bonds,
Series 2015 (“Stadium Bonds”). More specifically, the interest payment made in FY 2016 totaled $12.2
million while those made in FY 2017 totaled approximately $15 million, a $2.8 million difference. Also,
the first principal payment was made in July 2017 totaling $3.69 million. There were no principal payments
in FY 2016. Beginning in FY 2018, the total debt service, principal and interest, for the Stadium Bonds will
be approximately $22.4 million annually. It will remain at $22.4 million for the life of the bonds.
Classification July 2017 July 2016 Inc/(Dec) % Change
FY17 % of
Total
FY16 % of
Total
Personal services 213,737,049 203,852,742 9,884,306.33 4.85% 66.19% 68.45%
Operating exp 66,366,754 64,867,673 1,499,081.86 2.31% 20.55% 21.78%
Capital 4,587,739 3,400,730 1,187,008.83 34.90% 1.42% 1.14%
Debt service 18,822,037 12,269,657 6,552,379.87 53.40% 5.83% 4.12%
Transfers out 19,381,455 13,400,595 5,980,859.12 44.63% 6.00% 4.50%
Total 322,895,033 297,791,397 25,103,636.01 8.43%
GENERAL FUND YTD EXPENDITURES
7/28/2017 6/20/2017 12/20/2016 6/21/2016 12/21/2015 6/23/2015 12/22/2014 6/24/2014
General Fund 272 263 239 268 238 216 231 197

Cobb County – Monthly Report July 2017
08/15/2017 Page 4
There are two important factors to note when discussing the Stadium Bonds. First, the Stadium
Bond expenditures are recorded in the General Fund as a procedural step to simplify future accounting
transactions. Second, there are associated revenues being transferred into the General Fund from the
Cumberland Special Services District I and Cumberland Special Services District II to offset a majority of
payments as well as a $6.1 million annual payment from the Atlanta Braves.
Transfers out are approximately $5.9 million more than in July 2016. The majority of the variance
is the result of two transfers in the month of July. The first transfer was for the DOT Local Match and
amounted to approximately $2.3 million. The DOT Local Match is the portion that the General Fund pays
to contribute toward DOT related projects that receive Federal and State grant funds. These grants
typically require a local match of funds typically between 10-15% of the overall award. The DOT Local
Match was adopted in the FY17 budget, but was not part of the FY16 adopted budget. Because of this,
the variance related to the DOT local match will continue for the rest of the fiscal year. The second transfer
was for PC and Printer replacement. Approximately $925,000 was transferred out of the General Fund to
the Capital Projects Fund to cover the General Fund’s portion of the PC and printer replacement costs for
the county.

Cobb County – Monthly Report July 2017
08/15/2017 Page 5
General Fund Cash Position
Cash Position for Tax Anticipation Notes
Total Cash 010
Fiscal Year October November December January February March
2017 93,820,285 96,748,796 85,516,620 76,325,725 58,080,189 38,592,156
2016 76,844,787 106,093,798 96,907,095 74,131,962 73,091,302 56,600,625
2015 77,717,265 102,842,842 86,731,534 87,053,216 69,470,154 59,211,606
2014 76,613,336 77,382,160 76,207,660 64,737,285 53,556,682 45,961,669
2013 90,120,868 80,834,856 64,255,664 49,276,430 36,560,276 29,152,498
2012 55,241,920 147,870,521 57,198,812 39,184,970 28,980,993 19,712,159
2011 96,964,752 130,244,966 31,623,148 21,329,117 9,607,313 (2,231,219)
2010 77,293,132 138,955,763 22,953,703 13,311,982 7,700,068 (5,319,155)
Total Cash
Fiscal Year April May June July August September
2017 23,836,693 11,393,505 18,166,848 (17,756,263) - -
2016 44,000,937 30,381,692 1,894,446 9,298,184 (15,466,119) 16,555,522
2015 35,053,358 20,278,238 (484,132) (18,312,194) (30,977,554) 17,035
2014 51,580,598 38,543,713 19,220,204 (1,195,197) (15,340,857) 11,037,081
2013 48,104,470 28,316,634 10,491,489 (5,988,138) (23,591,666) 28,582,987
2012 50,308,686 33,303,317 19,020,693 2,286,056 (11,576,155) 28,005,023
2011 46,783,558 32,997,187 8,480,377 (8,189,933) (20,426,534) 64,352,771
2010 64,559,348 49,486,229 21,727,088 5,310,532 (9,042,458) 19,214,735
Fund Equivalents Yes
Fiscal Year October November December January February March
2017 150,035,987 155,028,116 133,747,529 119,400,742 98,103,811 72,081,062
2016 149,651,004 152,619,133 134,093,012 128,154,621 119,657,647 88,910,619
2015 202,870,700 154,586,760 132,598,252 127,738,912 104,957,409 91,557,808
2014 181,643,528 103,009,837 115,777,689 99,444,260 83,164,467 73,484,762
2013 203,684,887 123,935,174 104,749,886 82,360,791 69,636,103 56,208,613
2012 200,773,867 219,776,087 78,333,610 60,410,391 48,590,577 36,941,776
2011 175,317,550 189,124,081 45,068,298 30,883,850 15,622,111 (64,639)
2010 212,691,084 207,887,608 45,592,868 31,242,548 24,449,979 5,587,166
Fund Equivalents
Fiscal Year April May June July August September
2017 53,581,621 37,396,689 71,630,150 30,644,361 - -
2016 73,557,746 53,546,579 18,147,794 23,362,052 (8,797,571) 27,070,764
2015 62,573,560 43,322,657 15,634,554 20,884,754 8,340,449 18,224,441
2014 104,652,362 86,563,217 64,056,324 37,296,128 17,115,572 7,572,369
2013 107,913,702 82,890,375 63,247,391 38,767,343 13,814,000 31,026,167
2012 108,562,630 85,921,015 67,895,829 47,741,788 31,627,854 44,989,033
2011 95,732,488 76,184,765 45,118,324 23,604,946 7,477,802 23,480,912
2010 109,861,025 89,319,890 53,684,913 31,785,921 13,451,700 25,468,711

Cobb County – Monthly Report July 2017
08/15/2017 Page 6
Fire District Fund
Fire District Fund Analysis
The Fire District Fund’s operating results through July of 2017 are down $5.6 million. The
reduction in the change of fund balance is attributed to increases in personnel services due to merit and
pay and class implementation. Additionally there were also increases in operating and capital
expenditures, as the Fire District Fund has starting to implement their capital plan. The July analysis
indicates the Fire District Fund is stable and will finish the year within its budget assuming a property tax
collection rate of 97% from August through November.
Cobb County – Monthly Report July 2017
08/15/2017 Page 7
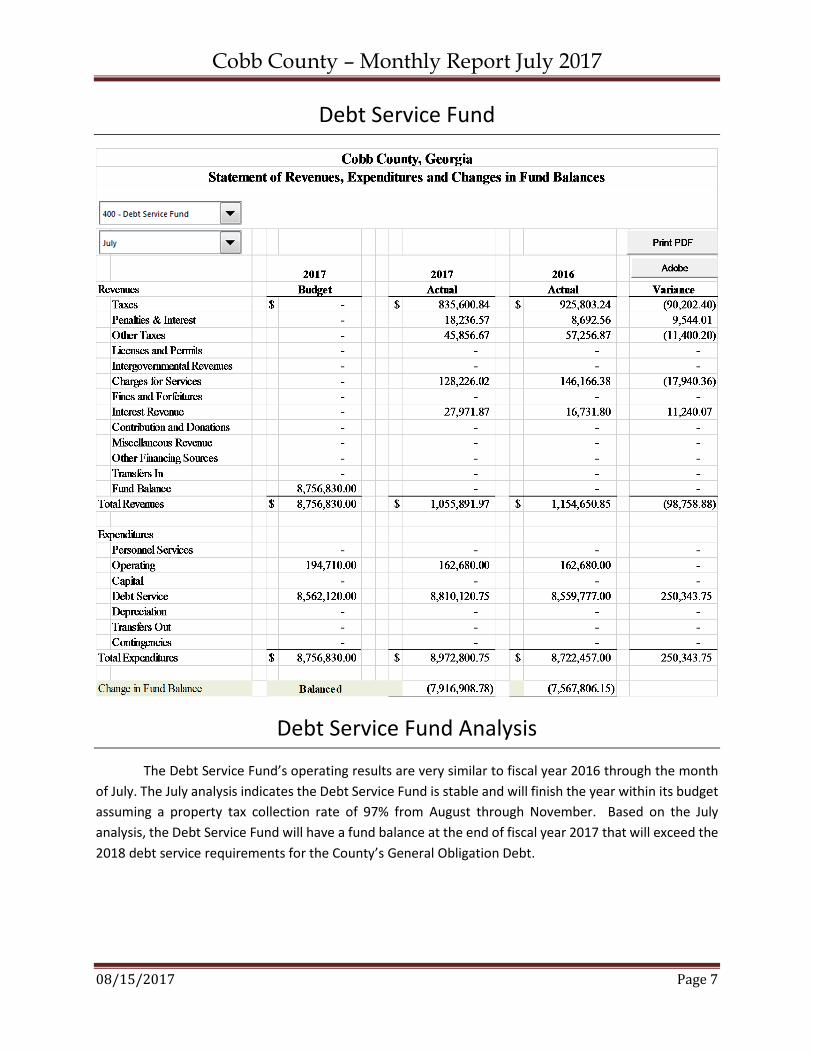
Debt Service Fund
Debt Service Fund Analysis
The Debt Service Fund’s operating results are very similar to fiscal year 2016 through the month
of July. The July analysis indicates the Debt Service Fund is stable and will finish the year within its budget
assuming a property tax collection rate of 97% from August through November. Based on the July
analysis, the Debt Service Fund will have a fund balance at the end of fiscal year 2017 that will exceed the
2018 debt service requirements for the County’s General Obligation Debt.
Cobb County – Monthly Report July 2017
08/15/2017 Page 8
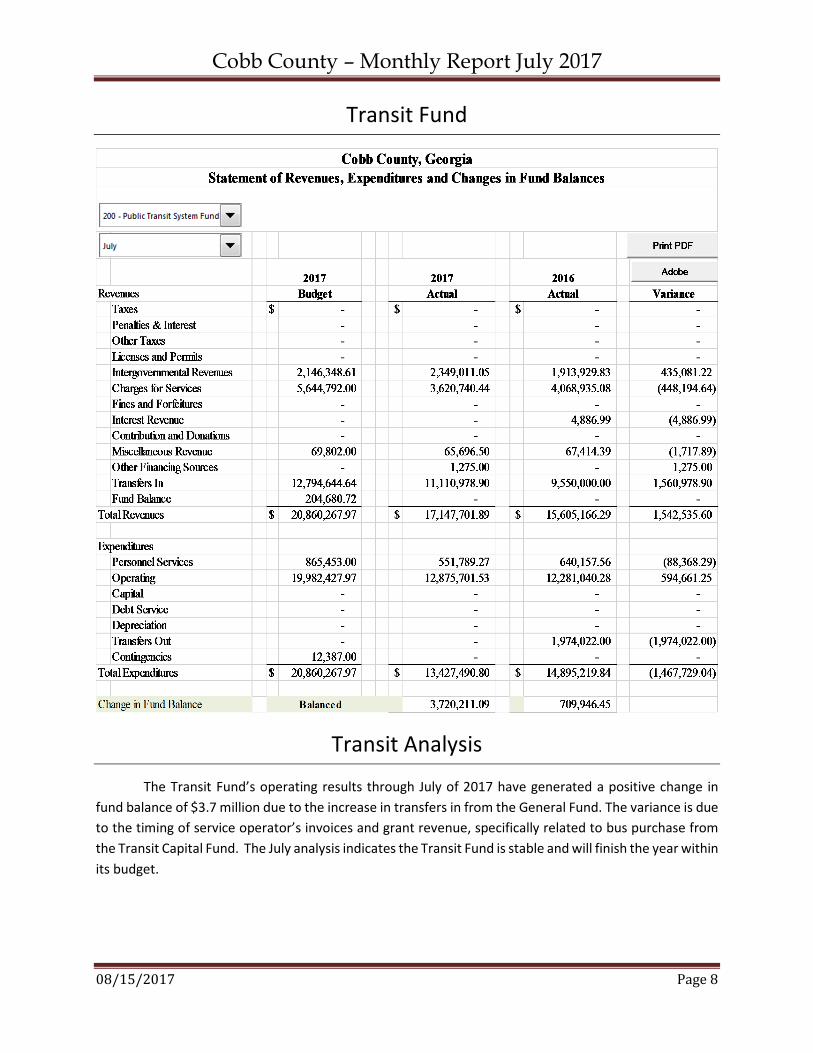
Transit Fund
Transit Analysis
The Transit Fund’s operating results through July of 2017 have generated a positive change in
fund balance of $3.7 million due to the increase in transfers in from the General Fund. The variance is due
to the timing of service operator’s invoices and grant revenue, specifically related to bus purchase from
the Transit Capital Fund. The July analysis indicates the Transit Fund is stable and will finish the year within
its budget.

Cobb County – Monthly Report July 2017
08/15/2017 Page 9
Hotel Motel Fund
Hotel Motel Analysis
As of the month ended July 2017 Hotel Motel Tax collections were $795K more than July 2016.
Based on the analysis this fund’s tax collections will exceed the annual required debt service obligations
on the Cobb-Marietta and Exhibit Hall Authority Refunding Revenue Bonds, Series 2013. Those excess
funds will be transfers to the General Fund to be used to travel and tourism.

Cobb County – Monthly Report July 2017
08/15/2017 Page 10
Water Operations Fund
Water Operations Fund Analysis
The Water Operations Fund’s change in fund balance through July 2017 $21.5 million less than
July 2016. The Water and Sewerage Service Fees have positive variance, which accounts for the majority
of the increase in revenues. Transfer Out of to the General Fund in FY17 was $20 million more than the
transfer made in fiscal year 2016. Additionally, the Water Fund transferred $11.3M out to cover water
infrastructure during July 2017. The Water Transfer to the General Fund was restored 6% to 10% of prior
year revenues.

Cobb County – Monthly Report July 2017
08/15/2017 Page 11
Health Fund
Health Fund Analysis
The Health Fund’s operating expenditures are $1.7M more through July of 2017 than compared
to the same period for 2016. The increase is related to a decline in medical and dental benefits paid out.
Any medical benefits paid for retirees helps the County meet is annual required contribution to the
OPEB. In fiscal year 2016 the County met its annual required contribution to the OPEB, without any
additional cash contributions, and no additional cash contributions have been made in fiscal year 2017.

Cobb County – Monthly Report July 2017
08/15/2017 Page 12

Cobb County – Monthly Report July 2017
08/15/2017 Page 13
The 2016 SPLOST Fund has generated $209.9 million in SPLOST revenue from inception through the month of July, which is approximately $23.7M over initial
projections.

Cobb County – Monthly Report July 2017
08/15/2017 Page 14
Watch List Funds
Streetlight District Fund Analysis
The Streetlight District Fund has been placed on the watch list because the County committed to
review the Streetlight District Fees after the fund reached its reserve fund balance goals. At the end of
2016 this fund surpassed those goals and now the fees need to be reevaluated.
Watch List Funds
Cobb County – Monthly Report July 2017
08/15/2017 Page 15
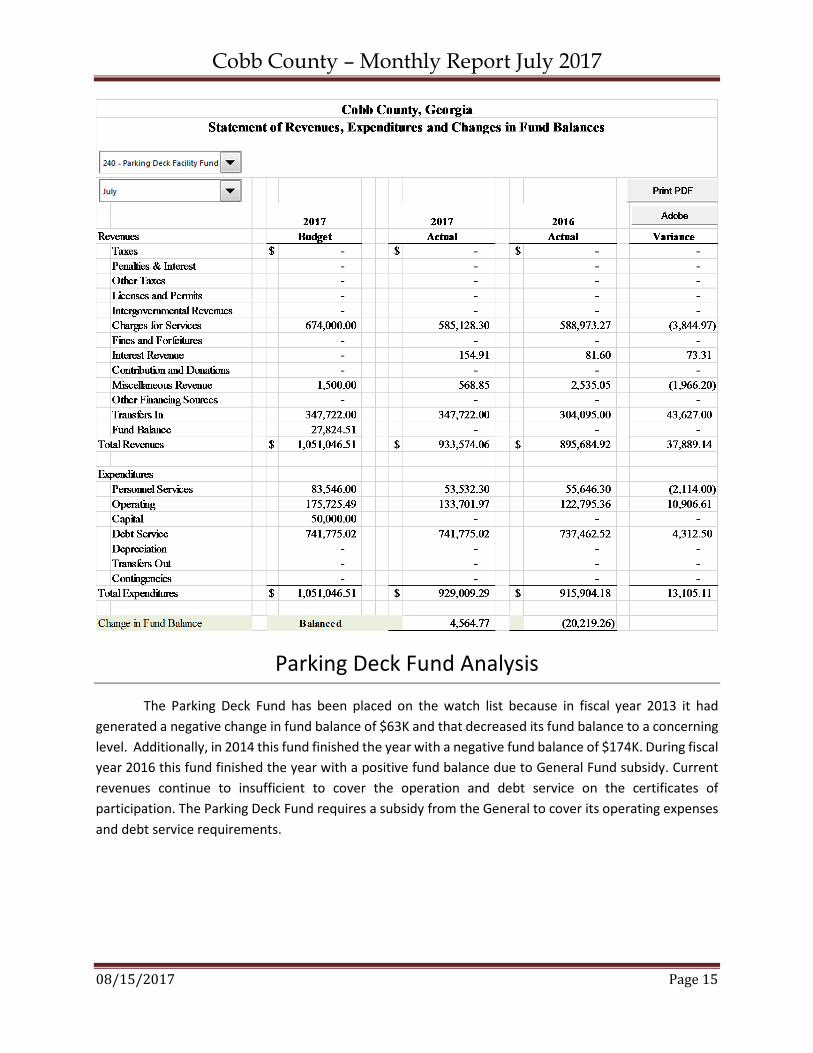
Parking Deck Fund Analysis
The Parking Deck Fund has been placed on the watch list because in fiscal year 2013 it had
generated a negative change in fund balance of $63K and that decreased its fund balance to a concerning
level. Additionally, in 2014 this fund finished the year with a negative fund balance of $174K. During fiscal
year 2016 this fund finished the year with a positive fund balance due to General Fund subsidy. Current
revenues continue to insufficient to cover the operation and debt service on the certificates of
participation. The Parking Deck Fund requires a subsidy from the General to cover its operating expenses
and debt service requirements.