Embed Size (px)
Citation preview
General Electric Company
e
1998Annual Report
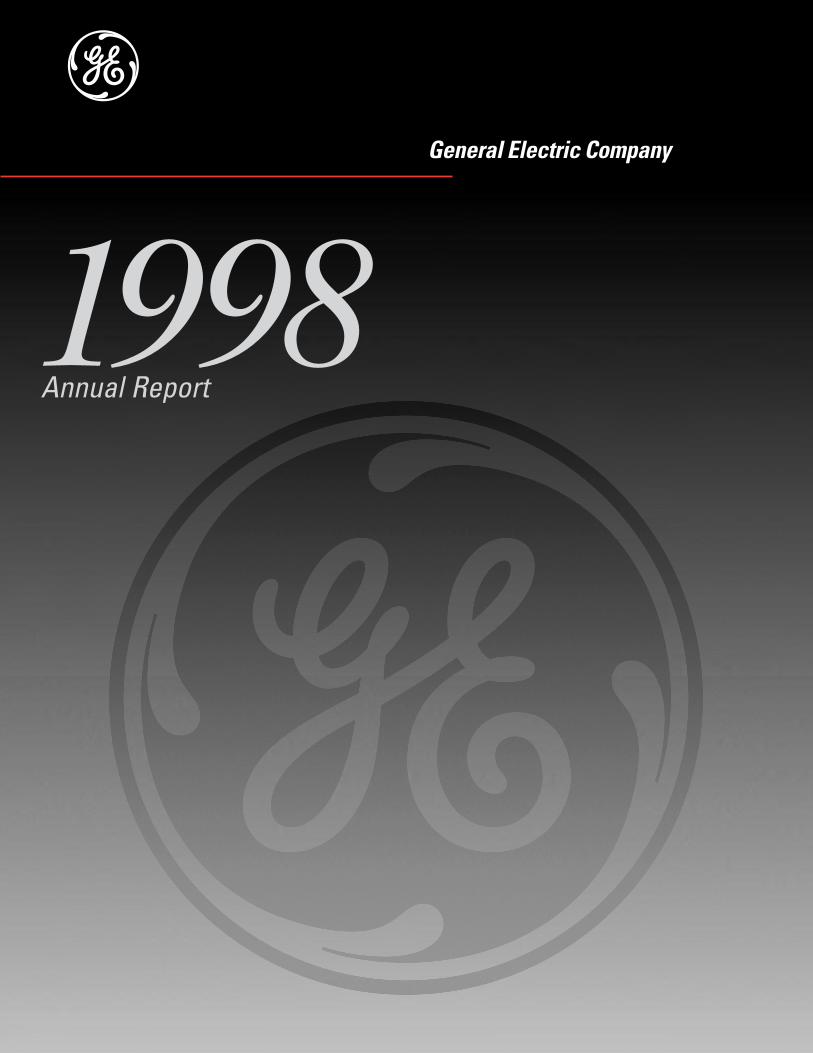
Financial Highlights
General Electric Company and consolidated affiliates
(Dollar amounts in millions; per-share amounts in dollars) 1998 1997 1996
Revenues $ 100,469 $ 90,840 $ 79,179Net earnings 9,296 8,203 7,280Dividends declared 4,081 3,535 3,138Per share
Net earnings 2.80 2.46 2.16Dividends declared 1.25 1.08 .95
GE ongoing operating margin rate (a) 16.7% 15.7% 14.8%
(a) “Ongoing operating margin” here and elsewhere in this report excludes restructuring and other special charges in 1997.
This entire Annual Report is printed on recycled paper.
Contents
1 Letter to Share Owners7 Innovation8 Business Review
18 Community Service20 Board of Directors22 Management25 Financial Section69 Corporate Information
1
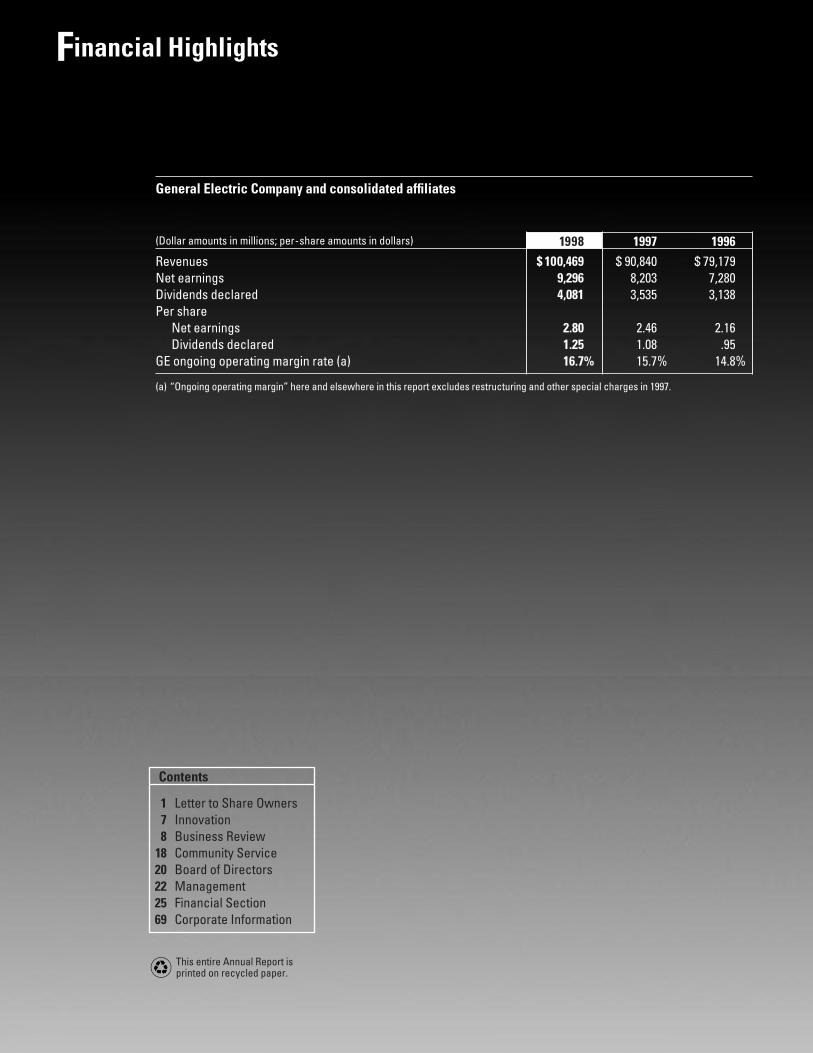
o Our Share Owners, Employees and CustomersT
1998 was another terrific year for your Company — another record year.
Chairman and Chief Executive
Officer John F. Welch, Jr. (center)
and Vice Chairmen and Executive
Officers Dennis D. Dammerman
(left), Eugene F. Murphy (back)
and John D. Opie (right) form
GE’s Corporate Executive Office.
Our share owners — including our active and retired employees, who
now own more than $17 billion in GE stock in their savings plans — were
rewarded for these actions and this performance — the total return on a
share of GE stock was 41% in 1998. GE has averaged a 24% per-year total
return to share owners for the past 18 years.
▪ Revenues rose to $100.5 billion, up 11%.
▪ Earnings increased 13% to $9.3 billion.
▪ Earnings per share grew 14% to $2.80.
▪ Operating margin rose to a record 16.7%, up a full point from the record 15.7% of1997. Working capital turns rose sharply to 9.2, up from 1997’s record of 7.4.
▪ This performance generated $10 billion infree cash flow, which, in combination with a “AAA” debt rating, allowed us to invest$21 billion for 108 acquisitions in support
of two of our three Company-wide initia-tives: Globalization and Services.
▪ Record cash flow allowed us to raisedividends by 17% and to further increaseshare owner value by repurchasing anadditional $3.6 billion in GE stock.
▪ In 1998,GE was named Fortune magazine’s“Most Admired Company in America”and “The World’s Most Respected Company” by a worldwide businessaudience in the Financial Times.
2
Life and quickly became a force in the Japanese insurance
industry. We also acquired the consumer loan business of
Japan’s Lake Corporation, with $6.2 billion in assets, and added
it to our already rapidly growing consumer finance business
there. These acquisitions, along with several other ventures,
partnerships and buyouts by our industrial businesses, together
with the growth of our ongoing existing businesses in Japan,
should allow us to more than double our over $300 million in
1998 Japanese earnings within three years.
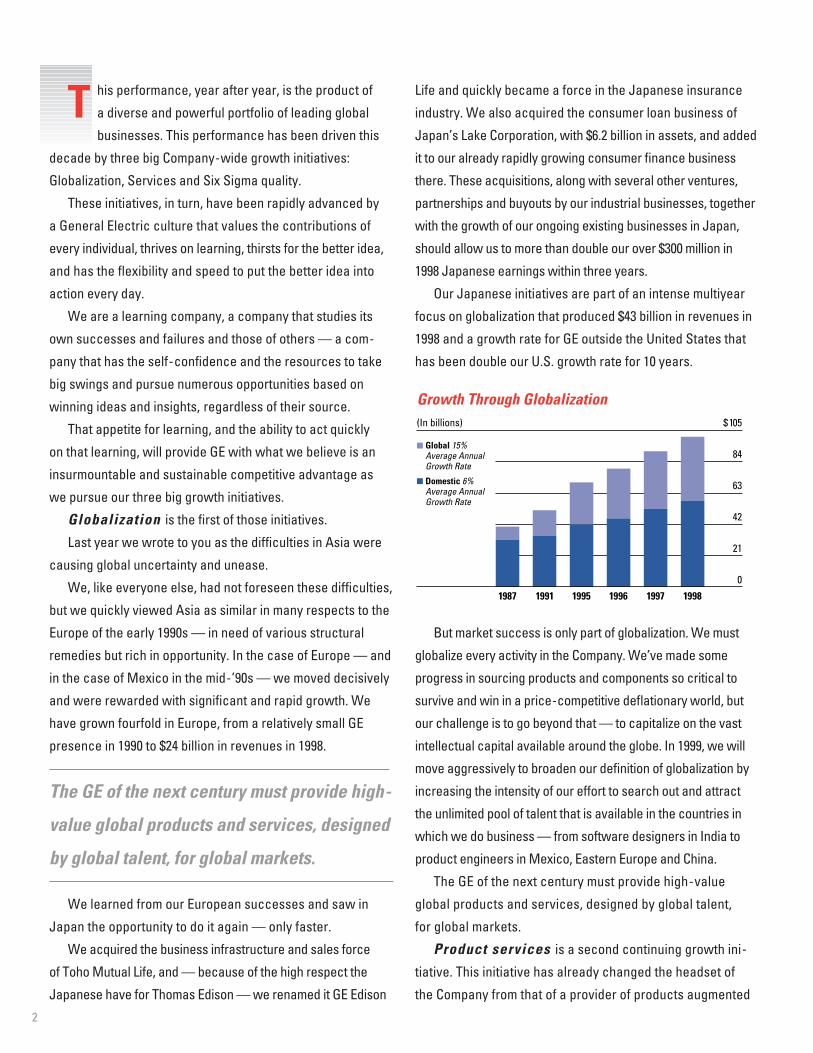
Our Japanese initiatives are part of an intense multiyear
focus on globalization that produced $43 billion in revenues in
1998 and a growth rate for GE outside the United States that
has been double our U.S. growth rate for 10 years.
But market success is only part of globalization. We must
globalize every activity in the Company. We’ve made some
progress in sourcing products and components so critical to
survive and win in a price-competitive deflationary world, but
our challenge is to go beyond that — to capitalize on the vast
intellectual capital available around the globe. In 1999, we will
move aggressively to broaden our definition of globalization by
increasing the intensity of our effort to search out and attract
the unlimited pool of talent that is available in the countries in
which we do business — from software designers in India to
product engineers in Mexico, Eastern Europe and China.
The GE of the next century must provide high-value
global products and services, designed by global talent,
for global markets.
Product services is a second continuing growth ini-
tiative. This initiative has already changed the headset of
the Company from that of a provider of products augmented
0
21
42
63
84
$105
Global 15% Average Annual Growth Rate
Domestic 6% Average Annual Growth Rate
Growth Through Globalization(In billions)
19971996199519911987 1998
T his performance, year after year, is the product of
a diverse and powerful portfolio of leading global
businesses. This performance has been driven this
decade by three big Company-wide growth initiatives:
Globalization, Services and Six Sigma quality.
These initiatives, in turn, have been rapidly advanced by
a General Electric culture that values the contributions of
every individual, thrives on learning, thirsts for the better idea,
and has the flexibility and speed to put the better idea into
action every day.
We are a learning company, a company that studies its
own successes and failures and those of others — a com-
pany that has the self-confidence and the resources to take
big swings and pursue numerous opportunities based on
winning ideas and insights, regardless of their source.
That appetite for learning, and the ability to act quickly
on that learning, will provide GE with what we believe is an
insurmountable and sustainable competitive advantage as
we pursue our three big growth initiatives.
Globalization is the first of those initiatives.
Last year we wrote to you as the difficulties in Asia were
causing global uncertainty and unease.
We, like everyone else, had not foreseen these difficulties,
but we quickly viewed Asia as similar in many respects to the
Europe of the early 1990s — in need of various structural
remedies but rich in opportunity. In the case of Europe — and
in the case of Mexico in the mid-’90s — we moved decisively
and were rewarded with significant and rapid growth. We
have grown fourfold in Europe, from a relatively small GE
presence in 1990 to $24 billion in revenues in 1998.
The GE of the next century must provide high-
value global products and services, designed
by global talent, for global markets.
We learned from our European successes and saw in
Japan the opportunity to do it again — only faster.
We acquired the business infrastructure and sales force
of Toho Mutual Life, and — because of the high respect the
Japanese have for Thomas Edison — we renamed it GE Edison
3
by ancillary services to a Company that is overwhelmingly
a source of customer-focused, high-value, information
technology-based productivity solutions — as well as a
provider of high-quality products.
With this initiative, as with globalization, we are broadening
our definition of services — from the traditional activities of
parts replacement, overhauling and reconditioning high-value
machines like jet engines, turbines, medical equipment
and locomotives, to a larger and bolder vision. We have the
engineering, the R&D, the product knowledge, the resources
and the management commitment to make the series of hun-
dred-million-dollar investments that will allow us to truly
change the performance of our installed base, and by doing
so upgrade the competitiveness and profitability of our cus-
tomers: utilities, hospitals, railroads, factories and airlines.
By adding higher and higher technology to the customers’
installed base of machines, we will have the capability of
returning them to operation not just “overhauled” but with
better fuel burn rates in engines, higher efficiency in turbines,
better resolutions in CT scanners, and the like.
The ability to go beyond “servicing” to, in essence,
“reengineering the installed base” will dramatically improve
our customers’ competitive positions.
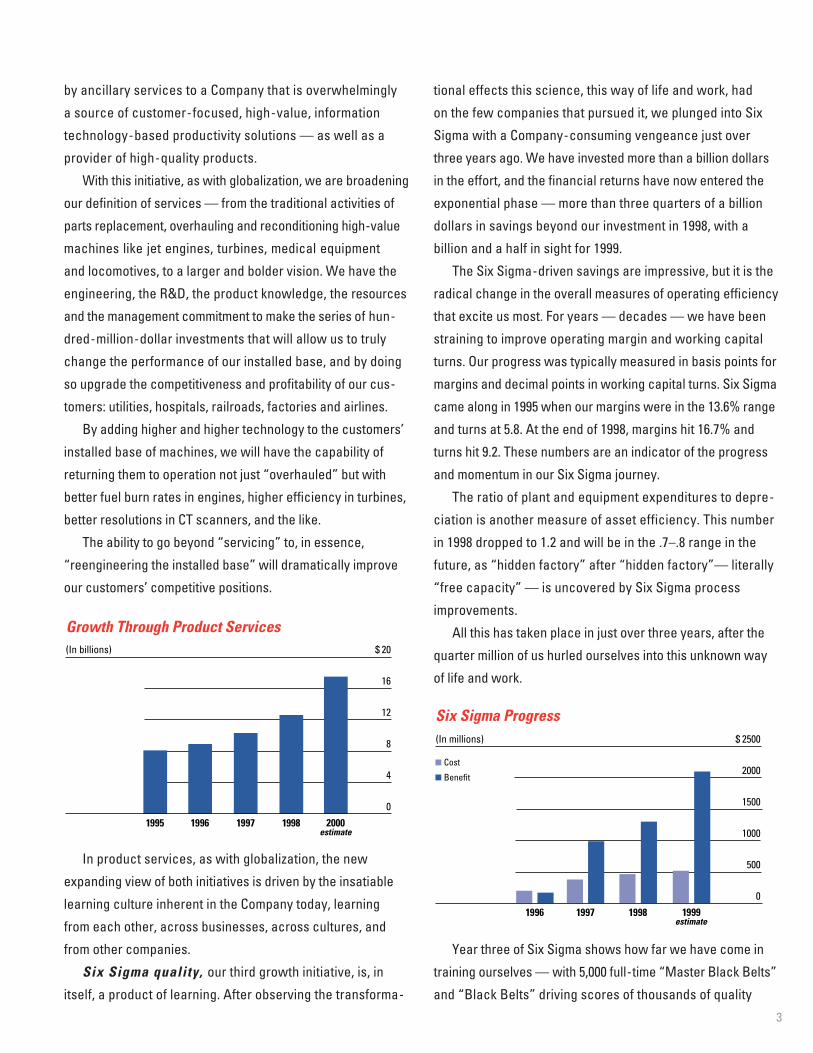
In product services, as with globalization, the new
expanding view of both initiatives is driven by the insatiable
learning culture inherent in the Company today, learning
from each other, across businesses, across cultures, and
from other companies.
Six Sigma quality, our third growth initiative, is, in
itself, a product of learning. After observing the transforma-
0
4
8
12
16
$ 20
Growth Through Product Services(In billions)
1998199719961995 2000estimate
tional effects this science, this way of life and work, had
on the few companies that pursued it, we plunged into Six
Sigma with a Company-consuming vengeance just over
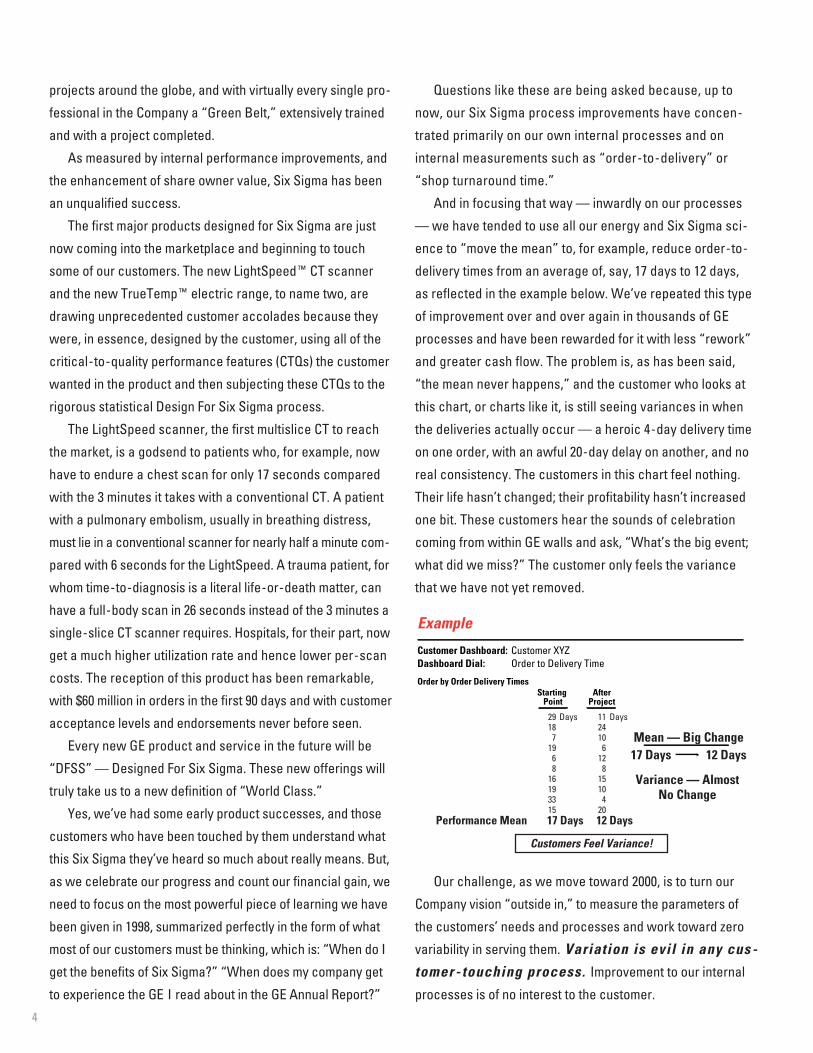
three years ago. We have invested more than a billion dollars
in the effort, and the financial returns have now entered the
exponential phase — more than three quarters of a billion
dollars in savings beyond our investment in 1998, with a
billion and a half in sight for 1999.
The Six Sigma-driven savings are impressive, but it is the
radical change in the overall measures of operating efficiency
that excite us most. For years — decades — we have been
straining to improve operating margin and working capital
turns. Our progress was typically measured in basis points for
margins and decimal points in working capital turns. Six Sigma
came along in 1995 when our margins were in the 13.6% range
and turns at 5.8. At the end of 1998, margins hit 16.7% and
turns hit 9.2. These numbers are an indicator of the progress
and momentum in our Six Sigma journey.
The ratio of plant and equipment expenditures to depre-
ciation is another measure of asset efficiency. This number
in 1998 dropped to 1.2 and will be in the .7–.8 range in the
future, as “hidden factory” after “hidden factory”— literally
“free capacity” — is uncovered by Six Sigma process
improvements.
All this has taken place in just over three years, after the
quarter million of us hurled ourselves into this unknown way
of life and work.
Year three of Six Sigma shows how far we have come in
training ourselves — with 5,000 full-time “Master Black Belts”
and “Black Belts” driving scores of thousands of quality
0
500
1000
1500
2000
$ 2500
Cost
Benefit
Six Sigma Progress
1999199819971996
(In millions)
estimate
4
projects around the globe, and with virtually every single pro-
fessional in the Company a “Green Belt,” extensively trained
and with a project completed.
As measured by internal performance improvements, and
the enhancement of share owner value, Six Sigma has been
an unqualified success.
The first major products designed for Six Sigma are just
now coming into the marketplace and beginning to touch
some of our customers. The new LightSpeed™ CT scanner
and the new TrueTemp™ electric range, to name two, are
drawing unprecedented customer accolades because they
were, in essence, designed by the customer, using all of the
critical-to-quality performance features (CTQs) the customer
wanted in the product and then subjecting these CTQs to the
rigorous statistical Design For Six Sigma process.
The LightSpeed scanner, the first multislice CT to reach
the market, is a godsend to patients who, for example, now
have to endure a chest scan for only 17 seconds compared
with the 3 minutes it takes with a conventional CT. A patient
with a pulmonary embolism, usually in breathing distress,
must lie in a conventional scanner for nearly half a minute com-
pared with 6 seconds for the LightSpeed. A trauma patient, for
whom time-to-diagnosis is a literal life-or-death matter, can
have a full-body scan in 26 seconds instead of the 3 minutes a
single-slice CT scanner requires. Hospitals, for their part, now
get a much higher utilization rate and hence lower per-scan
costs. The reception of this product has been remarkable,
with $60 million in orders in the first 90 days and with customer
acceptance levels and endorsements never before seen.
Every new GE product and service in the future will be
“DFSS” — Designed For Six Sigma. These new offerings will
truly take us to a new definition of “World Class.”
Yes, we’ve had some early product successes, and those
customers who have been touched by them understand what
this Six Sigma they’ve heard so much about really means. But,
as we celebrate our progress and count our financial gain, we
need to focus on the most powerful piece of learning we have
been given in 1998, summarized perfectly in the form of what
most of our customers must be thinking, which is: “When do I
get the benefits of Six Sigma?” “When does my company get
to experience the GE I read about in the GE Annual Report?”
Questions like these are being asked because, up to
now, our Six Sigma process improvements have concen-
trated primarily on our own internal processes and on
internal measurements such as “order-to-delivery” or
“shop turnaround time.”
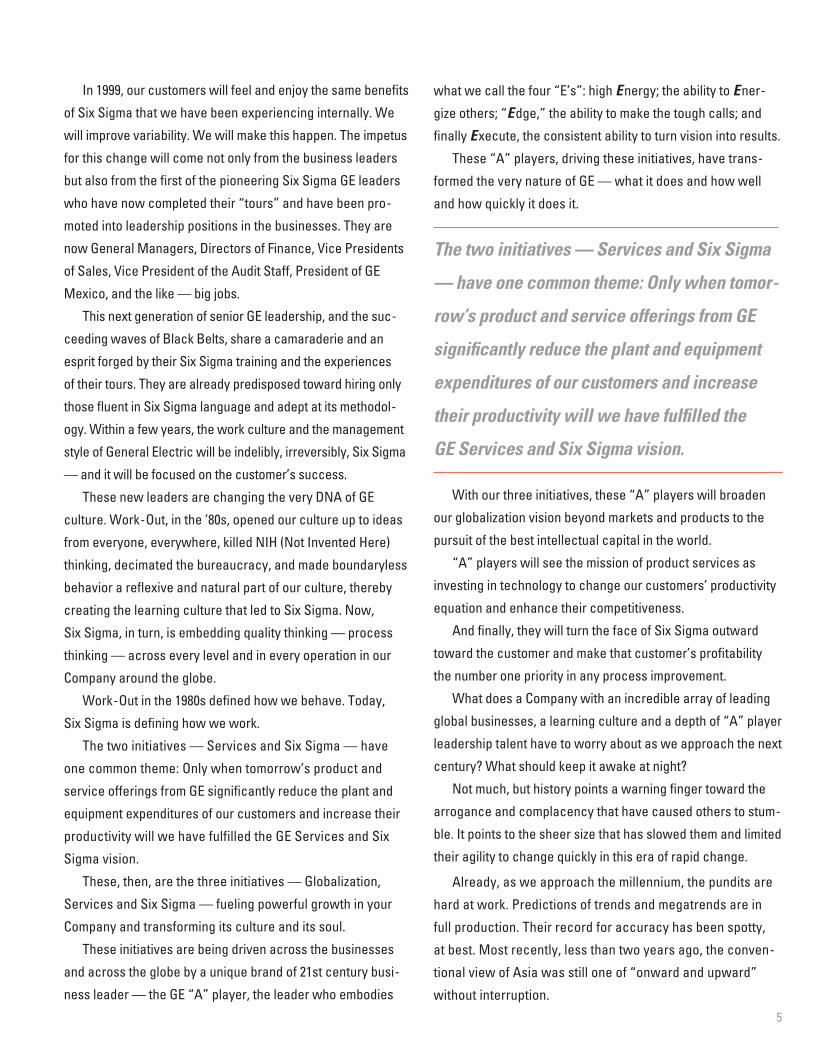
And in focusing that way — inwardly on our processes
— we have tended to use all our energy and Six Sigma sci-
ence to “move the mean” to, for example, reduce order-to-
delivery times from an average of, say, 17 days to 12 days,
as reflected in the example below. We’ve repeated this type
of improvement over and over again in thousands of GE
processes and have been rewarded for it with less “rework”
and greater cash flow. The problem is, as has been said,
“the mean never happens,” and the customer who looks at
this chart, or charts like it, is still seeing variances in when
the deliveries actually occur — a heroic 4-day delivery time
on one order, with an awful 20-day delay on another, and no
real consistency. The customers in this chart feel nothing.
Their life hasn’t changed; their profitability hasn’t increased
one bit. These customers hear the sounds of celebration
coming from within GE walls and ask, “What’s the big event;
what did we miss?” The customer only feels the variance
that we have not yet removed.
Our challenge, as we move toward 2000, is to turn our
Company vision “outside in,” to measure the parameters of
the customers’ needs and processes and work toward zero
variability in serving them. Variation is evil in any cus-
tomer-touching process. Improvement to our internal
processes is of no interest to the customer.
Example
Customer Dashboard: Customer XYZDashboard Dial: Order to Delivery Time
Order by Order Delivery Times
12 DaysPerformance Mean 17 Days
29187
1968
16193315
Days Days1124106
128
15104
20
Starting Point
AfterProject
Customers Feel Variance!
Mean — Big Change17 Days 12 Days
Variance — AlmostNo Change
5
what we call the four “E’s”: high Energy; the ability to Ener-
gize others; “Edge,” the ability to make the tough calls; and
finally Execute, the consistent ability to turn vision into results.
These “A” players, driving these initiatives, have trans-
formed the very nature of GE — what it does and how well
and how quickly it does it.
The two initiatives — Services and Six Sigma
— have one common theme: Only when tomor-
row’s product and service offerings from GE
significantly reduce the plant and equipment
expenditures of our customers and increase
their productivity will we have fulfilled the
GE Services and Six Sigma vision.
With our three initiatives, these “A” players will broaden
our globalization vision beyond markets and products to the
pursuit of the best intellectual capital in the world.
“A” players will see the mission of product services as
investing in technology to change our customers’ productivity
equation and enhance their competitiveness.
And finally, they will turn the face of Six Sigma outward
toward the customer and make that customer’s profitability
the number one priority in any process improvement.
What does a Company with an incredible array of leading
global businesses, a learning culture and a depth of “A” player
leadership talent have to worry about as we approach the next
century? What should keep it awake at night?
Not much, but history points a warning finger toward the
arrogance and complacency that have caused others to stum-
ble. It points to the sheer size that has slowed them and limited
their agility to change quickly in this era of rapid change.
Already, as we approach the millennium, the pundits are
hard at work. Predictions of trends and megatrends are in
full production. Their record for accuracy has been spotty,
at best. Most recently, less than two years ago, the conven-
tional view of Asia was still one of “onward and upward”
without interruption.
In 1999, our customers will feel and enjoy the same benefits
of Six Sigma that we have been experiencing internally. We
will improve variability. We will make this happen. The impetus
for this change will come not only from the business leaders
but also from the first of the pioneering Six Sigma GE leaders
who have now completed their “tours” and have been pro-
moted into leadership positions in the businesses. They are
now General Managers, Directors of Finance, Vice Presidents
of Sales, Vice President of the Audit Staff, President of GE
Mexico, and the like — big jobs.
This next generation of senior GE leadership, and the suc-
ceeding waves of Black Belts, share a camaraderie and an
esprit forged by their Six Sigma training and the experiences
of their tours. They are already predisposed toward hiring only
those fluent in Six Sigma language and adept at its methodol-
ogy. Within a few years, the work culture and the management
style of General Electric will be indelibly, irreversibly, Six Sigma
— and it will be focused on the customer’s success.
These new leaders are changing the very DNA of GE
culture. Work-Out, in the ’80s, opened our culture up to ideas
from everyone, everywhere, killed NIH (Not Invented Here)
thinking, decimated the bureaucracy, and made boundaryless
behavior a reflexive and natural part of our culture, thereby
creating the learning culture that led to Six Sigma. Now,
Six Sigma, in turn, is embedding quality thinking — process
thinking — across every level and in every operation in our
Company around the globe.
Work-Out in the 1980s defined how we behave. Today,
Six Sigma is defining how we work.
The two initiatives — Services and Six Sigma — have
one common theme: Only when tomorrow’s product and
service offerings from GE significantly reduce the plant and
equipment expenditures of our customers and increase their
productivity will we have fulfilled the GE Services and Six
Sigma vision.
These, then, are the three initiatives — Globalization,
Services and Six Sigma — fueling powerful growth in your
Company and transforming its culture and its soul.
These initiatives are being driven across the businesses
and across the globe by a unique brand of 21st century busi-
ness leader — the GE “A” player, the leader who embodies
6
Looking back much further, to 20 years ago, when a new
GE team moved into leadership, the prognostications were,
in many cases, spectacularly inaccurate.
n In 1980, with oil at $35 a barrel, the big questions were
when would it hit $100 or if it would be available at all.
n Japan in 1980 seemed to be in inexorable ascendancy,
invading and dominating complacent industry after industry.
Future American generations were doomed to menial work.
The U.S. was losing confidence, experiencing “malaise.”
n Twenty years ago, everything was predicated on the
expectation of a never-ending double-digit inflationary
environment.
Obviously, these trends did not play out — quite the reverse.
Oil is at record lows, Japan is struggling, and the U.S. has moved
from “malaise” to exuberance — irrational or not. Inflation has
yielded to deflation as the shaping economic force.
So what does this tell us about the future? It tells us that
what’s as important as predicting trends is a company’s
ability to cope with any trend.
Sure, early in the next century, Japan will rebound. Oil
prices are bound to rise again. Inflation is probably not dead.
But spending a lot of time putting too fine a point on the
“how” and “when” any of these might happen is less impor-
tant than growing a culture that is both challenged by the
unexpected and confident in, as well as capable of, dealing
with whatever comes along.
That’s why so much about leading a big company is about
assuring that it stays agile, unencumbered by bureaucracy or
lulled by complacency — keeping it a company that breathes
information, loves change and is excited by the opportunity
change presents. It means never allowing a company to take
itself too seriously, and reminding it constantly, in the face of
any praise or good press, that yesterday’s press clippings
often wrap today’s fish.
Crossing the $100 billion mark in revenue, as we did in 1998,
was a milestone, just as the $10 billion mark in earnings will be,
but that’s all they are — good for a quick pat on the back.
Yes, GE has become a very big company, and with the
growth initiatives we have under way, we have every inten-
tion of becoming a lot bigger.
So what does this tell us about the future?
It tells us that what’s as important as pre-
dicting trends is a company’s ability to
cope with any trend.
But bigger is only better if a company understands and is
committed to using the unique advantages of size.
As a big, global, multibusiness company, we have access to
an enormous amount of information — and with our learning
culture, we have the ability to acquire, share and act rapidly on
that information to turn it into marketplace advantage.
Size gives us another big advantage: our reach and
resources enable us to go to bat more frequently, to take
more swings, to experiment more, and, unlike a small com-
pany, we can miss on occasion and get to swing again.
What size cannot be allowed to do to a big company is to
let it fall to the temptation of “managing” its size rather than
“using” it. We can never stop swinging! At the same time,
we must always be striving to capture the best of a small
company — its energy, excitement and speed.
We move into 1999 filled with high expectations and with
the confidence that we have the right initiatives, the right
culture and the right leadership teams — teams with the
agility and speed to seize the big opportunities we know this
changing world will present us.
Thanks for your continuing support.
Eugene F. MurphyVice Chairman of the Boardand Executive Officer
John D. OpieVice Chairman of the Boardand Executive Officer
Dennis D. DammermanVice Chairman of the Boardand Executive Officer
John F. Welch, Jr.Chairman of the Board andChief Executive Officer
February 12, 1999

7
Developing a Better Silicone Judy Serth-Guzzo, a chemist at the Research and Devel-opment Center in Schenectady, New York,led a Six Sigma project that resulted in a newlow-cost, high-performance, heat-curedelastomer. This new silicone rubber, beingdeveloped for medical tubing and automotivegaskets, was designed to meet customerrequirements for hardness and ductility.
Engineering a Service Solution MannyMannava of GE Aircraft Engines readies afan blade for laser shock peening, a new GE process aimed at increasing the durabilityof aircraft engine components. Enhanceddurability translates into more time between scheduled inspections and off-wing service,reducing maintenance costs for GE customers.
Imaging Patients with LightSpeed DianeRadowski assembles a LightSpeed™ MatrixDetector, developed by a GE Medical Systemsteam using Six Sigma tools. The detector,which has 14,592 individual elements, makesmultislice scanning a reality, allowing thenew LightSpeed™ CT scanner to deliverfaster, more detailed images of the humanbody than ever before possible.
Improving Color Performance in LampsMark Duffy (left) and Lisa Ward of GE Lightingconduct a quality test on a ceramic arc tube,which delivers the improved color perform-ance and light output available in GE’s newConstantColor® CMH™ lamps. Six Sigmatools were used to develop the new lamps.
Designing a Better Disk Bruce Harper of GE Plastics examines new digital video disks(DVDs) made of Lexan® Optical Quality resin.GE technicians are working with equipmentmanufacturers and customers to developnew products for making DVDs, compactdisks and CD-ROMs.
By using Six Sigma tools and methodology, GE people are
bringing to market new innovations that are designed to meet
CTQs — the critical-to-quality needs of our customers.
GE Innovation
Designing a Better DiskImproving Color Performance in Lamps
Engineering a Service SolutionDeveloping a Better Silicone
Imaging Patients with LightSpeed
W. James McNerney, Jr.President and ChiefExecutive Officer,GE Aircraft Engines
GE AIRCRAFT ENGINES DELIVERED A STELLAR FINANCIAL PERFORM-ance in 1998, achieving strong double-digit gains in rev-enues and earnings while strengthening our overallindustry position and expanding our market share.
Our Six Sigma quality initiative is accelerating culturalchange throughout our operations and changing how weserve customers. More than 8,000 employees are trainedto lead Six Sigma projects; and working with co-workersand suppliers, they contributed more than $200 million in1998 financial benefits while speeding up and simplifyingprocesses most important to our customers. We areplacing even greater emphasis in 1999 on this highly successful initiative with our customers and suppliers.
Consistent with our industry leadership during the1990s, GE Aircraft Engines and CFM International, our50/50 joint company with Snecma of France, again wonthe majority of the world’s large commercial engineorders. Important 1998 airline orders included AmericanAirlines, Continental Airlines, Delta Air Lines, Iberia Air-lines, Korean Airlines, Lufthansa German Airlines, SabenaBelgian Airlines, Southwest Airlines and VARIG.
GE Engine Services, with 1998 revenues approaching $5 billion, continues to experience dramatic growth ascustomers increasingly outsource life-cycle engineeringand maintenance activities. Multiyear service contractswere established with Evergreen International Airlines,VARIG, Continental Airlines, America West Airlines andothers. To further our global reach, we created GE VARIG
Engine Services in Brazil, established a joint venturemaintenance agreement with EVA Airways and expandedour On-Wing Supportæ maintenance network into China.In addition, GE and Harris Corporation formed an innova-tive company, GE Harris Aviation Information Solutions, to give customers the ability to monitor and analyze datadirectly to and from aircraft on a real-time basis.
For the third consecutive year, CFM Internationalreceived orders for more than 1,000 engines for the best-selling CFM56 engine family. The new CFM56-7 engineentered revenue service on Boeing’s Next-Generation737 aircraft, for which more than 1,000 orders havealready been received. CFM also celebrated 10 years asthe most popular engine for Airbus Industrie’s A320 air-craft family. To ensure leadership into the 21st century,CFM launched Project TECH56, an ambitious technologyleadership initiative for CFM56 engines.
1998 was a significant delivery year for the GE90engine that powers the Boeing 777. The number of GE90engines in airline service not only doubled, but alsoexhibited industry-leading performance and reliability.Our CF6-80C2 engine, the most successful engine forwidebody commercial jets with more than 2,500 enginesin service, continued to capture significant new orders.
The CF34 engine family stands atop the fast-growingregional aircraft sector, powering more than 50% of the jets in this class. Our CF34 engines power the 50-passenger Canadair Regional Jet, and a higher-thrustmodel under development will exclusively power the 70-passenger Canadair Regional Jet Series 700 aircraftand Fairchild Aerospace’s new 728JET family.
In military programs, we delivered the first productionF414 fighter engine for the U.S. Navy’s top-priority F/A-18E/F Super Hornet. The team of GE, Allison and Rolls-Royce completed the Preliminary Design Review for thefour-year Alternate Engine Program contract on the U.S.Joint Strike Fighter. Technology development programsare enhancing higher-thrust versions of our best-sellingF110 fighter and T700 helicopter engines.
In marine engines, our reliable, environmentallyfriendly LM2500 model was selected for the world’s firstgas turbine-powered cruise ships being built for RoyalCaribbean International and Celebrity Cruises.
These successful actions in 1998, over a wide range of products and services, will support our continued suc-cess and growth well into the future.
8
ircraft EnginesA
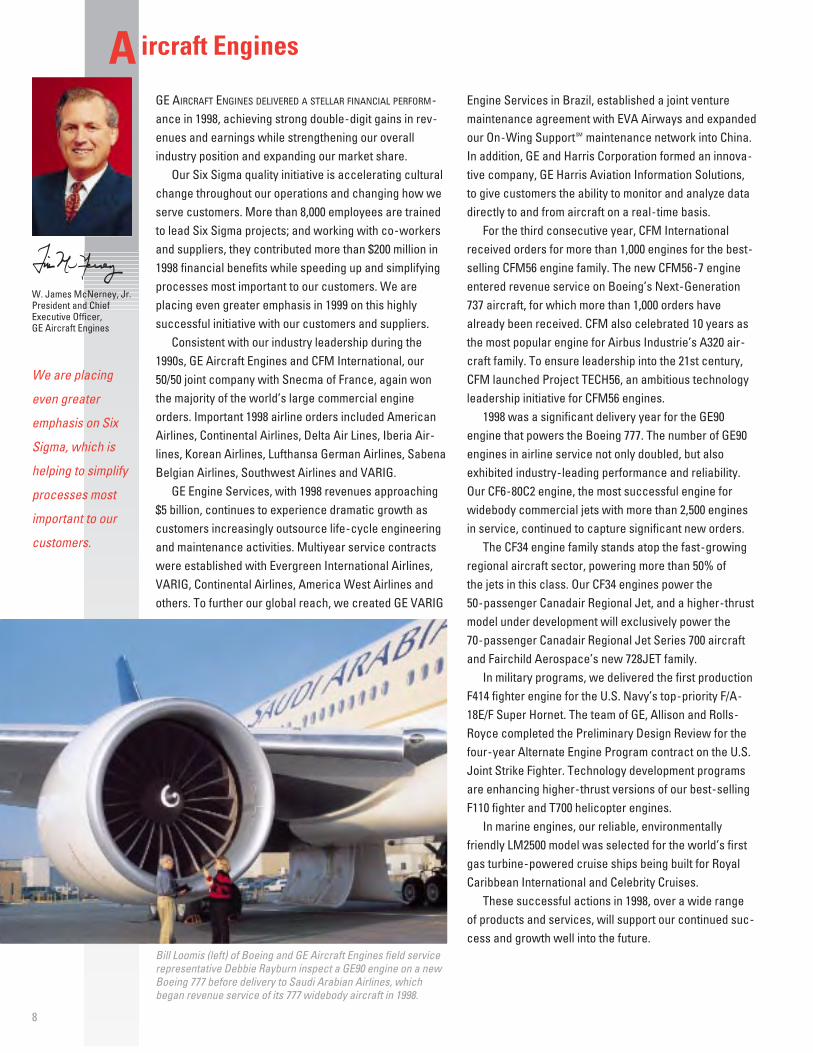
Bill Loomis (left) of Boeing and GE Aircraft Engines field servicerepresentative Debbie Rayburn inspect a GE90 engine on a newBoeing 777 before delivery to Saudi Arabian Airlines, whichbegan revenue service of its 777 widebody aircraft in 1998.
We are placing
even greater
emphasis on Six
Sigma, which is
helping to simplify
processes most
important to our
customers.
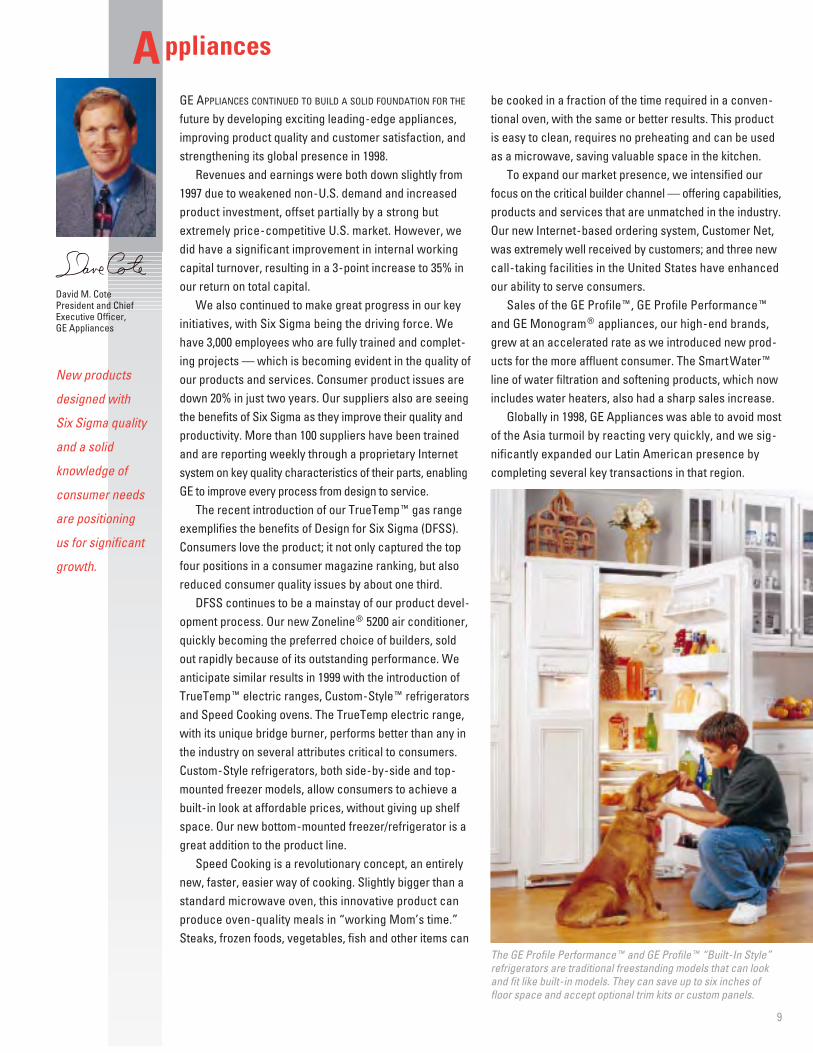
The GE Profile Performance™ and GE Profile™ “Built-In Style”refrigerators are traditional freestanding models that can lookand fit like built-in models. They can save up to six inches offloor space and accept optional trim kits or custom panels.
9
ppliancesAGE APPLIANCES CONTINUED TO BUILD A SOLID FOUNDATION FOR THE
future by developing exciting leading-edge appliances,improving product quality and customer satisfaction, andstrengthening its global presence in 1998.
Revenues and earnings were both down slightly from1997 due to weakened non-U.S. demand and increasedproduct investment, offset partially by a strong butextremely price-competitive U.S. market. However, wedid have a significant improvement in internal workingcapital turnover, resulting in a 3-point increase to 35% inour return on total capital.
We also continued to make great progress in our keyinitiatives, with Six Sigma being the driving force. Wehave 3,000 employees who are fully trained and complet-ing projects — which is becoming evident in the quality ofour products and services. Consumer product issues aredown 20% in just two years. Our suppliers also are seeingthe benefits of Six Sigma as they improve their quality andproductivity. More than 100 suppliers have been trained and are reporting weekly through a proprietary Internetsystem on key quality characteristics of their parts, enablingGE to improve every process from design to service.
The recent introduction of our TrueTemp™ gas rangeexemplifies the benefits of Design for Six Sigma (DFSS).Consumers love the product; it not only captured the topfour positions in a consumer magazine ranking, but alsoreduced consumer quality issues by about one third.
DFSS continues to be a mainstay of our product devel-opment process. Our new Zoneline® 5200 air conditioner,quickly becoming the preferred choice of builders, soldout rapidly because of its outstanding performance. Weanticipate similar results in 1999 with the introduction ofTrueTemp™ electric ranges, Custom-Style™ refrigeratorsand Speed Cooking ovens. The TrueTemp electric range,with its unique bridge burner, performs better than any inthe industry on several attributes critical to consumers.Custom-Style refrigerators, both side-by-side and top-mounted freezer models, allow consumers to achieve abuilt-in look at affordable prices, without giving up shelfspace. Our new bottom-mounted freezer/refrigerator is agreat addition to the product line.
Speed Cooking is a revolutionary concept, an entirelynew, faster, easier way of cooking. Slightly bigger than astandard microwave oven, this innovative product canproduce oven-quality meals in “working Mom’s time.”Steaks, frozen foods, vegetables, fish and other items can
be cooked in a fraction of the time required in a conven-tional oven, with the same or better results. This productis easy to clean, requires no preheating and can be usedas a microwave, saving valuable space in the kitchen.
To expand our market presence, we intensified ourfocus on the critical builder channel — offering capabilities,products and services that are unmatched in the industry.Our new Internet-based ordering system, Customer Net,was extremely well received by customers; and three newcall-taking facilities in the United States have enhancedour ability to serve consumers.
Sales of the GE Profile™, GE Profile Performance™and GE Monogram® appliances, our high-end brands,grew at an accelerated rate as we introduced new prod-ucts for the more affluent consumer. The SmartWater™line of water filtration and softening products, which nowincludes water heaters, also had a sharp sales increase.
Globally in 1998, GE Appliances was able to avoid mostof the Asia turmoil by reacting very quickly, and we sig-nificantly expanded our Latin American presence bycompleting several key transactions in that region.
New products
designed with
Six Sigma quality
and a solid
knowledge of
consumer needs
are positioning
us for significant
growth.
David M. CotePresident and ChiefExecutive Officer,GE Appliances

10
GE CAPITAL SERVICES GREW EARNINGS 17% IN 1998 — ANOTHER
record year in a long series of high double-digit earningsincreases. Assets broke the $300 billion mark for the firsttime, and for the first time as well, more than a third ofthose assets are now outside the United States.
GE Capital Services, like General Electric, is a widelydiverse array of global businesses, serving differentniches, each with its own risk and market characteristics.
Two ongoing GE initiatives have been embracedacross GE Capital during the past several years, and thefirst of these, globalization, has been a dominant factor in our continuing rapid growth.
In 1998, we continued to acquire valuable assets inEurope. We doubled our presence in Central Europe byacquiring Agrobanka — a Czech financial institution —and the Polish American Mortgage Bank. Other acquisi-tions included mobile accommodations and modular unitbusinesses in Germany, as well as equipment financingsubsidiaries, and Swiss consumer credit operations. GE Railcar Services doubled its European freight carcapacity with the purchase, in Great Britain, of Interna-tional Wagon Services. This acquisition helped propelRailcar into the ranks of the top 20 businesses that provide90% of the earnings of our parent, GE.
GE Capital businesses now account for 11 of those 20 global-leading businesses of General Electric, withEmployers Reinsurance, Commercial Equipment Financeand Global Consumer Finance among the top 10.
The unexpected turbulence in Japan that began twoyears ago raised the same flag of opportunity that flewover Europe in the early 1990s. A corps of GE Capital
business development people had been on the ground inJapan and were ready with acquisition recommendationsin 1998 and early 1999 — when the time came for bigmoves. The acquisitions of Koei Credit and the consumerfinance business of Lake Corporation quickly raised ourability to provide innovative financial services to theJapanese consumer. These followed the deal betweenGE Financial Assurance and Toho Mutual Life that producedwhat is now GE Edison Life — one of the fastest-growinglife insurers in Japan.
In early 1999, the largest of the deals done so far inJapan was announced as we moved quickly to buy theleasing businesses of Japan Leasing Corporation. Withnearly $7 billion of leasing assets, it is a very attractive,low-risk acquisition that will make GE Capital a majorplayer in the Japanese leasing market and will give usaccess to 71,000 new corporate clients.
Our plan for Japan is simple and clear: to use theexperience we gained in Europe, as well as in Japan, toestablish in three years what it took us six years to achievein Europe — a $500 million earnings stream from the$4 trillion Japanese economy, second largest in the world.
In 1999, the steady pace of acquisitions will continuein Asia and Europe, as well as in North America — whichsaw several key acquisitions in 1998 by our trailer leasingcompany, reinsurance business, commercial real estatebusiness and several other activities.
As we go forward with acquisitions, however, we willplace equal emphasis on organic growth. We will growby gaining share in our niches as well as by growing ourproductivity through backroom consolidation and the
apital ServicesC
Dennis D. DammermanChairman and ChiefExecutive Officer, General ElectricCapital Services, Inc.;and Vice Chairman andExecutive Officer, GeneralElectric Company
Denis J. NaydenPresident and Chief Executive Officer, GE Capital Corporation
Employers Reinsurance Corporation is expanding its thrust intothe Asia-Pacific region. ERC Australia is the largest provider ofreinsurance for the Sydney Opera House, a world-renownedlandmark managed by the New South Wales government.
Formed in 1998, GE Edison Life is among the fastest-growingJapanese life insurers. It has more than 500 offices and 6,000sales agents, such as Sayoko Kawasaki (above), serving bothcorporate and individual clients throughout Japan.
11
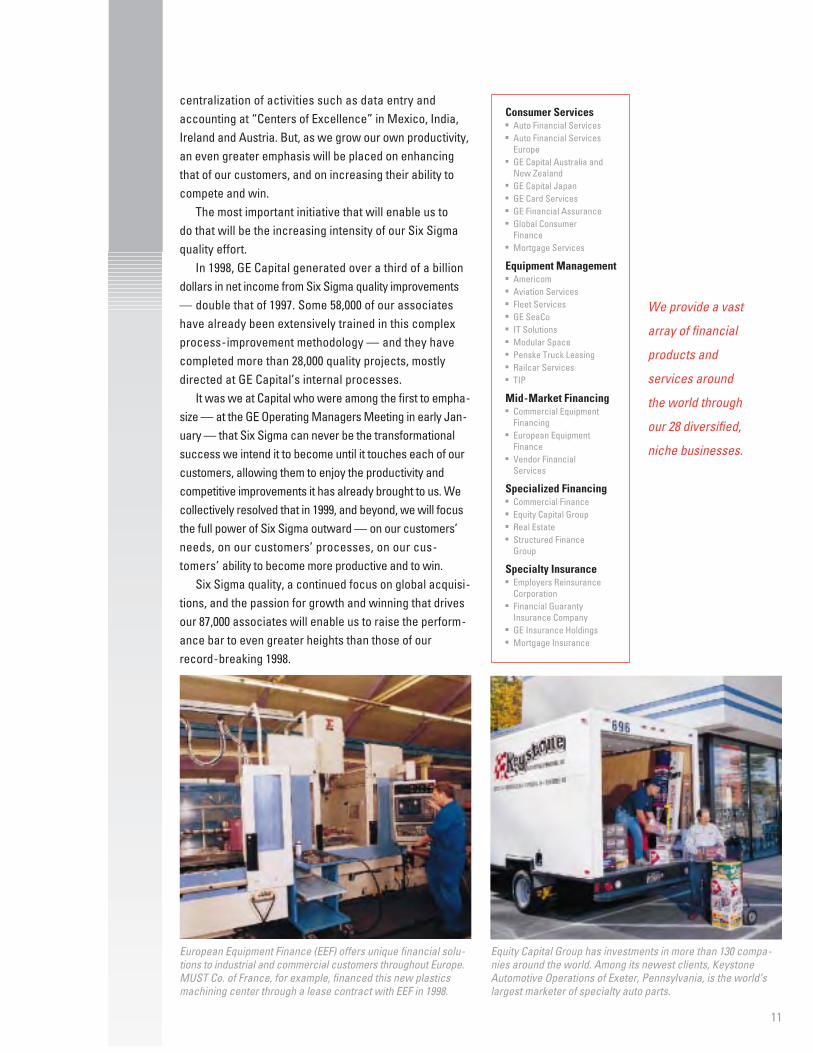
Equity Capital Group has investments in more than 130 compa-nies around the world. Among its newest clients, KeystoneAutomotive Operations of Exeter, Pennsylvania, is the world’slargest marketer of specialty auto parts.
European Equipment Finance (EEF) offers unique financial solu-tions to industrial and commercial customers throughout Europe.MUST Co. of France, for example, financed this new plasticsmachining center through a lease contract with EEF in 1998.
centralization of activities such as data entry andaccounting at “Centers of Excellence” in Mexico, India,Ireland and Austria. But, as we grow our own productivity,an even greater emphasis will be placed on enhancingthat of our customers, and on increasing their ability tocompete and win.
The most important initiative that will enable us to do that will be the increasing intensity of our Six Sigmaquality effort.
In 1998, GE Capital generated over a third of a billion dollars in net income from Six Sigma quality improvements— double that of 1997. Some 58,000 of our associateshave already been extensively trained in this complexprocess-improvement methodology — and they havecompleted more than 28,000 quality projects, mostlydirected at GE Capital’s internal processes.
It was we at Capital who were among the first to empha-size — at the GE Operating Managers Meeting in early Jan-uary — that Six Sigma can never be the transformationalsuccess we intend it to become until it touches each of ourcustomers, allowing them to enjoy the productivity andcompetitive improvements it has already brought to us. Wecollectively resolved that in 1999, and beyond, we will focusthe full power of Six Sigma outward — on our customers’needs, on our customers’ processes, on our cus-tomers’ ability to become more productive and to win.
Six Sigma quality, a continued focus on global acquisi-tions, and the passion for growth and winning that drivesour 87,000 associates will enable us to raise the perform-ance bar to even greater heights than those of ourrecord-breaking 1998.
Consumer Services▪ Auto Financial Services▪ Auto Financial Services
Europe▪ GE Capital Australia and
New Zealand▪ GE Capital Japan▪ GE Card Services▪ GE Financial Assurance▪ Global Consumer
Finance▪ Mortgage Services
Equipment Management▪ Americom▪ Aviation Services▪ Fleet Services▪ GE SeaCo▪ IT Solutions▪ Modular Space▪ Penske Truck Leasing▪ Railcar Services▪ TIP
Mid-Market Financing▪ Commercial Equipment
Financing▪ European Equipment
Finance▪ Vendor Financial
Services
Specialized Financing▪ Commercial Finance▪ Equity Capital Group▪ Real Estate▪ Structured Finance
Group
Specialty Insurance▪ Employers Reinsurance
Corporation▪ Financial Guaranty
Insurance Company▪ GE Insurance Holdings▪ Mortgage Insurance
We provide a vast
array of financial
products and
services around
the world through
our 28 diversified,
niche businesses.
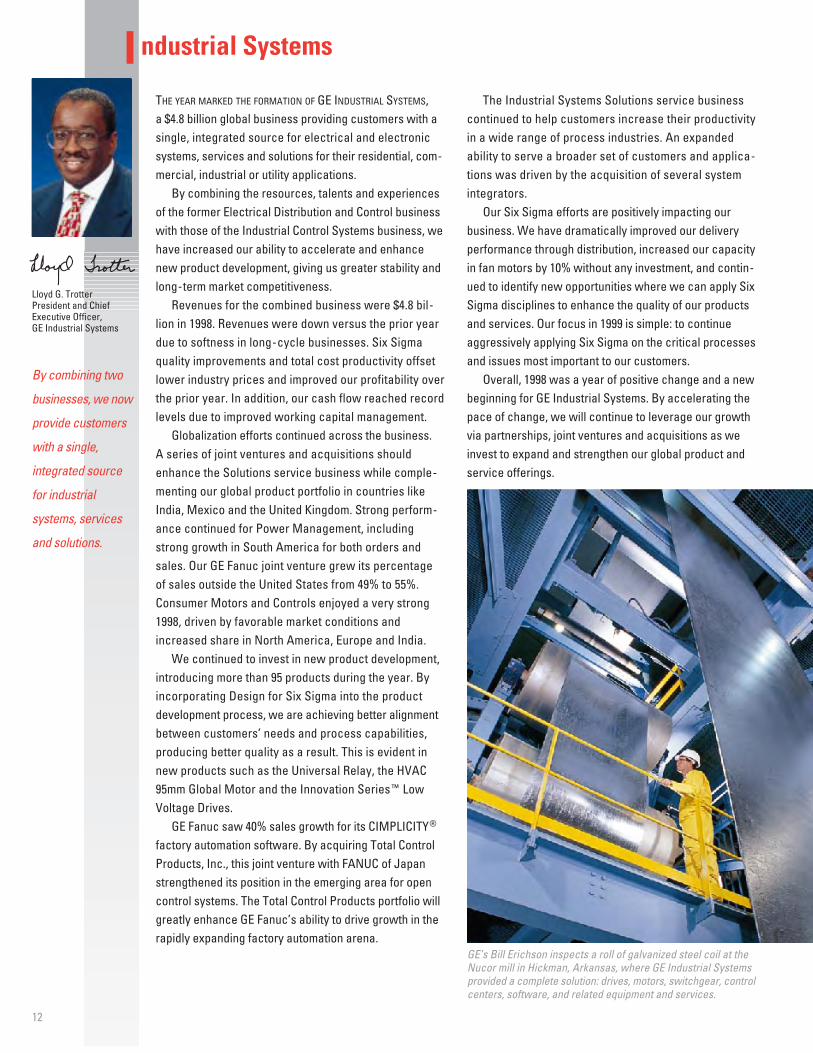
GE’s Bill Erichson inspects a roll of galvanized steel coil at theNucor mill in Hickman, Arkansas, where GE Industrial Systemsprovided a complete solution: drives, motors, switchgear, controlcenters, software, and related equipment and services.
12
ndustrial SystemsITHE YEAR MARKED THE FORMATION OF GE INDUSTRIAL SYSTEMS, a $4.8 billion global business providing customers with asingle, integrated source for electrical and electronicsystems, services and solutions for their residential, com-mercial, industrial or utility applications.
By combining the resources, talents and experiencesof the former Electrical Distribution and Control businesswith those of the Industrial Control Systems business, wehave increased our ability to accelerate and enhancenew product development, giving us greater stability andlong-term market competitiveness.
Revenues for the combined business were $4.8 bil-lion in 1998. Revenues were down versus the prior yeardue to softness in long-cycle businesses. Six Sigmaquality improvements and total cost productivity offsetlower industry prices and improved our profitability overthe prior year. In addition, our cash flow reached recordlevels due to improved working capital management.
Globalization efforts continued across the business. A series of joint ventures and acquisitions shouldenhance the Solutions service business while comple-menting our global product portfolio in countries likeIndia, Mexico and the United Kingdom. Strong perform-ance continued for Power Management, includingstrong growth in South America for both orders andsales. Our GE Fanuc joint venture grew its percentage of sales outside the United States from 49% to 55%.Consumer Motors and Controls enjoyed a very strong1998, driven by favorable market conditions andincreased share in North America, Europe and India.
We continued to invest in new product development,introducing more than 95 products during the year. Byincorporating Design for Six Sigma into the productdevelopment process, we are achieving better alignmentbetween customers’ needs and process capabilities,producing better quality as a result. This is evident innew products such as the Universal Relay, the HVAC95mm Global Motor and the Innovation Series™ LowVoltage Drives.
GE Fanuc saw 40% sales growth for its CIMPLICITY®factory automation software. By acquiring Total ControlProducts, Inc., this joint venture with FANUC of Japanstrengthened its position in the emerging area for opencontrol systems. The Total Control Products portfolio willgreatly enhance GE Fanuc’s ability to drive growth in therapidly expanding factory automation arena.
Lloyd G. TrotterPresident and ChiefExecutive Officer,GE Industrial Systems
By combining two
businesses, we now
provide customers
with a single,
integrated source
for industrial
systems, services
and solutions.
The Industrial Systems Solutions service businesscontinued to help customers increase their productivityin a wide range of process industries. An expandedability to serve a broader set of customers and applica-tions was driven by the acquisition of several systemintegrators.
Our Six Sigma efforts are positively impacting ourbusiness. We have dramatically improved our deliveryperformance through distribution, increased our capacityin fan motors by 10% without any investment, and contin-ued to identify new opportunities where we can apply SixSigma disciplines to enhance the quality of our productsand services. Our focus in 1999 is simple: to continueaggressively applying Six Sigma on the critical processesand issues most important to our customers.
Overall, 1998 was a year of positive change and a newbeginning for GE Industrial Systems. By accelerating thepace of change, we will continue to leverage our growthvia partnerships, joint ventures and acquisitions as weinvest to expand and strengthen our global product andservice offerings.
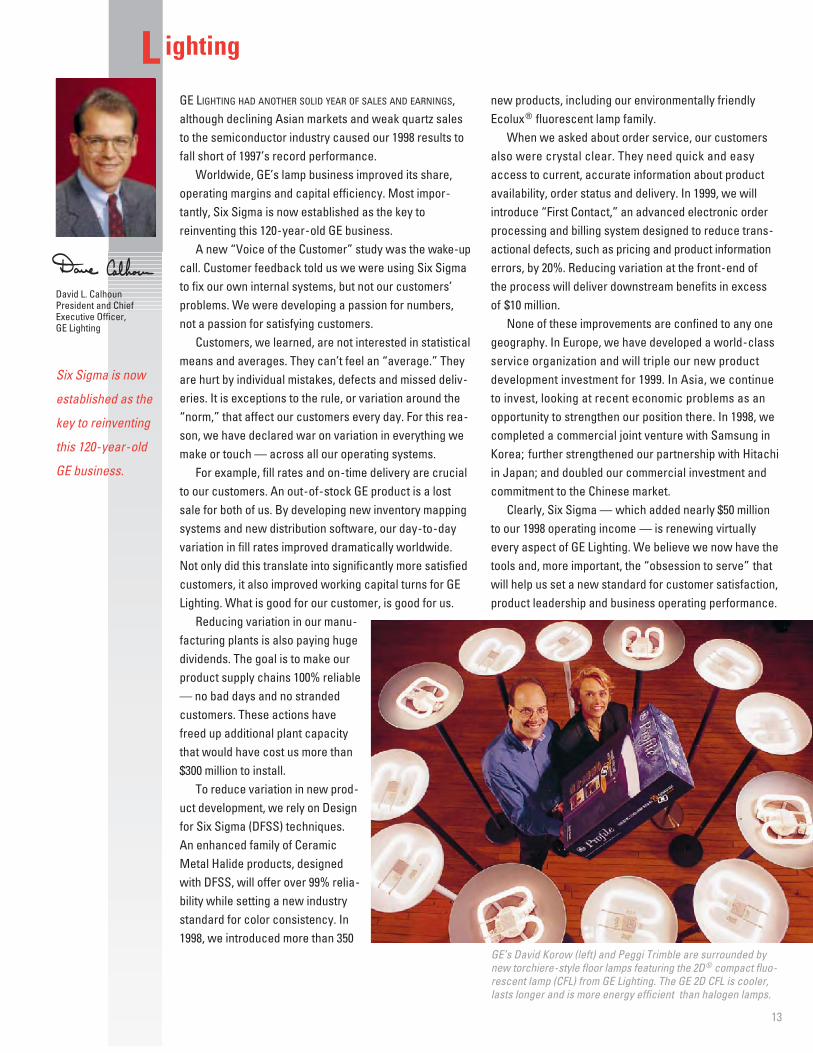
GE’s David Korow (left) and Peggi Trimble are surrounded bynew torchiere-style floor lamps featuring the 2D® compact fluo-rescent lamp (CFL) from GE Lighting. The GE 2D CFL is cooler,lasts longer and is more energy efficient than halogen lamps.
13
ightingLGE LIGHTING HAD ANOTHER SOLID YEAR OF SALES AND EARNINGS,although declining Asian markets and weak quartz salesto the semiconductor industry caused our 1998 results tofall short of 1997’s record performance.
Worldwide, GE’s lamp business improved its share,operating margins and capital efficiency. Most impor-tantly, Six Sigma is now established as the key to reinventing this 120-year-old GE business.
A new “Voice of the Customer” study was the wake-upcall. Customer feedback told us we were using Six Sigmato fix our own internal systems, but not our customers’problems. We were developing a passion for numbers,not a passion for satisfying customers.
Customers, we learned, are not interested in statisticalmeans and averages. They can’t feel an “average.” Theyare hurt by individual mistakes, defects and missed deliv-eries. It is exceptions to the rule, or variation around the“norm,” that affect our customers every day. For this rea-son, we have declared war on variation in everything wemake or touch — across all our operating systems.
For example, fill rates and on-time delivery are crucialto our customers. An out-of-stock GE product is a lostsale for both of us. By developing new inventory mappingsystems and new distribution software, our day-to-dayvariation in fill rates improved dramatically worldwide.Not only did this translate into significantly more satisfiedcustomers, it also improved working capital turns for GELighting. What is good for our customer, is good for us.
Reducing variation in our manu-facturing plants is also paying hugedividends. The goal is to make ourproduct supply chains 100% reliable— no bad days and no strandedcustomers. These actions havefreed up additional plant capacitythat would have cost us more than$300 million to install.
To reduce variation in new prod-uct development, we rely on Designfor Six Sigma (DFSS) techniques. An enhanced family of CeramicMetal Halide products, designedwith DFSS, will offer over 99% relia-bility while setting a new industrystandard for color consistency. In1998, we introduced more than 350
Six Sigma is now
established as the
key to reinventing
this 120-year-old
GE business.
David L. CalhounPresident and ChiefExecutive Officer, GE Lighting
new products, including our environmentally friendlyEcolux® fluorescent lamp family.
When we asked about order service, our customersalso were crystal clear. They need quick and easyaccess to current, accurate information about productavailability, order status and delivery. In 1999, we willintroduce “First Contact,” an advanced electronic orderprocessing and billing system designed to reduce trans-actional defects, such as pricing and product informationerrors, by 20%. Reducing variation at the front-end of the process will deliver downstream benefits in excess of $10 million.
None of these improvements are confined to any onegeography. In Europe, we have developed a world-classservice organization and will triple our new productdevelopment investment for 1999. In Asia, we continue to invest, looking at recent economic problems as anopportunity to strengthen our position there. In 1998, wecompleted a commercial joint venture with Samsung inKorea; further strengthened our partnership with Hitachiin Japan; and doubled our commercial investment andcommitment to the Chinese market.
Clearly, Six Sigma — which added nearly $50 millionto our 1998 operating income — is renewing virtuallyevery aspect of GE Lighting. We believe we now have thetools and, more important, the “obsession to serve” thatwill help us set a new standard for customer satisfaction,product leadership and business operating performance.
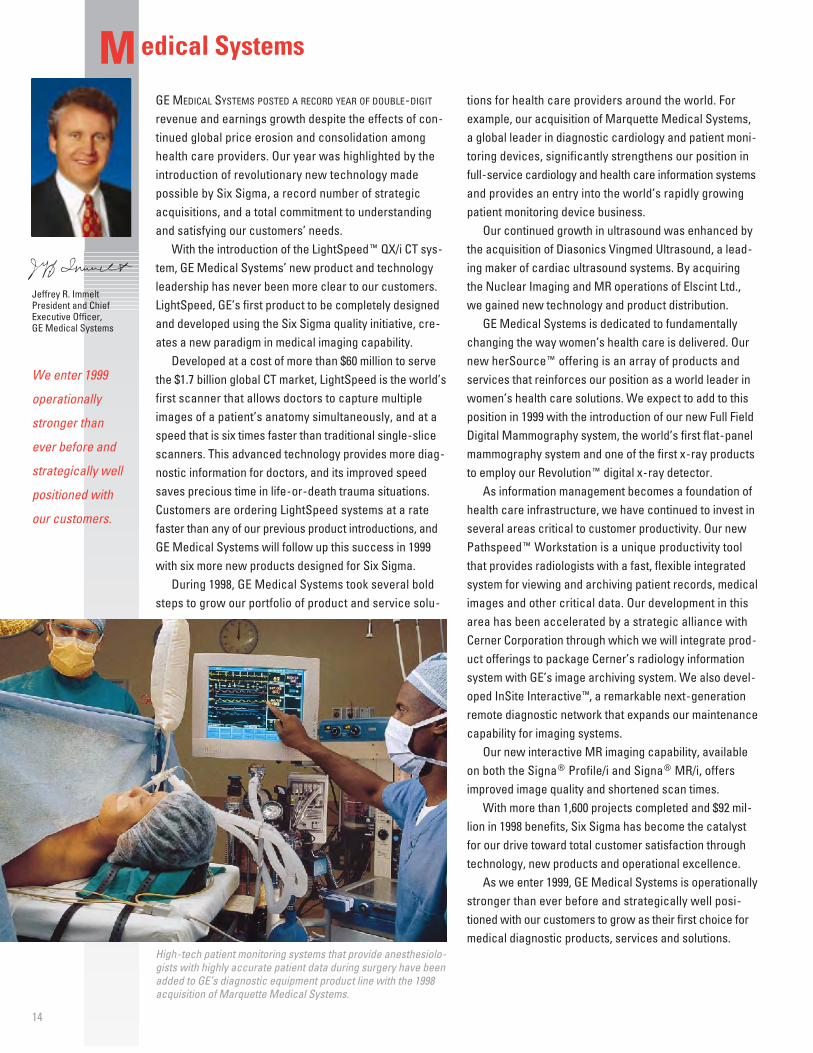
High-tech patient monitoring systems that provide anesthesiolo-gists with highly accurate patient data during surgery have beenadded to GE’s diagnostic equipment product line with the 1998acquisition of Marquette Medical Systems.
14
edical SystemsMGE MEDICAL SYSTEMS POSTED A RECORD YEAR OF DOUBLE-DIGIT
revenue and earnings growth despite the effects of con-tinued global price erosion and consolidation amonghealth care providers. Our year was highlighted by theintroduction of revolutionary new technology made possible by Six Sigma, a record number of strategicacquisitions, and a total commitment to understandingand satisfying our customers’ needs.
With the introduction of the LightSpeed™ QX/i CT sys-tem, GE Medical Systems’ new product and technologyleadership has never been more clear to our customers.LightSpeed, GE’s first product to be completely designedand developed using the Six Sigma quality initiative, cre-ates a new paradigm in medical imaging capability.
Developed at a cost of more than $60 million to servethe $1.7 billion global CT market, LightSpeed is the world’sfirst scanner that allows doctors to capture multipleimages of a patient’s anatomy simultaneously, and at aspeed that is six times faster than traditional single-slicescanners. This advanced technology provides more diag-nostic information for doctors, and its improved speedsaves precious time in life-or-death trauma situations.Customers are ordering LightSpeed systems at a ratefaster than any of our previous product introductions, andGE Medical Systems will follow up this success in 1999with six more new products designed for Six Sigma.
During 1998, GE Medical Systems took several boldsteps to grow our portfolio of product and service solu-
tions for health care providers around the world. Forexample, our acquisition of Marquette Medical Systems,a global leader in diagnostic cardiology and patient moni-toring devices, significantly strengthens our position infull-service cardiology and health care information systemsand provides an entry into the world’s rapidly growingpatient monitoring device business.
Our continued growth in ultrasound was enhanced bythe acquisition of Diasonics Vingmed Ultrasound, a lead-ing maker of cardiac ultrasound systems. By acquiringthe Nuclear Imaging and MR operations of Elscint Ltd.,we gained new technology and product distribution.
GE Medical Systems is dedicated to fundamentallychanging the way women’s health care is delivered. Ournew herSource™ offering is an array of products andservices that reinforces our position as a world leader inwomen’s health care solutions. We expect to add to thisposition in 1999 with the introduction of our new Full FieldDigital Mammography system, the world’s first flat-panelmammography system and one of the first x-ray productsto employ our Revolution™ digital x-ray detector.
As information management becomes a foundation ofhealth care infrastructure, we have continued to invest inseveral areas critical to customer productivity. Our newPathspeed™ Workstation is a unique productivity toolthat provides radiologists with a fast, flexible integratedsystem for viewing and archiving patient records, medicalimages and other critical data. Our development in thisarea has been accelerated by a strategic alliance withCerner Corporation through which we will integrate prod-uct offerings to package Cerner’s radiology informationsystem with GE’s image archiving system. We also devel-oped InSite Interactive™, a remarkable next-generationremote diagnostic network that expands our maintenancecapability for imaging systems.
Our new interactive MR imaging capability, availableon both the Signa® Profile/i and Signa® MR/i, offersimproved image quality and shortened scan times.
With more than 1,600 projects completed and $92 mil-lion in 1998 benefits, Six Sigma has become the catalystfor our drive toward total customer satisfaction throughtechnology, new products and operational excellence.
As we enter 1999, GE Medical Systems is operationallystronger than ever before and strategically well posi-tioned with our customers to grow as their first choice formedical diagnostic products, services and solutions.
Jeffrey R. ImmeltPresident and ChiefExecutive Officer,GE Medical Systems
We enter 1999
operationally
stronger than
ever before and
strategically well
positioned with
our customers.
15
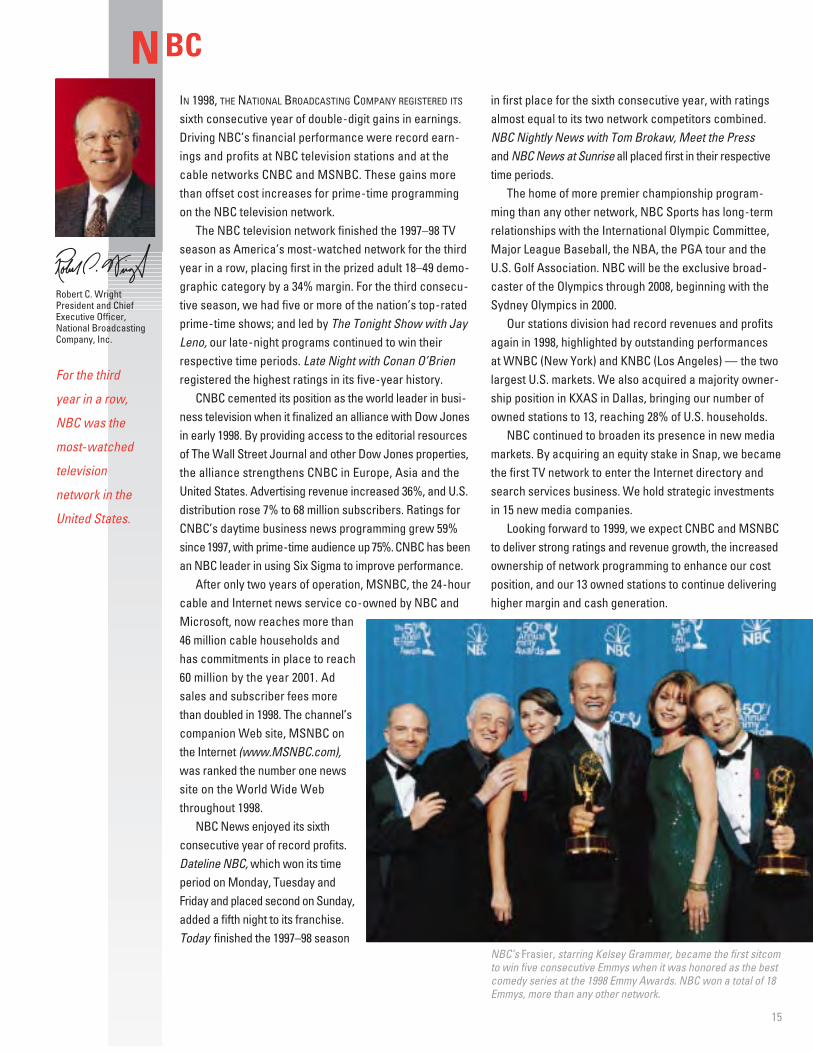
NBC’s Frasier, starring Kelsey Grammer, became the first sitcomto win five consecutive Emmys when it was honored as the bestcomedy series at the 1998 Emmy Awards. NBC won a total of 18Emmys, more than any other network.
BCNIN 1998, THE NATIONAL BROADCASTING COMPANY REGISTERED ITS
sixth consecutive year of double-digit gains in earnings.Driving NBC’s financial performance were record earn-ings and profits at NBC television stations and at thecable networks CNBC and MSNBC. These gains morethan offset cost increases for prime-time programmingon the NBC television network.
The NBC television network finished the 1997–98 TVseason as America’s most-watched network for the thirdyear in a row, placing first in the prized adult 18–49 demo-graphic category by a 34% margin. For the third consecu-tive season, we had five or more of the nation’s top-ratedprime-time shows; and led by The Tonight Show with JayLeno, our late-night programs continued to win theirrespective time periods. Late Night with Conan O’Brienregistered the highest ratings in its five-year history.
CNBC cemented its position as the world leader in busi-ness television when it finalized an alliance with Dow Jonesin early 1998. By providing access to the editorial resourcesof The Wall Street Journal and other Dow Jones properties,the alliance strengthens CNBC in Europe, Asia and theUnited States. Advertising revenue increased 36%, and U.S.distribution rose 7% to 68 million subscribers. Ratings forCNBC’s daytime business news programming grew 59%since1997, with prime-time audience up75%.CNBC has beenan NBC leader in using Six Sigma to improve performance.
After only two years of operation, MSNBC, the 24-hourcable and Internet news service co-owned by NBC andMicrosoft, now reaches more than46 million cable households andhas commitments in place to reach60 million by the year 2001. Adsales and subscriber fees morethan doubled in 1998. The channel’scompanion Web site, MSNBC onthe Internet (www.MSNBC.com),was ranked the number one newssite on the World Wide Webthroughout 1998.
NBC News enjoyed its sixth consecutive year of record profits.Dateline NBC, which won its timeperiod on Monday, Tuesday and Friday and placed second on Sunday,added a fifth night to its franchise.Today finished the 1997–98 season
For the third
year in a row,
NBC was the
most-watched
television
network in the
United States.
Robert C. WrightPresident and Chief Executive Officer,National BroadcastingCompany, Inc.
in first place for the sixth consecutive year, with ratingsalmost equal to its two network competitors combined. NBC Nightly News with Tom Brokaw, Meet the Press and NBC News at Sunrise all placed first in their respective time periods.
The home of more premier championship program-ming than any other network, NBC Sports has long-termrelationships with the International Olympic Committee,Major League Baseball, the NBA, the PGA tour and theU.S. Golf Association. NBC will be the exclusive broad-caster of the Olympics through 2008, beginning with theSydney Olympics in 2000.
Our stations division had record revenues and profitsagain in 1998, highlighted by outstanding performances at WNBC (New York) and KNBC (Los Angeles) — the twolargest U.S. markets. We also acquired a majority owner-ship position in KXAS in Dallas, bringing our number ofowned stations to 13, reaching 28% of U.S. households.
NBC continued to broaden its presence in new mediamarkets. By acquiring an equity stake in Snap, we becamethe first TV network to enter the Internet directory andsearch services business. We hold strategic investmentsin 15 new media companies.
Looking forward to 1999, we expect CNBC and MSNBCto deliver strong ratings and revenue growth, the increasedownership of network programming to enhance our costposition, and our 13 owned stations to continue deliveringhigher margin and cash generation.
Our investment in polycarbonate capacity is driven bythe prospects for new and exciting uses for our Lexanresin and continued growth in key applications.
The market for polycarbonate optical storage media,including CD-ROMs, digital video disks, video game disksand writeable computer disks, is an important area for usand is growing at about 15% a year. In addition, polycar-bonate demand continues to grow for applications incomputer housings and automotive components.
Exatec, our joint venture with Bayer to develop polycar-bonate automotive glazing technology and manufacturingsystems, has established facilities at Wixom, Michigan,and Cologne, Germany, to pursue this high-potential usefor our materials.
Our other joint venture with Bayer, called GE-BayerSilicones Europe, was consummated in mid-1998 andgreatly strengthens our position in the European region.
A breakthrough application for GE Plastics during1998 was the Smart™ car. Produced by Micro CompactCar AG in Europe, it is the first vehicle featuring all-plastic,vertical body panels that utilize fully colored plastics.This application, made from our Xenoy® resin, has won industry awards for innovation. Other engineering materials continue to grow as well, including our Cycoloy®resin, which is finding greater use in housings for com-puters, cellular phones, pagers and personal digitalappliances.
Also during 1998, we continued our global expansionwith acquisitions in Mexico for Polymerland, our plasticsdistribution business; in India for our Structured Productsbusiness; and in Argentina for our resins business.
Excellence in environmental and safety management,as always, is a key focus of our business. We arestrengthening the close partnership we have with ourcommunities and are communicating our capabilities insafety and environmental stewardship in anticipation ofnew U.S. regulations requiring publication of risk man-agement programs.
We are well positioned for another great year in 1999.Our efforts in Six Sigma quality will have a greater focuson customers and will help fuel growth in key globalindustries such as computers, communication systemsand automobiles. We will also continue to focus on man-ufacturing capacity and productivity to help ensure ourenergetic entry into the 21st century.
Julian Veagel of GE Plastics has a bird’s-eye view of the newLexan® polycarbonate plant in Cartagena, Spain. A secondplant, announced in 1998, will double polycarbonate capacity at Cartagena to 260,000 metric tons annually.
16
lasticsPGE PLASTICS ACHIEVED RECORD EARNINGS OF $1.6 BILLION IN 1998,a 6% increase over 1997, while revenues of $6.6 billionwere about even with the previous year. During 1998, wewere able to overcome pressure on selling prices andweakness in Asian demand for silicones and industrialdiamonds with lower raw material costs and continuingproductivity gains. In addition, our cash flow of $950 mil-lion was much higher than in 1997.
Six Sigma was again a bright spot for GE Plastics, with total benefits increasing to $188 million in 1998.About 90% of exempt employees are now schooled in Six Sigma as a result of our continuing efforts in qualitytraining. During 1998, we completed specific quality projects with more than 200 customers; and Six Sigmahas had a positive effect on our new product develop-ments, with more than 90% of new materials exhibitingextremely high quality levels.
We continue to invest in manufacturing capacity tomeet the future materials needs of our customers. Plansfor a second 130,000-metric-ton polycarbonate plant atCartagena, Spain, were announced in 1998. The Carta-gena site will supply polycarbonate resin to GE Plasticscustomers worldwide. Construction on the first plant iscomplete and production commenced in the first quarterof 1999. The investment announced in 1998 will bring totalLexan® polycarbonate capacity of the Cartagena site to260,000 metric tons annually by the year 2002.
Gary L. RogersPresident and ChiefExecutive Officer,GE Plastics
Our Six Sigma
efforts have had
a tremendous
positive effect
on new product
development.
significant inroads in the NAFTA region. S&S EnergyProducts and GE Industrial Aeroderivatives combinedforces to win the first order, from Royal Caribbean Inter-national and Celebrity Cruises, for the packaging andservicing of environmentally friendly LM2500 gas turbinesfor the cruise ship industry.
In the area of Six Sigma quality, we achieved morethan $235 million in savings from more than 8,100 projects,both of which were up more than 150% from 1997.
We also completed the first full-speed, no-load test of the H System™ combined-cycle power block. This sys-tem will be the first gas turbine to break the 60% thermalefficiency barrier when it enters commercial operationearly in the next century.
In 1999, we will apply Six Sigma discipline to meet theunprecendented demand for our gas turbines, and we will continue to expand into new segments of the energymarket through technology development, joint venturesand acquisitions. As a result, half of our 1999 revenuesare expected to come from products and services thatwere not part of our portfolio four years ago.
17
ower SystemsPAN UNPRECEDENTED DEMAND FOR POWER GENERATION EQUIPMENT
in the United States drove record orders of $10.5 billionfor GE Power Systems in 1998. These orders reflect nearly150% growth in gas turbine combined-cycle units over1997 and a 65% GE win rate. Revenues of $8.5 billion alsowere at record levels, as were earnings of $1.3 billion.
The majority of orders were for “F” series advancedtechnology gas turbines, bringing the total installed,ordered or committed units to more than 300 — twice theadvanced technology units of all competitors combinedand affirming GE’s continued leadership in gas turbinetechnology and customer satisfaction.
We continued expanding our portfolio of products,services and capabilities, investing more than $1.5 billionin joint ventures, acquisitions and technology to fuelgrowth in high-tech services, information technology,distributed power and new energy services. We completedthe acquisition of the gas turbine division of Stewart &Stevenson, adding turnkey packaging capability foraeroderivative gas turbines. Our GE Harris Energy Con-trol Systems joint venture acquired ASCADA, a worldleader in power system management, monitoring andcontrol systems.
We also entered into an agreement with Elliott EnergySystems to distribute microturbines and, in early 1999,completed a joint venture with Plug Power to market fuelcells. Both agreements expand our capabilities to providelow-cost, leading-edge technology alternatives for smallblocks of power.
With new unit sales presenting significant serviceopportunities, we took major steps to grow the scale andscope of our service business. We consolidated all serv-ices components into GE Energy Services and announcedseveral information technology-based service solutions.To improve global customer access, a new customersupport center operates 7 days a week, 24 hours a day,with multiple-language capability. In addition, we shiftedsignificant resources to services sales and technologyand business development.
Revenues from contractual services — power plantoperation and maintenance and long-term service agree-ments — increased 85%. To strengthen our focus onindustrial customers, we combined Nuovo Pignone, S&SEnergy Products and GE Industrial Aeroderivatives intothe Industrial Products group. Nuovo Pignone’s ordersexceeded $2 billion as it expanded its focus and made
An upsurge in
power plant
orders and new
service opportu-
nities is fueling
our growth into
the next century.
Robert L. NardelliPresident and ChiefExecutive Officer,GE Power Systems
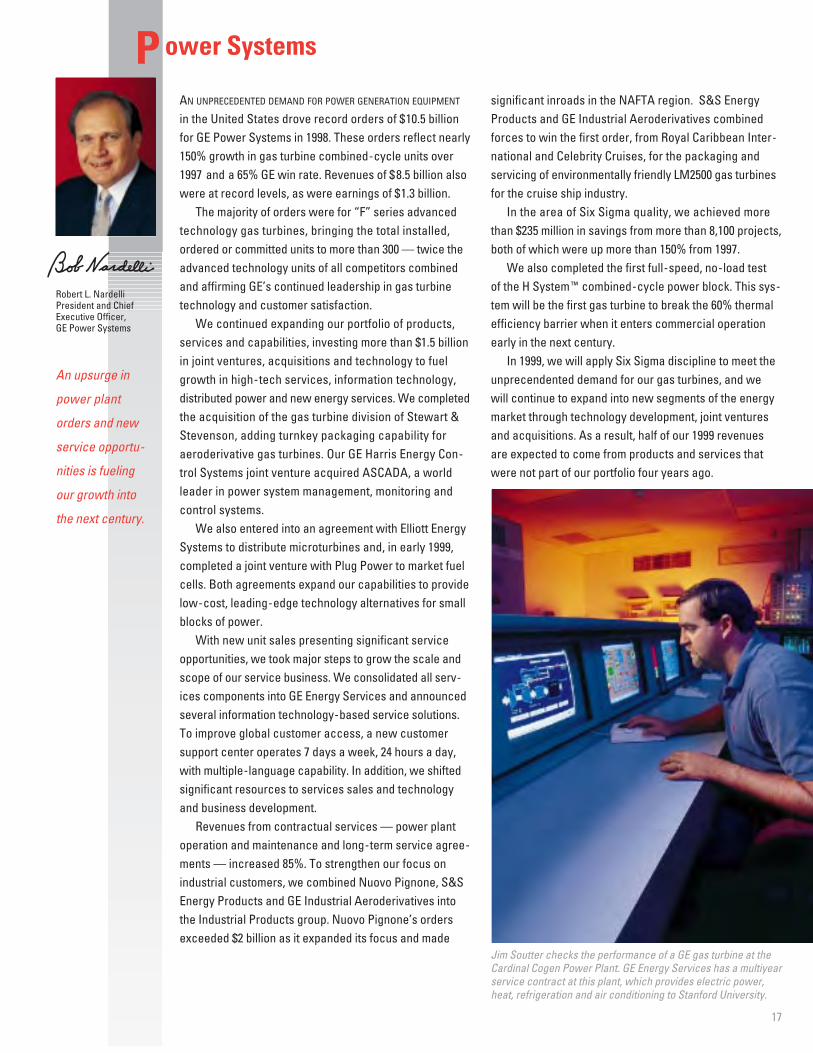
Jim Soutter checks the performance of a GE gas turbine at theCardinal Cogen Power Plant. GE Energy Services has a multiyearservice contract at this plant, which provides electric power,heat, refrigeration and air conditioning to Stanford University.

18
ransportation SystemsT
Our business
heads into 1999
with a record
order backlog
and major growth
in services.
GE Transportation Systems completely rebuilt this servicefacility in San Luis Potosí, Mexico, to service locomotives forTFM under a 20-year contract with the privatized Mexican rail-road. GE also delivered 50 new locomotives to TFM in 1998.
John G. RicePresident and ChiefExecutive Officer, GE Transportation Systems
Helping the Visually Impaired John Melink (front)and Jack Simpson are among more than 100 GEElfun retirees in Cincinnati, Ohio, who have repairednearly 22,000 Talking Book machines for the visuallyimpaired since setting up shop in 1989. Elfun is aworldwide organization of GE volunteers.
Preparing Students for College As part of aCollege Bound program, Patricia Perry (left) of GEFinancial Assurance took students Gilbert Carterand Nitisha Coward of J.F. Kennedy High School inRichmond to see the Aluminaut deep-diving subma-rine at the Science Museum of Virginia. The GEFund made a $1 million, five-year grant to double the number of Kennedy students going to college.
Bringing Sesame Street to China GE providedmost of the funding for “Zhima Jie,” a Chinese adaptation of Sesame Street that began airing inChina during 1998. The educational TV program,designed to prepare young children for school, was developed by a team of Chinese educators and professionals to reflect Chinese culture.
Preserving Edison’s Archives Plans to restore theEdison National Historic Site in West Orange, NewJersey, received a $5 million boost from GE in 1998.The Edison site contains thousands of artifacts anddocuments from the work of Thomas Alva Edison,the world’s most prolific inventor and the father ofGeneral Electric.
Planting Trees at a Homeless Shelter GE Plasticsemployees, friends and community volunteers joinedtogether in sprucing up the exterior as well as theinterior of a Red Cross homeless shelter in Pittsfield,Massachusetts. Here, Brock Williamson (left) andBob Sauve (right) help a volunteer landscape archi-tect plant a tree outside the facility, which handles500 to 600 people a year. The renovation projectinvolved more than 180 community volunteers.
Tutoring at a Distance GE volunteers are involvedin a Campus Compact-Elfun-GE Fund partnershipthat links students from North Carolina Central University and elementary schools in the Raleigh/Durham area through the “Tutoring at a Distance”program. Senior Elfun Alan Stirling, who started theprogram aimed at increasing literacy via computers,is shown here with Brandon Benjamin (left) andNicole Forte.
Going to the Zoo As part of their annual meeting,GE Elfuns from around the world joined other GEvolunteers at the Beardsley Zoo in Bridgeport, Connecticut, for a one-day service project in whichthey enlarged and enhanced the river otter exhibitand created a special garden with a gazebo,benches, pathways and 1,300 new plants.
Community Service
GE TRANSPORTATION SYSTEMS HAS COMPLETED FIVE CONSECUTIVE
years of record locomotive and parts shipments andheads into 1999 with a record order backlog. Our busi-ness delivered double-digit growth in cash, earnings andoperating margin in 1998.
The largest follow-on order in our history came fromBNSF, bringing to 637 locomotives the total to be deliv-ered to BNSF through 1999. These locomotives will becovered by a long-term service contract, raising total GEunits under service worldwide to more than 2,700. Newservice contracts in Canada and Mexico accompanieddelivery of more than 175 units to these trading partners.Mexico continues to provide opportunities for 1999.
Following startup testing on the AC6000™ locomotive,we delivered almost 50 of the more than 190 units onorder, with the first to be shipped outside the UnitedStates going to BHP Iron Ore in Australia.
Sales at GE-Harris Railway Electronics nearly doubledfrom 1997. GE-Harris continues to develop and delivernew products and systems that will generate savings forour customers into the next century.
Continued growth in electric wheels for off-highwaytrucks was bolstered by our largest single order ever, for160 wheel systems from Coal India.
With new products, another record order book and agrowing service backlog, the challenge for 1999 will be tooptimize use of Six Sigma tools to deliver the next level oflocomotive performance and reliability to our customers.

Preparing Students for College
Going to the Zoo
Planting Trees at a Homeless ShelterPreserving Edison’s Archives
Helping the Visually Impaired
Bringing Sesame Street to China
Tutoring at a Distance
GE volunteers, GE businesses and the GE Fund are helping to make the world
a better place every day — through such diverse activities as mentoring
young students, building or repairing important facilities, creating innovative
programs or helping the less advantaged.
oard of Directors (As of February 12, 1999)B
20
THE BOARD OF DIRECTORS WAS SADDENED BY THE DEATH IN 1998 OF D. WAYNE CALLOWAY, A GEDirector since 1991. Mr. Calloway had been the Chairman and Chief Executive Officerof PepsiCo, Inc., before his retirement in 1996. Mr. Calloway had keen insight into busi-ness and people. He was a quiet person of measured phrase, but when he spoke, hehad a great impact on the Board. His wisdom and friendship will be deeply missed.
Andrea Jung was named to the Board in 1998. Ms. Jung is President and ChiefOperating Officer of Avon Products, Inc., where she has operating responsibility forall of Avon’s global business units and also directs its global marketing and researchand development efforts.
Kenneth G. Langone was named to the Board in 1999. Mr. Langone is Chairman,President and Chief Executive Officer of Invemed Associates, Inc., an investmentbanking and brokerage firm that he founded.
Director Paolo Fresco retired from his position as Vice Chairman and ExecutiveOfficer of General Electric, which he had held since 1992, on November 1, 1998, tobecome Chairman of Fiat SpA of Italy. He will remain a GE Director.
Mr. Fresco has been a tireless advocate of globalization and of transformingGeneral Electric into a company with “global brains.” Those brains, in the form of anincreasingly globalized culture, and the enormous growth the Company enjoys fromits thriving global operations, are the enduring legacies of his 36 years of active serv-ice with General Electric.
The GE Board held eight meetings during 1998. At the December meeting, the Directors voted to increase GE’s quarterly dividend
by 17%, from 30¢ to 35¢ per share, marking the 23rd consecutive year of GE dividendincreases. The Board also announced that GE’s current share repurchase authoriza-tion will remain at $17 billion, which will allow the buyback program to continuethrough the year 2000 at about $2 billion annually.
Board committees addressed a variety of matters during 1998.The Audit Committee, which consists entirely of outside Directors, held four meet-
ings. It reviewed the activities and independence of GE’s independent auditors andthe activities of GE’s internal audit staff. It also reviewed the Company’s financialreporting process, internal financial controls and compliance with key GE policiesand applicable laws.
The Finance Committee, in four meetings, reviewed GE’s pension trust and retire-ment plans, foreign exchange exposure, airline industry financing and other mattersinvolving major uses of GE funds.
The Management Development and Compensation Committee, which consistsentirely of outside Directors, held 10 meetings. Its activities included all executivecompensation plans, policies and practices, all changes in executive assignmentsand responsibilities, and succession plans for key positions.
The Nominating Committee, at its three meetings, reviewed candidates for theBoard and recommended the structure and membership of Board committees for the ensuing year.
The Operations Committee, in four meetings, reviewed the Company’s operatingplan and various operational matters.
The Public Responsibilities Committee, in two meetings, evaluated environmentaland other public responsibility issues as well as activities of the GE Fund.
The Technology and Science Committee participated in one meeting at which itreviewed the GE Energy Services business.
Audit CommitteeGertrude G. Michelson, ChairmanSilas S. CathcartRoger S. PenskeFrank H.T. RhodesAndrew C. Sigler
Finance CommitteeClaudio X. Gonzalez, ChairmanJohn F. Welch, Jr., Vice ChairmanRoger S. PenskeFrank H.T. RhodesDouglas A. Warner III
Management Development and Compensation CommitteeSilas S. Cathcart, ChairmanClaudio X. GonzalezGertrude G. MichelsonFrank H.T. RhodesAndrew C. Sigler
Nominating CommitteeAndrew C. Sigler, ChairmanSilas S. CathcartGertrude G. MichelsonRoger S. PenskeDouglas A. Warner III
Operations CommitteeRoger S. Penske, ChairmanJames I. Cash, Jr.Silas S. CathcartDennis D. DammermanPaolo FrescoClaudio X. GonzalezAndrea JungKenneth G. LangoneEugene F. MurphySam NunnJohn D. OpieAndrew C. SiglerDouglas A. Warner III
Public Responsibilities CommitteeSam Nunn, ChairmanJohn F. Welch, Jr., Vice ChairmanJames I. Cash, Jr.Dennis D. DammermanClaudio X. GonzalezAndrea JungKenneth G. LangoneGertrude G. MichelsonEugene F. MurphyJohn D. OpieRoger S. PenskeAndrew C. SiglerDouglas A. Warner III
Technology and Science CommitteeFrank H.T. Rhodes, ChairmanJames I. Cash, Jr.Paolo FrescoEugene F. MurphyJohn D. OpieRoger S. Penske

2121
Kenneth G. LangoneChairman, President andChief Executive Officer,Invemed Associates, Inc.,investment banking and brokerage, New York, N.Y. Director since 1999.
Eugene F. MurphyVice Chairman of the Boardand Executive Officer, General Electric Company.Director since 1997.
John D. OpieVice Chairman of the Boardand Executive Officer, General Electric Company.Director since 1995.
Paolo FrescoChairman of the Board, Fiat SpA, automotive andindustrial products, Turin,Italy. Director since 1990.
Claudio X. GonzalezChairman of the Board andChief Executive Officer, Kimberly-Clark de Mexico,S.A. de C.V., Mexico City,and Director, Kimberly-ClarkCorporation, consumer andpaper products. Directorsince 1993.
James I. Cash, Jr.James E. Robison Professorof Business Administration,Harvard Graduate School of Business, Cambridge,Mass. Director since 1997.
Silas S. CathcartRetired Chairman of theBoard and Chief ExecutiveOfficer, Illinois Tool Works,Inc., diversified products,Chicago, Ill. Director 1972–1987 and since 1990.
Andrea JungPresident and Chief Operating Officer andDirector, Avon Products,Inc., cosmetics, New York,N.Y. Director since 1998.
Roger S. PenskeChairman of the Board,Penske Corporation, PenskeMotorsports, Inc., DetroitDiesel Corporation and Penske Truck Leasing Corporation, transportation and automotive services,Detroit, Mich. Director since 1994.
Frank H.T. RhodesPresident Emeritus, CornellUniversity, Ithaca, N.Y. Director since 1984.
Andrew C. SiglerRetired Chairman of theBoard and Chief ExecutiveOfficer, Champion Interna-tional Corporation, paper andforest products, Stamford,Conn. Director since 1984.
Douglas A. Warner IIIChairman of the Board, ChiefExecutive Officer and Presi-dent, J.P. Morgan & Co. Inc.and Morgan Guaranty TrustCompany, New York, N.Y.Director since 1992.
Dennis D. DammermanVice Chairman of the Boardand Executive Officer, General Electric Company;and Chairman and ChiefExecutive Officer, GeneralElectric Capital Services,Inc. Director since 1994.
John F. Welch, Jr.Chairman of the Board andChief Executive Officer, General Electric Company. Director since 1980.
Gertrude G. MichelsonFormer Senior Vice Presi-dent – External Affairs and former Director, R.H.Macy & Co., Inc., retailers,New York, N.Y. Directorsince 1976.
Sam NunnFormer U.S. Senator from the State of Georgia and Partner, King & Spalding, law firm, Atlanta, Ga. Director since 1997.

22
Philip D. AmeenVice President and Comptroller
Charlene BegleyVice President, Audit Staff
James R. BuntVice President and Treasurer
Alberto F. CerrutiVice President, Mergers and Acquisitions and International Finance
Beth ComstockVice President, Public Relations
Pamela DaleyVice President and Senior Counsel, Transactions
Brackett B. Denniston IIIVice President and Senior Counsel, Litigation and Legal Policy
R. Michael GadbawVice President and Senior Counsel, International Law and Policy
Joyce HergenhanVice President; President, GE Fund
Steven KerrVice President, Leadership Development
John H. MyersChairman and President, GE Investment Corporation
Robert W. NelsonVice President, Financial Planning and Analysis
Charles E. OkoskyVice President, Executive Development
Stephen D. RamseyVice President, Environmental Programs
John M. SamuelsVice President and Senior Counsel, Taxes
Ronald A. SternVice President and Senior Counsel, Antitrust
Piet C. van AbeelenVice President, Six Sigma Quality
Susan M. WalterVice President, Government Relations
Senior Executive Officers
Senior Corporate Officers Corporate Staff Officers
anagement (As of February 12, 1999)M
John D. OpieVice Chairman of the Board and Executive Officer
Dennis D. DammermanVice Chairman of the Board and Executive Officer
Eugene F. MurphyVice Chairman of the Board and Executive Officer
John F. Welch, Jr.Chairman of the Board and Chief Executive Officer
Lewis S. EdelheitSenior Vice President,Research and Development
William J. ConatySenior Vice President,Human Resources
Göran S. MalmSenior Vice Presidentand President, GE Asia–Pacific
Benjamin W.Heineman,Jr.Senior Vice President, General Counsel and Secretary
Keith S. SherinSenior Vice President,Finance, and Chief FinancialOfficer
Gary M. ReinerSenior Vice Presidentand Chief InformationOfficer

23
W. James McNerney, Jr.President and Chief Executive Officer, GE Aircraft Engines
Corbett D. CaudillVice President, Engineering
Charles L. ChadwellVice President, Commercial Enginesand Service
Marc A. ChiniVice President, Human Resources
Herbert D. DeppVice President, Marketing and Sales
John J. FalconiVice President, Finance and Information Technology
Dennis R. LittleVice President, Military Engines
David L. Lloyd, Jr.Vice President and General Counsel
George R. OliverVice President, Production and Procurement
William J. VareschiVice President, Engine Services
Jeffrey S. BornsteinVice President, Finance
Russell F. SparksVice President, Product Management
Theodore R. TorbeckVice President, Operations
Aircraft Engines Capital Services
Appliances
David M. CotePresident and Chief Executive Officer, GE Appliances
Brian P. KelleyVice President, Sales and Distribution
Jeffrey MoodyVice President, Marketing
Happy R. PerkinsGeneral Counsel and Vice President,Public Affairs
Susan P. PetersVice President, Human Resources
Paul A. RaymontVice President, Technology
Stephen J. SeditaVice President, Finance
Richard F. SegaliniVice President, Sourcing and Manufacturing
Denis J. NaydenPresident and Chief Executive Officer,GE Capital Corporation
Nigel D.T. AndrewsExecutive Vice President, GE Capital
Robert W. SpeetzenPresident and Chief Executive Officer, GE Capital Railcar Services
James A. ColicaSenior Vice President, Global Risk Management
Sandra L. DericksonPresident, GE Capital Auto FinancialServices
Henry A. HubschmanPresident, GE Capital Aviation Services
Robert L. LewisPresident, Structured Finance Group
Thomas H. MannPresident and Chief Executive Officer,GE Capital Mortgage Corporation
James E. MohnPresident and Chief Executive Officer,Information Technology Solutions
Michael A. NealExecutive Vice President, GE Capital
Stephen M. BennettVice President, Vendor FinancialServices
Michael A. GaudinoVice President, CommercialFinance
Christopher H. RichmondVice President, Commercial Equipment Financing
David R. NissenPresident and Chief Executive Officer,Global Consumer Finance
Daniel W. PorterManaging Director, GE Capital Europe
Ronald R. PressmanPresident, GE Capital Real EstateFinancing
Edward D. StewartExecutive Vice President, GE Capital
Kaj AhlmannChairman, President and Chief Executive Officer, Employers Reinsurance Corporation
Robert J. DellingerExecutive Vice President and Chief Financial Officer
Nancy E. BartonSenior Vice President, General Counseland Secretary
Michael D. FraizerPresident and Chief Executive Officer,GE Financial Assurance
James A. ParkeSenior Vice President, Finance
Richard D’AvinoVice President and Senior Tax Counsel
Jeffrey S. WernerSenior Vice President, CorporateTreasury and Global Funding
Lawrence J. TooleSenior Vice President, HumanResources
perating Management (As of February 12, 1999)O
Dennis D. DammermanChairman and Chief Executive Officer,General Electric Capital Services, Inc.;and Vice Chairman and Executive Officer,General Electric Company
Industrial Systems
Lloyd G. TrotterPresident and Chief Executive Officer, GE Industrial Systems
Joaquim AgutPresident and Chief Executive Officer, GE Power Controls B.V.
M. Roger GasawayVice President, Manufacturing
Joseph M. HoganPresident and Chief Executive Officer, GE Fanuc Automation North America, Inc.
Richard L. PeaseVice President, Industrial SystemsSolutions
J. Jeffrey SchaperVice President, Sales
Robert D. SloanVice President and General Counsel
24
Jeffrey R. ImmeltPresident and Chief Executive Officer, GE Medical Systems
Scott C. DonnellyVice President, Global Technology
Patrick DupuisVice President, Finance and FinancialServices
Yoshiaki FujimoriPresident and Chief Executive Officer,GE Medical Systems Asia Ltd.; andChairman and Chief Executive Officer,GE Yokogawa Medical Systems
Lawrence R. JohnstonPresident and Chief Executive Officer,GE Medical Systems Europe
Paul J. MirabellaVice President, Americas
James G. Del MauroVice President, Corporate Accounts
Thomas E. DunhamVice President, Americas Service
J. Keith MorganVice President and General Counsel
Marc A. OnettoVice President, Manufacturing
Marc J. SapersteinVice President, Human Resources
Robert L. NardelliPresident and Chief Executive Officer, GE Power Systems
Ricardo ArtigasVice President, GE Energy Services
Ernest H. GaultVice President, Global ServicesOperations
Ellen S. SmithVice President, Sales
Francis S. BlakeVice President, Business Development
Stephen B. BransfieldVice President, Power Generation Production
Jon A. EbacherVice President, Power GenerationTechnology
Elizabeth K. LanierVice President and General Counsel
Mark M. LittleVice President, Global Power Plants
John C. LoomisVice President, Human Resources
Thomas P. SaddlemireVice President, Finance
Steven R. SpeckerVice President, Nuclear Energy
Richard R. StewartPresident, S&S Energy Products
Dennis K. WilliamsPresident and Chief Executive Officer,Nuovo Pignone
Pier Luigi FerraraDeputy Chief Executive, NuovoPignone
Delbert L. WilliamsonPresident, Global Sales
William G. WertVice President, Global Sales
Operating Management (Continued)
Plastics
Gary L. RogersPresident and Chief Executive Officer, GE Plastics
Ferdinando F. BeccalliVice President, GE Plastics–Americas
Charles E. Crew, Jr.Vice President, Sales
Matthew J. EspePresident and Representative Director,GE Plastics–Pacific
Craig ArnoldPresident, GE Plastics–China
Arthur H. HarperVice President, Global Manufacturing
Jean M. HeuschenVice President, Worldwide Technology
James W. Ireland IIIVice President, Finance
Paul F. McBrideVice President, GE Silicones
Robert E. Muir, Jr.Vice President, Human Resources
Peter Y. SolmssenVice President and General Counsel
Uwe S. WascherSenior Managing Director, GE Plastics–Europe
William A. WoodburnVice President, GE Superabrasives
Power Systems Information Services
Gary M. ReinerChairman, GE Information Services; and Senior Vice President and Chief Information Officer, General Electric Company
Harvey F. SeegersPresident and Chief Executive Officer,GE Information Services
Licensing/Trading
Stuart A. FisherPresident and Chief Executive Officer, GE and RCA Licensing ManagementOperation, Inc. and GE Trading Company
Marketing and Sales
Thomas E. CooperVice President, Washington Operations
Albert J. FebboVice President, GE Automotive and Corporate Marketing
Transportation Systems
John G. RicePresident and Chief Executive Officer, GE Transportation Systems
Medical Systems
NBC
Robert C. WrightPresident and Chief Executive Officer,National Broadcasting Company, Inc.
Mark W. BegorExecutive Vice President and Chief Financial Officer
William BolsterPresident, CNBC
Richard CottonExecutive Vice President and GeneralCounsel
Dick EbersolChairman, Sports and Olympics
John EckPresident, Broadcast and Network Operations
Randel FalcoPresident, Television Network
Andrew R. LackPresident, News
Donald W. Ohlmeyer, Jr.President, NBC–West Coast
Thomas S. RogersPresident, NBC Cable and BusinessDevelopment
Scott M. SassaPresident, Entertainment
Edward L. ScanlonExecutive Vice President, Employee Relations
Patrick T. WallacePresident, Television Stations
Lighting
David L. CalhounPresident and Chief Executive Officer, GE Lighting
William F. BanholzerVice President, Technology
Paul T. BossidyVice President, North America
Joseph S. BarrancoVice President, Production
David J. FeldmanVice President, Sales
Kirk S. HachigianVice President, Asia–Pacific
Richard M. Jackson, Jr.Vice President and General Counsel
Robert L. LlamasVice President, Human Resources
David L. PawlPresident, GE Quartz, Inc.
Robert H. SwanVice President, Finance
Mike S. ZafirovskiPresident and Chief Executive Officer,GE Lighting Europe
Stanley F. DavisVice President, Sales
International
Scott R. BaymanPresident and Chief Executive Officer, GE India
Jay F. LapinPresident and Chief Executive Officer, GE Japan
John T. McCarterPresident and Chief Executive Officer, GE Latin America
Alistair C. StewartPresident, GE Middle East, Africa, Central and Eastern Europe
GE Supply
William L. MeddaughPresident and Chief Executive Officer, GE Supply
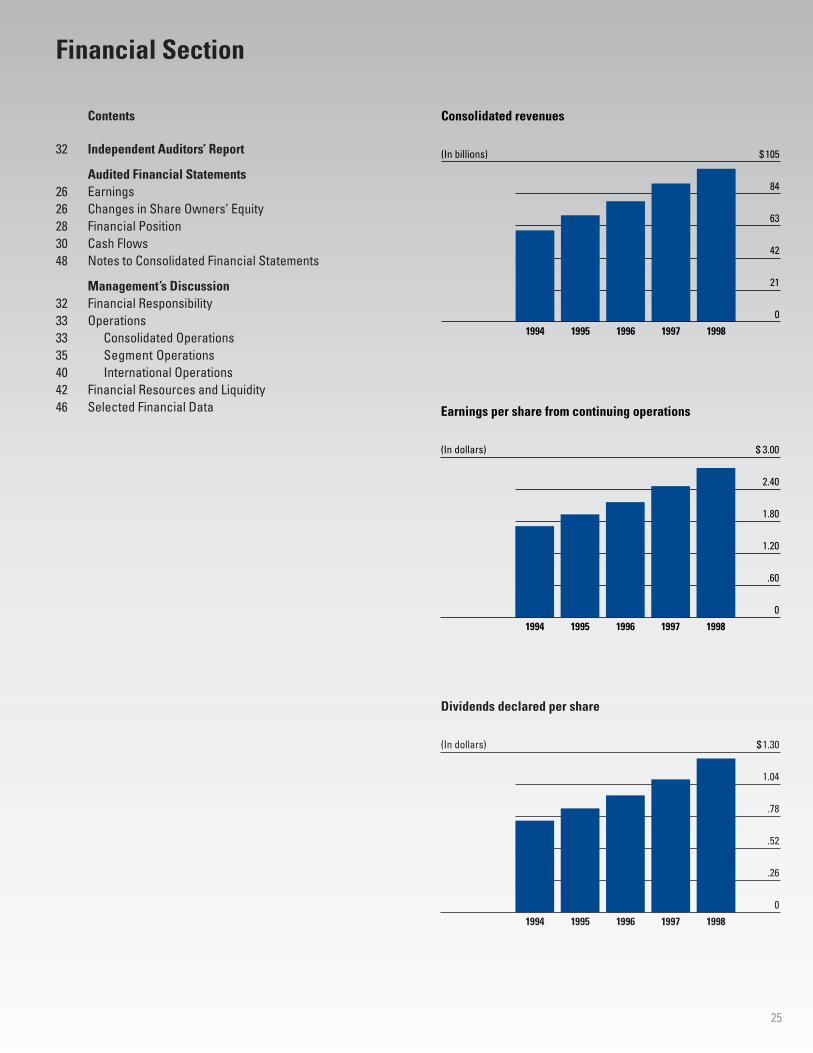
Contents
32 Independent Auditors’ Report
Audited Financial Statements26 Earnings26 Changes in Share Owners’ Equity28 Financial Position30 Cash Flows48 Notes to Consolidated Financial Statements
Management’s Discussion32 Financial Responsibility33 Operations33 Consolidated Operations35 Segment Operations40 International Operations42 Financial Resources and Liquidity46 Selected Financial Data
0
21
42
63
84
$ 105
Consolidated revenues
(In billions)
19981997199619951994
25
0
.26
.52
.78
1.04
$ 1.30
Dividends declared per share
(In dollars)
19981997199619951994
0
.60
1.20
1.80
2.40
$ 3.00
Earnings per share from continuing operations
(In dollars)
19981997199619951994
Financial Section
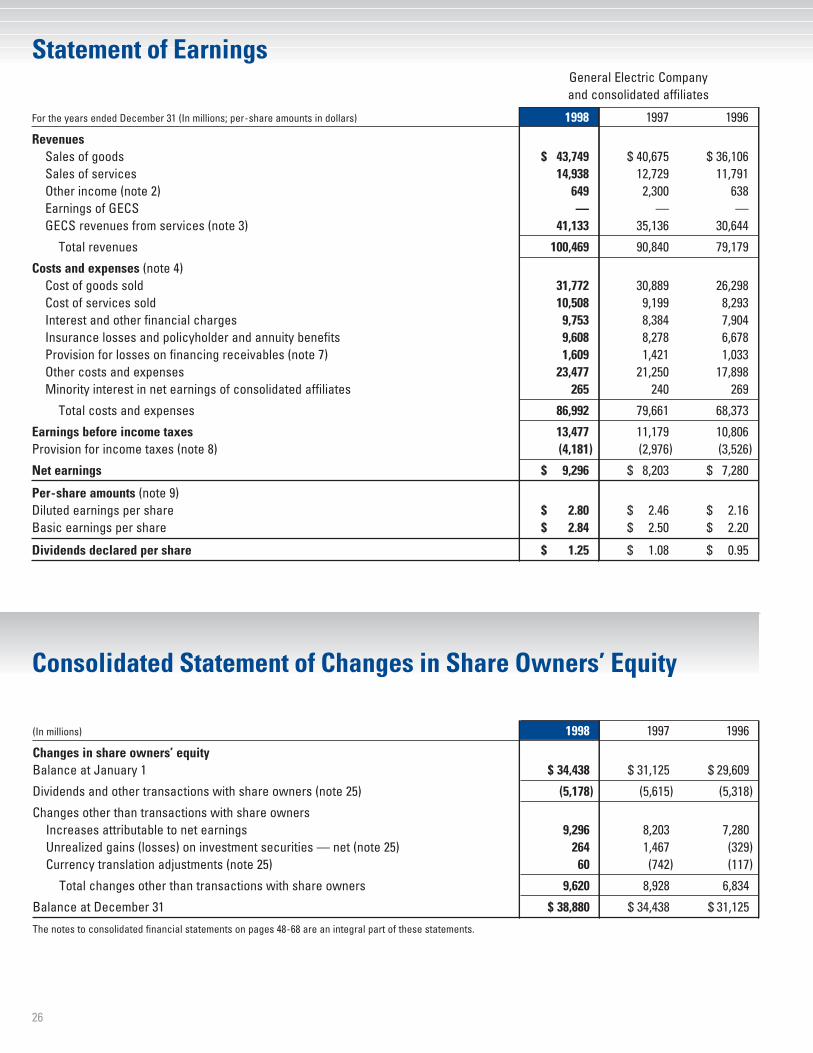
26
General Electric Companyand consolidated affiliates
For the years ended December 31 (In millions; per-share amounts in dollars) 1998 1997 1996
RevenuesSales of goods $ 43,749 $ 40,675 $ 36,106Sales of services 14,938 12,729 11,791Other income (note 2) 649 2,300 638Earnings of GECS — — —GECS revenues from services (note 3) 41,133 35,136 30,644
Total revenues 100,469 90,840 79,179
Costs and expenses (note 4)Cost of goods sold 31,772 30,889 26,298Cost of services sold 10,508 9,199 8,293Interest and other financial charges 9,753 8,384 7,904Insurance losses and policyholder and annuity benefits 9,608 8,278 6,678Provision for losses on financing receivables (note 7) 1,609 1,421 1,033Other costs and expenses 23,477 21,250 17,898Minority interest in net earnings of consolidated affiliates 265 240 269
Total costs and expenses 86,992 79,661 68,373
Earnings before income taxes 13,477 11,179 10,806Provision for income taxes (note 8) (4,181) (2,976) (3,526)
Net earnings $ 9,296 $ 8,203 $ 7,280
Per-share amounts (note 9)Diluted earnings per share $ 2.80 $ 2.46 $ 2.16Basic earnings per share $ 2.84 $ 2.50 $ 2.20
Dividends declared per share $ 1.25 $ 1.08 $ 0.95
Statement of Earnings
(In millions) 1998 1997 1996
Changes in share owners’ equityBalance at January 1 $ 34,438 $ 31,125 $ 29,609
Dividends and other transactions with share owners (note 25) (5,178) (5,615) (5,318)
Changes other than transactions with share ownersIncreases attributable to net earnings 9,296 8,203 7,280Unrealized gains (losses) on investment securities — net (note 25) 264 1,467 (329)Currency translation adjustments (note 25) 60 (742) (117)
Total changes other than transactions with share owners 9,620 8,928 6,834
Balance at December 31 $ 38,880 $ 34,438 $ 31,125
The notes to consolidated financial statements on pages 48-68 are an integral part of these statements.
Consolidated Statement of Changes in Share Owners’ Equity
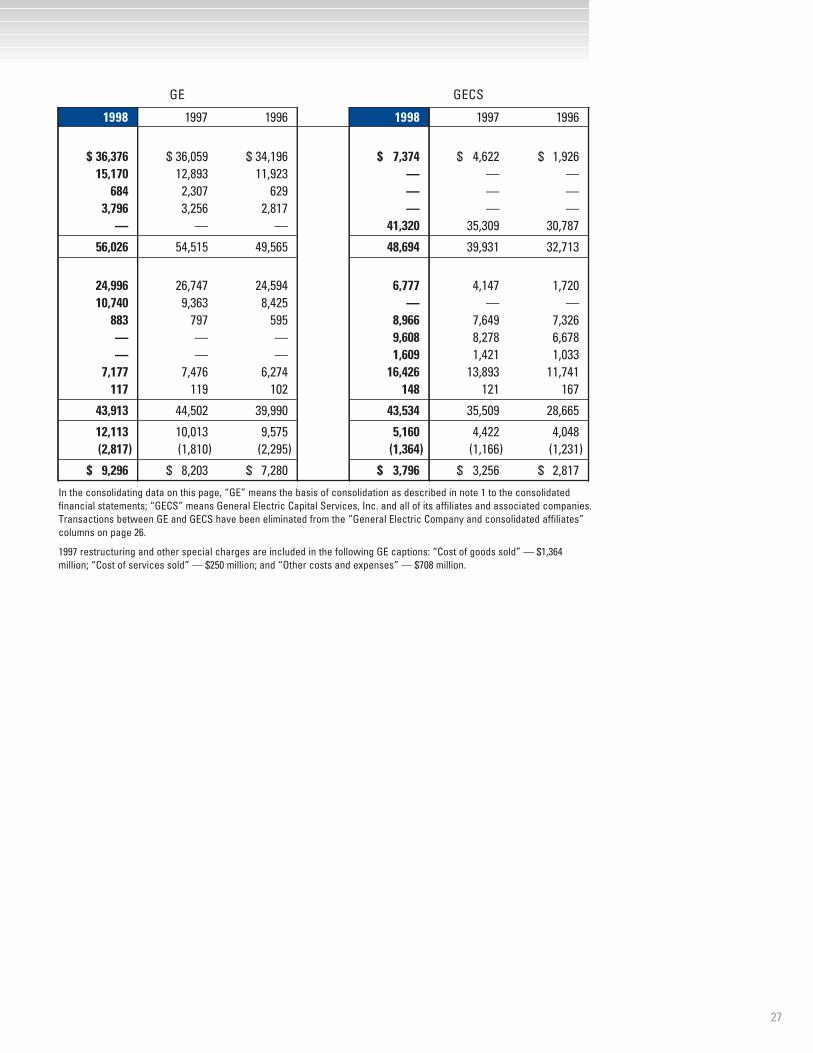
27
GE GECS
1998 1997 1996 1998 1997 1996
$ 36,376 $ 36,059 $ 34,196 $ 7,374 $ 4,622 $ 1,92615,170 12,893 11,923 — — —
684 2,307 629 — — —3,796 3,256 2,817 — — —
— — — 41,320 35,309 30,787
56,026 54,515 49,565 48,694 39,931 32,713
24,996 26,747 24,594 6,777 4,147 1,72010,740 9,363 8,425 — — —
883 797 595 8,966 7,649 7,326— — — 9,608 8,278 6,678— — — 1,609 1,421 1,033
7,177 7,476 6,274 16,426 13,893 11,741117 119 102 148 121 167
43,913 44,502 39,990 43,534 35,509 28,665
12,113 10,013 9,575 5,160 4,422 4,048(2,817) (1,810) (2,295) (1,364) (1,166) (1,231)
$ 9,296 $ 8,203 $ 7,280 $ 3,796 $ 3,256 $ 2,817
In the consolidating data on this page, “GE” means the basis of consolidation as described in note 1 to the consolidatedfinancial statements; “GECS” means General Electric Capital Services, Inc. and all of its affiliates and associated companies.Transactions between GE and GECS have been eliminated from the “General Electric Company and consolidated affiliates”columns on page 26.
1997 restructuring and other special charges are included in the following GE captions: “Cost of goods sold” — $1,364 million; “Cost of services sold” — $250 million; and “Other costs and expenses” — $708 million.
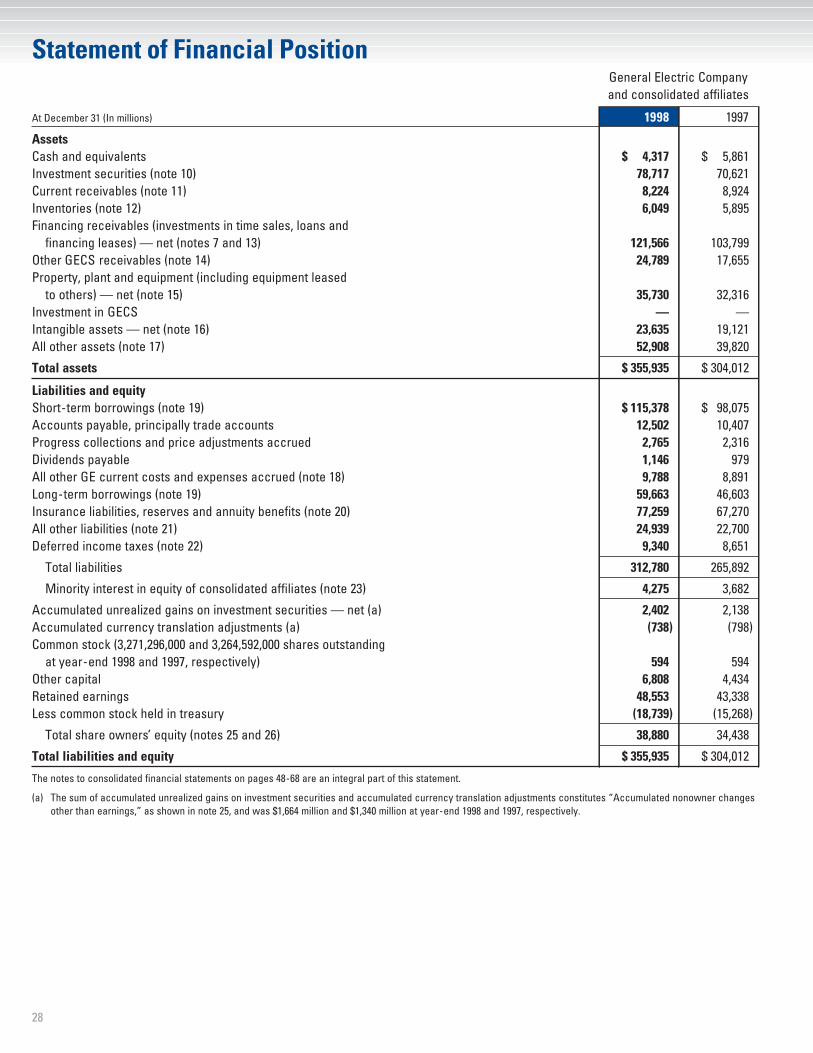
28
General Electric Companyand consolidated affiliates
At December 31 (In millions) 1998 1997
AssetsCash and equivalents $ 4,317 $ 5,861Investment securities (note 10) 78,717 70,621Current receivables (note 11) 8,224 8,924Inventories (note 12) 6,049 5,895Financing receivables (investments in time sales, loans and
financing leases) — net (notes 7 and 13) 121,566 103,799Other GECS receivables (note 14) 24,789 17,655Property, plant and equipment (including equipment leased
to others) — net (note 15) 35,730 32,316Investment in GECS — —Intangible assets — net (note 16) 23,635 19,121All other assets (note 17) 52,908 39,820
Total assets $ 355,935 $ 304,012
Liabilities and equity Short-term borrowings (note 19) $ 115,378 $ 98,075Accounts payable, principally trade accounts 12,502 10,407Progress collections and price adjustments accrued 2,765 2,316Dividends payable 1,146 979All other GE current costs and expenses accrued (note 18) 9,788 8,891Long-term borrowings (note 19) 59,663 46,603Insurance liabilities, reserves and annuity benefits (note 20) 77,259 67,270All other liabilities (note 21) 24,939 22,700Deferred income taxes (note 22) 9,340 8,651
Total liabilities 312,780 265,892
Minority interest in equity of consolidated affiliates (note 23) 4,275 3,682
Accumulated unrealized gains on investment securities — net (a) 2,402 2,138Accumulated currency translation adjustments (a) (738) (798)Common stock (3,271,296,000 and 3,264,592,000 shares outstanding
at year-end 1998 and 1997, respectively) 594 594Other capital 6,808 4,434Retained earnings 48,553 43,338Less common stock held in treasury (18,739) (15,268)
Total share owners’ equity (notes 25 and 26) 38,880 34,438
Total liabilities and equity $ 355,935 $ 304,012
The notes to consolidated financial statements on pages 48-68 are an integral part of this statement.
(a) The sum of accumulated unrealized gains on investment securities and accumulated currency translation adjustments constitutes “Accumulated nonowner changesother than earnings,” as shown in note 25, and was $1,664 million and $1,340 million at year-end 1998 and 1997, respectively.
Statement of Financial Position
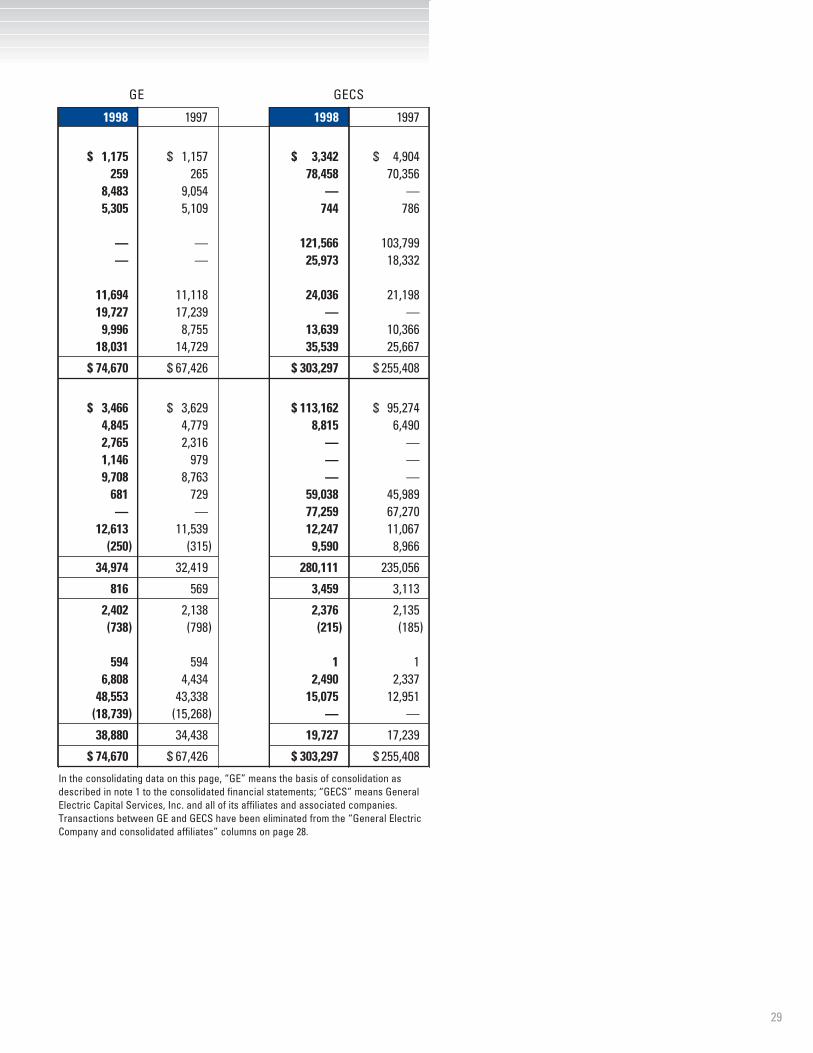
29
GE GECS
1998 1997 1998 1997
$ 1,175 $ 1,157 $ 3,342 $ 4,904259 265 78,458 70,356
8,483 9,054 — —5,305 5,109 744 786
— — 121,566 103,799— — 25,973 18,332
11,694 11,118 24,036 21,19819,727 17,239 — —
9,996 8,755 13,639 10,36618,031 14,729 35,539 25,667
$ 74,670 $ 67,426 $ 303,297 $ 255,408
$ 3,466 $ 3,629 $ 113,162 $ 95,2744,845 4,779 8,815 6,4902,765 2,316 — —1,146 979 — —9,708 8,763 — —
681 729 59,038 45,989— — 77,259 67,270
12,613 11,539 12,247 11,067(250) (315) 9,590 8,966
34,974 32,419 280,111 235,056
816 569 3,459 3,113
2,402 2,138 2,376 2,135(738) (798) (215) (185)
594 594 1 16,808 4,434 2,490 2,337
48,553 43,338 15,075 12,951(18,739) (15,268) — —
38,880 34,438 19,727 17,239
$ 74,670 $ 67,426 $ 303,297 $ 255,408
In the consolidating data on this page, “GE” means the basis of consolidation asdescribed in note 1 to the consolidated financial statements; “GECS” means GeneralElectric Capital Services, Inc. and all of its affiliates and associated companies. Transactions between GE and GECS have been eliminated from the “General ElectricCompany and consolidated affiliates” columns on page 28.
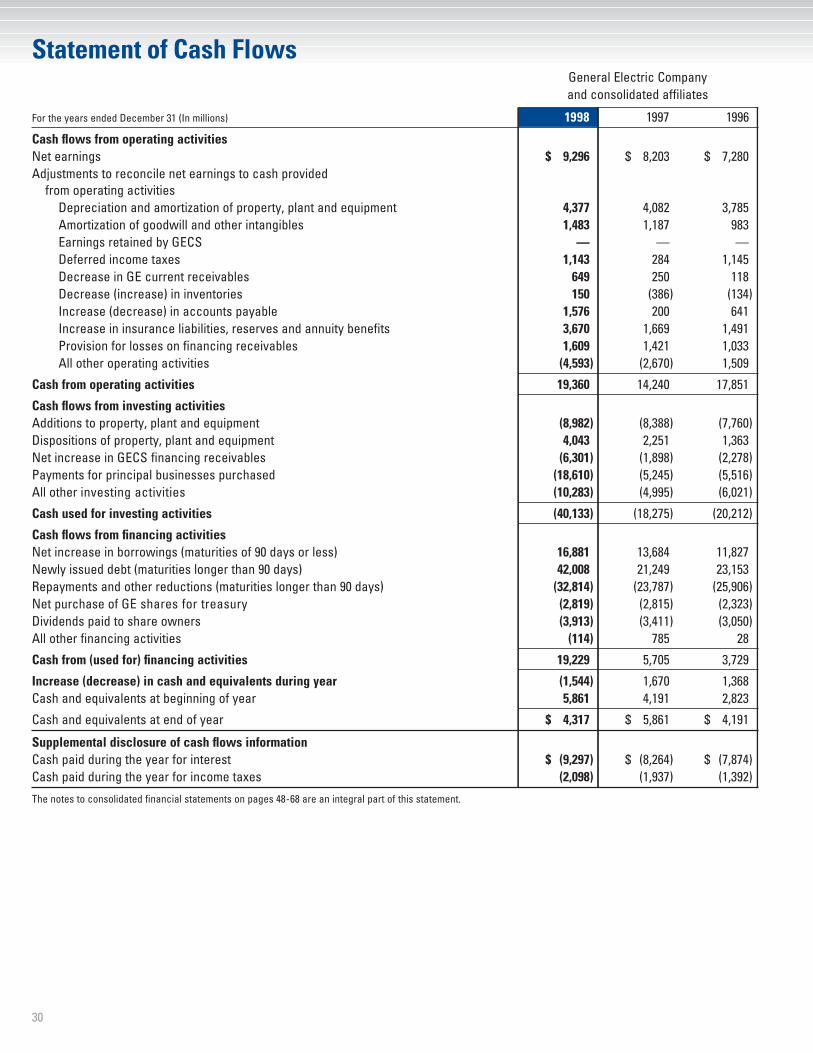
30
General Electric Companyand consolidated affiliates
For the years ended December 31 (In millions) 1998 1997 1996
Cash flows from operating activitiesNet earnings $ 9,296 $ 8,203 $ 7,280Adjustments to reconcile net earnings to cash provided
from operating activitiesDepreciation and amortization of property, plant and equipment 4,377 4,082 3,785Amortization of goodwill and other intangibles 1,483 1,187 983Earnings retained by GECS — — —Deferred income taxes 1,143 284 1,145Decrease in GE current receivables 649 250 118Decrease (increase) in inventories 150 (386) (134)Increase (decrease) in accounts payable 1,576 200 641Increase in insurance liabilities, reserves and annuity benefits 3,670 1,669 1,491Provision for losses on financing receivables 1,609 1,421 1,033All other operating activities (4,593) (2,670) 1,509
Cash from operating activities 19,360 14,240 17,851
Cash flows from investing activitiesAdditions to property, plant and equipment (8,982) (8,388) (7,760)Dispositions of property, plant and equipment 4,043 2,251 1,363Net increase in GECS financing receivables (6,301) (1,898) (2,278)Payments for principal businesses purchased (18,610) (5,245) (5,516)All other investing activities (10,283) (4,995) (6,021)
Cash used for investing activities (40,133) (18,275) (20,212)
Cash flows from financing activitiesNet increase in borrowings (maturities of 90 days or less) 16,881 13,684 11,827Newly issued debt (maturities longer than 90 days) 42,008 21,249 23,153Repayments and other reductions (maturities longer than 90 days) (32,814) (23,787) (25,906)Net purchase of GE shares for treasury (2,819) (2,815) (2,323)Dividends paid to share owners (3,913) (3,411) (3,050)All other financing activities (114) 785 28
Cash from (used for) financing activities 19,229 5,705 3,729
Increase (decrease) in cash and equivalents during year (1,544) 1,670 1,368Cash and equivalents at beginning of year 5,861 4,191 2,823
Cash and equivalents at end of year $ 4,317 $ 5,861 $ 4,191
Supplemental disclosure of cash flows information Cash paid during the year for interest $ (9,297) $ (8,264) $ (7,874)Cash paid during the year for income taxes (2,098) (1,937) (1,392)
The notes to consolidated financial statements on pages 48-68 are an integral part of this statement.
Statement of Cash Flows
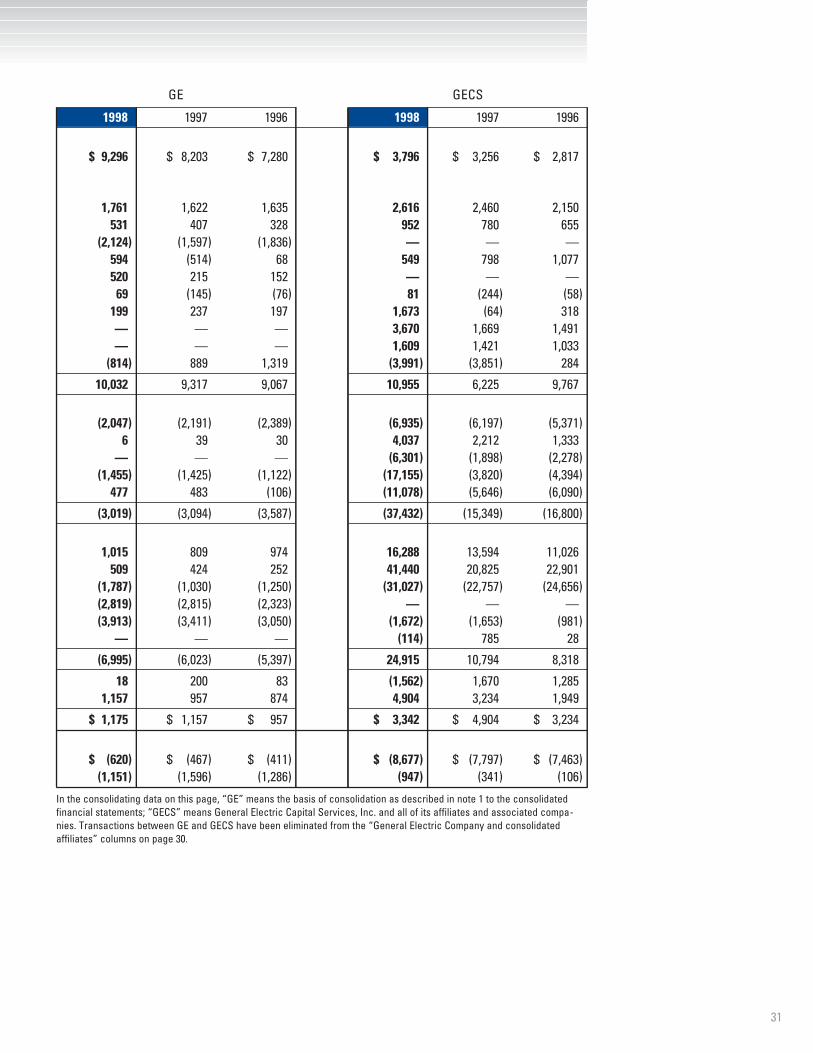
31
GE GECS
1998 1997 1996 1998 1997 1996
$ 9,296 $ 8,203 $ 7,280 $ 3,796 $ 3,256 $ 2,817
1,761 1,622 1,635 2,616 2,460 2,150531 407 328 952 780 655
(2,124) (1,597) (1,836) — — —594 (514) 68 549 798 1,077520 215 152 — — —
69 (145) (76) 81 (244) (58)199 237 197 1,673 (64) 318— — — 3,670 1,669 1,491— — — 1,609 1,421 1,033
(814) 889 1,319 (3,991) (3,851) 284
10,032 9,317 9,067 10,955 6,225 9,767
(2,047) (2,191) (2,389) (6,935) (6,197) (5,371)6 39 30 4,037 2,212 1,333
— — — (6,301) (1,898) (2,278)(1,455) (1,425) (1,122) (17,155) (3,820) (4,394)
477 483 (106) (11,078) (5,646) (6,090)
(3,019) (3,094) (3,587) (37,432) (15,349) (16,800)
1,015 809 974 16,288 13,594 11,026509 424 252 41,440 20,825 22,901
(1,787) (1,030) (1,250) (31,027) (22,757) (24,656)(2,819) (2,815) (2,323) — — —(3,913) (3,411) (3,050) (1,672) (1,653) (981)
— — — (114) 785 28
(6,995) (6,023) (5,397) 24,915 10,794 8,318
18 200 83 (1,562) 1,670 1,2851,157 957 874 4,904 3,234 1,949
$ 1,175 $ 1,157 $ 957 $ 3,342 $ 4,904 $ 3,234
$ (620) $ (467) $ (411) $ (8,677) $ (7,797) $ (7,463)(1,151) (1,596) (1,286) (947) (341) (106)
In the consolidating data on this page, “GE” means the basis of consolidation as described in note 1 to the consolidatedfinancial statements; “GECS” means General Electric Capital Services, Inc. and all of its affiliates and associated compa-nies. Transactions between GE and GECS have been eliminated from the “General Electric Company and consolidatedaffiliates” columns on page 30.
32
The financial data in this report, including the audited financialstatements, have been prepared by management using the bestavailable information and applying judgment. Accounting princi-ples used in preparing the financial statements are those that are generally accepted in the United States.
Management believes that a sound, dynamic system of internalfinancial controls that balances benefits and costs provides a vitalingredient for the Company’s Six Sigma quality program as well as the best safeguard for Company assets. Professional financialmanagers are responsible for implementing and overseeing thefinancial control system, reporting on management’s stewardshipof the assets entrusted to it by share owners and maintainingaccurate records.
GE is dedicated to the highest standards of integrity, ethics and social responsibility. This dedication is reflected in writtenpolicy statements covering, among other subjects, environmentalprotection, potentially conflicting outside interests of employees,compliance with antitrust laws, proper business practices, andadherence to the highest standards of conduct and practices in transactions with the U.S. government. Management continuallyemphasizes to all employees that even the appearance of impro-priety can erode public confidence in the Company. Ongoing
education and communication programs and review activities,such as those conducted by the Company’s Policy ComplianceReview Board, are designed to create a strong compliance culture— one that encourages employees to raise their policy questionsand concerns and that prohibits retribution for doing so.
KPMG LLP provides an objective, independent review of man-agement’s discharge of its obligations relating to the fairness ofreporting of operating results and financial condition. Their reportfor 1998 appears below.
The Audit Committee of the Board (consisting solely of Directorsfrom outside GE) maintains an ongoing appraisal — on behalf ofshare owners — of the activities and independence of the Com-pany’s independent auditors, the activities of its internal auditstaff, financial reporting process, internal financial controls andcompliance with key Company policies.
John F. Welch, Jr. Keith S. SherinChairman of the Board and Senior Vice President, Finance, andChief Executive Officer Chief Financial Officer
February 12, 1999
To Share Owners and Board of Directors ofGeneral Electric Company
We have audited the accompanying statement of financial posi-tion of General Electric Company and consolidated affiliates as ofDecember 31, 1998 and 1997, and the related statements of earn-ings, changes in share owners’ equity and cash flows for each of the years in the three-year period ended December 31, 1998.These consolidated financial statements are the responsibility ofthe Company’s management. Our responsibility is to express anopinion on these consolidated financial statements based on ouraudits.
We conducted our audits in accordance with generallyaccepted auditing standards. Those standards require that weplan and perform the audit to obtain reasonable assurance aboutwhether the financial statements are free of material misstate-ment. An audit includes examining, on a test basis, evidence sup-porting the amounts and disclosures in the financial statements.
An audit also includes assessing the accounting principles usedand significant estimates made by management, as well as evalu-ating the overall financial statement presentation. We believe thatour audits provide a reasonable basis for our opinion.
In our opinion, the aforementioned financial statements appear-ing on pages 26–31, 36, and 48–68 present fairly, in all materialrespects, the financial position of General Electric Company andconsolidated affiliates at December 31, 1998 and 1997, and theresults of their operations and their cash flows for each of theyears in the three-year period ended December 31, 1998, in con-formity with generally accepted accounting principles.
KPMG LLPStamford, Connecticut
February 12, 1999
Management’s Discussion of Financial Responsibility
Independent Auditors’ Report
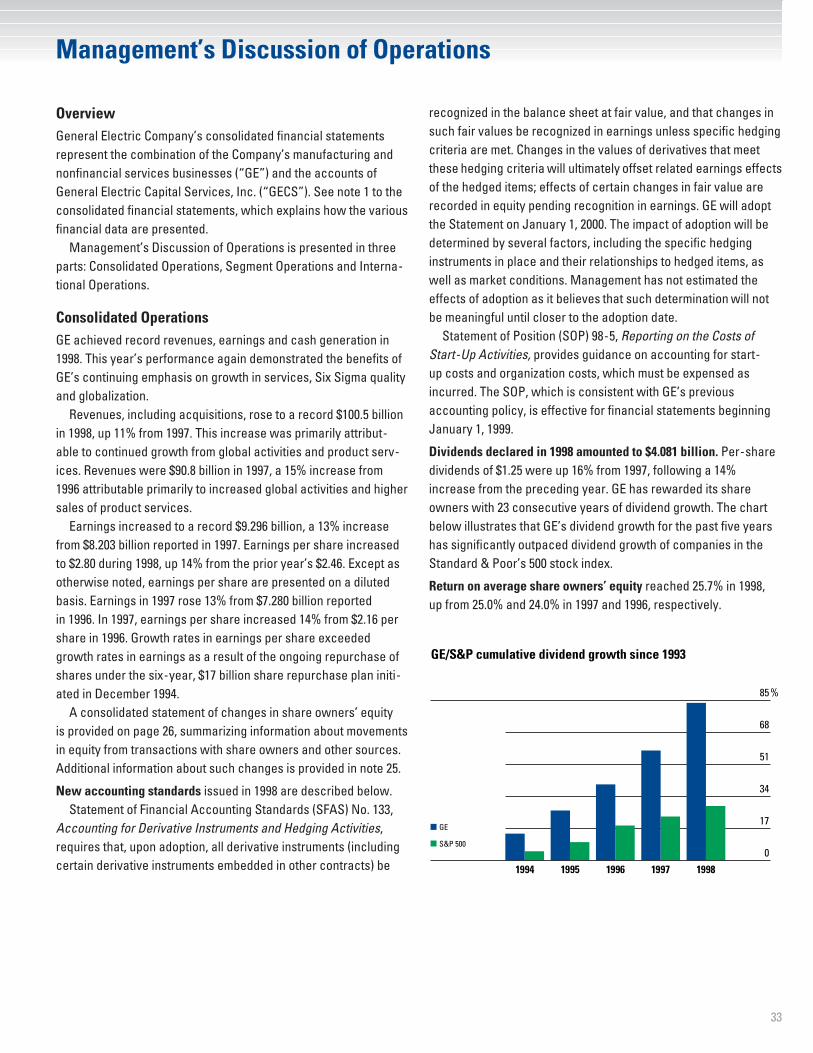
33
OverviewGeneral Electric Company’s consolidated financial statementsrepresent the combination of the Company’s manufacturing andnonfinancial services businesses (“GE”) and the accounts of General Electric Capital Services, Inc. (“GECS”). See note 1 to theconsolidated financial statements, which explains how the variousfinancial data are presented.
Management’s Discussion of Operations is presented in threeparts: Consolidated Operations, Segment Operations and Interna-tional Operations.
Consolidated OperationsGE achieved record revenues, earnings and cash generation in1998. This year’s performance again demonstrated the benefits ofGE’s continuing emphasis on growth in services, Six Sigma qualityand globalization.
Revenues, including acquisitions, rose to a record $100.5 billionin 1998, up 11% from 1997. This increase was primarily attribut-able to continued growth from global activities and product serv-ices. Revenues were $90.8 billion in 1997, a 15% increase from1996 attributable primarily to increased global activities and highersales of product services.
Earnings increased to a record $9.296 billion, a 13% increasefrom $8.203 billion reported in 1997. Earnings per share increasedto $2.80 during 1998, up 14% from the prior year’s $2.46. Except asotherwise noted, earnings per share are presented on a dilutedbasis. Earnings in 1997 rose 13% from $7.280 billion reported in 1996. In 1997, earnings per share increased 14% from $2.16 pershare in 1996. Growth rates in earnings per share exceededgrowth rates in earnings as a result of the ongoing repurchase ofshares under the six-year, $17 billion share repurchase plan initi-ated in December 1994.
A consolidated statement of changes in share owners’ equity is provided on page 26, summarizing information about movementsin equity from transactions with share owners and other sources.Additional information about such changes is provided in note 25.
New accounting standards issued in 1998 are described below. Statement of Financial Accounting Standards (SFAS) No. 133,
Accounting for Derivative Instruments and Hedging Activities,requires that, upon adoption, all derivative instruments (includingcertain derivative instruments embedded in other contracts) be
recognized in the balance sheet at fair value, and that changes insuch fair values be recognized in earnings unless specific hedgingcriteria are met. Changes in the values of derivatives that meetthese hedging criteria will ultimately offset related earnings effectsof the hedged items; effects of certain changes in fair value arerecorded in equity pending recognition in earnings. GE will adoptthe Statement on January 1, 2000. The impact of adoption will bedetermined by several factors, including the specific hedginginstruments in place and their relationships to hedged items, aswell as market conditions. Management has not estimated theeffects of adoption as it believes that such determination will notbe meaningful until closer to the adoption date.
Statement of Position (SOP) 98-5, Reporting on the Costs ofStart-Up Activities, provides guidance on accounting for start-up costs and organization costs, which must be expensed asincurred. The SOP, which is consistent with GE’s previousaccounting policy, is effective for financial statements beginningJanuary 1, 1999.
Dividends declared in 1998 amounted to $4.081 billion. Per-sharedividends of $1.25 were up 16% from 1997, following a 14%increase from the preceding year. GE has rewarded its shareowners with 23 consecutive years of dividend growth. The chartbelow illustrates that GE’s dividend growth for the past five yearshas significantly outpaced dividend growth of companies in theStandard & Poor’s 500 stock index.
Return on average share owners’ equity reached 25.7% in 1998, up from 25.0% and 24.0% in 1997 and 1996, respectively.
0
17
34
51
68
85%
GE
S&P 500
0
17
34
51
68
85
GE/S&P cumulative dividend growth since 1993
19981997199619951994
Management’s Discussion of Operations
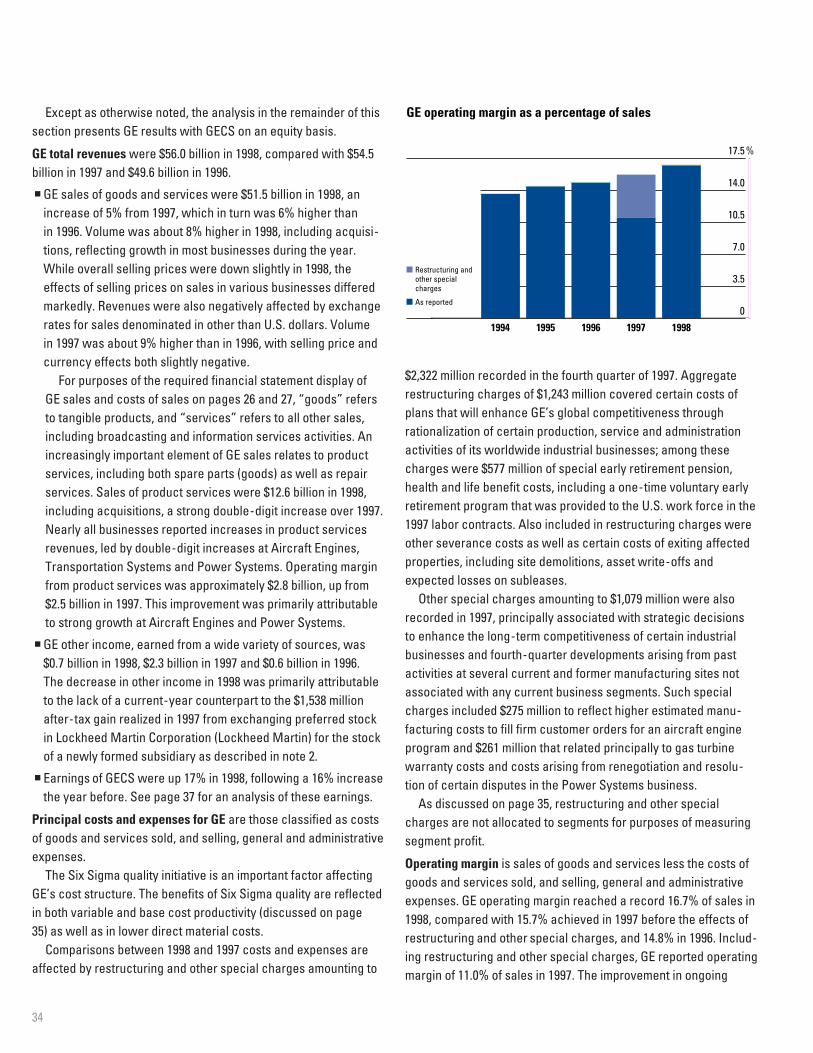
34
Except as otherwise noted, the analysis in the remainder of thissection presents GE results with GECS on an equity basis.
GE total revenues were $56.0 billion in 1998, compared with $54.5billion in 1997 and $49.6 billion in 1996.
n GE sales of goods and services were $51.5 billion in 1998, anincrease of 5% from 1997, which in turn was 6% higher than in 1996. Volume was about 8% higher in 1998, including acquisi-tions, reflecting growth in most businesses during the year.While overall selling prices were down slightly in 1998, theeffects of selling prices on sales in various businesses differedmarkedly. Revenues were also negatively affected by exchangerates for sales denominated in other than U.S. dollars. Volume in 1997 was about 9% higher than in 1996, with selling price andcurrency effects both slightly negative.
For purposes of the required financial statement display of GE sales and costs of sales on pages 26 and 27, “goods” refersto tangible products, and “services” refers to all other sales,including broadcasting and information services activities. Anincreasingly important element of GE sales relates to productservices, including both spare parts (goods) as well as repairservices. Sales of product services were $12.6 billion in 1998,including acquisitions, a strong double-digit increase over 1997.Nearly all businesses reported increases in product servicesrevenues, led by double-digit increases at Aircraft Engines,Transportation Systems and Power Systems. Operating marginfrom product services was approximately $2.8 billion, up from$2.5 billion in 1997. This improvement was primarily attributableto strong growth at Aircraft Engines and Power Systems.
n GE other income, earned from a wide variety of sources, was$0.7 billion in 1998, $2.3 billion in 1997 and $0.6 billion in 1996. The decrease in other income in 1998 was primarily attributableto the lack of a current-year counterpart to the $1,538 millionafter-tax gain realized in 1997 from exchanging preferred stockin Lockheed Martin Corporation (Lockheed Martin) for the stockof a newly formed subsidiary as described in note 2.
n Earnings of GECS were up 17% in 1998, following a 16% increasethe year before. See page 37 for an analysis of these earnings.
Principal costs and expenses for GE are those classified as costsof goods and services sold, and selling, general and administrativeexpenses.
The Six Sigma quality initiative is an important factor affectingGE’s cost structure. The benefits of Six Sigma quality are reflectedin both variable and base cost productivity (discussed on page35) as well as in lower direct material costs.
Comparisons between 1998 and 1997 costs and expenses areaffected by restructuring and other special charges amounting to
$2,322 million recorded in the fourth quarter of 1997. Aggregaterestructuring charges of $1,243 million covered certain costs ofplans that will enhance GE’s global competitiveness through rationalization of certain production, service and administrationactivities of its worldwide industrial businesses; among thesecharges were $577 million of special early retirement pension,health and life benefit costs, including a one-time voluntary earlyretirement program that was provided to the U.S. work force in the1997 labor contracts. Also included in restructuring charges wereother severance costs as well as certain costs of exiting affectedproperties, including site demolitions, asset write-offs andexpected losses on subleases.
Other special charges amounting to $1,079 million were alsorecorded in 1997, principally associated with strategic decisions to enhance the long-term competitiveness of certain industrialbusinesses and fourth-quarter developments arising from pastactivities at several current and former manufacturing sites notassociated with any current business segments. Such specialcharges included $275 million to reflect higher estimated manu-facturing costs to fill firm customer orders for an aircraft engineprogram and $261 million that related principally to gas turbinewarranty costs and costs arising from renegotiation and resolu-tion of certain disputes in the Power Systems business.
As discussed on page 35, restructuring and other specialcharges are not allocated to segments for purposes of measuringsegment profit.
Operating margin is sales of goods and services less the costs ofgoods and services sold, and selling, general and administrativeexpenses. GE operating margin reached a record 16.7% of sales in1998, compared with 15.7% achieved in 1997 before the effects ofrestructuring and other special charges, and 14.8% in 1996. Includ-ing restructuring and other special charges, GE reported operatingmargin of 11.0% of sales in 1997. The improvement in ongoing
0
3.5
7.0
10.5
14.0
17.5%
0
3
7
Restructuring and other special charges
As reported
GE operating margin as a percentage of sales
19981997199619951994
35
operating margin in 1998 was broad-based, with improvements in a majority of GE’s businesses reflecting the increasing benefitsfrom GE’s product services and Six Sigma quality initiatives.
Total cost productivity (sales in relation to costs, both on a con-stant dollar basis) has paralleled the significant improvement inGE’s ongoing operating margin. Total cost productivity in 1998 was4.4%, reflecting benefits from the Six Sigma quality initiative aswell as higher volume. Three businesses — Medical Systems,Power Systems and NBC — achieved productivity in excess of5%. Total cost productivity was 4.2% in 1997, reflecting Six Sigmabenefits and the positive effects of higher volume. In 1997, threebusinesses — Power Systems, NBC and Plastics — reported pro-ductivity in excess of 5%. The total contribution of productivity inthe last two years offset not only the negative effects of total costinflation, but also the effects of selling price decreases.
GE interest and other financial charges in 1998 amounted to $883million, compared with $797 million in 1997 and $595 million in 1996.Lower interest rates in 1998 and 1997 were more than offset byhigher average levels of borrowings and other financing activities.
Income taxes on a consolidated basis were 31.0% of pretax earn-ings in 1998, compared with 26.6% in 1997 and 32.6% in 1996. Themost significant factor explaining 1997’s lower effective tax ratewas the 4.8% decrease attributable to the realized gain on the tax-free exchange of Lockheed Martin Corporation preferred stock. Amore detailed analysis of the differences between the U.S. federalstatutory rate and the consolidated rate, as well as other informa-tion about income tax provisions, is provided in note 8.
Return on average total capital invested was 23.9% at year-end1998, compared with 23.6% in 1997 and 22.2% in 1996.
Segment Operations
Revenues and segment profit for operating segments are shownon page 36. At year-end 1998, GE adopted SFAS No. 131, Disclo-sures about Segments of an Enterprise and Related Information,which requires segment data to be measured and analyzed on a basis that is consistent with how business activities are reportedinternally to management. The most significant change from previ-ous Annual Reports is that restructuring and other special chargesare not included in the measure of segment profit. Previouslyreported data have been restated as required by SFAS No. 131. For additional information, including a description of the productsand services included in each segment, see note 28.
Aircraft Engines achieved a 32% increase in revenues in 1998, following a 24% increase in 1997, on higher volume in commercialengines and product services, including acquisitions, in bothyears. Operating profit increased 30% in 1998, and 13% in 1997,
largely as a result of strong growth in product services as well asgood volume growth in commercial engines.
In 1998, $1.6 billion of Aircraft Engines revenues were from salesto the U.S. government, an increase of $0.1 billion from 1997, whichwas $0.3 billion lower than in 1996.
Aircraft Engines received orders of $10.8 billion in 1998, up $1.9billion from 1997. The backlog at year-end 1998 was $9.7 billion($9.5 billion at the end of 1997). Of the total, $7.5 billion related toproducts, about 52% of which was scheduled for delivery in 1999,and the remainder related to 1999 product services.
Appliances revenues were 3% lower than a year ago, reflectingprimarily selling price decreases and, to a lesser extent, lower volume. Operating profit was 2% lower as the decreases in sellingprices and volume more than offset productivity from Six Sigma.Revenues in 1997 were 4% higher than in 1996, reflecting primarilyacquisition-related volume. Operating profit increased 3% in 1997,primarily as a result of productivity and higher volume, partiallyoffset by lower selling prices.
Industrial Products and Systems revenues increased 2% in 1998, primarily as a result of volume increases at Transportation Systems and Industrial Systems that were partially offset by lower selling prices across most businesses in the segment. Operating profit increased 5%, reflecting productivity from SixSigma and the improvement in volume, which more than offset the effects of selling price decreases. Revenues rose 6% in 1997 as improved volume more than offset weaker pricing across allbusinesses in the segment. Operating profit increased 13% in 1997,the result of Six Sigma-based productivity and volume improve-ments across the segment, which more than offset the effects oflower selling prices.
Transportation Systems received orders of $2.4 billion in 1998,about the same as in 1997. The backlog at year-end 1998 was $2.3 billion ($2.0 billion at the end of 1997). Of the total, $2.1 billionrelated to products, about 83% of which was scheduled for ship-ment in 1999, and the remainder related to 1999 product services.
NBC revenues increased 2% in 1998, reflecting higher revenues in NBC’s owned-and-operated stations, including revenues fromstation acquisitions and growth in cable operations, the combina-tion of which more than offset lower network revenues. Operatingprofit was 11% higher than a year ago as improved results in inter-national, cable operations and owned-and-operated stations, as well as cost reductions across NBC, more than offset higherlicense fees for certain prime-time programs that were renewed.Revenues decreased 2% in 1997 as a strong advertising market-place was more than offset by the absence of a 1997 counterpartto NBC’s broadcast of the 1996 Summer Olympic Games. Operat-ing profit increased 19% in 1997, reflecting improved prime-time
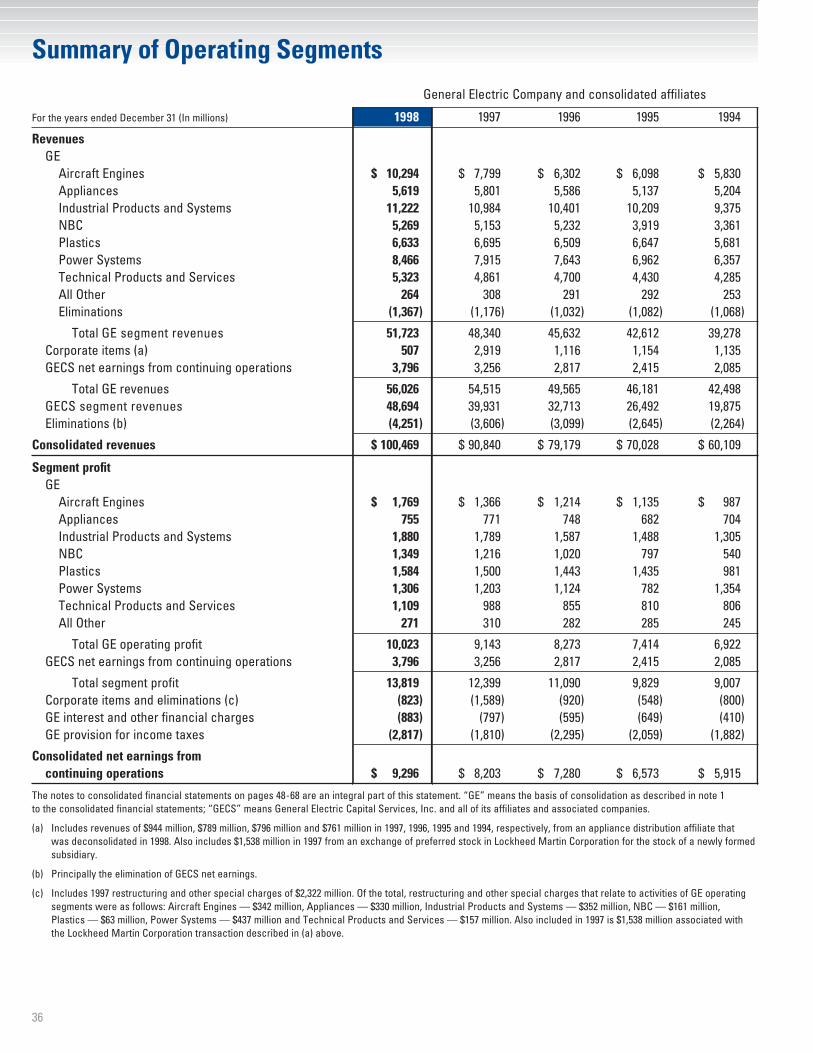
36
General Electric Company and consolidated affiliates
For the years ended December 31 (In millions) 1998 1997 1996 1995 1994
RevenuesGE
Aircraft Engines $ 10,294 $ 7,799 $ 6,302 $ 6,098 $ 5,830Appliances 5,619 5,801 5,586 5,137 5,204Industrial Products and Systems 11,222 10,984 10,401 10,209 9,375NBC 5,269 5,153 5,232 3,919 3,361Plastics 6,633 6,695 6,509 6,647 5,681Power Systems 8,466 7,915 7,643 6,962 6,357Technical Products and Services 5,323 4,861 4,700 4,430 4,285All Other 264 308 291 292 253Eliminations (1,367) (1,176) (1,032) (1,082) (1,068)
Total GE segment revenues 51,723 48,340 45,632 42,612 39,278Corporate items (a) 507 2,919 1,116 1,154 1,135GECS net earnings from continuing operations 3,796 3,256 2,817 2,415 2,085
Total GE revenues 56,026 54,515 49,565 46,181 42,498GECS segment revenues 48,694 39,931 32,713 26,492 19,875Eliminations (b) (4,251) (3,606) (3,099) (2,645) (2,264)
Consolidated revenues $ 100,469 $ 90,840 $ 79,179 $ 70,028 $ 60,109
Segment profitGE
Aircraft Engines $ 1,769 $ 1,366 $ 1,214 $ 1,135 $ 987Appliances 755 771 748 682 704Industrial Products and Systems 1,880 1,789 1,587 1,488 1,305NBC 1,349 1,216 1,020 797 540Plastics 1,584 1,500 1,443 1,435 981Power Systems 1,306 1,203 1,124 782 1,354Technical Products and Services 1,109 988 855 810 806All Other 271 310 282 285 245
Total GE operating profit 10,023 9,143 8,273 7,414 6,922GECS net earnings from continuing operations 3,796 3,256 2,817 2,415 2,085
Total segment profit 13,819 12,399 11,090 9,829 9,007Corporate items and eliminations (c) (823) (1,589) (920) (548) (800)GE interest and other financial charges (883) (797) (595) (649) (410)GE provision for income taxes (2,817) (1,810) (2,295) (2,059) (1,882)
Consolidated net earnings from continuing operations $ 9,296 $ 8,203 $ 7,280 $ 6,573 $ 5,915
The notes to consolidated financial statements on pages 48-68 are an integral part of this statement. “GE” means the basis of consolidation as described in note 1 to the consolidated financial statements; “GECS” means General Electric Capital Services, Inc. and all of its affiliates and associated companies.
(a) Includes revenues of $944 million, $789 million, $796 million and $761 million in 1997, 1996, 1995 and 1994, respectively, from an appliance distribution affiliate that was deconsolidated in 1998. Also includes $1,538 million in 1997 from an exchange of preferred stock in Lockheed Martin Corporation for the stock of a newly formedsubsidiary.
(b) Principally the elimination of GECS net earnings.
(c) Includes 1997 restructuring and other special charges of $2,322 million. Of the total, restructuring and other special charges that relate to activities of GE operatingsegments were as follows: Aircraft Engines — $342 million, Appliances — $330 million, Industrial Products and Systems — $352 million, NBC — $161 million, Plastics — $63 million, Power Systems — $437 million and Technical Products and Services — $157 million. Also included in 1997 is $1,538 million associated with the Lockheed Martin Corporation transaction described in (a) above.
Summary of Operating Segments
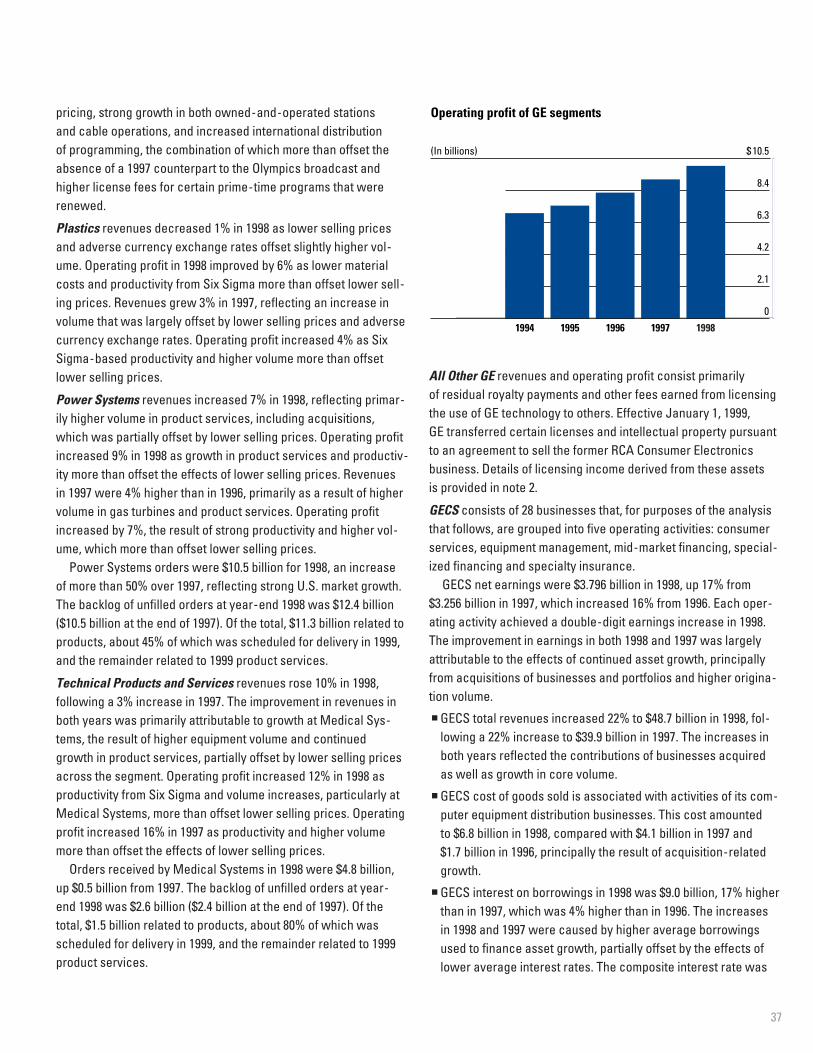
37
pricing, strong growth in both owned-and-operated stations and cable operations, and increased international distribution of programming, the combination of which more than offset theabsence of a 1997 counterpart to the Olympics broadcast andhigher license fees for certain prime-time programs that wererenewed.
Plastics revenues decreased 1% in 1998 as lower selling pricesand adverse currency exchange rates offset slightly higher vol-ume. Operating profit in 1998 improved by 6% as lower materialcosts and productivity from Six Sigma more than offset lower sell-ing prices. Revenues grew 3% in 1997, reflecting an increase involume that was largely offset by lower selling prices and adversecurrency exchange rates. Operating profit increased 4% as SixSigma-based productivity and higher volume more than offsetlower selling prices.
Power Systems revenues increased 7% in 1998, reflecting primar-ily higher volume in product services, including acquisitions,which was partially offset by lower selling prices. Operating profitincreased 9% in 1998 as growth in product services and productiv-ity more than offset the effects of lower selling prices. Revenues in 1997 were 4% higher than in 1996, primarily as a result of highervolume in gas turbines and product services. Operating profitincreased by 7%, the result of strong productivity and higher vol-ume, which more than offset lower selling prices.
Power Systems orders were $10.5 billion for 1998, an increase of more than 50% over 1997, reflecting strong U.S. market growth.The backlog of unfilled orders at year-end 1998 was $12.4 billion($10.5 billion at the end of 1997). Of the total, $11.3 billion related toproducts, about 45% of which was scheduled for delivery in 1999,and the remainder related to 1999 product services.
Technical Products and Services revenues rose 10% in 1998, following a 3% increase in 1997. The improvement in revenues inboth years was primarily attributable to growth at Medical Sys-tems, the result of higher equipment volume and continued growth in product services, partially offset by lower selling pricesacross the segment. Operating profit increased 12% in 1998 asproductivity from Six Sigma and volume increases, particularly atMedical Systems, more than offset lower selling prices. Operatingprofit increased 16% in 1997 as productivity and higher volumemore than offset the effects of lower selling prices.
Orders received by Medical Systems in 1998 were $4.8 billion,up $0.5 billion from 1997. The backlog of unfilled orders at year-end 1998 was $2.6 billion ($2.4 billion at the end of 1997). Of thetotal, $1.5 billion related to products, about 80% of which wasscheduled for delivery in 1999, and the remainder related to 1999product services.
All Other GE revenues and operating profit consist primarily of residual royalty payments and other fees earned from licensingthe use of GE technology to others. Effective January 1, 1999, GE transferred certain licenses and intellectual property pursuantto an agreement to sell the former RCA Consumer Electronicsbusiness. Details of licensing income derived from these assets is provided in note 2.
GECS consists of 28 businesses that, for purposes of the analysisthat follows, are grouped into five operating activities: consumerservices, equipment management, mid-market financing, special-ized financing and specialty insurance.
GECS net earnings were $3.796 billion in 1998, up 17% from$3.256 billion in 1997, which increased 16% from 1996. Each oper-ating activity achieved a double-digit earnings increase in 1998.The improvement in earnings in both 1998 and 1997 was largelyattributable to the effects of continued asset growth, principallyfrom acquisitions of businesses and portfolios and higher origina-tion volume.
n GECS total revenues increased 22% to $48.7 billion in 1998, fol-lowing a 22% increase to $39.9 billion in 1997. The increases inboth years reflected the contributions of businesses acquired as well as growth in core volume.
n GECS cost of goods sold is associated with activities of its com-puter equipment distribution businesses. This cost amounted to $6.8 billion in 1998, compared with $4.1 billion in 1997 and $1.7 billion in 1996, principally the result of acquisition-relatedgrowth.
n GECS interest on borrowings in 1998 was $9.0 billion, 17% higherthan in 1997, which was 4% higher than in 1996. The increases in 1998 and 1997 were caused by higher average borrowingsused to finance asset growth, partially offset by the effects oflower average interest rates. The composite interest rate was
0
2.1
4.2
6.3
8.4
$ 10.5
Operating profit of GE segments
(In billions)
19981997199619951994
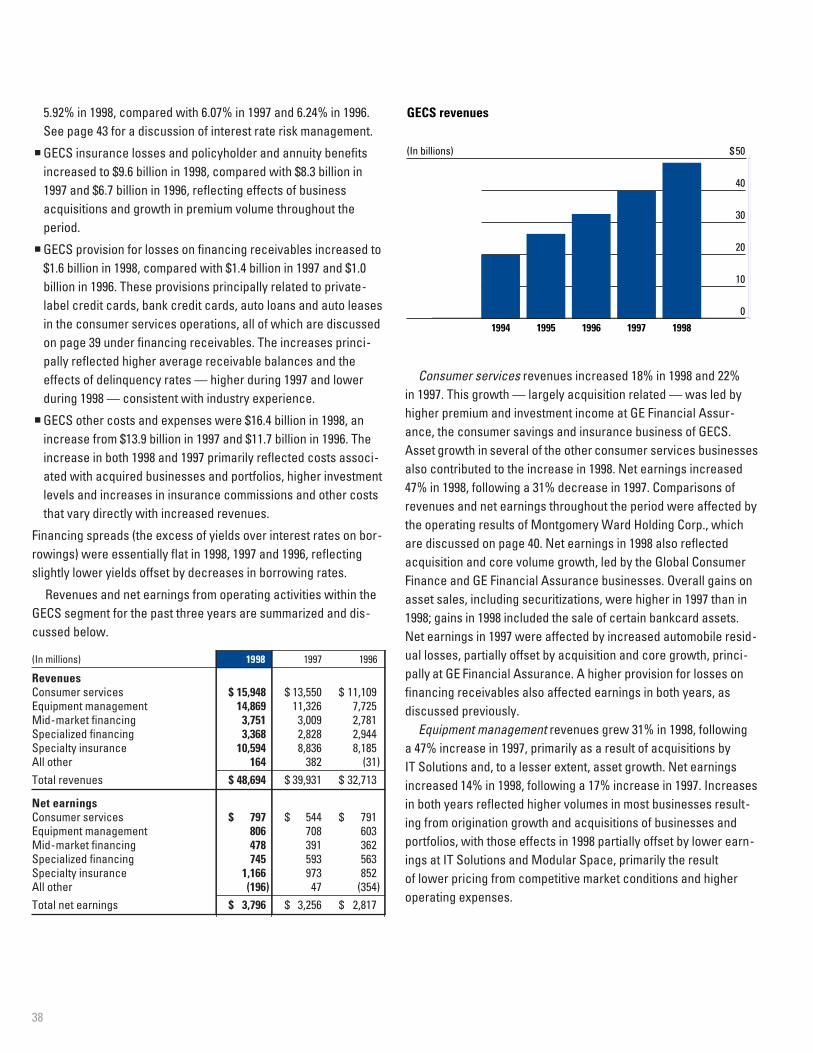
38
5.92% in 1998, compared with 6.07% in 1997 and 6.24% in 1996.See page 43 for a discussion of interest rate risk management.
n GECS insurance losses and policyholder and annuity benefitsincreased to $9.6 billion in 1998, compared with $8.3 billion in1997 and $6.7 billion in 1996, reflecting effects of business acquisitions and growth in premium volume throughout theperiod.
n GECS provision for losses on financing receivables increased to$1.6 billion in 1998, compared with $1.4 billion in 1997 and $1.0billion in 1996. These provisions principally related to private-label credit cards, bank credit cards, auto loans and auto leasesin the consumer services operations, all of which are discussedon page 39 under financing receivables. The increases princi-pally reflected higher average receivable balances and theeffects of delinquency rates — higher during 1997 and lowerduring 1998 — consistent with industry experience.
n GECS other costs and expenses were $16.4 billion in 1998, anincrease from $13.9 billion in 1997 and $11.7 billion in 1996. Theincrease in both 1998 and 1997 primarily reflected costs associ-ated with acquired businesses and portfolios, higher investmentlevels and increases in insurance commissions and other coststhat vary directly with increased revenues.
Financing spreads (the excess of yields over interest rates on bor-rowings) were essentially flat in 1998, 1997 and 1996, reflectingslightly lower yields offset by decreases in borrowing rates.
Revenues and net earnings from operating activities within theGECS segment for the past three years are summarized and dis-cussed below.
(In millions) 1998 1997 1996
RevenuesConsumer services $ 15,948 $ 13,550 $ 11,109Equipment management 14,869 11,326 7,725Mid-market financing 3,751 3,009 2,781Specialized financing 3,368 2,828 2,944Specialty insurance 10,594 8,836 8,185All other 164 382 (31)Total revenues $ 48,694 $ 39,931 $ 32,713
Net earningsConsumer services $ 797 $ 544 $ 791Equipment management 806 708 603Mid-market financing 478 391 362Specialized financing 745 593 563Specialty insurance 1,166 973 852All other (196) 47 (354)Total net earnings $ 3,796 $ 3,256 $ 2,817
Consumer services revenues increased 18% in 1998 and 22%in 1997. This growth — largely acquisition related — was led byhigher premium and investment income at GE Financial Assur-ance, the consumer savings and insurance business of GECS.Asset growth in several of the other consumer services businessesalso contributed to the increase in 1998. Net earnings increased47% in 1998, following a 31% decrease in 1997. Comparisons ofrevenues and net earnings throughout the period were affected bythe operating results of Montgomery Ward Holding Corp., whichare discussed on page 40. Net earnings in 1998 also reflectedacquisition and core volume growth, led by the Global ConsumerFinance and GE Financial Assurance businesses. Overall gains onasset sales, including securitizations, were higher in 1997 than in1998; gains in 1998 included the sale of certain bankcard assets.Net earnings in 1997 were affected by increased automobile resid-ual losses, partially offset by acquisition and core growth, princi-pally at GE Financial Assurance. A higher provision for losses onfinancing receivables also affected earnings in both years, as discussed previously.
Equipment management revenues grew 31% in 1998, following a 47% increase in 1997, primarily as a result of acquisitions by IT Solutions and, to a lesser extent, asset growth. Net earningsincreased 14% in 1998, following a 17% increase in 1997. Increasesin both years reflected higher volumes in most businesses result-ing from origination growth and acquisitions of businesses andportfolios, with those effects in 1998 partially offset by lower earn-ings at IT Solutions and Modular Space, primarily the result of lower pricing from competitive market conditions and higheroperating expenses.
0
10
20
30
40
$ 50
GECS revenues
(In billions)
19981997199619951994
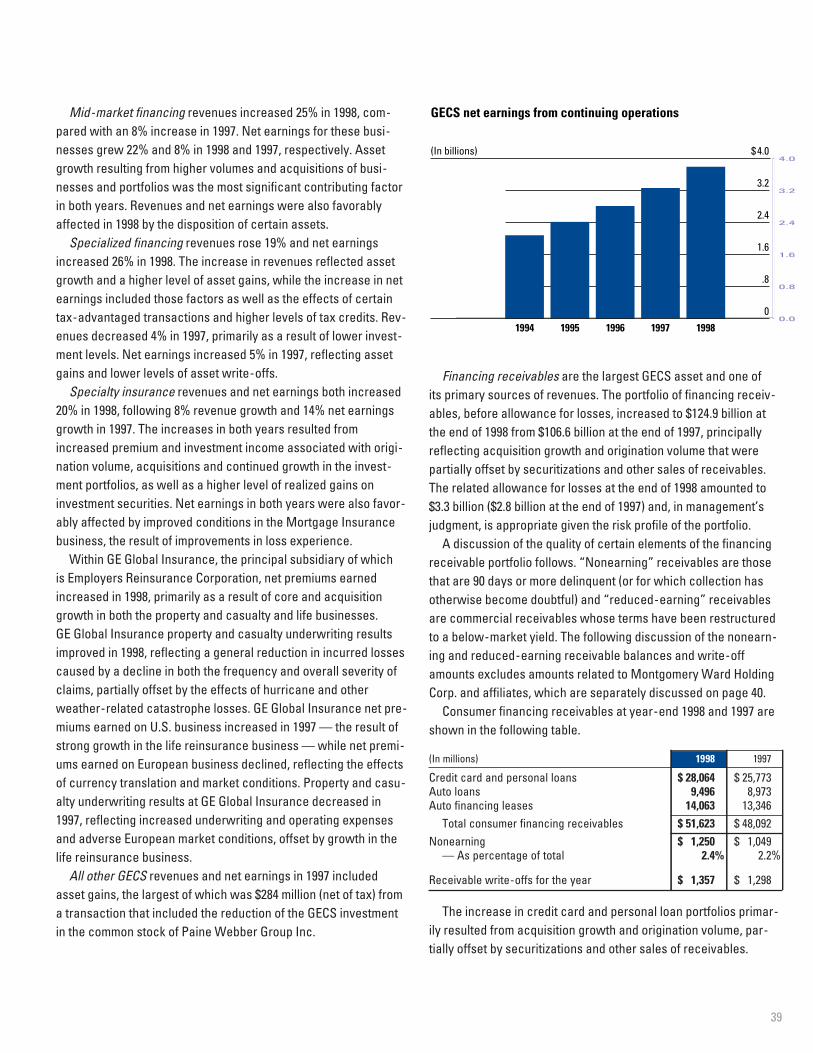
39
Mid-market financing revenues increased 25% in 1998, com-pared with an 8% increase in 1997. Net earnings for these busi-nesses grew 22% and 8% in 1998 and 1997, respectively. Assetgrowth resulting from higher volumes and acquisitions of busi-nesses and portfolios was the most significant contributing factorin both years. Revenues and net earnings were also favorablyaffected in 1998 by the disposition of certain assets.
Specialized financing revenues rose 19% and net earningsincreased 26% in 1998. The increase in revenues reflected assetgrowth and a higher level of asset gains, while the increase in netearnings included those factors as well as the effects of certaintax-advantaged transactions and higher levels of tax credits. Rev-enues decreased 4% in 1997, primarily as a result of lower invest-ment levels. Net earnings increased 5% in 1997, reflecting assetgains and lower levels of asset write-offs.
Specialty insurance revenues and net earnings both increased20% in 1998, following 8% revenue growth and 14% net earningsgrowth in 1997. The increases in both years resulted fromincreased premium and investment income associated with origi-nation volume, acquisitions and continued growth in the invest-ment portfolios, as well as a higher level of realized gains oninvestment securities. Net earnings in both years were also favor-ably affected by improved conditions in the Mortgage Insurancebusiness, the result of improvements in loss experience.
Within GE Global Insurance, the principal subsidiary of which is Employers Reinsurance Corporation, net premiums earnedincreased in 1998, primarily as a result of core and acquisitiongrowth in both the property and casualty and life businesses. GE Global Insurance property and casualty underwriting resultsimproved in 1998, reflecting a general reduction in incurred lossescaused by a decline in both the frequency and overall severity ofclaims, partially offset by the effects of hurricane and otherweather-related catastrophe losses. GE Global Insurance net pre-miums earned on U.S. business increased in 1997 — the result ofstrong growth in the life reinsurance business — while net premi-ums earned on European business declined, reflecting the effectsof currency translation and market conditions. Property and casu-alty underwriting results at GE Global Insurance decreased in1997, reflecting increased underwriting and operating expensesand adverse European market conditions, offset by growth in thelife reinsurance business.
All other GECS revenues and net earnings in 1997 includedasset gains, the largest of which was $284 million (net of tax) froma transaction that included the reduction of the GECS investmentin the common stock of Paine Webber Group Inc.
Financing receivables are the largest GECS asset and one of its primary sources of revenues. The portfolio of financing receiv-ables, before allowance for losses, increased to $124.9 billion atthe end of 1998 from $106.6 billion at the end of 1997, principallyreflecting acquisition growth and origination volume that werepartially offset by securitizations and other sales of receivables.The related allowance for losses at the end of 1998 amounted to$3.3 billion ($2.8 billion at the end of 1997) and, in management’sjudgment, is appropriate given the risk profile of the portfolio.
A discussion of the quality of certain elements of the financingreceivable portfolio follows. “Nonearning” receivables are thosethat are 90 days or more delinquent (or for which collection hasotherwise become doubtful) and “reduced-earning” receivablesare commercial receivables whose terms have been restructuredto a below-market yield. The following discussion of the nonearn-ing and reduced-earning receivable balances and write-offamounts excludes amounts related to Montgomery Ward HoldingCorp. and affiliates, which are separately discussed on page 40.
Consumer financing receivables at year-end 1998 and 1997 areshown in the following table.
(In millions) 1998 1997
Credit card and personal loans $ 28,064 $ 25,773Auto loans 9,496 8,973Auto financing leases 14,063 13,346
Total consumer financing receivables $ 51,623 $ 48,092Nonearning $ 1,250 $ 1,049
— As percentage of total 2.4% 2.2%
Receivable write-offs for the year $ 1,357 $ 1,298
The increase in credit card and personal loan portfolios primar-ily resulted from acquisition growth and origination volume, par-tially offset by securitizations and other sales of receivables.
0
.8
1.6
2.4
3.2
$ 4.0
0.0
0.8
1.6
2.4
3.2
4.0
GECS net earnings from continuing operations
(In billions)
19981997199619951994
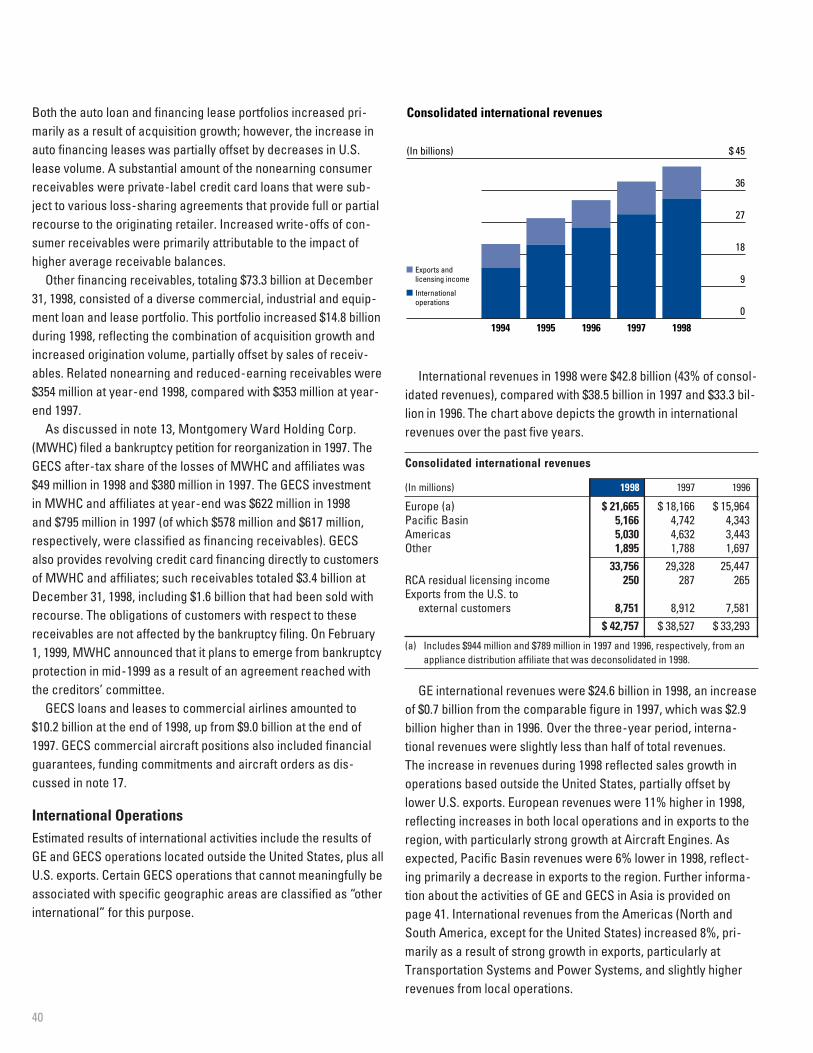
40
Both the auto loan and financing lease portfolios increased pri-marily as a result of acquisition growth; however, the increase inauto financing leases was partially offset by decreases in U.S.lease volume. A substantial amount of the nonearning consumerreceivables were private-label credit card loans that were sub-ject to various loss-sharing agreements that provide full or partialrecourse to the originating retailer. Increased write-offs of con-sumer receivables were primarily attributable to the impact ofhigher average receivable balances.
Other financing receivables, totaling $73.3 billion at December31, 1998, consisted of a diverse commercial, industrial and equip-ment loan and lease portfolio. This portfolio increased $14.8 billionduring 1998, reflecting the combination of acquisition growth andincreased origination volume, partially offset by sales of receiv-ables. Related nonearning and reduced-earning receivables were$354 million at year-end 1998, compared with $353 million at year-end 1997.
As discussed in note 13, Montgomery Ward Holding Corp.(MWHC) filed a bankruptcy petition for reorganization in 1997. TheGECS after-tax share of the losses of MWHC and affiliates was$49 million in 1998 and $380 million in 1997. The GECS investment in MWHC and affiliates at year-end was $622 million in 1998 and $795 million in 1997 (of which $578 million and $617 million,respectively, were classified as financing receivables). GECS also provides revolving credit card financing directly to customersof MWHC and affiliates; such receivables totaled $3.4 billion atDecember 31, 1998, including $1.6 billion that had been sold withrecourse. The obligations of customers with respect to thesereceivables are not affected by the bankruptcy filing. On February1, 1999, MWHC announced that it plans to emerge from bankruptcyprotection in mid-1999 as a result of an agreement reached withthe creditors’ committee.
GECS loans and leases to commercial airlines amounted to$10.2 billion at the end of 1998, up from $9.0 billion at the end of1997. GECS commercial aircraft positions also included financialguarantees, funding commitments and aircraft orders as dis-cussed in note 17.
International OperationsEstimated results of international activities include the results ofGE and GECS operations located outside the United States, plus allU.S. exports. Certain GECS operations that cannot meaningfully beassociated with specific geographic areas are classified as “otherinternational” for this purpose.
International revenues in 1998 were $42.8 billion (43% of consol-idated revenues), compared with $38.5 billion in 1997 and $33.3 bil-lion in 1996. The chart above depicts the growth in internationalrevenues over the past five years.
Consolidated international revenues
(In millions) 1998 1997 1996
Europe (a) $ 21,665 $ 18,166 $ 15,964Pacific Basin 5,166 4,742 4,343Americas 5,030 4,632 3,443Other 1,895 1,788 1,697
33,756 29,328 25,447RCA residual licensing income 250 287 265Exports from the U.S. to
external customers 8,751 8,912 7,581$ 42,757 $ 38,527 $ 33,293
(a) Includes $944 million and $789 million in 1997 and 1996, respectively, from anappliance distribution affiliate that was deconsolidated in 1998.
GE international revenues were $24.6 billion in 1998, an increaseof $0.7 billion from the comparable figure in 1997, which was $2.9billion higher than in 1996. Over the three-year period, interna-tional revenues were slightly less than half of total revenues. The increase in revenues during 1998 reflected sales growth inoperations based outside the United States, partially offset bylower U.S. exports. European revenues were 11% higher in 1998,reflecting increases in both local operations and in exports to theregion, with particularly strong growth at Aircraft Engines. Asexpected, Pacific Basin revenues were 6% lower in 1998, reflect-ing primarily a decrease in exports to the region. Further informa-tion about the activities of GE and GECS in Asia is provided onpage 41. International revenues from the Americas (North andSouth America, except for the United States) increased 8%, pri-marily as a result of strong growth in exports, particularly atTransportation Systems and Power Systems, and slightly higherrevenues from local operations.
0
9
18
27
36
$ 45
0
9
18
27
36
45
Exports andlicensing income
Internationaloperations
Consolidated international revenues
(In billions)
19981997199619951994
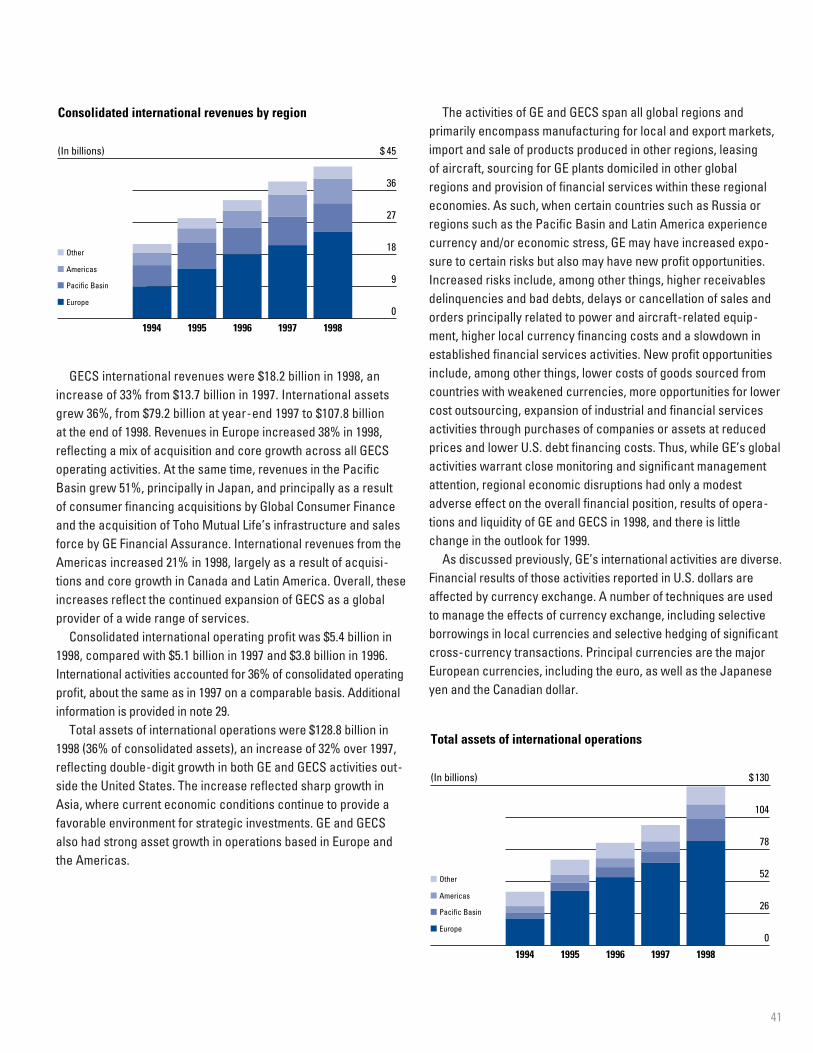
41
GECS international revenues were $18.2 billion in 1998, anincrease of 33% from $13.7 billion in 1997. International assetsgrew 36%, from $79.2 billion at year-end 1997 to $107.8 billion at the end of 1998. Revenues in Europe increased 38% in 1998,reflecting a mix of acquisition and core growth across all GECSoperating activities. At the same time, revenues in the PacificBasin grew 51%, principally in Japan, and principally as a result of consumer financing acquisitions by Global Consumer Financeand the acquisition of Toho Mutual Life’s infrastructure and salesforce by GE Financial Assurance. International revenues from theAmericas increased 21% in 1998, largely as a result of acquisi-tions and core growth in Canada and Latin America. Overall, theseincreases reflect the continued expansion of GECS as a globalprovider of a wide range of services.
Consolidated international operating profit was $5.4 billion in1998, compared with $5.1 billion in 1997 and $3.8 billion in 1996.International activities accounted for 36% of consolidated operatingprofit, about the same as in 1997 on a comparable basis. Additionalinformation is provided in note 29.
Total assets of international operations were $128.8 billion in1998 (36% of consolidated assets), an increase of 32% over 1997,reflecting double-digit growth in both GE and GECS activities out-side the United States. The increase reflected sharp growth inAsia, where current economic conditions continue to provide afavorable environment for strategic investments. GE and GECSalso had strong asset growth in operations based in Europe andthe Americas.
The activities of GE and GECS span all global regions and primarily encompass manufacturing for local and export markets,import and sale of products produced in other regions, leasing of aircraft, sourcing for GE plants domiciled in other global regions and provision of financial services within these regionaleconomies. As such, when certain countries such as Russia orregions such as the Pacific Basin and Latin America experiencecurrency and/or economic stress, GE may have increased expo-sure to certain risks but also may have new profit opportunities.Increased risks include, among other things, higher receivablesdelinquencies and bad debts, delays or cancellation of sales andorders principally related to power and aircraft-related equip-ment, higher local currency financing costs and a slowdown inestablished financial services activities. New profit opportunitiesinclude, among other things, lower costs of goods sourced fromcountries with weakened currencies, more opportunities for lowercost outsourcing, expansion of industrial and financial servicesactivities through purchases of companies or assets at reducedprices and lower U.S. debt financing costs. Thus, while GE’s globalactivities warrant close monitoring and significant managementattention, regional economic disruptions had only a modestadverse effect on the overall financial position, results of opera-tions and liquidity of GE and GECS in 1998, and there is littlechange in the outlook for 1999.
As discussed previously, GE’s international activities are diverse.Financial results of those activities reported in U.S. dollars areaffected by currency exchange. A number of techniques are usedto manage the effects of currency exchange, including selectiveborrowings in local currencies and selective hedging of significantcross-currency transactions. Principal currencies are the majorEuropean currencies, including the euro, as well as the Japaneseyen and the Canadian dollar.
0
26
52
78
104
$ 130
0
26
52
78
10
13
Pacific Basin
Europe
Other
Americas
Total assets of international operations
(In billions)
19981997199619951994
0
9
18
27
36
$ 45
0
9
18
27
36
45
Pacific Basin
Europe
Other
Americas
Consolidated international revenues by region
(In billions)
19981997199619951994
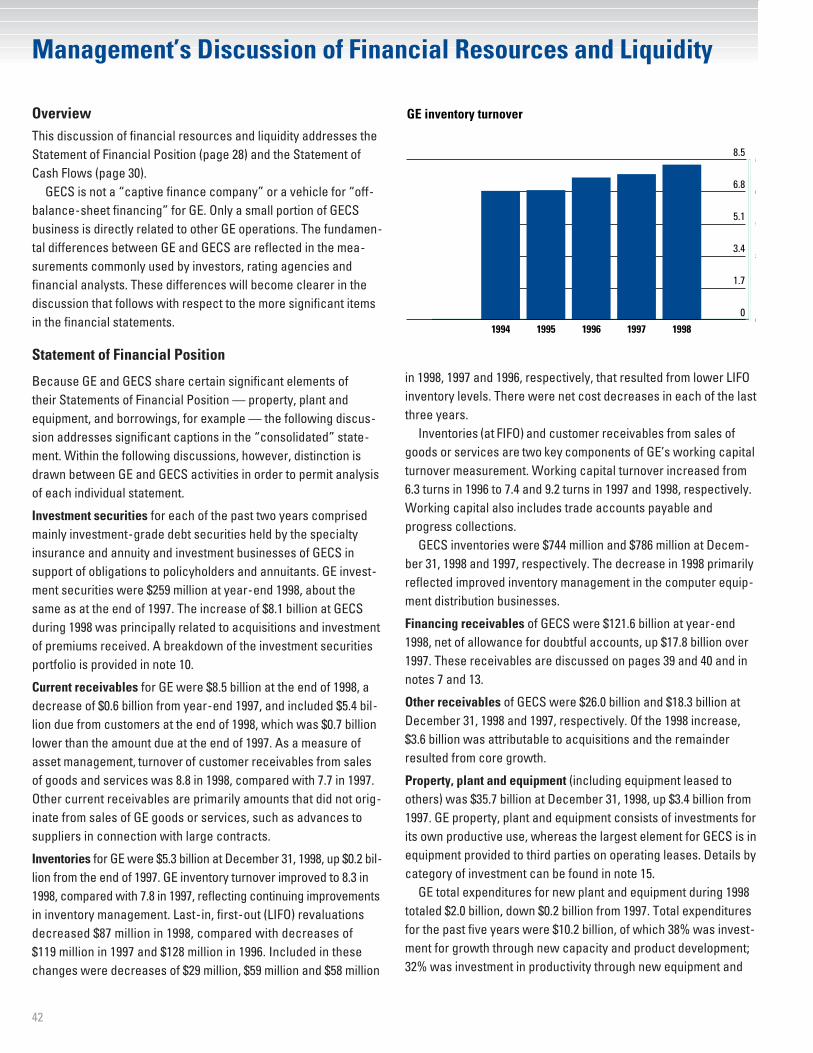
42
in 1998, 1997 and 1996, respectively, that resulted from lower LIFOinventory levels. There were net cost decreases in each of the lastthree years.
Inventories (at FIFO) and customer receivables from sales ofgoods or services are two key components of GE’s working capitalturnover measurement. Working capital turnover increased from6.3 turns in 1996 to 7.4 and 9.2 turns in 1997 and 1998, respectively.Working capital also includes trade accounts payable andprogress collections.
GECS inventories were $744 million and $786 million at Decem-ber 31, 1998 and 1997, respectively. The decrease in 1998 primarilyreflected improved inventory management in the computer equip-ment distribution businesses.
Financing receivables of GECS were $121.6 billion at year-end1998, net of allowance for doubtful accounts, up $17.8 billion over1997. These receivables are discussed on pages 39 and 40 and innotes 7 and 13.
Other receivables of GECS were $26.0 billion and $18.3 billion atDecember 31, 1998 and 1997, respectively. Of the 1998 increase,$3.6 billion was attributable to acquisitions and the remainderresulted from core growth.
Property, plant and equipment (including equipment leased to others) was $35.7 billion at December 31, 1998, up $3.4 billion from1997. GE property, plant and equipment consists of investments forits own productive use, whereas the largest element for GECS is inequipment provided to third parties on operating leases. Details bycategory of investment can be found in note 15.
GE total expenditures for new plant and equipment during 1998totaled $2.0 billion, down $0.2 billion from 1997. Total expendituresfor the past five years were $10.2 billion, of which 38% was invest-ment for growth through new capacity and product development;32% was investment in productivity through new equipment and
OverviewThis discussion of financial resources and liquidity addresses theStatement of Financial Position (page 28) and the Statement ofCash Flows (page 30).
GECS is not a “captive finance company” or a vehicle for “off-balance-sheet financing” for GE. Only a small portion of GECSbusiness is directly related to other GE operations. The fundamen-tal differences between GE and GECS are reflected in the mea-surements commonly used by investors, rating agencies andfinancial analysts. These differences will become clearer in thediscussion that follows with respect to the more significant itemsin the financial statements.
Statement of Financial Position
Because GE and GECS share certain significant elements of their Statements of Financial Position — property, plant andequipment, and borrowings, for example — the following discus-sion addresses significant captions in the “consolidated” state-ment. Within the following discussions, however, distinction isdrawn between GE and GECS activities in order to permit analysisof each individual statement.
Investment securities for each of the past two years comprisedmainly investment-grade debt securities held by the specialtyinsurance and annuity and investment businesses of GECS in support of obligations to policyholders and annuitants. GE invest-ment securities were $259 million at year-end 1998, about thesame as at the end of 1997. The increase of $8.1 billion at GECSduring 1998 was principally related to acquisitions and investmentof premiums received. A breakdown of the investment securitiesportfolio is provided in note 10.
Current receivables for GE were $8.5 billion at the end of 1998, adecrease of $0.6 billion from year-end 1997, and included $5.4 bil-lion due from customers at the end of 1998, which was $0.7 billionlower than the amount due at the end of 1997. As a measure ofasset management, turnover of customer receivables from sales of goods and services was 8.8 in 1998, compared with 7.7 in 1997.Other current receivables are primarily amounts that did not orig-inate from sales of GE goods or services, such as advances tosuppliers in connection with large contracts.
Inventories for GE were $5.3 billion at December 31, 1998, up $0.2 bil-lion from the end of 1997. GE inventory turnover improved to 8.3 in1998, compared with 7.8 in 1997, reflecting continuing improvementsin inventory management. Last-in, first-out (LIFO) revaluationsdecreased $87 million in 1998, compared with decreases of $119 million in 1997 and $128 million in 1996. Included in thesechanges were decreases of $29 million, $59 million and $58 million
0
1.7
3.4
5.1
6.8
8.5
0
3
5
6
8
GE inventory turnover
19981997199619951994
Management’s Discussion of Financial Resources and Liquidity
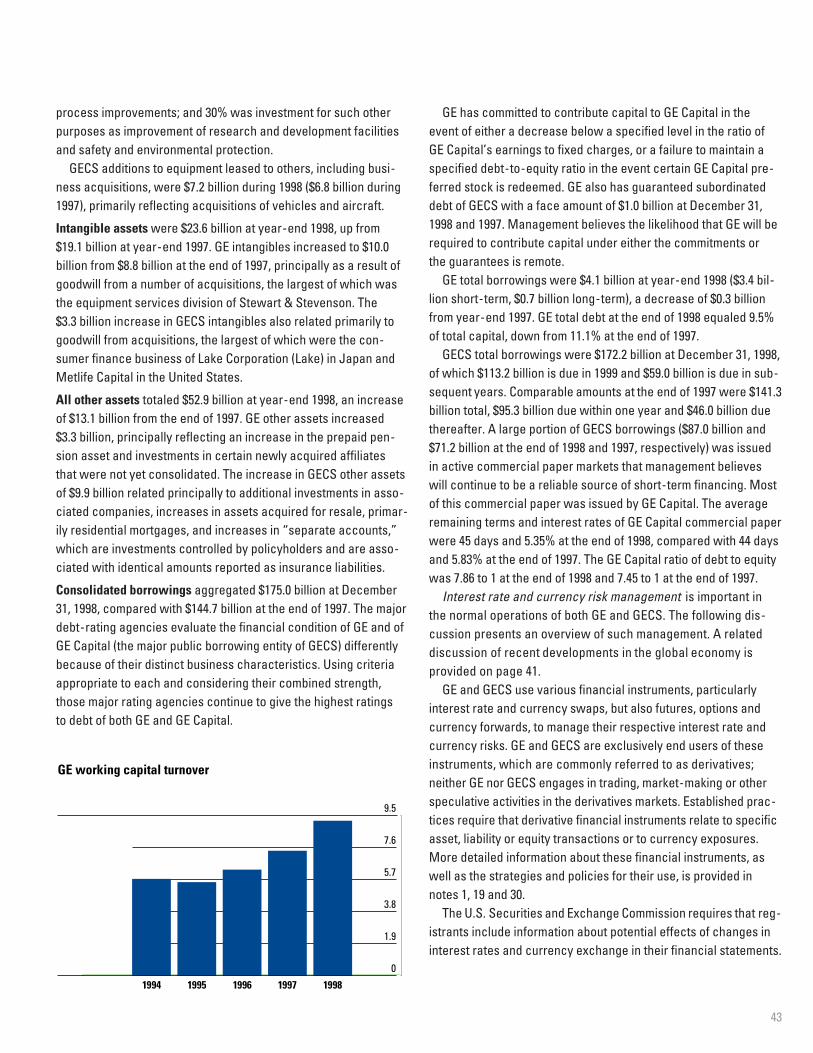
43
process improvements; and 30% was investment for such otherpurposes as improvement of research and development facilitiesand safety and environmental protection.
GECS additions to equipment leased to others, including busi-ness acquisitions, were $7.2 billion during 1998 ($6.8 billion during1997), primarily reflecting acquisitions of vehicles and aircraft.
Intangible assets were $23.6 billion at year-end 1998, up from$19.1 billion at year-end 1997. GE intangibles increased to $10.0billion from $8.8 billion at the end of 1997, principally as a result ofgoodwill from a number of acquisitions, the largest of which wasthe equipment services division of Stewart & Stevenson. The $3.3 billion increase in GECS intangibles also related primarily togoodwill from acquisitions, the largest of which were the con-sumer finance business of Lake Corporation (Lake) in Japan andMetlife Capital in the United States.
All other assets totaled $52.9 billion at year-end 1998, an increaseof $13.1 billion from the end of 1997. GE other assets increased $3.3 billion, principally reflecting an increase in the prepaid pen-sion asset and investments in certain newly acquired affiliatesthat were not yet consolidated. The increase in GECS other assetsof $9.9 billion related principally to additional investments in asso-ciated companies, increases in assets acquired for resale, primar-ily residential mortgages, and increases in “separate accounts,”which are investments controlled by policyholders and are asso-ciated with identical amounts reported as insurance liabilities.
Consolidated borrowings aggregated $175.0 billion at December31, 1998, compared with $144.7 billion at the end of 1997. The majordebt-rating agencies evaluate the financial condition of GE and ofGE Capital (the major public borrowing entity of GECS) differentlybecause of their distinct business characteristics. Using criteriaappropriate to each and considering their combined strength,those major rating agencies continue to give the highest ratings to debt of both GE and GE Capital.
GE has committed to contribute capital to GE Capital in theevent of either a decrease below a specified level in the ratio ofGE Capital’s earnings to fixed charges, or a failure to maintain aspecified debt-to-equity ratio in the event certain GE Capital pre-ferred stock is redeemed. GE also has guaranteed subordinateddebt of GECS with a face amount of $1.0 billion at December 31,1998 and 1997. Management believes the likelihood that GE will berequired to contribute capital under either the commitments or the guarantees is remote.
GE total borrowings were $4.1 billion at year-end 1998 ($3.4 bil-lion short-term, $0.7 billion long-term), a decrease of $0.3 billionfrom year-end 1997. GE total debt at the end of 1998 equaled 9.5%of total capital, down from 11.1% at the end of 1997.
GECS total borrowings were $172.2 billion at December 31, 1998,of which $113.2 billion is due in 1999 and $59.0 billion is due in sub-sequent years. Comparable amounts at the end of 1997 were $141.3billion total, $95.3 billion due within one year and $46.0 billion duethereafter. A large portion of GECS borrowings ($87.0 billion and$71.2 billion at the end of 1998 and 1997, respectively) was issuedin active commercial paper markets that management believeswill continue to be a reliable source of short-term financing. Mostof this commercial paper was issued by GE Capital. The averageremaining terms and interest rates of GE Capital commercial paperwere 45 days and 5.35% at the end of 1998, compared with 44 daysand 5.83% at the end of 1997. The GE Capital ratio of debt to equitywas 7.86 to 1 at the end of 1998 and 7.45 to 1 at the end of 1997.
Interest rate and currency risk management is important in the normal operations of both GE and GECS. The following dis-cussion presents an overview of such management. A relateddiscussion of recent developments in the global economy isprovided on page 41.
GE and GECS use various financial instruments, particularlyinterest rate and currency swaps, but also futures, options andcurrency forwards, to manage their respective interest rate andcurrency risks. GE and GECS are exclusively end users of theseinstruments, which are commonly referred to as derivatives; neither GE nor GECS engages in trading, market-making or otherspeculative activities in the derivatives markets. Established prac-tices require that derivative financial instruments relate to specificasset, liability or equity transactions or to currency exposures.More detailed information about these financial instruments, aswell as the strategies and policies for their use, is provided innotes 1, 19 and 30.
The U.S. Securities and Exchange Commission requires that reg-istrants include information about potential effects of changes ininterest rates and currency exchange in their financial statements.
0
1.9
3.8
5.7
7.6
9.5
GE working capital turnover
19981997199619951994
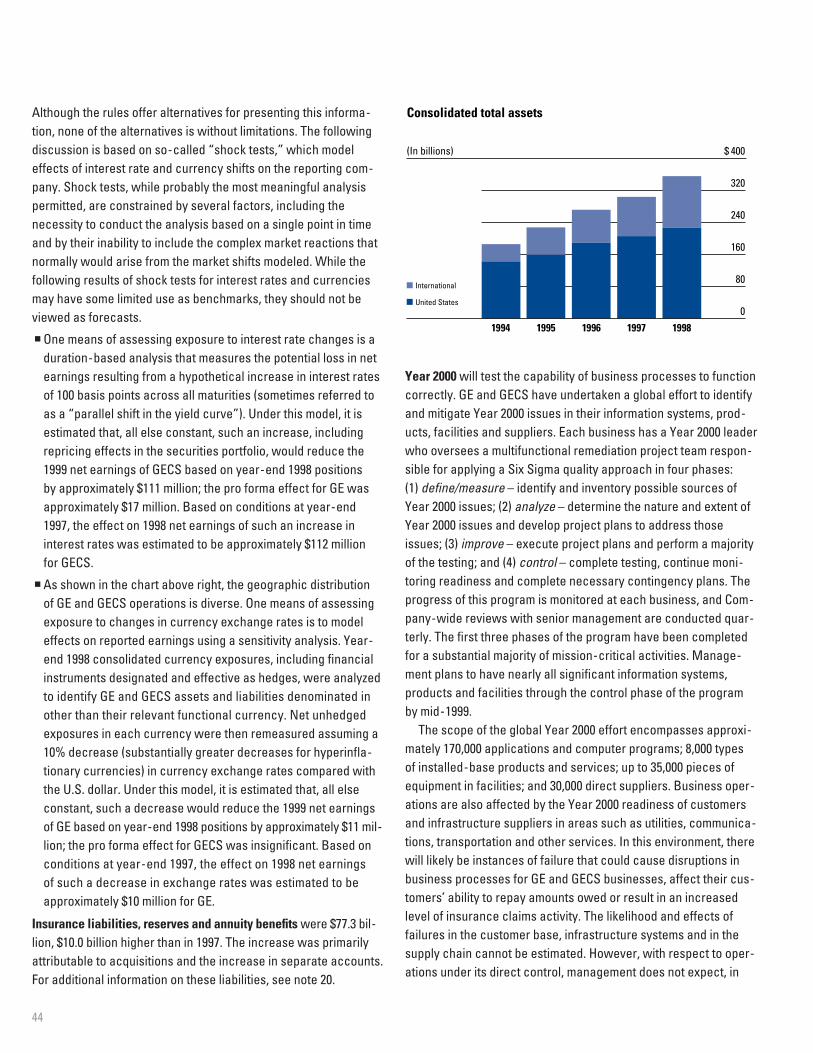
44
Although the rules offer alternatives for presenting this informa-tion, none of the alternatives is without limitations. The followingdiscussion is based on so-called “shock tests,” which modeleffects of interest rate and currency shifts on the reporting com-pany. Shock tests, while probably the most meaningful analysispermitted, are constrained by several factors, including thenecessity to conduct the analysis based on a single point in timeand by their inability to include the complex market reactions thatnormally would arise from the market shifts modeled. While thefollowing results of shock tests for interest rates and currenciesmay have some limited use as benchmarks, they should not beviewed as forecasts.
n One means of assessing exposure to interest rate changes is aduration-based analysis that measures the potential loss in netearnings resulting from a hypothetical increase in interest ratesof 100 basis points across all maturities (sometimes referred toas a “parallel shift in the yield curve”). Under this model, it isestimated that, all else constant, such an increase, includingrepricing effects in the securities portfolio, would reduce the1999 net earnings of GECS based on year-end 1998 positions by approximately $111 million; the pro forma effect for GE wasapproximately $17 million. Based on conditions at year-end1997, the effect on 1998 net earnings of such an increase ininterest rates was estimated to be approximately $112 million for GECS.
n As shown in the chart above right, the geographic distribution of GE and GECS operations is diverse. One means of assessingexposure to changes in currency exchange rates is to modeleffects on reported earnings using a sensitivity analysis. Year-end 1998 consolidated currency exposures, including financialinstruments designated and effective as hedges, were analyzedto identify GE and GECS assets and liabilities denominated inother than their relevant functional currency. Net unhedgedexposures in each currency were then remeasured assuming a10% decrease (substantially greater decreases for hyperinfla-tionary currencies) in currency exchange rates compared withthe U.S. dollar. Under this model, it is estimated that, all elseconstant, such a decrease would reduce the 1999 net earningsof GE based on year-end 1998 positions by approximately $11 mil-lion; the pro forma effect for GECS was insignificant. Based onconditions at year-end 1997, the effect on 1998 net earnings of such a decrease in exchange rates was estimated to beapproximately $10 million for GE.
Insurance liabilities, reserves and annuity benefits were $77.3 bil-lion, $10.0 billion higher than in 1997. The increase was primarilyattributable to acquisitions and the increase in separate accounts.For additional information on these liabilities, see note 20.
Year 2000 will test the capability of business processes to functioncorrectly. GE and GECS have undertaken a global effort to identifyand mitigate Year 2000 issues in their information systems, prod-ucts, facilities and suppliers. Each business has a Year 2000 leaderwho oversees a multifunctional remediation project team respon-sible for applying a Six Sigma quality approach in four phases: (1) define/measure – identify and inventory possible sources ofYear 2000 issues; (2) analyze – determine the nature and extent ofYear 2000 issues and develop project plans to address thoseissues; (3) improve – execute project plans and perform a majorityof the testing; and (4) control – complete testing, continue moni-toring readiness and complete necessary contingency plans. Theprogress of this program is monitored at each business, and Com-pany-wide reviews with senior management are conducted quar-terly. The first three phases of the program have been completedfor a substantial majority of mission-critical activities. Manage-ment plans to have nearly all significant information systems,products and facilities through the control phase of the programby mid-1999.
The scope of the global Year 2000 effort encompasses approxi-mately 170,000 applications and computer programs; 8,000 types of installed-base products and services; up to 35,000 pieces ofequipment in facilities; and 30,000 direct suppliers. Business oper-ations are also affected by the Year 2000 readiness of customersand infrastructure suppliers in areas such as utilities, communica-tions, transportation and other services. In this environment, therewill likely be instances of failure that could cause disruptions inbusiness processes for GE and GECS businesses, affect their cus-tomers’ ability to repay amounts owed or result in an increasedlevel of insurance claims activity. The likelihood and effects of failures in the customer base, infrastructure systems and in thesupply chain cannot be estimated. However, with respect to oper-ations under its direct control, management does not expect, in
0
80
160
240
320
$ 400
0
80
16
24
32
40
International
United States
Consolidated total assets
(In billions)
19981997199619951994
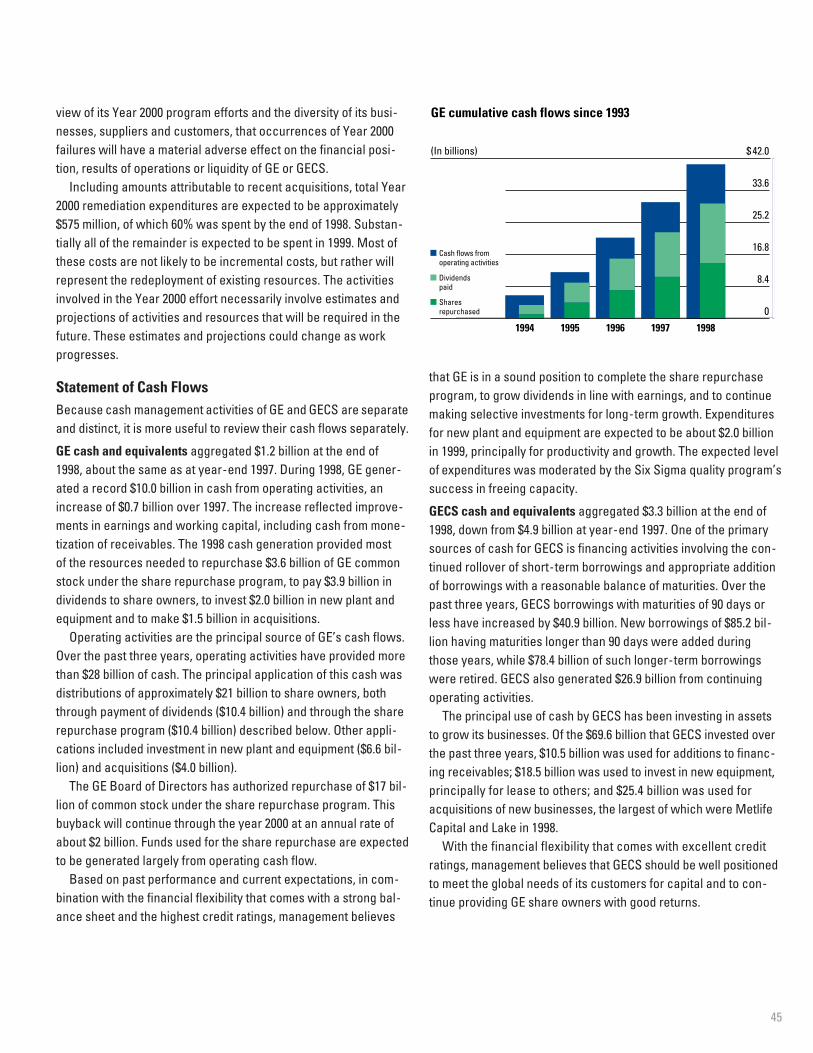
45
view of its Year 2000 program efforts and the diversity of its busi-nesses, suppliers and customers, that occurrences of Year 2000failures will have a material adverse effect on the financial posi-tion, results of operations or liquidity of GE or GECS.
Including amounts attributable to recent acquisitions, total Year2000 remediation expenditures are expected to be approximately$575 million, of which 60% was spent by the end of 1998. Substan-tially all of the remainder is expected to be spent in 1999. Most ofthese costs are not likely to be incremental costs, but rather willrepresent the redeployment of existing resources. The activitiesinvolved in the Year 2000 effort necessarily involve estimates andprojections of activities and resources that will be required in thefuture. These estimates and projections could change as workprogresses.
Statement of Cash FlowsBecause cash management activities of GE and GECS are separateand distinct, it is more useful to review their cash flows separately.
GE cash and equivalents aggregated $1.2 billion at the end of 1998, about the same as at year-end 1997. During 1998, GE gener-ated a record $10.0 billion in cash from operating activities, anincrease of $0.7 billion over 1997. The increase reflected improve-ments in earnings and working capital, including cash from mone-tization of receivables. The 1998 cash generation provided most of the resources needed to repurchase $3.6 billion of GE commonstock under the share repurchase program, to pay $3.9 billion individends to share owners, to invest $2.0 billion in new plant andequipment and to make $1.5 billion in acquisitions.
Operating activities are the principal source of GE’s cash flows.Over the past three years, operating activities have provided morethan $28 billion of cash. The principal application of this cash wasdistributions of approximately $21 billion to share owners, boththrough payment of dividends ($10.4 billion) and through the sharerepurchase program ($10.4 billion) described below. Other appli-cations included investment in new plant and equipment ($6.6 bil-lion) and acquisitions ($4.0 billion).
The GE Board of Directors has authorized repurchase of $17 bil-lion of common stock under the share repurchase program. Thisbuyback will continue through the year 2000 at an annual rate ofabout $2 billion. Funds used for the share repurchase are expectedto be generated largely from operating cash flow.
Based on past performance and current expectations, in com-bination with the financial flexibility that comes with a strong bal-ance sheet and the highest credit ratings, management believes
that GE is in a sound position to complete the share repurchaseprogram, to grow dividends in line with earnings, and to continuemaking selective investments for long-term growth. Expendituresfor new plant and equipment are expected to be about $2.0 billionin 1999, principally for productivity and growth. The expected levelof expenditures was moderated by the Six Sigma quality program’ssuccess in freeing capacity.
GECS cash and equivalents aggregated $3.3 billion at the end of1998, down from $4.9 billion at year-end 1997. One of the primarysources of cash for GECS is financing activities involving the con-tinued rollover of short-term borrowings and appropriate additionof borrowings with a reasonable balance of maturities. Over thepast three years, GECS borrowings with maturities of 90 days orless have increased by $40.9 billion. New borrowings of $85.2 bil-lion having maturities longer than 90 days were added duringthose years, while $78.4 billion of such longer-term borrowingswere retired. GECS also generated $26.9 billion from continuingoperating activities.
The principal use of cash by GECS has been investing in assetsto grow its businesses. Of the $69.6 billion that GECS invested overthe past three years, $10.5 billion was used for additions to financ-ing receivables; $18.5 billion was used to invest in new equipment,principally for lease to others; and $25.4 billion was used foracquisitions of new businesses, the largest of which were MetlifeCapital and Lake in 1998.
With the financial flexibility that comes with excellent credit ratings, management believes that GECS should be well positionedto meet the global needs of its customers for capital and to con-tinue providing GE share owners with good returns.
0
8.4
16.8
25.2
33.6
$ 42.0
Dividends paid
Cash flows fromoperating activities
Sharesrepurchased
0
8
1
2
3
4
GE cumulative cash flows since 1993
(In billions)
19981997199619951994
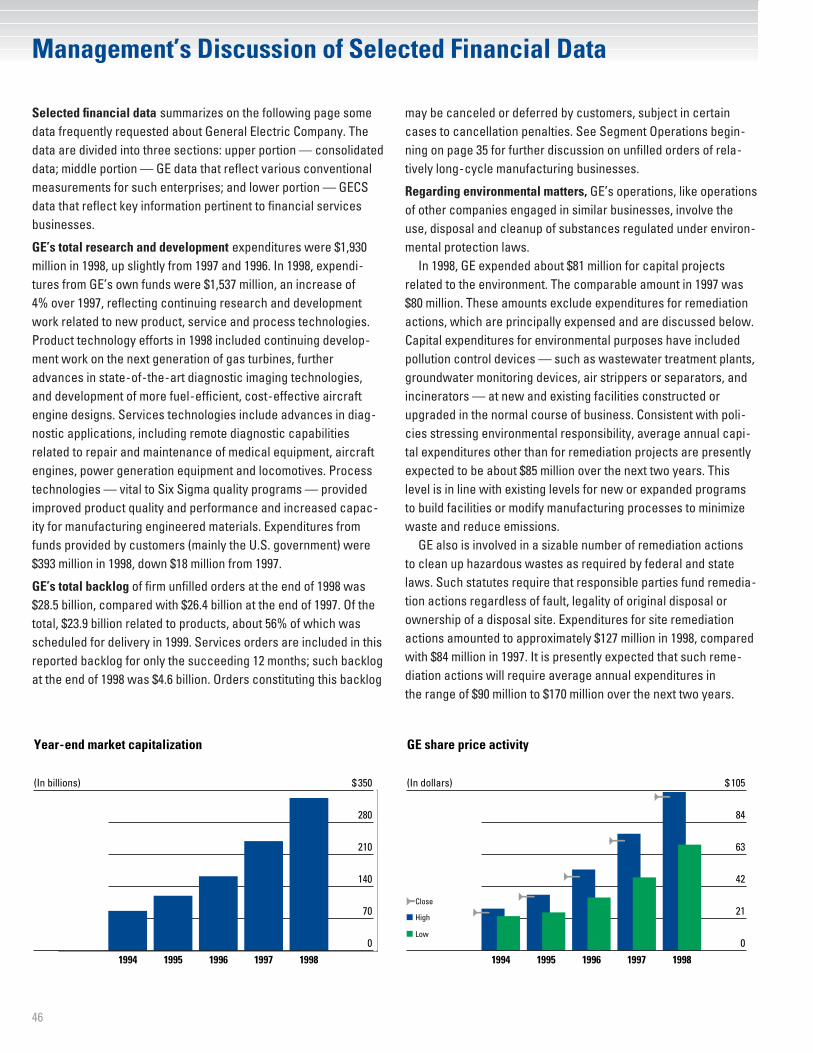
46
0
21
42
63
84
$ 105
GE share price activity
(In dollars)
19981997199619951994
High
Low
Close
0
70
140
210
280
$ 350
0
7
1
2
2
3
Year-end market capitalization
(In billions)
19981997199619951994
Selected financial data summarizes on the following page somedata frequently requested about General Electric Company. Thedata are divided into three sections: upper portion — consolidateddata; middle portion — GE data that reflect various conventionalmeasurements for such enterprises; and lower portion — GECSdata that reflect key information pertinent to financial servicesbusinesses.
GE’s total research and development expenditures were $1,930million in 1998, up slightly from 1997 and 1996. In 1998, expendi-tures from GE’s own funds were $1,537 million, an increase of 4% over 1997, reflecting continuing research and developmentwork related to new product, service and process technologies.Product technology efforts in 1998 included continuing develop-ment work on the next generation of gas turbines, furtheradvances in state-of-the-art diagnostic imaging technologies,and development of more fuel-efficient, cost-effective aircraftengine designs. Services technologies include advances in diag-nostic applications, including remote diagnostic capabilitiesrelated to repair and maintenance of medical equipment, aircraftengines, power generation equipment and locomotives. Processtechnologies — vital to Six Sigma quality programs — providedimproved product quality and performance and increased capac-ity for manufacturing engineered materials. Expenditures fromfunds provided by customers (mainly the U.S. government) were$393 million in 1998, down $18 million from 1997.
GE’s total backlog of firm unfilled orders at the end of 1998 was$28.5 billion, compared with $26.4 billion at the end of 1997. Of thetotal, $23.9 billion related to products, about 56% of which wasscheduled for delivery in 1999. Services orders are included in thisreported backlog for only the succeeding 12 months; such backlogat the end of 1998 was $4.6 billion. Orders constituting this backlog
may be canceled or deferred by customers, subject in certaincases to cancellation penalties. See Segment Operations begin-ning on page 35 for further discussion on unfilled orders of rela-tively long-cycle manufacturing businesses.
Regarding environmental matters, GE’s operations, like operationsof other companies engaged in similar businesses, involve theuse, disposal and cleanup of substances regulated under environ-mental protection laws.
In 1998, GE expended about $81 million for capital projectsrelated to the environment. The comparable amount in 1997 was$80 million. These amounts exclude expenditures for remediationactions, which are principally expensed and are discussed below.Capital expenditures for environmental purposes have includedpollution control devices — such as wastewater treatment plants,groundwater monitoring devices, air strippers or separators, andincinerators — at new and existing facilities constructed orupgraded in the normal course of business. Consistent with poli-cies stressing environmental responsibility, average annual capi-tal expenditures other than for remediation projects are presentlyexpected to be about $85 million over the next two years. This level is in line with existing levels for new or expanded programsto build facilities or modify manufacturing processes to minimizewaste and reduce emissions.
GE also is involved in a sizable number of remediation actions to clean up hazardous wastes as required by federal and statelaws. Such statutes require that responsible parties fund remedia-tion actions regardless of fault, legality of original disposal orownership of a disposal site. Expenditures for site remediationactions amounted to approximately $127 million in 1998, comparedwith $84 million in 1997. It is presently expected that such reme-diation actions will require average annual expenditures in the range of $90 million to $170 million over the next two years.
Management’s Discussion of Selected Financial Data
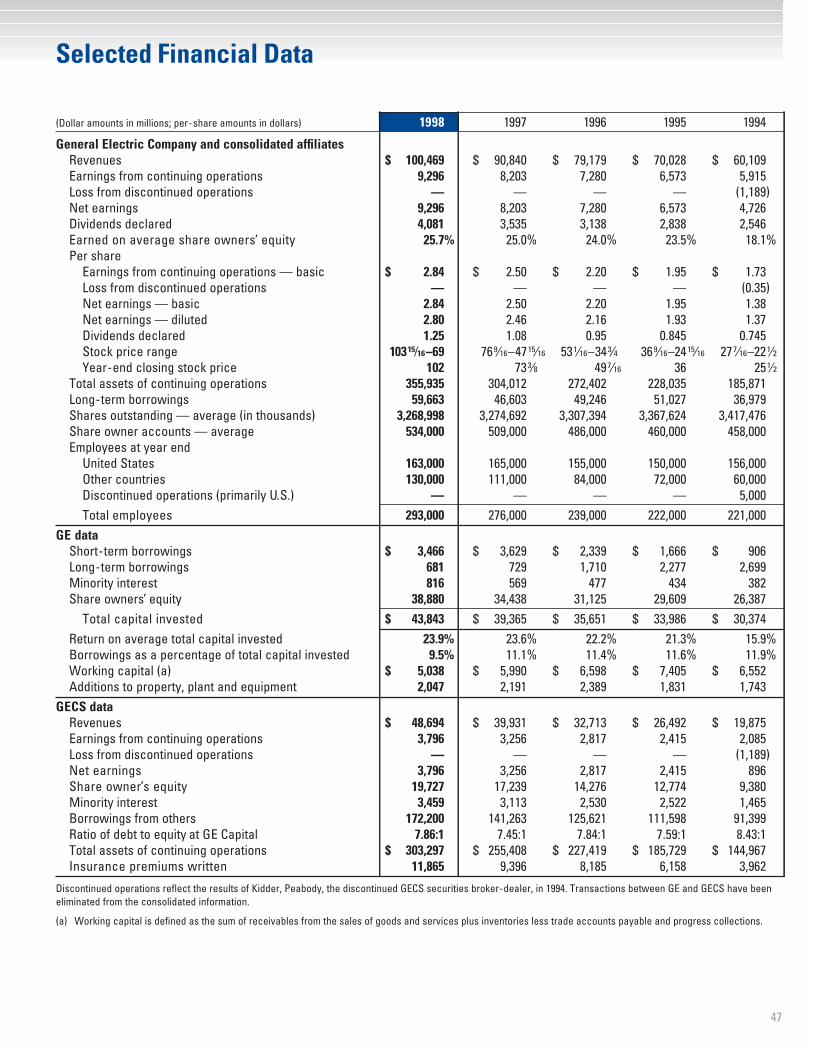
47
(Dollar amounts in millions; per-share amounts in dollars) 1998 1997 1996 1995 1994
General Electric Company and consolidated affiliatesRevenues $ 100,469 $ 90,840 $ 79,179 $ 70,028 $ 60,109Earnings from continuing operations 9,296 8,203 7,280 6,573 5,915Loss from discontinued operations — — — — (1,189)Net earnings 9,296 8,203 7,280 6,573 4,726Dividends declared 4,081 3,535 3,138 2,838 2,546Earned on average share owners’ equity 25.7% 25.0% 24.0% 23.5% 18.1%Per share
Earnings from continuing operations — basic $ 2.84 $ 2.50 $ 2.20 $ 1.95 $ 1.73Loss from discontinued operations — — — — (0.35)Net earnings — basic 2.84 2.50 2.20 1.95 1.38Net earnings — diluted 2.80 2.46 2.16 1.93 1.37Dividends declared 1.25 1.08 0.95 0.845 0.745Stock price range 103Æ–69 76¬–47Æ 53|–34· 36¬–24Æ 27Ò–22¤Year-end closing stock price 102 73‚ 49Ò 36 25¤
Total assets of continuing operations 355,935 304,012 272,402 228,035 185,871Long-term borrowings 59,663 46,603 49,246 51,027 36,979Shares outstanding — average (in thousands) 3,268,998 3,274,692 3,307,394 3,367,624 3,417,476Share owner accounts — average 534,000 509,000 486,000 460,000 458,000Employees at year end
United States 163,000 165,000 155,000 150,000 156,000Other countries 130,000 111,000 84,000 72,000 60,000Discontinued operations (primarily U.S.) — — — — 5,000Total employees 293,000 276,000 239,000 222,000 221,000
GE dataShort-term borrowings $ 3,466 $ 3,629 $ 2,339 $ 1,666 $ 906Long-term borrowings 681 729 1,710 2,277 2,699Minority interest 816 569 477 434 382Share owners’ equity 38,880 34,438 31,125 29,609 26,387
Total capital invested $ 43,843 $ 39,365 $ 35,651 $ 33,986 $ 30,374Return on average total capital invested 23.9% 23.6% 22.2% 21.3% 15.9%Borrowings as a percentage of total capital invested 9.5% 11.1% 11.4% 11.6% 11.9%Working capital (a) $ 5,038 $ 5,990 $ 6,598 $ 7,405 $ 6,552Additions to property, plant and equipment 2,047 2,191 2,389 1,831 1,743
GECS dataRevenues $ 48,694 $ 39,931 $ 32,713 $ 26,492 $ 19,875Earnings from continuing operations 3,796 3,256 2,817 2,415 2,085Loss from discontinued operations — — — — (1,189)Net earnings 3,796 3,256 2,817 2,415 896Share owner’s equity 19,727 17,239 14,276 12,774 9,380Minority interest 3,459 3,113 2,530 2,522 1,465Borrowings from others 172,200 141,263 125,621 111,598 91,399Ratio of debt to equity at GE Capital 7.86:1 7.45:1 7.84:1 7.59:1 8.43:1Total assets of continuing operations $ 303,297 $ 255,408 $ 227,419 $ 185,729 $ 144,967Insurance premiums written 11,865 9,396 8,185 6,158 3,962
Discontinued operations reflect the results of Kidder, Peabody, the discontinued GECS securities broker-dealer, in 1994. Transactions between GE and GECS have beeneliminated from the consolidated information.
(a) Working capital is defined as the sum of receivables from the sales of goods and services plus inventories less trade accounts payable and progress collections.
Selected Financial Data
48
1 Summary of Significant Accounting Policies
Consolidation. The consolidated financial statements representthe adding together of all affiliates — companies that GeneralElectric directly or indirectly controls. Results of associated com-panies — generally companies that are 20% to 50% owned andover which GE, directly or indirectly, has significant influence —are included in the financial statements on a “one-line” basis.
Financial statement presentation. Financial data and related measurements are presented in the following categories. n GE. This represents the adding together of all affiliates other
than General Electric Capital Services, Inc. (GECS), whose oper-ations are presented on a one-line basis.
n GECS. This affiliate owns all of the common stock of GeneralElectric Capital Corporation (GE Capital) and GE Global Insur-ance Holding Corporation (GE Global Insurance). GE Capital, GE Global Insurance and their respective affiliates are consoli-dated in the GECS columns and constitute its business.
n Consolidated. This represents the adding together of GE and GECS.
The effects of transactions among related companies within andbetween each of the above-mentioned groups are eliminated.Transactions between GE and GECS are not material.
Certain prior-year amounts have been reclassified to conformto the 1998 presentation.
The preparation of financial statements in conformity with generally accepted accounting principles requires management to make estimates and assumptions that affect reported amountsand related disclosures. Actual results could differ from thoseestimates.
Sales of goods and services. A sale is recorded when title passesto the customer or when services are performed in accordancewith contracts.
GECS revenues from services (earned income). Income on allloans is recognized on the interest method. Accrual of interestincome is suspended at the earlier of the time at which collectionof an account becomes doubtful or the account becomes 90 daysdelinquent. Interest income on impaired loans is recognizedeither as cash is collected or on a cost-recovery basis as condi-tions warrant.
Financing lease income is recorded on the interest method soas to produce a level yield on funds not yet recovered. Estimatedunguaranteed residual values of leased assets are based primarilyon periodic independent appraisals of the values of leased assetsremaining at expiration of the lease terms.
Operating lease income is recognized on a straight-line basisover the terms of underlying leases.
Origination, commitment and other nonrefundable fees relatedto fundings are deferred and recorded in earned income on theinterest method. Commitment fees related to loans not expected tobe funded and line-of-credit fees are deferred and recorded inearned income on a straight-line basis over the period to whichthe fees relate. Syndication fees are recorded in earned income atthe time related services are performed unless significant contin-gencies exist.
Premium income from insurance activities is discussed underGECS insurance accounting policies on page 49.
Depreciation and amortization. The cost of most of GE’s manu-facturing plant and equipment is depreciated using an acceleratedmethod based primarily on a sum-of-the-years digits formula.
The cost of GECS equipment leased to others on operatingleases is amortized, principally on a straight-line basis, to esti-mated residual value over the lease term or over the estimatedeconomic life of the equipment. Depreciation of property andequipment used by GECS is recorded on either a sum-of-the-years digits formula or a straight-line basis over the lives of theassets.
Recognition of losses on financing receivables and investments.The allowance for losses on small-balance receivables is deter-mined principally on the basis of actual experience during the preceding three years. Further allowances are provided to reflectmanagement’s judgment of additional probable losses. For otherreceivables, principally the larger loans and leases, the allowancefor losses is determined primarily on the basis of management’sjudgment of net probable losses, including specific allowances for known troubled accounts.
All accounts or portions thereof deemed to be uncollectible or to require an excessive collection cost are written off to theallowance for losses. Small-balance accounts generally are written off when 6 to 12 months delinquent, although any such balance judged to be uncollectible, such as an account in bank-ruptcy, is written down immediately to estimated realizable value. Large-balance accounts are reviewed at least quarterly,and those accounts with amounts that are judged to be uncol-lectible are written down to estimated realizable value.
When collateral is repossessed in satisfaction of a loan, thereceivable is written down against the allowance for losses toestimated fair value of the asset less costs to sell, transferred toother assets and subsequently carried at the lower of cost or estimated fair value less costs to sell. This accounting method hasbeen employed principally for specialized financing transactions.
Notes to Consolidated Financial Statements
49
Cash and equivalents. Debt securities with original maturities of three months or less are included in cash equivalents unlessdesignated as available for sale and classified as investmentsecurities.
Investment securities. Investments in debt and marketable equitysecurities are reported at fair value. Substantially all investmentsecurities are designated as available for sale, with unrealizedgains and losses included in share owners’ equity, net of applica-ble taxes and other adjustments. Unrealized losses that are otherthan temporary are recognized in earnings. Realized gains andlosses are accounted for on the specific identification method.
Inventories. All inventories are stated at the lower of cost or realizable values. Cost for virtually all of GE’s U.S. inventories isdetermined on a last-in, first-out (LIFO) basis. Cost of other GE inventories is primarily determined on a first-in, first-out (FIFO) basis.
GECS inventories consist primarily of finished products held for sale. Cost is primarily determined on a FIFO basis.
Intangible assets. Goodwill is amortized over its estimated periodof benefit on a straight-line basis; other intangible assets, includ-ing internal-use software, are amortized on appropriate basesover their estimated lives. No amortization period exceeds 40years. Goodwill in excess of associated expected operating cashflows is considered to be impaired and is written down to fairvalue, which is determined based on either discounted future cashflows or appraised values, depending on the nature of the asset.
Interest rate and currency risk management. As a matter of policy,neither GE nor GECS engages in derivatives trading, derivativesmarket-making or other speculative activities.
GE and GECS use swaps primarily to optimize funding costs. To a lesser degree, and in combination with options and limit contracts, GECS uses swaps to stabilize cash flows from mort-gage-related assets.
Interest rate and currency swaps that modify borrowings ordesignated assets, including swaps associated with forecastedcommercial paper renewals, are accounted for on an accrualbasis. Both GE and GECS require all other swaps, as well asfutures, options and currency forwards, to be designated andaccounted for as hedges of specific assets, liabilities or commit-ted transactions; resulting payments and receipts are recognizedcontemporaneously with effects of hedged transactions. A pay-ment or receipt arising from early termination of an effectivehedge is accounted for as an adjustment to the basis of thehedged transaction.
Instruments used as hedges must be effective at reducing therisk associated with the exposure being hedged and must be designated as a hedge at the inception of the contract. Accord-ingly, changes in market values of hedge instruments must behighly correlated with changes in market values of underlyinghedged items, both at inception of the hedge and over the life ofthe hedge contract.
As a matter of policy, any derivative that is either not desig-nated as a hedge, or is so designated but is ineffective, is markedto market and recognized in operations immediately.
GECS insurance accounting policies. Accounting policies forGECS insurance businesses follow.
Premium income. Insurance premiums are reported as earnedincome as follows:n For short-duration insurance contracts (including property
and casualty, accident and health, and financial guaranty insur-ance), premiums are reported as earned income, generally on a pro rata basis, over the terms of the related agreements.For retrospectively rated reinsurance contracts, premiumadjustments are recorded based on estimated losses and lossexpenses, taking into consideration both case and incurred-but-not-reported reserves.
n For traditional long-duration insurance contracts (includingterm and whole life contracts and annuities payable for the lifeof the annuitant), premiums are reported as earned incomewhen due.
n For investment contracts and universal life contracts, premiumsreceived are reported as liabilities, not as revenues. Universallife contracts are long-duration insurance contracts with termsthat are not fixed and guaranteed; for these contracts, revenuesare recognized for assessments against the policyholder’saccount, mostly for mortality, contract initiation, administrationand surrender. Investment contracts are contracts that haveneither significant mortality nor significant morbidity risk,including annuities payable for a determined period; for thesecontracts, revenues are recognized on the associated invest-ments and amounts credited to policyholder accounts arecharged to expense.
Deferred policy acquisition costs. Costs that vary with and areprimarily related to the acquisition of new and renewal insuranceand investment contracts are deferred and amortized over therespective policy terms. For short-duration insurance contracts,acquisition costs consist primarily of commissions, brokerage
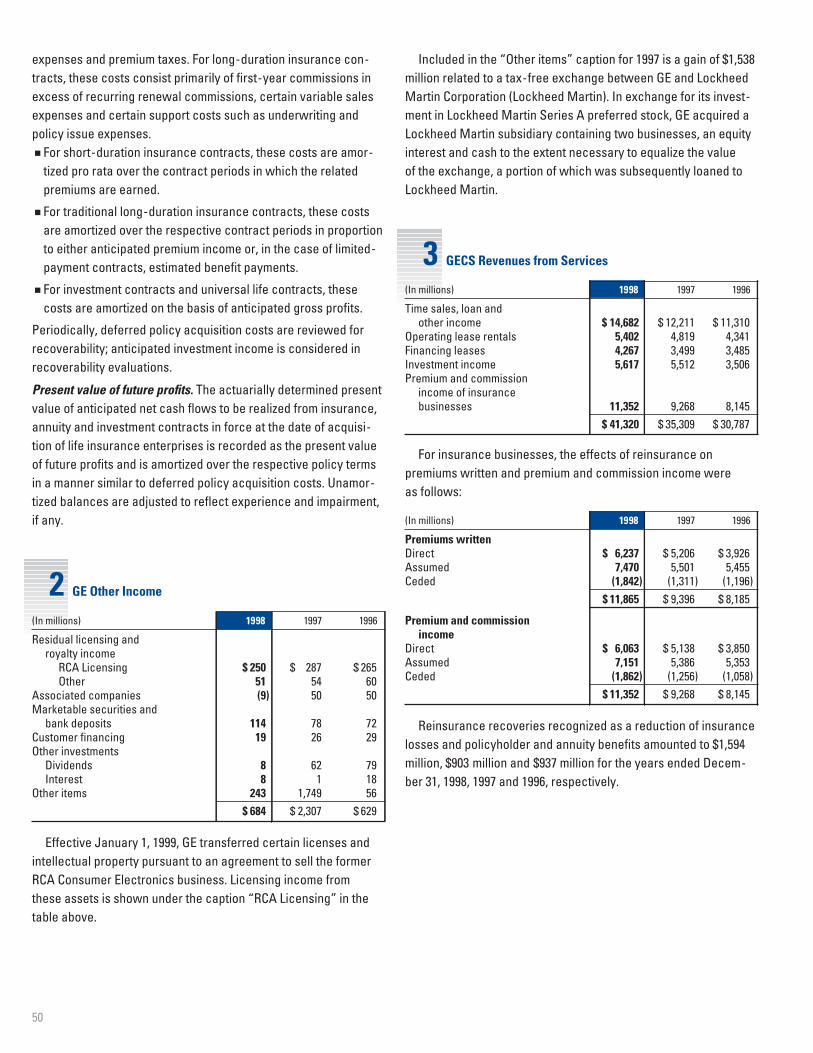
50
3 GECS Revenues from Services
2 GE Other Income
(In millions) 1998 1997 1996
Residual licensing and royalty income
RCA Licensing $ 250 $ 287 $ 265Other 51 54 60
Associated companies (9) 50 50Marketable securities and
bank deposits 114 78 72Customer financing 19 26 29Other investments
Dividends 8 62 79Interest 8 1 18
Other items 243 1,749 56$ 684 $ 2,307 $ 629
Effective January 1, 1999, GE transferred certain licenses andintellectual property pursuant to an agreement to sell the formerRCA Consumer Electronics business. Licensing income from these assets is shown under the caption “RCA Licensing” in thetable above.
(In millions) 1998 1997 1996
Time sales, loan and other income $ 14,682 $ 12,211 $ 11,310
Operating lease rentals 5,402 4,819 4,341Financing leases 4,267 3,499 3,485Investment income 5,617 5,512 3,506Premium and commission
income of insurance businesses 11,352 9,268 8,145
$ 41,320 $ 35,309 $ 30,787
For insurance businesses, the effects of reinsurance on premiums written and premium and commission income were as follows:
(In millions) 1998 1997 1996
Premiums writtenDirect $ 6,237 $ 5,206 $ 3,926Assumed 7,470 5,501 5,455Ceded (1,842) (1,311) (1,196)
$ 11,865 $ 9,396 $ 8,185
Premium and commission income
Direct $ 6,063 $ 5,138 $ 3,850Assumed 7,151 5,386 5,353Ceded (1,862) (1,256) (1,058)
$ 11,352 $ 9,268 $ 8,145
Reinsurance recoveries recognized as a reduction of insurancelosses and policyholder and annuity benefits amounted to $1,594million, $903 million and $937 million for the years ended Decem-ber 31, 1998, 1997 and 1996, respectively.
expenses and premium taxes. For long-duration insurance con-tracts, these costs consist primarily of first-year commissions inexcess of recurring renewal commissions, certain variable salesexpenses and certain support costs such as underwriting and policy issue expenses.n For short-duration insurance contracts, these costs are amor-
tized pro rata over the contract periods in which the related premiums are earned.
n For traditional long-duration insurance contracts, these costsare amortized over the respective contract periods in proportionto either anticipated premium income or, in the case of limited-payment contracts, estimated benefit payments.
n For investment contracts and universal life contracts, thesecosts are amortized on the basis of anticipated gross profits.
Periodically, deferred policy acquisition costs are reviewed forrecoverability; anticipated investment income is considered inrecoverability evaluations.
Present value of future profits. The actuarially determined presentvalue of anticipated net cash flows to be realized from insurance,annuity and investment contracts in force at the date of acquisi-tion of life insurance enterprises is recorded as the present valueof future profits and is amortized over the respective policy termsin a manner similar to deferred policy acquisition costs. Unamor-tized balances are adjusted to reflect experience and impairment,if any.
Included in the “Other items” caption for 1997 is a gain of $1,538million related to a tax-free exchange between GE and LockheedMartin Corporation (Lockheed Martin). In exchange for its invest-ment in Lockheed Martin Series A preferred stock, GE acquired aLockheed Martin subsidiary containing two businesses, an equityinterest and cash to the extent necessary to equalize the value of the exchange, a portion of which was subsequently loaned toLockheed Martin.
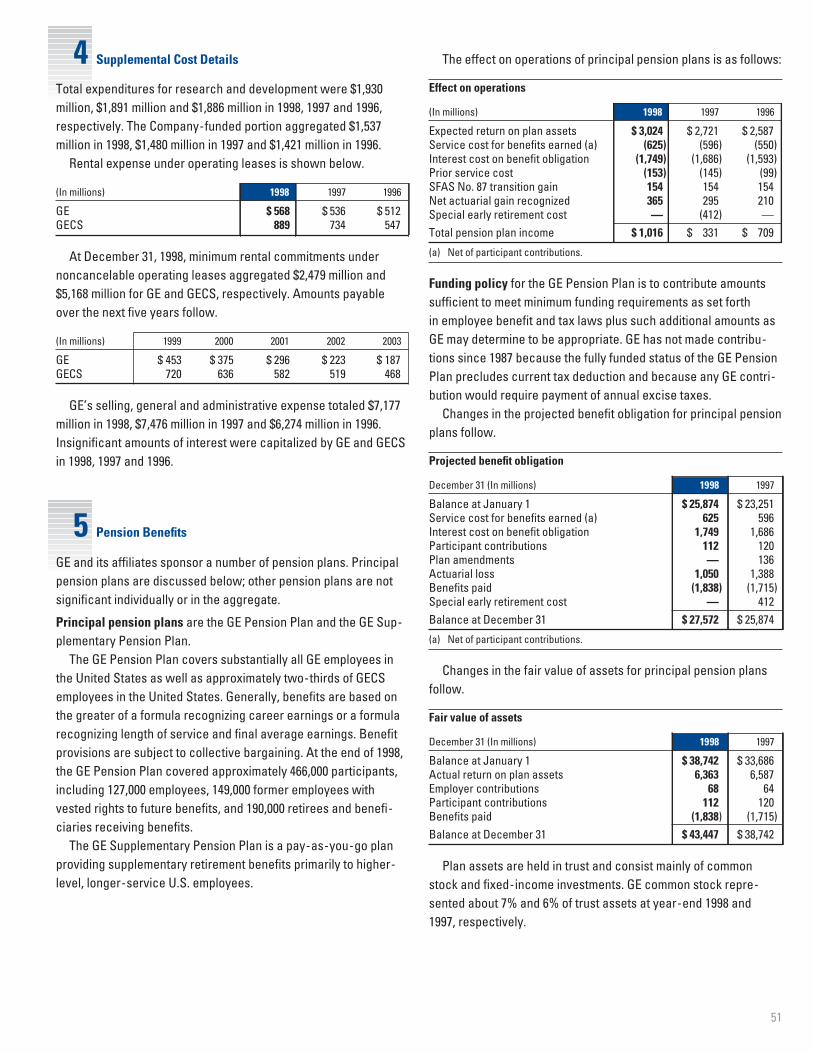
51
4 Supplemental Cost Details
Total expenditures for research and development were $1,930 million, $1,891 million and $1,886 million in 1998, 1997 and 1996,respectively. The Company-funded portion aggregated $1,537 million in 1998, $1,480 million in 1997 and $1,421 million in 1996.
Rental expense under operating leases is shown below.
(In millions) 1998 1997 1996
GE $ 568 $ 536 $ 512GECS 889 734 547
At December 31, 1998, minimum rental commitments under noncancelable operating leases aggregated $2,479 million and$5,168 million for GE and GECS, respectively. Amounts payableover the next five years follow.
(In millions) 1999 2000 2001 2002 2003
GE $ 453 $ 375 $ 296 $ 223 $ 187GECS 720 636 582 519 468
GE’s selling, general and administrative expense totaled $7,177million in 1998, $7,476 million in 1997 and $6,274 million in 1996.Insignificant amounts of interest were capitalized by GE and GECSin 1998, 1997 and 1996.
5 Pension Benefits
GE and its affiliates sponsor a number of pension plans. Principalpension plans are discussed below; other pension plans are notsignificant individually or in the aggregate.
Principal pension plans are the GE Pension Plan and the GE Sup-plementary Pension Plan.
The GE Pension Plan covers substantially all GE employees inthe United States as well as approximately two-thirds of GECSemployees in the United States. Generally, benefits are based onthe greater of a formula recognizing career earnings or a formularecognizing length of service and final average earnings. Benefitprovisions are subject to collective bargaining. At the end of 1998,the GE Pension Plan covered approximately 466,000 participants,including 127,000 employees, 149,000 former employees withvested rights to future benefits, and 190,000 retirees and benefi-ciaries receiving benefits.
The GE Supplementary Pension Plan is a pay-as-you-go planproviding supplementary retirement benefits primarily to higher-level, longer-service U.S. employees.
The effect on operations of principal pension plans is as follows:
Effect on operations
(In millions) 1998 1997 1996
Expected return on plan assets $ 3,024 $ 2,721 $ 2,587Service cost for benefits earned (a) (625) (596) (550)Interest cost on benefit obligation (1,749) (1,686) (1,593)Prior service cost (153) (145) (99)SFAS No. 87 transition gain 154 154 154Net actuarial gain recognized 365 295 210Special early retirement cost — (412) —Total pension plan income $ 1,016 $ 331 $ 709
(a) Net of participant contributions.
Funding policy for the GE Pension Plan is to contribute amountssufficient to meet minimum funding requirements as set forth in employee benefit and tax laws plus such additional amounts asGE may determine to be appropriate. GE has not made contribu-tions since 1987 because the fully funded status of the GE PensionPlan precludes current tax deduction and because any GE contri-bution would require payment of annual excise taxes.
Changes in the projected benefit obligation for principal pensionplans follow.
Projected benefit obligation
December 31 (In millions) 1998 1997
Balance at January 1 $ 25,874 $ 23,251Service cost for benefits earned (a) 625 596Interest cost on benefit obligation 1,749 1,686Participant contributions 112 120Plan amendments — 136Actuarial loss 1,050 1,388Benefits paid (1,838) (1,715)Special early retirement cost — 412Balance at December 31 $ 27,572 $ 25,874
(a) Net of participant contributions.
Changes in the fair value of assets for principal pension plansfollow.
Fair value of assets
December 31 (In millions) 1998 1997
Balance at January 1 $ 38,742 $ 33,686Actual return on plan assets 6,363 6,587Employer contributions 68 64Participant contributions 112 120Benefits paid (1,838) (1,715)Balance at December 31 $ 43,447 $ 38,742
Plan assets are held in trust and consist mainly of commonstock and fixed-income investments. GE common stock repre-sented about 7% and 6% of trust assets at year-end 1998 and 1997, respectively.
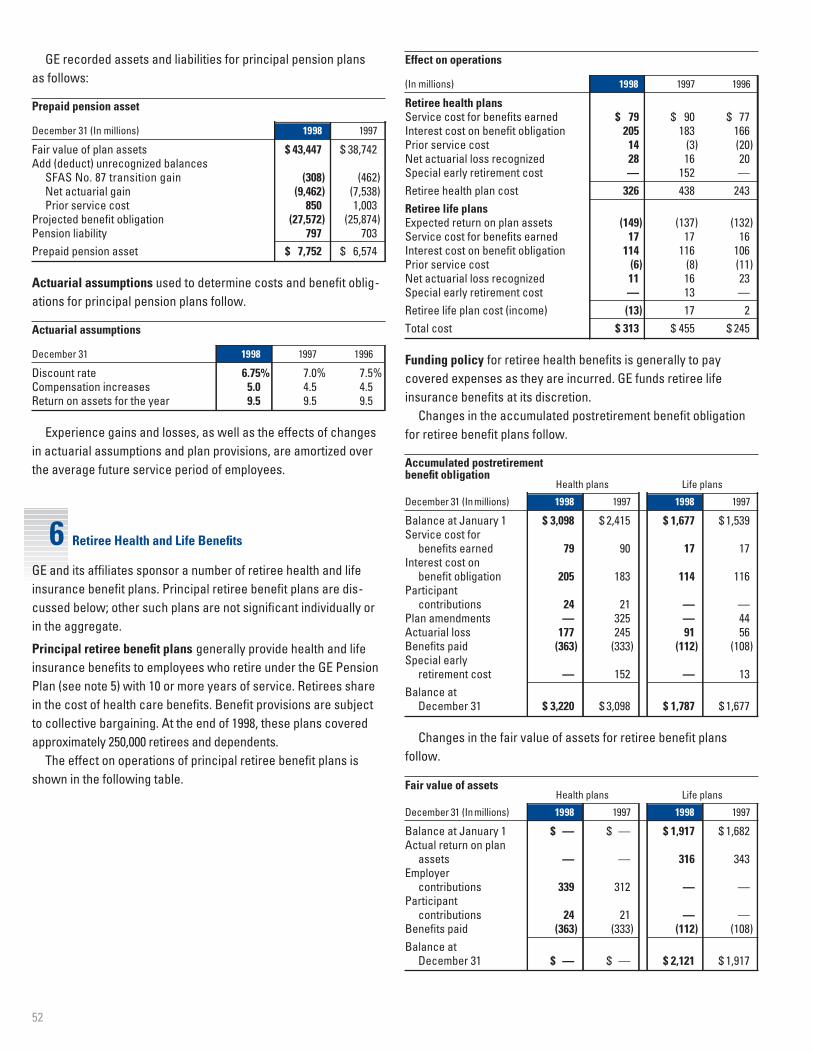
52
6 Retiree Health and Life Benefits
GE and its affiliates sponsor a number of retiree health and lifeinsurance benefit plans. Principal retiree benefit plans are dis-cussed below; other such plans are not significant individually orin the aggregate.
Principal retiree benefit plans generally provide health and lifeinsurance benefits to employees who retire under the GE PensionPlan (see note 5) with 10 or more years of service. Retirees sharein the cost of health care benefits. Benefit provisions are subjectto collective bargaining. At the end of 1998, these plans coveredapproximately 250,000 retirees and dependents.
The effect on operations of principal retiree benefit plans isshown in the following table.
Effect on operations
(In millions) 1998 1997 1996
Retiree health plansService cost for benefits earned $ 79 $ 90 $ 77Interest cost on benefit obligation 205 183 166Prior service cost 14 (3) (20)Net actuarial loss recognized 28 16 20Special early retirement cost — 152 —Retiree health plan cost 326 438 243Retiree life plansExpected return on plan assets (149) (137) (132)Service cost for benefits earned 17 17 16Interest cost on benefit obligation 114 116 106Prior service cost (6) (8) (11)Net actuarial loss recognized 11 16 23Special early retirement cost — 13 —Retiree life plan cost (income) (13) 17 2Total cost $ 313 $ 455 $ 245
Funding policy for retiree health benefits is generally to pay covered expenses as they are incurred. GE funds retiree life insurance benefits at its discretion.
Changes in the accumulated postretirement benefit obligationfor retiree benefit plans follow.
Accumulated postretirementbenefit obligation
Health plans Life plans
December 31 (Inmillions) 1998 1997 1998 1997
Balance at January 1 $ 3,098 $ 2,415 $ 1,677 $ 1,539Service cost for
benefits earned 79 90 17 17Interest cost on
benefit obligation 205 183 114 116Participant
contributions 24 21 — —Plan amendments — 325 — 44Actuarial loss 177 245 91 56Benefits paid (363) (333) (112) (108)Special early
retirement cost — 152 — 13Balance at
December 31 $ 3,220 $ 3,098 $ 1,787 $ 1,677
Changes in the fair value of assets for retiree benefit plans follow.
Fair value of assetsHealth plans Life plans
December 31 (Inmillions) 1998 1997 1998 1997
Balance at January 1 $ — $ — $ 1,917 $ 1,682Actual return on plan
assets — — 316 343Employer
contributions 339 312 — —Participant
contributions 24 21 — —Benefits paid (363) (333) (112) (108)Balance at
December 31 $ — $ — $ 2,121 $ 1,917
GE recorded assets and liabilities for principal pension plans as follows:
Prepaid pension asset
December 31 (In millions) 1998 1997
Fair value of plan assets $ 43,447 $ 38,742Add (deduct) unrecognized balances
SFAS No. 87 transition gain (308) (462)Net actuarial gain (9,462) (7,538)Prior service cost 850 1,003
Projected benefit obligation (27,572) (25,874)Pension liability 797 703Prepaid pension asset $ 7,752 $ 6,574
Actuarial assumptions used to determine costs and benefit oblig-ations for principal pension plans follow.
Actuarial assumptions
December 31 1998 1997 1996
Discount rate 6.75% 7.0% 7.5%Compensation increases 5.0 4.5 4.5Return on assets for the year 9.5 9.5 9.5
Experience gains and losses, as well as the effects of changesin actuarial assumptions and plan provisions, are amortized overthe average future service period of employees.
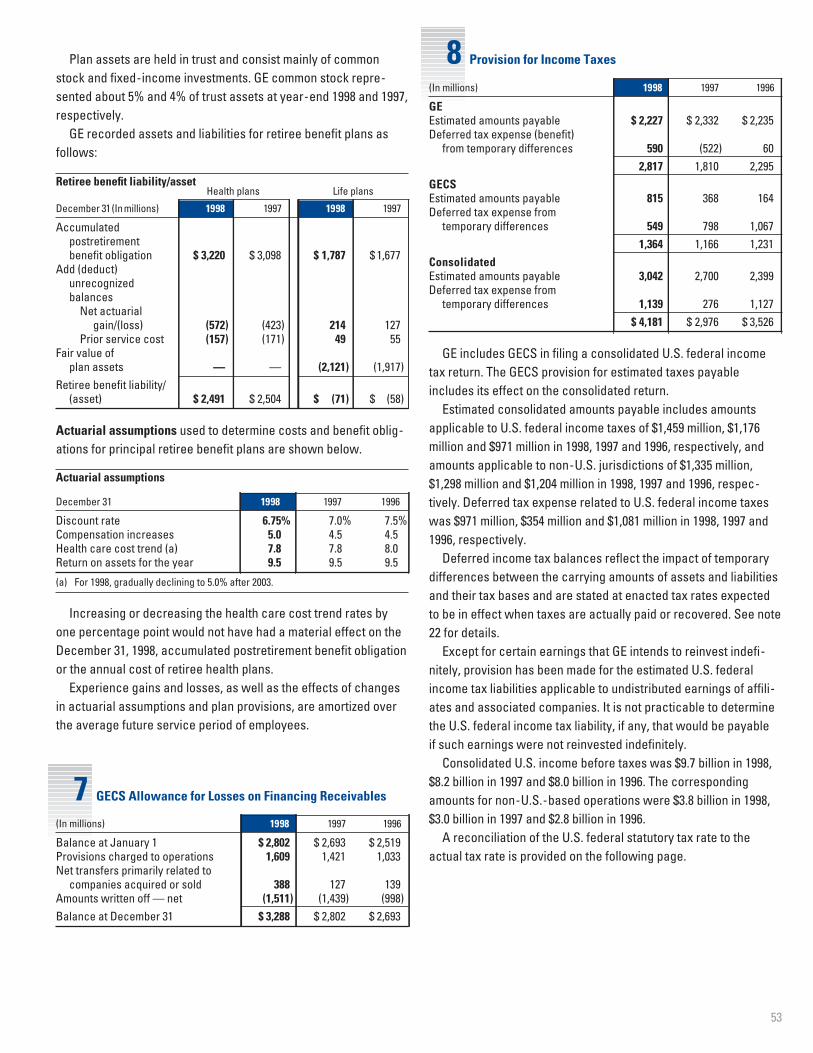
53
8 Provision for Income Taxes
7 GECS Allowance for Losses on Financing Receivables
(In millions) 1998 1997 1996
Balance at January 1 $ 2,802 $ 2,693 $ 2,519Provisions charged to operations 1,609 1,421 1,033Net transfers primarily related to
companies acquired or sold 388 127 139Amounts written off — net (1,511) (1,439) (998)Balance at December 31 $ 3,288 $ 2,802 $ 2,693
(In millions) 1998 1997 1996
GEEstimated amounts payable $ 2,227 $ 2,332 $ 2,235Deferred tax expense (benefit)
from temporary differences 590 (522) 602,817 1,810 2,295
GECSEstimated amounts payable 815 368 164Deferred tax expense from
temporary differences 549 798 1,0671,364 1,166 1,231
ConsolidatedEstimated amounts payable 3,042 2,700 2,399Deferred tax expense from
temporary differences 1,139 276 1,127$ 4,181 $ 2,976 $ 3,526
GE includes GECS in filing a consolidated U.S. federal incometax return. The GECS provision for estimated taxes payableincludes its effect on the consolidated return.
Estimated consolidated amounts payable includes amountsapplicable to U.S. federal income taxes of $1,459 million, $1,176million and $971 million in 1998, 1997 and 1996, respectively, andamounts applicable to non-U.S. jurisdictions of $1,335 million,$1,298 million and $1,204 million in 1998, 1997 and 1996, respec-tively. Deferred tax expense related to U.S. federal income taxeswas $971 million, $354 million and $1,081 million in 1998, 1997 and1996, respectively.
Deferred income tax balances reflect the impact of temporarydifferences between the carrying amounts of assets and liabilitiesand their tax bases and are stated at enacted tax rates expectedto be in effect when taxes are actually paid or recovered. See note22 for details.
Except for certain earnings that GE intends to reinvest indefi-nitely, provision has been made for the estimated U.S. federalincome tax liabilities applicable to undistributed earnings of affili-ates and associated companies. It is not practicable to determinethe U.S. federal income tax liability, if any, that would be payable if such earnings were not reinvested indefinitely.
Consolidated U.S. income before taxes was $9.7 billion in 1998,$8.2 billion in 1997 and $8.0 billion in 1996. The correspondingamounts for non-U.S.-based operations were $3.8 billion in 1998,$3.0 billion in 1997 and $2.8 billion in 1996.
A reconciliation of the U.S. federal statutory tax rate to theactual tax rate is provided on the following page.
Plan assets are held in trust and consist mainly of commonstock and fixed-income investments. GE common stock repre-sented about 5% and 4% of trust assets at year-end 1998 and 1997,respectively.
GE recorded assets and liabilities for retiree benefit plans asfollows:
Retiree benefit liability/assetHealth plans Life plans
December 31(Inmillions) 1998 1997 1998 1997
Accumulated postretirementbenefit obligation $ 3,220 $ 3,098 $ 1,787 $ 1,677
Add (deduct) unrecognizedbalances
Net actuarialgain/(loss) (572) (423) 214 127
Prior service cost (157) (171) 49 55Fair value of
plan assets — — (2,121) (1,917)Retiree benefit liability/
(asset) $ 2,491 $ 2,504 $ (71) $ (58)
Actuarial assumptions used to determine costs and benefit oblig-ations for principal retiree benefit plans are shown below.
Actuarial assumptions
December 31 1998 1997 1996
Discount rate 6.75% 7.0% 7.5%Compensation increases 5.0 4.5 4.5Health care cost trend (a) 7.8 7.8 8.0Return on assets for the year 9.5 9.5 9.5
(a) For 1998, gradually declining to 5.0% after 2003.
Increasing or decreasing the health care cost trend rates byone percentage point would not have had a material effect on theDecember 31, 1998, accumulated postretirement benefit obligationor the annual cost of retiree health plans.
Experience gains and losses, as well as the effects of changesin actuarial assumptions and plan provisions, are amortized overthe average future service period of employees.
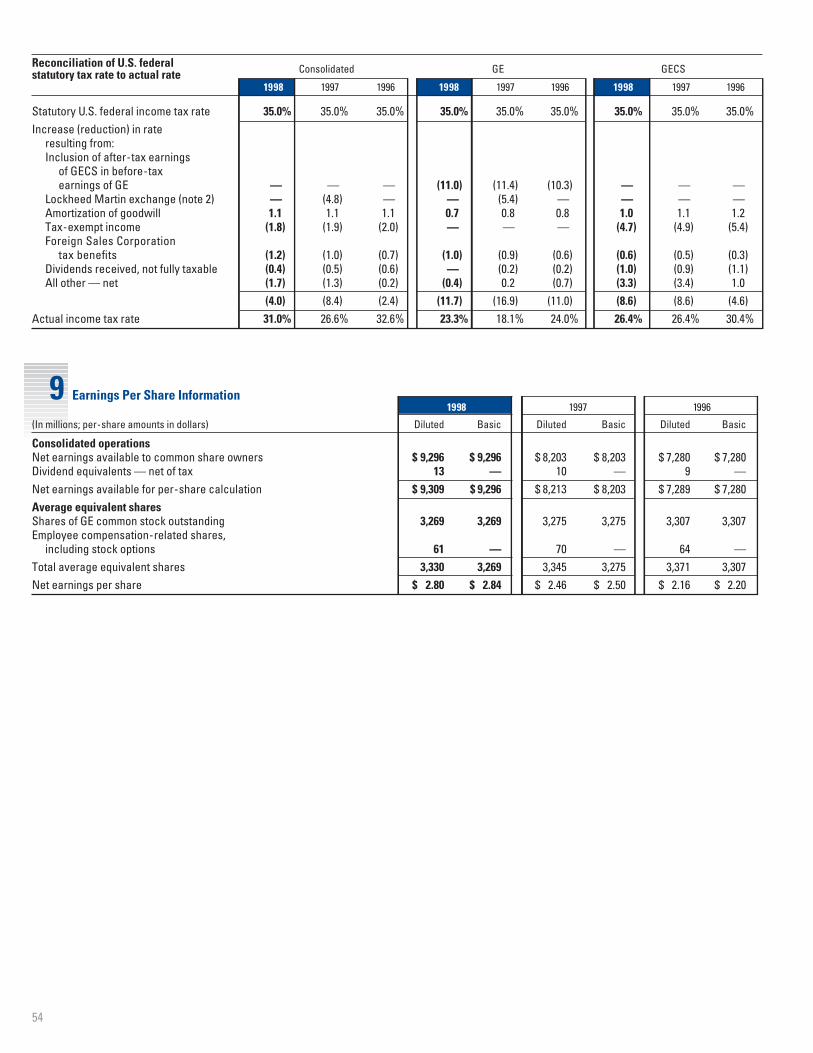
54
Reconciliation of U.S. federal Consolidated GE GECSstatutory tax rate to actual rate1998 1997 1996 1998 1997 1996 1998 1997 1996
Statutory U.S. federal income tax rate 35.0% 35.0% 35.0% 35.0% 35.0% 35.0% 35.0% 35.0% 35.0%Increase (reduction) in rate
resulting from:Inclusion of after-tax earnings
of GECS in before-tax earnings of GE — — — (11.0) (11.4) (10.3) — — —
Lockheed Martin exchange (note 2) — (4.8) — — (5.4) — — — —Amortization of goodwill 1.1 1.1 1.1 0.7 0.8 0.8 1.0 1.1 1.2Tax-exempt income (1.8) (1.9) (2.0) — — — (4.7) (4.9) (5.4)Foreign Sales Corporation
tax benefits (1.2) (1.0) (0.7) (1.0) (0.9) (0.6) (0.6) (0.5) (0.3)Dividends received, not fully taxable (0.4) (0.5) (0.6) — (0.2) (0.2) (1.0) (0.9) (1.1)All other — net (1.7) (1.3) (0.2) (0.4) 0.2 (0.7) (3.3) (3.4) 1.0
(4.0) (8.4) (2.4) (11.7) (16.9) (11.0) (8.6) (8.6) (4.6)Actual income tax rate 31.0% 26.6% 32.6% 23.3% 18.1% 24.0% 26.4% 26.4% 30.4%
9 Earnings Per Share Information1998 1997 1996
(In millions; per-share amounts in dollars) Diluted Basic Diluted Basic Diluted Basic
Consolidated operationsNet earnings available to common share owners $ 9,296 $ 9,296 $ 8,203 $ 8,203 $ 7,280 $ 7,280Dividend equivalents — net of tax 13 — 10 — 9 —Net earnings available for per-share calculation $ 9,309 $ 9,296 $ 8,213 $ 8,203 $ 7,289 $ 7,280Average equivalent sharesShares of GE common stock outstanding 3,269 3,269 3,275 3,275 3,307 3,307Employee compensation-related shares,
including stock options 61 — 70 — 64 —Total average equivalent shares 3,330 3,269 3,345 3,275 3,371 3,307Net earnings per share $ 2.80 $ 2.84 $ 2.46 $ 2.50 $ 2.16 $ 2.20
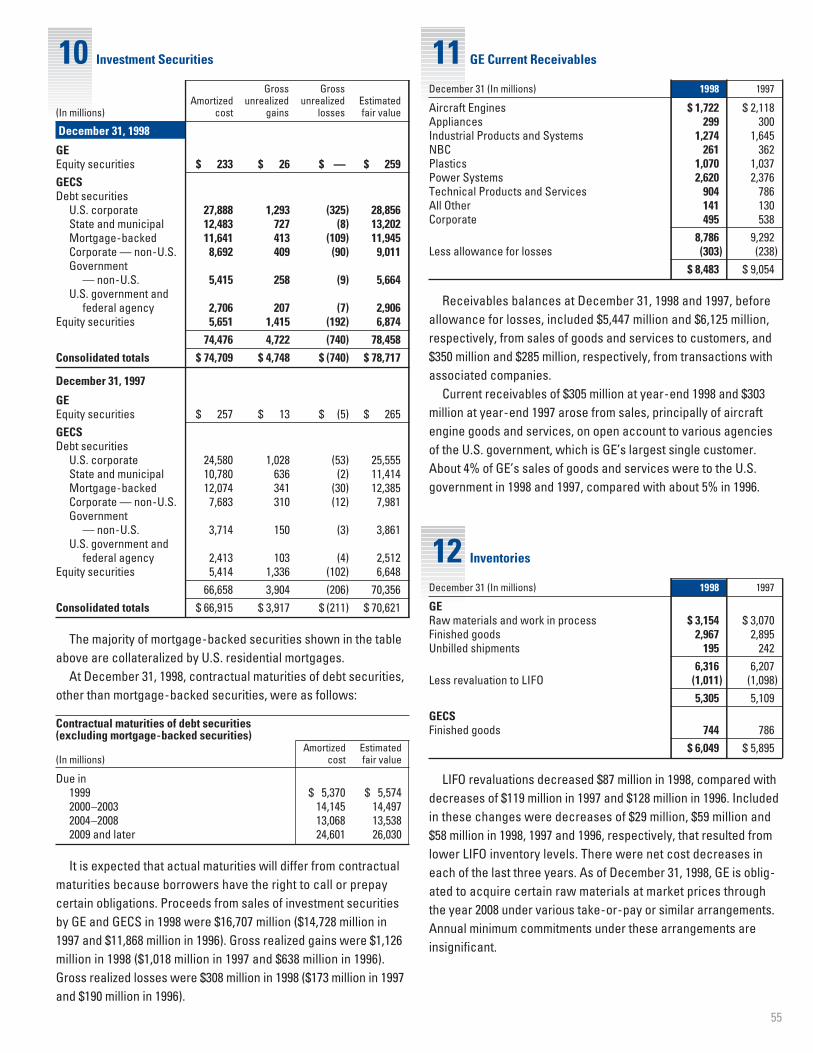
55
12 Inventories
11 GE Current Receivables
Gross GrossAmortized unrealized unrealized Estimated
(In millions) cost gains losses fair value
December 31, 1998
GEEquity securities $ 233 $ 26 $ — $ 259
GECSDebt securities
U.S. corporate 27,888 1,293 (325) 28,856State and municipal 12,483 727 (8) 13,202Mortgage-backed 11,641 413 (109) 11,945Corporate — non-U.S. 8,692 409 (90) 9,011Government
— non-U.S. 5,415 258 (9) 5,664U.S. government and
federal agency 2,706 207 (7) 2,906Equity securities 5,651 1,415 (192) 6,874
74,476 4,722 (740) 78,458
Consolidated totals $ 74,709 $ 4,748 $ (740) $ 78,717
December 31, 1997
GEEquity securities $ 257 $ 13 $ (5) $ 265GECSDebt securities
U.S. corporate 24,580 1,028 (53) 25,555State and municipal 10,780 636 (2) 11,414Mortgage-backed 12,074 341 (30) 12,385Corporate — non-U.S. 7,683 310 (12) 7,981Government
— non-U.S. 3,714 150 (3) 3,861U.S. government and
federal agency 2,413 103 (4) 2,512Equity securities 5,414 1,336 (102) 6,648
66,658 3,904 (206) 70,356Consolidated totals $ 66,915 $ 3,917 $ (211) $ 70,621
The majority of mortgage-backed securities shown in the tableabove are collateralized by U.S. residential mortgages.
At December 31, 1998, contractual maturities of debt securities,other than mortgage-backed securities, were as follows:
Contractual maturities of debt securities(excluding mortgage-backed securities)
Amortized Estimated(In millions) cost fair value
Due in 1999 $ 5,370 $ 5,5742000–2003 14,145 14,4972004–2008 13,068 13,5382009 and later 24,601 26,030
It is expected that actual maturities will differ from contractualmaturities because borrowers have the right to call or prepay certain obligations. Proceeds from sales of investment securitiesby GE and GECS in 1998 were $16,707 million ($14,728 million in1997 and $11,868 million in 1996). Gross realized gains were $1,126million in 1998 ($1,018 million in 1997 and $638 million in 1996).Gross realized losses were $308 million in 1998 ($173 million in 1997and $190 million in 1996).
December 31 (In millions) 1998 1997
GERaw materials and work in process $ 3,154 $ 3,070Finished goods 2,967 2,895Unbilled shipments 195 242
6,316 6,207Less revaluation to LIFO (1,011) (1,098)
5,305 5,109GECSFinished goods 744 786
$ 6,049 $ 5,895
LIFO revaluations decreased $87 million in 1998, compared withdecreases of $119 million in 1997 and $128 million in 1996. Includedin these changes were decreases of $29 million, $59 million and$58 million in 1998, 1997 and 1996, respectively, that resulted fromlower LIFO inventory levels. There were net cost decreases ineach of the last three years. As of December 31, 1998, GE is oblig-ated to acquire certain raw materials at market prices through the year 2008 under various take-or-pay or similar arrangements.Annual minimum commitments under these arrangements areinsignificant.
December 31 (In millions) 1998 1997
Aircraft Engines $ 1,722 $ 2,118Appliances 299 300Industrial Products and Systems 1,274 1,645NBC 261 362Plastics 1,070 1,037Power Systems 2,620 2,376Technical Products and Services 904 786All Other 141 130Corporate 495 538
8,786 9,292Less allowance for losses (303) (238)
$ 8,483 $ 9,054
Receivables balances at December 31, 1998 and 1997, beforeallowance for losses, included $5,447 million and $6,125 million,respectively, from sales of goods and services to customers, and$350 million and $285 million, respectively, from transactions withassociated companies.
Current receivables of $305 million at year-end 1998 and $303million at year-end 1997 arose from sales, principally of aircraftengine goods and services, on open account to various agenciesof the U.S. government, which is GE’s largest single customer.About 4% of GE’s sales of goods and services were to the U.S.government in 1998 and 1997, compared with about 5% in 1996.
10 Investment Securities
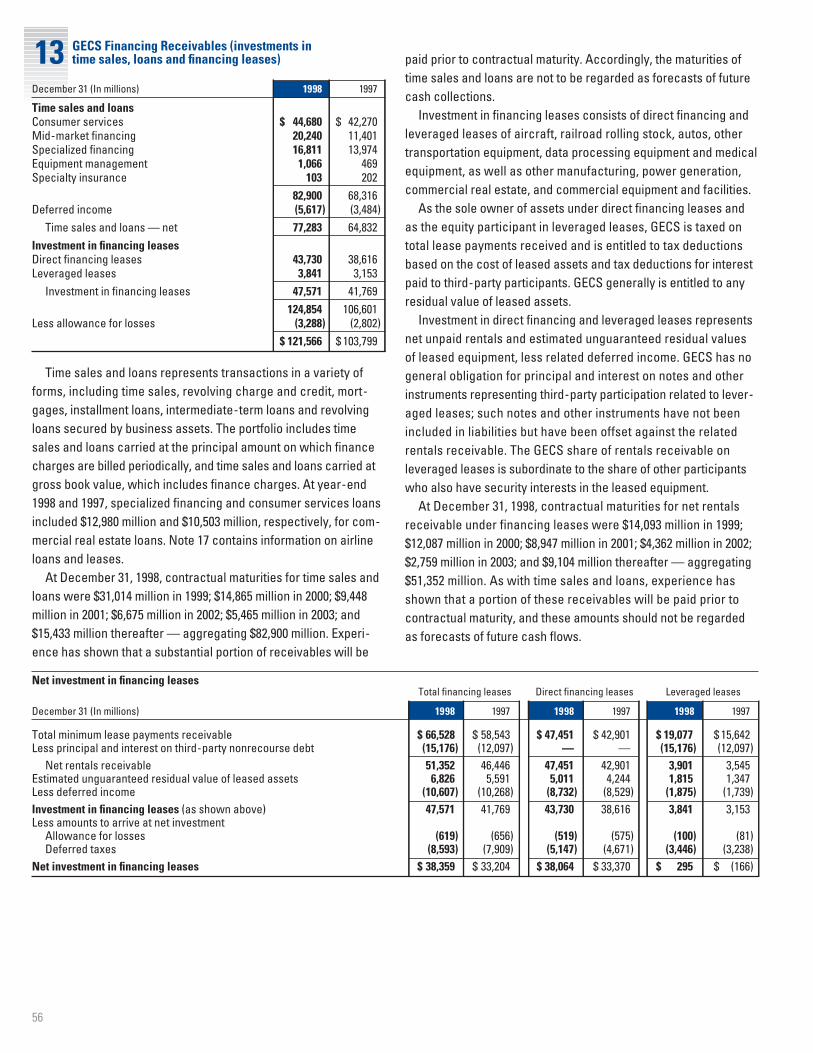
56
13 GECS Financing Receivables (investments in time sales, loans and financing leases) paid prior to contractual maturity. Accordingly, the maturities of
time sales and loans are not to be regarded as forecasts of futurecash collections.
Investment in financing leases consists of direct financing andleveraged leases of aircraft, railroad rolling stock, autos, othertransportation equipment, data processing equipment and medicalequipment, as well as other manufacturing, power generation,commercial real estate, and commercial equipment and facilities.
As the sole owner of assets under direct financing leases andas the equity participant in leveraged leases, GECS is taxed ontotal lease payments received and is entitled to tax deductionsbased on the cost of leased assets and tax deductions for interestpaid to third-party participants. GECS generally is entitled to anyresidual value of leased assets.
Investment in direct financing and leveraged leases representsnet unpaid rentals and estimated unguaranteed residual values of leased equipment, less related deferred income. GECS has nogeneral obligation for principal and interest on notes and otherinstruments representing third-party participation related to lever-aged leases; such notes and other instruments have not beenincluded in liabilities but have been offset against the relatedrentals receivable. The GECS share of rentals receivable on leveraged leases is subordinate to the share of other participantswho also have security interests in the leased equipment.
At December 31, 1998, contractual maturities for net rentalsreceivable under financing leases were $14,093 million in 1999;$12,087 million in 2000; $8,947 million in 2001; $4,362 million in 2002;$2,759 million in 2003; and $9,104 million thereafter — aggregating$51,352 million. As with time sales and loans, experience hasshown that a portion of these receivables will be paid prior to contractual maturity, and these amounts should not be regardedas forecasts of future cash flows.
Net investment in financing leasesTotal financing leases Direct financing leases Leveraged leases
December 31 (In millions) 1998 1997 1998 1997 1998 1997
Total minimum lease payments receivable $ 66,528 $ 58,543 $ 47,451 $ 42,901 $ 19,077 $ 15,642Less principal and interest on third-party nonrecourse debt (15,176) (12,097) — — (15,176) (12,097)
Net rentals receivable 51,352 46,446 47,451 42,901 3,901 3,545Estimated unguaranteed residual value of leased assets 6,826 5,591 5,011 4,244 1,815 1,347Less deferred income (10,607) (10,268) (8,732) (8,529) (1,875) (1,739)Investment in financing leases (as shown above) 47,571 41,769 43,730 38,616 3,841 3,153Less amounts to arrive at net investment
Allowance for losses (619) (656) (519) (575) (100) (81)Deferred taxes (8,593) (7,909) (5,147) (4,671) (3,446) (3,238)
Net investment in financing leases $ 38,359 $ 33,204 $ 38,064 $ 33,370 $ 295 $ (166)
December 31 (In millions) 1998 1997
Time sales and loansConsumer services $ 44,680 $ 42,270Mid-market financing 20,240 11,401Specialized financing 16,811 13,974Equipment management 1,066 469Specialty insurance 103 202
82,900 68,316Deferred income (5,617) (3,484)
Time sales and loans — net 77,283 64,832Investment in financing leasesDirect financing leases 43,730 38,616Leveraged leases 3,841 3,153
Investment in financing leases 47,571 41,769124,854 106,601
Less allowance for losses (3,288) (2,802)$ 121,566 $ 103,799
Time sales and loans represents transactions in a variety offorms, including time sales, revolving charge and credit, mort-gages, installment loans, intermediate-term loans and revolvingloans secured by business assets. The portfolio includes timesales and loans carried at the principal amount on which financecharges are billed periodically, and time sales and loans carried atgross book value, which includes finance charges. At year-end1998 and 1997, specialized financing and consumer services loansincluded $12,980 million and $10,503 million, respectively, for com-mercial real estate loans. Note 17 contains information on airlineloans and leases.
At December 31, 1998, contractual maturities for time sales andloans were $31,014 million in 1999; $14,865 million in 2000; $9,448million in 2001; $6,675 million in 2002; $5,465 million in 2003; and$15,433 million thereafter — aggregating $82,900 million. Experi-ence has shown that a substantial portion of receivables will be
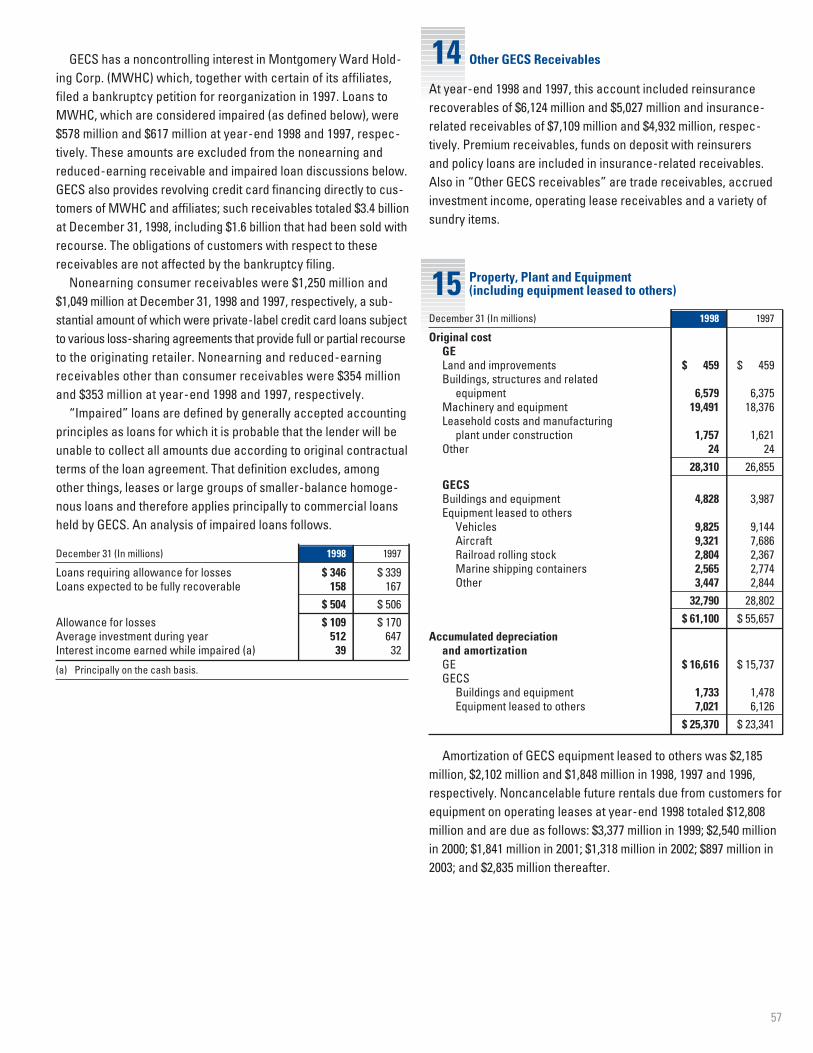
57
14 Other GECS Receivables
15 Property, Plant and Equipment(including equipment leased to others)
At year-end 1998 and 1997, this account included reinsurancerecoverables of $6,124 million and $5,027 million and insurance-related receivables of $7,109 million and $4,932 million, respec-tively. Premium receivables, funds on deposit with reinsurers and policy loans are included in insurance-related receivables.Also in “Other GECS receivables” are trade receivables, accruedinvestment income, operating lease receivables and a variety ofsundry items.
GECS has a noncontrolling interest in Montgomery Ward Hold-ing Corp. (MWHC) which, together with certain of its affiliates,filed a bankruptcy petition for reorganization in 1997. Loans toMWHC, which are considered impaired (as defined below), were$578 million and $617 million at year-end 1998 and 1997, respec-tively. These amounts are excluded from the nonearning andreduced-earning receivable and impaired loan discussions below.GECS also provides revolving credit card financing directly to cus-tomers of MWHC and affiliates; such receivables totaled $3.4 billionat December 31, 1998, including $1.6 billion that had been sold withrecourse. The obligations of customers with respect to thesereceivables are not affected by the bankruptcy filing.
Nonearning consumer receivables were $1,250 million and$1,049 million at December 31, 1998 and 1997, respectively, a sub-stantial amount of which were private-label credit card loans subjectto various loss-sharing agreements that provide full or partial recourseto the originating retailer. Nonearning and reduced-earningreceivables other than consumer receivables were $354 millionand $353 million at year-end 1998 and 1997, respectively.
“Impaired” loans are defined by generally accepted accountingprinciples as loans for which it is probable that the lender will beunable to collect all amounts due according to original contractualterms of the loan agreement. That definition excludes, amongother things, leases or large groups of smaller-balance homoge-nous loans and therefore applies principally to commercial loansheld by GECS. An analysis of impaired loans follows.
December 31 (In millions) 1998 1997
Loans requiring allowance for losses $ 346 $ 339Loans expected to be fully recoverable 158 167
$ 504 $ 506Allowance for losses $ 109 $ 170Average investment during year 512 647Interest income earned while impaired (a) 39 32
(a) Principally on the cash basis.
December 31 (In millions) 1998 1997
Original costGELand and improvements $ 459 $ 459Buildings, structures and related
equipment 6,579 6,375Machinery and equipment 19,491 18,376Leasehold costs and manufacturing
plant under construction 1,757 1,621Other 24 24
28,310 26,855GECSBuildings and equipment 4,828 3,987Equipment leased to others
Vehicles 9,825 9,144Aircraft 9,321 7,686Railroad rolling stock 2,804 2,367Marine shipping containers 2,565 2,774Other 3,447 2,844
32,790 28,802$ 61,100 $ 55,657
Accumulated depreciationand amortizationGE $ 16,616 $ 15,737GECS
Buildings and equipment 1,733 1,478Equipment leased to others 7,021 6,126
$ 25,370 $ 23,341
Amortization of GECS equipment leased to others was $2,185million, $2,102 million and $1,848 million in 1998, 1997 and 1996,respectively. Noncancelable future rentals due from customers forequipment on operating leases at year-end 1998 totaled $12,808million and are due as follows: $3,377 million in 1999; $2,540 millionin 2000; $1,841 million in 2001; $1,318 million in 2002; $897 million in2003; and $2,835 million thereafter.
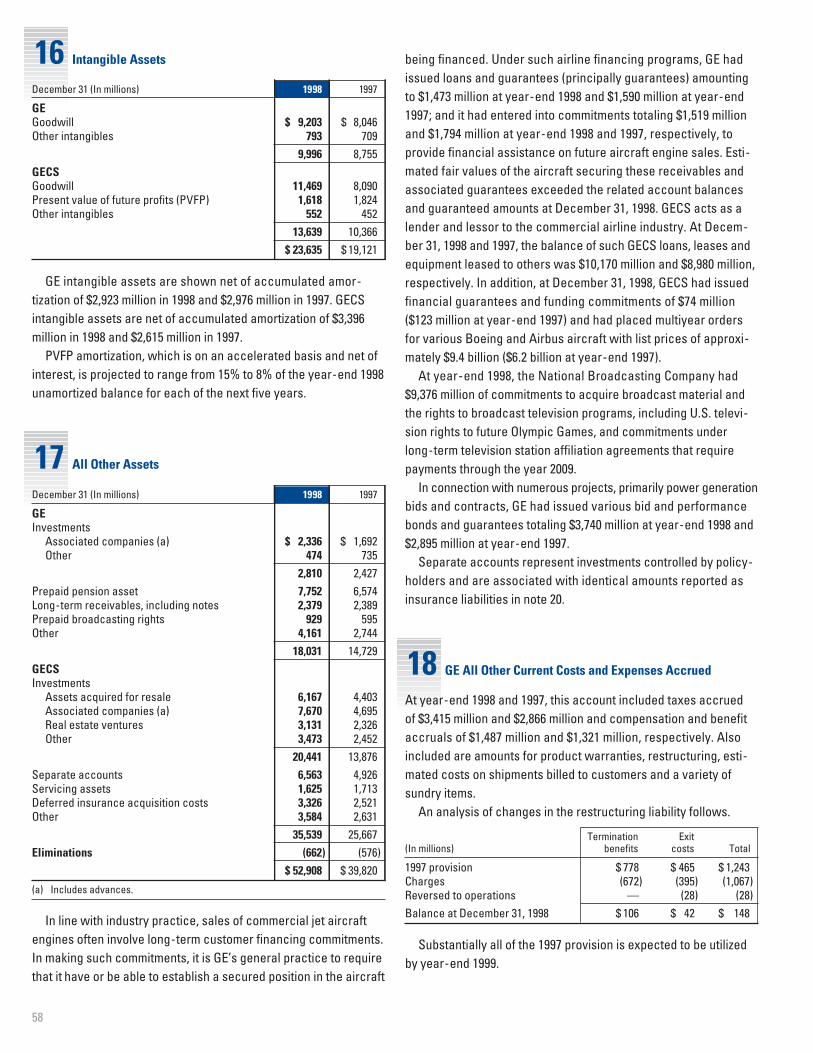
58
18 GE All Other Current Costs and Expenses Accrued
16 Intangible Assets
17 All Other Assets
December 31 (In millions) 1998 1997
GEGoodwill $ 9,203 $ 8,046Other intangibles 793 709
9,996 8,755GECSGoodwill 11,469 8,090Present value of future profits (PVFP) 1,618 1,824Other intangibles 552 452
13,639 10,366$ 23,635 $ 19,121
GE intangible assets are shown net of accumulated amor-tization of $2,923 million in 1998 and $2,976 million in 1997. GECSintangible assets are net of accumulated amortization of $3,396million in 1998 and $2,615 million in 1997.
PVFP amortization, which is on an accelerated basis and net ofinterest, is projected to range from 15% to 8% of the year-end 1998unamortized balance for each of the next five years.
December 31 (In millions) 1998 1997
GEInvestments
Associated companies (a) $ 2,336 $ 1,692Other 474 735
2,810 2,427Prepaid pension asset 7,752 6,574Long-term receivables, including notes 2,379 2,389Prepaid broadcasting rights 929 595Other 4,161 2,744
18,031 14,729GECSInvestments
Assets acquired for resale 6,167 4,403Associated companies (a) 7,670 4,695Real estate ventures 3,131 2,326Other 3,473 2,452
20,441 13,876Separate accounts 6,563 4,926Servicing assets 1,625 1,713Deferred insurance acquisition costs 3,326 2,521Other 3,584 2,631
35,539 25,667Eliminations (662) (576)
$ 52,908 $ 39,820
(a) Includes advances.
In line with industry practice, sales of commercial jet aircraftengines often involve long-term customer financing commitments.In making such commitments, it is GE’s general practice to requirethat it have or be able to establish a secured position in the aircraft
being financed. Under such airline financing programs, GE hadissued loans and guarantees (principally guarantees) amountingto $1,473 million at year-end 1998 and $1,590 million at year-end1997; and it had entered into commitments totaling $1,519 millionand $1,794 million at year-end 1998 and 1997, respectively, to provide financial assistance on future aircraft engine sales. Esti-mated fair values of the aircraft securing these receivables andassociated guarantees exceeded the related account balancesand guaranteed amounts at December 31, 1998. GECS acts as alender and lessor to the commercial airline industry. At Decem-ber 31, 1998 and 1997, the balance of such GECS loans, leases andequipment leased to others was $10,170 million and $8,980 million,respectively. In addition, at December 31, 1998, GECS had issuedfinancial guarantees and funding commitments of $74 million ($123 million at year-end 1997) and had placed multiyear ordersfor various Boeing and Airbus aircraft with list prices of approxi-mately $9.4 billion ($6.2 billion at year-end 1997).
At year-end 1998, the National Broadcasting Company had$9,376 million of commitments to acquire broadcast material andthe rights to broadcast television programs, including U.S. televi-sion rights to future Olympic Games, and commitments underlong-term television station affiliation agreements that requirepayments through the year 2009.
In connection with numerous projects, primarily power generationbids and contracts, GE had issued various bid and performancebonds and guarantees totaling $3,740 million at year-end 1998 and$2,895 million at year-end 1997.
Separate accounts represent investments controlled by policy-holders and are associated with identical amounts reported asinsurance liabilities in note 20.
At year-end 1998 and 1997, this account included taxes accrued of $3,415 million and $2,866 million and compensation and benefitaccruals of $1,487 million and $1,321 million, respectively. Alsoincluded are amounts for product warranties, restructuring, esti-mated costs on shipments billed to customers and a variety ofsundry items.
An analysis of changes in the restructuring liability follows.
Termination Exit(In millions) benefits costs Total
1997 provision $ 778 $ 465 $ 1,243Charges (672) (395) (1,067)Reversed to operations — (28) (28)Balance at December 31, 1998 $ 106 $ 42 $ 148
Substantially all of the 1997 provision is expected to be utilizedby year-end 1999.
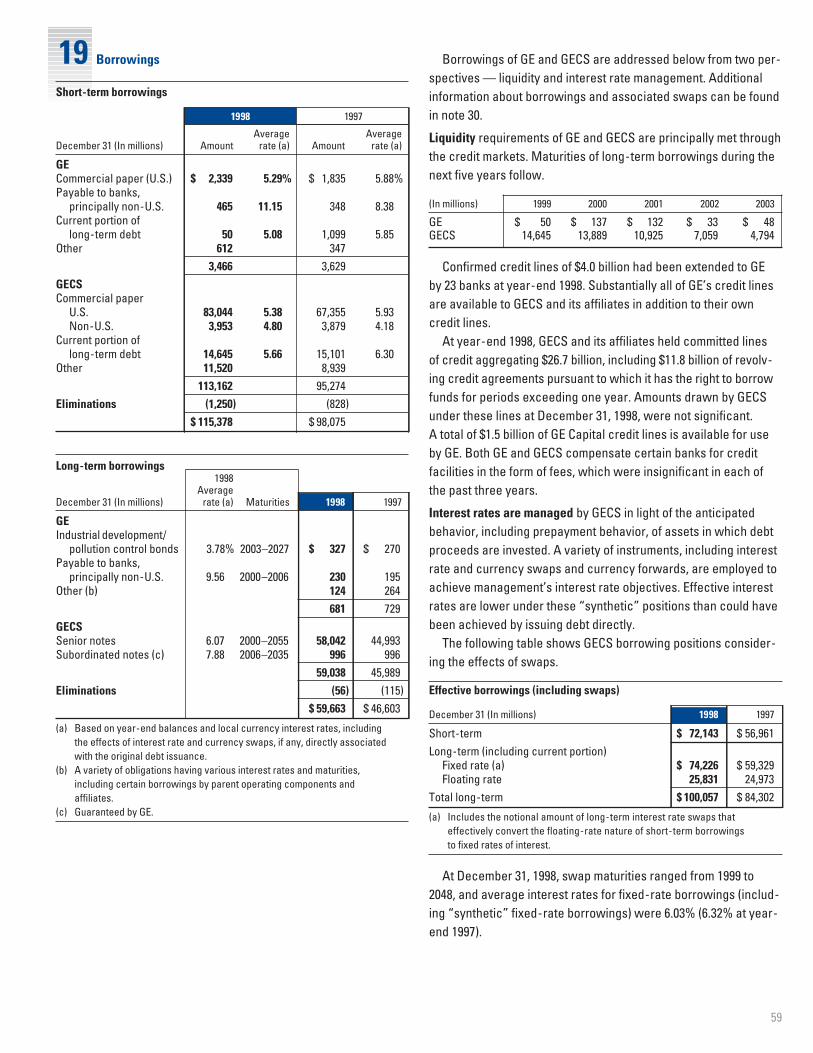
59
Borrowings of GE and GECS are addressed below from two per-spectives — liquidity and interest rate management. Additionalinformation about borrowings and associated swaps can be foundin note 30.
Liquidity requirements of GE and GECS are principally met throughthe credit markets. Maturities of long-term borrowings during thenext five years follow.
(In millions) 1999 2000 2001 2002 2003
GE $ 50 $ 137 $ 132 $ 33 $ 48GECS 14,645 13,889 10,925 7,059 4,794
Confirmed credit lines of $4.0 billion had been extended to GE by 23 banks at year-end 1998. Substantially all of GE’s credit linesare available to GECS and its affiliates in addition to their owncredit lines.
At year-end 1998, GECS and its affiliates held committed lines of credit aggregating $26.7 billion, including $11.8 billion of revolv-ing credit agreements pursuant to which it has the right to borrowfunds for periods exceeding one year. Amounts drawn by GECSunder these lines at December 31, 1998, were not significant. A total of $1.5 billion of GE Capital credit lines is available for use by GE. Both GE and GECS compensate certain banks for creditfacilities in the form of fees, which were insignificant in each ofthe past three years.
Interest rates are managed by GECS in light of the anticipatedbehavior, including prepayment behavior, of assets in which debtproceeds are invested. A variety of instruments, including interestrate and currency swaps and currency forwards, are employed toachieve management’s interest rate objectives. Effective interestrates are lower under these “synthetic” positions than could havebeen achieved by issuing debt directly.
The following table shows GECS borrowing positions consider-ing the effects of swaps.
Effective borrowings (including swaps)
December 31 (In millions) 1998 1997
Short-term $ 72,143 $ 56,961Long-term (including current portion)
Fixed rate (a) $ 74,226 $ 59,329Floating rate 25,831 24,973
Total long-term $ 100,057 $ 84,302
(a) Includes the notional amount of long-term interest rate swaps that effectively convert the floating-rate nature of short-term borrowings to fixed rates of interest.
At December 31, 1998, swap maturities ranged from 1999 to2048, and average interest rates for fixed-rate borrowings (includ-ing “synthetic” fixed-rate borrowings) were 6.03% (6.32% at year-end 1997).
19 Borrowings
Short-term borrowings
1998 1997
Average AverageDecember 31 (In millions) Amount rate (a) Amount rate (a)
GECommercial paper (U.S.) $ 2,339 5.29% $ 1,835 5.88%Payable to banks,
principally non-U.S. 465 11.15 348 8.38Current portion of
long-term debt 50 5.08 1,099 5.85Other 612 347
3,466 3,629GECSCommercial paper
U.S. 83,044 5.38 67,355 5.93Non-U.S. 3,953 4.80 3,879 4.18
Current portion of long-term debt 14,645 5.66 15,101 6.30
Other 11,520 8,939113,162 95,274
Eliminations (1,250) (828)$ 115,378 $ 98,075
Long-term borrowings1998
AverageDecember 31 (In millions) rate (a) Maturities 1998 1997
GEIndustrial development/
pollution control bonds 3.78% 2003–2027 $ 327 $ 270Payable to banks,
principally non-U.S. 9.56 2000–2006 230 195Other (b) 124 264
681 729GECSSenior notes 6.07 2000–2055 58,042 44,993Subordinated notes (c) 7.88 2006–2035 996 996
59,038 45,989Eliminations (56) (115)
$ 59,663 $ 46,603
(a) Based on year-end balances and local currency interest rates, includingthe effects of interest rate and currency swaps, if any, directly associatedwith the original debt issuance.
(b) A variety of obligations having various interest rates and maturities,including certain borrowings by parent operating components andaffiliates.
(c) Guaranteed by GE.
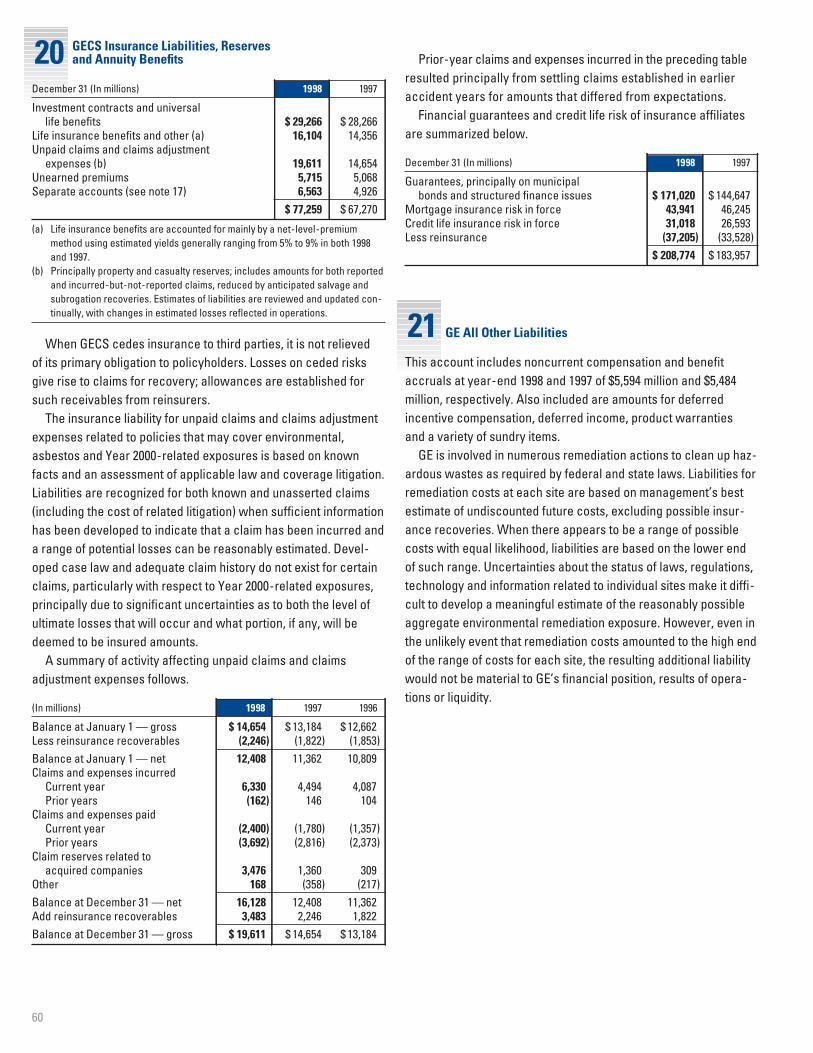
60
21 GE All Other Liabilities
20 GECS Insurance Liabilities, Reservesand Annuity Benefits Prior-year claims and expenses incurred in the preceding table
resulted principally from settling claims established in earlieraccident years for amounts that differed from expectations.
Financial guarantees and credit life risk of insurance affiliatesare summarized below.
December 31 (In millions) 1998 1997
Guarantees, principally on municipalbonds and structured finance issues $ 171,020 $ 144,647
Mortgage insurance risk in force 43,941 46,245Credit life insurance risk in force 31,018 26,593Less reinsurance (37,205) (33,528)
$ 208,774 $ 183,957
This account includes noncurrent compensation and benefitaccruals at year-end 1998 and 1997 of $5,594 million and $5,484million, respectively. Also included are amounts for deferredincentive compensation, deferred income, product warranties and a variety of sundry items.
GE is involved in numerous remediation actions to clean up haz-ardous wastes as required by federal and state laws. Liabilities forremediation costs at each site are based on management’s bestestimate of undiscounted future costs, excluding possible insur-ance recoveries. When there appears to be a range of possiblecosts with equal likelihood, liabilities are based on the lower endof such range. Uncertainties about the status of laws, regulations,technology and information related to individual sites make it diffi-cult to develop a meaningful estimate of the reasonably possibleaggregate environmental remediation exposure. However, even inthe unlikely event that remediation costs amounted to the high endof the range of costs for each site, the resulting additional liabilitywould not be material to GE’s financial position, results of opera-tions or liquidity.
December 31 (In millions) 1998 1997
Investment contracts and universal life benefits $ 29,266 $ 28,266
Life insurance benefits and other (a) 16,104 14,356Unpaid claims and claims adjustment
expenses (b) 19,611 14,654Unearned premiums 5,715 5,068Separate accounts (see note 17) 6,563 4,926
$ 77,259 $ 67,270
(a) Life insurance benefits are accounted for mainly by a net-level-premiummethod using estimated yields generally ranging from 5% to 9% in both 1998and 1997.
(b) Principally property and casualty reserves; includes amounts for both reportedand incurred-but-not-reported claims, reduced by anticipated salvage andsubrogation recoveries. Estimates of liabilities are reviewed and updated con-tinually, with changes in estimated losses reflected in operations.
When GECS cedes insurance to third parties, it is not relieved of its primary obligation to policyholders. Losses on ceded risksgive rise to claims for recovery; allowances are established forsuch receivables from reinsurers.
The insurance liability for unpaid claims and claims adjustmentexpenses related to policies that may cover environmental,asbestos and Year 2000-related exposures is based on knownfacts and an assessment of applicable law and coverage litigation.Liabilities are recognized for both known and unasserted claims(including the cost of related litigation) when sufficient informationhas been developed to indicate that a claim has been incurred anda range of potential losses can be reasonably estimated. Devel-oped case law and adequate claim history do not exist for certainclaims, particularly with respect to Year 2000-related exposures,principally due to significant uncertainties as to both the level ofultimate losses that will occur and what portion, if any, will bedeemed to be insured amounts.
A summary of activity affecting unpaid claims and claimsadjustment expenses follows.
(In millions) 1998 1997 1996
Balance at January 1 — gross $ 14,654 $ 13,184 $ 12,662Less reinsurance recoverables (2,246) (1,822) (1,853)Balance at January 1 — net 12,408 11,362 10,809Claims and expenses incurred
Current year 6,330 4,494 4,087Prior years (162) 146 104
Claims and expenses paidCurrent year (2,400) (1,780) (1,357)Prior years (3,692) (2,816) (2,373)
Claim reserves related toacquired companies 3,476 1,360 309
Other 168 (358) (217)Balance at December 31 — net 16,128 12,408 11,362Add reinsurance recoverables 3,483 2,246 1,822Balance at December 31 — gross $ 19,611 $ 14,654 $ 13,184
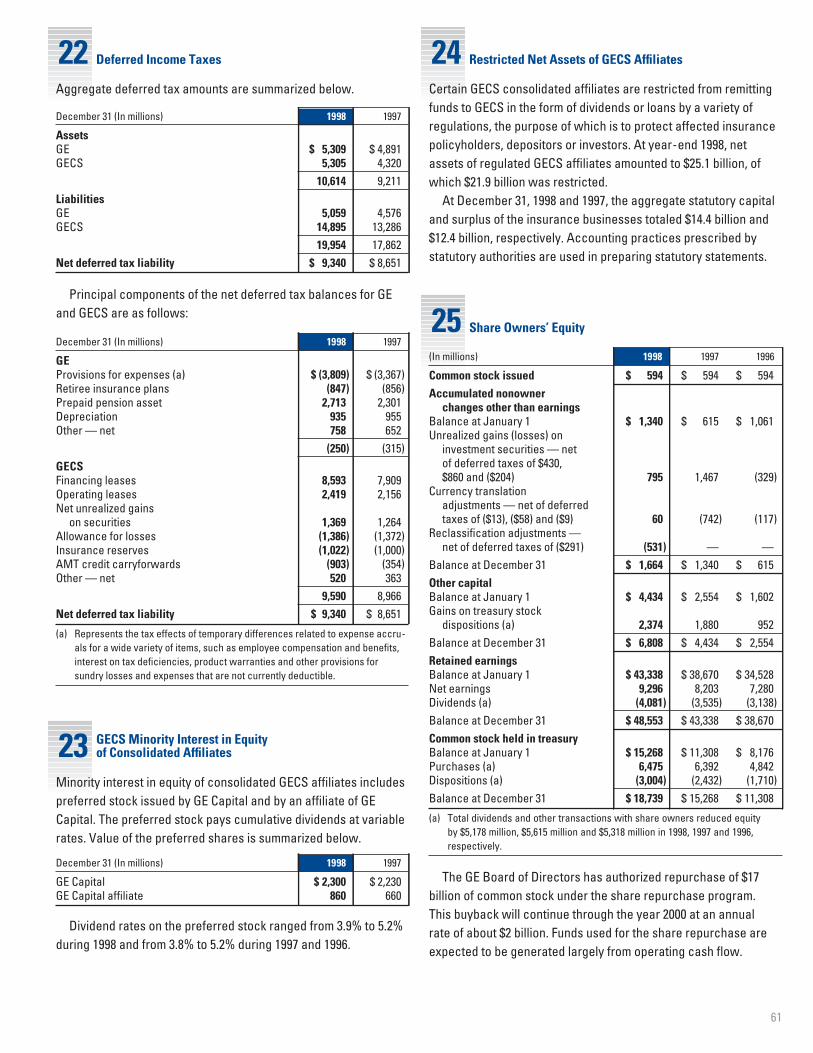
61
25 Share Owners’ Equity
22 Deferred Income Taxes 24 Restricted Net Assets of GECS Affiliates
Aggregate deferred tax amounts are summarized below.
December 31 (In millions) 1998 1997
AssetsGE $ 5,309 $ 4,891GECS 5,305 4,320
10,614 9,211LiabilitiesGE 5,059 4,576GECS 14,895 13,286
19,954 17,862Net deferred tax liability $ 9,340 $ 8,651
Principal components of the net deferred tax balances for GEand GECS are as follows:
December 31 (In millions) 1998 1997
GEProvisions for expenses (a) $ (3,809) $ (3,367)Retiree insurance plans (847) (856)Prepaid pension asset 2,713 2,301Depreciation 935 955Other — net 758 652
(250) (315)GECSFinancing leases 8,593 7,909Operating leases 2,419 2,156Net unrealized gains
on securities 1,369 1,264Allowance for losses (1,386) (1,372)Insurance reserves (1,022) (1,000)AMT credit carryforwards (903) (354)Other — net 520 363
9,590 8,966Net deferred tax liability $ 9,340 $ 8,651
(a) Represents the tax effects of temporary differences related to expense accru-als for a wide variety of items, such as employee compensation and benefits,interest on tax deficiencies, product warranties and other provisions forsundry losses and expenses that are not currently deductible.
Certain GECS consolidated affiliates are restricted from remittingfunds to GECS in the form of dividends or loans by a variety of regulations, the purpose of which is to protect affected insurancepolicyholders, depositors or investors. At year-end 1998, netassets of regulated GECS affiliates amounted to $25.1 billion, ofwhich $21.9 billion was restricted.
At December 31, 1998 and 1997, the aggregate statutory capitaland surplus of the insurance businesses totaled $14.4 billion and$12.4 billion, respectively. Accounting practices prescribed bystatutory authorities are used in preparing statutory statements.
(In millions) 1998 1997 1996
Common stock issued $ 594 $ 594 $ 594Accumulated nonowner
changes other than earningsBalance at January 1 $ 1,340 $ 615 $ 1,061Unrealized gains (losses) on
investment securities — net of deferred taxes of $430, $860 and ($204) 795 1,467 (329)
Currency translation adjustments — net of deferred taxes of ($13), ($58) and ($9) 60 (742) (117)
Reclassification adjustments —net of deferred taxes of ($291) (531) — —
Balance at December 31 $ 1,664 $ 1,340 $ 615Other capitalBalance at January 1 $ 4,434 $ 2,554 $ 1,602Gains on treasury stock
dispositions (a) 2,374 1,880 952Balance at December 31 $ 6,808 $ 4,434 $ 2,554Retained earningsBalance at January 1 $ 43,338 $ 38,670 $ 34,528Net earnings 9,296 8,203 7,280Dividends (a) (4,081) (3,535) (3,138)Balance at December 31 $ 48,553 $ 43,338 $ 38,670Common stock held in treasuryBalance at January 1 $ 15,268 $ 11,308 $ 8,176Purchases (a) 6,475 6,392 4,842Dispositions (a) (3,004) (2,432) (1,710)Balance at December 31 $ 18,739 $ 15,268 $ 11,308
(a) Total dividends and other transactions with share owners reduced equity by $5,178 million, $5,615 million and $5,318 million in 1998, 1997 and 1996,respectively.
The GE Board of Directors has authorized repurchase of $17 billion of common stock under the share repurchase program. This buyback will continue through the year 2000 at an annual rate of about $2 billion. Funds used for the share repurchase areexpected to be generated largely from operating cash flow.
23 GECS Minority Interest in Equityof Consolidated Affiliates
Minority interest in equity of consolidated GECS affiliates includespreferred stock issued by GE Capital and by an affiliate of GE Capital. The preferred stock pays cumulative dividends at variablerates. Value of the preferred shares is summarized below.
December 31 (In millions) 1998 1997
GE Capital $ 2,300 $ 2,230GE Capital affiliate 860 660
Dividend rates on the preferred stock ranged from 3.9% to 5.2%during 1998 and from 3.8% to 5.2% during 1997 and 1996.
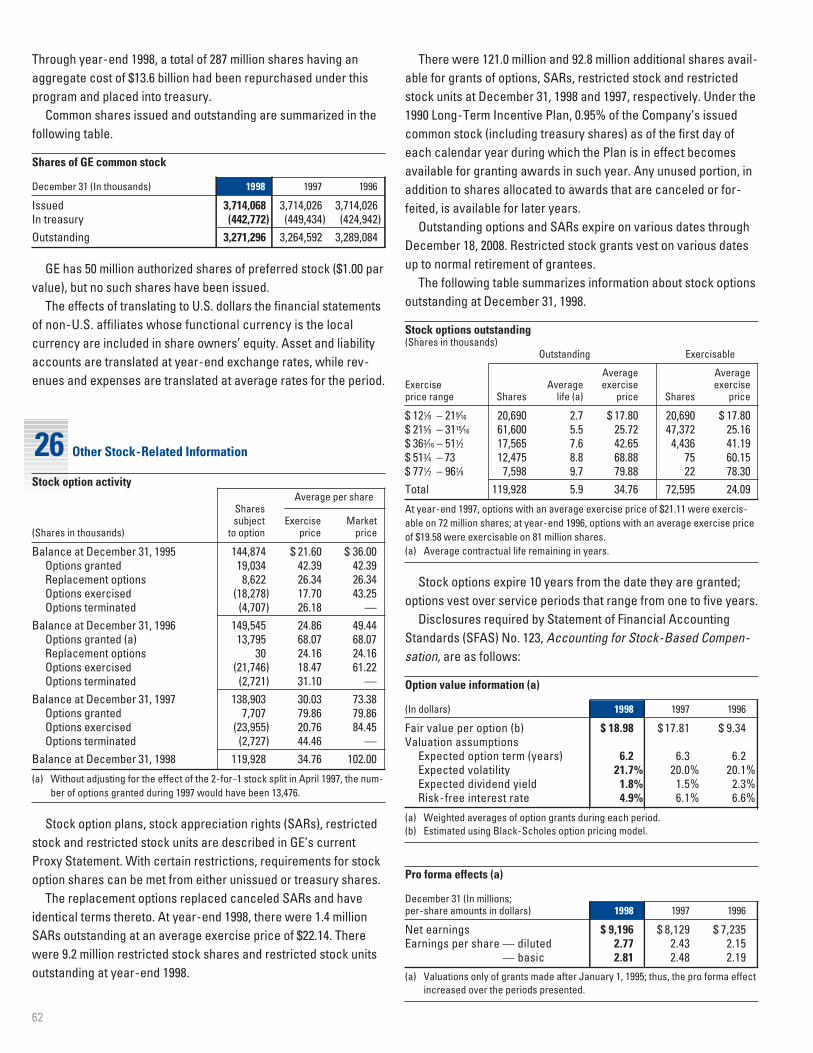
There were 121.0 million and 92.8 million additional shares avail-able for grants of options, SARs, restricted stock and restrictedstock units at December 31, 1998 and 1997, respectively. Under the1990 Long-Term Incentive Plan, 0.95% of the Company’s issuedcommon stock (including treasury shares) as of the first day ofeach calendar year during which the Plan is in effect becomesavailable for granting awards in such year. Any unused portion, inaddition to shares allocated to awards that are canceled or for-feited, is available for later years.
Outstanding options and SARs expire on various dates throughDecember 18, 2008. Restricted stock grants vest on various datesup to normal retirement of grantees.
The following table summarizes information about stock optionsoutstanding at December 31, 1998.
Stock options outstanding(Shares in thousands)
Outstanding Exercisable
Average AverageExercise Average exercise exerciseprice range Shares life (a) price Shares price
$ 121⁄8 – 219⁄16 20,690 2.7 $ 17.80 20,690 $ 17.80$ 215⁄8 – 3115⁄16 61,600 5.5 25.72 47,372 25.16$ 363⁄16 – 511⁄2 17,565 7.6 42.65 4,436 41.19$ 513⁄4 – 73 12,475 8.8 68.88 75 60.15$ 771⁄2 – 967⁄8 7,598 9.7 79.88 22 78.30Total 119,928 5.9 34.76 72,595 24.09
At year-end 1997, options with an average exercise price of $21.11 were exercis-able on 72 million shares; at year-end 1996, options with an average exercise priceof $19.58 were exercisable on 81 million shares. (a) Average contractual life remaining in years.
Stock options expire 10 years from the date they are granted;options vest over service periods that range from one to five years.
Disclosures required by Statement of Financial AccountingStandards (SFAS) No. 123, Accounting for Stock-Based Compen-sation, are as follows:
Option value information (a)
(In dollars) 1998 1997 1996
Fair value per option (b) $ 18.98 $ 17.81 $ 9.34Valuation assumptions
Expected option term (years) 6.2 6.3 6.2Expected volatility 21.7% 20.0% 20.1%Expected dividend yield 1.8% 1.5% 2.3%Risk-free interest rate 4.9% 6.1% 6.6%
(a) Weighted averages of option grants during each period.(b) Estimated using Black-Scholes option pricing model.
Pro forma effects (a)
December 31 (In millions;per-share amounts in dollars) 1998 1997 1996
Net earnings $ 9,196 $ 8,129 $ 7,235Earnings per share — diluted 2.77 2.43 2.15
— basic 2.81 2.48 2.19
(a) Valuations only of grants made after January 1, 1995; thus, the pro forma effectincreased over the periods presented.
62
26 Other Stock-Related Information
Stock option activityAverage per share
Shares subject Exercise Market
(Shares in thousands) to option price price
Balance at December 31, 1995 144,874 $ 21.60 $ 36.00Options granted 19,034 42.39 42.39Replacement options 8,622 26.34 26.34Options exercised (18,278) 17.70 43.25Options terminated (4,707) 26.18 —
Balance at December 31, 1996 149,545 24.86 49.44Options granted (a) 13,795 68.07 68.07Replacement options 30 24.16 24.16Options exercised (21,746) 18.47 61.22Options terminated (2,721) 31.10 —
Balance at December 31, 1997 138,903 30.03 73.38Options granted 7,707 79.86 79.86Options exercised (23,955) 20.76 84.45Options terminated (2,727) 44.46 —
Balance at December 31, 1998 119,928 34.76 102.00
(a) Without adjusting for the effect of the 2-for-1 stock split in April 1997, the num-ber of options granted during 1997 would have been 13,476.
Stock option plans, stock appreciation rights (SARs), restrictedstock and restricted stock units are described in GE’s currentProxy Statement. With certain restrictions, requirements for stockoption shares can be met from either unissued or treasury shares.
The replacement options replaced canceled SARs and haveidentical terms thereto. At year-end 1998, there were 1.4 millionSARs outstanding at an average exercise price of $22.14. Therewere 9.2 million restricted stock shares and restricted stock unitsoutstanding at year-end 1998.
Through year-end 1998, a total of 287 million shares having anaggregate cost of $13.6 billion had been repurchased under thisprogram and placed into treasury.
Common shares issued and outstanding are summarized in thefollowing table.
Shares of GE common stock
December 31 (In thousands) 1998 1997 1996
Issued 3,714,068 3,714,026 3,714,026In treasury (442,772) (449,434) (424,942)Outstanding 3,271,296 3,264,592 3,289,084
GE has 50 million authorized shares of preferred stock ($1.00 parvalue), but no such shares have been issued.
The effects of translating to U.S. dollars the financial statementsof non-U.S. affiliates whose functional currency is the local currency are included in share owners’ equity. Asset and liabilityaccounts are translated at year-end exchange rates, while rev-enues and expenses are translated at average rates for the period.
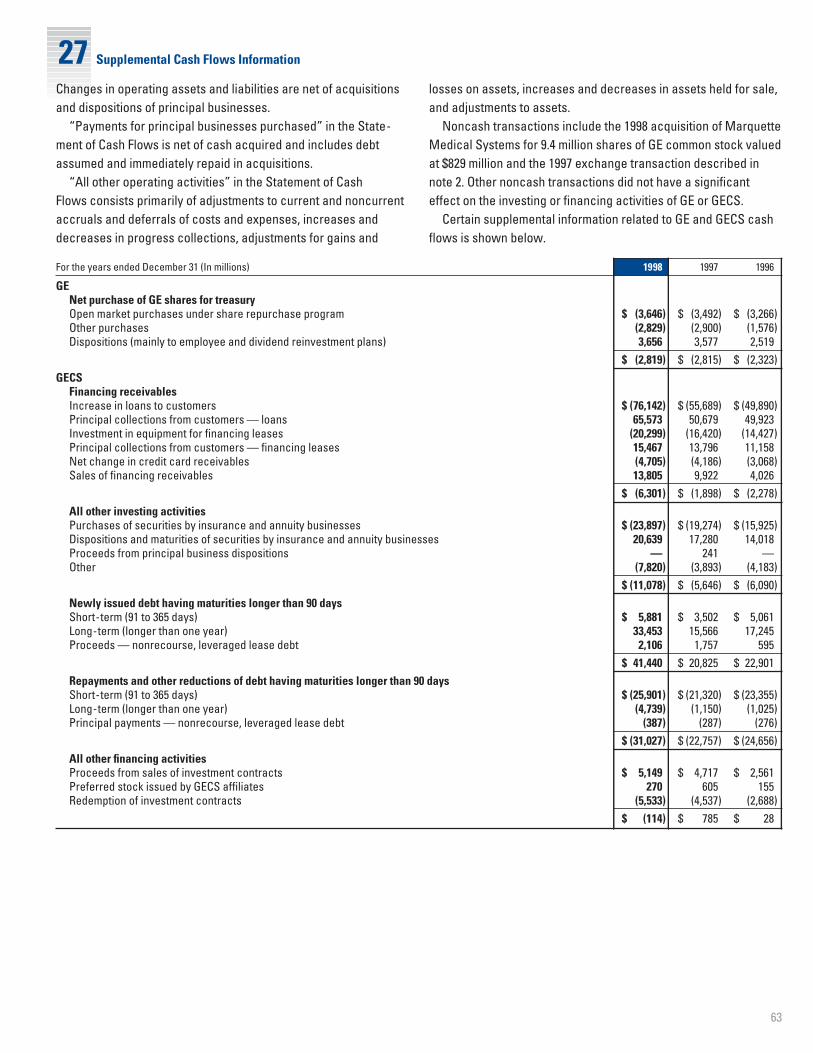
63
27 Supplemental Cash Flows Information
Changes in operating assets and liabilities are net of acquisitionsand dispositions of principal businesses.
“Payments for principal businesses purchased” in the State-ment of Cash Flows is net of cash acquired and includes debtassumed and immediately repaid in acquisitions.
“All other operating activities” in the Statement of Cash Flows consists primarily of adjustments to current and noncurrentaccruals and deferrals of costs and expenses, increases anddecreases in progress collections, adjustments for gains and
losses on assets, increases and decreases in assets held for sale,and adjustments to assets.
Noncash transactions include the 1998 acquisition of MarquetteMedical Systems for 9.4 million shares of GE common stock valuedat $829 million and the 1997 exchange transaction described innote 2. Other noncash transactions did not have a significanteffect on the investing or financing activities of GE or GECS.
Certain supplemental information related to GE and GECS cashflows is shown below.
For the years ended December 31 (In millions) 1998 1997 1996
GENet purchase of GE shares for treasuryOpen market purchases under share repurchase program $ (3,646) $ (3,492) $ (3,266)Other purchases (2,829) (2,900) (1,576)Dispositions (mainly to employee and dividend reinvestment plans) 3,656 3,577 2,519
$ (2,819) $ (2,815) $ (2,323)GECS
Financing receivablesIncrease in loans to customers $ (76,142) $ (55,689) $ (49,890)Principal collections from customers — loans 65,573 50,679 49,923Investment in equipment for financing leases (20,299) (16,420) (14,427)Principal collections from customers — financing leases 15,467 13,796 11,158Net change in credit card receivables (4,705) (4,186) (3,068)Sales of financing receivables 13,805 9,922 4,026
$ (6,301) $ (1,898) $ (2,278)All other investing activitiesPurchases of securities by insurance and annuity businesses $ (23,897) $ (19,274) $ (15,925)Dispositions and maturities of securities by insurance and annuity businesses 20,639 17,280 14,018Proceeds from principal business dispositions — 241 —Other (7,820) (3,893) (4,183)
$ (11,078) $ (5,646) $ (6,090)Newly issued debt having maturities longer than 90 daysShort-term (91 to 365 days) $ 5,881 $ 3,502 $ 5,061Long-term (longer than one year) 33,453 15,566 17,245Proceeds — nonrecourse, leveraged lease debt 2,106 1,757 595
$ 41,440 $ 20,825 $ 22,901Repayments and other reductions of debt having maturities longer than 90 daysShort-term (91 to 365 days) $ (25,901) $ (21,320) $ (23,355)Long-term (longer than one year) (4,739) (1,150) (1,025)Principal payments — nonrecourse, leveraged lease debt (387) (287) (276)
$ (31,027) $ (22,757) $ (24,656)All other financing activitiesProceeds from sales of investment contracts $ 5,149 $ 4,717 $ 2,561Preferred stock issued by GECS affiliates 270 605 155Redemption of investment contracts (5,533) (4,537) (2,688)
$ (114) $ 785 $ 28

28 Operating Segments
64
At year-end 1998, GE adopted SFAS No. 131, Disclosures aboutSegments of an Enterprise and Related Information. Prior-periodamounts have been restated in accordance with the requirementsof the new standard.
Basis for presentation. The Company’s operating businesses areorganized based on the nature of products and services provided.Certain GE businesses do not meet the definition of a reportable
operating segment and have been aggregated. The IndustrialProducts and Systems segment consists of Industrial Systems,Lighting, Transportation Systems and GE Supply. The TechnicalProducts and Services segment consists of Medical Systems and Information Services.
Segment accounting policies are the same as policies describedin note 1.
RevenuesFor the years ended December 31
Total revenues Intersegment revenues External revenues
(In millions) 1998 1997 1996 1998 1997 1996 1998 1997 1996
GEAircraft Engines $ 10,294 $ 7,799 $ 6,302 $ 292 $ 101 $ 86 $ 10,002 $ 7,698 $ 6,216Appliances 5,619 5,801 5,586 12 12 5 5,607 5,789 5,581Industrial Products and Systems 11,222 10,984 10,401 479 491 453 10,743 10,493 9,948NBC 5,269 5,153 5,232 — — — 5,269 5,153 5,232Plastics 6,633 6,695 6,509 20 24 22 6,613 6,671 6,487Power Systems 8,466 7,915 7,643 166 80 67 8,300 7,835 7,576Technical Products and Services 5,323 4,861 4,700 14 18 23 5,309 4,843 4,677All Other 264 308 291 — — — 264 308 291Eliminations (1,367) (1,176) (1,032) (983) (726) (656) (384) (450) (376)Total GE segment revenues 51,723 48,340 45,632 — — — 51,723 48,340 45,632Corporate items (a) 507 2,919 1,116 — — — 507 2,919 1,116GECS net earnings 3,796 3,256 2,817 — — — 3,796 3,256 2,817
Total GE 56,026 54,515 49,565 — — — 56,026 54,515 49,565GECS 48,694 39,931 32,713 — — — 48,694 39,931 32,713Eliminations (4,251) (3,606) (3,099) — — — (4,251) (3,606) (3,099)Consolidated revenues $ 100,469 $ 90,840 $ 79,179 $ — $ — $ — $ 100,469 $ 90,840 $ 79,179
GE revenues include income from sales of goods and services to customers and other income. Sales from one Company component to another generally are priced atequivalent commercial selling prices.(a) Includes revenues of $944 million and $789 million in 1997 and 1996, respectively, from an appliance distribution affiliate that was deconsolidated in 1998. Also includes
$1,538 million in 1997 from exchanging preferred stock in Lockheed Martin Corporation for the stock of a newly formed subsidiary.
Assets Property, plant and equipment Depreciation and amortizationadditions (including equipment (including goodwill and otherleased to others) intangibles)
At December 31 For the years ended December 31 For the years ended December 31
(In millions) 1998 1997 1996 1998 1997 1996 1998 1997 1996
GEAircraft Engines $ 8,866 $ 8,895 $ 5,423 $ 480 $ 729 $ 551 $ 398 $ 292 $ 282Appliances 2,436 2,354 2,399 150 83 168 137 131 123Industrial Products and Systems 6,466 6,672 6,574 428 487 450 440 408 362NBC 3,264 3,050 3,007 105 116 176 127 142 121Plastics 9,813 8,890 9,130 722 618 748 591 494 552Power Systems 7,253 6,182 6,322 246 215 185 215 199 184Technical Products and Services 3,858 2,438 2,245 254 189 154 143 137 123All Other 189 224 239 — — — 52 46 40Total GE segments 42,145 38,705 35,339 2,385 2,437 2,432 2,103 1,849 1,787Investment in GECS 19,727 17,239 14,276 — — — — — —Corporate items and eliminations (a) 12,798 11,482 10,310 158 129 114 189 180 176
Total GE 74,670 67,426 59,925 2,543 2,566 2,546 2,292 2,029 1,963GECS 303,297 255,408 227,419 8,110 7,320 5,762 3,568 3,240 2,805Eliminations (22,032) (18,822) (14,942) — — — — — —Consolidated totals $ 355,935 $ 304,012 $ 272,402 $ 10,653 $ 9,886 $ 8,308 $ 5,860 $ 5,269 $ 4,768
Additions to property, plant and equipment include amounts relating to principal businesses purchased. (a) Depreciation and amortization includes $64 million of unallocated RCA goodwill amortization in 1998, 1997 and 1996 that relates to NBC.
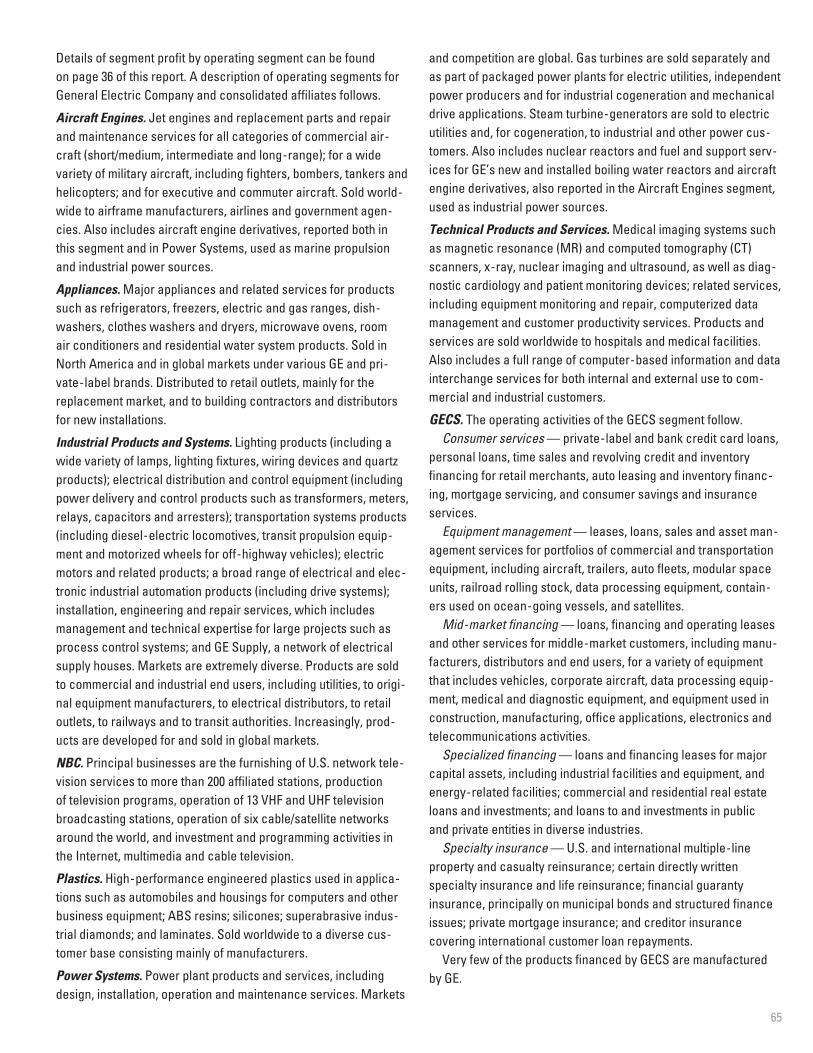
65
Details of segment profit by operating segment can be found on page 36 of this report. A description of operating segments forGeneral Electric Company and consolidated affiliates follows.
Aircraft Engines. Jet engines and replacement parts and repairand maintenance services for all categories of commercial air-craft (short/medium, intermediate and long-range); for a widevariety of military aircraft, including fighters, bombers, tankers andhelicopters; and for executive and commuter aircraft. Sold world-wide to airframe manufacturers, airlines and government agen-cies. Also includes aircraft engine derivatives, reported both inthis segment and in Power Systems, used as marine propulsionand industrial power sources.
Appliances. Major appliances and related services for productssuch as refrigerators, freezers, electric and gas ranges, dish-washers, clothes washers and dryers, microwave ovens, room air conditioners and residential water system products. Sold inNorth America and in global markets under various GE and pri-vate-label brands. Distributed to retail outlets, mainly for thereplacement market, and to building contractors and distributorsfor new installations.
Industrial Products and Systems. Lighting products (including awide variety of lamps, lighting fixtures, wiring devices and quartzproducts); electrical distribution and control equipment (includingpower delivery and control products such as transformers, meters,relays, capacitors and arresters); transportation systems products(including diesel-electric locomotives, transit propulsion equip-ment and motorized wheels for off-highway vehicles); electricmotors and related products; a broad range of electrical and elec-tronic industrial automation products (including drive systems);installation, engineering and repair services, which includes management and technical expertise for large projects such asprocess control systems; and GE Supply, a network of electricalsupply houses. Markets are extremely diverse. Products are soldto commercial and industrial end users, including utilities, to origi-nal equipment manufacturers, to electrical distributors, to retailoutlets, to railways and to transit authorities. Increasingly, prod-ucts are developed for and sold in global markets.
NBC. Principal businesses are the furnishing of U.S. network tele-vision services to more than 200 affiliated stations, production of television programs, operation of 13 VHF and UHF televisionbroadcasting stations, operation of six cable/satellite networksaround the world, and investment and programming activities inthe Internet, multimedia and cable television.
Plastics. High-performance engineered plastics used in applica-tions such as automobiles and housings for computers and otherbusiness equipment; ABS resins; silicones; superabrasive indus-trial diamonds; and laminates. Sold worldwide to a diverse cus-tomer base consisting mainly of manufacturers.
Power Systems. Power plant products and services, includingdesign, installation, operation and maintenance services. Markets
and competition are global. Gas turbines are sold separately andas part of packaged power plants for electric utilities, independentpower producers and for industrial cogeneration and mechanicaldrive applications. Steam turbine-generators are sold to electricutilities and, for cogeneration, to industrial and other power cus-tomers. Also includes nuclear reactors and fuel and support serv-ices for GE’s new and installed boiling water reactors and aircraftengine derivatives, also reported in the Aircraft Engines segment,used as industrial power sources.
Technical Products and Services. Medical imaging systems suchas magnetic resonance (MR) and computed tomography (CT)scanners, x-ray, nuclear imaging and ultrasound, as well as diag-nostic cardiology and patient monitoring devices; related services,including equipment monitoring and repair, computerized datamanagement and customer productivity services. Products andservices are sold worldwide to hospitals and medical facilities.Also includes a full range of computer-based information and datainterchange services for both internal and external use to com-mercial and industrial customers.
GECS. The operating activities of the GECS segment follow.Consumer services — private-label and bank credit card loans,
personal loans, time sales and revolving credit and inventoryfinancing for retail merchants, auto leasing and inventory financ-ing, mortgage servicing, and consumer savings and insuranceservices.
Equipment management — leases, loans, sales and asset man-agement services for portfolios of commercial and transportationequipment, including aircraft, trailers, auto fleets, modular spaceunits, railroad rolling stock, data processing equipment, contain-ers used on ocean-going vessels, and satellites.
Mid-market financing — loans, financing and operating leasesand other services for middle-market customers, including manu-facturers, distributors and end users, for a variety of equipmentthat includes vehicles, corporate aircraft, data processing equip-ment, medical and diagnostic equipment, and equipment used inconstruction, manufacturing, office applications, electronics andtelecommunications activities.
Specialized financing — loans and financing leases for majorcapital assets, including industrial facilities and equipment, andenergy-related facilities; commercial and residential real estateloans and investments; and loans to and investments in public and private entities in diverse industries.
Specialty insurance — U.S. and international multiple-lineproperty and casualty reinsurance; certain directly written specialty insurance and life reinsurance; financial guarantyinsurance, principally on municipal bonds and structured financeissues; private mortgage insurance; and creditor insurance covering international customer loan repayments.
Very few of the products financed by GECS are manufacturedby GE.
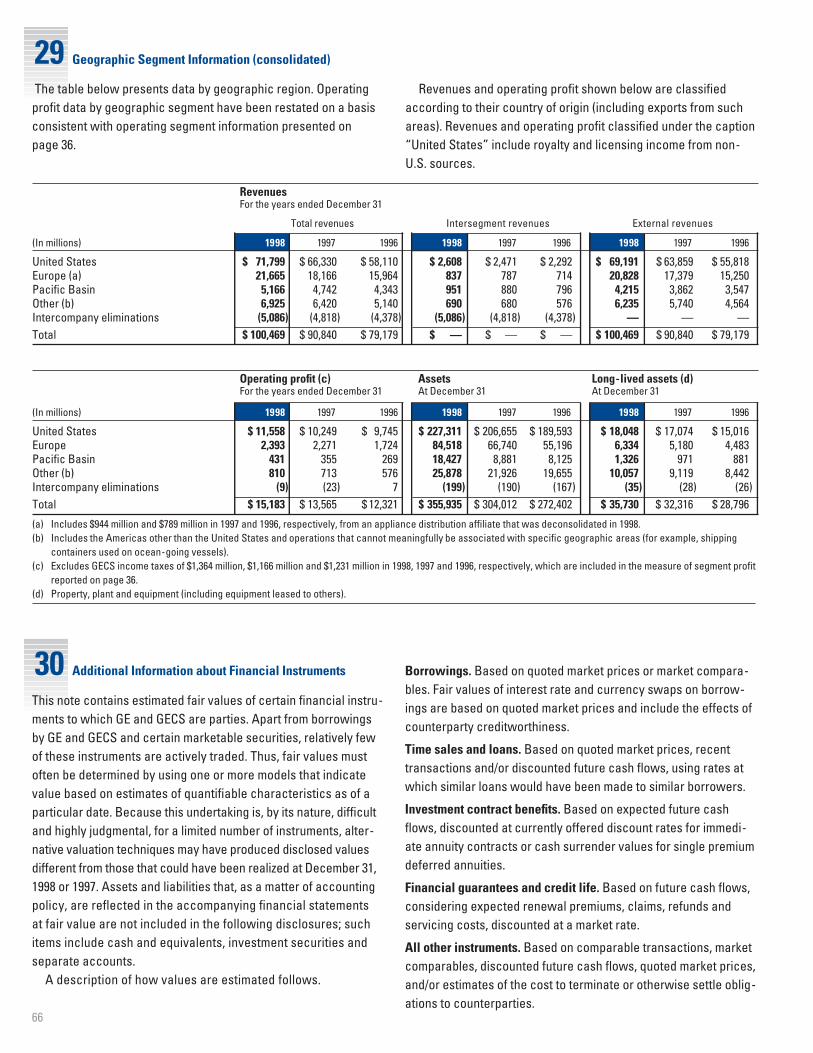
RevenuesFor the years ended December 31
Total revenues Intersegment revenues External revenues
(In millions) 1998 1997 1996 1998 1997 1996 1998 1997 1996
United States $ 71,799 $ 66,330 $ 58,110 $ 2,608 $ 2,471 $ 2,292 $ 69,191 $ 63,859 $ 55,818Europe (a) 21,665 18,166 15,964 837 787 714 20,828 17,379 15,250Pacific Basin 5,166 4,742 4,343 951 880 796 4,215 3,862 3,547Other (b) 6,925 6,420 5,140 690 680 576 6,235 5,740 4,564Intercompany eliminations (5,086) (4,818) (4,378) (5,086) (4,818) (4,378) — — —Total $ 100,469 $ 90,840 $ 79,179 $ — $ — $ — $ 100,469 $ 90,840 $ 79,179
Operating profit (c) Assets Long-lived assets (d)For the years ended December 31 At December 31 At December 31
(In millions) 1998 1997 1996 1998 1997 1996 1998 1997 1996
United States $ 11,558 $ 10,249 $ 9,745 $ 227,311 $ 206,655 $ 189,593 $ 18,048 $ 17,074 $ 15,016Europe 2,393 2,271 1,724 84,518 66,740 55,196 6,334 5,180 4,483Pacific Basin 431 355 269 18,427 8,881 8,125 1,326 971 881Other (b) 810 713 576 25,878 21,926 19,655 10,057 9,119 8,442Intercompany eliminations (9) (23) 7 (199) (190) (167) (35) (28) (26)Total $ 15,183 $ 13,565 $ 12,321 $ 355,935 $ 304,012 $ 272,402 $ 35,730 $ 32,316 $ 28,796
(a) Includes $944 million and $789 million in 1997 and 1996, respectively, from an appliance distribution affiliate that was deconsolidated in 1998.(b) Includes the Americas other than the United States and operations that cannot meaningfully be associated with specific geographic areas (for example, shipping
containers used on ocean-going vessels).(c) Excludes GECS income taxes of $1,364 million, $1,166 million and $1,231 million in 1998, 1997 and 1996, respectively, which are included in the measure of segment profit
reported on page 36.(d) Property, plant and equipment (including equipment leased to others).
66
30 Additional Information about Financial Instruments
29 Geographic Segment Information (consolidated)
The table below presents data by geographic region. Operatingprofit data by geographic segment have been restated on a basisconsistent with operating segment information presented on page 36.
Revenues and operating profit shown below are classifiedaccording to their country of origin (including exports from suchareas). Revenues and operating profit classified under the caption“United States” include royalty and licensing income from non-U.S. sources.
This note contains estimated fair values of certain financial instru-ments to which GE and GECS are parties. Apart from borrowings by GE and GECS and certain marketable securities, relatively few of these instruments are actively traded. Thus, fair values mustoften be determined by using one or more models that indicatevalue based on estimates of quantifiable characteristics as of aparticular date. Because this undertaking is, by its nature, difficultand highly judgmental, for a limited number of instruments, alter-native valuation techniques may have produced disclosed valuesdifferent from those that could have been realized at December 31,1998 or 1997. Assets and liabilities that, as a matter of accountingpolicy, are reflected in the accompanying financial statements at fair value are not included in the following disclosures; suchitems include cash and equivalents, investment securities andseparate accounts.
A description of how values are estimated follows.
Borrowings. Based on quoted market prices or market compara-bles. Fair values of interest rate and currency swaps on borrow-ings are based on quoted market prices and include the effects ofcounterparty creditworthiness.
Time sales and loans. Based on quoted market prices, recenttransactions and/or discounted future cash flows, using rates atwhich similar loans would have been made to similar borrowers.
Investment contract benefits. Based on expected future cashflows, discounted at currently offered discount rates for immedi-ate annuity contracts or cash surrender values for single premiumdeferred annuities.
Financial guarantees and credit life. Based on future cash flows,considering expected renewal premiums, claims, refunds andservicing costs, discounted at a market rate.
All other instruments. Based on comparable transactions, marketcomparables, discounted future cash flows, quoted market prices,and/or estimates of the cost to terminate or otherwise settle oblig-ations to counterparties.
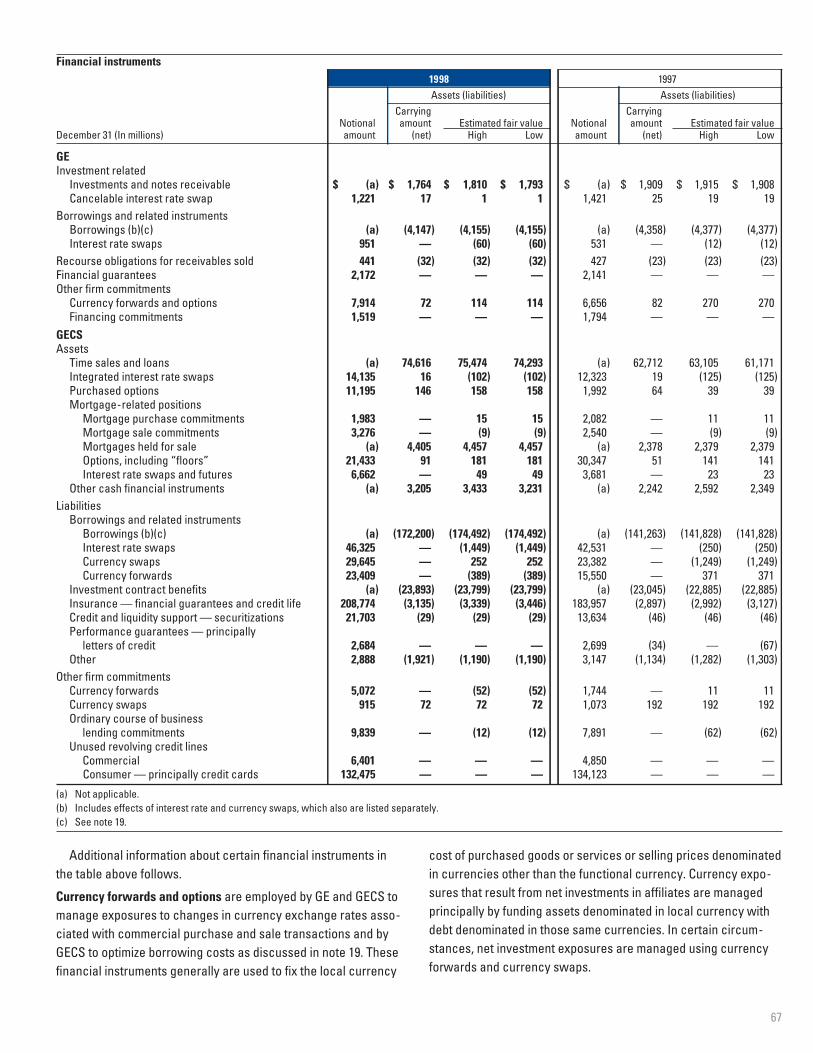
67
cost of purchased goods or services or selling prices denominatedin currencies other than the functional currency. Currency expo-sures that result from net investments in affiliates are managedprincipally by funding assets denominated in local currency withdebt denominated in those same currencies. In certain circum-stances, net investment exposures are managed using currencyforwards and currency swaps.
Additional information about certain financial instruments in the table above follows.
Currency forwards and options are employed by GE and GECS tomanage exposures to changes in currency exchange rates asso-ciated with commercial purchase and sale transactions and byGECS to optimize borrowing costs as discussed in note 19. Thesefinancial instruments generally are used to fix the local currency
Financial instruments1998 1997Assets (liabilities) Assets (liabilities)
Carrying CarryingNotional amount Estimated fair value Notional amount Estimated fair value
December 31 (In millions) amount (net) High Low amount (net) High Low
GEInvestment related
Investments and notes receivable $ (a) $ 1,764 $ 1,810 $ 1,793 $ (a) $ 1,909 $ 1,915 $ 1,908Cancelable interest rate swap 1,221 17 1 1 1,421 25 19 19
Borrowings and related instrumentsBorrowings (b)(c) (a) (4,147) (4,155) (4,155) (a) (4,358) (4,377) (4,377)Interest rate swaps 951 — (60) (60) 531 — (12) (12)
Recourse obligations for receivables sold 441 (32) (32) (32) 427 (23) (23) (23)Financial guarantees 2,172 — — — 2,141 — — —Other firm commitments
Currency forwards and options 7,914 72 114 114 6,656 82 270 270Financing commitments 1,519 — — — 1,794 — — —
GECSAssets
Time sales and loans (a) 74,616 75,474 74,293 (a) 62,712 63,105 61,171Integrated interest rate swaps 14,135 16 (102) (102) 12,323 19 (125) (125)Purchased options 11,195 146 158 158 1,992 64 39 39Mortgage-related positions
Mortgage purchase commitments 1,983 — 15 15 2,082 — 11 11Mortgage sale commitments 3,276 — (9) (9) 2,540 — (9) (9)Mortgages held for sale (a) 4,405 4,457 4,457 (a) 2,378 2,379 2,379Options, including “floors” 21,433 91 181 181 30,347 51 141 141Interest rate swaps and futures 6,662 — 49 49 3,681 — 23 23
Other cash financial instruments (a) 3,205 3,433 3,231 (a) 2,242 2,592 2,349Liabilities
Borrowings and related instrumentsBorrowings (b)(c) (a) (172,200) (174,492) (174,492) (a) (141,263) (141,828) (141,828)Interest rate swaps 46,325 — (1,449) (1,449) 42,531 — (250) (250)Currency swaps 29,645 — 252 252 23,382 — (1,249) (1,249)Currency forwards 23,409 — (389) (389) 15,550 — 371 371
Investment contract benefits (a) (23,893) (23,799) (23,799) (a) (23,045) (22,885) (22,885)Insurance — financial guarantees and credit life 208,774 (3,135) (3,339) (3,446) 183,957 (2,897) (2,992) (3,127)Credit and liquidity support — securitizations 21,703 (29) (29) (29) 13,634 (46) (46) (46)Performance guarantees — principally
letters of credit 2,684 — — — 2,699 (34) — (67)Other 2,888 (1,921) (1,190) (1,190) 3,147 (1,134) (1,282) (1,303)
Other firm commitmentsCurrency forwards 5,072 — (52) (52) 1,744 — 11 11Currency swaps 915 72 72 72 1,073 192 192 192Ordinary course of business
lending commitments 9,839 — (12) (12) 7,891 — (62) (62)Unused revolving credit lines
Commercial 6,401 — — — 4,850 — — —Consumer — principally credit cards 132,475 — — — 134,123 — — —
(a) Not applicable. (b) Includes effects of interest rate and currency swaps, which also are listed separately. (c) See note 19.
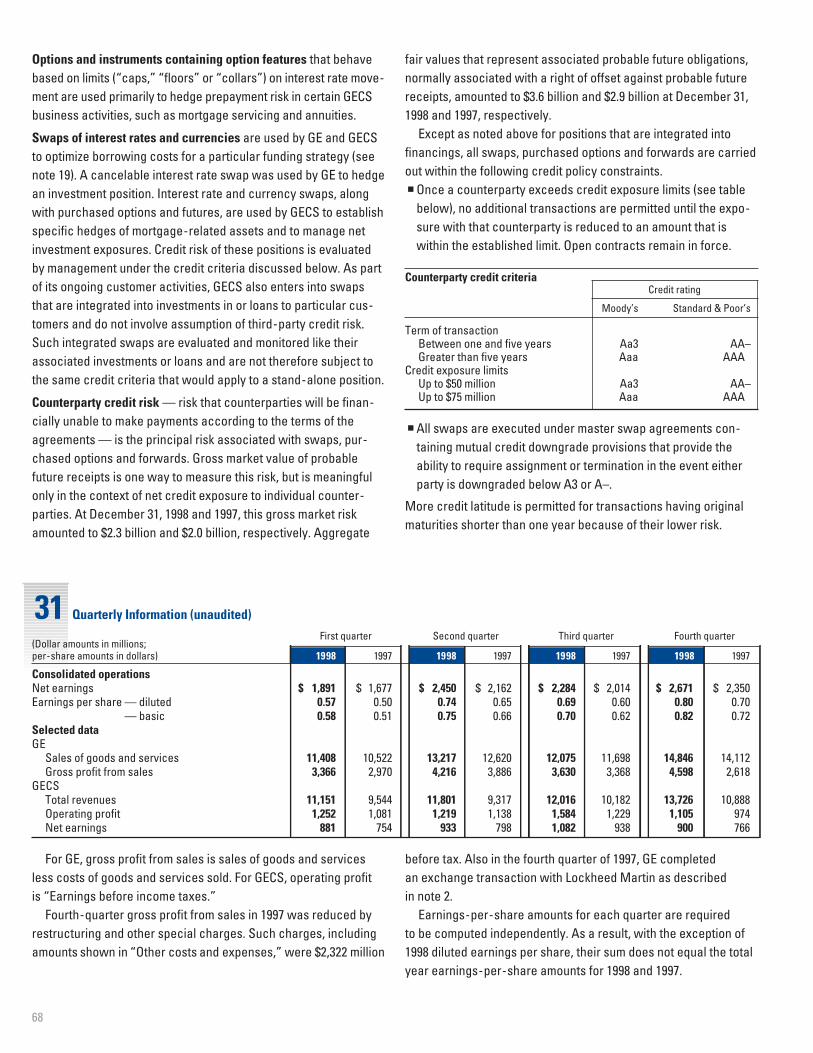
68
31 Quarterly Information (unaudited)
fair values that represent associated probable future obligations,normally associated with a right of offset against probable futurereceipts, amounted to $3.6 billion and $2.9 billion at December 31,1998 and 1997, respectively.
Except as noted above for positions that are integrated intofinancings, all swaps, purchased options and forwards are carriedout within the following credit policy constraints.n Once a counterparty exceeds credit exposure limits (see table
below), no additional transactions are permitted until the expo-sure with that counterparty is reduced to an amount that iswithin the established limit. Open contracts remain in force.
Counterparty credit criteriaCredit rating
Moody’s Standard & Poor’s
Term of transactionBetween one and five years Aa3 AA–Greater than five years Aaa AAA
Credit exposure limitsUp to $50 million Aa3 AA–Up to $75 million Aaa AAA
n All swaps are executed under master swap agreements con-taining mutual credit downgrade provisions that provide theability to require assignment or termination in the event eitherparty is downgraded below A3 or A–.
More credit latitude is permitted for transactions having originalmaturities shorter than one year because of their lower risk.
Options and instruments containing option features that behavebased on limits (“caps,” “floors” or “collars”) on interest rate move-ment are used primarily to hedge prepayment risk in certain GECSbusiness activities, such as mortgage servicing and annuities.
Swaps of interest rates and currencies are used by GE and GECSto optimize borrowing costs for a particular funding strategy (seenote 19). A cancelable interest rate swap was used by GE to hedgean investment position. Interest rate and currency swaps, alongwith purchased options and futures, are used by GECS to establishspecific hedges of mortgage-related assets and to manage netinvestment exposures. Credit risk of these positions is evaluatedby management under the credit criteria discussed below. As partof its ongoing customer activities, GECS also enters into swapsthat are integrated into investments in or loans to particular cus-tomers and do not involve assumption of third-party credit risk.Such integrated swaps are evaluated and monitored like theirassociated investments or loans and are not therefore subject tothe same credit criteria that would apply to a stand-alone position.
Counterparty credit risk — risk that counterparties will be finan-cially unable to make payments according to the terms of theagreements — is the principal risk associated with swaps, pur-chased options and forwards. Gross market value of probablefuture receipts is one way to measure this risk, but is meaningfulonly in the context of net credit exposure to individual counter-parties. At December 31, 1998 and 1997, this gross market riskamounted to $2.3 billion and $2.0 billion, respectively. Aggregate
For GE, gross profit from sales is sales of goods and servicesless costs of goods and services sold. For GECS, operating profit is “Earnings before income taxes.”
Fourth-quarter gross profit from sales in 1997 was reduced byrestructuring and other special charges. Such charges, includingamounts shown in “Other costs and expenses,” were $2,322 million
before tax. Also in the fourth quarter of 1997, GE completed an exchange transaction with Lockheed Martin as described in note 2.
Earnings-per-share amounts for each quarter are required to be computed independently. As a result, with the exception of1998 diluted earnings per share, their sum does not equal the totalyear earnings-per-share amounts for 1998 and 1997.
First quarter Second quarter Third quarter Fourth quarter(Dollar amounts in millions;per-share amounts in dollars) 1998 1997 1998 1997 1998 1997 1998 1997
Consolidated operationsNet earnings $ 1,891 $ 1,677 $ 2,450 $ 2,162 $ 2,284 $ 2,014 $ 2,671 $ 2,350Earnings per share — diluted 0.57 0.50 0.74 0.65 0.69 0.60 0.80 0.70
— basic 0.58 0.51 0.75 0.66 0.70 0.62 0.82 0.72Selected dataGE
Sales of goods and services 11,408 10,522 13,217 12,620 12,075 11,698 14,846 14,112Gross profit from sales 3,366 2,970 4,216 3,886 3,630 3,368 4,598 2,618
GECSTotal revenues 11,151 9,544 11,801 9,317 12,016 10,182 13,726 10,888Operating profit 1,252 1,081 1,219 1,138 1,584 1,229 1,105 974Net earnings 881 754 933 798 1,082 938 900 766
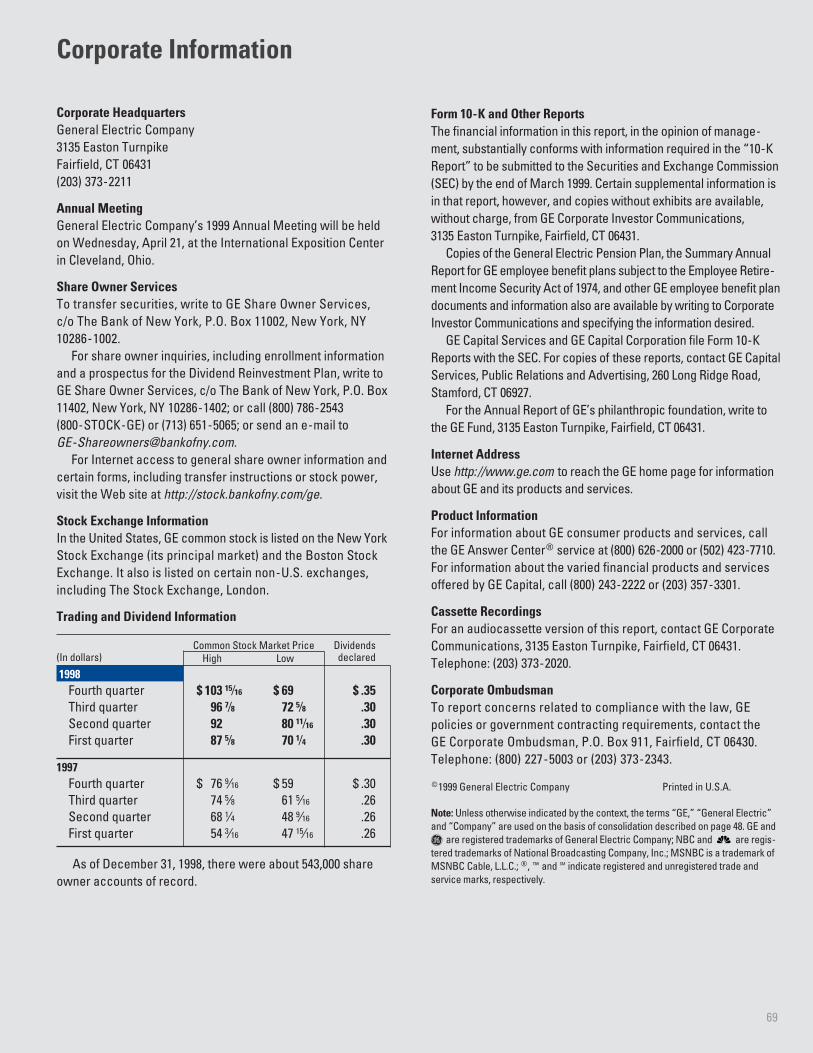
Form 10-K and Other ReportsThe financial information in this report, in the opinion of manage-ment, substantially conforms with information required in the “10-KReport” to be submitted to the Securities and Exchange Commission(SEC) by the end of March 1999. Certain supplemental information isin that report, however, and copies without exhibits are available,without charge, from GE Corporate Investor Communications,3135 Easton Turnpike, Fairfield, CT 06431.
Copies of the General Electric Pension Plan, the Summary AnnualReport for GE employee benefit plans subject to the Employee Retire-ment Income Security Act of 1974, and other GE employee benefit plandocuments and information also are available by writing to CorporateInvestor Communications and specifying the information desired.
GE Capital Services and GE Capital Corporation file Form 10-KReports with the SEC. For copies of these reports, contact GE CapitalServices, Public Relations and Advertising, 260 Long Ridge Road,Stamford, CT 06927.
For the Annual Report of GE’s philanthropic foundation, write tothe GE Fund, 3135 Easton Turnpike, Fairfield, CT 06431.
Internet AddressUse http: //www.ge.com to reach the GE home page for informationabout GE and its products and services.
Product InformationFor information about GE consumer products and services, call the GE Answer Center® service at (800) 626-2000 or (502) 423-7710.For information about the varied financial products and servicesoffered by GE Capital, call (800) 243-2222 or (203) 357-3301.
Cassette RecordingsFor an audiocassette version of this report, contact GE CorporateCommunications, 3135 Easton Turnpike, Fairfield, CT 06431. Telephone: (203) 373-2020.
Corporate OmbudsmanTo report concerns related to compliance with the law, GE policies or government contracting requirements, contact the GE Corporate Ombudsman, P.O. Box 911, Fairfield, CT 06430.Telephone: (800) 227-5003 or (203) 373-2343.
©1999 General Electric Company Printed in U.S.A.
Note: Unless otherwise indicated by the context, the terms “GE,” “General Electric”and “Company” are used on the basis of consolidation described on page 48. GE andg are registered trademarks of General Electric Company; NBC and are regis-tered trademarks of National Broadcasting Company, Inc.; MSNBC is a trademark ofMSNBC Cable, L.L.C.; ®, ™ and æ indicate registered and unregistered trade andservice marks, respectively.
Corporate Information
Corporate HeadquartersGeneral Electric Company3135 Easton TurnpikeFairfield, CT 06431(203) 373-2211
Annual MeetingGeneral Electric Company’s 1999 Annual Meeting will be held on Wednesday, April 21, at the International Exposition Center in Cleveland, Ohio.
Share Owner ServicesTo transfer securities, write to GE Share Owner Services, c/o The Bank of New York, P.O. Box 11002, New York, NY 10286-1002.
For share owner inquiries, including enrollment information and a prospectus for the Dividend Reinvestment Plan, write to GE Share Owner Services, c/o The Bank of New York, P.O. Box11402, New York, NY 10286-1402; or call (800) 786-2543 (800-STOCK-GE) or (713) 651-5065; or send an e-mail to [email protected].
For Internet access to general share owner information andcertain forms, including transfer instructions or stock power, visit the Web site at http: //stock.bankofny.com/ge.
Stock Exchange InformationIn the United States, GE common stock is listed on the New YorkStock Exchange (its principal market) and the Boston StockExchange. It also is listed on certain non-U.S. exchanges, including The Stock Exchange, London.
Trading and Dividend Information
Common Stock Market Price Dividends(In dollars) High Low declared
1998Fourth quarter $ 103 Æ $ 69 $ .35Third quarter 96 º 72 ª .30Second quarter 92 80 Ú .30First quarter 87 ª 70 › .30
1997Fourth quarter $ 76 ¬ $ 59 $ .30Third quarter 74 ª 61 « .26Second quarter 68 › 48 ¬ .26First quarter 54 » 47 Æ .26
As of December 31, 1998, there were about 543,000 shareowner accounts of record.
69

General Electric CompanyFairfield, Connecticut 06431www.ge.com
Bulk RateU.S. PostagePaidGeneral Electric Company