Embed Size (px)
Citation preview

General Distribution OCDE/GD(96)105
ECONOMICS DEPARTMENTWORKING PAPERS
NO. 165
TRADE AND COMPETITION: FRICTIONS AFTER THE URUGUAY ROUND
byInternational Trade and Investment Division
ORGANISATION FOR ECONOMIC CO-OPERATION AND DEVELOPMENT
Paris 1996
35090
Document complet disponible sur OLIS dans son format d'origine
Complete document available on OLIS in its original format

TRADE AND COMPETITION: FRICTIONS AFTER THE URUGUAY ROUND
With the gradual dismantling of tariffs and the growing integration of markets across countries,non-tariff and non-border barriers to international trade, investment and competition have become morevisible, a greater source of trade tensions and costly with regard to the foregone global benefits of increasedefficiency. In many OECD and non-OECD economies, market regulations were not designed with a viewto their international ramifications, and domestic policies in the domain of trade, competition andinvestment, with few exceptions, take little account of international repercussions of non-border obstaclesto the functioning of markets. Against this background, this paper examines the main issues underlyingthe current discussion of trade, investment and competition policy interactions, and the scope for furtherinternational co-operation.
******
Le démantèlement graduel des tarifs et l’intégration croissante des marchés entre les différentspays, ont rendu beaucoup plus visibles les barrières non douanières et non tarifaires au commerceinternational, aux investissements et à la concurrence, constituant une source plus importante de tensionscommerciales coûteuses comparées au bénéfice global attendu d’une efficacité accrue. Dans beaucoup depays tant membres que non membres de l’OCDE, les réglementations des marchés ont été élaborées sansconsidération de leurs ramifications internationales, et, à quelques exceptions près, les politiques nationalesdans les domaines des échanges, de la concurrence et de l’investissement n’ont que très peu tenu comptedes répercussions internationales des obstacles non douaniers au fonctionnement des marchés. Face à cettesituation, ce document examine les principales questions sous jacentes aux discussions actuelles sur lesinteractions entre les échanges, les investissements et la politique de la concurrence, ainsi que les champspossibles d’élargissement de la coopération internationale.
Copyright: OECD, 1996
Applications for permission to reproduce or translate all, or part of, this material should be madeto: Head of Publications Service, OECD, 2 rue André Pascal, 75775 Paris Cedex 16, France.
2

Table of Contents
I. Background and Summary. . . . . . . . . . . . . . . . . . . . . . . . . . . . . . . . . . . . . . . . . . . . . . . . . 5
II. Interactions and frictions between trade policies and competition policies. . . . . . . . . . . . . . . . 6
Trade policies and competition. . . . . . . . . . . . . . . . . . . . . . . . . . . . . . . . . . . . . . . . . . 7
Competition policies and trade distortions. . . . . . . . . . . . . . . . . . . . . . . . . . . . . . . . . . 8
III. Problems of market access in selected non-OECD economies. . . . . . . . . . . . . . . . . . . . . . . . 10
References and Selected Bibliography. . . . . . . . . . . . . . . . . . . . . . . . . . . . . . . . . . . . . . . . . . . 29
3

Tables
1. Industrial products, imports and reductions in bound tariff rates2. Indicators of barriers to trade3. The composition of world exports4. World FDI, trade and GDP growth5. Foreign direct investment: sectoral composition for selected OECD countries6. Anti-dumping cases potentially involving monopolising behaviour7. The basic structure of legislation and enforcement of competition policy8. Exemptions from competition policy applications9. Merger notification system and thresholds in OECD countries10. Impediments to FDI in selected non-OECD economies11. Enactment of competition law in selected non-OECD economies
Figures
1. Anti-dumping actions outstanding mid-years 1981-19952. Anti-dumping case initiations and the cycle3. Share of non-OECD countries and regions in manufacturing good exports and
imports of OECD countries and areas4. Direct investment flows in non-OECD regions
4

TRADE AND COMPETITION: FRICTIONS AFTER THE URUGUAY ROUND
International Trade and Investment Division1
I. Background and Summary
1. Trade and competition policies share the ultimate objective of achieving efficient allocation ofresources -- one between and one within countries. However, because of differences in scope and methodsthere is sometimes tension between the two. The promotion by trade policies of market access and "fair"trade can be at odds with the competition policy aim for efficiency in cases either where managed tradeis used to gain market access or where remedies are applied to protect domestic producers against "unfair"trade. Frictions can also arise because competition laws and market regulations are designed primarily withdomestic consequences in mind.
2. For some time, work has been going on at the OECD to identify the specific causes of suchtensions and ways to reduce them. Drawing on this work, this paper reviews some of the main elementsof the problem, looking at interactions and frictions between trade and competition policies and, inparticular, the problems of market access in selected non-OECD countries.
3. An overall conclusion is that, notwithstanding the considerable achievements in the area to date,much scope remains for improving policies, both domestic and international, to strengthen the world tradingsystem and enhance competition. Specific reforms could involve:
-- strengthening domestic competition laws and enlarging their scope; improving conditions forcompetition and market access, both domestically and internationally, in currently-regulatedmarkets (notably in service sectors);
-- strengthening international agreements to prevent abuse of countervailing trade measures;
-- increasing the scope of international competition arrangements and fostering the convergenceof competition principles and mutual recognition of standards in regulated sectors.
Over time, increased anti-trust co-operation at the international level may also serve as a basis fordeveloping multilateral rules and agreements on competition policy matters. Such agreements may also be
1. Principal contributors to this paper include Thomas Egebo, Pete Richardson, Marcos Bonturi,Nathalie Girouard, Alessandro Goglio and Bernard Wacquez. It draws on the work of a widerange of colleagues in the Economics Department, the Trade Directorate and the Directorate forFinancial, Fiscal and Enterprise Affairs. Special thanks go to Jørgen Elmeskov, Marie-Pierre Faudemay, Crawford Falconer, Mike Feiner, Toshi Kato, Gunther Keil, Joe Phillips,Anne Richards, Sally Van Siclen and Nick Vanston for comments and guidance on earlierversions and to Lise Perreault and Lyn Louichaoui for technical support.
5
inspired by the high standards of the national treatment, MFN and transparency clauses of the MultilateralAgreement on Investment (the MAI), currently being negotiated at the OECD, which promises to improveconditions for access and legal security of foreign direct investment in OECD countries2.
4. These issues are not confined to OECD countries. In many non-OECD economies, the obstaclesto market access -- to both trade and foreign direct investment -- are often greater than in OECD countries,whilst international forums and instruments to tackle them are fewer. Hence, concerns about policies inthese economies and their implications for growth and employment in the OECD are becoming even morepronounced. This makes it imperative to involve these economies in the process of regulatory reform andthe agenda for international agreements on trade, competition and other regulatory matters. This mayrequire a strengthening of outreach and peer review activities, ensuring also that further trade liberalisationin the OECD countries is non-discriminatoryvis-à-visthe non-OECD.
II. Interactions and frictions between trade policies and competition policies
5. International tensions arising from non-border barriers to trade and border barriers to competitionhave become more important in recent years because: the relative incidence of such barriers has increasedgiven the progress made in reducing traditional border barriers, most recently in the Uruguay Round (UR)(Tables 1 and 2); and obstacles to foreign enterprises and foreign investment take more importance asnational economies become increasingly integrated3. To date, relatively little has been done to tackle thesebarriers in an international policy context. Competition policiesper seare largely governed by domesticlaws and institutions and lack multilateral procedures regarding enforcement and dispute settlement. Apartfrom a few exceptions, international co-operation in competition policies has little legal backing and isconfined to recommendations and bilateral agreements for exchange of information4. Moreover, the URdid not include a mandate for work on trade and competition.
6. The UR did extend and enhance the scope of rules in a number of important areas: governmentprocurement, subsidies, intellectual property rights, technical regulations and standards, trade in servicesand discriminatory trade-related investment measures. But there is sufficient vagueness in the agreementsconcerning subsidies and technical standards to permit abuse5, and the agreement on investment fell shortof a full set of multilateral investment rules, leaving out certain requirements on investors, such astechnology transfer, and the issue of investment protection. Other omitted areas include ones with strong
2. For detailed background on the MAI, see OECD (1996) and Witherell (1995 and 1996).
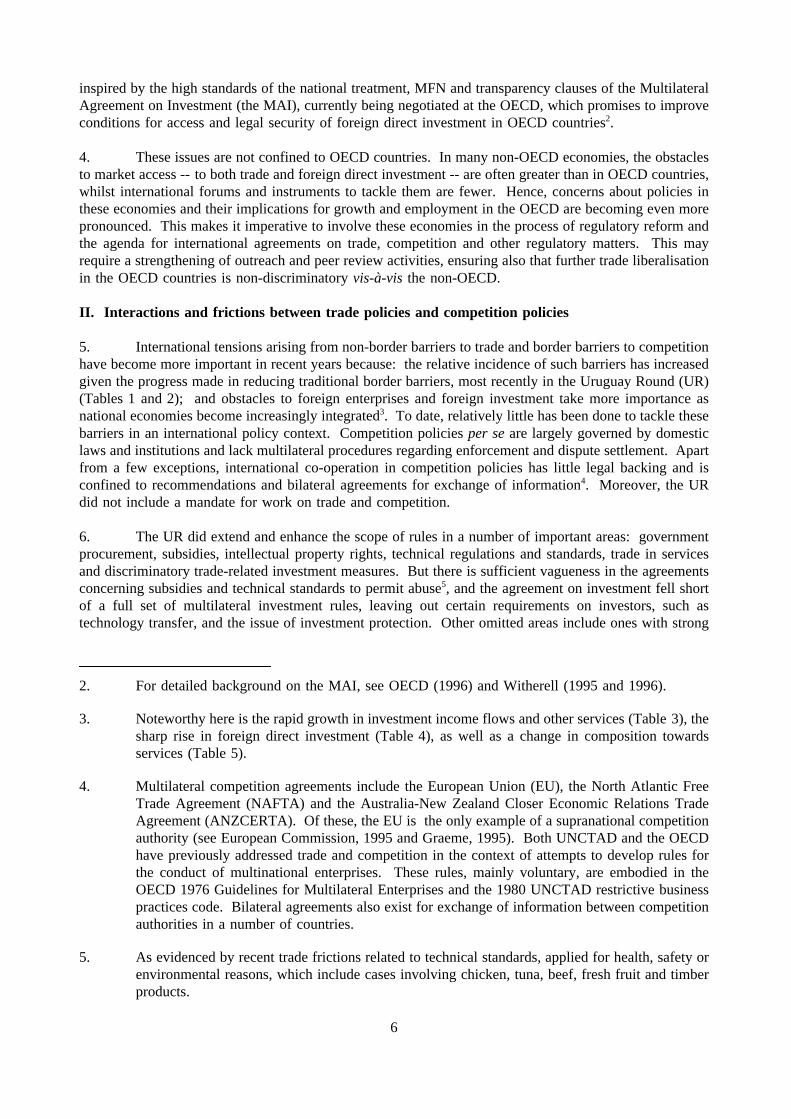
3. Noteworthy here is the rapid growth in investment income flows and other services (Table 3), thesharp rise in foreign direct investment (Table 4), as well as a change in composition towardsservices (Table 5).
4. Multilateral competition agreements include the European Union (EU), the North Atlantic FreeTrade Agreement (NAFTA) and the Australia-New Zealand Closer Economic Relations TradeAgreement (ANZCERTA). Of these, the EU is the only example of a supranational competitionauthority (see European Commission, 1995 and Graeme, 1995). Both UNCTAD and the OECDhave previously addressed trade and competition in the context of attempts to develop rules forthe conduct of multinational enterprises. These rules, mainly voluntary, are embodied in theOECD 1976 Guidelines for Multilateral Enterprises and the 1980 UNCTAD restrictive businesspractices code. Bilateral agreements also exist for exchange of information between competitionauthorities in a number of countries.
5. As evidenced by recent trade frictions related to technical standards, applied for health, safety orenvironmental reasons, which include cases involving chicken, tuna, beef, fresh fruit and timberproducts.
6

links to domestic regulation -- financial services, maritime transport, telecommunications and trade in steel,civil aircraft and other sectors. Moreover, achievements made in eliminating quantitative trade restrictionsand in prohibiting grey-area measures, such as voluntary export restraints, could result in such practicesgoing "underground" in the form of quasi-formal industry-to-industry agreements.
Trade policies and competition
7. A number of trade-policy instruments can impede competition6, sometimes at a substantial costin terms of economic efficiency and welfare7. The reasons given for using these instruments includeraising revenues, reducing the social costs of structural adjustment, protecting public safety and health,defending national security interests, long-term development planning, and protecting certain industries orinterest groups from foreign competition.
8. Some instruments (e.g. countervailing duties) are designed to counter perceived unfair practicesapplied by trading partners, such as dumping or subsidisation. To the extent that unfair practices arereduced, efficiency is enhanced -- but countervailing duties and anti-dumping measures can be abused forprotectionist purposes. Before the UR, wide scope for abuse of anti-dumping measures existed withinvestigations conducted by domestic authorities, often under relatively vague multilateral guidelines. Themost common abuses were in the calculation of dumping margins, through the use of asymmetrical orunfair price comparisons and use of arbitrary exchange rates and minimum profit rates. The UR tightenedthe rules by: clarifying investigation procedures and methods for calculating margins; providing a betterdistinction between actionable and non-actionable subsidies8; and including disciplines for the extensionand refund of duties and the creation of a sunset clause. Despite this tightening, anti-dumping procedurescan still serve as a protectionist tool. Often, investigations can be initiated with relatively little evidenceand, with considerable time and expense required for a company to defend itself against dumpingallegations, many choose not to9. In some cases, cumbersome requests for information relevant toinvestigations seem designed to discourage firms from attempting to provide it. Where no verifiableinformation is available from the exporting firm, investigators are free to use the "best informationavailable", which opens the possibility of abuse.
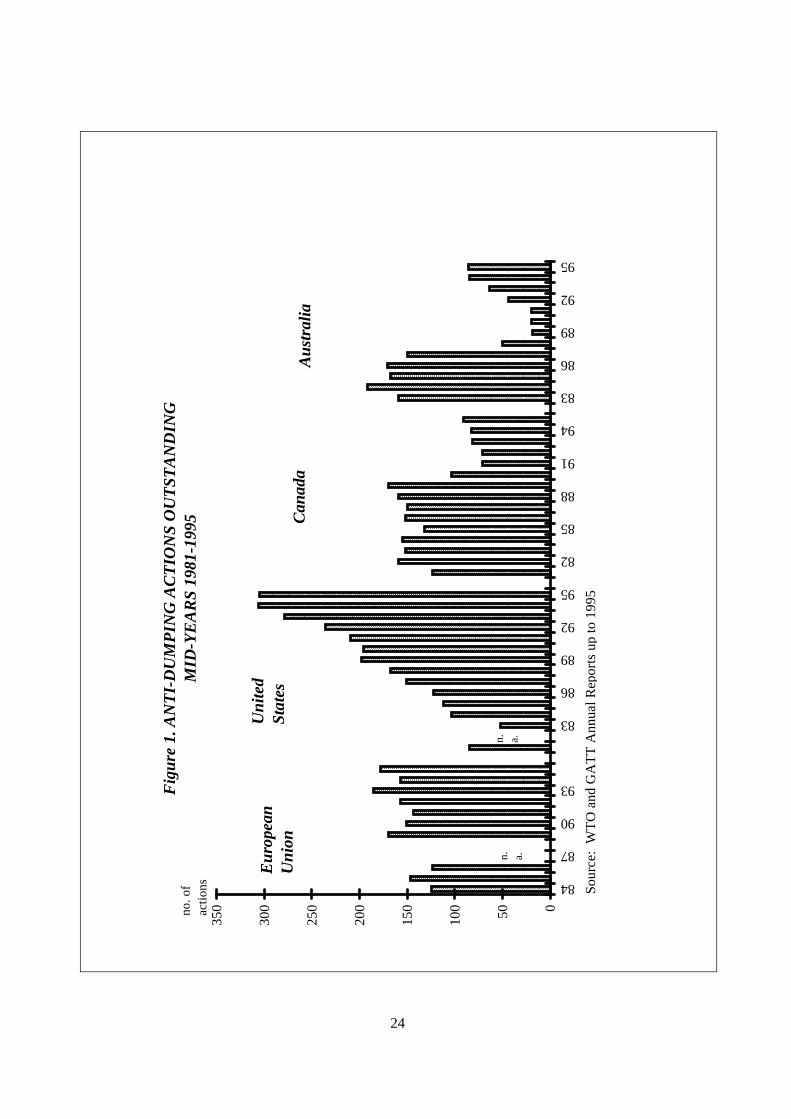
9. According to GATT, between July 1985 and June 1994, there were 450 anti-dumpinginvestigations by the United States, 428 by Australia, 240 by the EU, 203 by Canada, and 270 by all theother countries together, with duties being levied in 70 to 80 per cent of cases for the United States andthe EU10. Currently, a very significant number of anti-dumping cases remain outstanding (Figure 1) and
6. These include tariffs and a number of non-tariff barriers such as export restraint arrangements(like VERs), orderly marketing arrangements, export "forecasts", basic-price systems,industry-to-industry arrangements, discriminatory import systems and prior import surveillance.
7. Extensive reviews of this point are given by Baldwin (1970), Bhagwati (1971), Corden (1974) andSodersten and Vind (1968).
8. In the years preceding the conclusion of the UR, the United States had been the largest user ofcountervailing actions (42 actions initiated in the July 1993 to June 94 period, mostly concerningsteel products), followed by Australia (12 actions initiated).
9. See Nagaoka (1995).
10. See MITI (1995).
7

it is notable that the correlation between the number of cases initiated and real GDP growth has becomemore negative since the mid-1980s (Figure 2)11.
10. Assessing the welfare effects of anti-dumping measures must take account of the fact thatdumping may at times be a legitimate market strategy and may not necessarily lead to the monopolisationof a market, the hindering of competition or a decrease in efficiency. These distinctions are seldom madeby anti-dumping investigations. Indeed, a recent study of more than 1 000 dumping cases filed since 1980by the United States, Canada, Australia and the EU finds that less than 10 per cent of cases leading to anti-dumping measures (roughly two-thirds of those initiated) involved potential monopolising dumping(Table 6)12. Similar studies of the trade coverage of VERs suggest that efficiency-based anti-trustconcerns are not given much consideration in their formulation and implementation. In fact, efficiency-based criteria would condemn most, if not all, such export restraints.
Competition policies and trade distortions
11. There are a number of ways in which competition policies may allow anti-competitive businesspractices that restrict trade and thus international competition, sometimes because of the domestic focus ofsuch policies, sometimes because of limited coverage and sometimes because of lax enforcement.
12. Concerning coverage, competition policies control only practices over which jurisdiction can beenforced and which affect the domestic economy. They do not address practices of domestic enterpriseswhich have effects only in other countries, they cannot easily tackle restraints affecting the domesticeconomy which occur abroad and jurisdictions may clash over the behaviour of multinational firms.Moreover, there is considerable uncertainty about the proper competition-policy means to achieve overallefficiency. Over the years, anti-trust practices have shifted away from intervention towards "rules ofreason" based policies. It is now considered appropriate, in some circumstances, to allow many forms ofcollaboration, other than price collusion, output allocation and market sharing, because they reducetransaction costs, strengthen competition and improve efficiency13.
13. This section reviews some of the principle ways in which competition policies may restrict trade,and also reviews the related implications of restrictive government regulations and practices, including entryregulations, operational regulations, subsidies and procurement policies. In service sectors such regulationsare the most important barrier to international competition.
14. Neglect of international spill-overs by competition laws is particularly striking in the case ofexport and import cartels. Some export cartels improve competition by enabling smaller exporting firmsto achieve economies of scale in distribution and information gathering or to countervail buying power offoreign cartels. Likewise, import cartels can enable smaller firms to share costs or enjoy economies of scalefrom discounts and rebates. But such cartels also produce anti-competitive impacts if they control asignificant portion of the market14.
11. Interdependence in GDP growth in individual countries and regions makes it difficult todistinguish whether such a correlation indicates counter-cyclical occurrence of dumping asopposed to counter-cyclical use of anti-dumping instruments.
12. See Willig (1996).
13. See OECD (1994a) and Fox (1995) for further discussion and references.
14. See OECD, 1993.
8

15. Pure export cartels, directed exclusively at foreign markets, enjoy considerable freedom from theapplication of competition laws and cartels directed both at domestic and export markets may receiveexemptions. In Japan, Germany, the United Kingdom, France, the Netherlands and the EU they fall outsidethe scope of anti-trust law, although the first three jurisdictions require authorisation or registration. TheUnited States and Canada also exempt such cartels, but in the former, firms may obtain greater certaintyabout the application of the law by registering agreements and in the latter agreements may be prohibitedif they harm exports. Cartels formed by foreign suppliers are most often subject to the importing country’scompetition law, but applications against them face procedural and practical obstacles which limit effectiveenforcement, such as inability to obtain evidence outside the enforcing jurisdiction.
16. Import cartels are also covered by the competition laws of the importing country, but are oftenauthorised if importers are faced with dominating foreign suppliers, and if competition on domestic marketsis not held to be substantially restrained. Dissatisfaction with the degree of import-country enforcementof competition laws has apparently motivated increased resort to application of the exporting country’s lawsto activities which restrict access to foreign markets15. However, such intentions may also be hinderedby procedural and practical obstacles.
17. International effects of competition policies depend in part on the relativestrength of nationalcompetition regimes16; but institutional differences (Table 7) and complex interactions between these andother regulations, make it difficult to assess the relative positions of individual countries. Nonetheless, itwould appear that in virtually all countries a number of barriers to competition are left unaddressed.Exemptions for government enterprises and regulated private businesses from anti-trust legislation andliability, present to some extent in all OECD countries, may help to preserve anti-competitive structures andpractices that discriminate against potential entrants, including foreign companies. Exemptions are generallyfound in sectors that are subject to other government regulations. Those least covered by competition lawsappear to be agriculture, fishing and forestry, energy and utilities, transportation, and postal services(Table 8). Common exemptions also include defence, communications, financial and insurance services,and media and publishing, and in some countries distribution and certain manufacturing sectors. The extentof exemptions varies across countries, but this may merely reflect the fact that some countries rely less onlegislative exemptions and more on the less transparent instrument of administrative enforcement. In astudy of eleven jurisdictions (the United States, Japan, Germany, France, the United Kingdom, Canada, theEuropean Union, Hungary, Mexico, Portugal and Sweden) exemptions were found to be most prevalent inJapan, but also relatively frequent in the United States, Germany and the United Kingdom17.
18. Exemptions allowingspecific business arrangements and practiceshave also been cited ashindering international market access18. These include horizontal arrangements (group boycotts,discriminatory product standards and pricing, collective exclusive dealings), vertical restraints (exclusivedealings and territories) and single firm behaviour (predatory pricing, price discrimination and fidelityrebates). It is broadly agreed that horizontal arrangements are undesirable, and competition rules aregenerally firm with them. Even so, specific arrangements are often exempt from anti-trust rules, e.g. jointR&D undertakings, "public interest" cartels, specialisation agreements or crises cartels, and may thereforediscriminate against foreign competitors. Vertical restraints and single firm behaviour can have ambiguouseffects. For instance, exclusive dealing agreements may enhance efficiency and strengthen competition evenif they reduce market access. Likewise, aggressive pricing may indicate active competition rather than
15. Matsushita (1996) reviews a number of such cases.
16. See, in particular, OECD (1994a).
17. See Hawk (1996).
18. See, among many others, Goldfarb (1995), Kaellet al. (1995) and Ostry (1995).
9

predatory behaviour and would not be a threat to competition if markets are contestable. Japanesecompetition law, for example, has at times been criticised for being too permissive of exclusive purchasearrangements rendering access to distribution systems very difficult, but the Japanese competition authoritieshave been unable to identify agreements that prevent new entrants from finding alternative trading partners.
19. Merger control is in general used to prevent abuse of dominance. However, it may also be usedto screen foreign investments on purely non-competition grounds; although it would appear that the useof such screening may have diminished considerably in recent years. Considerable differences nonethelessremain in merger laws across countries (Table 9).
20. Much of the market access debate focuses onenforcement. For instance, perceived lack ofenforcement of competition law was a central issue in the United States/Japan Structural ImpedimentsInitiative (SII) launched in 1989, and in the recent complaint by Eastman Kodak under Section 301 of theUnited States Trade Act. However, relatively few indicators on the actual enforcements of competition lawsare available19. Two crude indicators are i) the staffing level of enforcement agencies, relative to the sizeof the economy (Table 7), which suggest little scope for enforcement in Italy and Switzerland (until 1990)and relatively high enforcement capacities in the United States and the Nordic countries; and ii) the levelof fines imposed for breaches of competition laws, which range from practically no sanctions in the Nordiccountries to heavy financial penalties in the United States and Germany and (more recently) Japan.
21. Regulations may discriminate against foreign and foreign-owned producers, by implicitlyfavouring incumbents and preventing new entrants. For instance, regulations of network-based services(utilities, tele- and postal communication, railways and air-transport) in many OECD countries extendmonopoly rights beyond the network to activities where competition would be possible and publicprocurement practices are often discriminatory. Domestic incumbents are also in many cases protected byconcessions and cumbersome licensing procedures (notably in professional services, health care,transportation and communication), zoning laws and regulations of large-scale stores (making it difficultto gain access to distribution systems), price-regulations (such as freight and passenger rates in transportand fees in professional services); and standards and technical regulations that new entrants, in particularforeigners, find it difficult to meet (in particular the plethora of standards and regulations in construction).Furthermore, in some service sectors, government regulations and practices discriminate more openlyagainst foreign producers. These include notably restrictions on: foreign direct investment (which makeit difficult to establish distribution outlets); access to networks; and the granting of licences and ownershipto foreigners. Common examples are non-market allocation of landing and take-off slots in internationalair-transportation, restrictions that prevent electricity consumers from choosing foreign power suppliers andwidespread discrimination against foreign ownership and access to networks in telecommunication services.Common discriminatory practices also include non-recognition of partner countries’ technical standards,procurement practices which favour domestic suppliers and discriminatory R&D funding.
III. Problems of market access in selected non-OECD economies
22. Non-OECD countries are being increasingly integrated into the global economy with both trade(Figure 3) and foreign direct investment (Figure 4) growing rapidly. Nonetheless, in many of them, thebarriers to entry and the degree of regulation, though declining, tend to be higher than in the OECD area.
23. Since the mid-1980s, most dynamic non-OECD economies have simplified their tariff structures,reduced or bound most tariff lines (Table 1), often in the context of wide ranging economic reforms. Also,they have reduced the coverage of non-tariff trade barriers, including quantitative restrictions and
19. Fox (1996) discusses how criteria for assessing degrees of actual enforcement of competition lawsmight be further developed.
10

prohibitions, and, notably in Central and South America, reduced or eliminated export taxes. Theimplementation of quantitative restrictions via import licensing and/or import clearance systems, is stillcommon in Central and South America and East Asia, and some countries maintain lists of prohibitedmanufactured imports. Furthermore, as in many OECD countries, the reduction of traditional tradeimpediments has coincided with pressures to resort to alternative measures to protect affected import-competing domestic producers. These include the re-activation of anti-dumping and/or countervailing dutystatutes in many non-OECD countries20; regulations intended to protect health and safety used in tradeof food and agricultural goods; and programmes aimed specifically at promoting exports. With regard toservices, virtually all emerging economies in East Asia and Central and South America maintaindiscriminatory restrictions on the insurance sector, banking services, professional services andtelecommunications and many maintain restrictions in wholesale and retail distribution.
24. In spite of strong growth in FDI, numerous restrictions remain in force in virtually all dynamicEast Asian and Central and South American economies (Hong Kong being a notable exception). These takethe form of traditional local-content requirements in investment and other trade-related investment measures.In most cases these instruments are used in combination with a number of incentive mechanisms (subsidiesas well as tax concessions) intended to channel foreign investors to a few selected sectors (Table 10).
25. While support for the adoption of pro-competitive practices has strengthened, by a revival ofregional free trade agreements in Central and South America (MERCOSUR, Andean Pact, etc.) and EastAsia (AFTA), the overall picture is still mixed with regard to competition law. Many developing countrieshave competition policies or are promulgating them (Table 11). In the early 1960s, many Central andSouth American countries enacted competition laws and these have either been revised recently (in Brazil,Chile and Colombia) or are under revision (in Argentina). In some Asian economies competition laws wereimplemented in the 1970s, whereas others (Indonesia, Malaysia and Singapore) have no laws or regulationsspecific to competition21.
20. See Khemani (1996), Finger (1993) and Low and Subramanian (1993).
21. See Green (1996).
11

Table 1.Industrial products, imports and reductions in bound tariff ratesMillions of U.S. dollars and percentages
ParticipantImports from MFN origins
1988
Trade-weighted tariffaveragesa
Pre-UruguayPost-Uruguay
United States 297 291 5.4 3.5
Japan 132 907 3.9 1.7
Canada 28 429 9.0 4.8
Australia 25 152 20.1 12.2
Austria 5 768 10.5 7.1
Finland 4 237 5.5 3.8
Iceland 334 18.2 11.5
New Zealand 4 996 23.8 11.9
Norway 6 192 3.6 2.0
South Africa 14 286 24.6 17.3
Sweden 10 324 4.6 3.1
Switzerland 10 227 2.2 1.5
E.C. 196 801 5.7 3.6
Developed economies 736 944 6.3 3.9
a) This table refers to trade-weighted bound MFN tariff rates in percentage terms.These are often higher than actually levied tariffs. Moreover, the URconverted some NTB’s to tariff equivalents, thereby raising, in some cases, theapparent levels of average bound tariff rates.
Source: GATT.
12

Table 1(continued)
ParticipantImports fromMFN origins
1988
Trade-weighted tariff averages
Pre-Uruguay Post-Uruguay
Developing economiesArgentina 2 981 38.2 30.9Brazil 11 409 40.7 27.0Chile 1 838 34.9 24.9Colombia 3 530 44.3 35.3Costa Rica 840 54.9 44.1El Salvador 557 34.5 30.6Hong Kong 115 549 0.0 0.0India 10 179 71.4 32.4Indonesia 12 603 20.4 36.9Jamaica 1 111 16.5 50.0Korea (Republic of) 40 610 18.0 8.3Macau 1 542 0.0 0.0Malaysia 11 301 10.0 9.1Mexico 10 988 46.1 33.7Peru 1 399 34.8 29.4Philippines 9 189 23.9 22.5Romania 3 456 11.7 33.9Senegal 613 13.7 13.8Singapore 32 804 0.4 5.1Sri Lanka 2 357 28.6 28.1Thailand 15 212 35.8 28.1Tunisia 2 976 28.3 40.2Turkey 5 832 25.1 22.3Uruguay 508 20.9 30.9Venezuela 5 097 50.0 31.1Zimbabwe 631 4.8 4.6
Total of developing economies 305 112 15.3 12.3
Transition economiesCzech Republic 8 862 4.9 3.8Hungary 9 468 9.6 6.9Poland 7 479 16.0 9.9Slovak Republic 8 862 4.9 3.8
Total of transition economies 34 671 8.6 6.0
a) This table refers to trade-weighted bound MFN tariff rates in percentage terms. These are oftenhigher than actually levied tariffs. Moreover, the UR converted some NTB’s to tariff equivalents,thereby raising, in some cases, the apparent levels of average bound tariff rates.
Source: GATT
13

Table 2.Indicators of barriers to trade
Average MFN tariffratea
Dispersion of MFNtariff ratesb
Frequency ratio ofNTBsc
1988 1993 1988 1993 1988 1993
United Statesd 4.7 4.9 7.7 8.6 25.5 22.9
Japan 4.0 3.5 8.8 12.7 13.1 12.1
Canada 9.2 8.9 8.8 8.4 11.1 11.0
Australia 12.2 6.9 14.3 10.1 3.4 0.7
Austria 10.9 9.5 10.1 8.7 65.8 55.6
Finland 5.3 4.9 10.1 10.3 10.6 8.4
Iceland 6.9 6.9 7.5 7.3 .. 3.9
Mexico 11.0 12.9 7.0 5.2 2.0 2.0
New Zealand 13.2 7.1 15.7 10.4 14.1 0.4
Norway 4.4 4.4 6.9 6.8 26.6 23.7
Sweden 3.3 3.3 4.8 5.1 32.6 29.8
Switzerland 3.7 3.6 13.0 11.6 12.9 13.5
Turkey 47.6 12.0 35.7 5.7 0.1 0.3
European Union 7.3 7.7 6.1 6.1 26.6 23.7
a) Applied MFN tariff rates on manufactured products, weighted by production.
b) Standard deviations of applied rates.
c) The percentage of national tariff lines affected by a particular non-tariff barrier.
d) First observation is for 1989.
Source: OECD, Indicators of Tariff and Non-tariff Barriers to Trade(forthcoming).
14
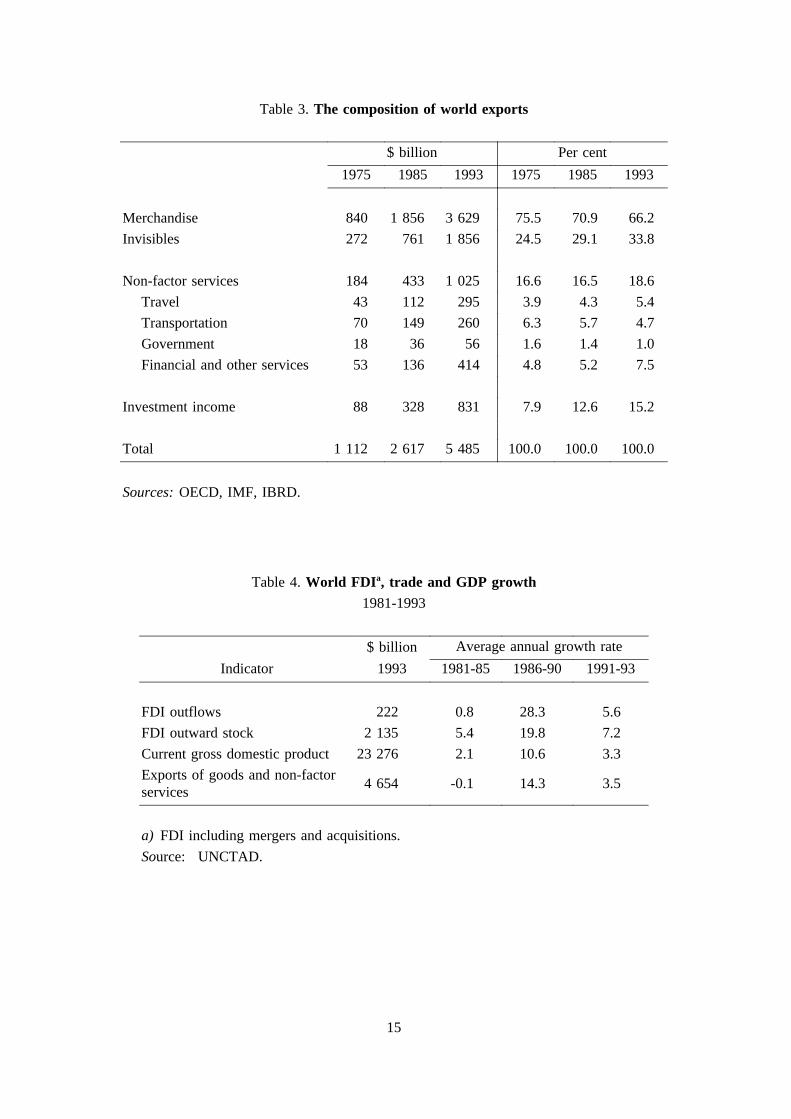
Table 3.The composition of world exports
$ billion Per cent
1975 1985 1993 1975 1985 1993
Merchandise 840 1 856 3 629 75.5 70.9 66.2
Invisibles 272 761 1 856 24.5 29.1 33.8
Non-factor services 184 433 1 025 16.6 16.5 18.6
Travel 43 112 295 3.9 4.3 5.4
Transportation 70 149 260 6.3 5.7 4.7
Government 18 36 56 1.6 1.4 1.0
Financial and other services 53 136 414 4.8 5.2 7.5
Investment income 88 328 831 7.9 12.6 15.2
Total 1 112 2 617 5 485 100.0 100.0 100.0
Sources:OECD, IMF, IBRD.
Table 4.World FDI a, trade and GDP growth1981-1993
$ billion Average annual growth rate
Indicator 1993 1981-85 1986-90 1991-93
FDI outflows 222 0.8 28.3 5.6
FDI outward stock 2 135 5.4 19.8 7.2
Current gross domestic product 23 276 2.1 10.6 3.3
Exports of goods and non-factorservices
4 654 -0.1 14.3 3.5
a) FDI including mergers and acquisitions.
Source: UNCTAD.
15

16
Tab
le5.
For
eign
dire
ctin
vest
men
t:se
ctor
alco
mpo
sitio
nfo
rse
lect
edO
EC
Dco
untr
ies
Per
cent
ages
1984
1987
1990
1993
Prim
ary
Sec
onda
ryT
ertia
ryP
rimar
yS
econ
dary
Ter
tiary
Prim
ary
Sec
onda
ryT
ertia
ryP
rimar
yS
econ
dary
Ter
tiary
A.
Out
war
dst
ock
Uni
ted
Sta
tes
30.1
40.6
29.3
20.7
41.9
37.4
13.6
39.5
46.9
12.6
36.4
51.1
Japa
n19
.131
.149
.811
.726
.461
.86.
826
.766
.55.
427
.766
.9
Ger
man
y4.
163
.832
.22.
464
.033
.51.
756
.142
.21.
250
.648
.2
Fra
nce
....
..4.
050
.046
.18.
341
.050
.77.
340
.352
.4
Italy
19.1
33.6
47.4
11.7
33.8
54.5
8.2
33.6
58.2
5.6
29.9
64.5
Uni
ted
Kin
gdom
33.3
31.8
34.8
24.1
36.0
39.9
19.1
39.0
41.9
16.7
37.8
45.5
B.
Inw
ard
stoc
k
Uni
ted
Sta
tes
18.5
31.5
50.0
17.0
35.6
47.4
13.4
38.7
47.9
9.6
37.4
53.0
Japa
n0.
073
.626
.40.
069
.130
.90.
063
.936
.10.
056
.343
.7
Ger
man
y0.
253
.446
.40.
247
.752
.10.
253
.546
.30.
146
.952
.9
Fra
nce
....
....
....
6.4
37.3
56.4
5.2
35.7
59.1
Italy
5.5
56.2
38.3
3.5
50.1
46.4
3.5
38.2
58.3
3.1
38.6
58.3
Uni
ted
Kin
gdom
33.9
40.8
25.3
28.7
37.2
34.1
23.0
35.9
41.1
25.7
33.6
40.8
So
urc
e:
Inte
rna
tion
al
Dire
ctIn
vest
me
nt
Sta
tistic
sY
ea
rbo
ok
19
95
,O
EC
D.
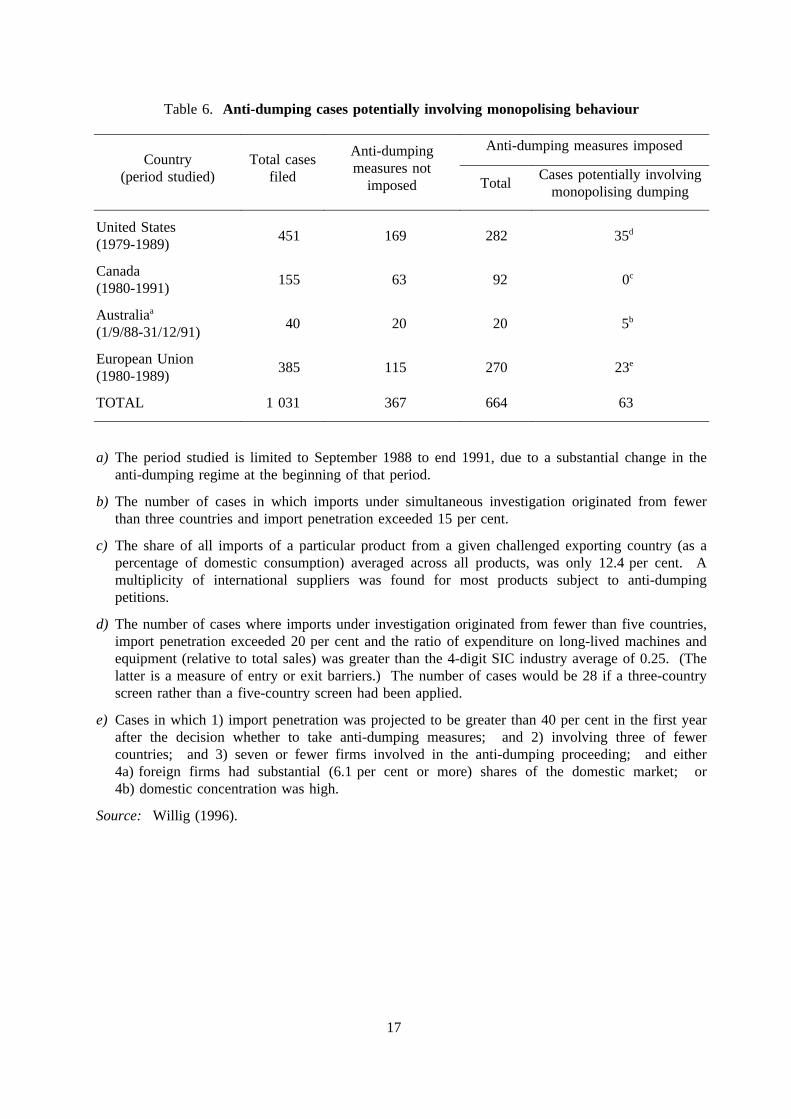
Table 6. Anti-dumping cases potentially involving monopolising behaviour
Country(period studied)
Total casesfiled
Anti-dumpingmeasures not
imposed
Anti-dumping measures imposed
TotalCases potentially involving
monopolising dumping
United States(1979-1989)
451 169 282 35d
Canada(1980-1991)
155 63 92 0c
Australiaa
(1/9/88-31/12/91)40 20 20 5b
European Union(1980-1989)
385 115 270 23e
TOTAL 1 031 367 664 63
a) The period studied is limited to September 1988 to end 1991, due to a substantial change in theanti-dumping regime at the beginning of that period.
b) The number of cases in which imports under simultaneous investigation originated from fewerthan three countries and import penetration exceeded 15 per cent.
c) The share of all imports of a particular product from a given challenged exporting country (as apercentage of domestic consumption) averaged across all products, was only 12.4 per cent. Amultiplicity of international suppliers was found for most products subject to anti-dumpingpetitions.
d) The number of cases where imports under investigation originated from fewer than five countries,import penetration exceeded 20 per cent and the ratio of expenditure on long-lived machines andequipment (relative to total sales) was greater than the 4-digit SIC industry average of 0.25. (Thelatter is a measure of entry or exit barriers.) The number of cases would be 28 if a three-countryscreen rather than a five-country screen had been applied.
e) Cases in which 1) import penetration was projected to be greater than 40 per cent in the first yearafter the decision whether to take anti-dumping measures; and 2) involving three of fewercountries; and 3) seven or fewer firms involved in the anti-dumping proceeding; and either4a) foreign firms had substantial (6.1 per cent or more) shares of the domestic market; or4b) domestic concentration was high.
Source: Willig (1996).
17

18
Tab
le7.
The
basi
cst
ruct
ure
ofle
gisl
atio
nan
den
forc
emen
tof
com
petit
ion
polic
y
Cou
ntry
Nam
e(s)
ofth
eau
thor
ity
Num
ber
ofst
affa
(whe
reav
aila
ble)
Bas
icst
ruct
ure
ofle
gisl
atio
nb
Enf
orce
men
tsy
stemc
Num
ber
Num
ber
per
GD
P(1
0-10 )
Abu
seof
dom
inan
tpo
sitio
nR
estr
ictiv
eag
reem
ents
Mer
ger
cont
rol
Judi
cial
Adm
ini-
stra
tive
Pro
hibi
tion
prin
cipl
e
Yes
Yes
Yes
Yes
Yes
Uni
ted
Sta
tes
Fed
eral
Tra
deC
omm
issi
onA
nti-t
rust
Div
isio
n,D
epar
tmen
tof
Just
ice
950
(in19
95)
650
(in19
95)
2.4
XX
XX
X
Japa
nF
air
Tra
deC
omm
issi
on47
8(in
1992
)1.
8X
XX
X
Ger
man
yF
eder
alC
arte
lO
ffice
,M
onop
oly
Com
mis
sion
XX
X
Fra
nce
Com
petit
ion
Cou
ncil
XX
XX
Italy
Com
petit
ion
Aut
horit
y17
0(in
1995
)1.
6X
XX
X
Uni
ted
Kin
gdom
Offi
ceof
Fai
rT
radi
ng/M
MC
/DT
I42
0(in
1995
)3.
9X
X
Can
ada
Bur
eau
ofC
ompe
titio
nP
olic
y24
5(in
1995
)4.
2X
XX
Den
mar
kC
ompe
titio
nC
ounc
il10
7(in
1991
)10
.1X
Net
herla
nds
Com
petit
ion
Pol
icy
Dep
artm
ent
Min
istr
yof
Eco
nom
icA
ffairs
25(in
1995
)0.
8X
XX
Nor
way
Com
petit
ion
Aut
horit
y10
0(e
arly
90s)
11.4
XX
Sw
eden
Com
petit
ion
Aut
horit
y15
0(e
arly
90s)
9.8
XX
XX
Sw
itzer
land
Car
tels
Com
mis
sion
7(e
arly
90s)
0.4
XX
So
urc
es:
a)H
awk
(199
6),O
EC
DC
ou
ntr
yS
urv
eysf
orD
enm
ark,
Nor
way
,S
wed
en,
and
Sw
itzer
land
;M
anag
emen
tan
dC
oord
inat
ion
Age
ncy
(199
3/4)
,Ja
pa
nS
tatis
tica
lY
ea
rbo
ok
for
Japa
n;N
atio
nala
utho
ritie
sfo
rC
anad
a,Ita
ly,
the
Net
herla
nds,
the
Uni
ted
Kin
gdom
and
the
Uni
ted
Sta
tes.
GD
Pda
taar
eno
min
alG
DP
usin
gP
PP
in19
94.
b)F
orth
eE
urop
ean
Uni
onM
embe
rco
untr
ies,
Tab
le5.
17in
OE
CD
(199
4),
OE
CD
Job
sS
tud
y:P
art
II,P
aris
;fo
rC
anad
a,Co
mp
etit
ion
Po
licy
inO
EC
DC
ou
ntr
ies:
19
92
-19
93
,P
aris
.c)
For
Can
ada,
Fra
nce,
Ger
man
y,Ja
pan,
Sw
eden
,th
eU
nite
dK
ingd
oman
dth
eU
nite
dS
tate
s,B
oner
,R
.P.
and
R.
Kru
eger
(199
1),
Th
eB
asi
cso
fA
nti-
tru
stP
olic
y,T
heW
orld
Ban
k,W
ashi
ngto
n,D
.C.;
for
Den
mar
k,Ita
lyan
dS
witz
erla
nd,
OE
CD
(199
5),
Co
mp
etit
ion
Po
licy
inO
EC
DC
ou
ntr
ies
19
92
-93
,P
aris
;fo
rth
eN
ethe
rland
s,O
EC
D(1
994)
,Eco
no
mic
Su
rve
ys-N
eth
erla
nd
s,
Par
is;
for
Nor
way
,O
EC
D(1
995)
,Eco
no
mic
Su
rve
ys-N
orw
ay
,P
aris
.

19
Tab
le8.
Exe
mpt
ions
from
com
petit
ion
polic
yap
plic
atio
ns
I.S
ecto
rale
xem
ptio
nsU
nite
dS
tate
sJa
pan
Ger
man
yF
ranc
eU
nite
dK
ingd
omC
anad
aM
exic
oP
ortu
gal
Sw
eden
Eur
opea
nU
nion
Agr
icul
ture
,fo
rest
ryan
dfis
herie
s
--A
gric
ultu
reC
O,
AG
CO
,C
AA
G,
RP
MA
GA
GC
OA
G
--F
ishe
ryC
O,
AG
CO
,C
AA
GA
G
--F
ores
try
AG
CO
Man
ufac
turin
g
--T
obac
coC
O,
CA
--S
eric
ultu
reC
A
--Li
quor
CA
,R
PM
SE
AG
--S
ugar
CA
--B
ooks
RP
MR
PM
RP
MR
PM
RP
M
--N
ewsp
aper
AG
RP
MM
EM
ER
PM
--C
osm
etic
sR
PM
--P
harm
aceu
tical
sR
PM
SE
AG
RP
M
--C
oala
ndst
eel
SE
SE
SE
SE
SE
Ene
rgy
--E
lect
ricity
NM
AG
SE
SE
SE
--G
asN
MA
GS
ES
E
--O
ilA
GA
G
Tra
nspo
rtat
ion
--A
irlin
eA
GA
GA
GA
G
--R
ailro
adM
E,
AG
NM
AG
AG
AG
--R
oad
tran
spor
t,tr
ucki
ngM
E,
AG
CA
AG
AG
AG
--M
ariti
me
and
inla
ndw
ater
ship
ping
AG
CA
AG
AG
CA
SE
AG
--H
arbo
urA
GC
AC
AS
E
--W
areh
ouse
AG
CA
Com
mun
icat
ion
ME
SE
--A
udio
visu
alan
dra
dio
broa
dcas
ting
ME
No
te:
Ent
ryin
I.S
ecto
ral
exem
ptio
nsin
dica
tes
the
type
ofex
empt
edac
tiviti
es.
The
type
ofex
empt
ions
incl
udes
:N
M(N
atur
alm
onop
oly)
;C
O(C
o-op
erat
ives
and
asso
ciat
ion)
;R
PM
(Res
ale
pric
em
aint
enan
ce);
CA
(Car
tels
and
reco
mm
enda
tions
);A
G(C
erta
inty
pes
ofag
reem
ents
);S
E(S
tatu
tory
exem
ptio
ns);
and
ME
(Mer
ger)
.E
ntry
inII.
Exe
mpt
ions
byac
tivity
/con
duct
(X)
show
sth
eex
iste
nce
ofex
empt
ions
.
So
urc
e:
Haw
k(1
996)
,"A
ntitr
ust
and
mar
ket
acce
ss".

20
Tab
le8.
(co
ntin
ue
d)
I.S
ecto
rale
xem
ptio
ns(c
on
tinu
ed
)U
nite
dS
tate
sJa
pan
Ger
man
yF
ranc
eU
nite
dK
ingd
omC
anad
aM
exic
oP
ortu
gal
Sw
eden
Eur
opea
nU
nion
Who
lesa
lean
dre
tail
trad
e
--W
hole
sale
CA
,M
E
--R
etai
lC
AA
G
Fin
ance
and
insu
ranc
e
--B
anki
ngor
cred
itin
stitu
tions
ME
CO
,C
AA
GA
GS
EM
E,A
GM
E,
AG
--In
sura
nce
AG
CA
AG
ME
,A
GA
G
--S
ecur
ities
,un
derw
riter
s,co
mm
odity
futu
reM
E,
AG
AG
Oth
erpr
ivat
ese
rvic
es
--R
esta
uran
tsan
dho
tels
CA
--P
rofe
ssio
nals
port
sA
G
--M
edic
alan
dpa
ram
edic
alse
rvic
esS
E
II.E
xem
ptio
nsby
activ
ity/c
ondu
ctE
xpor
tan
dim
port
agre
emen
tsan
dca
rtel
sX
XX
XX
XX
Car
tels
--S
tand
ards
XX
X
--C
risis
and
depr
essi
onX
X
--R
atio
nalis
atio
nX
XX
--S
peci
alis
atio
nX
XX
X
--R
ebat
eX
Blo
ckex
empt
ions
ofag
reem
ents
--E
xclu
sive
dist
ribut
ion
XX
--E
xclu
sive
purc
hase
XX
--F
ranc
hise
XX
X
--P
aten
tlic
ensi
ngX
X
--K
now
-how
licen
sing
XX
R&
Djo
int
vent
ure
(con
sort
ia)
agre
emen
tsX
(par
tial)
XX
XX
Inte
llect
ualp
rope
rty
right
sX
XX
XX
Co-
oper
ativ
esan
das
soci
atio
nsX
XX
X
Sm
all-
and
med
ium
-siz
eden
terp
rises
X(p
artia
l)X
XX
XX
Intr
a-fir
mag
reem
ents
XX
XX
XX
XX
Org
anis
edla
bour
activ
ities
XX
XX
XX
X
Pub
licse
rvic
esX
--P
ublic
auth
oriti
esX
XX
--P
ublic
ente
rpris
esX
X

Table 9.Merger notification system and thresholds in OECD countries
System ofnotification
Notification thresholds Turnoverthresholds as% of GDPb
Risk of failure tonotifyc
(V) (C)a (M) Market share; (T) Turnover; (A) Asset (F) (D) (I)
United States X (A,T) Worldwide sales or total assets of one party > $100 million;and worldwide sales or total assets of other parties > $10 millionand acquiror’s securities and assets after merger > $15 million, or >15 per cent of outstanding voting securities or assets.
0.002(0.0002) X X
Japan X (A, T or M) True mergers or acquisition of the whole or a substantialpart of an ongoing business in Japan.
X X
Germany X Pre-merger: * (T) Worldwide sales of any party > DM 2 billion;or worldwide sales by each of two or more parties > DM 1 billion.Post-merger: * (T) Worldwide combined sales > DM 0.5 billion.
0.083(0.042) X X
France X (M, T) Combined market share > 25%;or combined sales in France >FF 7 billion; and (T) each of two or more parties’ sales in France >FF 2 billion.
0.108(0.031) X
Italy X (T) Aggregate sales in Italy > L 500 billion; or target company sales> L 50 billion.
0.038(0.004) X X
UnitedKingdom
X (M,A) Combined market share in UK > 25%;or acquired assets >£30 million
X
Canada X (A,T) Combined assets/sales in, from or into Canada > C$400 million;target asset value or sales in/from > C$35 million.
0.060(0.005) X X X
Australia X X
Austria X Post-merger: * (M) Combined market share > 5% of domestic
Belgium X (M, T) Combined market share > 20% of relevant market;andcombined annual turnover > BF 1 billion.
0.011 X
Greece X Pre-merger: * (M,T) Combined market share of horizonal mergers >30%; or aggregate turnover > ECU 65 million.Post-merger: * (M,T) Combined market share > 10%;or aggregateturnover > ECU 10 million.
0.125(0.019) X
Ireland X (A, T) Assets of each of two or more parties > £Ir 10 million;or sales of each of two or more parties > £Ir 20 million.
(0.078) X X
New Zealand X Nil X X
Portugal X (M,T) Combined market share of enterprises in relevant markets >30%; or combined turnover of enterprises > Esc 30 billion.
0.353 X
Spain X (M,T) Combined market share in Spain > 25%;or combined salesin Spain > Ptas 20 billion.
0.004 X
Sweden X (T) Aggregate turnover > Skr 4 billion. 0.296 X
EuropeanUnion
X (T) Combined worldwide sales > ECU 5 billion;and sales of eachof at least two parties > ECU 250 million, unless each party’s ECturnover within one and the same.
0.001(0.00004) X X
a) (V): Voluntary; (C) Compulsory.
b) Nominal GDP in 1990 in national currency (Numbers in parenthesis show the thresholds for each merging party). Nominal GDP inEU was calculated using PPP.
c) (F): Fine; (D): Divestiture; (1) Imprisonment.
Source:OECD (1994),Merger Cases in the Real World: A Study of Merger Control Procedures,Paris.
21

22
Tab
le10
.Im
pedi
men
tsto
FD
Iin
sele
cted
non-
OE
CD
econ
omie
s
Cen
tral
and
Sou
thA
mer
ica
Sou
than
dE
ast
Asi
a
Arg
entin
aB
razi
lC
hile
Chi
naIn
done
siaC
hine
seT
aipe
iHon
gK
ong
Kor
eaM
alay
sia
Sin
gapo
reT
haila
nd
Scr
eeni
ng/
notif
icat
ion
XX
XX
XX
XX
X
Res
tric
ted/
clos
edX
XX
XX
XX
XX
XX
Per
form
ance
requ
irem
ents
XX
XX
XX
XX
Fis
cali
ncen
tives
XX
XX
XX
XX
X
Tax
atio
nin
cent
ives
XX
XX
XX
XX
XX
Prio
rity
sect
ors
XX
XX
XX
X
Exc
hang
eco
ntro
lsX
XX
X
No
te:
Xin
dica
tes
use
ofin
stru
men
t.
So
urc
es:
AP
EC
(199
5)an
dO
EC
D.

Table 11. Enactment of competition law in selected non-OECD economies
Countries Years
1) AfricaCote d’Ivoire 1993
Kenya 1988
South Africa 1979
Ghana, Morocco, Senegal, Zambia & Zimbabwe (Legislative initiatives)
2) AsiaChinese Taipei --
India 1969
South Korea 1980
Pakistan 1970
Philippines (Legislative initiatives)
Sri Lanka 1987
Thailand 1979
3) Latin America/Caribbean
Argentina1919, 1946, 1980 (revisions
underway)
Brazil 1962, 1994
Chile 1962, 1994
Colombia 1959, 1992
Ecuador (Legislative initiatives)
Jamaica 1993
Mexico 1993
Venezuela 1991
4) Central and Eastern European countriesBelarus 1992
Czech and Slovak Republics 1991
Poland 1990
Russia 1991
Other CEE-FSU countries 1990-93
Source: Khemani (1996).
23
24
AAAAAAAAAAAAAAAAAAAAAAAAAAAAAAAAAAAAAAAAAAAAAA
AAAAAAAAAAAAAAAAAAAAAAAAAAAAAAAAAAAAAAAAAAAAAAAAAAAAAA
AAAAAAAAAAAAAAAAAAAAAAAAAAAAAAAAAAAAAAAAAAAAAA
AAAAAAAAAAAAAAAAAAAAAAAAAAAAAAAAAAAAAAAAAAAAAAAAAAAAAAAAAAAAAA
AAAAAAAAAAAAAAAAAAAAAAAAAAAAAAAAAAAAAAAAAAAAAAAAAAAAAAAA
AAAAAAAAAAAAAAAAAAAAAAAAAAAAAAAAAAAAAAAAAAAAAAAAAAAA
AAAAAAAAAAAAAAAAAAAAAAAAAAAAAAAAAAAAAAAAAAAAAAAAAAAAAAAAAA
AAAAAAAAAAAAAAAAAAAAAAAAAAAAAAAAAAAAAAAAAAAAAAAAAAAAAAAAAAAAAAAAAAAA
AAAAAAAAAAAAAAAAAAAAAAAAAAAAAAAAAAAAAAAAAAAAAAAAAAAAAAAAAA
AAAAAAAAAAAAAAAAAAAAAAAAAAAAAAAAAAAAAAAAAAAAAAAAAAAAAAAAAAAAAAAA
AAAAAAAAAAAAAAAAAAAAAAAAAAAAAAAAAA
AAAAAAAAAAAAAAAAAAAA
AAAAAAAAAAAAAAAAAAAAAAAAAAAAAAAAAAAAAA
AAAAAAAAAAAAAAAAAAAAAAAAAAAAAAAAAAAAAAAAAA
AAA
AAA
AAA
AAA
AAA
AAA
AAA
AAA
AAA
AAA
AAA
AAA
AAA
AAA
AAA
AAA
AAA
AAA
AAA
AAA
AAA
AAA
AAAAAAAAAAAAAAAAAAAAAAAAAAAAAAAAAAAAAAAAAAAAAAAAAAAAAAAA
AAAAAAAAAAAAAAAAAAAAAAAAAAAAAAAAAAAAAAAAAAAAAAAAAAAAAAAAAAAAAA
AAAAAAAAAAAAAAAAAAAAAAAAAAAAAAAAAAAAAAAAAAAAAAAAAAAAAAAAAAAAAAAAAAAAAAAA
AAAAAAAAAAAAAAAAAAAAAAAAAAAAAAAAAAAAAAAAAAAAAAAAAAAAAAAAAAAAAAAAAAAAAAAA
AAAAAAAAAAAAAAAAAAAAAAAAAAAAAAAAAAAAAAAAAAAAAAAAAAAAAAAAAAAAAAAAAAAAAAAAAAAA
AAAAAAAAAAAAAAAAAAAAAAAAAAAAAAAAAAAAAAAAAAAAAAAAAAAAAAAAAAAAAAAAAAAAAAAAAAAAAAAA
AA
AA
AA
AAAAAAAAAAAAAAAAAAAAAAAAAAAAAAAAAAAAAAAAAAAAAAAAAAAAAAAAAAAAAAAAAAAAAAAAAAAAAAAA
AA
AA
AA
AA
AA
AA
AA
AA
AA
AA
AA
AAAAAAAAAAAAAAAAAAAAAAAAAAAAAAAAAAAAAAAAAAAAAAAAAAAAAAAAAAAAAAAAAAAAAAAAAAAAAAAA
AA
AA
AA
AA
AA
AA
AA
AA
AA
AA
AA
AA
AA
AA
AA
AAAAAAAAAAAAAAAAAAAAAAAAAAAAAAAAAAAAAAAAAAAAAAAAAAAAAAAAAAAAAAAAAAAAAAAAAAAAAAAA
AA
AA
AA
AA
AA
AA
AA
AA
AA
AA
AA
AA
AA
AA
AA
AAAAAAAAAAAAAAAAAAAAAAAAAAAAAAAAAAAAAAAAAAAAAA
AAAAAAAAAAAAAAAAAAAAAAAAAAAAAAAAAAAAAAAAAAAAAAAAAAAAAAAAAA
AAAAAAAAAAAAAAAAAAAAAAAAAAAAAAAAAAAAAAAAAAAAAAAAAAAAAAAA
AAAAAAAAAAAAAAAAAAAAAAAAAAAAAAAAAAAAAAAAAAAAAAAAAAAAAAAA
AAAAAAAAAAAAAAAAAAAAAAAAAAAAAAAAAAAAAAAAAAAAAAAAAA
AAAAAAAAAAAAAAAAAAAAAAAAAAAAAAAAAAAAAAAAAAAAAAAAAAAAAAAA
AAAAAAAAAAAAAAAAAAAAAAAAAAAAAAAAAAAAAAAAAAAAAAAAAAAAAA
AAAAAAAAAAAAAAAAAAAAAAAAAAAAAAAAAAAAAAAAAAAAAAAAAAAAAAAAAA
AAAAAAAAAAAAAAAAAAAAAAAAAAAAAAAAAAAAAAAAAAAAAAAAAAAAAAAAAAAAAA
AAAAAAAAAAAAAAAAAAAAAAAAAAAAAAAAAAAAAA
AAA
AAA
AAA
AAA
AAA
AAA
AAA
AAA
AAA
AAA
AAA
AAA
AAA
AAA
AAAAAAAAAAAAAAAAAAAAAAAAAAAA A
AA
AAA
AAA
AAA
AAA
AAA
AAA
AAA
AAA
AAA
AAA
AAA
AAA
AAA
AAA
AAAAAAAAAAAAAAAAAAAAAAAAAAAAAA
AAAAAAAAAAAAAAAAAAAAAAAAAAAAAAAAAAAA
AAAAAAAAAAAAAAAAAAAAAAAAAAAAAAAAAAAAAAAAAAAAAAAAAAAAAAAAAA
AAAAAAAAAAAAAAAAAAAAAAAAAAAAAAAAAAAAAAAAAAAAAAAAAAAAAAAAAAAAAAAAAAAAAA
AAAAAAAAAAAAAAAAAAAAAAAAAAAAAAAAAAAAAAAAAAAAAAAAAAAAAAAAAAAAAA
AAAAAAAAAAAAAAAAAAAAAAAAAAAAAAAAAAAAAAAAAAAAAAAAAAAAAAAAAAAAAA
AAAAAAAAAAAAAAAAAAAAAAAAAAAAAAAAAAAAAAAAAAAAAAAAAAAAAA
AAAAAAAAAAAAAAAAAAAA
AAAAAAAA
AAAAAAAA
AAAAAAAA
AAAAAAAAAAAAAAAAAA
AAAAAAAAAAAAAAAAAAAAAAAA
AAAAAAAAAAAAAAAAAAAAAAAAAAAAAAAAAA
AAAAAAAAAAAAAAAAAAAAAAAAAAAAAAAA
Fig
ure
1. A
NT
I-D
UM
PIN
G A
CT
ION
S O
UT
ST
AN
DIN
GM
ID-Y
EA
RS
198
1-19
95
050100
150
200
250
300
35084
87
90
93
83
86
89
92
95
82
85
88
91
94
83
86
89
92
95
no
. o
fa
ctio
ns
Eur
opea
nU
nion
Uni
ted
Sta
tes
Can
ada
Aus
tral
ia
So
urc
e:
WT
O a
nd
GA
TT
An
nu
al R
epo
rts
up t
o 1
99
5
n.
a.
n.
a.

1) Anti -Dumping case initiation measured from mid-year to mid-year Real GDP growth rates lagged by one year.
Source: OECD and GATT/WTO
AAAAAAAAAAAAAAAAAAAAAAAAAAAAAAAAAAAAAAAAAAAAAAAAAAAAAAAAAAAA
AAAAAAAAAAAAAAAAAAAAAAAAAAAAAAAAAAAAAAAAAAAAAAAAAAAAAAAAAAAAAAAAAAAAAAAAAAAAAAAAAAAAAAAAAAAAAAAAAAAA
AAAAAAAAAAAAAAAAAAAAAAAAAAAAAAAAAAAAAAAAAAAAAAAAAAAAAAAAAAAAAAAAAAAA
AAAAAAAAAAAAAAAAAAAAAAAAAAAAAAAAAAAAAAAAAAAAAAAAAAAAAAAAAAAAAAAAAAAAAAAAAAAAAAAAAAAAAAAA
AAAAAAAAAAAAAAAAAAAAAAAAAAAAAAAAAAAAAAAAAAAAAAAAAAAAAAAAAAAAAAAAAAAAAAAAAAAAAAAAAAAAAAAA
AAAAAAAAAAAAAAAAAAAAAAAAAAAAAAAAAAAAAAAAAAAAAAAAAAAAAAAAAAAA
AAAAAAAAAAAAAAAAAAAAAAAAAAAAAAAAAAAAAAAAAAAAAAAA
AAAAAAAAAAAAAAAAAAAAAAAAAAAAAAAAAAAAAAAAAAAAAAAAAAAAAAAAAAAAAAAAAAAAAAAAAAAAAAAA
AAAAAAAAAAAAAAAAAAAAAAAAAAAAAAAAAAAAAAAAAAAAAAAAAAAAAAAAAAAAAAAAAAAAAAAAAAAA
AAAAAAAAAAAAAAAAAAAAAAAAAAAAAAAAAAAAAAAA
AAAAAAAAAAAAAAAAAAAAAAAAAAAAAAAAAAAAAAAA
AAAAAAAAAAAAAAAAAAAAAAAAAAAAAAAAAAAAAAAAAAAAAAAAAAAAAAAAAAAA
AAAAAAAAAAAAAAAAAAAAAAAAAAAAAAAAAAAAAAAAAAAAAAAAAAAAAAAAAAAAAAAAAAAAAAAAAAAAAAAAAAAAAAAA
AAAAAAAAAAAAAAAAAAAAAAAAAAAAAAAAAAAAAAAAAAAAAAAAAAAAAAAAAAAAAAAAAAAAAAAAAAAAAAAAAAAAAAAAAAAAAAAAAAAAAAAAAAAAAAAAAAAAAAAA
AAAAAAAAAAAAAAAAAAAAAAAAAAAAAAAAAAAAAAAAAAAAAAAAAAAAAAAAAAAAAAAAAAAAAAAAAAAAAAAAAAAAAAAAAAAAAAAA
0
10
20
30
40
50
60
70
80
1981 1982 1983 1984 1985 1986 1987 1988 1989 1990 1991 1992 1993 1994 1995
0
1
2
3
4
5
6
7
8
European Unionno. ofactions
Real GDP% growthper annum
AD initiations Lagged GDP th
AAAAAAAAAAAAAAAAAAAAAAAAAAAAAAAAAAAAAAAA
AAAAAAAAAAAAAAAAAAAAAAAAAAAAAAAAAAAAAAAAAAAAAAAAAAAAAAAAAAAAAAAAAAAAAAAAAAAAAAAAAAAAAAAAAAAAAAAAAAAAAAAAAAAAAAAAAAAAAAAAAAAAAAAA
AAAAAAAAAAAAAAAAAAAAAAAAAAAAAAAAAAAAAAAAAAAAAAAAAAAA
AAAAAAAAAAAAAAAAAAAAAAAAAAAAAAAAAAAAAAAAAAAAAAAAAAAAAAAAAAAAAAAAAAAAAAAAAAAAAAAAAAAAAAAAAAAAAAAAAAAAAAAAAAAAAAAAAAAA
AAAAAAAAAAAAAAAAAAAAAAAAAAAAAAAAAAAAAAAAAAAAAAAAAAAAAAAAAAAAAAAAAAAAAAAAAAAAAAAAAAAAAAAAAAAAAAAAAAAAAAAAAAAAAAAAAAAAAAAAAAAAAAAAAAAAAAAAAAAAAAAAAAAAAAAAAAAA
AAAAAAAAAAAAAAAAAAAAAAAAAAAAAAAAAAAAAAAAAAAAAAAAAAAAAAAAAAAAAAAAAAAAAAAAAAAAAAAAAAAAAAAAAAAAAAAAAAAAAAAAAAAAAAAAAAAAAAAAAAAAAAAAAAAAAAAAAAAAAAAAAAAAAAAAAAAAAAAA
AAAAAAAAAAAAAAAAAAAAAAAAAAAAAAAAAAAAAAAAAAAAAAAAAAAAAAAAAAAAAAAAAAAAAAAAAAAAAAAAAAAAAAAAAAAAAAAAAAAAAAAA
AAAAAAAAAAAAAAAAAAAAAAAAAAAAAAAAAAAAAAAAAAAAAAAAAAAAAAAAAAAAAAAAAAAAAAAAAAAAAAAA
AAAAAAAAAAAAAAAAAAAAAAAAAAAAAAAAAAAAAAAAAAAAAAAAAAAAAAAAAAAAAAAA
AAAAAAAAAAAAAAAAAAAAAAAAAAAAAAAAAAAAAAAAAAAAAAAAAAAAAAAAAAAAAAAA
AAAAAAAAAAAAAAAAAAAAAAAAAAAAAAAAAAAAAAAAAAAAAAAAAAAAAAAAAAAAAAAAAAAAAAAAAAAAAAAAAAAAAAAAAAAAAAAAAAAAAAAAAAAAAAAAAAAAAAAAAAAAAAAAAAAA
AAAAAAAAAAAAAAAAAAAAAAAAAAAAAAAAAAAAAAAAAAAAAAAAAAAAAAAAAAAAAAAAAAAAAAAAAAAAAAAAAAAAAAAAAAAAAAAAAAAAAAAAAAAAAAAAAAAAAAAAAAAAAAAAAAAAAAAAAAAAAAAAAAAAAAAAAAAA
AAAAAAAAAAAAAAAAAAAAAAAAAAAAAAAAAAAAAAAAAAAAAAAAAAAAAAAAAAAAAAAAAAAAAAAAAAAAAAAAAAAAAAAAAAAAAAAAAAAAAAAAAAAAAAAAAAAAAAAAAAAAAAAAAAAAAAAAAAAAAAAAAAAAAAAAAAAAAAAAAAAAAAAAAAAA
AAAAAAAAAAAAAAAAAAAAAAAAAAAAAAAAAAAAAAAAAAAAAAAAAAAAAAAAAAAAAAAAAAAAAAAAAAAAAAAAAAAAAAAAAAAAAAAAAAAAAAAAAAAAAAAAAAAAAAAA
AAAAAAAAAAAAAAAAAAAAAAAAAAAAAAAAAAAAAAAAAAAAAAAAAAAAAAAAAAAAAAAAAAAAAAAAAAAA
0
10
20
30
40
50
60
70
80
1981 1982 1983 1984 1985 1986 1987 1988 1989 1990 1991 1992 1993 1994 1995
-1
0
1
2
3
4
5
6
7
United Statesno. ofactions
Real GDP% growthper annum
Figure 2 . ANTI-DUMPING CASE INITIATIONS AND THE CYCLE (1)
AD initiationsLagged GDP growth
25

1) Anti -Dumping case initiation measured from mid-year to mid-year Real GDP growth rates lagged by one year.
Source: OECD and GATT/WTO
AAAAAAAAAAAAAAAAAAAAAAAAAAAAAAAAAAAAAAAAAAAAAAAAAAAAAAAAAAAAAAAAAAAAAAAAAAAAAAAA
AAAAAAAAAAAAAAAAAAAAAAAAAAAAAAAAAAAAAAAAAAAAAAAAAAAAAAAAAAAAAAAAAAAAAAAAAAAAAAAAAAAAAAAAAAAAAAAAAAAAAAAAAAAAAAAAAAAAAAAAAAAAAAAAAAAAAAAAAAAAAAAAAAAAAAAAAAAAAAAAAAAAAAAA
AAAAAAAAAAAAAAAAAAAAAAAAAAAAAAAAAAAAAAAAAAAAAAAAAAAAAAAAAAAAAAAAAAAAAAAA
AAAAAAAAAAAAAAAAAAAAAAAAAAAAAAAAAAAAAAAAAAAAAAAAAAAAAAAAAAAAAAAAAAAAAAAAAAAAAAAAAAAAAAAAAAAAAAAA
AAAAAAAAAAAAAAAAAAAAAAAAAAAAAAAAAAAAAAAAAAAAAAAAAAAAAAAAAAAAAAAAAAAAAAAA
AAAAAAAAAAAAAAAAAAAAAAAAAAAAAAAAAAAAAAAAAAAAAAAAAAAAAAAAAAAAAAAAAAAA
AAAAAAAAAAAAAAAAAAAAAAAAAAAAAAAAAAAAAAAAAAAAAAAAAAAAAAAA
AAAAAAAAAAAAAAAAAAAAAAAAAAAAAAAAAAAAAAAA
AAAAAAAAAAAAAAAAAAAAAAAAAAAAAAAAAAAAAAAAAAAA
AAAAAAAAAAAAAAAAAAAAAAAAAAAAAAAAAAAA
AAAAAAAAAAAAAAAAAAAAAAAAAAAAAAAAAAAAAAAAAAAAAAAA
AAAAAAAAAAAAAAAAAAAAAAAAAAAAAAAAAAAAAAAAAAAAAAAAAAAAAAAAAAAAAAAAAAAAAAAAAAAAAAAAAAAAAAAAAAAAAAAAAAAA
AAAAAAAAAAAAAAAAAAAAAAAAAAAAAAAAAAAAAAAAAAAAAAAAAAAAAAAAAAAA
AAAAAAAAAAAAAAAAAAAAAAAAAAAA
0
10
20
30
40
50
60
70
80
1981 1982 1983 1984 1985 1986 1987 1988 1989 1990 1991 1992 1993 1994 1995
-4
-2
0
2
4
6
8
Canada:no. ofactions
n.a.
AD initiations
Real GDP% growthper annum
Lagged GDP growth
AAAAAAAAAAAAAAAAAAAAAAAAAAAAAAAAAAAAAAAAAAAAAAAAAAAAAAAAAAAAAAAAAAAAAAAAAAAAAAAAAAAAAAAAAAAAAAAAAAAAAAAAAAAAAAAAAAAAAAAAAAAAAAAAAAAAAAAAAAAAAAAAAAAAAAAAAAAAAAAAAAAAAAAAAAAAAAAAAAAA
AAAAAAAAAAAAAAAAAAAAAAAAAAAAAAAAAAAAAAAAAAAAAAAAAAAAAAAAAAAAAAAAAAAAAAAAAAAAAAAAAAAAAAAAAAAAAAAAAAAAAAAAAAAAAAAAAAAAAAAAAAAAAAAAAAAAAAAAAAAAAAAAAAAAAAAAAAAAAAAAAAAAAAAAAAAAAAAAAAAA
AAAAAAAAAAAAAAAAAAAAAAAAAAAAAAAAAAAAAAAAAAAAAAAAAAAAAAAAAAAAAAAAAAAAAAAAAAAAAAAAAAAAAAAAAAAAAAAAAAAAAAAAAAAAAAAAAAAAAAAAAAAAAAAAAAAAAAAAAAAAAAAAAAAAAAAAAAAAAAAA
AAAAAAAAAAAAAAAAAAAAAAAAAAAAAAAAAAAAAAAAAAAAAAAAAAAAAAAAAAAAAAAAAAAAAAAAAAAAAAAAAAAAAAAAAAAAAAAAAAAAAAAAAAAAAAAAAAAAAAAAAAAAAAAAAAAAAAAAAAAA
AAAAAAAAAAAAAAAAAAAAAAAAAAAAAAAAAAAAAAAAAAAAAAAAAAAAAAAAAAAAAAAAAAAAAAAAAAAAAAAAAAAAAAAAAAAAAAAAAAAAAAAA
AAAAAAAAAAAAAAAAAAAAAAAAAAAAAAAAAAAAAAAAAAAAAAAAAAAA
AAAAAAAAAAAAAAAAAAAAAAAAAAAAAAAAAAAAAAAAAAAAAAAAAAAA
AAAAAAAAAAAAAAAAAAAAAAAAAAAAAAAAAAAAAAAAAAAAAAAAAAAAAAAAAAAA
AAAAAAAAAAAAAAAAAAAAAAAAAAAAAAAAAAAAAAAAAAAAAAAAAAAAAAAAAAAAAAAAAAAAAAAAAAAAAAAAAAAAAAAAAAAAAAAAAAAAAAAAAAAAAAAAAAAAAAAA
AAAAAAAAAAAAAAAAAAAAAAAAAAAAAAAAAAAAAAAAAAAAAAAAAAAAAAAAAAAAAAAAAAAAAAAAAAAAAAAAAAAAAAAAAAAAAAAAAAAAAAAAAAAAAAAAAAAAAAAAAAAAAAAAAAAAAAAAAAAAAAAAAAAAAAAAAAAAAAAAAAAAAAAAAAAAAAAAAAAAAAAAAAAAAAAA
AAAAAAAAAAAAAAAAAAAAAAAAAAAAAAAAAAAAAAAAAAAAAAAAAAAAAAAAAAAAAAAAAAAAAAAAAAAAAAAAAAAAAAAAAAAAAAAAAAAAAAAAAAAAAAAAAAAAAAAAAAAAAAAAAAAAAAAAAAAAAAAAAAAAAAAAAAAA
AAAAAAAAAAAAAAAAAAAAAAAAAAAAAAAAAAAAAAAAAAAAAAAAAAAAAAAAAAAAAAAAAAAAAAAAAAAAAAAAAAAAAAAAAAAAAAAAAAAAAAAAAAAAAAAAAAAA
AAAAAAAAAAAAAAAAAAAA
0
10
20
30
40
50
60
70
80
1981 1982 1983 1984 1985 1986 1987 1988 1989 1990 1991 1992 1993 1994 1995
-1
0
1
2
3
4
5
6
7
n.a. n.a.
no. ofactions
Australia Real GDP% growthper annum
Lagged GDP growth
AD initiations
Figure 2 . (continued)
26
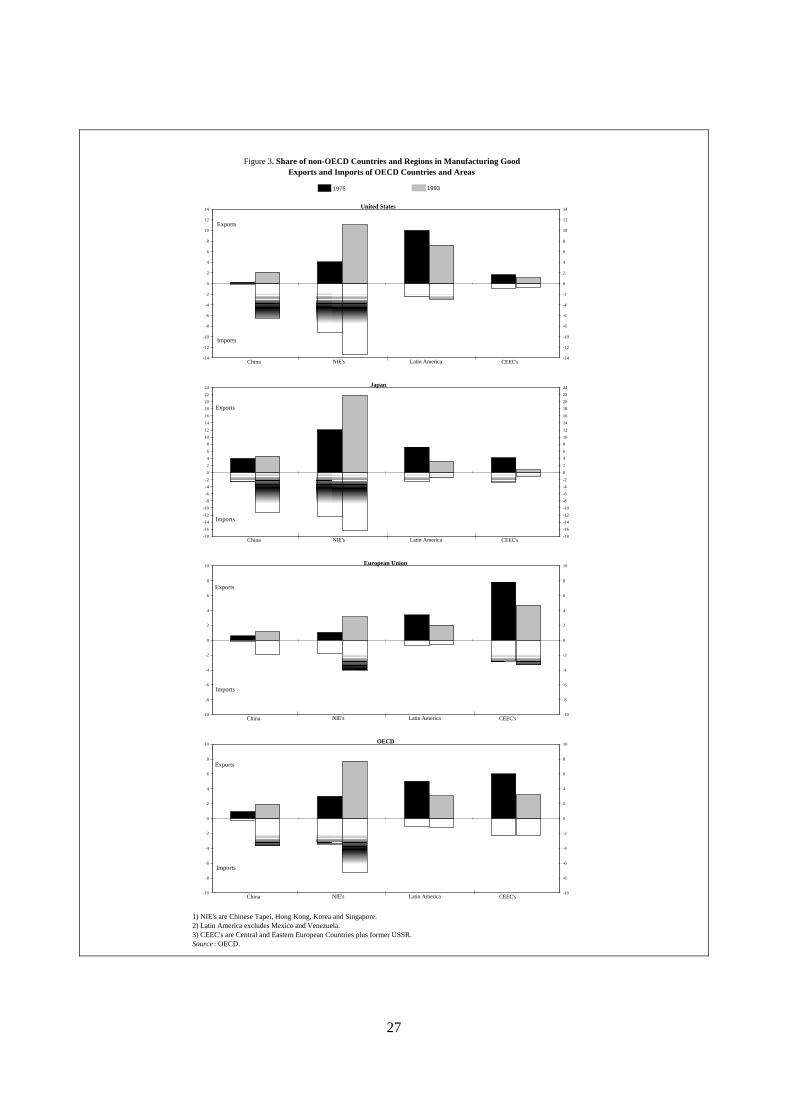
Figure 3. Share of non-OECD Countries and Regions in Manufacturing Good Exports and Imports of OECD Countries and Areas
1) NIE's are Chinese Tapei, Hong Kong, Korea and Singapore. 2) Latin America excludes Mexico and Venezuela.3) CEEC's are Central and Eastern European Countries plus former USSR.Source: OECD.
AAAAAAAA
AAAAAA
AAAAAAAAAAAAAAAAAAAAAAAAAAAAAAAAAAAAAAAAAAAAAAAAAAAAAAAA
AAAAAAAAAAAAAAAAAAAAAAAAAAAAAAAAAAAAAAAAAA
AAAAAAAAAAAAAAAAAAAA
AAAAAAAAAAAAAAA
AAAAAAAAAAAA
AAAAAAAAAAAA
AAAAAAAAAAAAAAAAAAAAAAAAAAAAAAAAAAAAAAAA
AAAAAAAAAAAAAAAAAAAAAAAAAAAAAAAAAAAAAAAA
AAAAAAAAAAAAAAAAAAAAAAAAAAAAAAAAAAAAAAAAAAAAAAAAAAAAAAAAAAAAAAAAAAAAAAAAAAAA
AAAAAAAAAAAAAAAAAAAAAAAAAAAAAAAAAAAAAAAAAAAAAAAAAAAAAAAAAAAAAAAAAAAAAAAAAAAA
AAAAAAAAAAAAAAAAAAAAAAAA
AAAAAAAAAAAAAAAAAAAAAAAA
AAAAAAAA
AAAAAAAA
United States
-14
-12
-10
-8
-6
-4
-2
0
2
4
6
8
10
12
14
-14
-12
-10
-8
-6
-4
-2
0
2
4
6
8
10
12
14
China NIE's Latin America CEEC's
Exports
Imports
AAAAAAAAAAAAAAAA
AAAAAAAAAAAA
AAAAAAAAAAAAAAAAAAAAAAAAAAAAAAAAAAAAAAAAAAAAAAAAAAAA
AAAAAAAAAAAAAAAAAAAAAAAAAAAAAAAAAAAAAAA
AAAAAAAAAAAAAAAA
AAAAAAAAAAAA
AAAAAAAAAAAAAAAA
AAAAAAAAAAAAAAAA
AAAAAAAAAAAAAAAAAAAAAAAAAAAAAAAAAAAAAAAAAAAAAAAA
AAAAAAAAAAAAAAAAAAAAAAAAAAAAAAAAAAAAAAAAAAAAAAAA
AAAAAAAAAAAAAAAAAAAAAAAAAAAAAAAAAAAAAAAAAAAAAAAAAAAAAAAAAAAAAAAA
AAAAAAAAAAAAAAAAAAAAAAAAAAAAAAAAAAAAAAAAAAAAAAAAAAAAAAAAAAAAAAAA
AAAAAAAAAAAA
AAAAAAAAAAAA
AAAAAAAAAAAA
AAAAAAAAAAAA
Japan
-18
-16
-14
-12
-10
-8
-6
-4
-2
0
2
4
6
8
10
12
14
16
18
20
22
24
-18
-16
-14
-12
-10
-8
-6
-4
-2
0
2
4
6
8
10
12
14
16
18
20
22
24
China NIE's Latin America CEEC's
Exports
Imports
AAAAAAA
AAAAAAAAAAAAAAAAAAAA
AAAAAAAAAAAAAAA
AAAAAAAAAAAA
AAAAAAAAA
AAAAAAAAAAAAAAAAAAAAAAAAAAAA
AAAAAAAAAAAAAAAAAAAAAAAAAAAA
AAAAAAAAAAAAAAAAAAAA
AAAAAAAAAAAAAAAAAAAA
AAAAAAAAAAAAAAAAAAAAAAAAAAAAAAAAAAAA
AAAAAAAAAAAAAAAAAAAAAAAAAAAAAAAAAAAA
AAAAAAAA
AAAAAAAA
AAAAAAAAAAAAAAAAAAAAAAAAAAAA
AAAAAAAAAAAAAAAAAAAAAAAAAAAA
European Union
-10
-8
-6
-4
-2
0
2
4
6
8
10
-10
-8
-6
-4
-2
0
2
4
6
8
10
China NIE's Latin America CEEC's
Exports
Imports
AAAAAAAA
AAAAAA
AAAAAAAAAAAAAAAAAAAAAAAAAAAAAAAA
AAAAAAAAAAAAAAAAAAAAAAAA
AAAAAAAAAAAA
AAAAAAAAA
AAAAAAAAAAAAAAAAAAAAAAAA
AAAAAAAAAAAAAAAAAAAAAAAA
AAAAAAAAAAAAAAAAAAAAAAAAAAAAAAAA
AAAAAAAAAAAAAAAAAAAAAAAAAAAAAAAA
AAAAAAAAAAAAAAAAAAAAAAAAAAAAAAAAAAAAAAAAAAAAAAAAAAAAAAAAAAAA
AAAAAAAAAAAAAAAAAAAAAAAAAAAAAAAAAAAAAAAAAAAAAAAAAAAAAAAAAAAA
AAAAAAAAAAAAAAAA
AAAAAAAAAAAAAAAA
AAAAAAAAAAAAAAAAAAAAAAAA
AAAAAAAAAAAAAAAAAAAAAAAA
OECD
-10
-8
-6
-4
-2
0
2
4
6
8
10
-10
-8
-6
-4
-2
0
2
4
6
8
10
China NIE's Latin America CEEC's
Exports
Imports
1975 1993
27

28
1) C
EE
C in
clud
es A
lban
ia, B
ulga
ria, F
orm
er C
zech
oslo
vaki
a, H
unga
ry, P
olan
d an
d R
oman
ia.
So
urc
e: I
.M.F
.
AAAA
AAAAAAA
AAA
AAAAAA
AAAAAA
AAAA
AAAAAAAA
AAAA
AAAA
AAAA
AAAAAA
AAAA
AAAA
AAAA
AAAA
AAAA
AA
AAAAAAAA
Fig
ure
4. D
irect
Inve
stm
ent f
low
s in
Non
-OE
CD
Reg
ions
010
20
30
40
50
60
70
19
84
19
85
19
86
19
87
19
88
19
89
19
90
19
91
19
92
19
93
Afr
ica
Asi
aLa
tin A
mer
ica A
AA
AAA
CE
EC
( in
$ b
illio
n)
15
.31
2.5
12
.41
3.7
23
.22
6.9
31
.7
40
51
.3
70
.1
1

References and Selected Bibliography
APEC (1995), "Survey of impediments to trade and investment in the APEC region", report by thePacific Economic Cooperation Council for APEC.
BALDWIN, R.E. (1970),Nontariff Distortions of International Trade, Brookings Institution,Washington.
BAUMOL, W.J, J.C. PANZAR and R.D. WILLIG (1982),Contestable Markets and the Theory ofIndustry Structure, New York, Harcourt, Brace and Jovanovich.
BHAGWATI, J. (1971), "The generalised theory of distortions and welfare", inTrade, Balance ofPayments and Growth, North-Holland, Amsterdam.
BONER, R.A. and R. KRUEGER (1991), "The basics of antitrust policy: a review of ten nations andthe European Communities",World Bank Technical Paper No. 160, World Bank, Washington1991.
CORDEN, W.H. (1974),Trade Policy and Economic Welfare, Oxford University Press, London.
EUROPEAN COMMISSION (1995), "Competition policy in the new trade order: strengtheninginternational co-operation and rules", report of the Group of Experts, mimeo, Brussels.
FEKETEKUTY, G. (1996), "The scope, implication and economic rationale of a competition-orientedapproach to future multilateral trade negotiations", paper presented at the OECD Joint meetingof the Working Party of the Trade Committee and Working Party No. 1 of the Committee onCompetition Law and Policy, 14 February.
FINGER, J.M., ed. (1993),Antidumping: How it Works and Who Gets Hurt, University of Michigan,Ann Arbor.
FOX, E. (1995), "Competition law and the next agenda for the WTO", Chapter 18 in OECD (1995).
FOX, E. (1996), "Developing criteria for assessing degree of actual enforcement of nations’ competitionlaws, with a particular view to market access/trade problems".
GOLDFARB, L.H. (1995), "Trade and competition policies in the global market place", Chapter 14 inOECD (1995).
GRAEME, A.T. (1995), "Trade and competition policy linkages: some ideas on a framework for thefuture", Chapter 16 in OECD (1995).
29

GREEN, C. (1996), "Competition regulations in the Asia-Pacific region", paper presented at the Asia-Pacific Round Table Meeting on The Global Contestability of National Markets, Improvingthe International Regime for Investment, Competition and Anti-dumping Policies, Singapore,January.
HAWK, B.E. (1996), "Antitrust and market access", OECD, Paris (forthcoming).
JANOW, M.E. (1996), "International perspectives on abuse of dominance", paper prepared for theOECD Trade Committee meeting, 12 January.
JEFFERSON, G.H. and T.G. RAWSKI (1994), "Enterprise reform in Chinese industry",Journal ofEconomic Perspectives8(2).
KAELL, A., D. IRELAND and Z. SADEQUE (1995), "Trade, competition policy and market access",Chapter 17 in OECD (1995).
KHEMANI, S. (1996), "Problems in developing countries in strengthening competition laws andpolicies", paper presented at the Asia-Pacific Roundtable Meeting, The Global Contestabilityof National Markets, Improving the International Regime for Investment, Competition andAnti-dumping Policies, Singapore, January.
LOW, P. and A. SUBRAMANIAN (1996), "TRIMs in the Uruguay Round: an unfinished business?",in Martin, W. and L.A. Winters, "The Uruguay Round and the developing economies",WorldBank Discussion Paper, No. 307.
LOW, P. and A. SUBRAMANIAN (1993), "Trade protection in agriculture: a special case?", mimeo,The World Bank, Washington, D.C.
MATSUSHITA, M. (1995), "Harmonization of competition laws through bilateral trade negotiations:the Japanese experience", Chapter 15 in OECD (1995).
MATSUSHITA, M. (1996), "Competition law and market access: approaches to assessing competitionpolicy enforcement", paper presented at the Joint brainstorming of the Working Party of theTrade Committee and Working Party No. 1 of the Committee on Competition Law and Policy,16 February.
MITI (1995), "1995 Report on the WTO consistency of trade policies by major trading partners", WTOCommittee of the Industrial Structure Council, Japan.
NAGAOKA, S. (1995), "Antidumping policy and competition" inRegulating Policies and Reform: AComparative Perspective, C.R. Rrischtak (ed), the World Bank.
OECD (1993),Obstacles to Trade and Competition, Paris.
OECD (1994a), "Trade and competition policies: comparing objectives and methods",Trade PolicyIssues No. 4, Paris.
OECD (1994b), Merger Cases in the Real World; A Study of Merger Convention Procedures, Paris.
OECD (1995),New Dimensions of Market Access in a Globalising World Economy, Paris.
OECD (1996),Towards Multilateral Investment Rules, Paris.
30

OECD (1996),Indicators of Tariff and Non-Tariff Barriers to Trade, (forthcoming).
OSTRY, S. (1995), "New dimensions of market access: challenges for the trading system", Chapter 3in OECD (1995).
SODERSTEN, B., and K. VIND (1968), "Tariffs and trade in general equilibrium",American EconomicReview, June.
WILLIG, R.D (1996),Antidumping and Competition(forthcoming).
WITHERELL, W.H. (1995),The OECD Multilateral Agreement on Investment, OECD, Paris.
WITHERELL, W.H. (1996), "The multilateral agreement on investment negotiations at year-end 1995",remarks at the Fourth West-East Conference of Ministers of Economy, Industry, and Trade,Baltimore, Maryland, January 8-10.
31
ECONOMICS DEPARTMENT
WORKING PAPERS
A complete list of Working Papers is available on request.
164. Corporate Governance, Competition and Performance(June, 1996) Colin Mayer
163. Fiscal Relations within the European Union(April 1996) Peter Hoeller, Marie-Odile Louppe and Patrice Vergriete
162. Mark-up ratios in manufacturing industries(April 1996) Joaquim Oliveira Martins, Stefano Scarpetta and Dirk Pilat
161. Innovation, Firm Size and Market Structure: Schumpeterian Hypotheses and some new Themes(April 1996) George Symeonidis.
160. Valuing the Right to Tax Incomes: An Options Pricing Approach(April, 1996) Teun Draaisma and Kathryn Gordon.
159. Innovation and Competitive Advantage(October 1995) P. A. Geroski
158. Monetary Policy at Price Stability: A Review of Some Issues(September 1995) Malcolm Edey, Norbert Funke, Mike Kennedy and Angel Palerm
157. Technical Progress, Factor Productivity and Macroeconomic Performance in the MediumTerm(September 1995) Claude Giorno, Pete Richardson and Wim Suyker
156. Ageing Populations, Pension Systems and Government Budgets: How do they Affect Savings(August 1995) Willi Leibfritz, Deborah Roseveare, Douglas Fore and Eckhard Wurzel
155. The Determinants of Real Long-Term Interest Rates: 17 Country Pooled Time-SeriesEvidence(June 1995) Adrian Orr, Malcolm Edey and Michael Kennedy
154. An Assessment of Financial Reform in OECD Countries(May 1995) Malcolm Edey and Ketil Hviding
153. Markets for Tradeable CO2 Emission Quotas, Principles and Practice(February 1995) Graciela Chichilnisky and Geoffrey Heal
152. Estimating Potential Output, Output Gaps and Structural Budget Balances(January 1995) Claude Giorno, Pete Richardson, Deborah Roseveare and Paul van den Noord
151. NOx/SOx Emissions and Carbon Abatement(December 1994) Christophe Complainville and Joaquim O. Martins
32

150. The Determinants and Properties of Monetary Conditions: Direct Survey Evidence from NewZealand(December 1994) Andreas Fischer and Adrian Orr
149. Health Care Reform: Controlling Spending and Increasing Efficiency(December 1994) Howard Oxley and Maitland Macfarlan
148. Macroeconomic Performance and Fiscal Policy Adjustments in the Medium Term:Alternative Medium-Term Scenarios(September 1994) Pete Richardson, Claude Giorno and Stephan Thurman
147. The EC’s Internal Market: Implementation, Economic Consequences, Unfinished Business(August 1994) Peter Hoeller and Marie-Odile Louppe
146. Comparison of Model Structure and Policy Scenarios: GREEN and 12RT(August 1994) Alan Manne and Joaquim O. Martins
145. An International Sectoral Data Base for Fourteen OECD Countries (Second Edition)(June 1994) F.J.M. Meyer zu Schlochtern and J.L. Meyer zu Schlochtern
144. Fiscal Policy, Government Debt and Economic Performance(June 1994) Willi Leibfritz, Deborah Roseveare and Paul van den Noord
143. GREEN: The Reference Manual(May 1994) Dominique van der Mensbrugghe
142. Pension Liabilities in the Seven Major Economies(December 1993) Paul van den Noord and Richard Herd
141. The Distribution System in Sweden(October 1993) Sören Wibe
140. The Distribution Sector in the United Kingdom(October 1993) John A. Dawson
139. The Italian Distribution System(October 1993) Luca Pellegrini and Angelo M. Cardani
138. The French Distribution Industry and the Openness of the French Economy(October 1993) Patrick A. Messerlin
137. The German Distribution System(October 1993) Josef Lachner, Uwe Chr. Täger, Gunther Weitzel
136. A Study of the Distribution System in Japan(October 1993) Masayoshi Maruyama
135. An Analysis of the U.S. Distribution System(October 1993) Roger R. Betancourt
134. Market Structure, International Trade and Relative Wages(October 1993) Joaquim Oliveira Martins
33

GENERAL DISTRIBUTION
ECONOMICS DEPARTMENT
WORKING PAPERS
This series of Working Papers is designed to make available, to awider readership, selected studies which the Department hasprepared for use within OECD. Authorship is generally collective,but main individual authors are named. The Papers are generallyavailable in their original language, English or French, with asummary in the other.
The views expressed in this paper are those of the author(s) and donot necessarily reflect those of the OECD or of the governments ofits Member countries.
Comment on the Papers is invited, and may be sent to OECD,Economics Department, 2 rue André Pascal, 75775 Paris Cedex 16,France. Additional copies of the Papers, on a limited basis, can beforwarded on request.
ORGANISATION FOR ECONOMIC CO-OPERATION AND DEVELOPMENT
34