Embed Size (px)
Citation preview
General Commands Reference Guide T
TRACE32 Online Help
TRACE32 Directory
TRACE32 Index
TRACE32 Documents ......................................................................................................................
General Commands ......................................................................................................................
General Commands Reference Guide T ................................................................................... 1
History ...................................................................................................................................... 14
TargetSystem ........................................................................................................................... 15
TargetSystem TRACE32 PowerView instances 15
TargetSystem.NewInstance Start new TRACE32 PowerView instance 16
TargetSystem.state Show overview of multicore system 18
TASK ......................................................................................................................................... 23
TASK OS Awareness for TRACE32 23
Overview TASK 23
TASK.ACCESS Control memory access 28
TASK.Break Deprecated 28
TASK.CACHEFLUSH Reread task list 28
TASK.CONFIG Configure OS Awareness 29
TASK.COPYDOWN Copy file from host into target 30
TASK.COPYUP Copy file from target into host 31
TASK.CreateExtraID Create a virtual task 31
TASK.CreateID Create virtual task 31
TASK.Debug Deprecated 31
TASK.DeleteID Delete virtual task 32
TASK.DETACH Detach from task 32
TASK.INSTALL Deprecated 33
TASK.KILL End task 33
TASK.List Information about tasks 34
TASK.List.MACHINES List machines 34
TASK.List.SPACES List MMU spaces 35
TASK.List.tasks List all running tasks 36
TASK.List.TREE Display tasks in a tree structure 38
TASK.ListID List virtual tasks 38
TASK.MTXTRC Internal 39
TASK.NAME Translation of task magic number to task name 40
TASK.NAME.DELete Delete a task name table entry 40
TASK.NAME.RESet Reset task name table 40
General Commands Reference Guide T 1 ©1989-2019 Lauterbach GmbH
TASK.NAME.Set Set a task name table entry 41
TASK.NAME.view Show task name translation table 41
TASK.NoBreak Deprecated 41
TASK.NoDebug Deprecated 42
TASK.NoStop Deprecated 42
TASK.OFF Deprecated 42
TASK.ON Deprecated 43
TASK.ORTI AUTOSAR/OSEK support 44
TASK.ORTI.CPU Set OSEK SMP CPU number 44
TASK.ORTI.load Configure OS Awareness for OSEK/ORTI 44
TASK.ORTI.NOSTACK Exclude an ORTI task from stack evaluation 45
TASK.ORTI.SPLITSTACK Split stack analysis of idle ORTI task to cores 46
TASK.RESet Reset OS Awareness 47
TASK.RUN Load task 47
TASK.select Display context of specified task 48
TASK.SETDIR Set the awareness directory 49
TASK.STacK Stack usage coverage 50
TASK.STacK.ADD Add stack space coverage 51
TASK.STacK.DIRection Define stack growth direction 53
TASK.STacK.Init Initialize unused stack space 53
TASK.STacK.PATtern Define stack check pattern 54
TASK.STacK.PATternGAP Define check pattern gap 55
TASK.STacK.ReMove Remove stack space coverage 55
TASK.STacK.RESet Reset stack coverage 56
TASK.STacK.view Open stack space coverage 57
TASK.Stop Deprecated 58
TCB ........................................................................................................................................... 59
TCB Trace control block 59
TCB.AllBranches Broadcast all branches 60
TCB.CPU Broadcast information for specified CPU only 60
TCB.CycleAccurate Cycle accurate tracing 61
TCB.DataTrace Broadcast specified address and data information 62
TCB.EX Broadcast exception level information 63
TCB.FCR Broadcast function call-return information 63
TCB.IM Broadcast instruction cache miss information 63
TCB.InstructionCompletionSizeBits Specify size of completion message 64
TCB.KE Broadcast kernel mode information 64
TCB.LSM Broadcast load store data cache information 65
TCB.OFF Switch TCB off 65
TCB.ON Switch TCB on 65
TCB.PCTrace Broadcast program counter trace 66
TCB.PortFilter Disable port filter 66
TCB.PortMode Specify trace clock ratio 67
General Commands Reference Guide T 2 ©1989-2019 Lauterbach GmbH
TCB.PortWidth Specify trace port width 67
TCB.Register Display TCB control register 68
TCB.RESet Reset TCB setup to default 69
TCB.SourceSizeBits Specify number of bit for core information in trace 69
TCB.STALL Stall CPU for complete trace 69
TCB.state Display TCB setup 70
TCB.SV Broadcast supervisor mode information 71
TCB.SyncPeriod Specify TCB sync period 71
TCB.TC Broadcast information for specified HW thread 72
TCB.ThreadSizeBits Specify number of bit for thread information in trace 72
TCB.Type Specify TCB type 73
TCB.UM Broadcast user mode information 73
TCB.Version Specify trace cell version 74
TERM ........................................................................................................................................ 75
TERM Terminal emulation 75
Overview TERM 75
Interface Routines 76
Interface Routines (EPROM Simulator) 76
Interface Routines (Single Character Modes) 77
Interface Routines (Buffered Modes) 77
Interface Routines (Serial Line Debugger) 77
Interface Routines (Special Hardware, JTAG) 77
Functions 78
Fast Data Write 78
Interface Routines 78
TERM.CLEAR Clear terminal window 79
TERM.CLOSE Close files 79
TERM.CMDLINE Specify a command line 79
TERM.FastWRITE Fast data write 79
TERM.GATE Terminal with virtual hosting 81
TERM.HARDCOPY Print terminal window contents 81
TERM.HEAPINFO Define memory heap parameters 82
TERM.LocalEcho Enables/disables local echo for new terminal windows 82
TERM.METHOD Select terminal protocol 83
TERM.Mode Define terminal type 86
TERM.Out Send data to virtual terminal 87
TERM.PIPE Connect terminal to named pipe 87
TERM.PipeREAD Connect terminal input to named pipe 88
TERM.PipeWRITE Connect terminal output to named pipe 88
TERM.Protocol Select terminal protocol 88
TERM.PULSE Enable pulse generator for transfers 89
TERM.Rate Define polling rate 89
TERM.READ Get terminal input from file 90
General Commands Reference Guide T 3 ©1989-2019 Lauterbach GmbH
TERM.RESet Reset terminal parameters 90
TERM.SCROLL Enable automatic scrolling for terminal window 91
TERM.SIZE Define size of terminal window 91
TERM.TCP Route terminal input/output to TCP port 92
TERM.TELNET Open TELNET terminal window 92
TERM.TRIGGER Trigger on string in terminal window 93
TERM.Vector Define interrupt vectors 94
TERM.view Terminal display 96
TERM.WRITE Write terminal output to file 97
TPIU .......................................................................................................................................... 98
TPIU Trace Port Interface Unit (TPIU) 98
Overview TPIU 98
TPIU.CLEAR Re-write the TPIU registers 99
TPIU.IGNOREZEROS Workaround for a special chip 99
TPIU.NOFLUSH Workaround for a chip bug affecting TPIU flush 99
TPIU.PortClock Inform debugger about HSSTP trace frequency 100
TPIU.PortMode Select the operation mode of the TPIU 101
TPIU.PortSize Select interface type and port size of the TPIU 102
TPIU.RefClock Set up reference clock for HSSTP 103
TPIU.Register Display TPIU registers 103
TPIU.RESet Reset TPIU settings 104
TPIU.state Display TPIU configuration window 104
TPIU.SWVPrescaler Set up SWV prescaler 105
TPIU.SWVZEROS Workaround for a chip bug 105
TPIU.SyncPeriod Set period of sync packet injection 106
TPU ........................................................................................................................................... 107
TPU.BASE Base address 107
TPU.Break Break TPU 107
TPU.Dump Memory display 107
TPU.Go Start TPU 107
TPU.Register.ALL Register operation mode 107
TPU.Register.NEWSTEP New debugging mode 107
TPU.Register.Set Register modification 107
TPU.Register.view Register display 108
TPU.RESet Disable TPU debugger 108
TPU.SCAN Scanning TPU 108
TPU.SELect Select TPU for debugging 108
TPU.Step Single step TPU 108
TPU.view View TPU channels 108
Trace ......................................................................................................................................... 109
Trace Trace configuration and display 109
Overview Trace 110
General Commands Reference Guide T 4 ©1989-2019 Lauterbach GmbH
About the Command Placeholder <trace> 111
What to know about the TRACE32 default settings for Trace.METHOD 111
Types of Replacements for <trace> 113
Replacing <trace> with a Trace Method - Examples 113
Replacing <trace> with a Trace Evaluation - Example 114
Replacing <trace> with RTS for Real-time Profiling - Example 115
Replacing <trace> with Trace Source and Trace Method - Examples 116
How to access the trace sources in TRACE32 118
List of <trace> Command Groups consisting of <trace_source><trace_method> 119
Related Trace Command Groups 120
<trace>.ABCDEF Sampling configuration for probes ABCDEF 121
<trace>.ACCESS Define access path to source code for trace decoding 122
<trace>.ADDRESS Software trace address 124
<trace>.Arm Arm the trace 125
<trace>.AutoArm Arm automatically 126
<trace>.AutoFocus Calibrate AUTOFOCUS preprocessor 126
Preprocessor with AUTOFOCUS Technology 129
<trace>.AutoInit Automatic initialization 131
<trace>.AutoStart Automatic start 131
<trace>.AutoTEST Continuous measurement 132
<trace>.BookMark Set a bookmark in trace listing 134
<trace>.BookMarkToggle Toggles a single trace bookmark 136
<trace>.Break Stop trace 137
<trace>.Chart Display trace contents graphically 138
Parameters 138
General Options 139
Drag and Drop 141
<trace>.Chart.Address Time between program events as a chart 146
<trace>.Chart.DatasYmbol Analyze pointer contents graphically 147
<trace>.Chart.DistriB Distribution display graphically 149
<trace>.Chart.Func Function activity chart 151
<trace>.Chart.GROUP Group activity chart 152
<trace>.Chart.INTERRUPTTREE Display interrupt nesting 153
<trace>.Chart.Line Graphical HLL lines analysis 154
<trace>.Chart.Nesting Show function nesting at cursor position 155
<trace>.Chart.sYmbol Symbol analysis 156
<trace>.Chart.TASK Task activity chart 160
<trace>.Chart.TASKFunc Task related function run-time analysis (legacy) 161
<trace>.Chart.TASKINTR Display ISR2 time chart (ORTI) 161
<trace>.Chart.TASKKernel Task run-time chart with kernel markers (flat) 162
<trace>.Chart.TASKSRV Service routine run-time analysis 163
<trace>.Chart.TASKState Task state analysis 164
<trace>.Chart.TASKVSINTERRUPT Time chart 165
General Commands Reference Guide T 5 ©1989-2019 Lauterbach GmbH
<trace>.Chart.TASKVSINTR Time chart 166
<trace>.Chart.TREE Display function chart as tree view 167
<trace>.Chart.VarState Variable activity chart 167
<trace>.CLEAR Clear FDX communication buffers 170
<trace>.CLOCK Clock to calculate time out of cycle count information 170
<trace>.CLOSE Close FDX files 171
<trace>.ComPare Compare trace contents 171
<trace>.CSELect Select signal for counter 173
<trace>.CustomTrace Custom trace 174
<trace>.CustomTrace.<label>.COMMAND Send command to specific DLL 174
<trace>.CustomTrace.<label>.UNLOAD Unload a single DLL 174
<trace>.CustomTraceLoad Load a DLL for trace analysis/Unload all DLLs 175
<trace>.DISable Disable the trace 176
<trace>.DISableChannel Disable FDX communication 176
<trace>.DisConfig Trace disassembler configuration 177
<trace>.DisConfig.CYcle Trace disassemble setting 177
<trace>.DisConfig.FlowMode Enable FlowTrace analysis 178
<trace>.DisConfig.RESet Reset trace disassemble setting 179
<trace>.DisConfig.view Trace disassemble setting 179
<trace>.DRAW Plot trace data against time 180
<trace>.DRAW.channel Plot no-data values against time 180
<trace>.DRAW.Data Plot data values against time 182
<trace>.DRAW.Var Plot variable values against time 186
<trace>.Enable Operation mode 190
<trace>.ENableChannel Enable FDX communication 190
<trace>.EXPORT Export trace data for processing in other applications 191
<trace>.EXPORT.Ascii Export trace data as ASCII 192
<trace>.EXPORT.Bin Export trace data as binary file 193
<trace>.EXPORT.BRANCHFLOW Export branch events from trace data 194
<trace>.EXPORT.CSVFunc Export the function nesting to a CSV file 195
<trace>.EXPORT.flow Export trace data 196
<trace>.EXPORT.Func Export function nesting 199
<trace>.EXPORT.MTV Export in MCDS Trace Viewer format 200
<trace>.EXPORT.TASKEVENTS Export task event to CSV 201
<trace>.EXPORT.TracePort Export trace packets as recorded at trace port 202
<trace>.EXPORT.VCD Export trace data in VCD format 203
<trace>.EXPORT.VERILOG Export trace data in VERILOG format 204
<trace>.EXPORT.VHDL Export trace data in VHDL format 204
<trace>.FILE Load a file into the file trace buffer 205
<trace>.Find Find specified entry in trace 207
<trace>.FindAll Find all specified entries in trace 211
<trace>.FindChange Search for changes in trace flow 212
<trace>.FLOWPROCESS Process flowtrace 213
General Commands Reference Guide T 6 ©1989-2019 Lauterbach GmbH
<trace>.FLOWSTART Restart flowtrace processing 213
<trace>.Get Display input level 214
<trace>.GOTO Move cursor to specified trace record 216
<trace>.IMPORT Import trace information 218
<trace>.IMPORT.CoreByteStream Import pure single core trace data 220
<trace>.IMPORT.ETB Import on-chip trace data 221
<trace>.IMPORT.flow Import bus trace data 221
<trace>.IMPORT.GUESSWRAP Guess wrap pointer 222
<trace>.IMPORT.STP Import STP recording from file (nibble) 222
<trace>.IMPORT.STPByteStream Import STP recording from file (byte) 223
<trace>.IMPORT.TraceFile Import trace data where processing has failed 223
<trace>.IMPORT.TracePort Import off-chip trace data 224
<trace>.IMPORT.VCD Import recorded signals in VCD file format 224
<trace>.IMPORT.WRAP Define wrap pointer 225
<trace>.InChannel Inchannel state display 226
<trace>.Init Initialize trace 226
<trace>.JKLMNO Sampling configuration for probes JKLMNO 227
<trace>.JOINFILE Concatenate several trace recordings 227
<trace>.LEVEL Select trigger level manually 227
<trace>.List List trace contents 230
<trace>.ListNesting Analyze function nesting 242
<trace>.ListVar List variable recorded to trace 245
<trace>.LOAD Load trace file for offline processing 248
<trace>.MERGEFILE Combine two trace files into one 250
Trace.METHOD Select trace method 251
<trace>.Mode Set the trace operation mode 253
<trace>.MUX Select channels 257
<trace>.OFF Switch off 257
<trace>.Out tbd. 257
<trace>.PC Display PC in real-time 258
<trace>.PipePROTO Unload all DLLs 259
<trace>.PipePROTO.COMMAND Send command to DLLs 259
<trace>.PipePROTO.load Define a user-supplied DLL as trace sink 259
<trace>.PipeWRITE Connect to a named pipe to stream trace data 260
<trace>.PortFilter Specify utilization of trace memory 260
<trace>.PortSize Set external port size 262
<trace>.PortType Specify trace interface 262
<trace>.PROfile Display counter profile 264
<trace>.PROfileChart Profile charts 265
<trace>.PROfileChart.COUNTER Display a profile chart 266
<trace>.PROfileChart.DIStance Time interval for a single event 267
<trace>.PROfileChart.DistriB Distribution display in timeslices 269
<trace>.PROfileChart.DURation Time between two events 270
General Commands Reference Guide T 7 ©1989-2019 Lauterbach GmbH
TRACE32 PowerTrace 270
TRACE32-ICE and TRACE32-FIRE 273
<trace>.PROfileChart.GROUP Group profile chart 274
<trace>.PROfileChart.Rate Event frequency 275
<trace>.PROfileChart.sYmbol Dynamic program behavior graphically (flat) 277
<trace>.PROfileChart.TASK Dynamic task behavior graphically (flat) 281
<trace>.PROfileSTATistic Statistical analysis in a table versus time 283
<trace>.Program Program trigger unit 283
<trace>.PROTOcol Protocol analysis 285
<trace>.PROTOcol.Chart Graphic display for user-defined protocol 285
<trace>.PROTOcol.Draw Graphic display for user-defined protocol 287
<trace>.PROTOcol.EXPORT Export trace buffer for user-defined protocol 288
<trace>.PROTOcol.Find Find in trace buffer for user-defined protocol 289
<trace>.PROTOcol.List Display trace buffer for user-defined protocol 290
<trace>.PROTOcol.STATistic Display statistics for user-defined protocol 293
Protocol specific Options 295
Options for ASYNC 295
Options for CAN 295
Options for I2C 296
Options for JTAG 296
Options for USB 297
<trace>.Rate Select sampling rate 298
<trace>.REF Set reference point for time measurement 299
<trace>.ReProgram Program trigger unit 300
<trace>.RESet Reset command 300
<trace>.SAMPLE Set AutoFocus sample time offset 300
<trace>.SAVE Save trace for postprocessing in TRACE32 302
Parameters 302
Options 303
<trace>.Select Select trigger/counter line 306
<trace>.SelfArm Automatic restart of trace recording 306
<trace>.SET Select line for recording 308
<trace>.ShowFocus Display data eye for AUTOFOCUS preprocessor 308
<trace>.ShowFocusClockEye Display clock eye 312
<trace>.ShowFocusEye Display data eye 314
<trace>.SIZE Define buffer size 317
<trace>.SLAVE Select slave mode 318
<trace>.SnapShot Restart trace capturing once 319
<trace>.SPY Adaptive Stream and Analysis 319
<trace>.state Display trace configuration window 321
<trace>.STATistic Statistic analysis 324
<trace>.STATistic.Address Time between up to 8 program events 325
<trace>.STATistic.AddressDIStance Time interval for single program event 326
General Commands Reference Guide T 8 ©1989-2019 Lauterbach GmbH
<trace>.STATistic.AddressDURation Time between two program events 327
<trace>.STATistic.BondOut Bondout mode 329
<trace>.STATistic.ChildTREE Show callee context of a function 329
<trace>.STATistic.COLOR Assign colors to function for colored graphics 330
<trace>.STATistic.CYcle Analyze cycle types 330
<trace>.STATistic.DatasYmbol Analyze pointer contents numerically 333
<trace>.STATistic.DIStance Time interval for a single event 335
<trace>.STATistic.DistriB Distribution analysis 338
<trace>.STATistic.DURation Time between two events 341
<trace>.STATistic.FIRST Start point for statistic analysis 344
<trace>.STATistic.Func Nesting function runtime analysis 346
PowerTrace 347
Procedure for Measurement for TRACE32-ICE and TRACE32-FIRE 366
<trace>.STATistic.FuncDURation Statistic analysis of single function 371
<trace>.STATistic.FuncDURationInternal Statistic analysis of single func. 372
<trace>.STATistic.GROUP Group run-time analysis 373
<trace>.STATistic.Ignore Ignore false records in statistic 374
<trace>.STATistic.INTERRUPT Interrupt statistic 375
<trace>.STATistic.InterruptIsFunction Statistics interrupt processing 376
<trace>.STATistic.INTERRUPTTREE Display interrupt nesting 377
<trace>.STATistic.LAST End point for statistic analysis 378
<trace>.STATistic.Line HLL-line analysis 380
<trace>.STATistic.LINKage Per caller statistic of function 383
<trace>.STATistic.LISTCONFIG tbd. 384
<trace>.STATistic.Measure Analyze the performance of a single signal 385
<trace>.STATistic.MODULE Code execution broken down by module 387
<trace>.STATistic.PAddress Which instructions accessed data address 387
<trace>.STATistic.ParentTREE Show the call context of a function 388
<trace>.STATistic.PIPELINE tbd. 389
<trace>.STATistic.PreFetch Prefetch detection 390
<trace>.STATistic.PROGRAM Code execution broken down by program 391
<trace>.STATistic.PsYmbol Shows which functions accessed data address 391
<trace>.STATistic.Sort Specify sorting criterion for statistic commands 393
<trace>.STATistic.sYmbol Flat run-time analysis 401
<trace>.STATistic.TASK Task activity statistic 406
<trace>.STATistic.TASKFunc Task specific function run-time analysis 413
Procedure for Measurement for TRACE32-ICD and PowerTrace 415
Procedure for Measurement for TRACE32-ICE and TRACE32-FIRE 416
<trace>.STATistic.TASKKernel Task analysis with kernel markers (flat) 421
<trace>.STATistic.TASKORINTERRUPT Statistic of interrupts and tasks 424
<trace>.STATistic.TASKSRV Analysis of time in OS service routines 424
<trace>.STATistic.TASKState Performance analysis 425
<trace>.STATistic.TASKTREE Tree display of task specific functions 429
General Commands Reference Guide T 9 ©1989-2019 Lauterbach GmbH
<trace>.STATistic.TASKVSINTERRUPT Statistic of interrupts, task-related 430
<trace>.STATistic.TREE Tree display of nesting function run-time analysis 431
<trace>.STATistic.Use Use records 432
<trace>.STREAMCompression Select compression mode for streaming 433
<trace>.STREAMFILE Specify temporary streaming file path 434
<trace>.STREAMFileLimit Set size limit for streaming file 435
<trace>.STREAMLOAD Load streaming file from disk 436
<trace>.STREAMSAVE Save streaming file to disk 438
<trace>.TCount Set trigger counter 438
<trace>.TDelay Trigger delay 439
<trace>.TERMination Use trace line termination of preprocessor 441
<trace>.TestFocus Test trace port recording 441
<trace>.TestFocusClockEye Scan clock eye 444
<trace>.TestFocusEye Check signal integrity 444
<trace>.THreshold Optimize threshold for trace lines 446
<trace>.TimeStamp Configure timestamp usage of LOGGER trace 447
<trace>.Timing Waveform of trace buffer 448
<trace>.TMode Select trigger mode 450
<trace>.TOut Enable trigger output line (PowerIntegrator) 450
<trace>.TPreDelay Pre-trigger delay 451
<trace>.TraceChannel tbd. 451
<trace>.TraceCLOCK Export trace data 452
<trace>.TraceCONNECT Select on-chip peripheral sink 452
<trace>.TRACK Set tracking record 453
<trace>.TRIGGER Trigger the trace 453
<trace>.TSELect Select trigger source 454
<trace>.TSYNC Select trigger line and mode 455
<trace>.TView Display trigger settings 456
<trace>.TWidth Set trigger filter 456
<trace>.View Display single record 457
<trace>.XTrack Cross system tracking 458
<trace>.ZERO Align timestamps of trace and timing analyzers 459
TRACEPORT ............................................................................................................................ 460
TRACEPORT Configure trace hardware 460
TRACEPORT.EndsKiP Define number of bytes skipped at the end of frame 461
TRACEPORT.LaneCount Select port size of the trace port 462
TRACEPORT.LaneSpeed Inform debugger about trace port frequency 462
TRACEPORT.MsgBItEndian Change bit-order within each byte 463
TRACEPORT.MsgBYteEndian Change byte-order within each word 464
TRACEPORT.MsgLOngEndian Change dword-order within each qword 464
TRACEPORT.MsgWOrdEndian Change word-order within each dword 465
TRACEPORT.PinReMap Adapt the lane order of the trace port 466
TRACEPORT.RefCLocK Set up reference clock for trace port 467
General Commands Reference Guide T 10 ©1989-2019 Lauterbach GmbH
TRACEPORT.RESet Reset trace port configuration 467
TRACEPORT.StartsKiP Define number of bytes skipped at the start of frame 468
TRACEPORT.state Display trace port configuration window 469
TrAddress ................................................................................................................................ 470
TrAddress Select output signal 470
TRANSlation ............................................................................................................................ 473
TRANSlation Debugger address translation 473
Overview TRANSlation 473
TRANSlation.AutoEnable Auto-enable debugger MMU translation 476
TRANSlation.AutoSCAN Autoscan feature for debugger MMU 476
TRANSlation.CacheFlush Flush TRACE32 address translation cache 477
TRANSlation.CLEANUP Clean up MMU table 477
TRANSlation.COMMON Common address ranges for kernel and tasks 478
TRANSlation.COMMON.ADD Add another common address range 480
TRANSlation.COMMON.CLEAR Clear all common logical address ranges 480
TRANSlation.Create Create translation 481
TRANSlation.CreateID Add entry to MMU space ID table 482
TRANSlation.CreateTab Create multiple translations 482
TRANSlation.Delete Delete translation 483
TRANSlation.DeleteID Remove entry from MMU space ID table 483
TRANSlation.List List MMU translation table 484
TRANSlation.ListID List MMU space ID table 485
TRANSlation.NoProtect Unprotect memory 485
TRANSlation.OFF Deactivate debugger address translation 486
TRANSlation.ON Activate debugger address translation 486
TRANSlation.PAGER Allow paged breakpoints for Linux 487
TRANSlation.Protect Protect memory 488
TRANSlation.Protect.ADD Add range to protected memory ranges 488
TRANSlation.Protect.OFF Switch protection of target memory off 489
TRANSlation.Protect.ON Protect entire target memory 490
TRANSlation.RESet Reset MMU configuration 491
TRANSlation.SCANall Scan MMU tables 491
TRANSlation.ScanID Scan MMU address space tables from kernel 491
TRANSlation.SHADOW Enable shadow access to target memory 492
TRANSlation.state Overview of translation settings 493
TRANSlation.TableWalk Automatic MMU page table walk 494
TRANSlation.TlbAutoScan Allow automatic TLB scans during table walk 495
TRANSlation.TRANSparent Transparent banking area 497
TrBus ........................................................................................................................................ 498
TrBus Trigger bus 498
Overview TrBus 498
Trigger Bus on the PowerTrace 500
General Commands Reference Guide T 11 ©1989-2019 Lauterbach GmbH
Interaction Between Independent PODBUS Devices 501
TrBus.Arm Arm the trigger bus 502
TrBus.Connect Configure TRIGGER as input or output 503
TrBus.Mode Define polarity/edge for the trigger signal 504
TrBus.OFF Switch trigger bus off 504
TrBus.Out Define source for the external trigger pulse 505
TrBus.RESet Reset setting for trigger bus 505
TrBus.Set Define the target for the incoming trigger 505
TrBus.state Display settings for the trigger bus 506
TrBus.Trigger Stimulate a trigger on the trigger bus 506
TrEvent ..................................................................................................................................... 508
TrEvent Event trigger system 508
Overview TrEvent 508
TrEvent.Delay Define delay 509
TrEvent.Enable Select time windows 509
TrEvent.Init Initialization 510
TrEvent.MinInit Initialization 510
TrEvent.Mode Select operation mode 510
TrEvent.OFF Switch off 514
TrEvent.ON Switch on 515
TrEvent.RESet Reset command 516
TrEvent.Select Select event source 516
TrEvent.view State display 518
TrIn ............................................................................................................................................ 519
TrIn Internal trigger logic 519
Overview TrIn 519
TrIn.Clock Define clock 521
TrIn.Data Define data 524
TrIn.Mask Define bits 525
TrIn.Normal Level operation 525
TrIn.RESet Reset command 525
TrIn.state State display 525
TrIn.Transient Transient operation 526
TrMain ....................................................................................................................................... 528
TrMain Trigger system of TRACE32-ICE 528
Overview TrMain 528
TrMain.ALways Constant triggering 531
TrMain.Arm Release and activate trigger system 531
TrMain.AutoInit Automatic trigger initialization 531
TrMain.AutoStart Automatic trigger initialization 532
TrMain.Break Break 532
TrMain.Count Set trigger counter 533
General Commands Reference Guide T 12 ©1989-2019 Lauterbach GmbH
TrMain.Delay Set trigger delay 533
TrMain.Init Initialize trigger system 534
TrMain.Mode Select mode 534
TrMain.OFF Switch off trigger system 535
TrMain.Out Output trigger pulse 535
TrMain.RESet Reset trigger system 536
TrMain.Set Select trigger sources 537
TrMain.state Trigger state display 542
TrMain.Trigger Trigger 542
TrOnchip .................................................................................................................................. 543
TrOnchip Onchip triggers 543
TrOnchip.Address tbd. 543
TrOnchip.CONVert Adjust range breakpoint in onchip registers 544
TrOnchip.CYcle tbd. 545
TrOnchip.Data tbd. 545
TrOnchip.RESet Reset settings to defaults 545
TrOnchip.Set Break on event 546
TrOnchip.state Display onchip trigger window 547
TrOnchip.TaskID tbd. 548
TrOnchip.TEnable tbd. 548
TrPOD ....................................................................................................................................... 549
TrPOD Trigger probe 549
TrPOD.Clock Defines data mask 549
TrPOD.ClockPOL Defines data polarity 549
TrPOD.Data Defines data mask 550
TrPOD.DataPOL Defines data polarity 550
TrPOD.Mode Defines data polarity 551
TrPOD.OFF Switch off 552
TrPOD.ON Switch on 552
TrPOD.RESet Reset command 552
TrPOD.state State display 553
TrPOD.Time Defines the time for the pulse width trigger 554
General Commands Reference Guide T 13 ©1989-2019 Lauterbach GmbH
General Commands Reference Guide T
Version 06-Nov-2019
History
25-Jun-19 Description of the new trace method NONE in <trace>.METHOD NONE and “What to know about the TRACE32 default settings for Trace.METHOD”.
18-Mar-19 New command TASK.ORTI.SPLITSTACK. New section “What to know about the Machine Parameters”.
27-Feb-19 Updated the commands TRANSlation.ON, TRANSlation.OFF, TRANSlation.TableWalk, and TRANSlation.NoProtect.
22-Feb-19 Description of the command group TRANSlation.Protect.
13-Aug-18 Description of the new command TargetSystem.NewInstance.
10-Aug-18 The channel number was added to the command syntax of most TERM commands. The channel number allows the concurrent use of several terminal windows.
03-Aug-18 Link to “Application Note for the Trace.DRAW Command” (app_trace_draw.pdf) added to Trace.DRAW.Data and Trace.DRAW.Var command. Related to this, a clean-up for both commands was performed.
10-Jul-18 Description of the command TRANSlation.state.
08-Mar-18 Description for command Trace.ListVar updated.
25-Jan-18 Syntax description and examples for commands Trace.DRAW.Data and Trace.DRAW.Var updated.
08-Dec-17 Description of the command group TRACEPORT.
General Commands Reference Guide T 14 ©1989-2019 Lauterbach GmbH
TargetSystem
TargetSystem TRACE32 PowerView instances
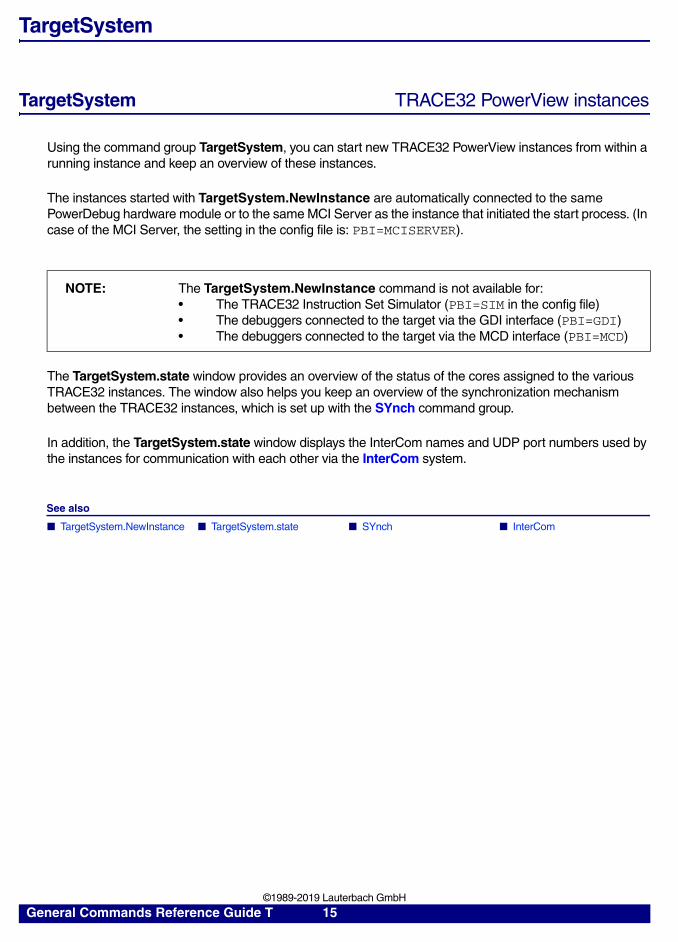
Using the command group TargetSystem, you can start new TRACE32 PowerView instances from within a running instance and keep an overview of these instances.
The instances started with TargetSystem.NewInstance are automatically connected to the same PowerDebug hardware module or to the same MCI Server as the instance that initiated the start process. (In case of the MCI Server, the setting in the config file is: PBI=MCISERVER).
The TargetSystem.state window provides an overview of the status of the cores assigned to the various TRACE32 instances. The window also helps you keep an overview of the synchronization mechanism between the TRACE32 instances, which is set up with the SYnch command group.
In addition, the TargetSystem.state window displays the InterCom names and UDP port numbers used by the instances for communication with each other via the InterCom system.
See also
■ TargetSystem.NewInstance ■ TargetSystem.state ■ SYnch ■ InterCom
NOTE: The TargetSystem.NewInstance command is not available for:• The TRACE32 Instruction Set Simulator (PBI=SIM in the config file)• The debuggers connected to the target via the GDI interface (PBI=GDI)• The debuggers connected to the target via the MCD interface (PBI=MCD)
General Commands Reference Guide T 15 ©1989-2019 Lauterbach GmbH
TargetSystem.NewInstance Start new TRACE32 PowerView instance[Examples]
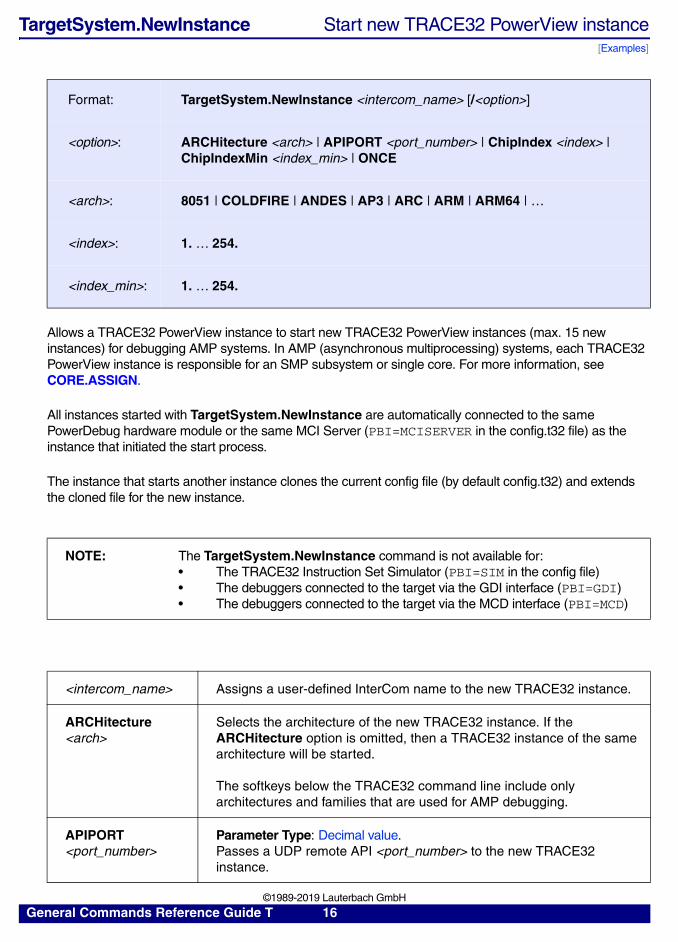
Allows a TRACE32 PowerView instance to start new TRACE32 PowerView instances (max. 15 new instances) for debugging AMP systems. In AMP (asynchronous multiprocessing) systems, each TRACE32 PowerView instance is responsible for an SMP subsystem or single core. For more information, see CORE.ASSIGN.
All instances started with TargetSystem.NewInstance are automatically connected to the same PowerDebug hardware module or the same MCI Server (PBI=MCISERVER in the config.t32 file) as the instance that initiated the start process.
The instance that starts another instance clones the current config file (by default config.t32) and extends the cloned file for the new instance.
Format: TargetSystem.NewInstance <intercom_name> [/<option>]
<option>: ARCHitecture <arch> | APIPORT <port_number> | ChipIndex <index> | ChipIndexMin <index_min> | ONCE
<arch>: 8051 | COLDFIRE | ANDES | AP3 | ARC | ARM | ARM64 | …
<index>: 1. … 254.
<index_min>: 1. … 254.
NOTE: The TargetSystem.NewInstance command is not available for:• The TRACE32 Instruction Set Simulator (PBI=SIM in the config file)• The debuggers connected to the target via the GDI interface (PBI=GDI)• The debuggers connected to the target via the MCD interface (PBI=MCD)
<intercom_name> Assigns a user-defined InterCom name to the new TRACE32 instance.
ARCHitecture <arch>
Selects the architecture of the new TRACE32 instance. If the ARCHitecture option is omitted, then a TRACE32 instance of the same architecture will be started.
The softkeys below the TRACE32 command line include only architectures and families that are used for AMP debugging.
APIPORT <port_number>
Parameter Type: Decimal value. Passes a UDP remote API <port_number> to the new TRACE32 instance.
General Commands Reference Guide T 16 ©1989-2019 Lauterbach GmbH
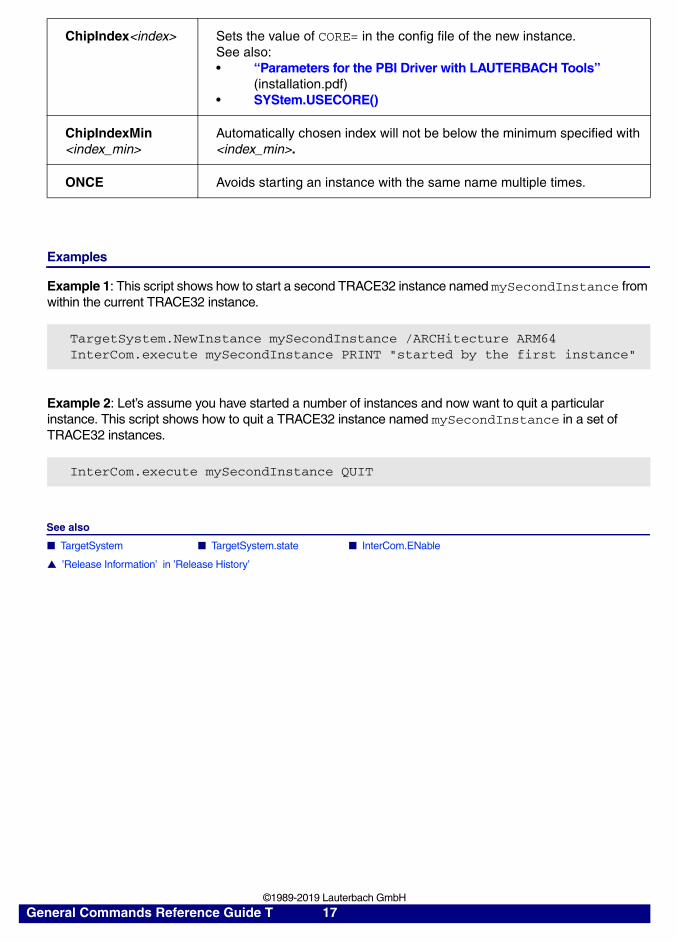
Examples
Example 1: This script shows how to start a second TRACE32 instance named mySecondInstance from within the current TRACE32 instance.
Example 2: Let’s assume you have started a number of instances and now want to quit a particular instance. This script shows how to quit a TRACE32 instance named mySecondInstance in a set of TRACE32 instances.
See also
■ TargetSystem ■ TargetSystem.state ■ InterCom.ENable
▲ ’Release Information’ in ’Release History’
ChipIndex<index> Sets the value of CORE= in the config file of the new instance. See also:• “Parameters for the PBI Driver with LAUTERBACH Tools”
(installation.pdf)• SYStem.USECORE()
ChipIndexMin <index_min>
Automatically chosen index will not be below the minimum specified with <index_min>.
ONCE Avoids starting an instance with the same name multiple times.
TargetSystem.NewInstance mySecondInstance /ARCHitecture ARM64InterCom.execute mySecondInstance PRINT "started by the first instance"
InterCom.execute mySecondInstance QUIT
General Commands Reference Guide T 17 ©1989-2019 Lauterbach GmbH
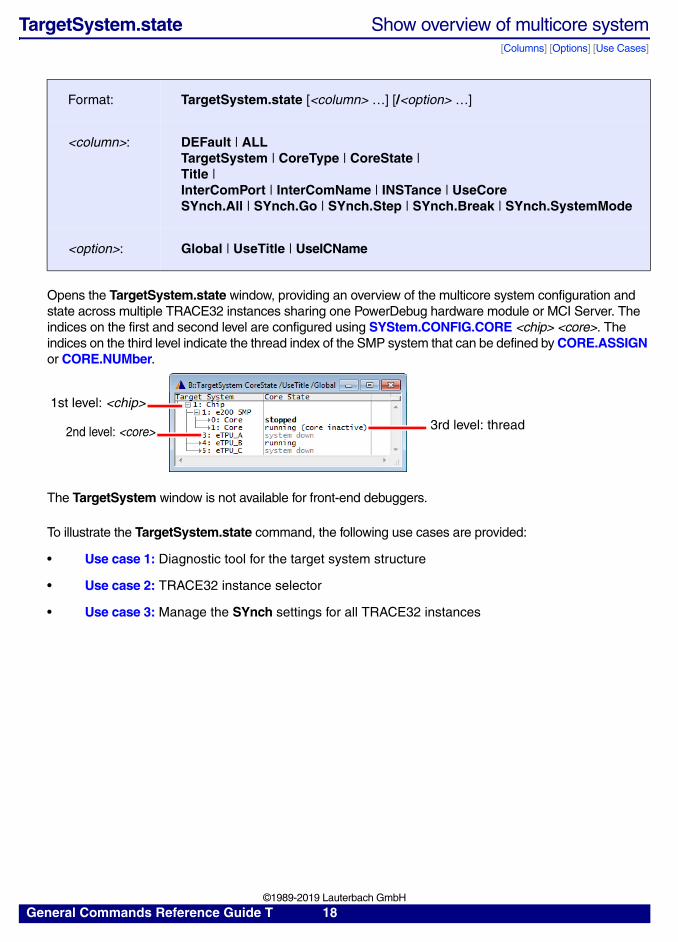
TargetSystem.state Show overview of multicore system[Columns] [Options] [Use Cases]
Opens the TargetSystem.state window, providing an overview of the multicore system configuration and state across multiple TRACE32 instances sharing one PowerDebug hardware module or MCI Server. The indices on the first and second level are configured using SYStem.CONFIG.CORE <chip> <core>. The indices on the third level indicate the thread index of the SMP system that can be defined by CORE.ASSIGN or CORE.NUMber.
The TargetSystem window is not available for front-end debuggers.
To illustrate the TargetSystem.state command, the following use cases are provided:
• Use case 1: Diagnostic tool for the target system structure
• Use case 2: TRACE32 instance selector
• Use case 3: Manage the SYnch settings for all TRACE32 instances
Format: TargetSystem.state [<column> …] [/<option> …]
<column>: DEFault | ALLTargetSystem | CoreType | CoreState | Title | InterComPort | InterComName | INSTance | UseCoreSYnch.All | SYnch.Go | SYnch.Step | SYnch.Break | SYnch.SystemMode
<option>: Global | UseTitle | UseICName
1st level: <chip>
2nd level: <core> 3rd level: thread
General Commands Reference Guide T 18 ©1989-2019 Lauterbach GmbH
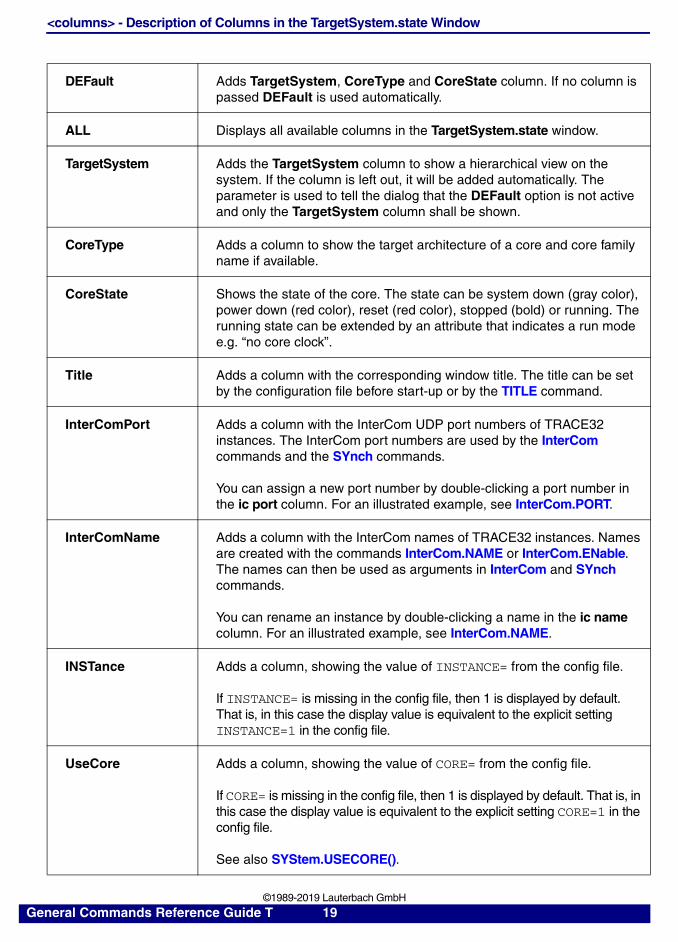
<columns> - Description of Columns in the TargetSystem.state Window
DEFault Adds TargetSystem, CoreType and CoreState column. If no column is passed DEFault is used automatically.
ALL Displays all available columns in the TargetSystem.state window.
TargetSystem Adds the TargetSystem column to show a hierarchical view on the system. If the column is left out, it will be added automatically. The parameter is used to tell the dialog that the DEFault option is not active and only the TargetSystem column shall be shown.
CoreType Adds a column to show the target architecture of a core and core family name if available.
CoreState Shows the state of the core. The state can be system down (gray color), power down (red color), reset (red color), stopped (bold) or running. The running state can be extended by an attribute that indicates a run mode e.g. “no core clock”.
Title Adds a column with the corresponding window title. The title can be set by the configuration file before start-up or by the TITLE command.
InterComPort Adds a column with the InterCom UDP port numbers of TRACE32 instances. The InterCom port numbers are used by the InterCom commands and the SYnch commands.
You can assign a new port number by double-clicking a port number in the ic port column. For an illustrated example, see InterCom.PORT.
InterComName Adds a column with the InterCom names of TRACE32 instances. Names are created with the commands InterCom.NAME or InterCom.ENable. The names can then be used as arguments in InterCom and SYnch commands.
You can rename an instance by double-clicking a name in the ic name column. For an illustrated example, see InterCom.NAME.
INSTance Adds a column, showing the value of INSTANCE= from the config file.
If INSTANCE= is missing in the config file, then 1 is displayed by default. That is, in this case the display value is equivalent to the explicit setting INSTANCE=1 in the config file.
UseCore Adds a column, showing the value of CORE= from the config file.
If CORE= is missing in the config file, then 1 is displayed by default. That is, in this case the display value is equivalent to the explicit setting CORE=1 in the config file.
See also SYStem.USECORE().
General Commands Reference Guide T 19 ©1989-2019 Lauterbach GmbH
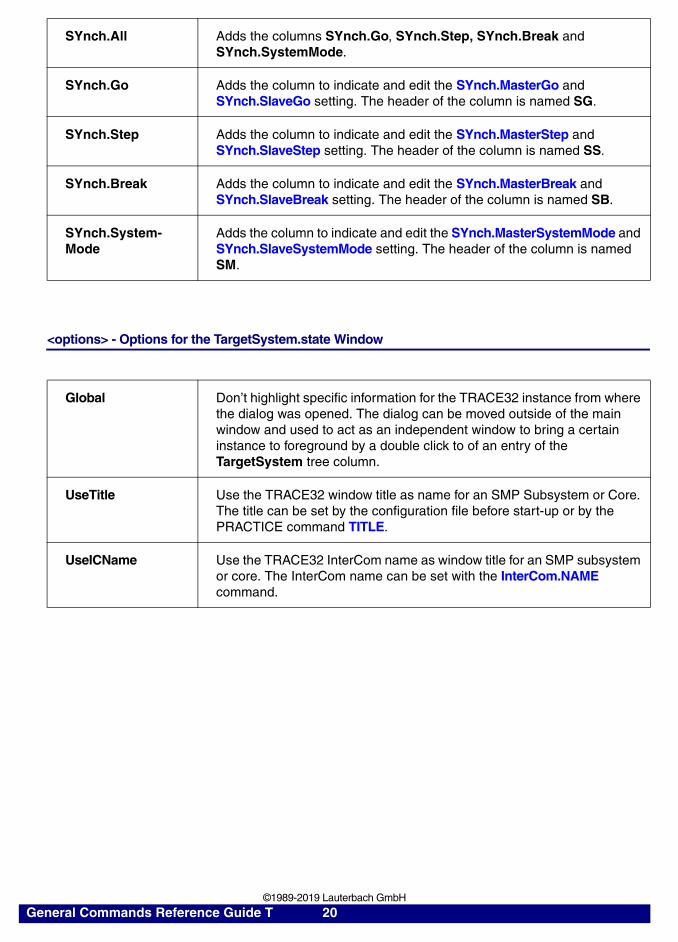
<options> - Options for the TargetSystem.state Window
SYnch.All Adds the columns SYnch.Go, SYnch.Step, SYnch.Break and SYnch.SystemMode.
SYnch.Go Adds the column to indicate and edit the SYnch.MasterGo and SYnch.SlaveGo setting. The header of the column is named SG.
SYnch.Step Adds the column to indicate and edit the SYnch.MasterStep and SYnch.SlaveStep setting. The header of the column is named SS.
SYnch.Break Adds the column to indicate and edit the SYnch.MasterBreak and SYnch.SlaveBreak setting. The header of the column is named SB.
SYnch.System-Mode
Adds the column to indicate and edit the SYnch.MasterSystemMode and SYnch.SlaveSystemMode setting. The header of the column is named SM.
Global Don’t highlight specific information for the TRACE32 instance from where the dialog was opened. The dialog can be moved outside of the main window and used to act as an independent window to bring a certain instance to foreground by a double click to of an entry of the TargetSystem tree column.
UseTitle Use the TRACE32 window title as name for an SMP Subsystem or Core. The title can be set by the configuration file before start-up or by the PRACTICE command TITLE.
UseICName Use the TRACE32 InterCom name as window title for an SMP subsystem or core. The InterCom name can be set with the InterCom.NAME command.
General Commands Reference Guide T 20 ©1989-2019 Lauterbach GmbH
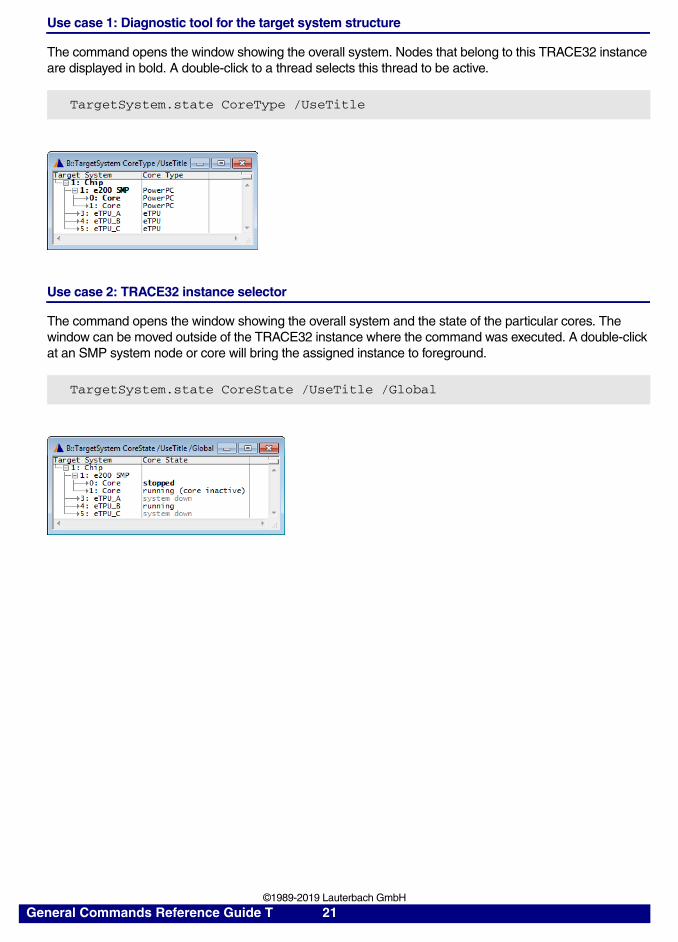
Use case 1: Diagnostic tool for the target system structure
The command opens the window showing the overall system. Nodes that belong to this TRACE32 instance are displayed in bold. A double-click to a thread selects this thread to be active.
Use case 2: TRACE32 instance selector
The command opens the window showing the overall system and the state of the particular cores. The window can be moved outside of the TRACE32 instance where the command was executed. A double-click at an SMP system node or core will bring the assigned instance to foreground.
TargetSystem.state CoreType /UseTitle
TargetSystem.state CoreState /UseTitle /Global
General Commands Reference Guide T 21 ©1989-2019 Lauterbach GmbH
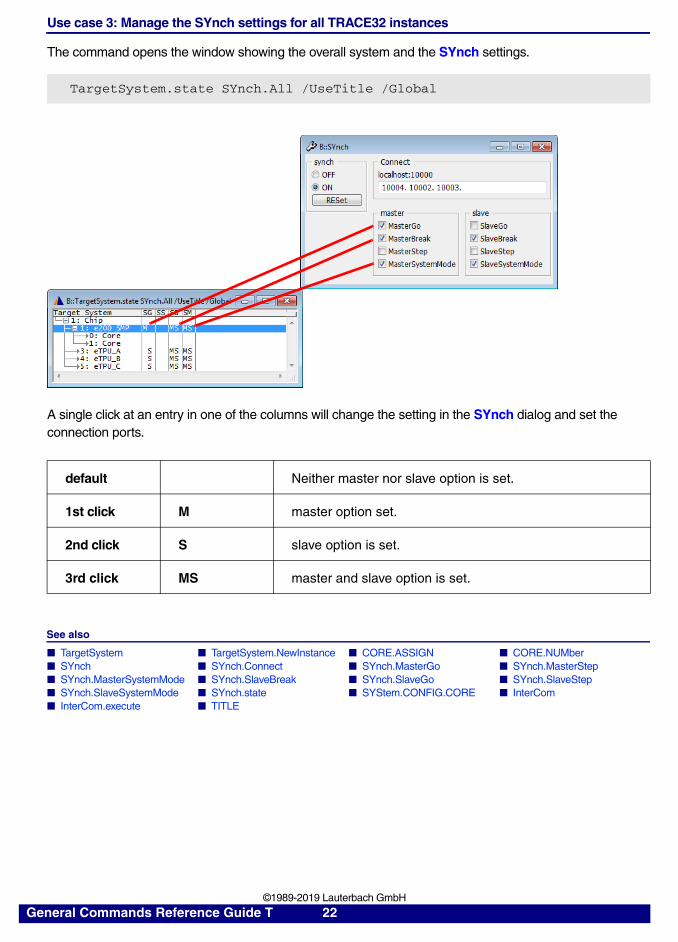
Use case 3: Manage the SYnch settings for all TRACE32 instances
The command opens the window showing the overall system and the SYnch settings.
A single click at an entry in one of the columns will change the setting in the SYnch dialog and set the connection ports.
See also
■ TargetSystem ■ TargetSystem.NewInstance ■ CORE.ASSIGN ■ CORE.NUMber ■ SYnch ■ SYnch.Connect ■ SYnch.MasterGo ■ SYnch.MasterStep ■ SYnch.MasterSystemMode ■ SYnch.SlaveBreak ■ SYnch.SlaveGo ■ SYnch.SlaveStep ■ SYnch.SlaveSystemMode ■ SYnch.state ■ SYStem.CONFIG.CORE ■ InterCom ■ InterCom.execute ■ TITLE
TargetSystem.state SYnch.All /UseTitle /Global
default Neither master nor slave option is set.
1st click M master option set.
2nd click S slave option is set.
3rd click MS master and slave option is set.
General Commands Reference Guide T 22 ©1989-2019 Lauterbach GmbH
TASK
TASK OS Awareness for TRACE32[Task Magic Numbers, IDs, Names] [Machine Magic Numbers, IDs, Names] [Glossary]
See also
■ TASK.ACCESS ■ TASK.Break ■ TASK.CACHEFLUSH ■ TASK.CONFIG ■ TASK.COPYDOWN ■ TASK.COPYUP ■ TASK.CreateExtraID ■ TASK.CreateID ■ TASK.Debug ■ TASK.DeleteID ■ TASK.DETACH ■ TASK.INSTALL ■ TASK.KILL ■ TASK.List ■ TASK.ListID ■ TASK.MTXTRC ■ TASK.NAME ■ TASK.NoBreak ■ TASK.NoDebug ■ TASK.NoStop ■ TASK.OFF ■ TASK.ON ■ TASK.ORTI ■ TASK.RESet ■ TASK.RUN ■ TASK.select ■ TASK.SETDIR ■ TASK.STacK ■ TASK.Stop ■ EXTension ❏ TASK.ACCESS() ❏ TASK.BACK() ❏ TASK.CONFIG() ❏ TASK.CONFIGFILE() ❏ TASK.F1() ❏ TASK.F2() ❏ TASK.F3() ❏ TASK.F4() ❏ TASK.FORE() ❏ TASK.ID() ❏ TASK.MAGIC() ❏ TASK.NAME() ❏ TASK.SPACEID()
▲ ’TASK Functions’ in ’General Function Reference’
Overview TASK
This chapter describes the OS Awareness features (aka kernel awareness), generic to all processors and kernels. Kernel specific features are described in additional manuals, see OS Awareness Manuals.
The OS Awareness may support the following main features:
• Display of kernel resources (e.g. tasks, queues, semaphores, messages).
• Task stack coverage.
• Task related breakpoints.
• Task context display.
• Manual execution of system calls.
• Operating system’s MMU support.
• Dynamic task performance measurement
• Task runtime statistics and flowchart display out of the trace buffer. Display of task switches in the trace listing.
• Task state statistics and time chart out of the trace buffer, i.e. show how long each task is in a certain state (running, ready, etc.).
• Task-related function runtime statistics, flowchart display and function nesting display out of the trace buffer.
• Display system calls with parameters in the trace listing.
• Fast access to the features through dedicated menus.
General Commands Reference Guide T 23 ©1989-2019 Lauterbach GmbH
Not all features are implemented for all processors and kernels. Please see the kernel specific manual for a detailed description of the supported features.
OS Awareness Configurations
The OS Awareness is configured by the TASK.CONFIG command. The command loads a configuration file that tells the debugger all kernel-related information. It can be adopted to any (RT)OS kernel. Lauterbach provides ready-to-start configuration files for a wide range of real-time operating systems. If you want to adapt it to your own proprietary kernel, ask Lauterbach for assistance.
What to know about the Task Parameters
In TRACE32, operating system tasks (short: tasks) can be identified based on one of these values:
• Task magic number
• Task ID
• Task name
For OS-aware debugging and tracing, these three values are displayed in the TASK.List.tasks window and can be returned with the functions TASK.MAGIC(), TASK.ID(), and TASK.NAME(). In addition, the three values can be passed as parameters to task-related TRACE32 commands and options.
Task Magic Number
The task magic number is an arbitrary hex value, used by TRACE32 to uniquely identify a task of an operating system. The meaning of the value depends on the OS Awareness; often it refers to the task control block of the target OS or to the task ID.
Task ID
This value refers to the numeric task ID as given by the operating system. If the OS does not provide a task ID, this option may not be available.
NOTE: In case of the TASK.CONFIG command, you will encounter the parameter <magic_address>.
• <task_magic> and <magic_address> are not the same.
• For information about <magic_address>, see TASK.CONFIG command.
<task_magic> Parameter Type: Hex value. Example: TASK.select 0xEFF7B040
<task_id> Parameter Type: Decimal value.Example: TASK.select 1546.
General Commands Reference Guide T 24 ©1989-2019 Lauterbach GmbH
Task Name
This string refers to the task name as given by the operating system. If the OS does not provide a task name, this option may not be available.
If the task runs in a system involving virtualization, then the task name can be preceded with the machine name.
What to know about the Machine Parameters
In hypervisor-based environments, TRACE32 identifies machines based on one of these values:
• Machine magic number
• Machine ID
• Machine name
For hypervisor debugging and tracing, these three values are displayed in the TASK.List.MACHINES window. In addition, the three values can be passed as parameters to machine-related TRACE32 commands and options.
Machine Magic Number
A machine magic number is an arbitrary hex value, used by TRACE32 to uniquely identify a machine (host machine or guest machine). The meaning of the value depends on the Hypervisor Awareness; often it refers to the guest control block of the hypervisor or to the machine ID.
<task_name> Parameter Type: String.
Example 1: TASK.select "adbd:1546"Example 2: TASK.select "FreeRTOS:::SieveDemo" FreeRTOS is the name of the machine. The three colons ::: serve as the separator between the machine name and the task name SieveDemo.
<machine_magic> Parameter Type: Hex value. Range: machine magic number > 0xFF
Machine magic numbers are displayed, for example, in the magic column of the TASK.List.MACHINES window as hex values.
General Commands Reference Guide T 25 ©1989-2019 Lauterbach GmbH
Machine ID
A machine ID is a numeric identifier which extends a logical address and intermediate physical address in TRACE32 or can be used together with the option MACHINE in some TRACE32 commands. The purpose of a machine ID is to identify guest machines within a system that is using a hypervisor to run multiple virtual machines.
In TRACE32, the machine ID clearly specifies which virtual machine (a guest machine or the host machine) an address belongs to:
• The machine ID 0 (zero) is always associated with the host machine running the hypervisor.
• All the other machine IDs >= 1 are associated with the guest machines.
Format of addresses with machine IDs:
In the TRACE32 address format, the machine ID is always in the leading position, directly after the access class specifier. The machine ID is followed a triple colon (:::) to separate the machine ID from the remaining parts of an address. The format of a TRACE32 address containing a machine ID looks like this:
• Without space ID:
<access_class>:<machine_id>:::<address_offset>
• With space ID:
<access_class>:<machine_id>:::<space_id>::<address_offset>
Examples:
• Without space ID:
- G:0x1:::0x80000000
- 0x2:::0xA0000000
• With space ID:
- G:0x3:::0x020A::0x80000000
- G:0x0:::0x0::0x4000C000
- 0x2:::0x170::0x1F000000
Notes:
• Machine IDs can only be used if a TRACE32 Hypervisor Awareness is loaded with the command EXTension.LOAD.
• Use command SYStem.Option.MACHINESPACES ON to enable machine IDs in TRACE32.
<machine_id> Parameter Type: Decimal or hex value. Range: 0x0 <= machine ID < 0x1F
Machine IDs are displayed, for example, in the mid column of the TASK.List.MACHINES window as decimal values (1., 2., etc.)
General Commands Reference Guide T 26 ©1989-2019 Lauterbach GmbH
Machine Name
A machine name is a meaningful string that allows users to identify a host or guest machine in a hypervisor-based environment. The machine name is given by the Hypervisor Awareness. If the Hypervisor Awareness does not provide a machine name, you can assign a name to a machine by using the NAME option of the EXTension.LOAD command. Without the NAME option, the base name of the extension definition file will be used.
In a hypervisor-based environment, the machine name precedes the task name.
Glossary
For important OS Awareness and Hypervisor Awareness terms, such as task, thread, process, machine, kernel, MMU space, and virtual machine, refer to the “TRACE32 Glossary” (glossary.pdf).
<machine_name> Parameter Type: String.
Example: TASK.select "FreeRTOS:::SieveDemo" FreeRTOS is the name of the machine. The three colons ::: serve as the separator between the machine name and the task name SieveDemo.
General Commands Reference Guide T 27 ©1989-2019 Lauterbach GmbH
TASK.ACCESS Control memory access
Defines the memory access class used by TASK related windows.
TASK related windows may access the target memory (e.g. when reading task control blocks). If the access class is set to E:, the debugger uses emulation memory access to read the memory (e.g. emulation memory, shadow memory or pseudo-dual-port access). If set to C:, the debugger uses CPU access. If the appropriate access is not possible, the window is temporarily frozen.
TASK.ACCESS without parameter enables the default mode, which uses E:, if the application is running, and C: if the application is stopped.
Please see also the manuals for a description of E: and C: to your processor.
• Processor Architecture Manuals
• Target Guides FIRE
• Target Guides ICE
See also
■ TASK
ICE only
TASK.Break Deprecated
It was used in 68k ICE only for task selective debugging. TASK.Break marks a task of the selective list to be breaked at the next entry.
See also
■ TASK
Format: TASK.ACCESS [<class>]
Format: TASK.Break <task> (deprecated)
General Commands Reference Guide T 28 ©1989-2019 Lauterbach GmbH
ICE only
TASK.CACHEFLUSH Reread task list
Usually not needed. Use only if advised to do so.
The debugger reads out the task list of the target at each single step or Go/Break sequence, and stores the list internally (see TASK.List.tasks). If the task list or task characteristics change while the target is halted, a manual update of the task list may be necessary. This command forces an immediate re-evaluation of the task list.
See also
■ TASK
TASK.CONFIG Configure OS Awareness
Configures the OS Awareness using a given configuration file. Please refer to the OS-specific manual. See OS Awareness Manuals.
Arguments:
Format: TASK.CACHEFLUSH
Format: TASK.CONFIG <os_awareness_file> <magic_address> <args> [/<option>]
<option>: ACCESS <class>
<os_awareness_file>
File name of the configuration file.
<magic_address> Address of the memory location holding the task magic number of the currently running task. See “What to know about the Task Parameters”, page 24.
<args> All other arguments are interpreted by the configuration file. Details of predefined files are described in the kernel-specific part of an OS Awareness Manual.
General Commands Reference Guide T 29 ©1989-2019 Lauterbach GmbH
Options:
See also
■ TASK ■ EXTension.LOAD ■ MMU
▲ ’Configuration’ in ’Bootloader Awareness Manual coreboot’▲ ’Configuration’ in ’Bootloader Awareness Manual GRUB’▲ ’Release Information’ in ’Release History’▲ ’Configuration’ in ’OS Awareness Manual FreeRTOS’▲ ’Configuration’ in ’OS Awareness Manual HI7000’▲ ’Configuration’ in ’OS Awareness Manual NORTi’▲ ’Configuration’ in ’OS Awareness Manual OKL4’▲ ’Configuration’ in ’OS Awareness Manual PrKERNEL’▲ ’Configuration’ in ’OS Awareness Manual RTXC Quadros’▲ ’Configuration’ in ’OS Awareness Manual REALOS’▲ ’Configuration’ in ’OS Awareness Manual RTEMS’▲ ’Configuration’ in ’OS Awareness Manual RTX-ARM’▲ ’Configuration’ in ’OS Awareness Manual MicroC3/Compact’▲ ’Configuration’ in ’OS Awareness Manual MicroC3/Standard’▲ ’Configuration’ in ’OS Awareness Manual Zephyr’▲ ’Configuration’ in ’UEFI Awareness Manual BLDK’▲ ’Configuration’ in ’UEFI Awareness Manual TianoCore’
TASK.COPYDOWN Copy file from host into target
Copies a file from the host into the target. Only supported for Linux and QNX run mode debugging.
See also
■ TASK
▲ ’Commands for Run Mode Debugging’ in ’Run Mode Debugging Manual Linux’▲ ’Commands for Run Mode Debugging’ in ’Run Mode Debugging Manual QNX’
ACCESS Defines the memory access class used by TASK-related windows. See TASK.ACCESS.
Format: TASK.COPYDOWN <source_file_host> <destination_file_target>
General Commands Reference Guide T 30 ©1989-2019 Lauterbach GmbH
TASK.COPYUP Copy file from target into host
Copies a file from the target into the host. Only supported for Linux and QNX run mode debugging.
See also
■ TASK
▲ ’Commands for Run Mode Debugging’ in ’Run Mode Debugging Manual Linux’▲ ’Commands for Run Mode Debugging’ in ’Run Mode Debugging Manual QNX’
TASK.CreateExtraID Create a virtual task
Creates a virtual task ID for trace analysis. Trace analysis will use the given task ID for task identification rather than the task magic number. Only for some dedicated applications.
See also
■ TASK
TASK.CreateID Create virtual task
Creates a virtual task name for trace analysis. Trace analysis will use the given task name for task identification, rather than the task magic. Only for some dedicated applications.
See also
■ TASK
Format: TASK.COPYUP <source_file_target> <destination_file_host>
Format: TASK.CreateExtraID <task_name> <task_id> <space_id> <trace_id>
Format: TASK.CreateID <task_name> <task_id> <space_id> <trace_id>
General Commands Reference Guide T 31 ©1989-2019 Lauterbach GmbH
ICE only
TASK.Debug Deprecated
It was used in 68k ICE only for task selective debugging. TASK.Debug marks a task of the selective list as active for debugging.
See also
■ TASK
▲ ’LynxOS Commands’ in ’OS Awareness Manual LynxOS’
TASK.DeleteID Delete virtual task
Delete a virtual task created with TASK.CreateID or TASK.CreateExtraID.
See also
■ TASK
Debugger only
TASK.DETACH Detach from task
Requests the debug agent to detach from the process <id>.
Only applicable if GDB (Linux) is used as debug agent.
Example:
See also
■ TASK
▲ ’Commands for Run Mode Debugging’ in ’Run Mode Debugging Manual QNX’
Format: TASK.Debug <task> (deprecated)
Format: TASK.DeleteID <task_id>
Format: TASK.DETACH <id>
TASK.DETACH 41.
General Commands Reference Guide T 32 ©1989-2019 Lauterbach GmbH
TASK.INSTALL Deprecated
See also
■ TASK
Debugger only
TASK.KILL End task
Request the debug agent to end the process <id>.
Only applicable if GDB (Linux) or TRK (Symbian) is used as debug agent.
Example:
See also
■ TASK
▲ ’Pdebug Front-end Specific Commands’ in ’TRACE32 pdebug Target Server for ARM’▲ ’Commands for Run Mode Debugging’ in ’Run Mode Debugging Manual Linux’▲ ’Commands for Run Mode Debugging’ in ’Run Mode Debugging Manual QNX’
Format: TASK.INSTALL (deprecated)
Format: TASK.KILL <id>
TASK.KILL 41.
General Commands Reference Guide T 33 ©1989-2019 Lauterbach GmbH
TASK.List Information about tasks
The windows of the TASK.List command group provide information about processes, space IDs, MMU spaces, machines, and tasks known to the debugger in an RTOS and hypervisor environment. The debugger needs a so-called “awareness” of the RTOS or hypervisor to be able to read out these items from the target.
See also
■ TASK.List.MACHINES ■ TASK.List.SPACES ■ TASK.List.tasks ■ TASK.List.TREE ■ TASK
TASK.List.MACHINES List machines
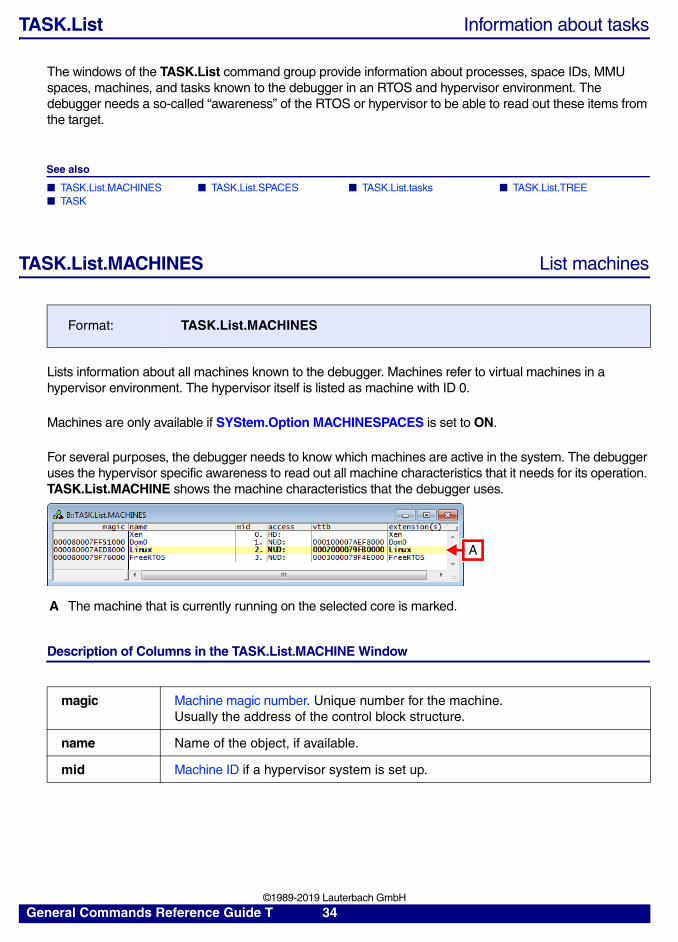
Lists information about all machines known to the debugger. Machines refer to virtual machines in a hypervisor environment. The hypervisor itself is listed as machine with ID 0.
Machines are only available if SYStem.Option MACHINESPACES is set to ON.
For several purposes, the debugger needs to know which machines are active in the system. The debugger uses the hypervisor specific awareness to read out all machine characteristics that it needs for its operation. TASK.List.MACHINE shows the machine characteristics that the debugger uses.
Description of Columns in the TASK.List.MACHINE Window
Format: TASK.List.MACHINES
A The machine that is currently running on the selected core is marked.
magic Machine magic number. Unique number for the machine.Usually the address of the control block structure.
name Name of the object, if available.
mid Machine ID if a hypervisor system is set up.
A
General Commands Reference Guide T 34 ©1989-2019 Lauterbach GmbH
See also
■ TASK.List ■ TASK.List.tasks
▲ ’Release Information’ in ’Release History’
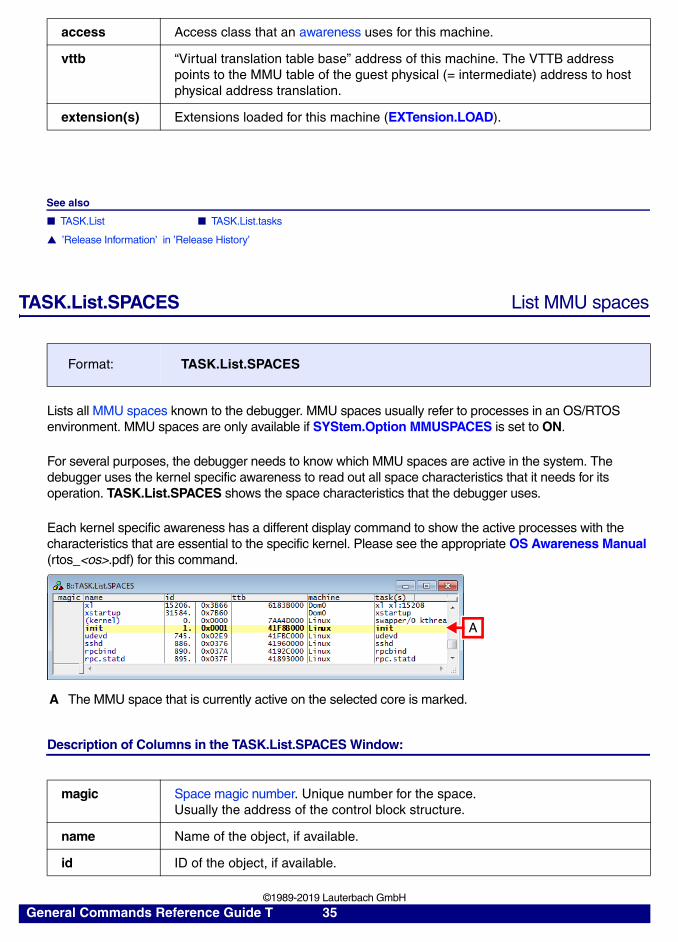
TASK.List.SPACES List MMU spaces
Lists all MMU spaces known to the debugger. MMU spaces usually refer to processes in an OS/RTOS environment. MMU spaces are only available if SYStem.Option MMUSPACES is set to ON.
For several purposes, the debugger needs to know which MMU spaces are active in the system. The debugger uses the kernel specific awareness to read out all space characteristics that it needs for its operation. TASK.List.SPACES shows the space characteristics that the debugger uses.
Each kernel specific awareness has a different display command to show the active processes with the characteristics that are essential to the specific kernel. Please see the appropriate OS Awareness Manual (rtos_<os>.pdf) for this command.
Description of Columns in the TASK.List.SPACES Window:
access Access class that an awareness uses for this machine.
vttb “Virtual translation table base” address of this machine. The VTTB address points to the MMU table of the guest physical (= intermediate) address to host physical address translation.
extension(s) Extensions loaded for this machine (EXTension.LOAD).
Format: TASK.List.SPACES
A The MMU space that is currently active on the selected core is marked.
magic Space magic number. Unique number for the space.Usually the address of the control block structure.
name Name of the object, if available.
id ID of the object, if available.
A
General Commands Reference Guide T 35 ©1989-2019 Lauterbach GmbH
See also
■ TASK.List ■ TASK.List.tasks
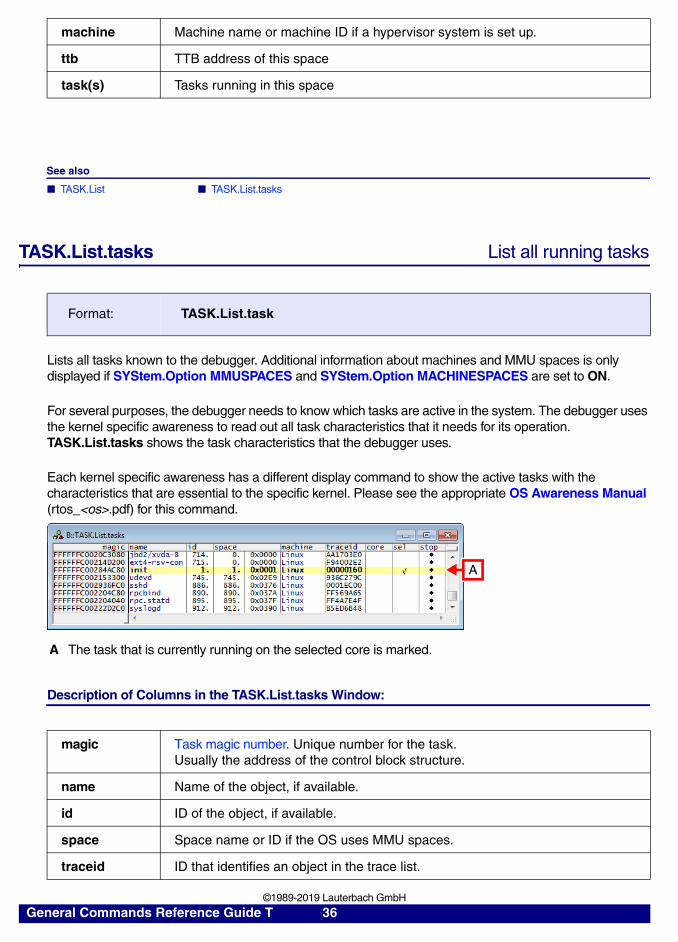
TASK.List.tasks List all running tasks
Lists all tasks known to the debugger. Additional information about machines and MMU spaces is only displayed if SYStem.Option MMUSPACES and SYStem.Option MACHINESPACES are set to ON.
For several purposes, the debugger needs to know which tasks are active in the system. The debugger uses the kernel specific awareness to read out all task characteristics that it needs for its operation. TASK.List.tasks shows the task characteristics that the debugger uses.
Each kernel specific awareness has a different display command to show the active tasks with the characteristics that are essential to the specific kernel. Please see the appropriate OS Awareness Manual (rtos_<os>.pdf) for this command.
Description of Columns in the TASK.List.tasks Window:
machine Machine name or machine ID if a hypervisor system is set up.
ttb TTB address of this space
task(s) Tasks running in this space
Format: TASK.List.task
A The task that is currently running on the selected core is marked.
magic Task magic number. Unique number for the task.Usually the address of the control block structure.
name Name of the object, if available.
id ID of the object, if available.
space Space name or ID if the OS uses MMU spaces.
traceid ID that identifies an object in the trace list.
A
General Commands Reference Guide T 36 ©1989-2019 Lauterbach GmbH
See also
■ TASK.List ■ TASK.List.MACHINES ■ TASK.List.SPACES ■ TASK.List.TREE ■ CORE.List
▲ ’Pdebug Front-end Specific Commands’ in ’TRACE32 pdebug Target Server for ARM’▲ ’Commands for Run Mode Debugging’ in ’Run Mode Debugging Manual Linux’▲ ’Commands for Run Mode Debugging’ in ’Run Mode Debugging Manual QNX’▲ ’Commands for Run Mode Debugging’ in ’Run Mode Debugging Manual Symbian’▲ ’Specific Commands’ in ’Native Process Debugger’
core Identifies in SMP systems at which core this task runs.
sel Task selected for debugging (only in Run Mode Debugging).
stop Task selected to stop on break (only in Run Mode Debugging).
machine Machine name or machine ID if a hypervisor system is set up.
General Commands Reference Guide T 37 ©1989-2019 Lauterbach GmbH
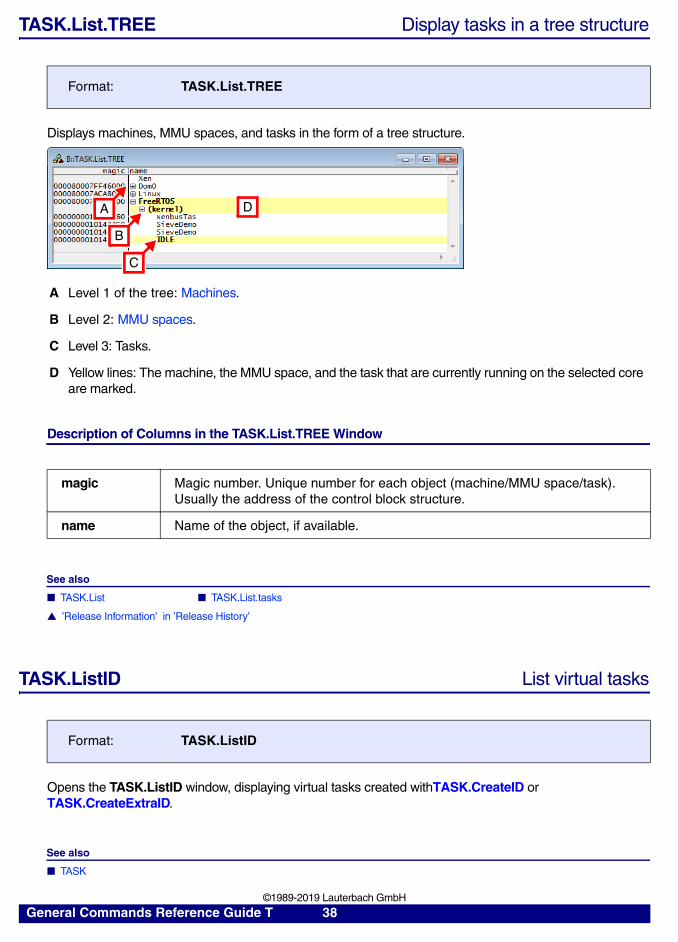
TASK.List.TREE Display tasks in a tree structure
Displays machines, MMU spaces, and tasks in the form of a tree structure.
Description of Columns in the TASK.List.TREE Window
See also
■ TASK.List ■ TASK.List.tasks
▲ ’Release Information’ in ’Release History’
TASK.ListID List virtual tasks
Opens the TASK.ListID window, displaying virtual tasks created withTASK.CreateID or TASK.CreateExtraID.
See also
■ TASK
Format: TASK.List.TREE
A Level 1 of the tree: Machines.
B Level 2: MMU spaces.
C Level 3: Tasks.
D Yellow lines: The machine, the MMU space, and the task that are currently running on the selected core are marked.
magic Magic number. Unique number for each object (machine/MMU space/task).Usually the address of the control block structure.
name Name of the object, if available.
Format: TASK.ListID
D
B
C
A
General Commands Reference Guide T 38 ©1989-2019 Lauterbach GmbH
TASK.MTXTRC Internal
This command is for internal use only and should not be used. TASK.MTXTRC shows a trace of the OS Awareness hyper processor activity.
See also
■ TASK
Format: TASK.MTXTRC (deprecated)
General Commands Reference Guide T 39 ©1989-2019 Lauterbach GmbH
TASK.NAME Translation of task magic number to task name
Several windows of the OS Awareness show task-related information, e.g. TASK.STacK or Trace.Chart.TASK. Internally, the OS Awareness always uses the task magic numbers to identify a task. When displaying the task-related information, the debugger can translate this task magic number into a more readable task name, using a task name translation table. If the debugger finds an entry with the appropriate task magic number, it shows the task name instead of the task magic number (or task ID).
The translation table can be populated manually or automatically. If the TASK configuration file supports it, the debugger automatically populates the table with the current available task magic numbers and their names. Additionally, or if no configuration file exists, or if the configuration doesn’t support task names, table entries may be added manually. If a manual entry and an automatic entry have the same task magic number, the manual entry overwrites the automatic one.
See also
■ TASK.NAME.DELete ■ TASK.NAME.RESet ■ TASK.NAME.Set ■ TASK.NAME.view ■ TASK
TASK.NAME.DELete Delete a task name table entry
Deletes the entry, specified by <task_magic>, from the task name translation table. If the entry is an automatic entry, the next usage of task names may add the automatic entry again.
See also
■ TASK.NAME ■ TASK.NAME.view
TASK.NAME.RESet Reset task name table
Erases the whole task name translation table. If the TASK configuration file supports task name evaluation, the next usage of task names will populate the table again with automatic entries.
See also
■ TASK.NAME ■ TASK.NAME.view
Format: TASK.NAME.DELete <task_magic>
Format: TASK.NAME.RESet
General Commands Reference Guide T 40 ©1989-2019 Lauterbach GmbH

TASK.NAME.Set Set a task name table entry
Adds a manual entry to the task name translation table.
Example:
See also
■ TASK.NAME ■ TASK.NAME.view
TASK.NAME.view Show task name translation table
Shows the contents of the task name translation table.
See also
■ TASK.NAME ■ TASK.NAME.DELete ■ TASK.NAME.RESet ■ TASK.NAME.Set
Format: TASK.NAME.Set <task_magic> <task_name>
<task_magic>, <task_name>
The string specified by <task_name> is assigned to the task specified by <task_magic>. If the table contains already an automatic entry for the specified task magic number, it will be overwritten by the new entry!
TASK.NAME.Set 0x58D68 "My_Task 1"
Format: TASK.NAME.view
A Flag “a”: The entry was set automatically by the TASK configuration file.
B Flag “m”: The entry was set manually by the TASK.NAME.Set command.
A
B
General Commands Reference Guide T 41 ©1989-2019 Lauterbach GmbH
ICE only
TASK.NoBreak Deprecated
It was used in 68k ICE only for task selective debugging. TASK.NoBreak marks a task of the selective list to be not breaked at the next entry.
See also
■ TASK
ICE only
TASK.NoDebug Deprecated
It was used in 68k ICE only for task selective debugging. TASK.Debug marks a task of the selective list as inactive for debugging.
See also
■ TASK
ICE only
TASK.NoStop Deprecated
It was used in 68k ICE only for task selective debugging. TASK.NoStop marks a task of the selective list to be stopped.
See also
■ TASK
Format: TASK.NoBreak <task> (deprecated)
Format: TASK.NoDebug <task> (deprecated)
Format: TASK.NoStop <task> (deprecated)
General Commands Reference Guide T 42 ©1989-2019 Lauterbach GmbH
ICE only
TASK.OFF Deprecated
It was used in 68k ICE only for task selective debugging. TASK.OFF switches off the task selective debugger.
See also
■ TASK
TASK.ON Deprecated
It was used in 68k ICE only for task selective debugging. TASK.ON switches on the task selective debugger.
See also
■ TASK
Format: TASK.OFF (deprecated)
Format: TASK.ON (deprecated)
General Commands Reference Guide T 43 ©1989-2019 Lauterbach GmbH
TASK.ORTI AUTOSAR/OSEK support
See also
■ TASK.ORTI.CPU ■ TASK.ORTI.load ■ TASK.ORTI.NOSTACK ■ TASK.ORTI.SPLITSTACK ■ TASK
▲ ’Release Information’ in ’Release History’
TASK.ORTI.CPU Set OSEK SMP CPU number
If TRACE32 is set up in AMP mode (one PowerView instance for each core), it assigns a CPU ID to each individual core, starting with zero. An AUTOSAR/OSEK operating system in SMP mode may assign a different CPU ID to the cores, depending how the OS uses the chip.
This command instructs the debugger to use the given CPU ID when extracting core dependent information from the ORTI file.
See also
■ TASK.ORTI
TASK.ORTI.load Configure OS Awareness for OSEK/ORTI
Configures the OS Awareness for AUTOSAR/OSEK operating systems using ORTI. For a detailed description, please refer to the chapter “OS Awareness Manual OSEK/ORTI” (rtos_orti.pdf).
See also
■ TASK.ORTI
Format: TASK.ORTI.CPU <cpu_id>
Format: TASK.ORTI.load <file>
General Commands Reference Guide T 44 ©1989-2019 Lauterbach GmbH
TASK.ORTI.NOSTACK Exclude an ORTI task from stack evaluation
When using the OS Awareness for ORTI (see TASK.ORTI.load), this command excludes a task from all stack evaluations, e.g. when performing a trace function analysis. Usually used for the idle routine if it isn’t running as a separate task.
See also
■ TASK.ORTI
Format: TASK.ORTI.NOSTACK <task_name>
General Commands Reference Guide T 45 ©1989-2019 Lauterbach GmbH
TASK.ORTI.SPLITSTACK Split stack analysis of idle ORTI task to cores
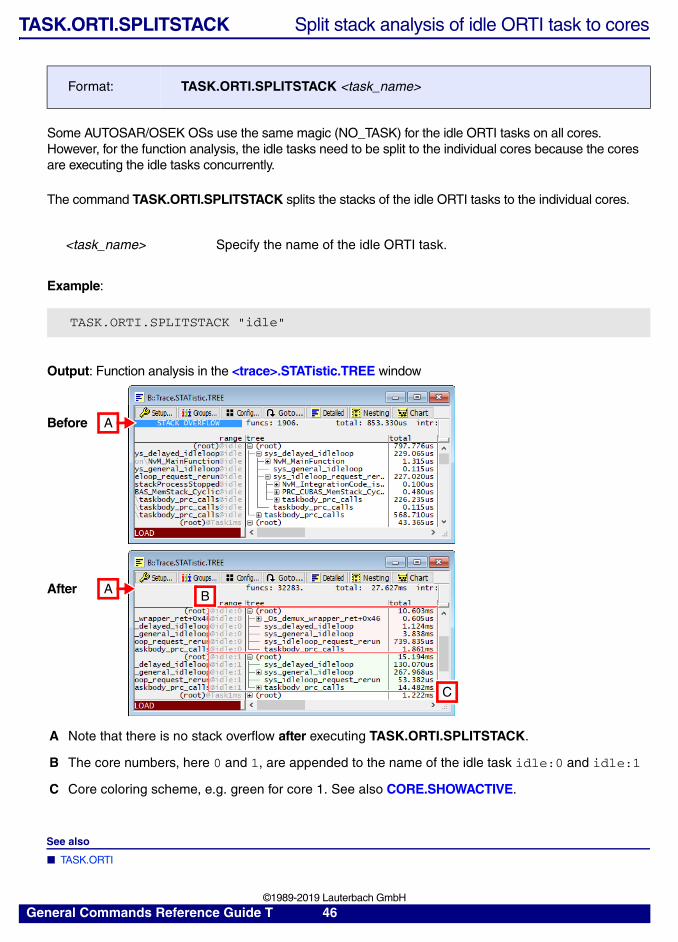
Some AUTOSAR/OSEK OSs use the same magic (NO_TASK) for the idle ORTI tasks on all cores. However, for the function analysis, the idle tasks need to be split to the individual cores because the cores are executing the idle tasks concurrently.
The command TASK.ORTI.SPLITSTACK splits the stacks of the idle ORTI tasks to the individual cores.
Example:
Output: Function analysis in the <trace>.STATistic.TREE window
See also
■ TASK.ORTI
Format: TASK.ORTI.SPLITSTACK <task_name>
<task_name> Specify the name of the idle ORTI task.
TASK.ORTI.SPLITSTACK "idle"
A Note that there is no stack overflow after executing TASK.ORTI.SPLITSTACK.
B The core numbers, here 0 and 1, are appended to the name of the idle task idle:0 and idle:1
C Core coloring scheme, e.g. green for core 1. See also CORE.SHOWACTIVE.
A
A
Before
After B
C
General Commands Reference Guide T 46 ©1989-2019 Lauterbach GmbH
TASK.RESet Reset OS Awareness
Resets the OS Awareness.
The configuration is cleared, all additional commands and features are removed.
See also
■ TASK
TASK.RUN Load task
Loads <process> and prepares it for debugging.
Only applicable if GDB (Linux) or TRK (Symbian) is used as debug agent.
Example:
See also
■ TASK
▲ ’Pdebug Front-end Specific Commands’ in ’TRACE32 pdebug Target Server for ARM’▲ ’Commands for Run Mode Debugging’ in ’Run Mode Debugging Manual Linux’▲ ’Commands for Run Mode Debugging’ in ’Run Mode Debugging Manual QNX’▲ ’Commands for Run Mode Debugging’ in ’Run Mode Debugging Manual Symbian’
Format: TASK.RESet
Format: TASK.RUN <process>
TASK.RUN /bin/hello
General Commands Reference Guide T 47 ©1989-2019 Lauterbach GmbH
TASK.select Display context of specified task
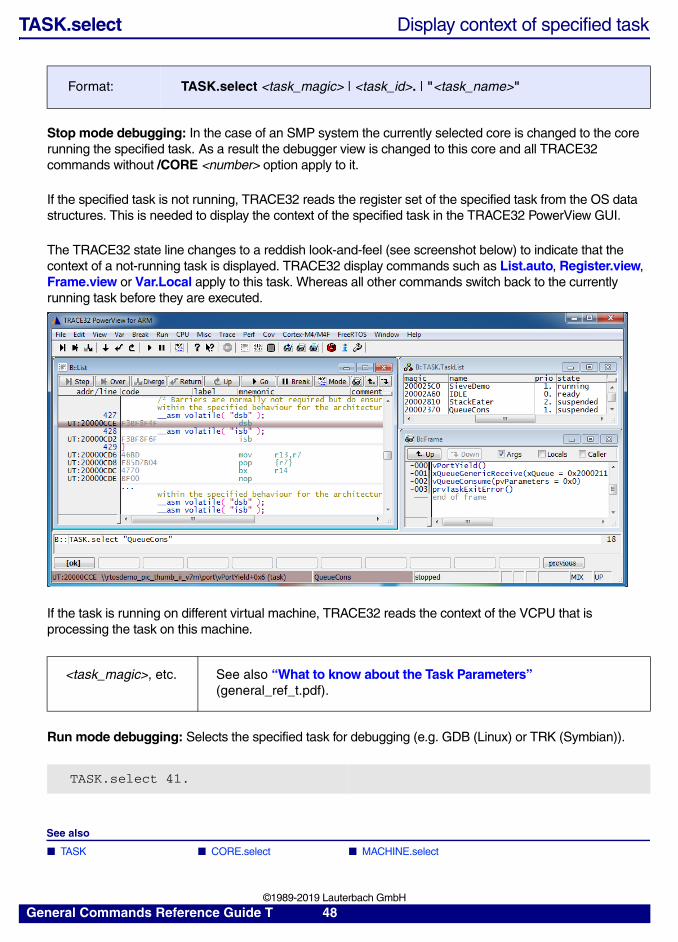
Stop mode debugging: In the case of an SMP system the currently selected core is changed to the core running the specified task. As a result the debugger view is changed to this core and all TRACE32 commands without /CORE <number> option apply to it.
If the specified task is not running, TRACE32 reads the register set of the specified task from the OS data structures. This is needed to display the context of the specified task in the TRACE32 PowerView GUI.
The TRACE32 state line changes to a reddish look-and-feel (see screenshot below) to indicate that the context of a not-running task is displayed. TRACE32 display commands such as List.auto, Register.view, Frame.view or Var.Local apply to this task. Whereas all other commands switch back to the currently running task before they are executed.
If the task is running on different virtual machine, TRACE32 reads the context of the VCPU that is processing the task on this machine.
Run mode debugging: Selects the specified task for debugging (e.g. GDB (Linux) or TRK (Symbian)).
See also
■ TASK ■ CORE.select ■ MACHINE.select
Format: TASK.select <task_magic> | <task_id>. | "<task_name>"
<task_magic>, etc. See also “What to know about the Task Parameters” (general_ref_t.pdf).
TASK.select 41.
General Commands Reference Guide T 48 ©1989-2019 Lauterbach GmbH
▲ ’Release Information’ in ’Release History’▲ ’Commands for Run Mode Debugging’ in ’Run Mode Debugging Manual Linux’
TASK.SETDIR Set the awareness directoryOS awarenesses: Linux only
The Linux awareness and menu call scripts from the awareness directory. This directory is set per default to ~~/demo/<arch>/kernel/linux/<linux_version>. When loading the awareness outside this directory, TRACE32 prints a warning. With this command you can change the awareness directory. Scripts will be called then from the new directory.
See also
■ TASK
Format: TASK.SETDIR <path>
General Commands Reference Guide T 49 ©1989-2019 Lauterbach GmbH
TASK.STacK Stack usage coverage
The TASK.STacK command group allows to watch the stack usage in single tasking and multi-tasking systems. In single tasking systems, or in non supported operating systems, the user has to specify the stack area manually. The task magic number can be any number to identify a stack area.
In configured RTOS operation, the magic number must be the respective task magic number.
The debugger tries to get the current stack pointer. If the OS Awareness is configured, and the configuration file supports stack coverage, the current stack pointer is read out of the task control block of the application. When the application is stopped, the stack pointer is read from register and displayed at the current running task. Without any RTOS configuration the stack pointer will be displayed at the stack that fits to the pointer (pointer inside the stack). If no stack fits, or if the running task could not be found, the stack pointer of the register is displayed in an extra line. (See also TASK.STacK.view)
There are two methods to evaluate the maximum stack space. If flag memory is available (see MAP.Flag), the flag system can be used. Be sure that flag memory is mapped to the stack areas. The emulator searches from stack top to stack bottom for the first write flag. The found address is then used as maximum stack address. If no flag system is available, you can use a pattern search, if the stack is initialized with a known pattern. In this case, the debugger searches from stack top to stack bottom for the first byte, that is not equal to the specified pattern. (See also TASK.STacK.PATtern)
For more information on stack coverage in operating systems, refer to the OS Awareness Manuals.
See also
■ TASK.STacK.ADD ■ TASK.STacK.DIRection ■ TASK.STacK.Init ■ TASK.STacK.PATtern ■ TASK.STacK.PATternGAP ■ TASK.STacK.ReMove ■ TASK.STacK.RESet ■ TASK.STacK.view ■ TASK
▲ ’Features’ in ’Hypervisor Awareness Manual Wind River Hypervisor’▲ ’Features’ in ’OS Awareness Manual AMX’▲ ’Features’ in ’OS Awareness Manual ARTK’▲ ’Features’ in ’OS Awareness Manual Atomthreads’▲ ’Features’ in ’OS Awareness Manual DSP/BIOS’▲ ’Features’ in ’OS Awareness Manual ChibiOS/RT’▲ ’Features’ in ’OS Awareness Manual Chorus Classic’▲ ’Features’ in ’OS Awareness Manual CMX’▲ ’Features’ in ’OS Awareness Manual CMX-TINY+’▲ ’Features’ in ’OS Awareness Manual eCos’▲ ’Features’ in ’OS Awareness Manual embOS’▲ ’Features’ in ’OS Awareness Manual FAMOS’▲ ’Features’ in ’OS Awareness Manual FreeRTOS’▲ ’Features’ in ’OS Awareness Manual HI7000’▲ ’Features’ in ’OS Awareness Manual Linux’▲ ’Features’ in ’OS Awareness Manual LiteOS’▲ ’Features’ in ’OS Awareness Manual LynxOS’▲ ’Features’ in ’OS Awareness Manual MQX’▲ ’Features’ in ’OS Awareness Manual MTOS-UX’▲ ’Features’ in ’OS Awareness Manual NetBSD’▲ ’Features’ in ’OS Awareness Manual NORTi’▲ ’Features’ in ’OS Awareness Manual Nucleus PLUS’▲ ’Features’ in ’OS Awareness Manual NuttX’▲ ’Features’ in ’OS Awareness Manual OKL4’▲ ’Debug Features’ in ’OS Awareness Manual OSEK/ORTI’▲ ’Features’ in ’OS Awareness Manual OS21’▲ ’Features’ in ’OS Awareness Manual OSEck’▲ ’Features’ in ’OS Awareness Manual OSE Delta’
General Commands Reference Guide T 50 ©1989-2019 Lauterbach GmbH
▲ ’Features’ in ’OS Awareness Manual OSE Epsilon’▲ ’Features’ in ’OS Awareness Manual PikeOS’▲ ’Features’ in ’OS Awareness Manual PrKERNEL’▲ ’Debug Features’ in ’OS Awareness Manual PXROS’▲ ’Features’ in ’OS Awareness Manual QNX’▲ ’Features’ in ’OS Awareness Manual RTXC Quadros’▲ ’Features’ in ’OS Awareness Manual QXK’▲ ’Features’ in ’OS Awareness Manual REALOS’▲ ’Features’ in ’OS Awareness Manual RIOT’▲ ’Features’ in ’OS Awareness Manual RTOS/7700’▲ ’Features’ in ’OS Awareness Manual RTEMS’▲ ’Features’ in ’OS Awareness Manual RTX-ARM’▲ ’Features’ in ’OS Awareness Manual ARTX-166’▲ ’Features’ in ’OS Awareness Manual Sciopta’▲ ’Features’ in ’OS Awareness Manual SMX’▲ ’Features’ in ’OS Awareness Manual SYS/BIOS’▲ ’Features’ in ’OS Awareness Manual ThreadX’▲ ’Features’ in ’OS Awareness Manual MicroC3/Compact’▲ ’Features’ in ’OS Awareness Manual MicroC3/Standard’▲ ’Features’ in ’OS Awareness Manual uClinux’▲ ’Features’ in ’OS Awareness Manual MicroC/OS-III’▲ ’Features’ in ’OS Awareness Manual MicroC/OS-II’▲ ’Features’ in ’OS Awareness Manual VDK’▲ ’Features’ in ’OS Awareness Manual VxWorks’▲ ’Features’ in ’OS Awareness Manual Windows Standard’▲ ’Features’ in ’OS Awareness Manual Windows CE6/EC7/EC20’▲ ’Features’ in ’OS Awareness Manual Windows CE4/CE5’▲ ’Features’ in ’OS Awareness Manual XOS’▲ ’Features’ in ’OS Awareness Manual Zephyr’
TASK.STacK.ADD Add stack space coverage
With the 1st argument: Adds a stack area to the TASK.STacK.view window.
Without the 1st argument: Opens the TASK.STacK.ADD window. Double-click the entry of a stack area you want to add to the TASK.STacK.view window.
When no OS Awareness is loaded:
Format: TASK.STacK.ADD [<task_magic> [<stackrange>]] [/<option>]
<option>: MACHINE <machine_magic> | <machine_id> | <machine_name>
<task_magic>, <stackrange>
The task magic number is any number used to identify a stack area. In this case the stack range must be specified as a second parameter.
See also “What to know about the Task Parameters” (general_ref_t.pdf).
General Commands Reference Guide T 51 ©1989-2019 Lauterbach GmbH
When an OS Awareness is loaded:
In hypervisor-based environments:
Examples
Example 1: When no OS Awareness is loaded
Example 2: When an OS Awareness is loaded
Example 3: In a hypervisor-based environment
See also
■ TASK.STacK ■ TASK.STacK.view
<task_magic> The magic number must be the task magic number. See also “What to know about the Task Parameters” (general_ref_t.pdf).
<stackrange> If the extension definition file supplies automatic stack range detection (only possible in some OS’s), then the stack range parameter can be omitted. Otherwise specify the stack area manually. If available, you can omit the magic and select a task from a task list.
MACHINE Lets you add only stack areas that belong to the selected machine. See also “What to know about the Machine Parameters” (general_ref_t.pdf).
TASK.STacK.ADD 2 0x1000--0x1fff
TASK.STacK.ADD 0x101433C0
TASK.STack.ADD 0x101433C0 /MACHINE 3
General Commands Reference Guide T 52 ©1989-2019 Lauterbach GmbH
TASK.STacK.DIRection Define stack growth direction
Defines whether the stack grows downwards or upwards.
See also
■ TASK.STacK ■ TASK.STacK.view
TASK.STacK.Init Initialize unused stack space
If flag system is used on ICE or FIRE: Resets the write flags on the stack areas. The evaluation for maximum stack space will then start from scratch. If a magic is specified, the write flags of the according stack space will be deleted, otherwise the write flags of all displayed stacks are reset.
If pattern check is used:Overwrites the currently unused stack space with the pattern defined by TASK.STacK.PATtern. The memory starting from the stack pointer onto the stack boundary address (equals to the low address, if the stack grows downwards) will be initialized with the pattern.
See also
■ TASK.STacK ■ TASK.STacK.view
Format: TASK.STacK.DIRection [UP | DOWN]
DOWN The stack starts with the high address and grows to a lower address.
UP The stack starts with the low address and grows to a higher address.
Format: TASK.STacK.Init [<task_magic>]
CAUTION: If the stack is used in an unusual way, e.g. some stack space is used even if the stack pointer does not point behind the used area, relevant target data may be overwritten, and your application may crash.
General Commands Reference Guide T 53 ©1989-2019 Lauterbach GmbH
TASK.STacK.PATtern Define stack check pattern
Defines, whether to use flag system or pattern check for stack coverage calculation.
See also
■ TASK.STacK ■ TASK.STacK.view
Format: TASK.STacK.PATtern [ON | OFF | [%<format>] <pattern>]
OFF Pattern check is switched off. Stack coverage calculation is done with the flag system (write flags). This option is only available, if a flag system is available.Only available on ICE or FIRE systems with flag memory.On ICD, the stack coverage calculation always uses pattern check.
ON Pattern check is switched on. Stack coverage calculation is done by comparing the stack data with the predefined pattern (see below). The default pattern is zero.Only available on ICE or FIRE systems with flag memory.On ICD, the stack coverage calculation always uses pattern check.
<pattern> Pattern check is switched on. Stack coverage calculation is done by comparing the stack data with defined pattern. The pattern must be the value, which represents unused stack space. This will only work, if the stack space is initialized with this value. Use TASK.STacK.Init to re-initialize currently unused stack space with the pattern.
<pattern> can also be a string enclosed in quotes.
<format> Use a <format> to define formats other than bytes e.g. %Long.
General Commands Reference Guide T 54 ©1989-2019 Lauterbach GmbH
TASK.STacK.PATternGAP Define check pattern gap
If the stack check pattern defined with TASK.STacK.PATtern is not contiguous, this command defines the gap between two consecutive patterns.
Example: If the stack is pre-filled with a 4-byte pattern 0xdeadbeef on each 64byte boundary, specify:
See also
■ TASK.STacK ■ TASK.STacK.view
TASK.STacK.ReMove Remove stack space coverage
With the 1st argument: Removes a stack area from the TASK.STacK.view window.
Without the 1st argument: Opens the TASK.STacK ReMove window. Double-click the entry of a stack area you want to remove from the TASK.STacK.view window.
Format: TASK.STacK.PATternGAP [<value>]
<value> Number of bytes between two consecutive stack check patterns.
TASK.STacK.PATtern %Long 0xDEADBEEFTASK.STacK.PATternGAP 0x40-4
Format: TASK.STacK.ReMove [<task_magic>] [/<option>]
<option>: MACHINE <machine_magic> | <machine_id> | <machine_name>
<task_magic> Specify the task magic number of the task whose stack area you want to remove.See also “What to know about the Task Parameters” (general_ref_t.pdf).
MACHINE Lets you removes only stack areas that belong to the selected machine.
See also “What to know about the Machine Parameters” (general_ref_t.pdf).
General Commands Reference Guide T 55 ©1989-2019 Lauterbach GmbH
Example:
See also
■ TASK.STacK ■ TASK.STacK.view
TASK.STacK.RESet Reset stack coverage
Resets the stack coverage system and all manually defined stack areas.
If flag system is used on ICE or FIRE: Resets the write flags on the stack areas. The evaluation for maximum stack space will then start from scratch. If a magic is specified, the write flags of the according stack space will be deleted, otherwise the write flags of all displayed stacks are reset.
If pattern check is used:Resets the defined pattern to zero.
See also
■ TASK.STacK ■ TASK.STacK.view
TASK.STacK.ReMove 0x10147420
Format: TASK.STacK.RESet [<task_magic>]
General Commands Reference Guide T 56 ©1989-2019 Lauterbach GmbH
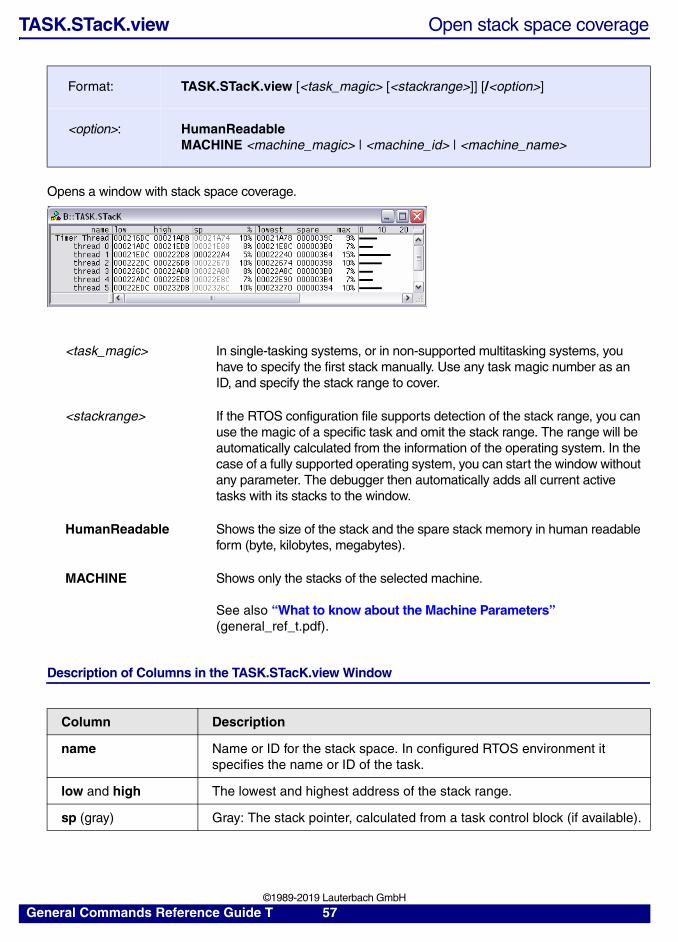
TASK.STacK.view Open stack space coverage
Opens a window with stack space coverage.
Description of Columns in the TASK.STacK.view Window
Format: TASK.STacK.view [<task_magic> [<stackrange>]] [/<option>]
<option>: HumanReadableMACHINE <machine_magic> | <machine_id> | <machine_name>
<task_magic> In single-tasking systems, or in non-supported multitasking systems, you have to specify the first stack manually. Use any task magic number as an ID, and specify the stack range to cover.
<stackrange> If the RTOS configuration file supports detection of the stack range, you can use the magic of a specific task and omit the stack range. The range will be automatically calculated from the information of the operating system. In the case of a fully supported operating system, you can start the window without any parameter. The debugger then automatically adds all current active tasks with its stacks to the window.
HumanReadable Shows the size of the stack and the spare stack memory in human readable form (byte, kilobytes, megabytes).
MACHINE Shows only the stacks of the selected machine.
See also “What to know about the Machine Parameters” (general_ref_t.pdf).
Column Description
name Name or ID for the stack space. In configured RTOS environment it specifies the name or ID of the task.
low and high The lowest and highest address of the stack range.
sp (gray) Gray: The stack pointer, calculated from a task control block (if available).
General Commands Reference Guide T 57 ©1989-2019 Lauterbach GmbH
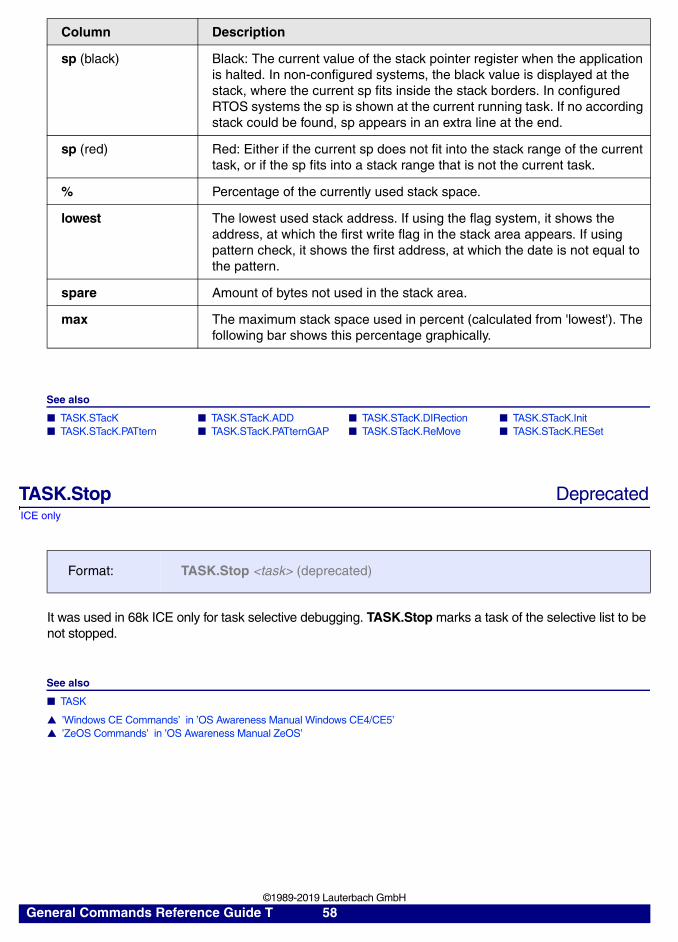
See also
■ TASK.STacK ■ TASK.STacK.ADD ■ TASK.STacK.DIRection ■ TASK.STacK.Init ■ TASK.STacK.PATtern ■ TASK.STacK.PATternGAP ■ TASK.STacK.ReMove ■ TASK.STacK.RESet
ICE only
TASK.Stop Deprecated
It was used in 68k ICE only for task selective debugging. TASK.Stop marks a task of the selective list to be not stopped.
See also
■ TASK
▲ ’Windows CE Commands’ in ’OS Awareness Manual Windows CE4/CE5’▲ ’ZeOS Commands’ in ’OS Awareness Manual ZeOS’
sp (black) Black: The current value of the stack pointer register when the application is halted. In non-configured systems, the black value is displayed at the stack, where the current sp fits inside the stack borders. In configured RTOS systems the sp is shown at the current running task. If no according stack could be found, sp appears in an extra line at the end.
sp (red) Red: Either if the current sp does not fit into the stack range of the current task, or if the sp fits into a stack range that is not the current task.
% Percentage of the currently used stack space.
lowest The lowest used stack address. If using the flag system, it shows the address, at which the first write flag in the stack area appears. If using pattern check, it shows the first address, at which the date is not equal to the pattern.
spare Amount of bytes not used in the stack area.
max The maximum stack space used in percent (calculated from 'lowest'). The following bar shows this percentage graphically.
Format: TASK.Stop <task> (deprecated)
Column Description
General Commands Reference Guide T 58 ©1989-2019 Lauterbach GmbH
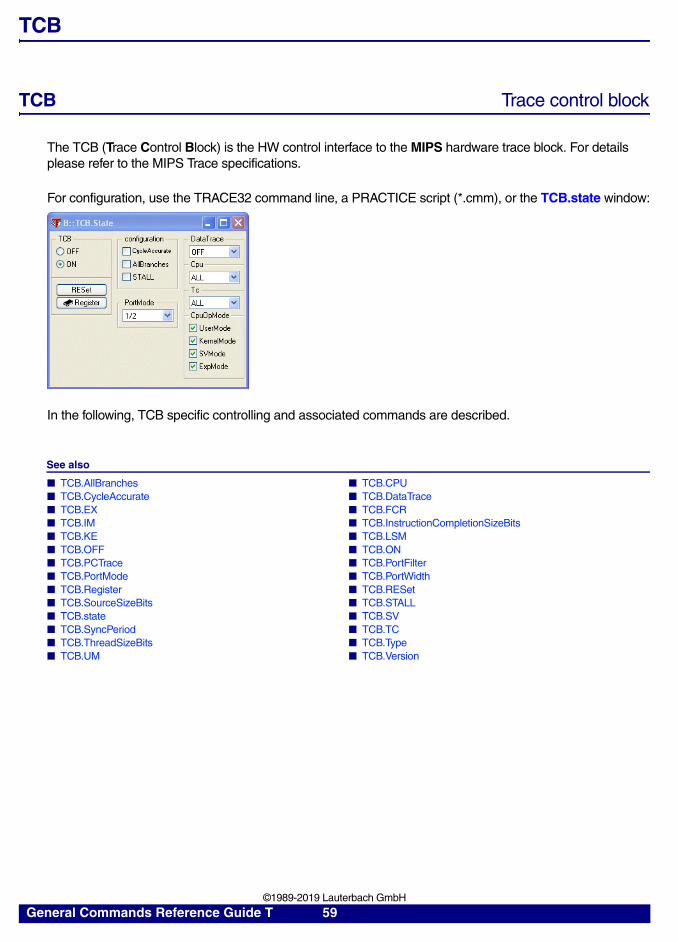
TCB
TCB Trace control block
The TCB (Trace Control Block) is the HW control interface to the MIPS hardware trace block. For details please refer to the MIPS Trace specifications.
For configuration, use the TRACE32 command line, a PRACTICE script (*.cmm), or the TCB.state window:
In the following, TCB specific controlling and associated commands are described.
See also
■ TCB.AllBranches ■ TCB.CPU ■ TCB.CycleAccurate ■ TCB.DataTrace ■ TCB.EX ■ TCB.FCR ■ TCB.IM ■ TCB.InstructionCompletionSizeBits ■ TCB.KE ■ TCB.LSM ■ TCB.OFF ■ TCB.ON ■ TCB.PCTrace ■ TCB.PortFilter ■ TCB.PortMode ■ TCB.PortWidth ■ TCB.Register ■ TCB.RESet ■ TCB.SourceSizeBits ■ TCB.STALL ■ TCB.state ■ TCB.SV ■ TCB.SyncPeriod ■ TCB.TC ■ TCB.ThreadSizeBits ■ TCB.Type ■ TCB.UM ■ TCB.Version
General Commands Reference Guide T 59 ©1989-2019 Lauterbach GmbH
TCB.AllBranches Broadcast all branches
See also
■ TCB ■ TCB.state
TCB.CPU Broadcast information for specified CPU only
The TCB broadcasts only information for the specified CPU.
See also
■ TCB ■ TCB.state
Format: TCB.AllBranches [ON | OFF]
OFF(default)
The TCB broadcasts only the address information when the processor branches to a location that cannot be directly inferred from the source code.
ON The TCB broadcasts the address information for all branches or jumps.
Format: TCB.CPU ALL | <cpu_x>
<cpu_x>: CPU0 | CPU1
ALL(default)
The TCB broadcasts information for executed instructions of all active CPU’s.
<cpu_x> The TCB broadcasts only information for executed instructions of <cpu_x>.
General Commands Reference Guide T 60 ©1989-2019 Lauterbach GmbH
TCB.CycleAccurate Cycle accurate tracing
Cycle accurate tracing can be used to observe the exact number of cycles that a particular code sequence takes to execute. If cycle accurate tracing is used, trace information is generated for each clock cycle. In this case the <core_clock> can be used to calculate the timestamps for the trace information.
Example:
See also
■ TCB ■ TCB.state
Format: TCB.CycleAccurate [ON | OFF]
ON The TCB broadcasts the information which instructions were executed, but additionally stall information. No timestamps are generated by TRACE32.
OFF(default)
The TCB broadcasts only the information which instructions were executed. Timestamps are generated by TRACE32.
TCB.CycleAccurate ON
Trace.CLOCK 500.MHz ; specify the <core_clock> as ; base for the trace timestamps
Trace.List ; display the trace information
General Commands Reference Guide T 61 ©1989-2019 Lauterbach GmbH
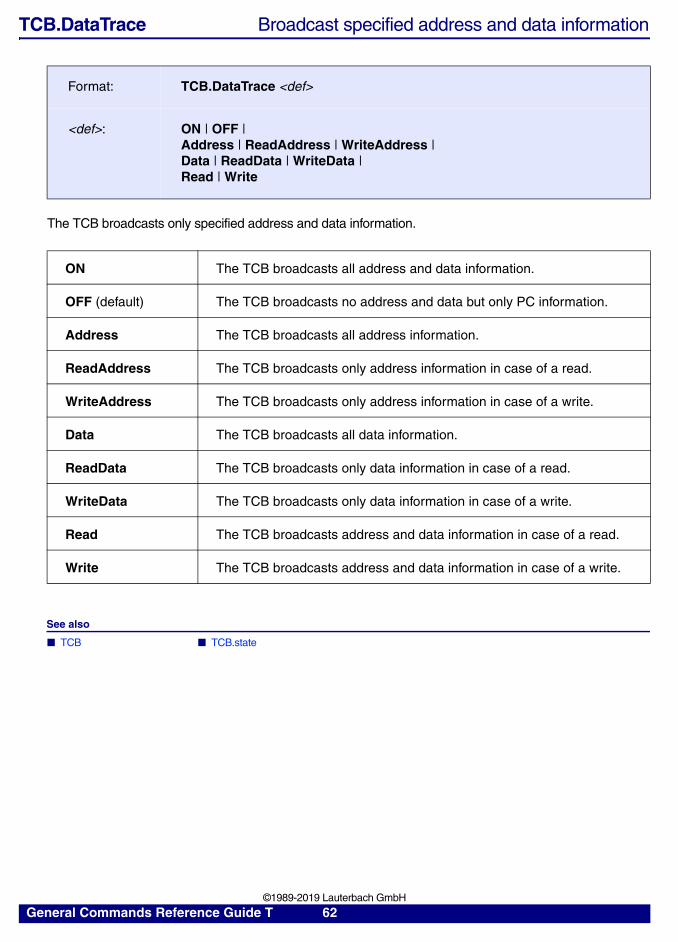
TCB.DataTrace Broadcast specified address and data information
The TCB broadcasts only specified address and data information.
See also
■ TCB ■ TCB.state
Format: TCB.DataTrace <def>
<def>: ON | OFF | Address | ReadAddress | WriteAddress | Data | ReadData | WriteData | Read | Write
ON The TCB broadcasts all address and data information.
OFF (default) The TCB broadcasts no address and data but only PC information.
Address The TCB broadcasts all address information.
ReadAddress The TCB broadcasts only address information in case of a read.
WriteAddress The TCB broadcasts only address information in case of a write.
Data The TCB broadcasts all data information.
ReadData The TCB broadcasts only data information in case of a read.
WriteData The TCB broadcasts only data information in case of a write.
Read The TCB broadcasts address and data information in case of a read.
Write The TCB broadcasts address and data information in case of a write.
General Commands Reference Guide T 62 ©1989-2019 Lauterbach GmbH
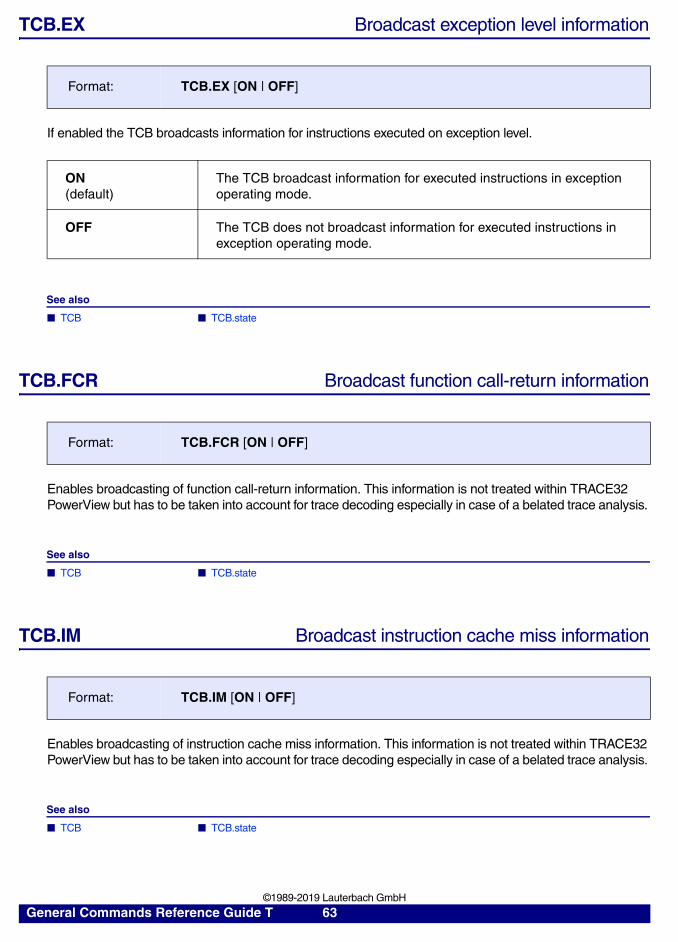
TCB.EX Broadcast exception level information
If enabled the TCB broadcasts information for instructions executed on exception level.
See also
■ TCB ■ TCB.state
TCB.FCR Broadcast function call-return information
Enables broadcasting of function call-return information. This information is not treated within TRACE32 PowerView but has to be taken into account for trace decoding especially in case of a belated trace analysis.
See also
■ TCB ■ TCB.state
TCB.IM Broadcast instruction cache miss information
Enables broadcasting of instruction cache miss information. This information is not treated within TRACE32 PowerView but has to be taken into account for trace decoding especially in case of a belated trace analysis.
See also
■ TCB ■ TCB.state
Format: TCB.EX [ON | OFF]
ON(default)
The TCB broadcast information for executed instructions in exception operating mode.
OFF The TCB does not broadcast information for executed instructions in exception operating mode.
Format: TCB.FCR [ON | OFF]
Format: TCB.IM [ON | OFF]
General Commands Reference Guide T 63 ©1989-2019 Lauterbach GmbH
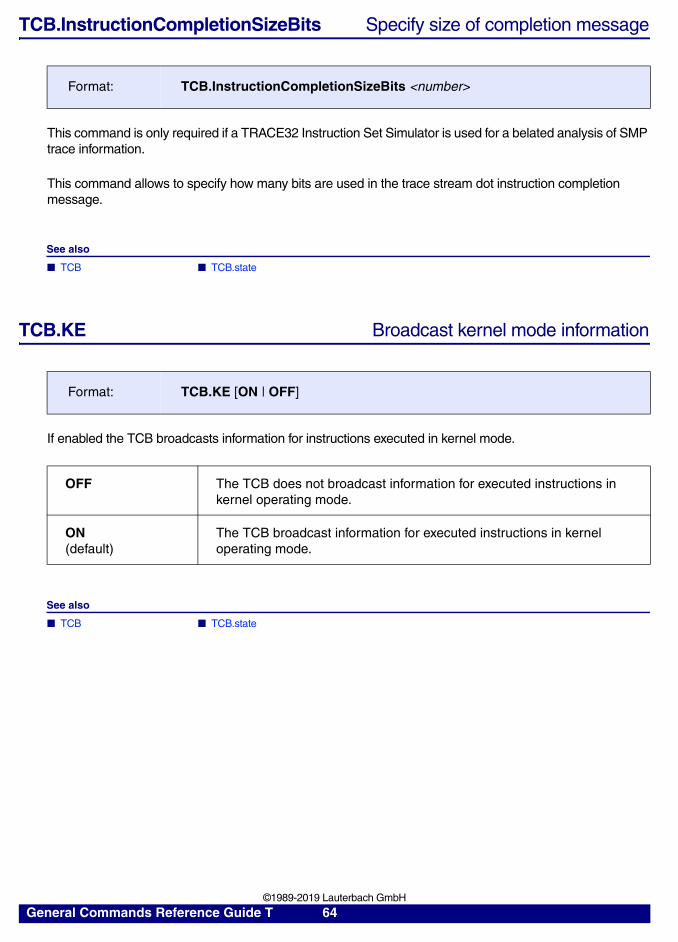
TCB.InstructionCompletionSizeBits Specify size of completion message
This command is only required if a TRACE32 Instruction Set Simulator is used for a belated analysis of SMP trace information.
This command allows to specify how many bits are used in the trace stream dot instruction completion message.
See also
■ TCB ■ TCB.state
TCB.KE Broadcast kernel mode information
If enabled the TCB broadcasts information for instructions executed in kernel mode.
See also
■ TCB ■ TCB.state
Format: TCB.InstructionCompletionSizeBits <number>
Format: TCB.KE [ON | OFF]
OFF The TCB does not broadcast information for executed instructions in kernel operating mode.
ON (default)
The TCB broadcast information for executed instructions in kernel operating mode.
General Commands Reference Guide T 64 ©1989-2019 Lauterbach GmbH
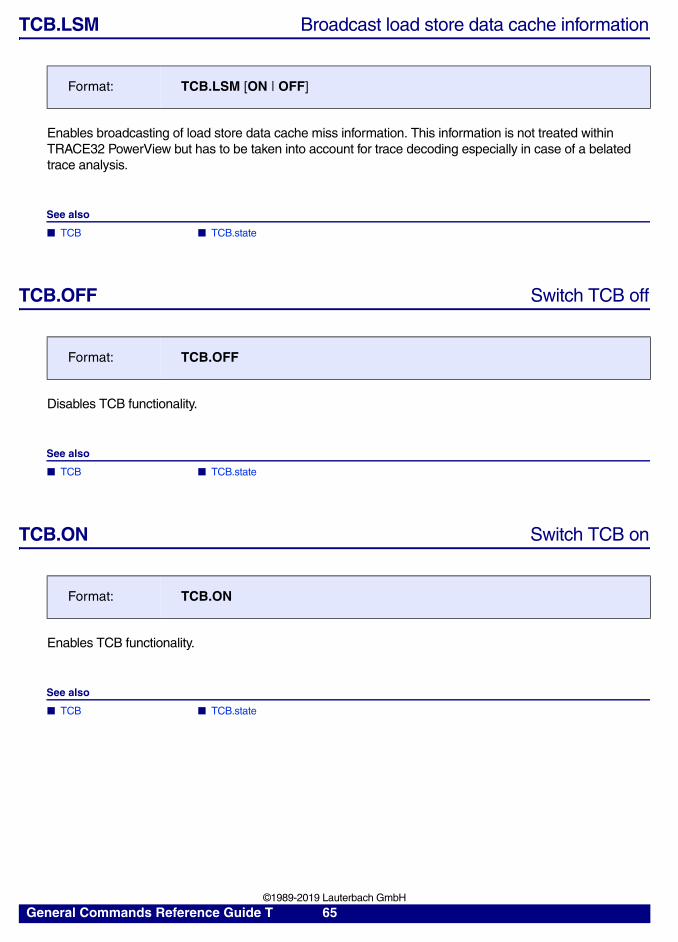
TCB.LSM Broadcast load store data cache information
Enables broadcasting of load store data cache miss information. This information is not treated within TRACE32 PowerView but has to be taken into account for trace decoding especially in case of a belated trace analysis.
See also
■ TCB ■ TCB.state
TCB.OFF Switch TCB off
Disables TCB functionality.
See also
■ TCB ■ TCB.state
TCB.ON Switch TCB on
Enables TCB functionality.
See also
■ TCB ■ TCB.state
Format: TCB.LSM [ON | OFF]
Format: TCB.OFF
Format: TCB.ON
General Commands Reference Guide T 65 ©1989-2019 Lauterbach GmbH
TCB.PCTrace Broadcast program counter trace
If enabled, the TCB broadcasts program counter trace information.
See also
■ TCB ■ TCB.state
TCB.PortFilter Disable port filter
Disable filtering of trace data within AutoFocus II Preprocessor. This command should only be used for diagnostic purpose!
See also
■ TCB ■ TCB.state
Format: TCB.PCTrace [ON | OFF]
OFF The TCB does not broadcast program counter trace information.
ON (default) The TCB broadcast program counter trace information.
Format: TCB.PortFilter [ON | OFF]
General Commands Reference Guide T 66 ©1989-2019 Lauterbach GmbH
TCB.PortMode Specify trace clock ratio
Specifies the ratio between trace- and CPU clock in case of off-chip trace.
Example:
See also
■ TCB ■ TCB.state
TCB.PortWidth Specify trace port width
Specify the trace port width in number of bits. This value is determined automatically by selecting trace method or reading trace configuration register from target. Therefore this command should only be used for diagnosis purpose or if necessary belated trace analysis.
See also
■ TCB ■ TCB.state
Format: TCB.PortMode <trace_clock>/<cpu_clock>
<trace_clock>/<cpu_clock>:
8/1 | 4/1 | 2/1 | 1/1 | 1/2 | 1/4 | 1/6 | 1/8
TCB.PortMode 1/2 ; <trace_clock> is one half of <core_clock>.
Format: TCB.PortWidth <width>
<width>: 4 | 8 | 16 | 64
General Commands Reference Guide T 67 ©1989-2019 Lauterbach GmbH
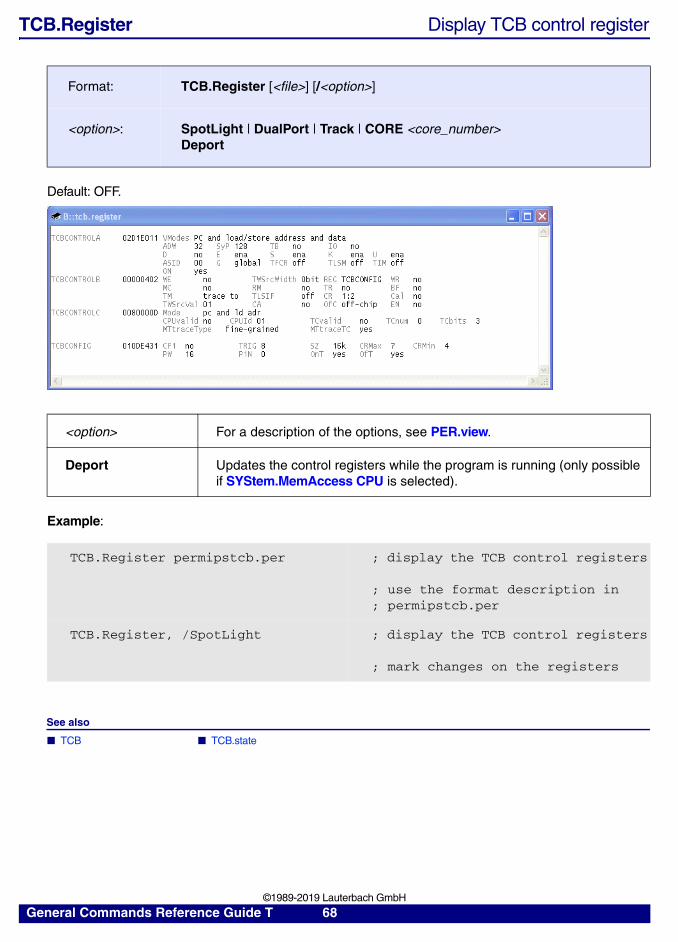
TCB.Register Display TCB control register
Default: OFF.
Example:
See also
■ TCB ■ TCB.state
Format: TCB.Register [<file>] [/<option>]
<option>: SpotLight | DualPort | Track | CORE <core_number>Deport
<option> For a description of the options, see PER.view.
Deport Updates the control registers while the program is running (only possible if SYStem.MemAccess CPU is selected).
TCB.Register permipstcb.per ; display the TCB control registers
; use the format description in; permipstcb.per
TCB.Register, /SpotLight ; display the TCB control registers
; mark changes on the registers
General Commands Reference Guide T 68 ©1989-2019 Lauterbach GmbH
TCB.RESet Reset TCB setup to default
Resets the TCB settings to default.
See also
■ TCB ■ TCB.state
TCB.SourceSizeBits Specify number of bit for core information in trace
This command is only required if a TRACE32 Instruction Set Simulator is used for a belated analysis of SMP trace information.
This command allows to specify how many bits are used in the trace stream to identify the source core.
See also
■ TCB ■ TCB.state
TCB.STALL Stall CPU for complete trace
If enabled, TCB broadcasts slow but complete trace information.
See also
■ TCB ■ TCB.state
Format: TCB.RESet
Format: TCB.SourceSizeBits <number>
Format: TCB.STALL [ON | OFF]
OFF The TCB broadcasts trace information in real-time with the risk of broken trace flow.
ON (default)
The TCB stall CPU if necessary and broadcast always complete information.
General Commands Reference Guide T 69 ©1989-2019 Lauterbach GmbH
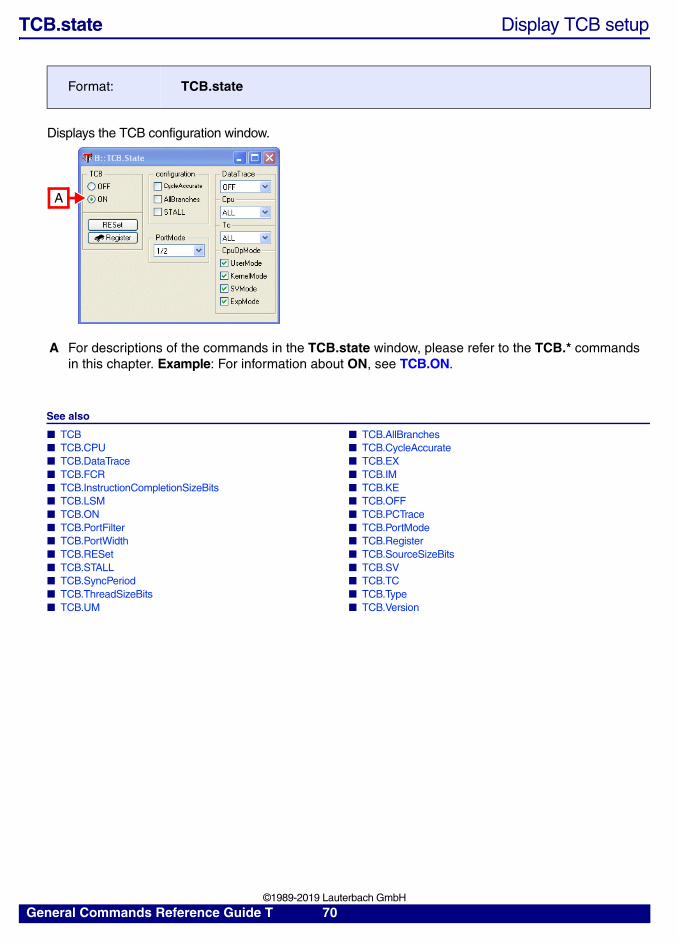
TCB.state Display TCB setup
Displays the TCB configuration window.
See also
■ TCB ■ TCB.AllBranches ■ TCB.CPU ■ TCB.CycleAccurate ■ TCB.DataTrace ■ TCB.EX ■ TCB.FCR ■ TCB.IM ■ TCB.InstructionCompletionSizeBits ■ TCB.KE ■ TCB.LSM ■ TCB.OFF ■ TCB.ON ■ TCB.PCTrace ■ TCB.PortFilter ■ TCB.PortMode ■ TCB.PortWidth ■ TCB.Register ■ TCB.RESet ■ TCB.SourceSizeBits ■ TCB.STALL ■ TCB.SV ■ TCB.SyncPeriod ■ TCB.TC ■ TCB.ThreadSizeBits ■ TCB.Type ■ TCB.UM ■ TCB.Version
Format: TCB.state
A For descriptions of the commands in the TCB.state window, please refer to the TCB.* commands in this chapter. Example: For information about ON, see TCB.ON.
A
General Commands Reference Guide T 70 ©1989-2019 Lauterbach GmbH
TCB.SV Broadcast supervisor mode information
If enabled the TCB broadcasts information for instructions executed in supervisor mode.
See also
■ TCB ■ TCB.state
TCB.SyncPeriod Specify TCB sync period
Specify the period in cycles the TCB broadcasts a synchronization message.
See also
■ TCB ■ TCB.state
Format: TCB.SV [ON | OFF]
ON (default)
The TCB broadcast information for executed instructions in supervisor operating mode.
OFF The TCB does not broadcast information for executed instructions in supervisor operating mode.
Format: TCB.SyncPeriod <period>
<period>: 0 | 1 | 2 | 3 | 4 | 5 | 6 | 7
<period> The TCB sync period in 2 ^ (<period> + 5) cycles.
General Commands Reference Guide T 71 ©1989-2019 Lauterbach GmbH
TCB.TC Broadcast information for specified HW thread
The TCB broadcasts only information for the specified HW thread.
See also
■ TCB ■ TCB.state
TCB.ThreadSizeBits Specify number of bit for thread information in trace
This command is only required if a TRACE32 Instruction Set Simulator is used for a belated analysis of SMP trace information.
This command allows to specify how many bits are used in the trace stream to identify the source thread context.
See also
■ TCB ■ TCB.state
Format: TCB.TC ALL | <tc_x>
<tc_x>: TC0 | TC1 | TC2 | TC3 | TC4 | TC5 | TC6 | TC7 | TC8
ALL (default)
The TCB broadcasts information for executed instructions of all active TCs.
<tc_x> The TCB broadcasts only information for executed instructions of <tc_x>.
Format: TCB.ThreadSizeBits <number>
General Commands Reference Guide T 72 ©1989-2019 Lauterbach GmbH
TCB.Type Specify TCB type
This command is only required if a TRACE32 Instruction Set Simulator is used for a belated analysis of SMP trace information.
See also
■ TCB ■ TCB.state
TCB.UM Broadcast user mode information
If enabled the TCB broadcasts information for instructions executed in user mode.
See also
■ TCB ■ TCB.state
Format: TCB.Type | <tcb_type>
<tcb_type>: PD | PD74K | IFLOW | FALCON | ZEPHYR
PD MIPS standard program and data trace control block.
PD74K Specific MIPS74K program data trace control block.
IFLOW MIPS standard instruction flow trace control block.
FALCON Lantiq specific instruction flow trace control block.
ZEPHYR Broadcom specific program and data trace control block.
Format: TCB.UM [ON | OFF]
ON (default)
The TCB broadcast information for executed instructions in user operating mode.
OFF The TCB does not broadcast information for executed instructions in user operating mode.
General Commands Reference Guide T 73 ©1989-2019 Lauterbach GmbH
TCB.Version Specify trace cell version
This command is only required if a TRACE32 Instruction Set Simulator is used for a belated trace analysis. This command allows to specify manually the version number of the TCB trace cell. The version number must fit to the TCB the trace data have been recorded with. It could be found in the header of the TCB window if TRACE32 is connected to the referring target.
See also
■ TCB ■ TCB.state
Format: TCB.Version <number>
General Commands Reference Guide T 74 ©1989-2019 Lauterbach GmbH
TERM
TERM Terminal emulation
See also
■ TERM.CLEAR ■ TERM.CLOSE ■ TERM.CMDLINE ■ TERM.FastWRITE ■ TERM.GATE ■ TERM.HARDCOPY ■ TERM.HEAPINFO ■ TERM.LocalEcho ■ TERM.METHOD ■ TERM.Mode ■ TERM.Out ■ TERM.PIPE ■ TERM.PipeREAD ■ TERM.PipeWRITE ■ TERM.Protocol ■ TERM.PULSE ■ TERM.Rate ■ TERM.READ ■ TERM.RESet ■ TERM.SCROLL ■ TERM.SIZE ■ TERM.TCP ■ TERM.TELNET ■ TERM.TRIGGER ■ TERM.Vector ■ TERM.view ■ TERM.WRITE ❏ TERM.LINE() ❏ TERM.RETURNCODE() ❏ TERM.TRIGGERED()
▲ ’TERM Functions (Terminal Window)’ in ’General Function Reference’▲ ’Release Information’ in ’Release History’▲ ’Features’ in ’OS Awareness Manual RTXC Quadros’
Overview TERM
Multitasking operating systems or monitor programs running on the target system often need a terminal interface for operation. This interface can be implemented either using peripherals (e.g. serial port) or as a memory based interface. The memory based interface can work in several operation modes. It can communicate either on character basis or with blocks of up to 255 bytes length. The memory access can either be made while the target is running (when the system supports such run-time memory accesses) or only when the target is stopped.
When the EPROM simulator (ESI) is used, the ESI can be used as communication port as well. Some processor architectures also provide a special communication interface which is accessible through the BDM/JTAG port (DCC modes).
The standard terminal window provides only the basic functions Backspace, Return and LineFeed. A VT100 emulation mode is also available. A character can only be entered when the cursor is positioned in an active window. The terminal window may also be used for “virtual hosting”. This allows to access some basic operation system functions and the file system of the host from the target program. This functionality is only available in the TERM.GATE command.
General Commands Reference Guide T 75 ©1989-2019 Lauterbach GmbH
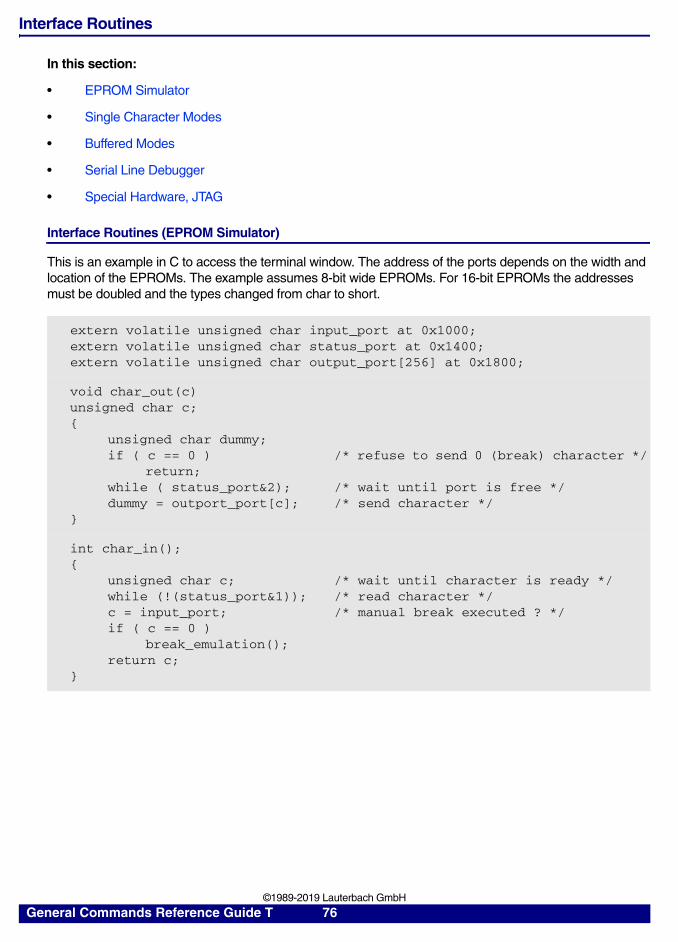
Interface Routines
In this section:
• EPROM Simulator
• Single Character Modes
• Buffered Modes
• Serial Line Debugger
• Special Hardware, JTAG
Interface Routines (EPROM Simulator)
This is an example in C to access the terminal window. The address of the ports depends on the width and location of the EPROMs. The example assumes 8-bit wide EPROMs. For 16-bit EPROMs the addresses must be doubled and the types changed from char to short.
extern volatile unsigned char input_port at 0x1000;extern volatile unsigned char status_port at 0x1400;extern volatile unsigned char output_port[256] at 0x1800;
void char_out(c)unsigned char c;{
unsigned char dummy;if ( c == 0 )
return;while ( status_port&2);dummy = outport_port[c];
}
/* refuse to send 0 (break) character */
/* wait until port is free *//* send character */
int char_in();{
unsigned char c;while (!(status_port&1));c = input_port;if ( c == 0 )
break_emulation();return c;
}
/* wait until character is ready *//* read character *//* manual break executed ? */
General Commands Reference Guide T 76 ©1989-2019 Lauterbach GmbH
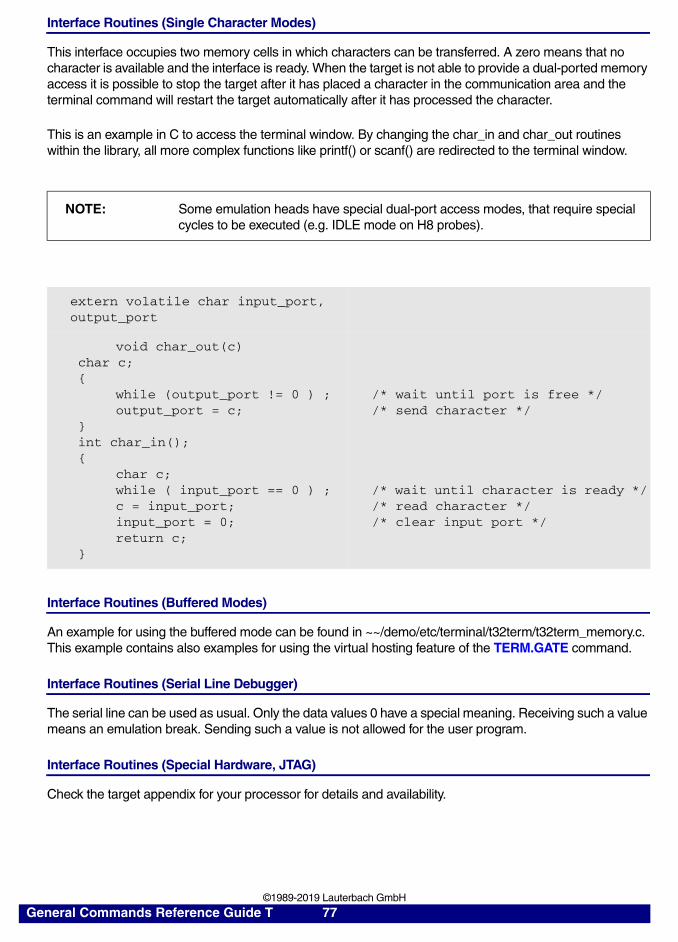
Interface Routines (Single Character Modes)
This interface occupies two memory cells in which characters can be transferred. A zero means that no character is available and the interface is ready. When the target is not able to provide a dual-ported memory access it is possible to stop the target after it has placed a character in the communication area and the terminal command will restart the target automatically after it has processed the character.
This is an example in C to access the terminal window. By changing the char_in and char_out routines within the library, all more complex functions like printf() or scanf() are redirected to the terminal window.
Interface Routines (Buffered Modes)
An example for using the buffered mode can be found in ~~/demo/etc/terminal/t32term/t32term_memory.c. This example contains also examples for using the virtual hosting feature of the TERM.GATE command.
Interface Routines (Serial Line Debugger)
The serial line can be used as usual. Only the data values 0 have a special meaning. Receiving such a value means an emulation break. Sending such a value is not allowed for the user program.
Interface Routines (Special Hardware, JTAG)
Check the target appendix for your processor for details and availability.
NOTE: Some emulation heads have special dual-port access modes, that require special cycles to be executed (e.g. IDLE mode on H8 probes).
extern volatile char input_port, output_port
void char_out(c)char c;{
while (output_port != 0 ) ;output_port = c;
}int char_in();{
char c;while ( input_port == 0 ) ;c = input_port;input_port = 0;return c;
}
/* wait until port is free *//* send character */
/* wait until character is ready *//* read character *//* clear input port */
General Commands Reference Guide T 77 ©1989-2019 Lauterbach GmbH
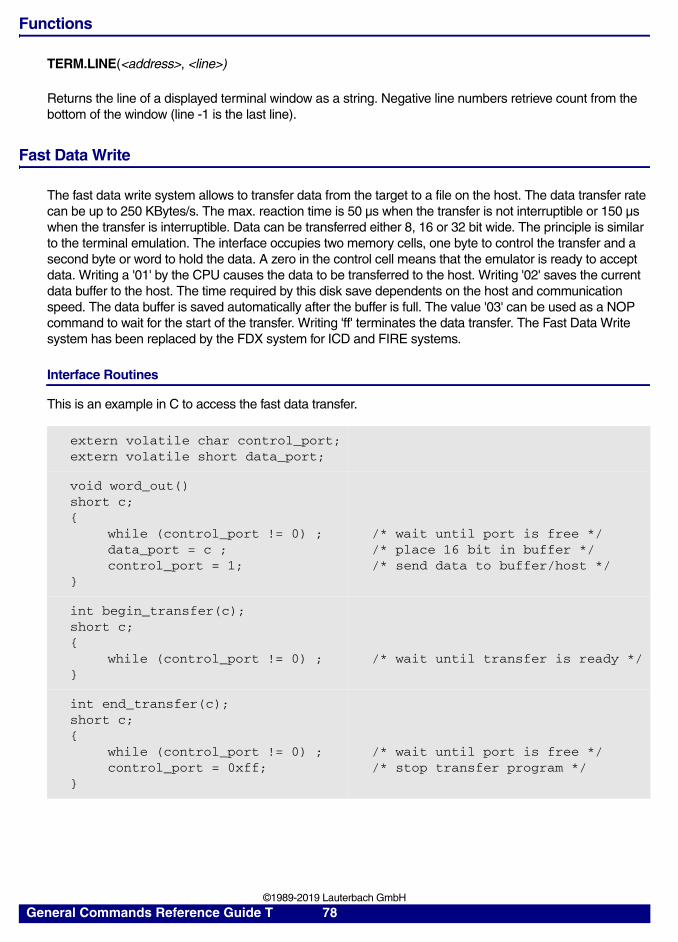
Functions
TERM.LINE(<address>, <line>)
Returns the line of a displayed terminal window as a string. Negative line numbers retrieve count from the bottom of the window (line -1 is the last line).
Fast Data Write
The fast data write system allows to transfer data from the target to a file on the host. The data transfer rate can be up to 250 KBytes/s. The max. reaction time is 50 µs when the transfer is not interruptible or 150 µs when the transfer is interruptible. Data can be transferred either 8, 16 or 32 bit wide. The principle is similar to the terminal emulation. The interface occupies two memory cells, one byte to control the transfer and a second byte or word to hold the data. A zero in the control cell means that the emulator is ready to accept data. Writing a '01' by the CPU causes the data to be transferred to the host. Writing '02' saves the current data buffer to the host. The time required by this disk save dependents on the host and communication speed. The data buffer is saved automatically after the buffer is full. The value '03' can be used as a NOP command to wait for the start of the transfer. Writing 'ff' terminates the data transfer. The Fast Data Write system has been replaced by the FDX system for ICD and FIRE systems.
Interface Routines
This is an example in C to access the fast data transfer.
extern volatile char control_port;extern volatile short data_port;
void word_out()short c;{
while (control_port != 0) ;data_port = c ;control_port = 1;
}
/* wait until port is free *//* place 16 bit in buffer *//* send data to buffer/host */
int begin_transfer(c);short c;{
while (control_port != 0) ;}
/* wait until transfer is ready */
int end_transfer(c);short c;{
while (control_port != 0) ;control_port = 0xff;
}
/* wait until port is free *//* stop transfer program */
General Commands Reference Guide T 78 ©1989-2019 Lauterbach GmbH
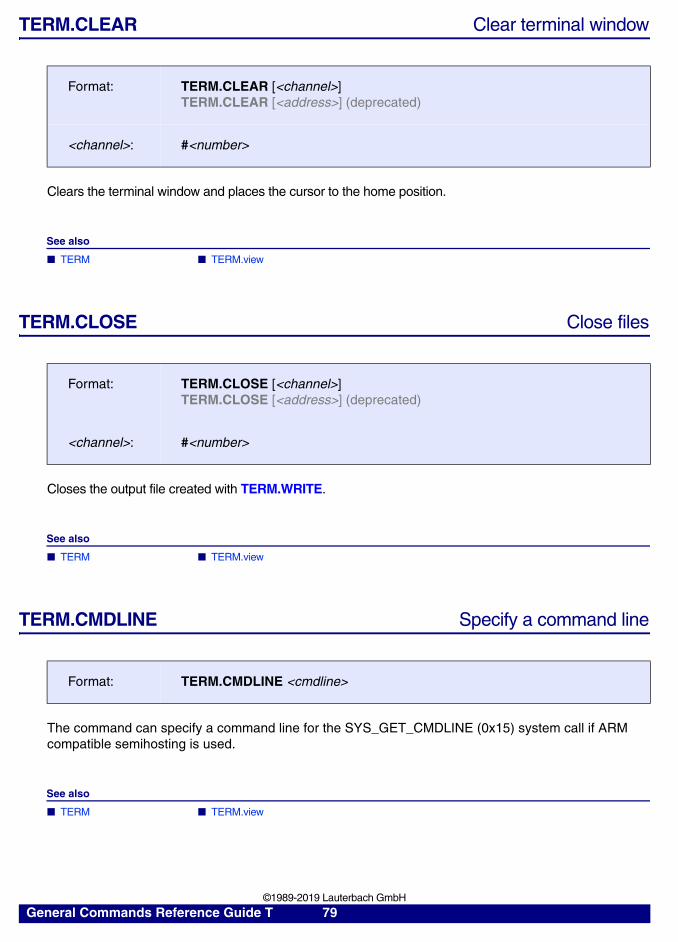
TERM.CLEAR Clear terminal window
Clears the terminal window and places the cursor to the home position.
See also
■ TERM ■ TERM.view
TERM.CLOSE Close files
Closes the output file created with TERM.WRITE.
See also
■ TERM ■ TERM.view
TERM.CMDLINE Specify a command line
The command can specify a command line for the SYS_GET_CMDLINE (0x15) system call if ARM compatible semihosting is used.
See also
■ TERM ■ TERM.view
Format: TERM.CLEAR [<channel>] TERM.CLEAR [<address>] (deprecated)
<channel>: #<number>
Format: TERM.CLOSE [<channel>] TERM.CLOSE [<address>] (deprecated)
<channel>: #<number>
Format: TERM.CMDLINE <cmdline>
General Commands Reference Guide T 79 ©1989-2019 Lauterbach GmbH
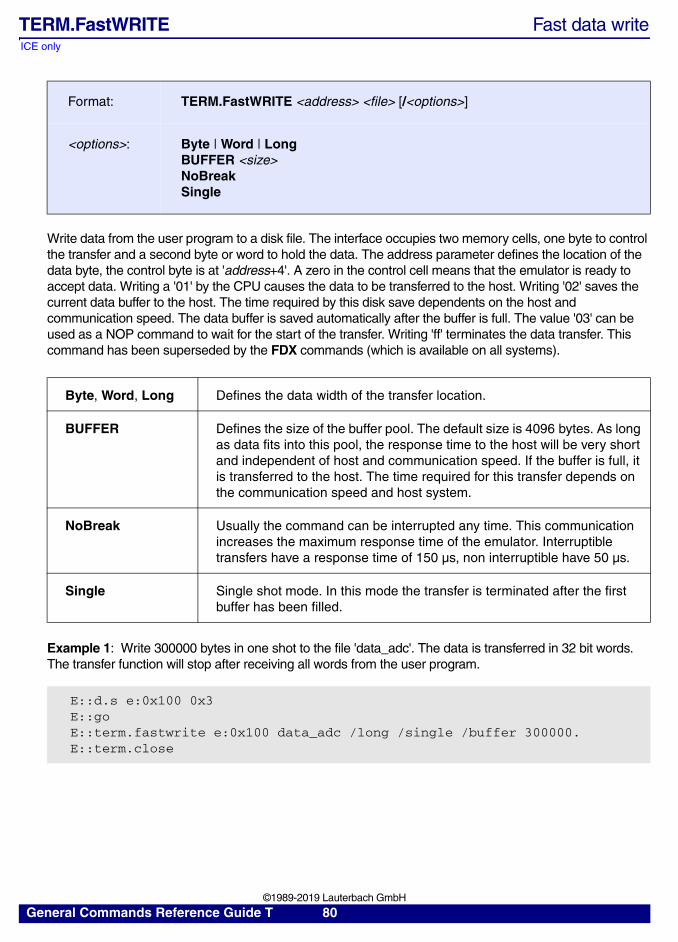
ICE only
TERM.FastWRITE Fast data write
Write data from the user program to a disk file. The interface occupies two memory cells, one byte to control the transfer and a second byte or word to hold the data. The address parameter defines the location of the data byte, the control byte is at 'address+4'. A zero in the control cell means that the emulator is ready to accept data. Writing a '01' by the CPU causes the data to be transferred to the host. Writing '02' saves the current data buffer to the host. The time required by this disk save dependents on the host and communication speed. The data buffer is saved automatically after the buffer is full. The value '03' can be used as a NOP command to wait for the start of the transfer. Writing 'ff' terminates the data transfer. This command has been superseded by the FDX commands (which is available on all systems).
Example 1: Write 300000 bytes in one shot to the file 'data_adc'. The data is transferred in 32 bit words. The transfer function will stop after receiving all words from the user program.
Format: TERM.FastWRITE <address> <file> [/<options>]
<options>: Byte | Word | LongBUFFER <size>NoBreakSingle
Byte, Word, Long Defines the data width of the transfer location.
BUFFER Defines the size of the buffer pool. The default size is 4096 bytes. As long as data fits into this pool, the response time to the host will be very short and independent of host and communication speed. If the buffer is full, it is transferred to the host. The time required for this transfer depends on the communication speed and host system.
NoBreak Usually the command can be interrupted any time. This communication increases the maximum response time of the emulator. Interruptible transfers have a response time of 150 µs, non interruptible have 50 µs.
Single Single shot mode. In this mode the transfer is terminated after the first buffer has been filled.
E::d.s e:0x100 0x3E::goE::term.fastwrite e:0x100 data_adc /long /single /buffer 300000.E::term.close
General Commands Reference Guide T 80 ©1989-2019 Lauterbach GmbH
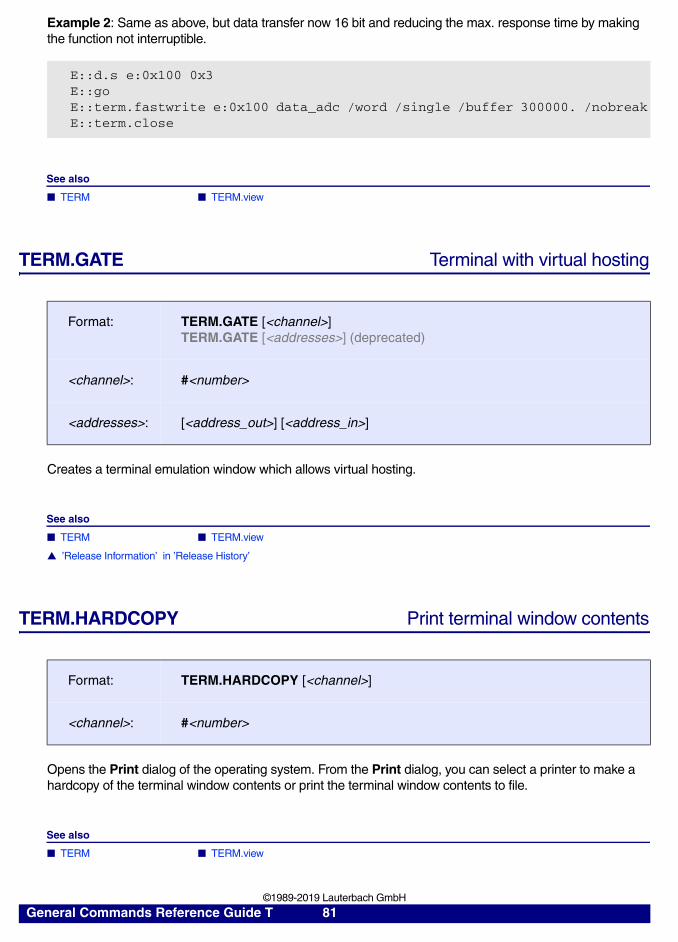
Example 2: Same as above, but data transfer now 16 bit and reducing the max. response time by making the function not interruptible.
See also
■ TERM ■ TERM.view
TERM.GATE Terminal with virtual hosting
Creates a terminal emulation window which allows virtual hosting.
See also
■ TERM ■ TERM.view
▲ ’Release Information’ in ’Release History’
TERM.HARDCOPY Print terminal window contents
Opens the Print dialog of the operating system. From the Print dialog, you can select a printer to make a hardcopy of the terminal window contents or print the terminal window contents to file.
See also
■ TERM ■ TERM.view
E::d.s e:0x100 0x3E::goE::term.fastwrite e:0x100 data_adc /word /single /buffer 300000. /nobreakE::term.close
Format: TERM.GATE [<channel>] TERM.GATE [<addresses>] (deprecated)
<channel>: #<number>
<addresses>: [<address_out>] [<address_in>]
Format: TERM.HARDCOPY [<channel>]
<channel>: #<number>
General Commands Reference Guide T 81 ©1989-2019 Lauterbach GmbH
TERM.HEAPINFO Define memory heap parameters
Defines the memory heap and stack locations returned by the ARM compatible semihosting calls. Only relevant when ARM compatible semihosting is used.
Please note that the heap grows toward higher memory addresses (heap_base < heap_limit) and the stack grows towards lower memory addresses (stack_base > stack_limit). <heap_base> = 0 advises the application to locate the heap at the top of the memory region.
See also
■ TERM ■ TERM.view
TERM.LocalEcho Enables/disables local echo for new terminal windows
Defines, if terminal windows, which are opened after the TERM.LocalEcho command with the TERM.view or TERM.GATE command, will have a local echo or not.Terminal windows with enabled local echo also show the transmitted characters in addition to the received characters.
See also
■ TERM ■ TERM.view
Format: TERM.HEAPINFO [<heap_base>] [<heap_limit>] [<stack_base>] [<stack_limit>]
Format: TERM.LocalEcho [<channel>] [ON | OFF]
<channel>: #<number>
General Commands Reference Guide T 82 ©1989-2019 Lauterbach GmbH
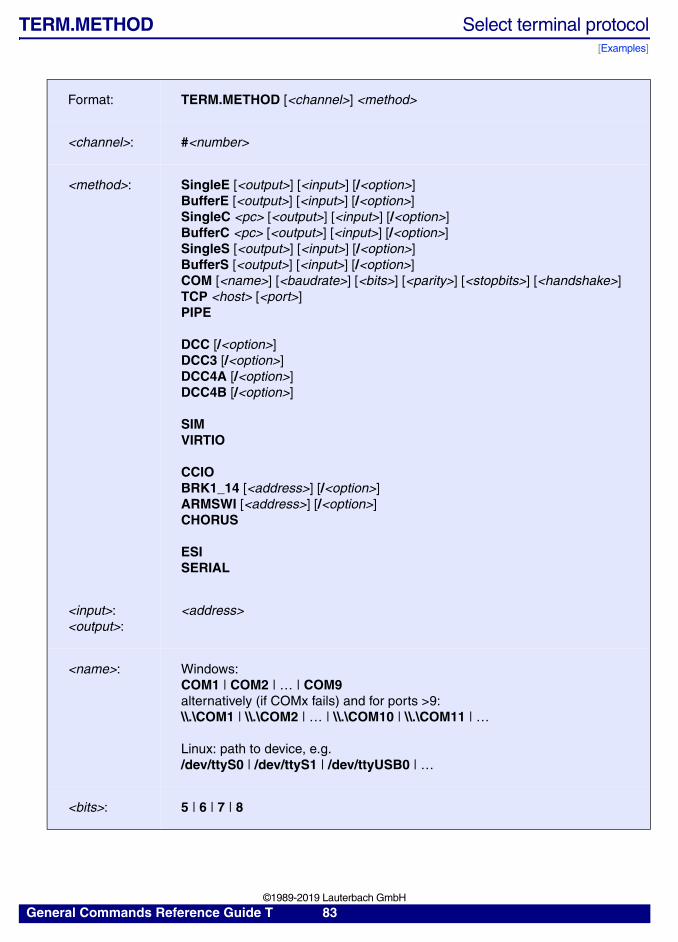
TERM.METHOD Select terminal protocol[Examples]
Format: TERM.METHOD [<channel>] <method>
<channel>: #<number>
<method>: SingleE [<output>] [<input>] [/<option>] BufferE [<output>] [<input>] [/<option>] SingleC <pc> [<output>] [<input>] [/<option>] BufferC <pc> [<output>] [<input>] [/<option>] SingleS [<output>] [<input>] [/<option>] BufferS [<output>] [<input>] [/<option>] COM [<name>] [<baudrate>] [<bits>] [<parity>] [<stopbits>] [<handshake>]TCP <host> [<port>]PIPE
DCC [/<option>] DCC3 [/<option>] DCC4A [/<option>] DCC4B [/<option>]
SIMVIRTIO
CCIOBRK1_14 [<address>] [/<option>] ARMSWI [<address>] [/<option>] CHORUS
ESISERIAL
<input>:<output>:
<address>
<name>: Windows:COM1 | COM2 | … | COM9alternatively (if COMx fails) and for ports >9:\\.\COM1 | \\.\COM2 | … | \\.\COM10 | \\.\COM11 | …
Linux: path to device, e.g./dev/ttyS0 | /dev/ttyS1 | /dev/ttyUSB0 | …
<bits>: 5 | 6 | 7 | 8
General Commands Reference Guide T 83 ©1989-2019 Lauterbach GmbH
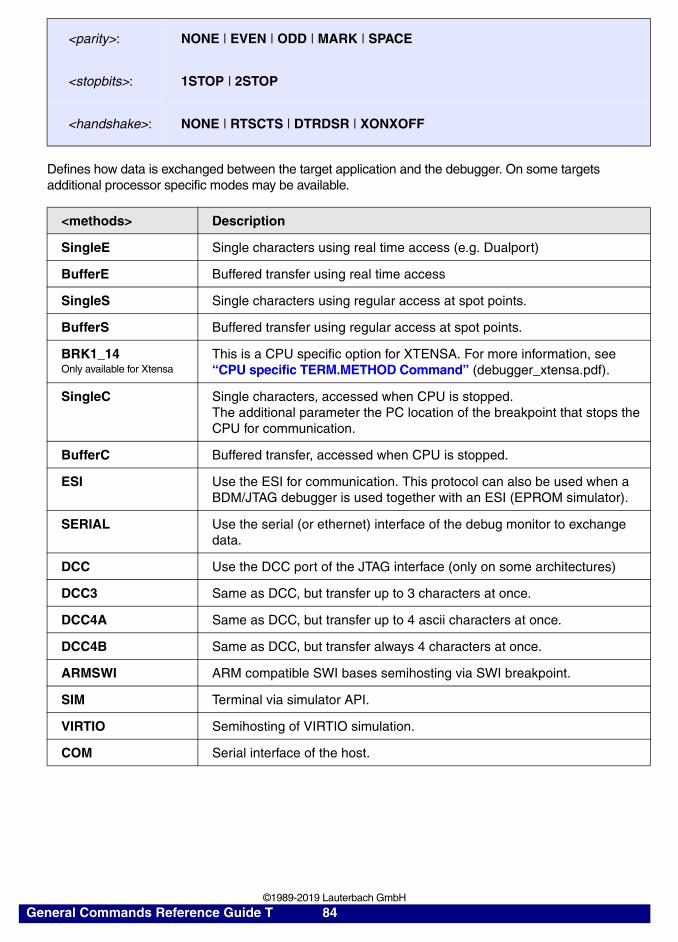
Defines how data is exchanged between the target application and the debugger. On some targets additional processor specific modes may be available.
<parity>: NONE | EVEN | ODD | MARK | SPACE
<stopbits>: 1STOP | 2STOP
<handshake>: NONE | RTSCTS | DTRDSR | XONXOFF
<methods> Description
SingleE Single characters using real time access (e.g. Dualport)
BufferE Buffered transfer using real time access
SingleS Single characters using regular access at spot points.
BufferS Buffered transfer using regular access at spot points.
BRK1_14Only available for Xtensa
This is a CPU specific option for XTENSA. For more information, see “CPU specific TERM.METHOD Command” (debugger_xtensa.pdf).
SingleC Single characters, accessed when CPU is stopped.The additional parameter the PC location of the breakpoint that stops the CPU for communication.
BufferC Buffered transfer, accessed when CPU is stopped.
ESI Use the ESI for communication. This protocol can also be used when a BDM/JTAG debugger is used together with an ESI (EPROM simulator).
SERIAL Use the serial (or ethernet) interface of the debug monitor to exchange data.
DCC Use the DCC port of the JTAG interface (only on some architectures)
DCC3 Same as DCC, but transfer up to 3 characters at once.
DCC4A Same as DCC, but transfer up to 4 ascii characters at once.
DCC4B Same as DCC, but transfer always 4 characters at once.
ARMSWI ARM compatible SWI bases semihosting via SWI breakpoint.
SIM Terminal via simulator API.
VIRTIO Semihosting of VIRTIO simulation.
COM Serial interface of the host.
General Commands Reference Guide T 84 ©1989-2019 Lauterbach GmbH
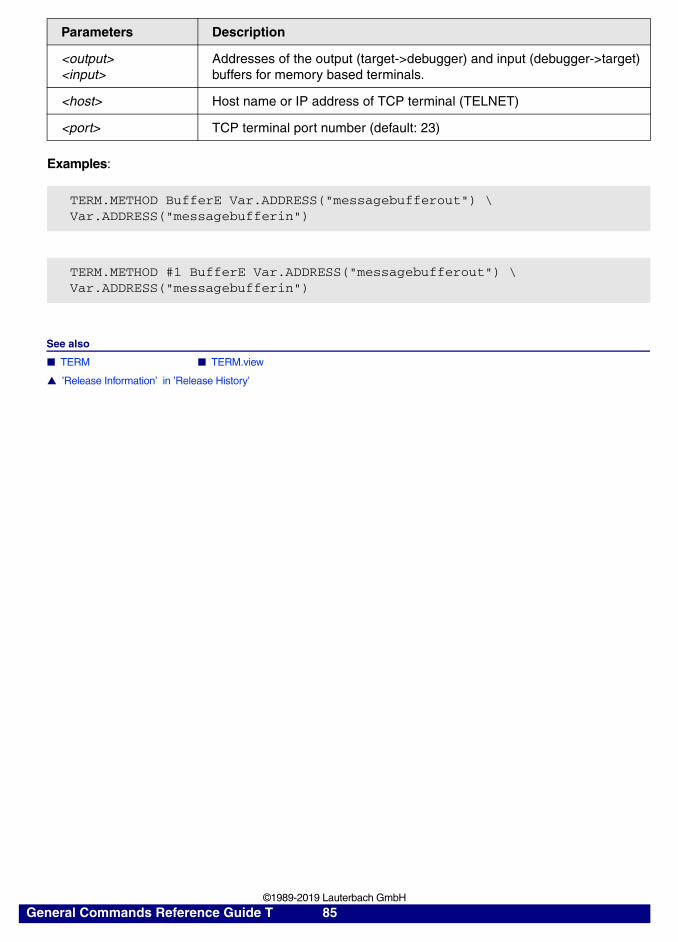
Examples:
See also
■ TERM ■ TERM.view
▲ ’Release Information’ in ’Release History’
Parameters Description
<output><input>
Addresses of the output (target->debugger) and input (debugger->target) buffers for memory based terminals.
<host> Host name or IP address of TCP terminal (TELNET)
<port> TCP terminal port number (default: 23)
TERM.METHOD BufferE Var.ADDRESS("messagebufferout") \ Var.ADDRESS("messagebufferin")
TERM.METHOD #1 BufferE Var.ADDRESS("messagebufferout") \ Var.ADDRESS("messagebufferin")
General Commands Reference Guide T 85 ©1989-2019 Lauterbach GmbH
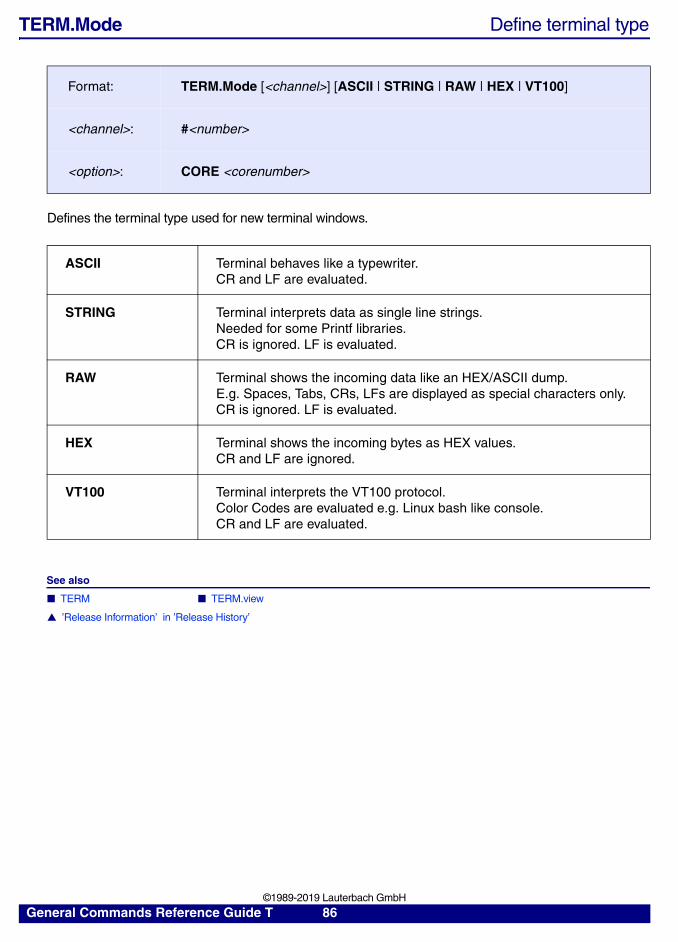
TERM.Mode Define terminal type
Defines the terminal type used for new terminal windows.
See also
■ TERM ■ TERM.view
▲ ’Release Information’ in ’Release History’
Format: TERM.Mode [<channel>] [ASCII | STRING | RAW | HEX | VT100]
<channel>: #<number>
<option>: CORE <corenumber>
ASCII Terminal behaves like a typewriter.CR and LF are evaluated.
STRING Terminal interprets data as single line strings. Needed for some Printf libraries.CR is ignored. LF is evaluated.
RAW Terminal shows the incoming data like an HEX/ASCII dump. E.g. Spaces, Tabs, CRs, LFs are displayed as special characters only.CR is ignored. LF is evaluated.
HEX Terminal shows the incoming bytes as HEX values.CR and LF are ignored.
VT100 Terminal interprets the VT100 protocol. Color Codes are evaluated e.g. Linux bash like console.CR and LF are evaluated.
General Commands Reference Guide T 86 ©1989-2019 Lauterbach GmbH
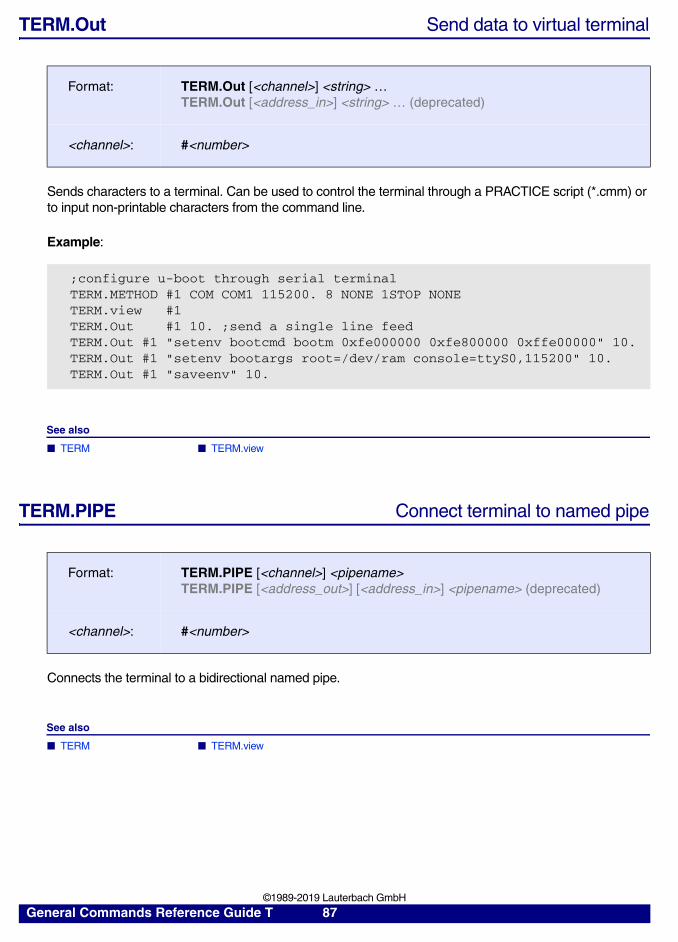
TERM.Out Send data to virtual terminal
Sends characters to a terminal. Can be used to control the terminal through a PRACTICE script (*.cmm) or to input non-printable characters from the command line.
Example:
See also
■ TERM ■ TERM.view
TERM.PIPE Connect terminal to named pipe
Connects the terminal to a bidirectional named pipe.
See also
■ TERM ■ TERM.view
Format: TERM.Out [<channel>] <string> …TERM.Out [<address_in>] <string> … (deprecated)
<channel>: #<number>
;configure u-boot through serial terminalTERM.METHOD #1 COM COM1 115200. 8 NONE 1STOP NONETERM.view #1TERM.Out #1 10. ;send a single line feedTERM.Out #1 "setenv bootcmd bootm 0xfe000000 0xfe800000 0xffe00000" 10.TERM.Out #1 "setenv bootargs root=/dev/ram console=ttyS0,115200" 10.TERM.Out #1 "saveenv" 10.
Format: TERM.PIPE [<channel>] <pipename> TERM.PIPE [<address_out>] [<address_in>] <pipename> (deprecated)
<channel>: #<number>
General Commands Reference Guide T 87 ©1989-2019 Lauterbach GmbH
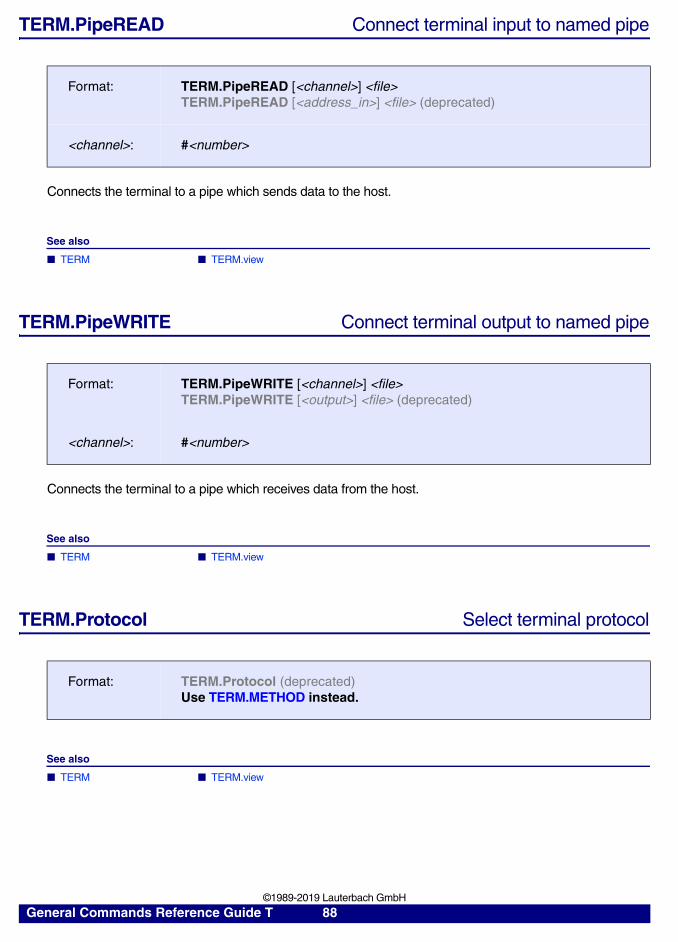
TERM.PipeREAD Connect terminal input to named pipe
Connects the terminal to a pipe which sends data to the host.
See also
■ TERM ■ TERM.view
TERM.PipeWRITE Connect terminal output to named pipe
Connects the terminal to a pipe which receives data from the host.
See also
■ TERM ■ TERM.view
TERM.Protocol Select terminal protocol
See also
■ TERM ■ TERM.view
Format: TERM.PipeREAD [<channel>] <file>TERM.PipeREAD [<address_in>] <file> (deprecated)
<channel>: #<number>
Format: TERM.PipeWRITE [<channel>] <file>TERM.PipeWRITE [<output>] <file> (deprecated)
<channel>: #<number>
Format: TERM.Protocol (deprecated)Use TERM.METHOD instead.
General Commands Reference Guide T 88 ©1989-2019 Lauterbach GmbH
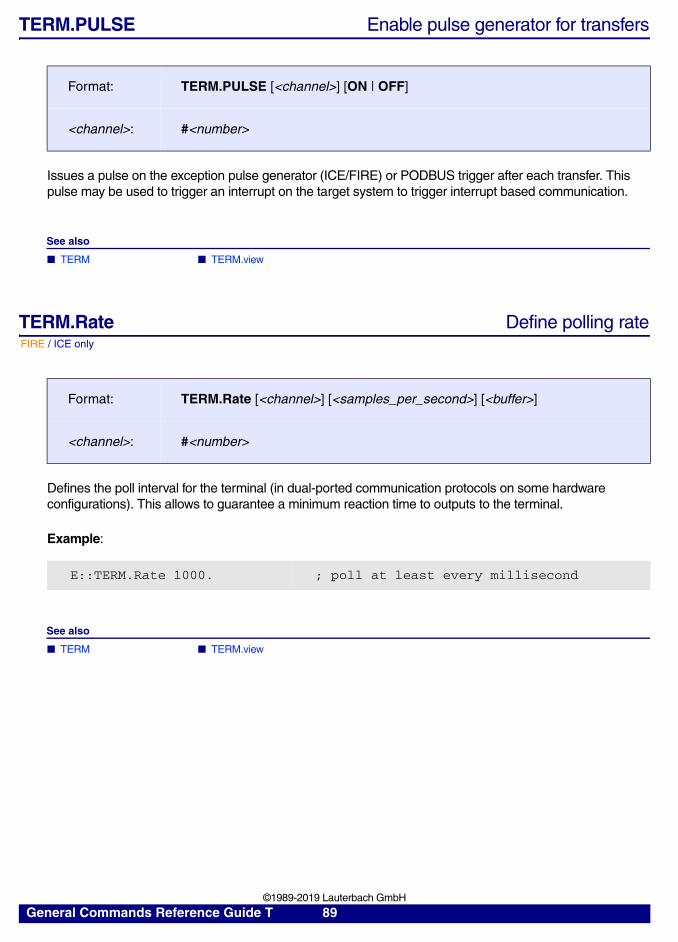
TERM.PULSE Enable pulse generator for transfers
Issues a pulse on the exception pulse generator (ICE/FIRE) or PODBUS trigger after each transfer. This pulse may be used to trigger an interrupt on the target system to trigger interrupt based communication.
See also
■ TERM ■ TERM.view
FIRE / ICE only
TERM.Rate Define polling rate
Defines the poll interval for the terminal (in dual-ported communication protocols on some hardware configurations). This allows to guarantee a minimum reaction time to outputs to the terminal.
Example:
See also
■ TERM ■ TERM.view
Format: TERM.PULSE [<channel>] [ON | OFF]
<channel>: #<number>
Format: TERM.Rate [<channel>] [<samples_per_second>] [<buffer>]
<channel>: #<number>
E::TERM.Rate 1000. ; poll at least every millisecond
General Commands Reference Guide T 89 ©1989-2019 Lauterbach GmbH
TERM.READ Get terminal input from file
The contents of the file are send to the terminal, defined by the optional address. The terminal must already exist to use this command. The TERM.CLOSE command closes the input file after or during transfer.
Example:
See also
■ TERM ■ TERM.view
TERM.RESet Reset terminal parameters
Closes the I/O redirection files and set all parameters to default values.
See also
■ TERM ■ TERM.view
Format: TERM.READ [<channel>] <file>TERM.READ [<address_in>] <file> (deprecated)
<channel>: #<number>
TERM.READ #1 key_input.in
Format: TERM.RESet [<channel>]
<channel>: #<number>
General Commands Reference Guide T 90 ©1989-2019 Lauterbach GmbH
TERM.SCROLL Enable automatic scrolling for terminal window
Default: OFF.
Enables or disables automatic scrolling. With automatic scrolling enabled the visible window will follow the terminal cursor.
See also
■ TERM ■ TERM.view
TERM.SIZE Define size of terminal window
Defines the size of the virtual terminal in lines and columns.
See also
■ TERM ■ TERM.view
▲ ’Release Information’ in ’Release History’
Format: TERM.SCROLL [<channel>] [ON | OFF]
<channel>: #<number>
Format: TERM.SIZE [<channel>] [<columns>] [<lines>] [<backlog_size>]
<channel>: #<number>
<backlog_size> This value defines the lines of the backlog buffer.The backlog is updated whenever a line scrolls out of the “real” part of the TERM.view window.
General Commands Reference Guide T 91 ©1989-2019 Lauterbach GmbH
TERM.TCP Route terminal input/output to TCP port
Routes terminal input/output to TCP port.
See also
■ TERM ■ TERM.view
TERM.TELNET Open TELNET terminal window
Opens the terminal emulation window for TELNET.
Example:
See also
■ TERM ■ TERM.view
▲ ’Release Information’ in ’Release History’
Format: TERM.TCP [<channel>] <port>
<channel>: #<number>
Format: TERM.TELNET [<channel>]
<channel>: #<number>
TERM.METHOD TCP 10.2.23.140 ;using default port 23TERM.MODE VT100TERM.TELNET
General Commands Reference Guide T 92 ©1989-2019 Lauterbach GmbH
TERM.TRIGGER Trigger on string in terminal window[Example]
Sets a trigger for the occurrence of a specific string in the terminal window. The function TERM.TRIGGERED() returns if the trigger has occurred or not.
Format: TERM.TRIGGER [<channel>] <message_string>TERM.TRIGGER [<address_out>] <string> (deprecated)
<channel>: #<number>
<channel> Handle to refer to a terminal. A new handle can be created with TERM.METHOD.
<address_out> Only required for memory-based data exchange (SingleE, BufferE, SingleS, BufferS).
<message_string> Case sensitive.The message string or substring you want the TERM.TRIGGER() function to find in the TERM.view or TERM.GATE window.
General Commands Reference Guide T 93 ©1989-2019 Lauterbach GmbH
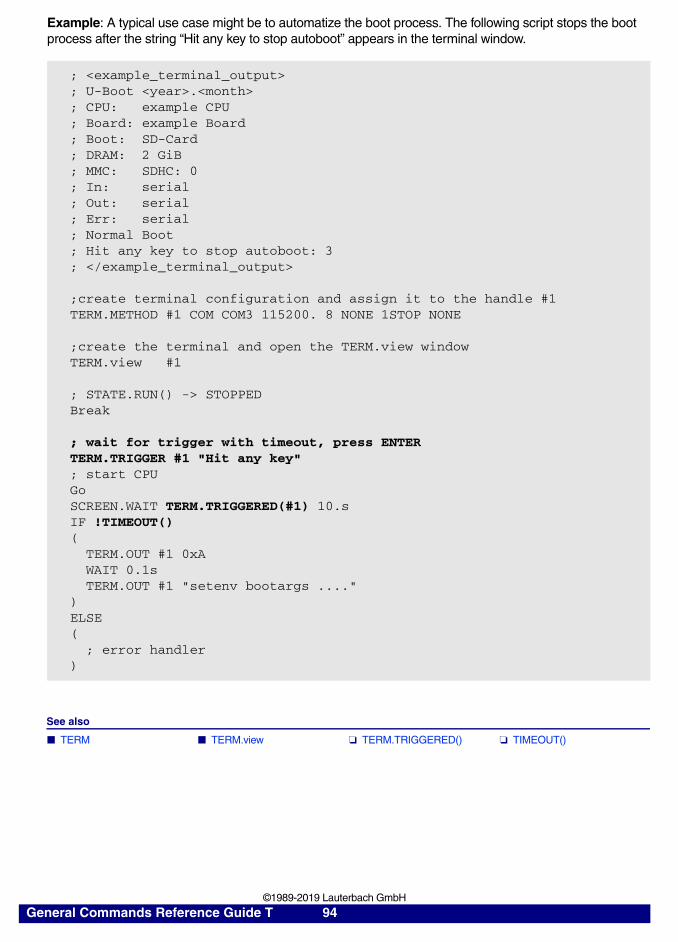
Example: A typical use case might be to automatize the boot process. The following script stops the boot process after the string “Hit any key to stop autoboot” appears in the terminal window.
See also
■ TERM ■ TERM.view ❏ TERM.TRIGGERED() ❏ TIMEOUT()
; <example_terminal_output>; U-Boot <year>.<month>; CPU: example CPU; Board: example Board; Boot: SD-Card; DRAM: 2 GiB; MMC: SDHC: 0; In: serial; Out: serial; Err: serial; Normal Boot; Hit any key to stop autoboot: 3; </example_terminal_output>
;create terminal configuration and assign it to the handle #1TERM.METHOD #1 COM COM3 115200. 8 NONE 1STOP NONE
;create the terminal and open the TERM.view windowTERM.view #1
; STATE.RUN() -> STOPPEDBreak
; wait for trigger with timeout, press ENTERTERM.TRIGGER #1 "Hit any key"; start CPUGoSCREEN.WAIT TERM.TRIGGERED(#1) 10.sIF !TIMEOUT() ( TERM.OUT #1 0xA WAIT 0.1s TERM.OUT #1 "setenv bootargs ....")ELSE( ; error handler)
General Commands Reference Guide T 94 ©1989-2019 Lauterbach GmbH
ICE only
TERM.Vector Define interrupt vectors
Defines interrupt vectors for the I/O port simulation. The exception generator will generate one pulse with the <tx_vector>, after the terminal has accepted one character and one pulse with <rx_vector>, if the terminal has placed one character in the dual-port memory. If one vector is zero, no exception will be generated (default).
See also
■ TERM ■ TERM.view
Format: TERM.Vector [<channel>] [<tx_vector>] [<rx_vector>]
<channel>: #<number>
General Commands Reference Guide T 95 ©1989-2019 Lauterbach GmbH
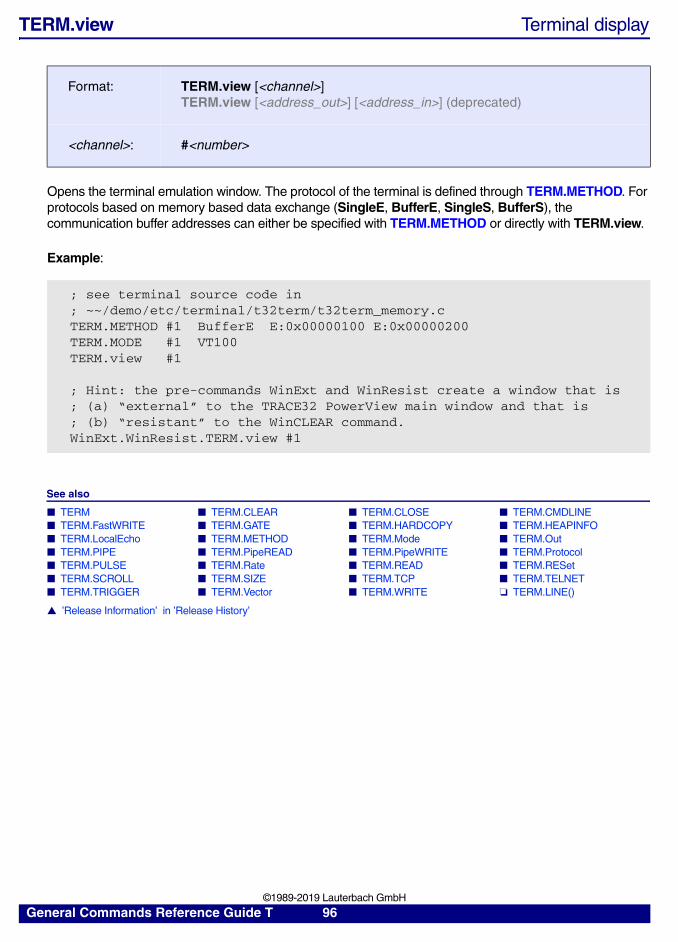
TERM.view Terminal display
Opens the terminal emulation window. The protocol of the terminal is defined through TERM.METHOD. For protocols based on memory based data exchange (SingleE, BufferE, SingleS, BufferS), the communication buffer addresses can either be specified with TERM.METHOD or directly with TERM.view.
Example:
See also
■ TERM ■ TERM.CLEAR ■ TERM.CLOSE ■ TERM.CMDLINE ■ TERM.FastWRITE ■ TERM.GATE ■ TERM.HARDCOPY ■ TERM.HEAPINFO ■ TERM.LocalEcho ■ TERM.METHOD ■ TERM.Mode ■ TERM.Out ■ TERM.PIPE ■ TERM.PipeREAD ■ TERM.PipeWRITE ■ TERM.Protocol ■ TERM.PULSE ■ TERM.Rate ■ TERM.READ ■ TERM.RESet ■ TERM.SCROLL ■ TERM.SIZE ■ TERM.TCP ■ TERM.TELNET ■ TERM.TRIGGER ■ TERM.Vector ■ TERM.WRITE ❏ TERM.LINE()
▲ ’Release Information’ in ’Release History’
Format: TERM.view [<channel>] TERM.view [<address_out>] [<address_in>] (deprecated)
<channel>: #<number>
; see terminal source code in ; ~~/demo/etc/terminal/t32term/t32term_memory.cTERM.METHOD #1 BufferE E:0x00000100 E:0x00000200TERM.MODE #1 VT100TERM.view #1
; Hint: the pre-commands WinExt and WinResist create a window that is ; (a) “external” to the TRACE32 PowerView main window and that is ; (b) “resistant” to the WinCLEAR command.WinExt.WinResist.TERM.view #1
General Commands Reference Guide T 96 ©1989-2019 Lauterbach GmbH
TERM.WRITE Write terminal output to file
The output sent from the target to the terminal emulation window is written to the specified file. The terminal emulation window must be opened before using this command. The TERM.CLOSE command closes the output file after or during transfer.
Example:
See also
■ TERM ■ TERM.view
▲ ’Release Information’ in ’Release History’
Format: TERM.WRITE [<channel>] <file>TERM.WRITE [<address_out>] <file> (deprecated)
<channel>: #<number>
TERM.WRITE #1 term_out.lst
General Commands Reference Guide T 97 ©1989-2019 Lauterbach GmbH
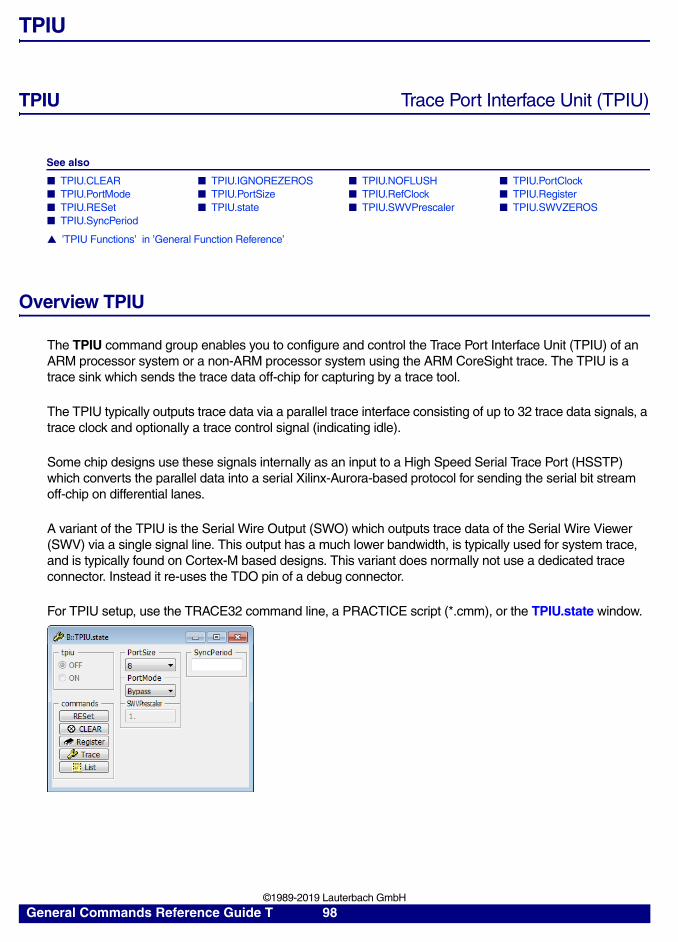
TPIU
TPIU Trace Port Interface Unit (TPIU)
See also
■ TPIU.CLEAR ■ TPIU.IGNOREZEROS ■ TPIU.NOFLUSH ■ TPIU.PortClock ■ TPIU.PortMode ■ TPIU.PortSize ■ TPIU.RefClock ■ TPIU.Register ■ TPIU.RESet ■ TPIU.state ■ TPIU.SWVPrescaler ■ TPIU.SWVZEROS ■ TPIU.SyncPeriod
▲ ’TPIU Functions’ in ’General Function Reference’
Overview TPIU
The TPIU command group enables you to configure and control the Trace Port Interface Unit (TPIU) of an ARM processor system or a non-ARM processor system using the ARM CoreSight trace. The TPIU is a trace sink which sends the trace data off-chip for capturing by a trace tool.
The TPIU typically outputs trace data via a parallel trace interface consisting of up to 32 trace data signals, a trace clock and optionally a trace control signal (indicating idle).
Some chip designs use these signals internally as an input to a High Speed Serial Trace Port (HSSTP) which converts the parallel data into a serial Xilinx-Aurora-based protocol for sending the serial bit stream off-chip on differential lanes.
A variant of the TPIU is the Serial Wire Output (SWO) which outputs trace data of the Serial Wire Viewer (SWV) via a single signal line. This output has a much lower bandwidth, is typically used for system trace, and is typically found on Cortex-M based designs. This variant does normally not use a dedicated trace connector. Instead it re-uses the TDO pin of a debug connector.
For TPIU setup, use the TRACE32 command line, a PRACTICE script (*.cmm), or the TPIU.state window.
General Commands Reference Guide T 98 ©1989-2019 Lauterbach GmbH
TPIU.CLEAR Re-write the TPIU registers
Re-writes the TPIU registers on the target with the settings displayed on the TPIU.state window.
See also
■ TPIU ■ TPIU.state
TPIU.IGNOREZEROS Workaround for a special chip
See also
■ TPIU ■ TPIU.state
TPIU.NOFLUSH Workaround for a chip bug affecting TPIU flush
Default: OFF.
Activates a workaround for a chip bug which caused serious issues when the trace tool caused a TPIU flush at the end of the trace recording.
See also
■ TPIU ■ TPIU.state
Format: TPIU.CLEAR
Format: TPIU.IGNOREZEROS [ON | OFF]
Format: TPIU.NOFLUSH [ON | OFF]
General Commands Reference Guide T 99 ©1989-2019 Lauterbach GmbH
TPIU.PortClock Inform debugger about HSSTP trace frequency
Default: 1500Mbps
Informs the debugger about the HSSTP trace frequency to improve the accuracy of the timestamp calculation.
Example:
See also
■ TPIU ■ TPIU.state
Format: TPIU.PortClock <frequency>
TPIU.PortClock 3125MbpsTPIU.PortClock 3125M ; M is the short form of Mbps
General Commands Reference Guide T 100 ©1989-2019 Lauterbach GmbH
TPIU.PortMode Select the operation mode of the TPIU
Selects the operation mode of the TPIU.
Example:
See also
■ TPIU ■ TPIU.state
Format: TPIU.PortMode <mode>
<mode>: Bypass | Wrapped | Continuous | NRZ
Modes for Parallel Trace and HSSTP
The TPIU can optionally output a trace control signal (TRACECTL) which indicates idle cycles of the trace port not worth to record. The TPIU formatter can be used to add the idle information to the trace packets. The formatter needs to be used in case of multiple trace sources to add the ID of the trace source.
Bypass TRACECTL pin is available, formatter is not used.
Wrapped TRACECTL pin is available, formatter is used.
Continuous TRACECTL pin is not available, formatter is used.
Modes for Serial Wire Output
TRACE32 supports the UART/NRZ (NRZ = Non-Return-to-Zero) coding of the Serial Wire Output but not yet the Manchester coding. The bitrate of this asynchronous interface is derived by dividing the CPU frequency.
NRZ NRZ coding at CPU clock divided by <divisor> set up by: TPIU.SWVPrescaler <divisor> (default: 1)
NRZ/2 (deprecated)See example below.
NRZ coding at half of the CPU clock speed.
NRZ/3 (deprecated)See example below.
NRZ coding at a third of the CPU clock speed.
NRZ/4 (deprecated)See example below.
NRZ coding at a quarter of the CPU clock speed.
;(deprecated)TPIU.PortMode NRZ/4
;please use these two commands instead of NRZ/<divisor>TPIU.PortMode NRZ TPIU.SWVPrescaler 4.
General Commands Reference Guide T 101 ©1989-2019 Lauterbach GmbH
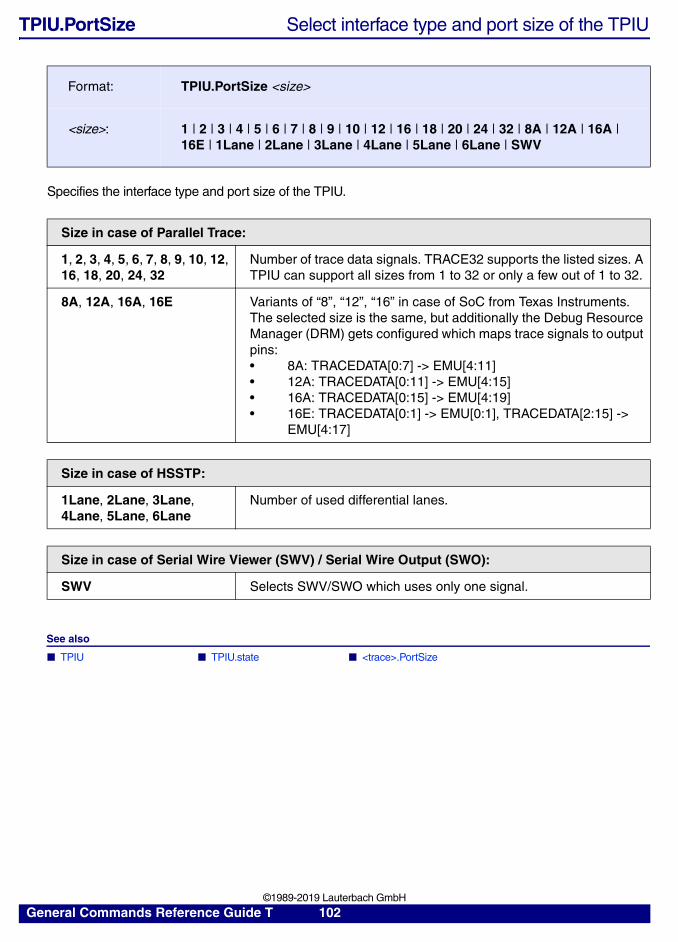
TPIU.PortSize Select interface type and port size of the TPIU
Specifies the interface type and port size of the TPIU.
See also
■ TPIU ■ TPIU.state ■ <trace>.PortSize
Format: TPIU.PortSize <size>
<size>: 1 | 2 | 3 | 4 | 5 | 6 | 7 | 8 | 9 | 10 | 12 | 16 | 18 | 20 | 24 | 32 | 8A | 12A | 16A | 16E | 1Lane | 2Lane | 3Lane | 4Lane | 5Lane | 6Lane | SWV
Size in case of Parallel Trace:
1, 2, 3, 4, 5, 6, 7, 8, 9, 10, 12, 16, 18, 20, 24, 32
Number of trace data signals. TRACE32 supports the listed sizes. A TPIU can support all sizes from 1 to 32 or only a few out of 1 to 32.
8A, 12A, 16A, 16E Variants of “8”, “12”, “16” in case of SoC from Texas Instruments. The selected size is the same, but additionally the Debug Resource Manager (DRM) gets configured which maps trace signals to output pins:• 8A: TRACEDATA[0:7] -> EMU[4:11]• 12A: TRACEDATA[0:11] -> EMU[4:15]• 16A: TRACEDATA[0:15] -> EMU[4:19]• 16E: TRACEDATA[0:1] -> EMU[0:1], TRACEDATA[2:15] ->
EMU[4:17]
Size in case of HSSTP:
1Lane, 2Lane, 3Lane, 4Lane, 5Lane, 6Lane
Number of used differential lanes.
Size in case of Serial Wire Viewer (SWV) / Serial Wire Output (SWO):
SWV Selects SWV/SWO which uses only one signal.
General Commands Reference Guide T 102 ©1989-2019 Lauterbach GmbH
TPIU.RefClock Set up reference clock for HSSTP
Defines the reference clock frequency the serial preprocessor outputs to the target. Defaults depending on architecture:
• PowerPC: bit clock frequency
• TriCore and RH850: 100MHz
• ARM: bit clock frequency
See also
■ TPIU ■ TPIU.state
TPIU.Register Display TPIU registers
Opens the TPIU.Register window, displaying the TPIU registers and the registers of other trace related modules.
See also
■ TPIU ■ TPIU.state
Format: TPIU.RefClock [/<option>]
<option>: OFF | OSC | 1/1 | 1/2 | 1/20 | 1/25 | 1/30 | 1/40 | 1/50
OFF TRACE32 does not send any reference clock to the target.
OSC An asynchronous oscillator will be enabled. Its frequency is architecture dependent.
1/<x> A synchronous clock source will be enabled. Its dividers generate a reference clock as a fraction of the bit clock (lane speed), e.g. 100MHz at 5Gbps with divider 1/50. Once a divider is selected, the reference clock will automatically change with the lane speed.
Format: TPIU.Register [/<option>]
<option>: SpotLight | DualPort | Track | CORE <core_number>
<option> For a description of the options, see PER.view.
General Commands Reference Guide T 103 ©1989-2019 Lauterbach GmbH
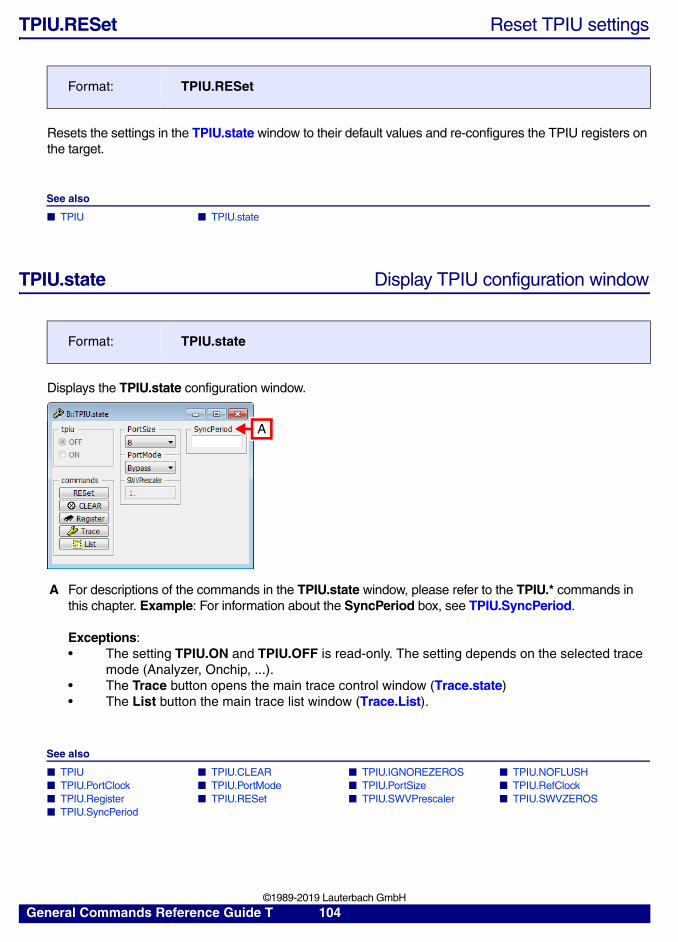
TPIU.RESet Reset TPIU settings
Resets the settings in the TPIU.state window to their default values and re-configures the TPIU registers on the target.
See also
■ TPIU ■ TPIU.state
TPIU.state Display TPIU configuration window
Displays the TPIU.state configuration window.
See also
■ TPIU ■ TPIU.CLEAR ■ TPIU.IGNOREZEROS ■ TPIU.NOFLUSH ■ TPIU.PortClock ■ TPIU.PortMode ■ TPIU.PortSize ■ TPIU.RefClock ■ TPIU.Register ■ TPIU.RESet ■ TPIU.SWVPrescaler ■ TPIU.SWVZEROS ■ TPIU.SyncPeriod
Format: TPIU.RESet
Format: TPIU.state
A For descriptions of the commands in the TPIU.state window, please refer to the TPIU.* commands in this chapter. Example: For information about the SyncPeriod box, see TPIU.SyncPeriod.
Exceptions:• The setting TPIU.ON and TPIU.OFF is read-only. The setting depends on the selected trace
mode (Analyzer, Onchip, ...).• The Trace button opens the main trace control window (Trace.state)• The List button the main trace list window (Trace.List).
A
General Commands Reference Guide T 104 ©1989-2019 Lauterbach GmbH
TPIU.SWVPrescaler Set up SWV prescaler
Default: 1.
In case of TPIU.PortMode NRZ, the bitrate of the Serial Wire Viewer / Serial Wire Output is derived by dividing the CPU frequency. The command TPIU.SWVPrescaler sets up the divisor, which can range from 0x1 to 0x1000 (1. to 4096.).
Examples:
See also
■ TPIU ■ TPIU.state
TPIU.SWVZEROS Workaround for a chip bug
Default: OFF.
Activates a workaround for a chip bug affecting SWV/SWO data of a certain device.
See also
■ TPIU ■ TPIU.state
Format: TPIU.SWVPrescaler <divisor>
TPIU.PortMode NRZTPIU.SWVPrescaler 7. ; NRZ coding at a 7th of the CPU clock
TPIU.PortMode NRZTPIU.SWVPrescaler 10. ; NRZ coding at a 10th of the CPU clock
Format: TPIU.SWVZEROS [ON | OFF]
General Commands Reference Guide T 105 ©1989-2019 Lauterbach GmbH
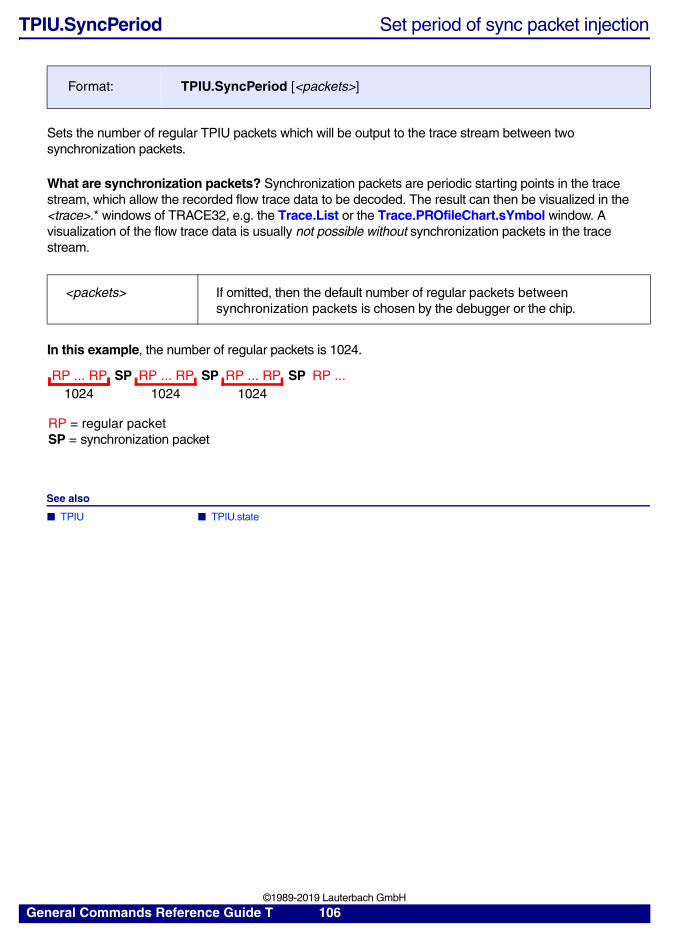
TPIU.SyncPeriod Set period of sync packet injection
Sets the number of regular TPIU packets which will be output to the trace stream between two synchronization packets.
What are synchronization packets? Synchronization packets are periodic starting points in the trace stream, which allow the recorded flow trace data to be decoded. The result can then be visualized in the <trace>.* windows of TRACE32, e.g. the Trace.List or the Trace.PROfileChart.sYmbol window. A visualization of the flow trace data is usually not possible without synchronization packets in the trace stream.
In this example, the number of regular packets is 1024.
See also
■ TPIU ■ TPIU.state
Format: TPIU.SyncPeriod [<packets>]
<packets> If omitted, then the default number of regular packets between synchronization packets is chosen by the debugger or the chip.
RP ... RP SP RP ... RP SP RP ... RP SP RP ...
RP = regular packetSP = synchronization packet
1024 10241024
General Commands Reference Guide T 106 ©1989-2019 Lauterbach GmbH
TPU
TPU.BASE Base address
See command TPU.BASE in 'TPU Debugger' (tpu.pdf, page 4).
TPU.Break Break TPU
See command TPU.Break in 'TPU Debugger' (tpu.pdf, page 10).
TPU.Dump Memory display
See command TPU.Dump in 'TPU Debugger' (tpu.pdf, page 8).
TPU.Go Start TPU
See command TPU.Go in 'TPU Debugger' (tpu.pdf, page 10).
TPU.Register.ALL Register operation mode
See command TPU.Register.ALL in 'TPU Debugger' (tpu.pdf, page 5).
TPU.Register.NEWSTEP New debugging mode
See command TPU.Register.NEWSTEP in 'TPU Debugger' (tpu.pdf, page 6).
TPU.Register.Set Register modification
See command TPU.Register.Set in 'TPU Debugger' (tpu.pdf, page 8).
General Commands Reference Guide T 107 ©1989-2019 Lauterbach GmbH
TPU.Register.view Register display
See command TPU.Register.view in 'TPU Debugger' (tpu.pdf, page 7).
TPU.RESet Disable TPU debugger
See command TPU.RESet in 'TPU Debugger' (tpu.pdf, page 11).
TPU.SCAN Scanning TPU
See command TPU.SCAN in 'TPU Debugger' (tpu.pdf, page 4).
TPU.SELect Select TPU for debugging
See command TPU.SELect in 'TPU Debugger' (tpu.pdf, page 11).
TPU.Step Single step TPU
See command TPU.Step in 'TPU Debugger' (tpu.pdf, page 11).
TPU.view View TPU channels
See command TPU.view in 'TPU Debugger' (tpu.pdf, page 5).
General Commands Reference Guide T 108 ©1989-2019 Lauterbach GmbH
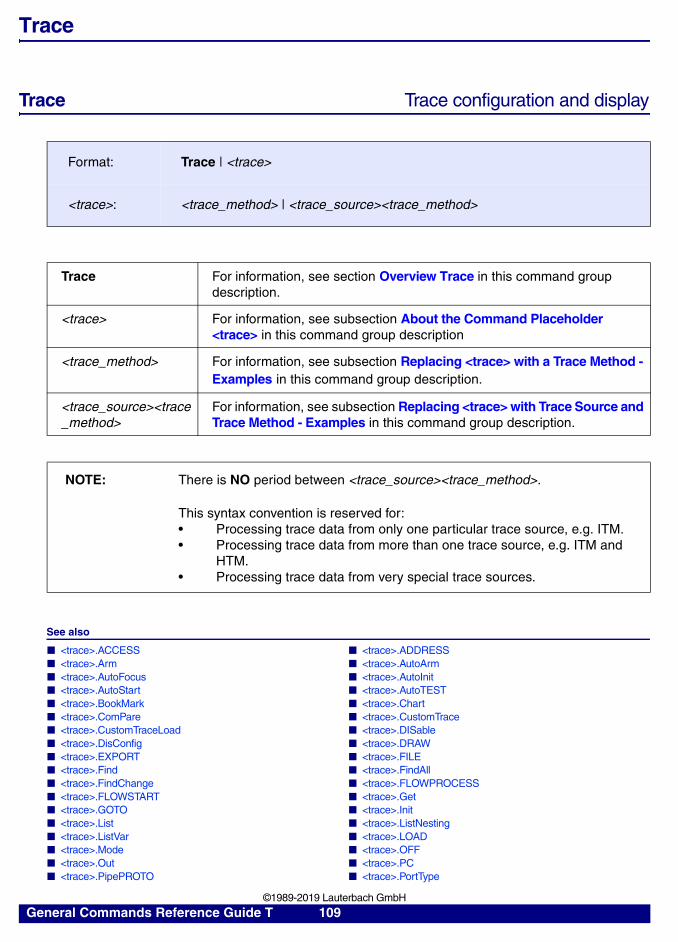
Trace
Trace Trace configuration and display
See also
■ <trace>.ACCESS ■ <trace>.ADDRESS ■ <trace>.Arm ■ <trace>.AutoArm ■ <trace>.AutoFocus ■ <trace>.AutoInit ■ <trace>.AutoStart ■ <trace>.AutoTEST ■ <trace>.BookMark ■ <trace>.Chart ■ <trace>.ComPare ■ <trace>.CustomTrace ■ <trace>.CustomTraceLoad ■ <trace>.DISable ■ <trace>.DisConfig ■ <trace>.DRAW ■ <trace>.EXPORT ■ <trace>.FILE ■ <trace>.Find ■ <trace>.FindAll ■ <trace>.FindChange ■ <trace>.FLOWPROCESS ■ <trace>.FLOWSTART ■ <trace>.Get ■ <trace>.GOTO ■ <trace>.Init ■ <trace>.List ■ <trace>.ListNesting ■ <trace>.ListVar ■ <trace>.LOAD ■ <trace>.Mode ■ <trace>.OFF ■ <trace>.Out ■ <trace>.PC ■ <trace>.PipePROTO ■ <trace>.PortType
Format: Trace | <trace>
<trace>: <trace_method> | <trace_source><trace_method>
Trace For information, see section Overview Trace in this command group description.
<trace> For information, see subsection About the Command Placeholder <trace> in this command group description
<trace_method> For information, see subsection Replacing <trace> with a Trace Method - Examples in this command group description.
<trace_source><trace_method>
For information, see subsection Replacing <trace> with Trace Source and Trace Method - Examples in this command group description.
NOTE: There is NO period between <trace_source><trace_method>.
This syntax convention is reserved for:• Processing trace data from only one particular trace source, e.g. ITM.• Processing trace data from more than one trace source, e.g. ITM and
HTM.• Processing trace data from very special trace sources.
General Commands Reference Guide T 109 ©1989-2019 Lauterbach GmbH
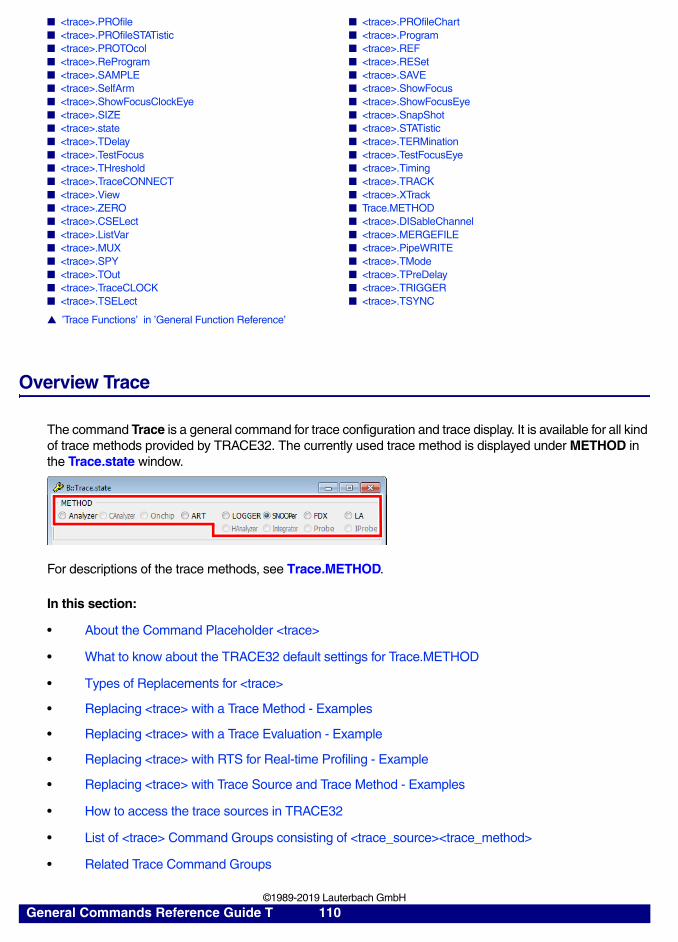
■ <trace>.PROfile ■ <trace>.PROfileChart ■ <trace>.PROfileSTATistic ■ <trace>.Program ■ <trace>.PROTOcol ■ <trace>.REF ■ <trace>.ReProgram ■ <trace>.RESet ■ <trace>.SAMPLE ■ <trace>.SAVE ■ <trace>.SelfArm ■ <trace>.ShowFocus ■ <trace>.ShowFocusClockEye ■ <trace>.ShowFocusEye ■ <trace>.SIZE ■ <trace>.SnapShot ■ <trace>.state ■ <trace>.STATistic ■ <trace>.TDelay ■ <trace>.TERMination ■ <trace>.TestFocus ■ <trace>.TestFocusEye ■ <trace>.THreshold ■ <trace>.Timing ■ <trace>.TraceCONNECT ■ <trace>.TRACK ■ <trace>.View ■ <trace>.XTrack ■ <trace>.ZERO ■ Trace.METHOD ■ <trace>.CSELect ■ <trace>.DISableChannel ■ <trace>.ListVar ■ <trace>.MERGEFILE ■ <trace>.MUX ■ <trace>.PipeWRITE ■ <trace>.SPY ■ <trace>.TMode ■ <trace>.TOut ■ <trace>.TPreDelay ■ <trace>.TraceCLOCK ■ <trace>.TRIGGER ■ <trace>.TSELect ■ <trace>.TSYNC
▲ ’Trace Functions’ in ’General Function Reference’
Overview Trace
The command Trace is a general command for trace configuration and trace display. It is available for all kind of trace methods provided by TRACE32. The currently used trace method is displayed under METHOD in the Trace.state window.
For descriptions of the trace methods, see Trace.METHOD.
In this section:
• About the Command Placeholder <trace>
• What to know about the TRACE32 default settings for Trace.METHOD
• Types of Replacements for <trace>
• Replacing <trace> with a Trace Method - Examples
• Replacing <trace> with a Trace Evaluation - Example
• Replacing <trace> with RTS for Real-time Profiling - Example
• Replacing <trace> with Trace Source and Trace Method - Examples
• How to access the trace sources in TRACE32
• List of <trace> Command Groups consisting of <trace_source><trace_method>
• Related Trace Command Groups
General Commands Reference Guide T 110 ©1989-2019 Lauterbach GmbH
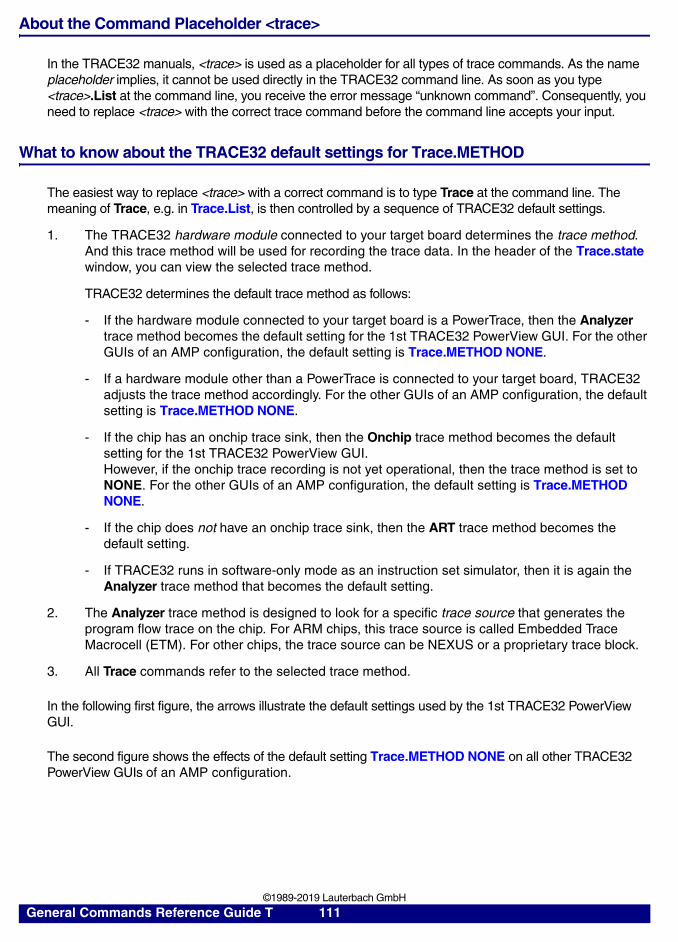
About the Command Placeholder <trace>
In the TRACE32 manuals, <trace> is used as a placeholder for all types of trace commands. As the name placeholder implies, it cannot be used directly in the TRACE32 command line. As soon as you type <trace>.List at the command line, you receive the error message “unknown command”. Consequently, you need to replace <trace> with the correct trace command before the command line accepts your input.
What to know about the TRACE32 default settings for Trace.METHOD
The easiest way to replace <trace> with a correct command is to type Trace at the command line. The meaning of Trace, e.g. in Trace.List, is then controlled by a sequence of TRACE32 default settings.
1. The TRACE32 hardware module connected to your target board determines the trace method. And this trace method will be used for recording the trace data. In the header of the Trace.state window, you can view the selected trace method.
TRACE32 determines the default trace method as follows:
- If the hardware module connected to your target board is a PowerTrace, then the Analyzer trace method becomes the default setting for the 1st TRACE32 PowerView GUI. For the other GUIs of an AMP configuration, the default setting is Trace.METHOD NONE.
- If a hardware module other than a PowerTrace is connected to your target board, TRACE32 adjusts the trace method accordingly. For the other GUIs of an AMP configuration, the default setting is Trace.METHOD NONE.
- If the chip has an onchip trace sink, then the Onchip trace method becomes the default setting for the 1st TRACE32 PowerView GUI. However, if the onchip trace recording is not yet operational, then the trace method is set to NONE. For the other GUIs of an AMP configuration, the default setting is Trace.METHOD NONE.
- If the chip does not have an onchip trace sink, then the ART trace method becomes the default setting.
- If TRACE32 runs in software-only mode as an instruction set simulator, then it is again the Analyzer trace method that becomes the default setting.
2. The Analyzer trace method is designed to look for a specific trace source that generates the program flow trace on the chip. For ARM chips, this trace source is called Embedded Trace Macrocell (ETM). For other chips, the trace source can be NEXUS or a proprietary trace block.
3. All Trace commands refer to the selected trace method.
In the following first figure, the arrows illustrate the default settings used by the 1st TRACE32 PowerView GUI.
The second figure shows the effects of the default setting Trace.METHOD NONE on all other TRACE32 PowerView GUIs of an AMP configuration.
General Commands Reference Guide T 111 ©1989-2019 Lauterbach GmbH
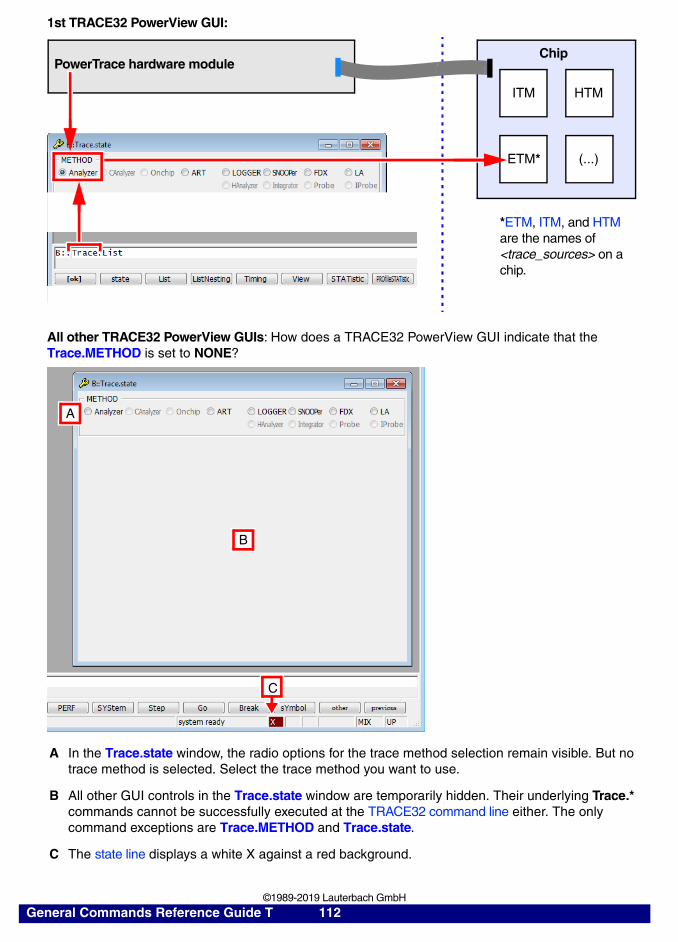
1st TRACE32 PowerView GUI:
All other TRACE32 PowerView GUIs: How does a TRACE32 PowerView GUI indicate that the Trace.METHOD is set to NONE?
A In the Trace.state window, the radio options for the trace method selection remain visible. But no trace method is selected. Select the trace method you want to use.
B All other GUI controls in the Trace.state window are temporarily hidden. Their underlying Trace.* commands cannot be successfully executed at the TRACE32 command line either. The only command exceptions are Trace.METHOD and Trace.state.
C The state line displays a white X against a red background.
ETM* (...)
ITM HTM
ChipPowerTrace hardware module
*ETM, ITM, and HTM are the names of <trace_sources> on a chip.
A
B
C
General Commands Reference Guide T 112 ©1989-2019 Lauterbach GmbH
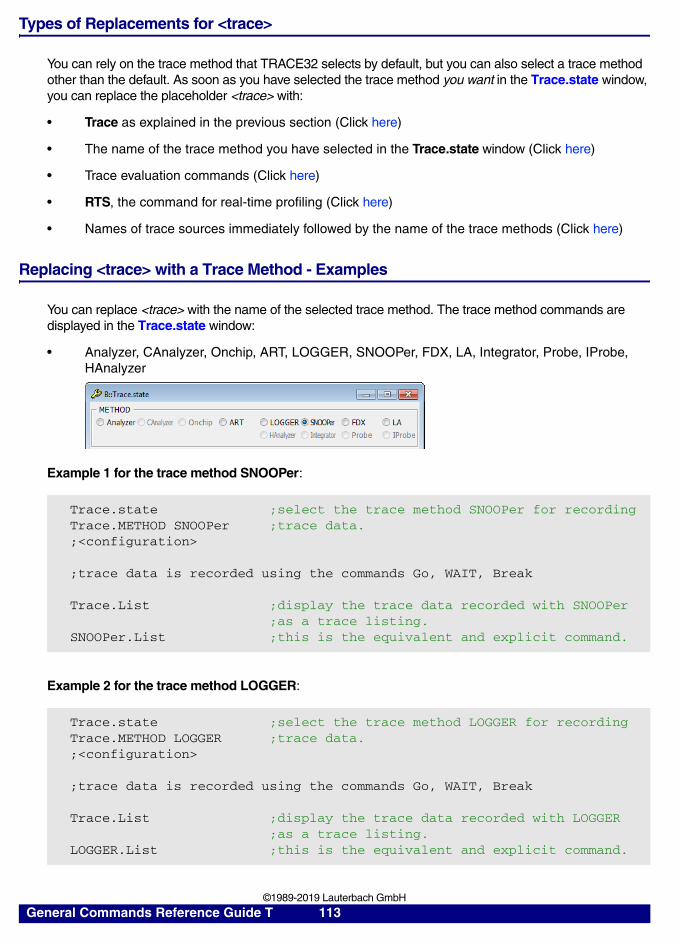
Types of Replacements for <trace>
You can rely on the trace method that TRACE32 selects by default, but you can also select a trace method other than the default. As soon as you have selected the trace method you want in the Trace.state window, you can replace the placeholder <trace> with:
• Trace as explained in the previous section (Click here)
• The name of the trace method you have selected in the Trace.state window (Click here)
• Trace evaluation commands (Click here)
• RTS, the command for real-time profiling (Click here)
• Names of trace sources immediately followed by the name of the trace methods (Click here)
Replacing <trace> with a Trace Method - Examples
You can replace <trace> with the name of the selected trace method. The trace method commands are displayed in the Trace.state window:
• Analyzer, CAnalyzer, Onchip, ART, LOGGER, SNOOPer, FDX, LA, Integrator, Probe, IProbe, HAnalyzer
Example 1 for the trace method SNOOPer:
Example 2 for the trace method LOGGER:
Trace.state ;select the trace method SNOOPer for recordingTrace.METHOD SNOOPer ;trace data.;<configuration>
;trace data is recorded using the commands Go, WAIT, Break
Trace.List ;display the trace data recorded with SNOOPer ;as a trace listing.SNOOPer.List ;this is the equivalent and explicit command.
Trace.state ;select the trace method LOGGER for recordingTrace.METHOD LOGGER ;trace data.;<configuration>
;trace data is recorded using the commands Go, WAIT, Break
Trace.List ;display the trace data recorded with LOGGER ;as a trace listing.LOGGER.List ;this is the equivalent and explicit command.
General Commands Reference Guide T 113 ©1989-2019 Lauterbach GmbH
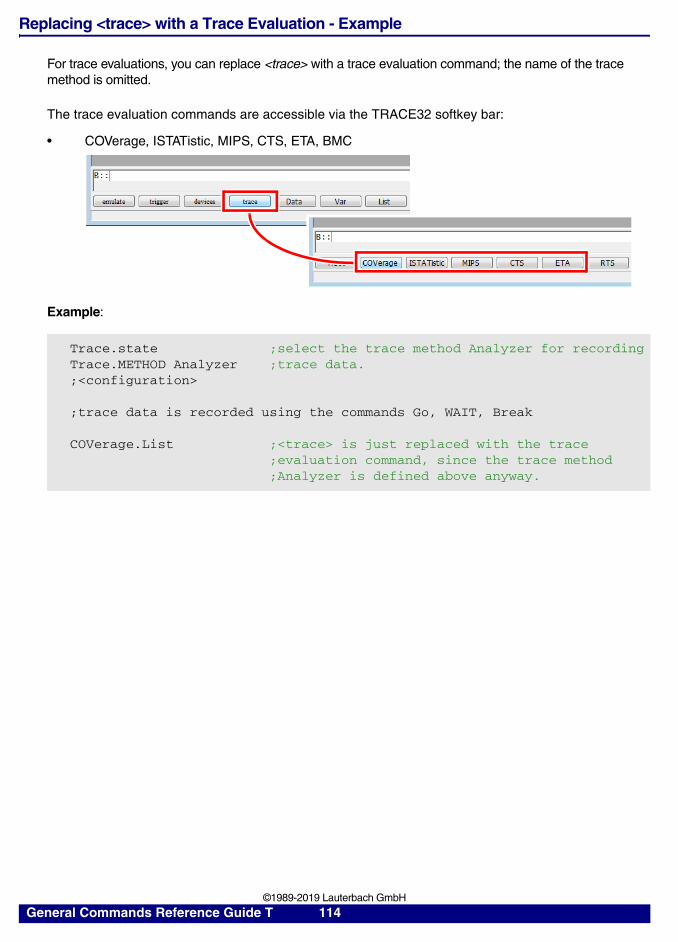
Replacing <trace> with a Trace Evaluation - Example
For trace evaluations, you can replace <trace> with a trace evaluation command; the name of the trace method is omitted.
The trace evaluation commands are accessible via the TRACE32 softkey bar:
• COVerage, ISTATistic, MIPS, CTS, ETA, BMC
Example:
Trace.state ;select the trace method Analyzer for recordingTrace.METHOD Analyzer ;trace data.;<configuration>
;trace data is recorded using the commands Go, WAIT, Break
COVerage.List ;<trace> is just replaced with the trace ;evaluation command, since the trace method ;Analyzer is defined above anyway.
General Commands Reference Guide T 114 ©1989-2019 Lauterbach GmbH
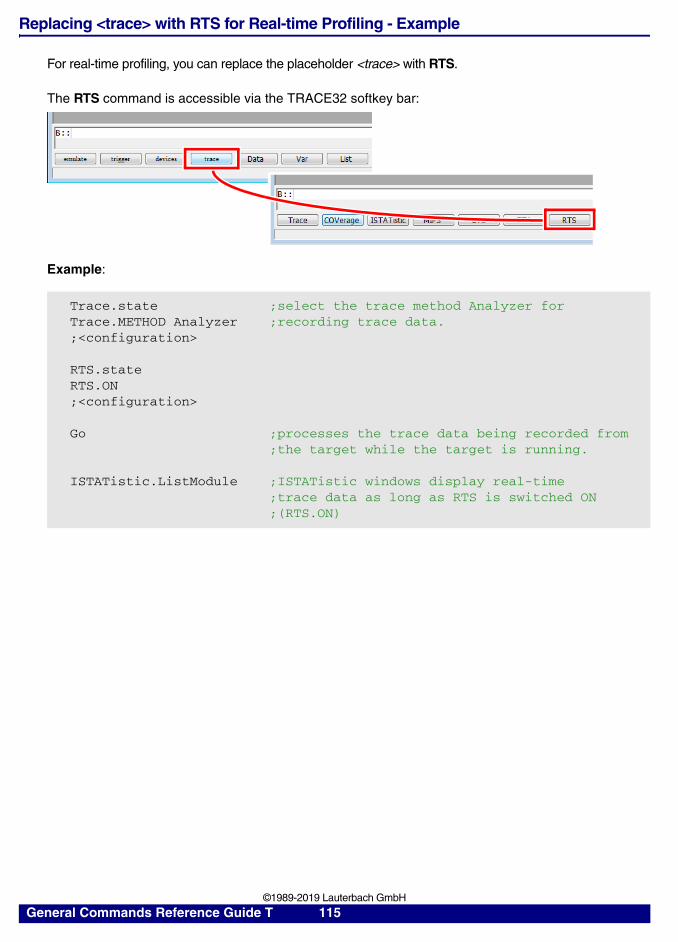
Replacing <trace> with RTS for Real-time Profiling - Example
For real-time profiling, you can replace the placeholder <trace> with RTS.
The RTS command is accessible via the TRACE32 softkey bar:
Example:
Trace.state ;select the trace method Analyzer forTrace.METHOD Analyzer ;recording trace data.;<configuration>
RTS.stateRTS.ON;<configuration>
Go ;processes the trace data being recorded from ;the target while the target is running.
ISTATistic.ListModule ;ISTATistic windows display real-time ;trace data as long as RTS is switched ON ;(RTS.ON)
General Commands Reference Guide T 115 ©1989-2019 Lauterbach GmbH
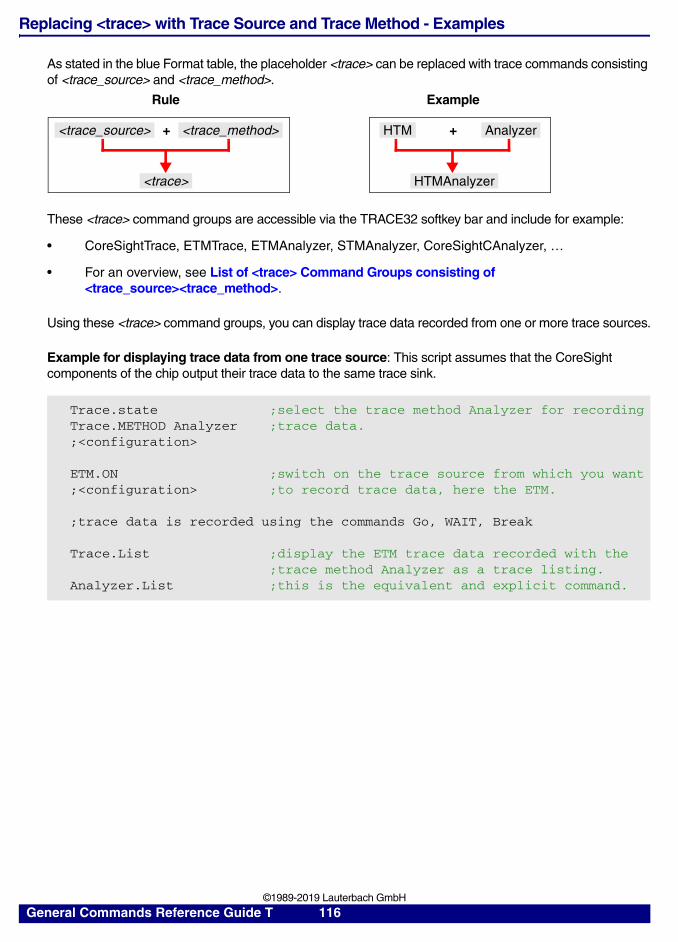
Replacing <trace> with Trace Source and Trace Method - Examples
As stated in the blue Format table, the placeholder <trace> can be replaced with trace commands consisting of <trace_source> and <trace_method>.
These <trace> command groups are accessible via the TRACE32 softkey bar and include for example:
• CoreSightTrace, ETMTrace, ETMAnalyzer, STMAnalyzer, CoreSightCAnalyzer, …
• For an overview, see List of <trace> Command Groups consisting of <trace_source><trace_method>.
Using these <trace> command groups, you can display trace data recorded from one or more trace sources.
Example for displaying trace data from one trace source: This script assumes that the CoreSight components of the chip output their trace data to the same trace sink.
Trace.state ;select the trace method Analyzer for recordingTrace.METHOD Analyzer ;trace data.;<configuration>
ETM.ON ;switch on the trace source from which you want;<configuration> ;to record trace data, here the ETM.
;trace data is recorded using the commands Go, WAIT, Break
Trace.List ;display the ETM trace data recorded with the ;trace method Analyzer as a trace listing.Analyzer.List ;this is the equivalent and explicit command.
<trace_source> <trace_method>
<trace>
+ HTM Analyzer
HTMAnalyzer
+
Rule Example
General Commands Reference Guide T 116 ©1989-2019 Lauterbach GmbH
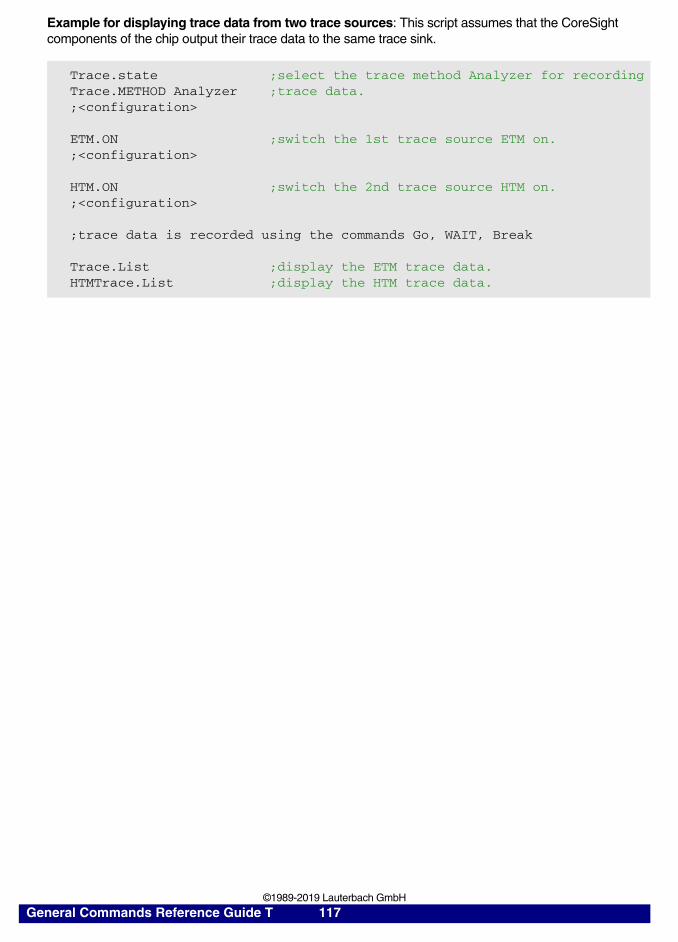
Example for displaying trace data from two trace sources: This script assumes that the CoreSight components of the chip output their trace data to the same trace sink.
Trace.state ;select the trace method Analyzer for recordingTrace.METHOD Analyzer ;trace data.;<configuration>
ETM.ON ;switch the 1st trace source ETM on.;<configuration>
HTM.ON ;switch the 2nd trace source HTM on.;<configuration>
;trace data is recorded using the commands Go, WAIT, Break
Trace.List ;display the ETM trace data.HTMTrace.List ;display the HTM trace data.
General Commands Reference Guide T 117 ©1989-2019 Lauterbach GmbH
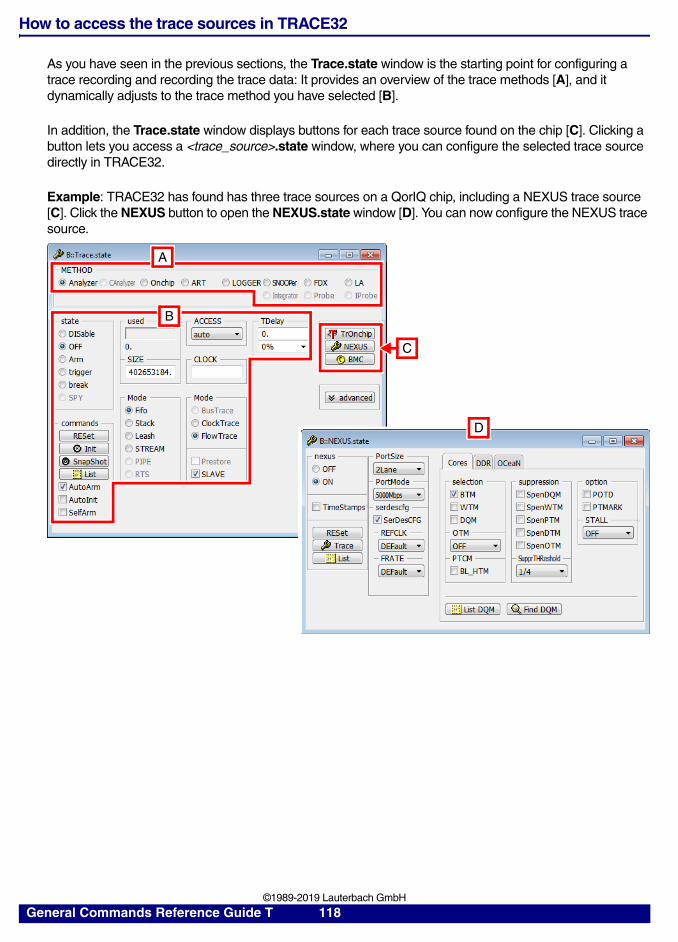
How to access the trace sources in TRACE32
As you have seen in the previous sections, the Trace.state window is the starting point for configuring a trace recording and recording the trace data: It provides an overview of the trace methods [A], and it dynamically adjusts to the trace method you have selected [B].
In addition, the Trace.state window displays buttons for each trace source found on the chip [C]. Clicking a button lets you access a <trace_source>.state window, where you can configure the selected trace source directly in TRACE32.
Example: TRACE32 has found has three trace sources on a QorIQ chip, including a NEXUS trace source [C]. Click the NEXUS button to open the NEXUS.state window [D]. You can now configure the NEXUS trace source.
C
B
D
A
General Commands Reference Guide T 118 ©1989-2019 Lauterbach GmbH
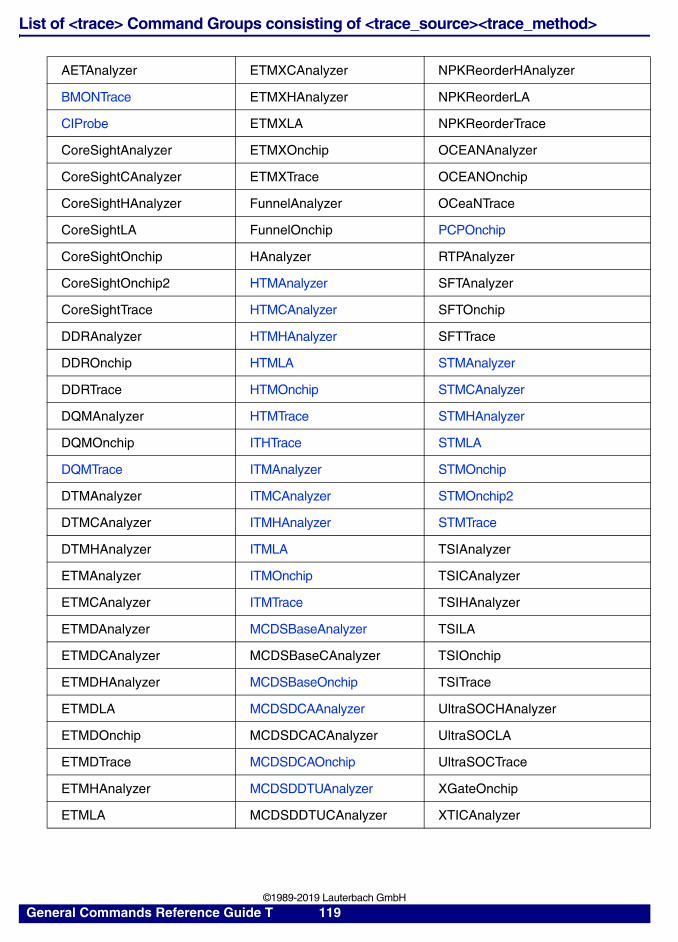
List of <trace> Command Groups consisting of <trace_source><trace_method>
AETAnalyzer ETMXCAnalyzer NPKReorderHAnalyzer
BMONTrace ETMXHAnalyzer NPKReorderLA
CIProbe ETMXLA NPKReorderTrace
CoreSightAnalyzer ETMXOnchip OCEANAnalyzer
CoreSightCAnalyzer ETMXTrace OCEANOnchip
CoreSightHAnalyzer FunnelAnalyzer OCeaNTrace
CoreSightLA FunnelOnchip PCPOnchip
CoreSightOnchip HAnalyzer RTPAnalyzer
CoreSightOnchip2 HTMAnalyzer SFTAnalyzer
CoreSightTrace HTMCAnalyzer SFTOnchip
DDRAnalyzer HTMHAnalyzer SFTTrace
DDROnchip HTMLA STMAnalyzer
DDRTrace HTMOnchip STMCAnalyzer
DQMAnalyzer HTMTrace STMHAnalyzer
DQMOnchip ITHTrace STMLA
DQMTrace ITMAnalyzer STMOnchip
DTMAnalyzer ITMCAnalyzer STMOnchip2
DTMCAnalyzer ITMHAnalyzer STMTrace
DTMHAnalyzer ITMLA TSIAnalyzer
ETMAnalyzer ITMOnchip TSICAnalyzer
ETMCAnalyzer ITMTrace TSIHAnalyzer
ETMDAnalyzer MCDSBaseAnalyzer TSILA
ETMDCAnalyzer MCDSBaseCAnalyzer TSIOnchip
ETMDHAnalyzer MCDSBaseOnchip TSITrace
ETMDLA MCDSDCAAnalyzer UltraSOCHAnalyzer
ETMDOnchip MCDSDCACAnalyzer UltraSOCLA
ETMDTrace MCDSDCAOnchip UltraSOCTrace
ETMHAnalyzer MCDSDDTUAnalyzer XGateOnchip
ETMLA MCDSDDTUCAnalyzer XTICAnalyzer
General Commands Reference Guide T 119 ©1989-2019 Lauterbach GmbH
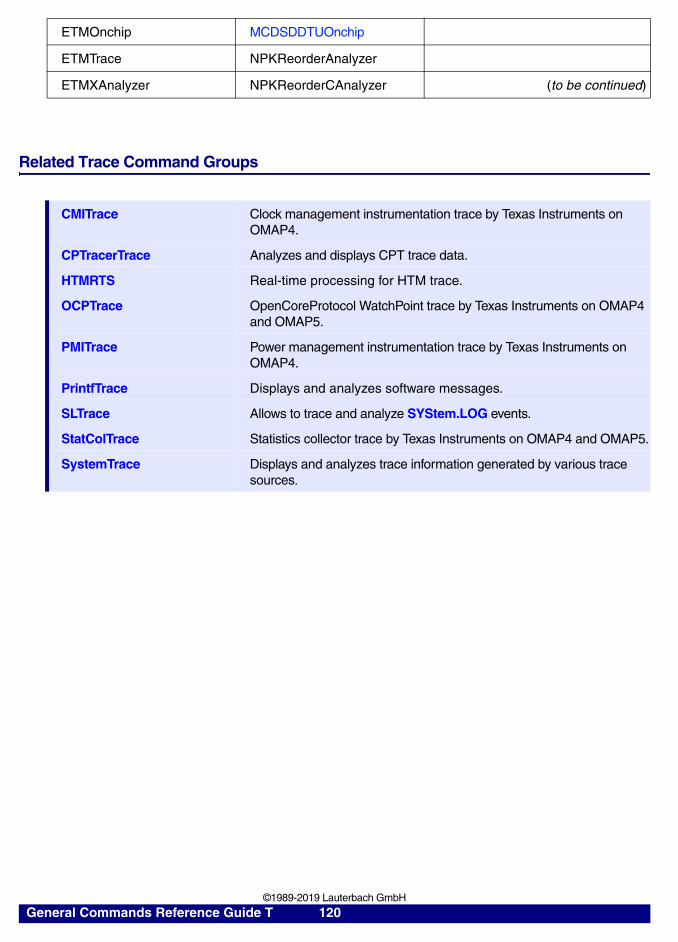
Related Trace Command Groups
ETMOnchip MCDSDDTUOnchip
ETMTrace NPKReorderAnalyzer
ETMXAnalyzer NPKReorderCAnalyzer (to be continued)
CMITrace Clock management instrumentation trace by Texas Instruments on OMAP4.
CPTracerTrace Analyzes and displays CPT trace data.
HTMRTS Real-time processing for HTM trace.
OCPTrace OpenCoreProtocol WatchPoint trace by Texas Instruments on OMAP4 and OMAP5.
PMITrace Power management instrumentation trace by Texas Instruments on OMAP4.
PrintfTrace Displays and analyzes software messages.
SLTrace Allows to trace and analyze SYStem.LOG events.
StatColTrace Statistics collector trace by Texas Instruments on OMAP4 and OMAP5.
SystemTrace Displays and analyzes trace information generated by various trace sources.
General Commands Reference Guide T 120 ©1989-2019 Lauterbach GmbH
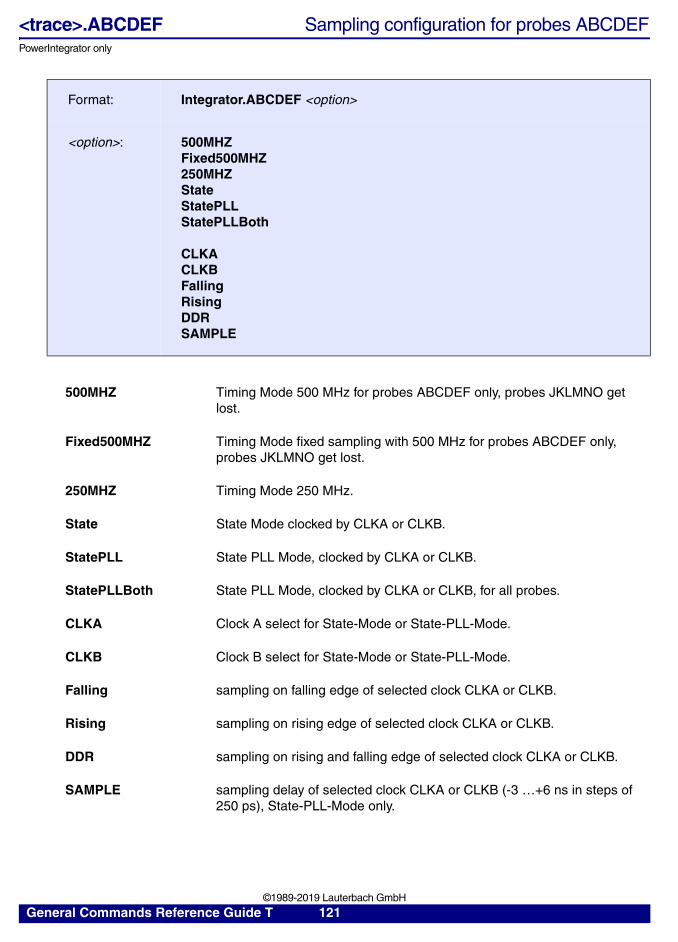
<trace>.ABCDEF Sampling configuration for probes ABCDEFPowerIntegrator only
Format: Integrator.ABCDEF <option>
<option>: 500MHZFixed500MHZ250MHZStateStatePLLStatePLLBoth
CLKACLKBFallingRisingDDRSAMPLE
500MHZ Timing Mode 500 MHz for probes ABCDEF only, probes JKLMNO get lost.
Fixed500MHZ Timing Mode fixed sampling with 500 MHz for probes ABCDEF only, probes JKLMNO get lost.
250MHZ Timing Mode 250 MHz.
State State Mode clocked by CLKA or CLKB.
StatePLL State PLL Mode, clocked by CLKA or CLKB.
StatePLLBoth State PLL Mode, clocked by CLKA or CLKB, for all probes.
CLKA Clock A select for State-Mode or State-PLL-Mode.
CLKB Clock B select for State-Mode or State-PLL-Mode.
Falling sampling on falling edge of selected clock CLKA or CLKB.
Rising sampling on rising edge of selected clock CLKA or CLKB.
DDR sampling on rising and falling edge of selected clock CLKA or CLKB.
SAMPLE sampling delay of selected clock CLKA or CLKB (-3 …+6 ns in steps of 250 ps), State-PLL-Mode only.
General Commands Reference Guide T 121 ©1989-2019 Lauterbach GmbH
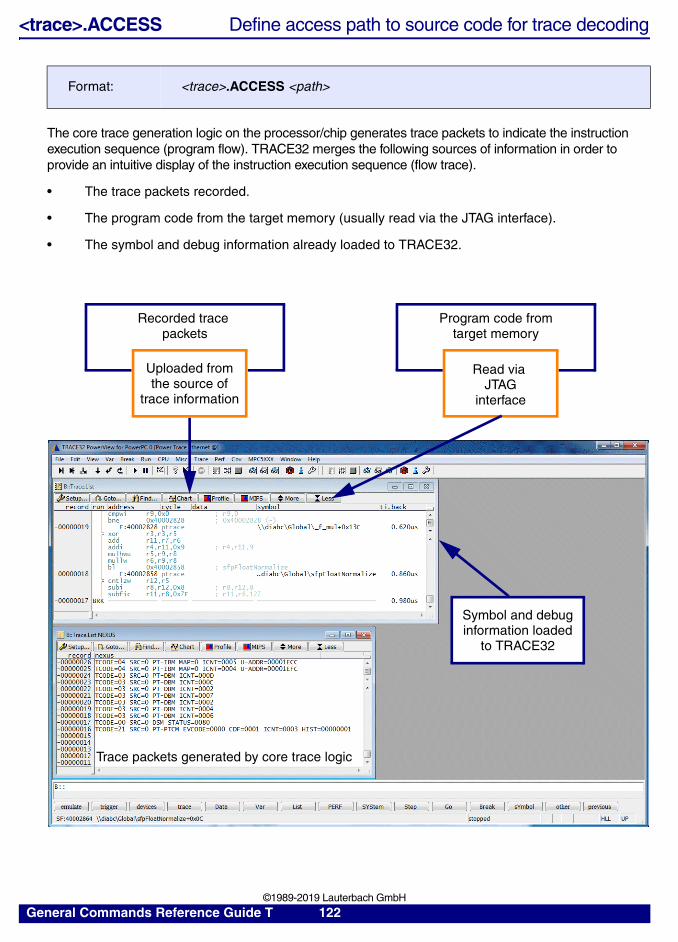
<trace>.ACCESS Define access path to source code for trace decoding
The core trace generation logic on the processor/chip generates trace packets to indicate the instruction execution sequence (program flow). TRACE32 merges the following sources of information in order to provide an intuitive display of the instruction execution sequence (flow trace).
• The trace packets recorded.
• The program code from the target memory (usually read via the JTAG interface).
• The symbol and debug information already loaded to TRACE32.
Format: <trace>.ACCESS <path>
Symbol and debuginformation loaded
to TRACE32
Recorded trace packets
Uploaded fromthe source of
trace information
Program code fromtarget memory
Read via JTAG
interface
Trace packets generated by core trace logic
General Commands Reference Guide T 122 ©1989-2019 Lauterbach GmbH
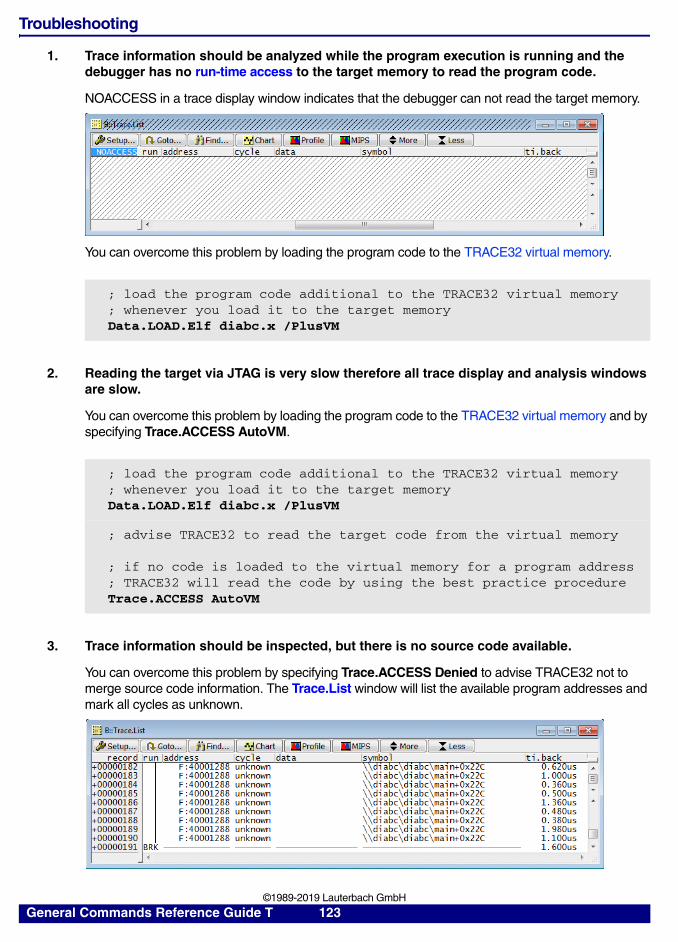
Troubleshooting
1. Trace information should be analyzed while the program execution is running and the debugger has no run-time access to the target memory to read the program code.
NOACCESS in a trace display window indicates that the debugger can not read the target memory.
You can overcome this problem by loading the program code to the TRACE32 virtual memory.
2. Reading the target via JTAG is very slow therefore all trace display and analysis windows are slow.
You can overcome this problem by loading the program code to the TRACE32 virtual memory and by specifying Trace.ACCESS AutoVM.
3. Trace information should be inspected, but there is no source code available.
You can overcome this problem by specifying Trace.ACCESS Denied to advise TRACE32 not to merge source code information. The Trace.List window will list the available program addresses and mark all cycles as unknown.
; load the program code additional to the TRACE32 virtual memory; whenever you load it to the target memoryData.LOAD.Elf diabc.x /PlusVM
; load the program code additional to the TRACE32 virtual memory; whenever you load it to the target memoryData.LOAD.Elf diabc.x /PlusVM
; advise TRACE32 to read the target code from the virtual memory
; if no code is loaded to the virtual memory for a program address; TRACE32 will read the code by using the best practice procedureTrace.ACCESS AutoVM
General Commands Reference Guide T 123 ©1989-2019 Lauterbach GmbH
Recommended access paths:
Rarely used access paths:
See also
■ <trace>.state ■ Trace
<trace>.ADDRESS Software trace address
LOGGER.ADDRESS defines the address of the logger trace buffer control block in target memory.
See also
■ <trace>.state ■ Trace
auto TRACE32 uses its own best practice procedure to read the program code. (Note: For the ARM architecture this mode is usually not using the DualPort access.)
AutoVM If the program code for a program address is available via the TRACE32 virtual memory it is read from there. Otherwise the best practice procedure is used.
VM The program code is always read from the TRACE32 virtual memory.
Denied No source code information is read.
OVS Code overlays are handled by the best practice procedure. If the best practice procedure does not deliver correct results, you can advise TRACE32 to read the program code by using the overlay table.
CPU Advise TRACE32 to read the code via the CPU/core.
DualPort Advise TRACE32 to read the code via the run-time access to the target memory.
Format: <trace>.ADDRESS [<address>]
General Commands Reference Guide T 124 ©1989-2019 Lauterbach GmbH
<trace>.Arm Arm the trace
The trace memory and if available the trigger unit are prepared for recording and triggering. It is not possible to read the trace contents while the trace is in Arm state.
For most trace methods it is possible to AutoArm (<trace>.AutoArm) the trace. That means:
• Recording and triggering are prepared whenever the program execution is started.
• Recording and triggering are stopped whenever the program execution is stopped.
This is the default setting.
It is also possible to manually switch off the trace (<trace>.OFF) to read the trace contents and arm it again afterwards.
See also
■ <trace>.AutoArm ■ <trace>.AutoStart ■ <trace>.Init ■ <trace>.state ■ Trace ■ CIProbe ❏ Analyzer.STATE() ❏ SNOOPer.STATE()
▲ ’Emulator Functions’ in ’FIRE User’s Guide’▲ ’Release Information’ in ’Release History’
Format: <trace>.Arm
General Commands Reference Guide T 125 ©1989-2019 Lauterbach GmbH
<trace>.AutoArm Arm automatically
Default: <trace>.AutoArm ON.
• Recording and if available triggering is prepared whenever the program execution is started.
• Recording and if available triggering is stopped whenever the program execution is stopped.
See also
■ <trace>.Arm ■ <trace>.state ■ Trace ■ CIProbe ❏ Analyzer.STATE() ❏ SNOOPer.STATE()
▲ ’Emulator Functions’ in ’FIRE User’s Guide’
<trace>.AutoFocus Calibrate AUTOFOCUS preprocessor
The command Trace.AutoFocus configures an AutoFocus preprocessor for an error-free sampling on a high-speed trace port.
For preprocessors without AUTOFOCUS technology, but adjustable reference voltage, this command will modify the reference voltage (see Trace.THreshold) and try to find a value were the trace capture is free of errors. This might take anywhere from a few up to 30 s.
If available the test pattern generator of the trace port is used to generate the trace data for the auto-configuration. Otherwise a test program is loaded and started by TRACE32.
If a test program is used, TRACE32 attempts to load the test program to the memory addressed by the PC or the stack pointer. It is also possible to define an <address_range> for the test program.
Format: <trace>.AutoArm [ON | OFF]
Format: <trace>.AutoFocus [<address_range>] [/<option>]
<option>: AccumulateKEEPALTERNATENoTHreshold
Trace.AutoFocus ; start the auto-configuration
Trace.AutoFocus 0x24000000++0xfff ; start auto-configuration, load; the test program to address; 0x24000000
General Commands Reference Guide T 126 ©1989-2019 Lauterbach GmbH
If TRACE32 is unable to load the test program the following error message is displayed: “Don‘t know where to execute the test code”.
By default the original RAM contents is restored after the auto-configuration and the trace contents is deleted.
The option /Accumulate allows to overlay several auto-configurations. It is recommended to proceed as follows:
1. Execute the command Trace.AutoFocus at the highest CPU clock frequency.
2. Reduce the CPU clock frequency and execute the command Trace.AutoFocus /Accumulate.
If a preprocessor with AUTOFOCUS technology is used, the clock and data delays are adjusted, while the termination voltage, the clock reference voltage and the data reference voltage remain unchanged.
3. Repeat step 2 for all relevant frequencies.If
Accumulate If the application program varies the CPU clock frequency, this affects also the trace port and the auto-configuration. In such a case it is recommended to overlay the auto-configurations for all relevant CPU clock frequencies by using the option /Accumulate.
KEEP When the auto-configuration is completed, the test pattern generator/test program is started once again to test the correctness of the trace recording. After this test the trace is cleared and an eventually loaded test program is removed from the target RAM.With the option /KEEP the test trace is not cleared and can be viewed with the Trace.List command. If a test program was loaded by TRACE32 it also remains in the target RAM.
ALTERNATE If the trace port provides a test pattern generator, it is always used for the auto-configuration. The option /ALTERNATE forces TRACE32 to use its own test program.This is recommended e.g. if a CoreSight test pattern generator is not stimulating the TRACECLT signal.
NoTHreshold Do not calibrate the Trace.THreshold reference voltage.
Trace.AutoFocus ; Execute the command for the; highest CPU clock
Trace.AutoFocus /Accumulate ; Re-execute the command for the; next lower CPU clock
…
Trace.AutoFocus /Accumulate ; Re-execute the command for the; lowest relevant CPU clock
General Commands Reference Guide T 127 ©1989-2019 Lauterbach GmbH
A failure in the Trace.AutoFocus command results in a stop of a PRACTICE script. The following workaround can be used to avoid this behavior:
; go to the label error_autofocus: if an error occurred in the script
ON ERROR GOTO error_autofocus
Trace.AutoFocus
; go to the label end: if an error occurred in the script
ON ERROR GOTO end
…
end:
ENDDO
error_autofocus:
PRINT %ERROR "Trace.AutoFocus failed. Script is aborted"
ENDDO
NOTE: The NEXUS AutoFocus adapter does not support this feature.
General Commands Reference Guide T 128 ©1989-2019 Lauterbach GmbH
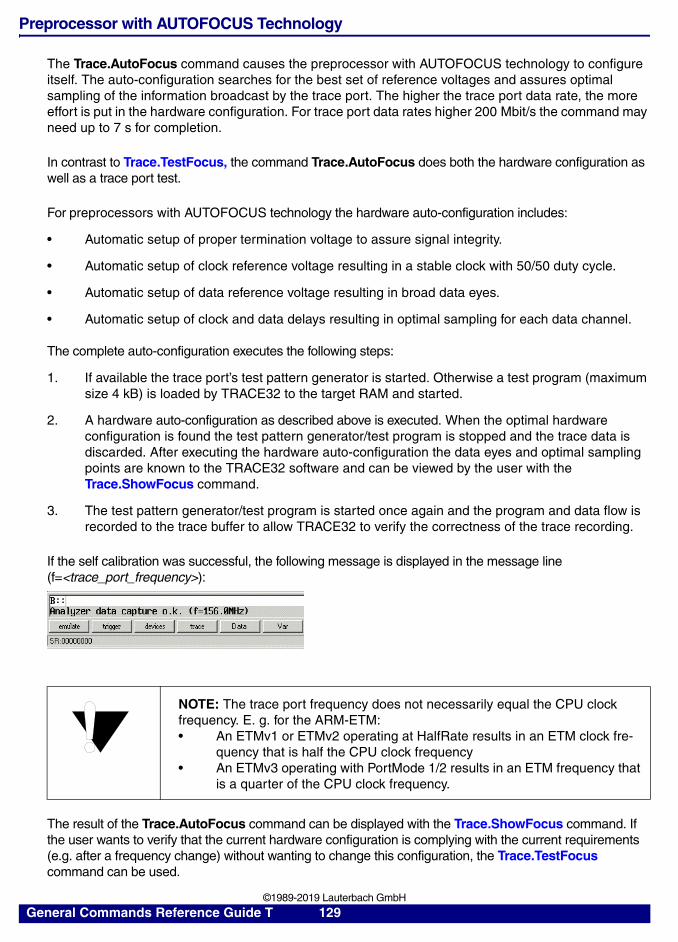
Preprocessor with AUTOFOCUS Technology
The Trace.AutoFocus command causes the preprocessor with AUTOFOCUS technology to configure itself. The auto-configuration searches for the best set of reference voltages and assures optimal sampling of the information broadcast by the trace port. The higher the trace port data rate, the more effort is put in the hardware configuration. For trace port data rates higher 200 Mbit/s the command may need up to 7 s for completion.
In contrast to Trace.TestFocus, the command Trace.AutoFocus does both the hardware configuration as well as a trace port test.
For preprocessors with AUTOFOCUS technology the hardware auto-configuration includes:
• Automatic setup of proper termination voltage to assure signal integrity.
• Automatic setup of clock reference voltage resulting in a stable clock with 50/50 duty cycle.
• Automatic setup of data reference voltage resulting in broad data eyes.
• Automatic setup of clock and data delays resulting in optimal sampling for each data channel.
The complete auto-configuration executes the following steps:
1. If available the trace port’s test pattern generator is started. Otherwise a test program (maximum size 4 kB) is loaded by TRACE32 to the target RAM and started.
2. A hardware auto-configuration as described above is executed. When the optimal hardware configuration is found the test pattern generator/test program is stopped and the trace data is discarded. After executing the hardware auto-configuration the data eyes and optimal sampling points are known to the TRACE32 software and can be viewed by the user with the Trace.ShowFocus command.
3. The test pattern generator/test program is started once again and the program and data flow is recorded to the trace buffer to allow TRACE32 to verify the correctness of the trace recording.
If the self calibration was successful, the following message is displayed in the message line (f=<trace_port_frequency>):
The result of the Trace.AutoFocus command can be displayed with the Trace.ShowFocus command. If the user wants to verify that the current hardware configuration is complying with the current requirements (e.g. after a frequency change) without wanting to change this configuration, the Trace.TestFocus command can be used.
NOTE: The trace port frequency does not necessarily equal the CPU clock frequency. E. g. for the ARM-ETM:• An ETMv1 or ETMv2 operating at HalfRate results in an ETM clock fre-
quency that is half the CPU clock frequency• An ETMv3 operating with PortMode 1/2 results in an ETM frequency that
is a quarter of the CPU clock frequency.
General Commands Reference Guide T 129 ©1989-2019 Lauterbach GmbH
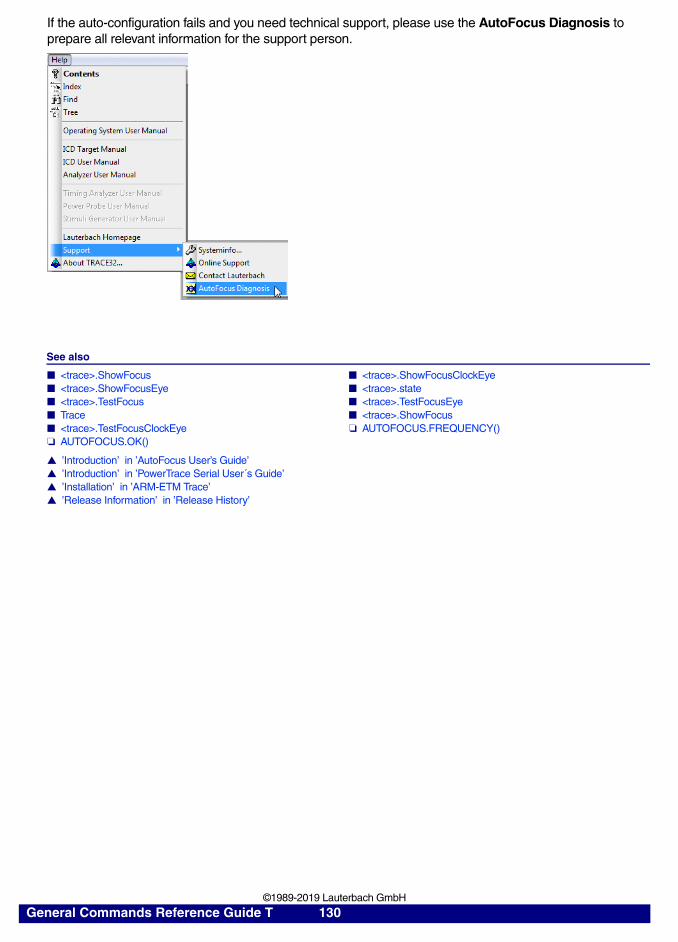
If the auto-configuration fails and you need technical support, please use the AutoFocus Diagnosis to prepare all relevant information for the support person.
See also
■ <trace>.ShowFocus ■ <trace>.ShowFocusClockEye ■ <trace>.ShowFocusEye ■ <trace>.state ■ <trace>.TestFocus ■ <trace>.TestFocusEye ■ Trace ■ <trace>.ShowFocus ■ <trace>.TestFocusClockEye ❏ AUTOFOCUS.FREQUENCY() ❏ AUTOFOCUS.OK()
▲ ’Introduction’ in ’AutoFocus User’s Guide’▲ ’Introduction’ in ’PowerTrace Serial User´s Guide’▲ ’Installation’ in ’ARM-ETM Trace’▲ ’Release Information’ in ’Release History’
General Commands Reference Guide T 130 ©1989-2019 Lauterbach GmbH
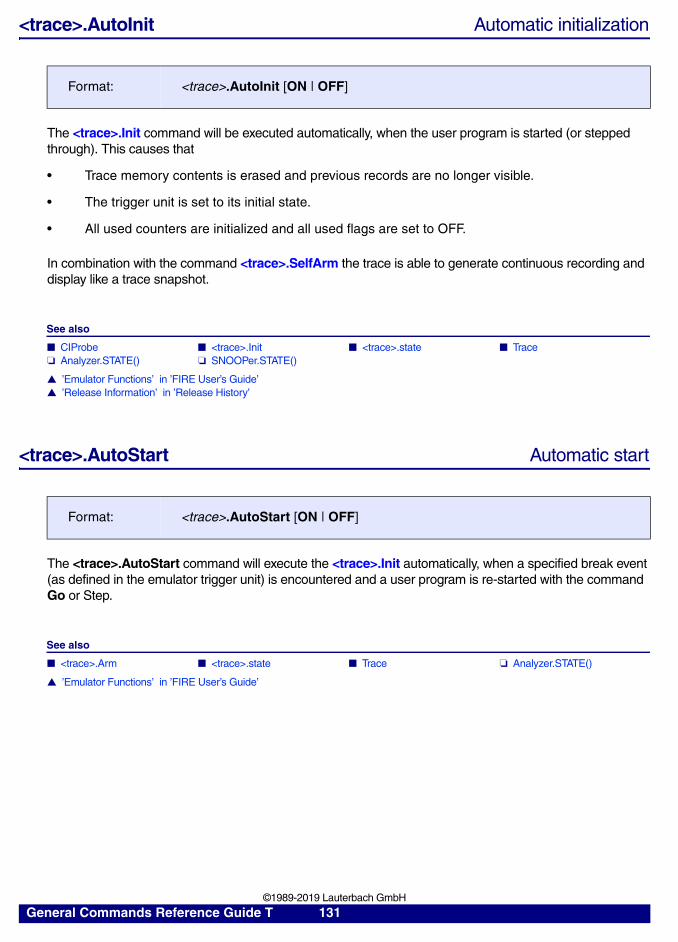
<trace>.AutoInit Automatic initialization
The <trace>.Init command will be executed automatically, when the user program is started (or stepped through). This causes that
• Trace memory contents is erased and previous records are no longer visible.
• The trigger unit is set to its initial state.
• All used counters are initialized and all used flags are set to OFF.
In combination with the command <trace>.SelfArm the trace is able to generate continuous recording and display like a trace snapshot.
See also
■ CIProbe ■ <trace>.Init ■ <trace>.state ■ Trace ❏ Analyzer.STATE() ❏ SNOOPer.STATE()
▲ ’Emulator Functions’ in ’FIRE User’s Guide’▲ ’Release Information’ in ’Release History’
<trace>.AutoStart Automatic start
The <trace>.AutoStart command will execute the <trace>.Init automatically, when a specified break event (as defined in the emulator trigger unit) is encountered and a user program is re-started with the command Go or Step.
See also
■ <trace>.Arm ■ <trace>.state ■ Trace ❏ Analyzer.STATE()
▲ ’Emulator Functions’ in ’FIRE User’s Guide’
Format: <trace>.AutoInit [ON | OFF]
Format: <trace>.AutoStart [ON | OFF]
General Commands Reference Guide T 131 ©1989-2019 Lauterbach GmbH
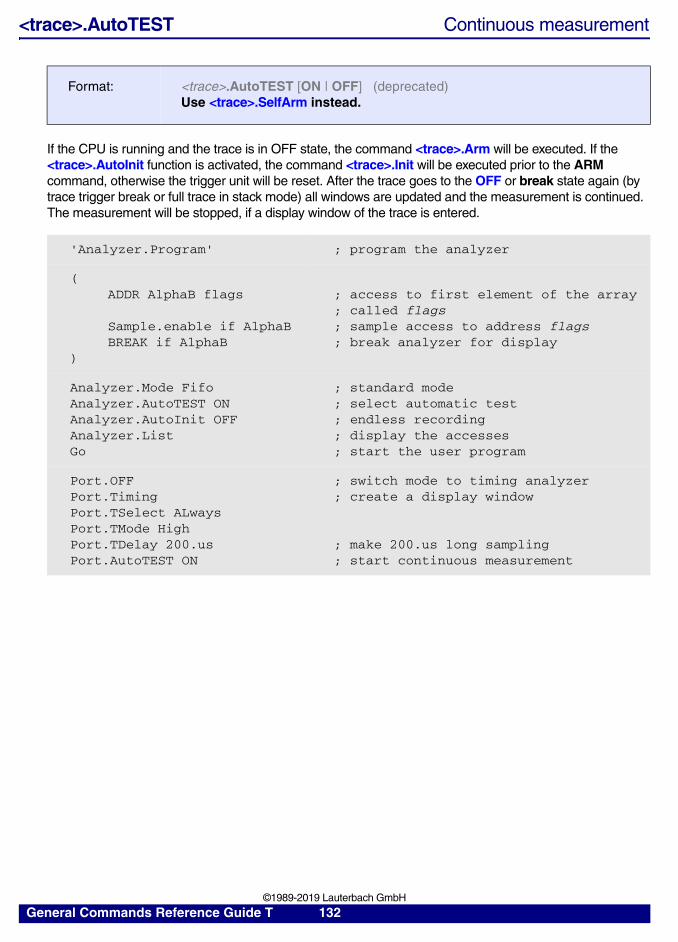
<trace>.AutoTEST Continuous measurement
If the CPU is running and the trace is in OFF state, the command <trace>.Arm will be executed. If the <trace>.AutoInit function is activated, the command <trace>.Init will be executed prior to the ARM command, otherwise the trigger unit will be reset. After the trace goes to the OFF or break state again (by trace trigger break or full trace in stack mode) all windows are updated and the measurement is continued. The measurement will be stopped, if a display window of the trace is entered.
Format: <trace>.AutoTEST [ON | OFF] (deprecated)Use <trace>.SelfArm instead.
'Analyzer.Program' ; program the analyzer
(ADDR AlphaB flags
Sample.enable if AlphaBBREAK if AlphaB
)
; access to first element of the array; called flags; sample access to address flags; break analyzer for display
Analyzer.Mode FifoAnalyzer.AutoTEST ONAnalyzer.AutoInit OFFAnalyzer.List Go
; standard mode; select automatic test; endless recording; display the accesses; start the user program
Port.OFFPort.TimingPort.TSelect ALwaysPort.TMode HighPort.TDelay 200.usPort.AutoTEST ON
; switch mode to timing analyzer; create a display window
; make 200.us long sampling; start continuous measurement
General Commands Reference Guide T 132 ©1989-2019 Lauterbach GmbH
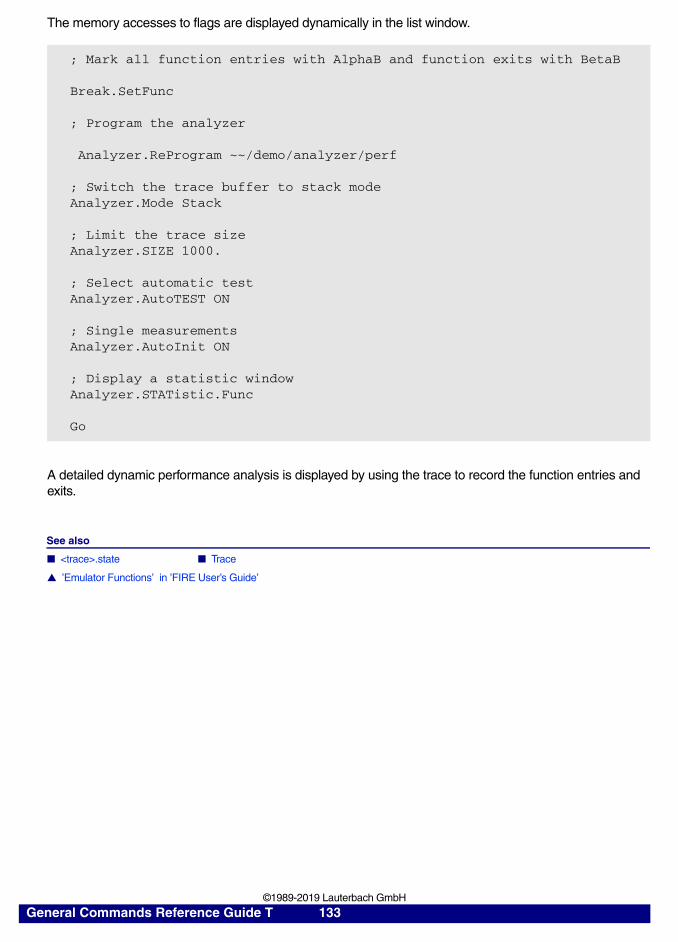
The memory accesses to flags are displayed dynamically in the list window.
A detailed dynamic performance analysis is displayed by using the trace to record the function entries and exits.
See also
■ <trace>.state ■ Trace
▲ ’Emulator Functions’ in ’FIRE User’s Guide’
; Mark all function entries with AlphaB and function exits with BetaB
Break.SetFunc
; Program the analyzer
Analyzer.ReProgram ~~/demo/analyzer/perf
; Switch the trace buffer to stack modeAnalyzer.Mode Stack
; Limit the trace sizeAnalyzer.SIZE 1000.
; Select automatic testAnalyzer.AutoTEST ON
; Single measurementsAnalyzer.AutoInit ON
; Display a statistic windowAnalyzer.STATistic.Func
Go
General Commands Reference Guide T 133 ©1989-2019 Lauterbach GmbH
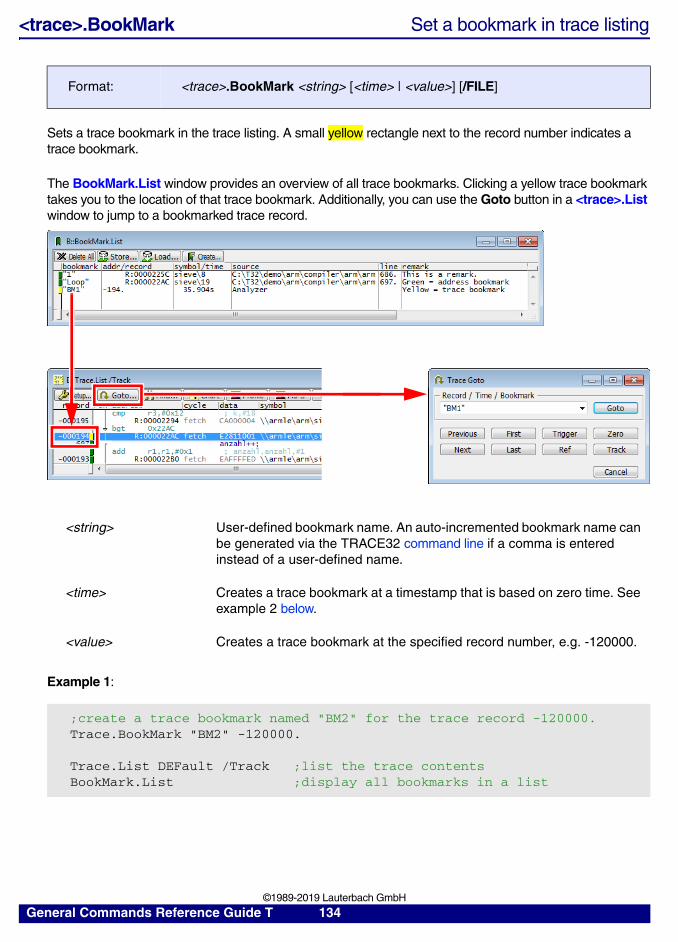
<trace>.BookMark Set a bookmark in trace listing
Sets a trace bookmark in the trace listing. A small yellow rectangle next to the record number indicates a trace bookmark.
The BookMark.List window provides an overview of all trace bookmarks. Clicking a yellow trace bookmark takes you to the location of that trace bookmark. Additionally, you can use the Goto button in a <trace>.List window to jump to a bookmarked trace record.
Example 1:
Format: <trace>.BookMark <string> [<time> | <value>] [/FILE]
<string> User-defined bookmark name. An auto-incremented bookmark name can be generated via the TRACE32 command line if a comma is entered instead of a user-defined name.
<time> Creates a trace bookmark at a timestamp that is based on zero time. See example 2 below.
<value> Creates a trace bookmark at the specified record number, e.g. -120000.
;create a trace bookmark named "BM2" for the trace record -120000.Trace.BookMark "BM2" -120000.
Trace.List DEFault /Track ;list the trace contentsBookMark.List ;display all bookmarks in a list
General Commands Reference Guide T 134 ©1989-2019 Lauterbach GmbH
Example 2 shows how to create a bookmark 0.300ms after the zero-time reference point. The optional steps are included in this example to let you view on screen what happens behind the scenes.
See also
■ <trace>.List ■ <trace>.state ■ Trace ■ <trace>.BookMarkToggle ■ <trace>.GOTO ■ BookMark ■ BookMark.Create ■ BookMark.EditRemark ■ BookMark.List
▲ ’BookMark’ in ’General Commands Reference Guide B’
;optional step: In the trace listing, the TIme.ZERO column is displayed;as the first column, followed by the DEFault columnsTrace.List TIme.ZERO DEFault /Track
;optional step: go to the first trace record, i.e. the record with the;lowest record numberTrace.GOTO Trace.FIRST()
;set the zero-time reference point to the first trace recordZERO.offset Trace.RECORD.TIME(Trace.FIRST())
Trace.BookMark "BM3" 0.300ms ;create a bookmark 0.300ms after the ;zero-time reference point
Trace.GOTO "BM3" ;optional step: got to the new bookmark
BookMark.List ;optional step: display all bookmarks
General Commands Reference Guide T 135 ©1989-2019 Lauterbach GmbH
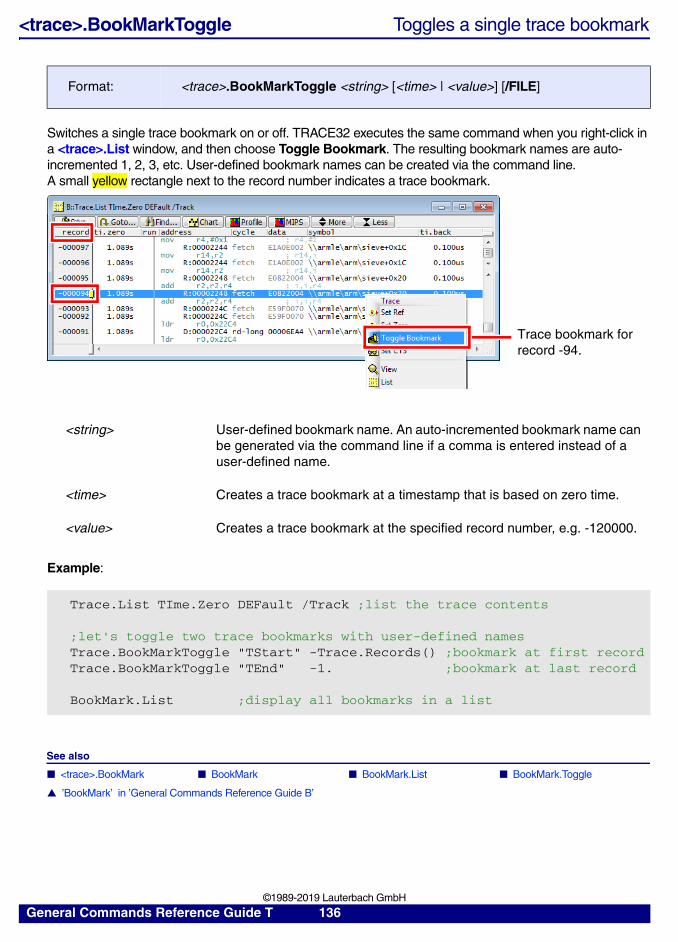
<trace>.BookMarkToggle Toggles a single trace bookmark
Switches a single trace bookmark on or off. TRACE32 executes the same command when you right-click in a <trace>.List window, and then choose Toggle Bookmark. The resulting bookmark names are auto-incremented 1, 2, 3, etc. User-defined bookmark names can be created via the command line. A small yellow rectangle next to the record number indicates a trace bookmark.
Example:
See also
■ <trace>.BookMark ■ BookMark ■ BookMark.List ■ BookMark.Toggle
▲ ’BookMark’ in ’General Commands Reference Guide B’
Format: <trace>.BookMarkToggle <string> [<time> | <value>] [/FILE]
<string> User-defined bookmark name. An auto-incremented bookmark name can be generated via the command line if a comma is entered instead of a user-defined name.
<time> Creates a trace bookmark at a timestamp that is based on zero time.
<value> Creates a trace bookmark at the specified record number, e.g. -120000.
Trace.List TIme.Zero DEFault /Track ;list the trace contents
;let's toggle two trace bookmarks with user-defined namesTrace.BookMarkToggle "TStart" -Trace.Records() ;bookmark at first recordTrace.BookMarkToggle "TEnd" -1. ;bookmark at last record
BookMark.List ;display all bookmarks in a list
Trace bookmark for record -94.
General Commands Reference Guide T 136 ©1989-2019 Lauterbach GmbH
<trace>.Break Stop trace
The trace is stopped and the trace storage is ready for read-out.
Format: <trace>.Break
General Commands Reference Guide T 137 ©1989-2019 Lauterbach GmbH
<trace>.Chart Display trace contents graphically[Parameters] [General Options] [Examples]
The <trace>.Chart command group allows to display the analyzed trace information graphically. Examples are:
• Function run-time (Trace.Chart.Func)
• Time chart (Trace.Chart.sYmbol)
• Task run-time (Trace.Chart.TASK)
• Variable contents (Trace.Chart.VarState)
Parameters
This section describes the optional <trace_area> parameters of the <trace>.Chart command group.
<record_range> Defines which part of the trace buffer is displayed.See example.
<record> Defines which trace record is centered on the x-axis when the window is opened. Records at the beginning or end of the x-axis are not centered.See example.
<time> Defines which timestamp is centered on the x-axis when the window is opened. Timestamps at the beginning or end of the x-axis are not centered.
NOTE: Only zero-time timestamps can be used as <time> parameters.
You can display the zero-time timestamps in a Trace window by adding the TimeZero option to Trace.Chart.* or by adding the TIme.Zero column to Trace.List.
See examples.
<timerange> Defines which timestamp is displayed on left of the x-axis when the window is opened.
NOTE: Only zero-time timestamps can be used as <timerange> parameters.
You can display the zero-time timestamps in a Trace window by adding the TimeZero option to Trace.Chart.* or by adding the TIme.Zero column to Trace.List.
See example.
General Commands Reference Guide T 138 ©1989-2019 Lauterbach GmbH
General Options
This section describes the options of the <trace>.Chart command group.
<timescale> Rule of thumb: The smaller the <timescale> value, the higher the resolution and the wider the chart in the data area of a <trace>.Chart.* window.
The <timescale> parameter defines the display scaling as time per character. tbd.It is useful for printing operations and allows to print out any timing chart in a fixed scale on multiple pages. tbd.• See example. • For the units of measurement, see “Parameter Types”
(ide_user.pdf).
<trace_bookmark> Defines which bookmark position is centered on the x-axis when the window is opened. Bookmark positions at the beginning or end of the x-axis are not centered.
NOTE: You can only use the names of trace bookmarks, which are created with the <trace>.BookMark command.
See example.
Track The cursor in the <trace>.Chart window follows the cursor movement in other trace windows. Default is a time tracking. If no time information is available tracking to record number is performed.The zoom factor of the <trace>.Chart window is retained, even if the trace content changes.
ZoomTrack Same as option Track. If the tracking in performed with another <trace>.Chart window the same zoom factor is used.
Sort [<sort_visible>] [<sort_core>] [<sort>]
Specify sorting criterion for analyzed items. For almost all commands the analyzed items are displayed in the order they are recorded by default.
Details on the sorting criterion can be found at the description of the command Trace.STATistic.Sort.
INCremental Intermediate results are displayed while TRACE32 PowerView is processing the trace analysis (default).
FULL TRACE32 PowerView displays the result when the processing is done.
General Commands Reference Guide T 139 ©1989-2019 Lauterbach GmbH
Option for SMP multicore tracing
FILE Use the trace contents loaded with the command <trace>.FILE.
TASK <task_magic>, etc.
Operating system task in OS-aware debugging and tracing.
See also “What to know about the Task Parameters” (general_ref_t.pdf).
CORE <n> Time chart is only displayed for the specified core.
SplitCORE Trace information is analyzed independently for each core. The time chart displays these individual results.
MergeCORE Trace information is analyzed independently for each core. The time chart summarizes these results to a single result.
JoinCORE Core information is ignored for the time chart.
RecScale Display trace in fixed record raster. This is the default.
TimeScale Display trace as true time display, time relative to the trigger point (respectively the last record in the trace).
TimeZero Display trace as true time display, time relative to zero point. For more information about the zero point refer to ZERO.
TimeREF Display trace as true time display, time relative to the reference point. For more information about the reference point refer to <trace>.REF.
FlowTrace Trace works as a program flow Trace. This option is usually not required.
BusTrace Trace works as a bus trace. This option is usually not required.
CTS Use Context Tracking System to fill trace gaps and then perform <trace>.Chart.
NoInline Inline functions are treated as separate functions. The option NoInline can be used to discard inline functions.
General Commands Reference Guide T 140 ©1989-2019 Lauterbach GmbH
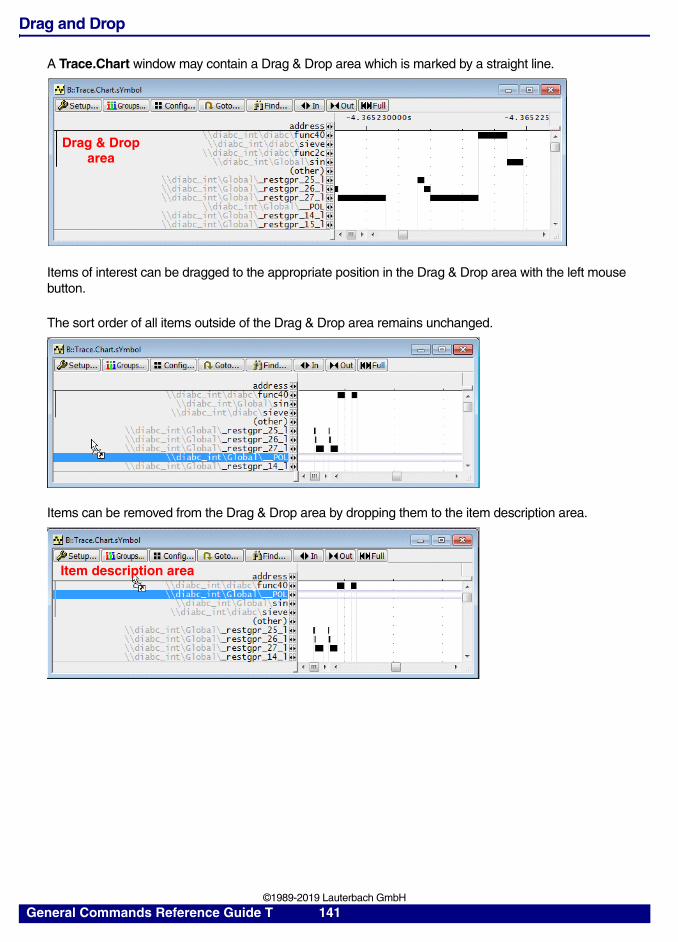
Drag and Drop
A Trace.Chart window may contain a Drag & Drop area which is marked by a straight line.
Items of interest can be dragged to the appropriate position in the Drag & Drop area with the left mouse button.
The sort order of all items outside of the Drag & Drop area remains unchanged.
Items can be removed from the Drag & Drop area by dropping them to the item description area.
Drag & Droparea
Item description area
General Commands Reference Guide T 141 ©1989-2019 Lauterbach GmbH
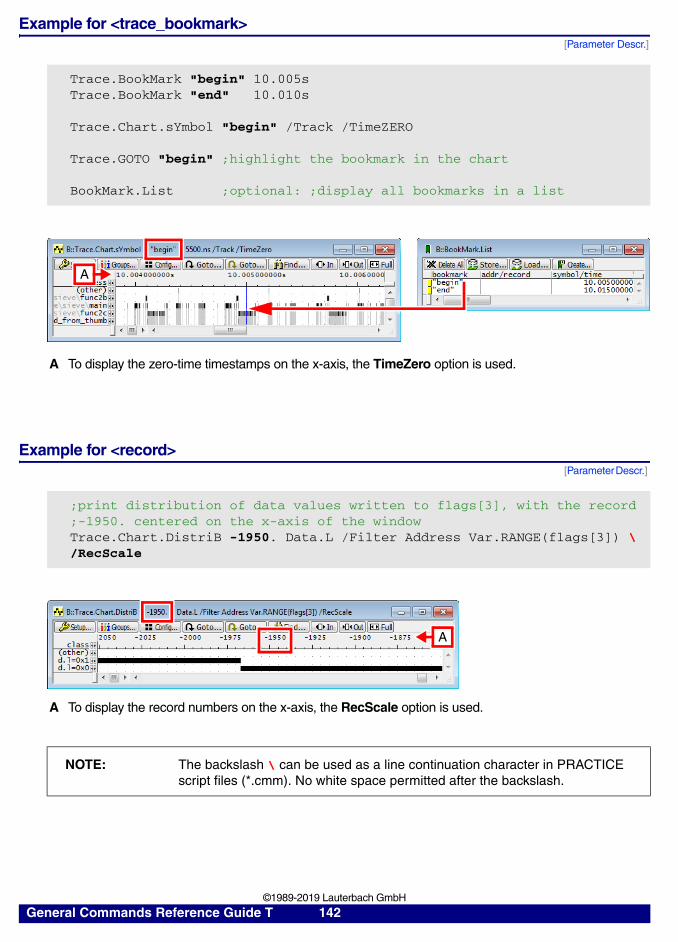
Example for <trace_bookmark>[Parameter Descr.]
Example for <record>[Parameter Descr.]
Trace.BookMark "begin" 10.005sTrace.BookMark "end" 10.010s
Trace.Chart.sYmbol "begin" /Track /TimeZERO
Trace.GOTO "begin" ;highlight the bookmark in the chart
BookMark.List ;optional: ;display all bookmarks in a list
A To display the zero-time timestamps on the x-axis, the TimeZero option is used.
;print distribution of data values written to flags[3], with the record ;-1950. centered on the x-axis of the windowTrace.Chart.DistriB -1950. Data.L /Filter Address Var.RANGE(flags[3]) \/RecScale
A To display the record numbers on the x-axis, the RecScale option is used.
NOTE: The backslash \ can be used as a line continuation character in PRACTICE script files (*.cmm). No white space permitted after the backslash.
A
A
General Commands Reference Guide T 142 ©1989-2019 Lauterbach GmbH
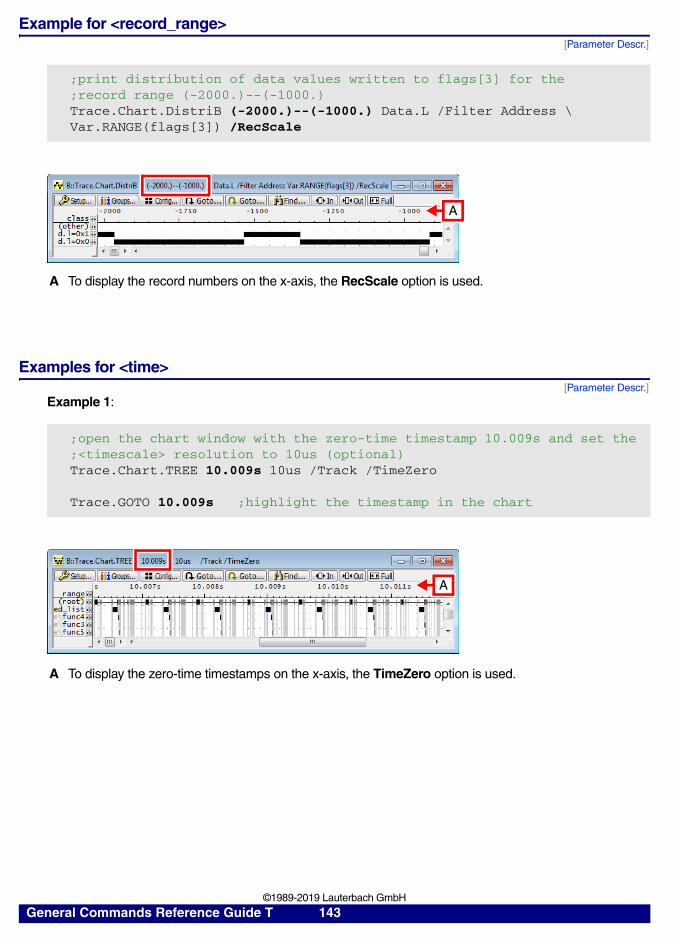
Example for <record_range>[Parameter Descr.]
Examples for <time>[Parameter Descr.]
Example 1:
;print distribution of data values written to flags[3] for the;record range (-2000.)--(-1000.)Trace.Chart.DistriB (-2000.)--(-1000.) Data.L /Filter Address \Var.RANGE(flags[3]) /RecScale
A To display the record numbers on the x-axis, the RecScale option is used.
;open the chart window with the zero-time timestamp 10.009s and set the;<timescale> resolution to 10us (optional)Trace.Chart.TREE 10.009s 10us /Track /TimeZero
Trace.GOTO 10.009s ;highlight the timestamp in the chart
A To display the zero-time timestamps on the x-axis, the TimeZero option is used.
A
A
General Commands Reference Guide T 143 ©1989-2019 Lauterbach GmbH
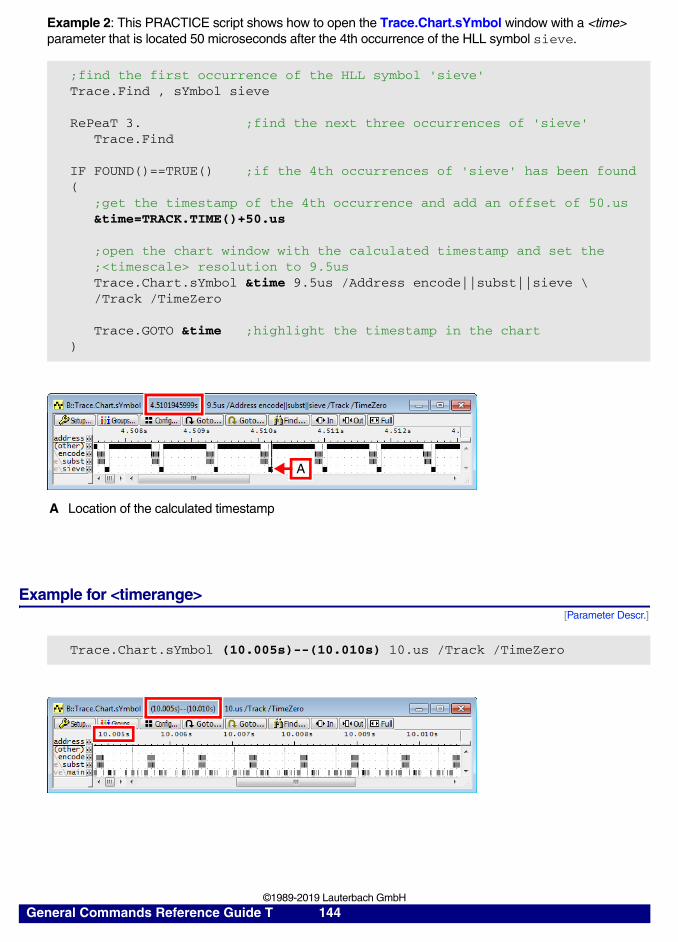
Example 2: This PRACTICE script shows how to open the Trace.Chart.sYmbol window with a <time> parameter that is located 50 microseconds after the 4th occurrence of the HLL symbol sieve.
Example for <timerange>[Parameter Descr.]
;find the first occurrence of the HLL symbol 'sieve'Trace.Find , sYmbol sieve
RePeaT 3. ;find the next three occurrences of 'sieve' Trace.Find
IF FOUND()==TRUE() ;if the 4th occurrences of 'sieve' has been found( ;get the timestamp of the 4th occurrence and add an offset of 50.us &time=TRACK.TIME()+50.us
;open the chart window with the calculated timestamp and set the ;<timescale> resolution to 9.5us Trace.Chart.sYmbol &time 9.5us /Address encode||subst||sieve \ /Track /TimeZero Trace.GOTO &time ;highlight the timestamp in the chart)
A Location of the calculated timestamp
Trace.Chart.sYmbol (10.005s)--(10.010s) 10.us /Track /TimeZero
A
General Commands Reference Guide T 144 ©1989-2019 Lauterbach GmbH
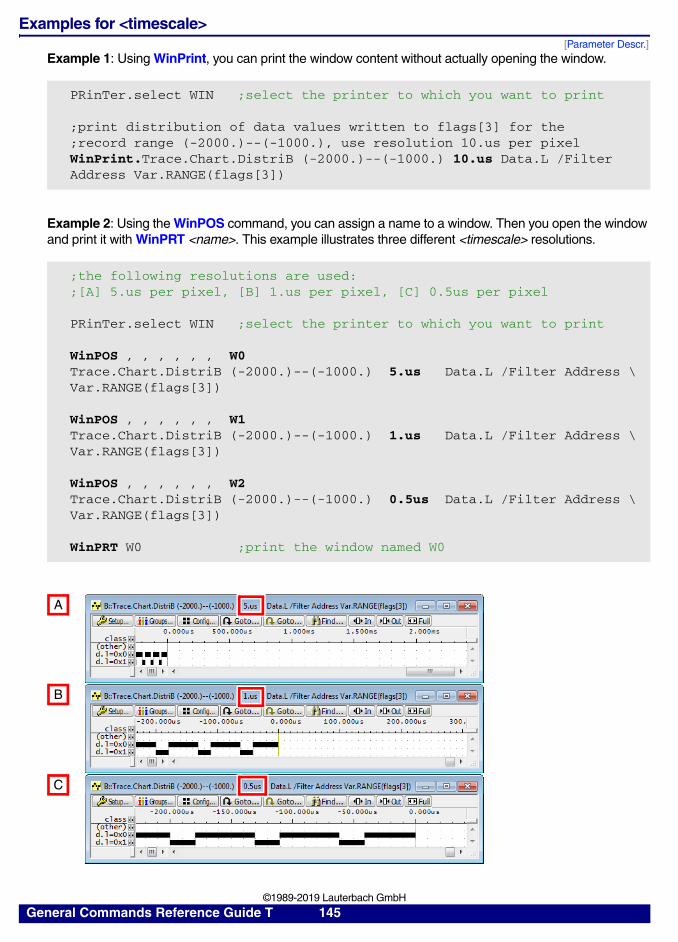
Examples for <timescale>[Parameter Descr.]
Example 1: Using WinPrint, you can print the window content without actually opening the window.
Example 2: Using the WinPOS command, you can assign a name to a window. Then you open the window and print it with WinPRT <name>. This example illustrates three different <timescale> resolutions.
PRinTer.select WIN ;select the printer to which you want to print
;print distribution of data values written to flags[3] for the;record range (-2000.)--(-1000.), use resolution 10.us per pixelWinPrint.Trace.Chart.DistriB (-2000.)--(-1000.) 10.us Data.L /Filter Address Var.RANGE(flags[3])
;the following resolutions are used:;[A] 5.us per pixel, [B] 1.us per pixel, [C] 0.5us per pixel
PRinTer.select WIN ;select the printer to which you want to print
WinPOS , , , , , , W0Trace.Chart.DistriB (-2000.)--(-1000.) 5.us Data.L /Filter Address \Var.RANGE(flags[3])
WinPOS , , , , , , W1Trace.Chart.DistriB (-2000.)--(-1000.) 1.us Data.L /Filter Address \Var.RANGE(flags[3])
WinPOS , , , , , , W2Trace.Chart.DistriB (-2000.)--(-1000.) 0.5us Data.L /Filter Address \Var.RANGE(flags[3])
WinPRT W0 ;print the window named W0
A
B
C
General Commands Reference Guide T 145 ©1989-2019 Lauterbach GmbH
See also
■ <trace>.Chart.DatasYmbol ■ <trace>.Chart.DistriB ■ <trace>.Chart.Func ■ <trace>.Chart.GROUP ■ <trace>.Chart.Line ■ <trace>.Chart.sYmbol ■ <trace>.Chart.TASK ■ <trace>.Chart.TASKSRV ■ <trace>.Chart.TASKState ■ <trace>.Chart.VarState ■ <trace>.state ■ Trace ■ <trace>.Chart.Address ■ <trace>.Chart.DistriB ■ <trace>.Chart.Func ■ <trace>.Chart.GROUP ■ <trace>.Chart.INTERRUPTTREE ■ <trace>.Chart.Line ■ <trace>.Chart.Nesting ■ <trace>.Chart.sYmbol ■ <trace>.Chart.TASK ■ <trace>.Chart.TASKFunc ■ <trace>.Chart.TASKINTR ■ <trace>.Chart.TASKKernel ■ <trace>.Chart.TASKSRV ■ <trace>.Chart.TASKState ■ <trace>.Chart.TASKVSINTERRUPT ■ <trace>.Chart.TASKVSINTR ■ <trace>.Chart.TREE ■ <trace>.Chart.VarState ■ <trace>.PROfileChart ■ <trace>.PROfileSTATistic ■ <trace>.STATistic
▲ ’How to use the PROTOanalyzer’ in ’DigRF Protocol Analyzer’▲ ’How to use the PROTOanalyzer’ in ’FlexRay Protocol Analyzer’▲ ’How to use the PROTOanalyzer’ in ’LIN Bus Protocol Analyzer’▲ ’Release Information’ in ’Release History’
<trace>.Chart.Address Time between program events as a chart
Displays the time interval between up to 8 program events as a chart. The <trace>.Chart.Address command is the counterpart of the <trace>.STATistic.Address command.
See also
■ <trace>.Chart
Format: <trace>.Chart.Address <address1> [<address1> …]
General Commands Reference Guide T 146 ©1989-2019 Lauterbach GmbH
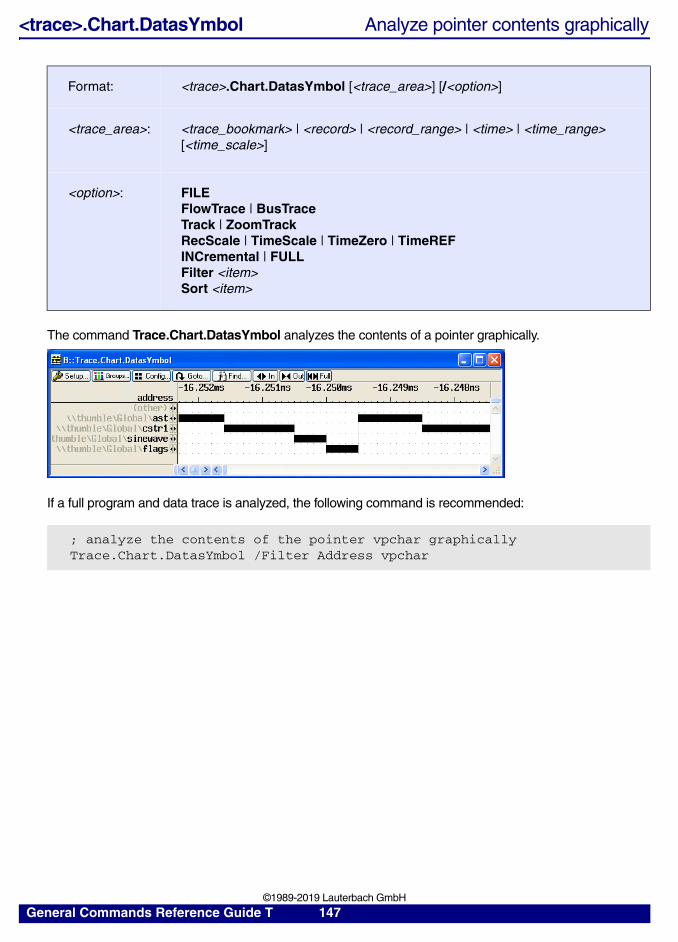
<trace>.Chart.DatasYmbol Analyze pointer contents graphically
The command Trace.Chart.DatasYmbol analyzes the contents of a pointer graphically.
If a full program and data trace is analyzed, the following command is recommended:
Format: <trace>.Chart.DatasYmbol [<trace_area>] [/<option>]
<trace_area>: <trace_bookmark> | <record> | <record_range> | <time> | <time_range> [<time_scale>]
<option>: FILEFlowTrace | BusTraceTrack | ZoomTrackRecScale | TimeScale | TimeZero | TimeREFINCremental | FULLFilter <item>Sort <item>
; analyze the contents of the pointer vpchar graphicallyTrace.Chart.DatasYmbol /Filter Address vpchar
General Commands Reference Guide T 147 ©1989-2019 Lauterbach GmbH

A more effective usage of the trace memory is possible, if only write accesses to the pointer are recorded to the trace.
See also
■ <trace>.Chart
▲ ’Release Information’ in ’Release History’
; set a filter to record only write cycles to the pointer vpchar to the; traceVar.Break.Set vpchar /Write /TraceEnable
…
; analyze the contents of the pointerTrace.Chart.DatasYmbol
; analyze the contents of the pointer, sort the result by symbol namesTrace.Chart.DatasYmbol /Sort sYmbol
General Commands Reference Guide T 148 ©1989-2019 Lauterbach GmbH
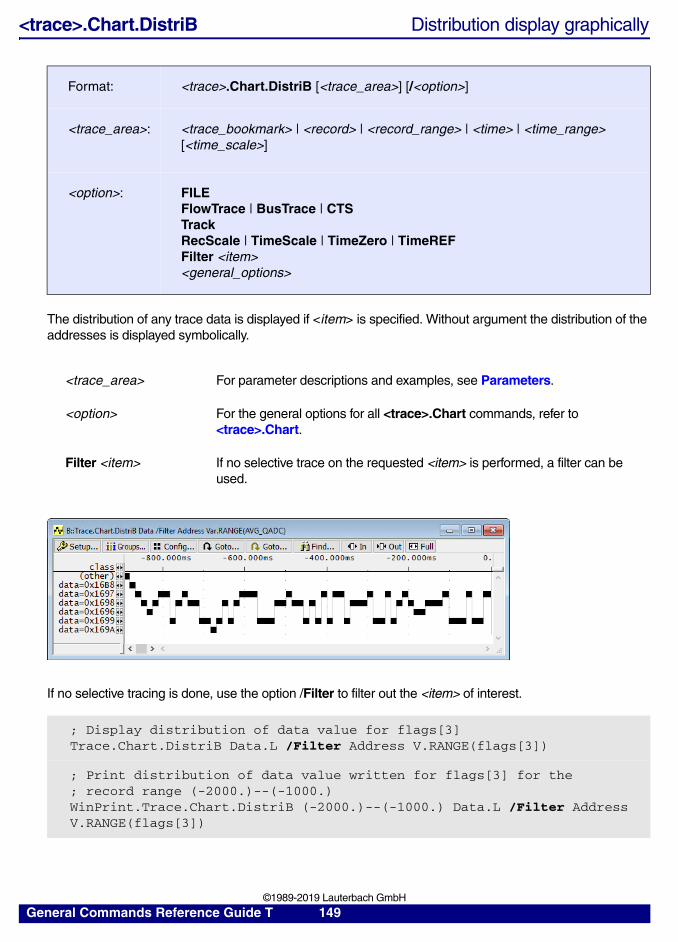
<trace>.Chart.DistriB Distribution display graphically
The distribution of any trace data is displayed if <item> is specified. Without argument the distribution of the addresses is displayed symbolically.
If no selective tracing is done, use the option /Filter to filter out the <item> of interest.
Format: <trace>.Chart.DistriB [<trace_area>] [/<option>]
<trace_area>: <trace_bookmark> | <record> | <record_range> | <time> | <time_range> [<time_scale>]
<option>: FILEFlowTrace | BusTrace | CTSTrackRecScale | TimeScale | TimeZero | TimeREFFilter <item><general_options>
<trace_area> For parameter descriptions and examples, see Parameters.
<option> For the general options for all <trace>.Chart commands, refer to <trace>.Chart.
Filter <item> If no selective trace on the requested <item> is performed, a filter can be used.
; Display distribution of data value for flags[3]Trace.Chart.DistriB Data.L /Filter Address V.RANGE(flags[3])
; Print distribution of data value written for flags[3] for the; record range (-2000.)--(-1000.)WinPrint.Trace.Chart.DistriB (-2000.)--(-1000.) Data.L /Filter Address V.RANGE(flags[3])
General Commands Reference Guide T 149 ©1989-2019 Lauterbach GmbH
Example for TRACE32-ICE or TRACE32-FIRE:
Perform a selective trace on the data of interest:
Example for all trace methods:
See also
■ <trace>.Chart
▲ ’Filter and Trigger - Single-Core and AMP’ in ’AURIX Trace Training’▲ ’Filter and Trigger - SMP Systems’ in ’AURIX Trace Training’
Analyzer.ReProgram (
ADDR AlphaBreak V.RANGE(GlobalStateVar)Sample.enable IF AlphaBreak
)Go…BreakTrace.Chart.DistriB Data.W
; selective trace; program the analyzer to; sample all accesses to; the variable; GlobalStateVar
; measurement
; display the time spent; in different states
Trace.STATistic.Sort AddressTrace.Chart.DistriB
; sort chart by addresses; display the time spent at different; addresses
General Commands Reference Guide T 150 ©1989-2019 Lauterbach GmbH
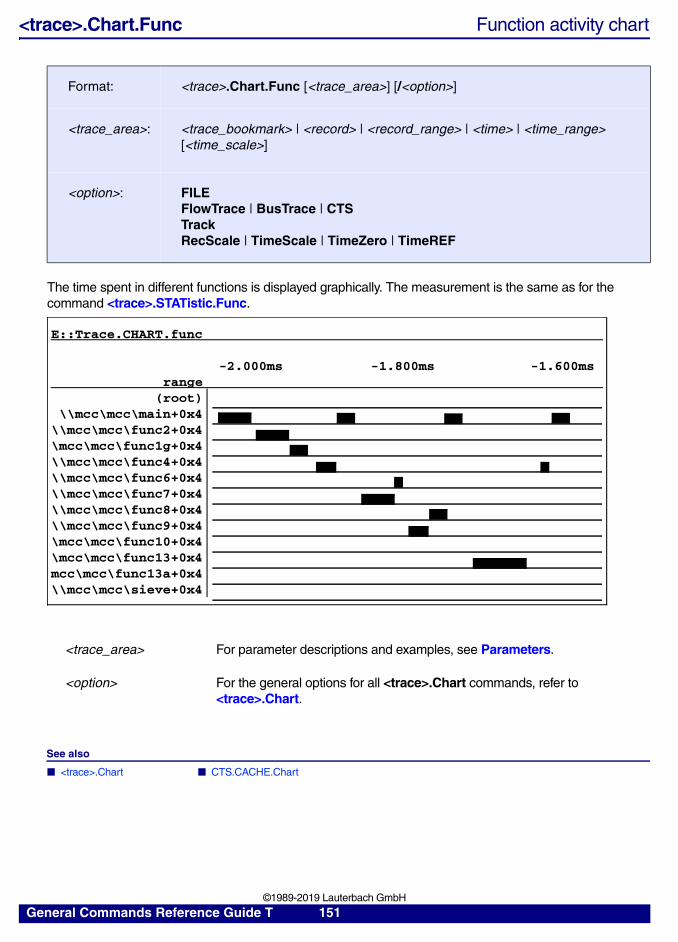
<trace>.Chart.Func Function activity chart
The time spent in different functions is displayed graphically. The measurement is the same as for the command <trace>.STATistic.Func.
See also
■ <trace>.Chart ■ CTS.CACHE.Chart
Format: <trace>.Chart.Func [<trace_area>] [/<option>]
<trace_area>: <trace_bookmark> | <record> | <record_range> | <time> | <time_range> [<time_scale>]
<option>: FILEFlowTrace | BusTrace | CTSTrackRecScale | TimeScale | TimeZero | TimeREF
<trace_area> For parameter descriptions and examples, see Parameters.
<option> For the general options for all <trace>.Chart commands, refer to <trace>.Chart.
E::Trace.CHART.func
-2.000ms -1.800ms -1.600msrange
(root)\\mcc\mcc\main+0x4
\\mcc\mcc\func2+0x4\mcc\mcc\func1g+0x4\\mcc\mcc\func4+0x4\\mcc\mcc\func6+0x4\\mcc\mcc\func7+0x4\\mcc\mcc\func8+0x4\\mcc\mcc\func9+0x4\mcc\mcc\func10+0x4\mcc\mcc\func13+0x4mcc\mcc\func13a+0x4\\mcc\mcc\sieve+0x4
General Commands Reference Guide T 151 ©1989-2019 Lauterbach GmbH
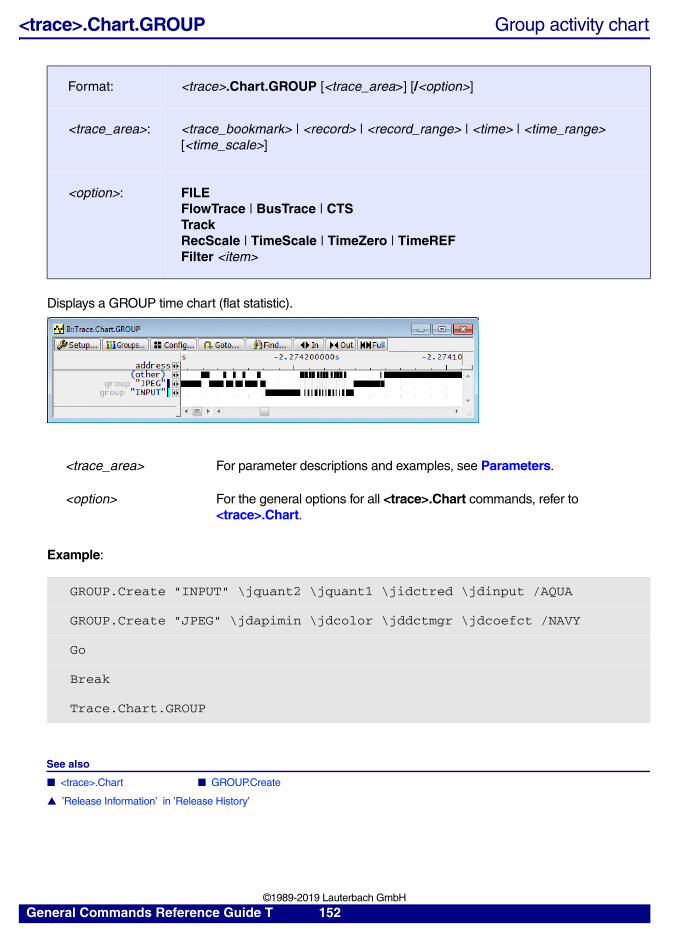
<trace>.Chart.GROUP Group activity chart
Displays a GROUP time chart (flat statistic).
Example:
See also
■ <trace>.Chart ■ GROUP.Create
▲ ’Release Information’ in ’Release History’
Format: <trace>.Chart.GROUP [<trace_area>] [/<option>]
<trace_area>: <trace_bookmark> | <record> | <record_range> | <time> | <time_range> [<time_scale>]
<option>: FILEFlowTrace | BusTrace | CTSTrackRecScale | TimeScale | TimeZero | TimeREFFilter <item>
<trace_area> For parameter descriptions and examples, see Parameters.
<option> For the general options for all <trace>.Chart commands, refer to <trace>.Chart.
GROUP.Create "INPUT" \jquant2 \jquant1 \jidctred \jdinput /AQUA
GROUP.Create "JPEG" \jdapimin \jdcolor \jddctmgr \jdcoefct /NAVY
Go
Break
Trace.Chart.GROUP
General Commands Reference Guide T 152 ©1989-2019 Lauterbach GmbH
<trace>.Chart.INTERRUPTTREE Display interrupt nesting
tbd.
See also
■ <trace>.Chart
Format: <trace>.Chart.INTERRUPTTREE [<trace_area>] [/<option>]
<trace_area>: <trace_bookmark> | <record> | <record_range> | <time> | <time_range> [<time_scale>]
<trace_area> For parameter descriptions and examples, see Parameters.
<option> For the general options for all <trace>.Chart commands, refer to <trace>.Chart.
General Commands Reference Guide T 153 ©1989-2019 Lauterbach GmbH
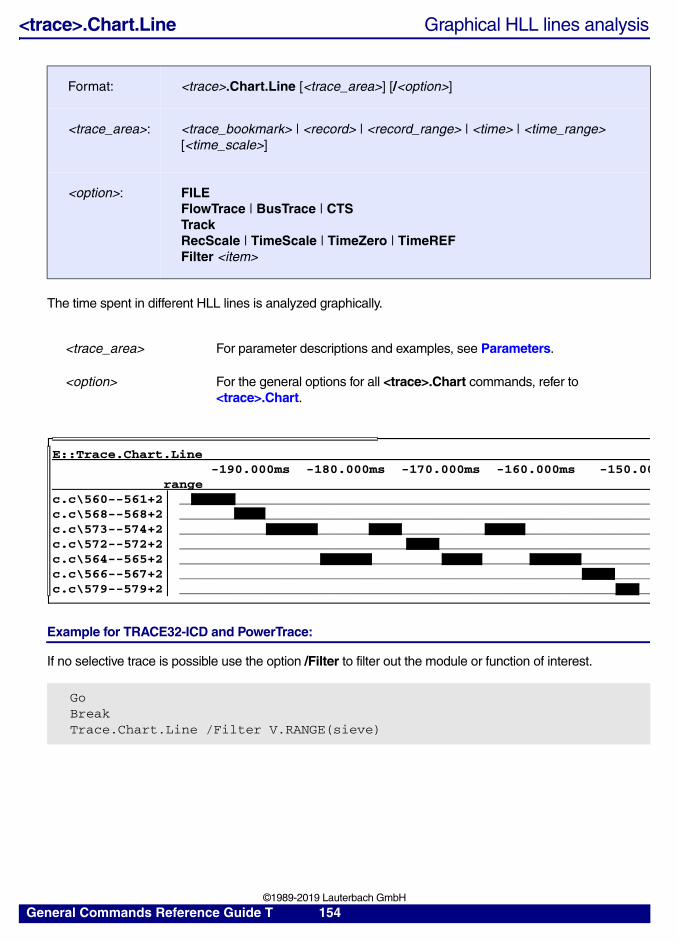
<trace>.Chart.Line Graphical HLL lines analysis
The time spent in different HLL lines is analyzed graphically.
Example for TRACE32-ICD and PowerTrace:
If no selective trace is possible use the option /Filter to filter out the module or function of interest.
Format: <trace>.Chart.Line [<trace_area>] [/<option>]
<trace_area>: <trace_bookmark> | <record> | <record_range> | <time> | <time_range> [<time_scale>]
<option>: FILEFlowTrace | BusTrace | CTSTrackRecScale | TimeScale | TimeZero | TimeREFFilter <item>
<trace_area> For parameter descriptions and examples, see Parameters.
<option> For the general options for all <trace>.Chart commands, refer to <trace>.Chart.
GoBreakTrace.Chart.Line /Filter V.RANGE(sieve)
E::Trace.Chart.Line-190.000ms -180.000ms -170.000ms -160.000ms -150.00
rangec.c\560--561+2 ____________________________________________________________c.c\568--568+2 ____________________________________________________________c.c\573--574+2 ____________________________________________________________c.c\572--572+2 ____________________________________________________________c.c\564--565+2 ____________________________________________________________c.c\566--567+2 ____________________________________________________________c.c\579--579+2 ____________________________________________________________
General Commands Reference Guide T 154 ©1989-2019 Lauterbach GmbH
Example for TRACE32-ICE and TRACE32-FIRE:
If only a specific module or function should be analyzed, perform a selective trace on the module or function:
See also
■ <trace>.Chart
▲ ’Release Information’ in ’Release History’
<trace>.Chart.Nesting Show function nesting at cursor position
Shows the function call stack as a time chart.
See also
■ <trace>.Chart
Analyzer.ReProgram(
ADDR AlphaBreak V.RANGE(module1)Sample.Enable IF AlphaBreak
)GoBreakTrace.Chart.Line
; sample only instruction from; module1
; collect data; graphical display of HLL analysis
Format: <trace>.Chart.Nesting [<trace_area>] [/<option>]
<trace_area>: <trace_bookmark> | <record> | <record_range> | <time> | <time_range> [<time_scale>]
<option>: FILE | FlowTrace | BusTraceRecScale | TimeScale | TimeZero | TimeREFINCremental | FULL Sort <item> TrackZoomTrackTASK
<trace_area> For parameter descriptions and examples, see Parameters.
<option> For the general options for all <trace>.Chart commands, refer to <trace>.Chart.
General Commands Reference Guide T 155 ©1989-2019 Lauterbach GmbH
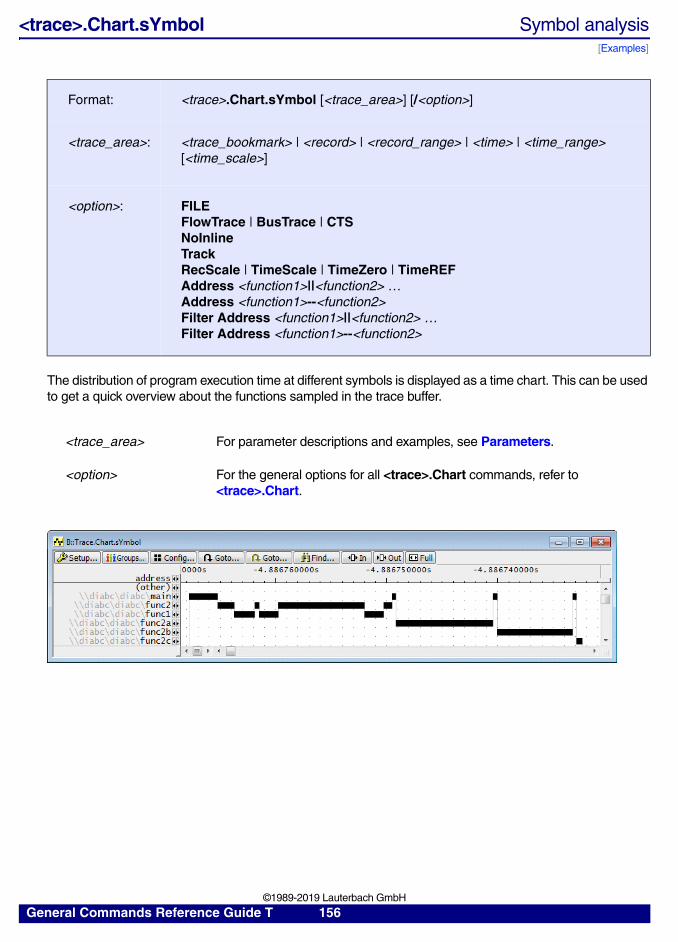
<trace>.Chart.sYmbol Symbol analysis[Examples]
The distribution of program execution time at different symbols is displayed as a time chart. This can be used to get a quick overview about the functions sampled in the trace buffer.
Format: <trace>.Chart.sYmbol [<trace_area>] [/<option>]
<trace_area>: <trace_bookmark> | <record> | <record_range> | <time> | <time_range> [<time_scale>]
<option>: FILEFlowTrace | BusTrace | CTSNoInlineTrackRecScale | TimeScale | TimeZero | TimeREFAddress <function1>||<function2> …Address <function1>--<function2>Filter Address <function1>||<function2> …Filter Address <function1>--<function2>
<trace_area> For parameter descriptions and examples, see Parameters.
<option> For the general options for all <trace>.Chart commands, refer to <trace>.Chart.
General Commands Reference Guide T 156 ©1989-2019 Lauterbach GmbH
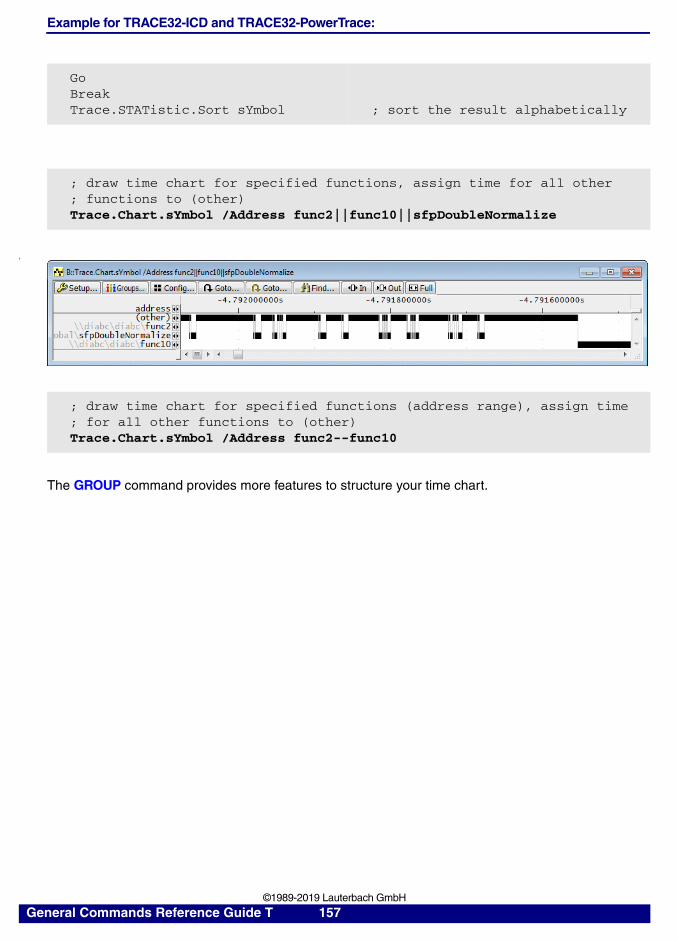
Example for TRACE32-ICD and TRACE32-PowerTrace:
#
The GROUP command provides more features to structure your time chart.
GoBreakTrace.STATistic.Sort sYmbol ; sort the result alphabetically
; draw time chart for specified functions, assign time for all other; functions to (other)Trace.Chart.sYmbol /Address func2||func10||sfpDoubleNormalize
; draw time chart for specified functions (address range), assign time; for all other functions to (other)Trace.Chart.sYmbol /Address func2--func10
General Commands Reference Guide T 157 ©1989-2019 Lauterbach GmbH
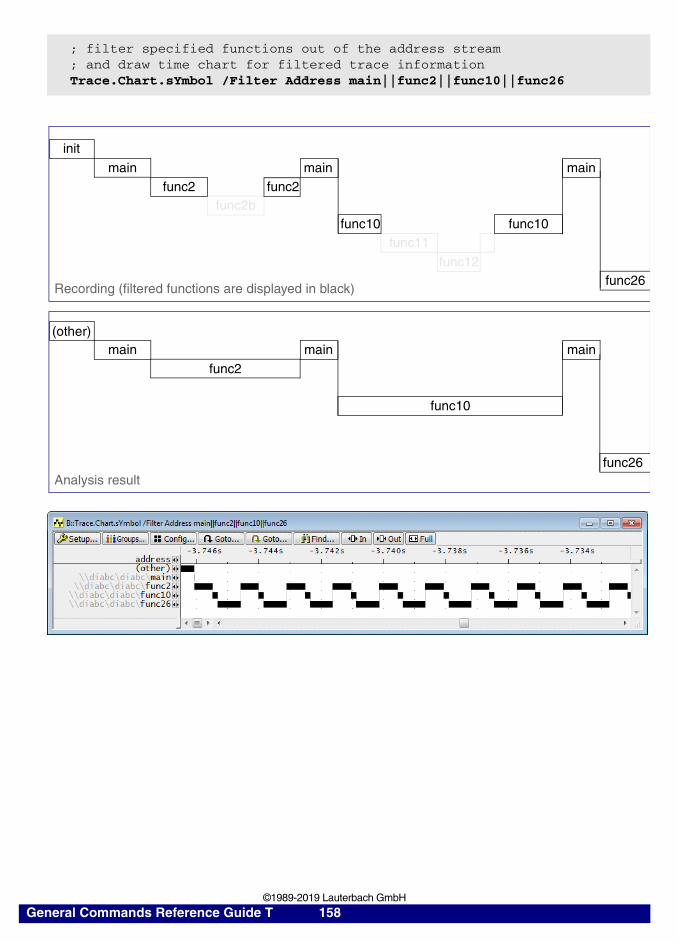
; filter specified functions out of the address stream; and draw time chart for filtered trace informationTrace.Chart.sYmbol /Filter Address main||func2||func10||func26
func26
main
func2
main
func10
main
func26
Recording (filtered functions are displayed in black)
Analysis result
(other)
main main
func11func10
main
func2b
init
func2 func2
func12
func10
General Commands Reference Guide T 158 ©1989-2019 Lauterbach GmbH
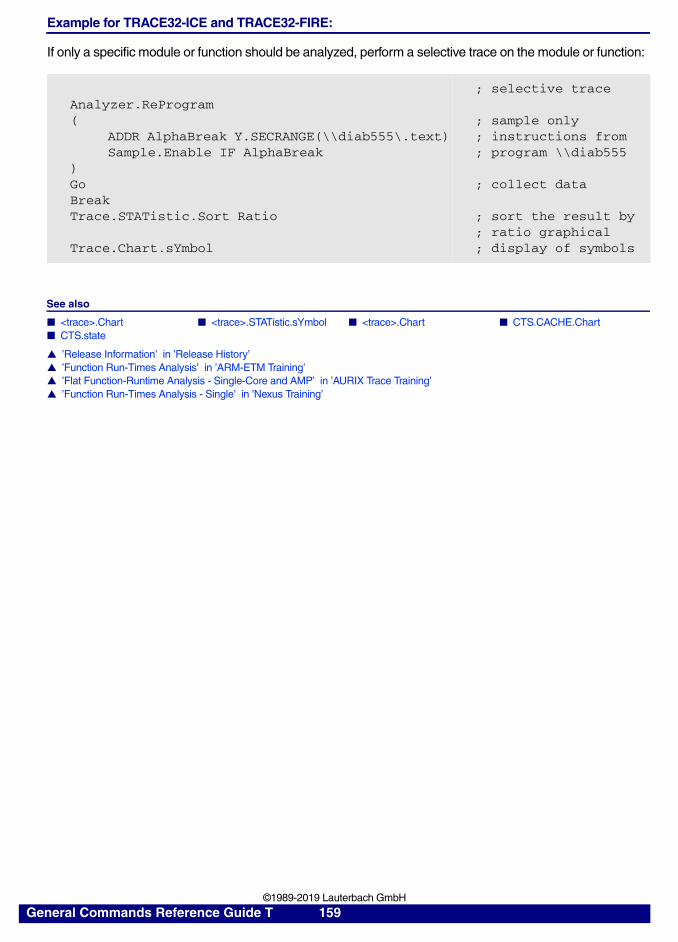
Example for TRACE32-ICE and TRACE32-FIRE:
If only a specific module or function should be analyzed, perform a selective trace on the module or function:
See also
■ <trace>.Chart ■ <trace>.STATistic.sYmbol ■ <trace>.Chart ■ CTS.CACHE.Chart ■ CTS.state
▲ ’Release Information’ in ’Release History’▲ ’Function Run-Times Analysis’ in ’ARM-ETM Training’▲ ’Flat Function-Runtime Analysis - Single-Core and AMP’ in ’AURIX Trace Training’▲ ’Function Run-Times Analysis - Single’ in ’Nexus Training’
Analyzer.ReProgram(
ADDR AlphaBreak Y.SECRANGE(\\diab555\.text)Sample.Enable IF AlphaBreak
)GoBreakTrace.STATistic.Sort Ratio
Trace.Chart.sYmbol
; selective trace
; sample only; instructions from; program \\diab555
; collect data
; sort the result by; ratio graphical; display of symbols
General Commands Reference Guide T 159 ©1989-2019 Lauterbach GmbH
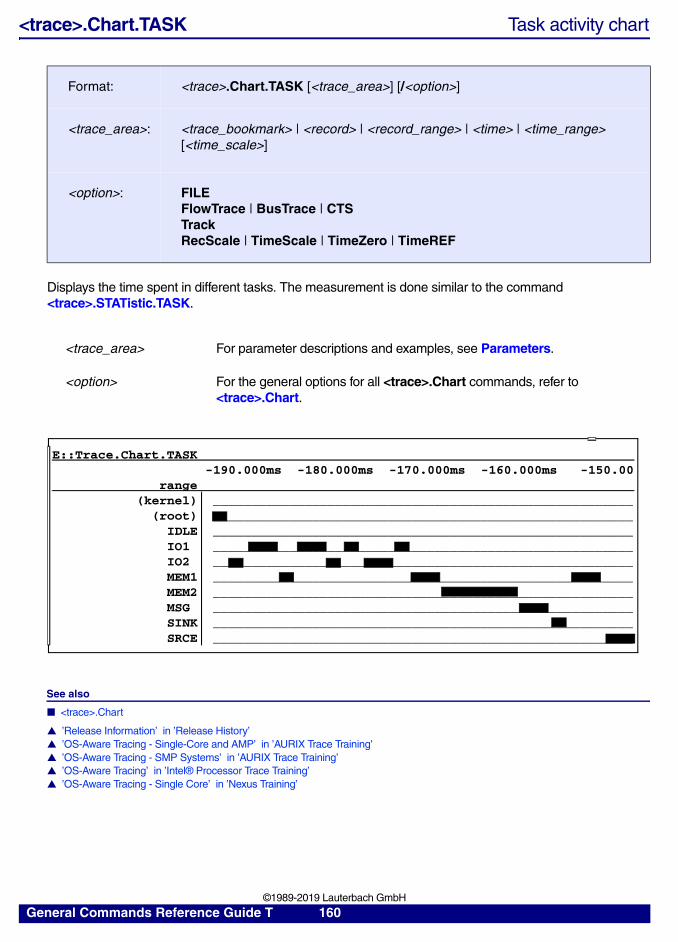
<trace>.Chart.TASK Task activity chart
Displays the time spent in different tasks. The measurement is done similar to the command <trace>.STATistic.TASK.
See also
■ <trace>.Chart
▲ ’Release Information’ in ’Release History’▲ ’OS-Aware Tracing - Single-Core and AMP’ in ’AURIX Trace Training’▲ ’OS-Aware Tracing - SMP Systems’ in ’AURIX Trace Training’▲ ’OS-Aware Tracing’ in ’Intel® Processor Trace Training’▲ ’OS-Aware Tracing - Single Core’ in ’Nexus Training’
Format: <trace>.Chart.TASK [<trace_area>] [/<option>]
<trace_area>: <trace_bookmark> | <record> | <record_range> | <time> | <time_range> [<time_scale>]
<option>: FILEFlowTrace | BusTrace | CTSTrackRecScale | TimeScale | TimeZero | TimeREF
<trace_area> For parameter descriptions and examples, see Parameters.
<option> For the general options for all <trace>.Chart commands, refer to <trace>.Chart.
E::Trace.Chart.TASK-190.000ms -180.000ms -170.000ms -160.000ms -150.00
range(kernel) _______________________________________________________
(root) _______________________________________________________IDLE _______________________________________________________IO1 _______________________________________________________IO2 _______________________________________________________MEM1 _______________________________________________________MEM2 _______________________________________________________MSG _______________________________________________________SINK _______________________________________________________SRCE _______________________________________________________
General Commands Reference Guide T 160 ©1989-2019 Lauterbach GmbH
<trace>.Chart.TASKFunc Task related function run-time analysis (legacy)
For details, refer to <trace>.Chart.Func.
See also
■ <trace>.Chart
<trace>.Chart.TASKINTR Display ISR2 time chart (ORTI)
Displays a ISR2 time chart.
See also
■ <trace>.Chart
▲ ’OS-Aware Tracing - Single-Core and AMP’ in ’AURIX Trace Training’▲ ’OS-Aware Tracing - SMP Systems’ in ’AURIX Trace Training’
Format: <trace>.Chart.TASKFunc [<record_range>] [<scale>] [/<option>] (legacy)
<option>: FILEFlowTrace | BusTrace | CTSTrackRecScale | TimeScale | TimeZero | TimeREF
Format: <trace>.Chart.TASKINTR [<trace_area>] [/<option>]
<trace_area>: <trace_bookmark> | <record> | <record_range> | <time> | <time_range> [<time_scale>]
<trace_area> For parameter descriptions and examples, see Parameters.
<option> For the general options for all <trace>.Chart commands, refer to <trace>.Chart.
General Commands Reference Guide T 161 ©1989-2019 Lauterbach GmbH
<trace>.Chart.TASKKernel Task run-time chart with kernel markers (flat)
Time chart for results of Trace.STATistic.TASKKernel.
See also
■ <trace>.Chart
Format: <trace>.Chart.TASKKernel [<trace_area>] [/<option>]
<trace_area>: <trace_bookmark> | <record> | <record_range> | <time> | <time_range> [<time_scale>]
<trace_area> For parameter descriptions and examples, see Parameters.
<option> For the general options for all <trace>.Chart commands, refer to <trace>.Chart.
General Commands Reference Guide T 162 ©1989-2019 Lauterbach GmbH
<trace>.Chart.TASKSRV Service routine run-time analysis
The time spent in OS service routines and different tasks is displayed. Service routines that are used by multiple tasks are displayed for each task. The measurement is similar to the command <trace>.STATistic.TASKSRV.
See also
■ <trace>.Chart
▲ ’OS-Aware Tracing - Single-Core and AMP’ in ’AURIX Trace Training’▲ ’OS-Aware Tracing - SMP Systems’ in ’AURIX Trace Training’
Format: <trace>.Chart.TASKSRV [<trace_area>] [/<option>]
<trace_area>: <trace_bookmark> | <record> | <record_range> | <time> | <time_range> [<time_scale>]
<option>: FILEFlowTrace | BusTrace | CTSTrackRecScale | TimeScale | TimeZero | TimeREF
<trace_area> For parameter descriptions and examples, see Parameters.
<option> For the general options for all <trace>.Chart commands, refer to <trace>.Chart.
General Commands Reference Guide T 163 ©1989-2019 Lauterbach GmbH
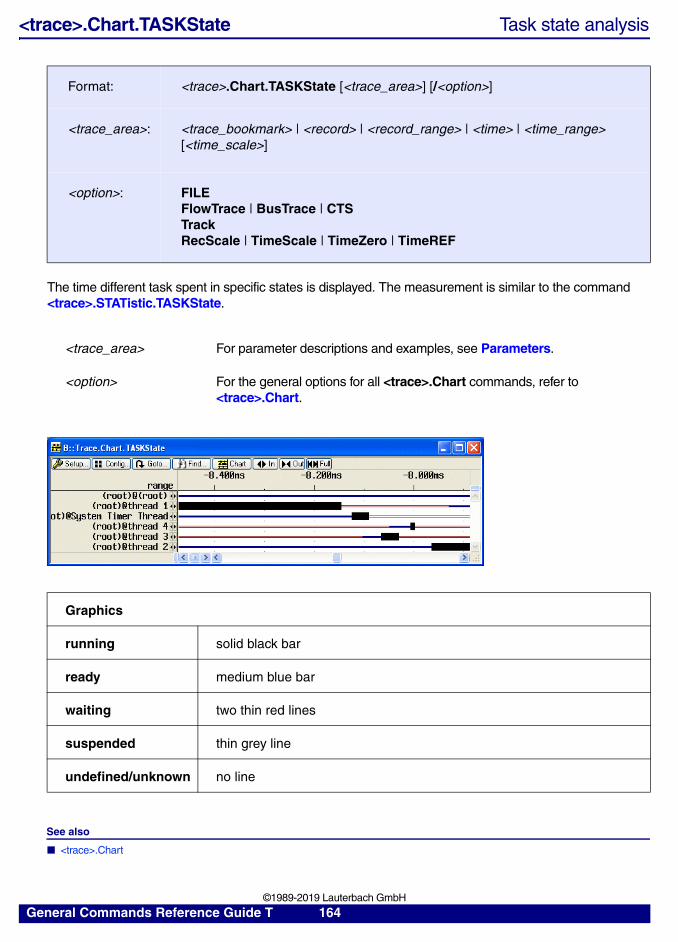
<trace>.Chart.TASKState Task state analysis
The time different task spent in specific states is displayed. The measurement is similar to the command <trace>.STATistic.TASKState.
See also
■ <trace>.Chart
Format: <trace>.Chart.TASKState [<trace_area>] [/<option>]
<trace_area>: <trace_bookmark> | <record> | <record_range> | <time> | <time_range> [<time_scale>]
<option>: FILEFlowTrace | BusTrace | CTSTrackRecScale | TimeScale | TimeZero | TimeREF
<trace_area> For parameter descriptions and examples, see Parameters.
<option> For the general options for all <trace>.Chart commands, refer to <trace>.Chart.
Graphics
running solid black bar
ready medium blue bar
waiting two thin red lines
suspended thin grey line
undefined/unknown no line
General Commands Reference Guide T 164 ©1989-2019 Lauterbach GmbH
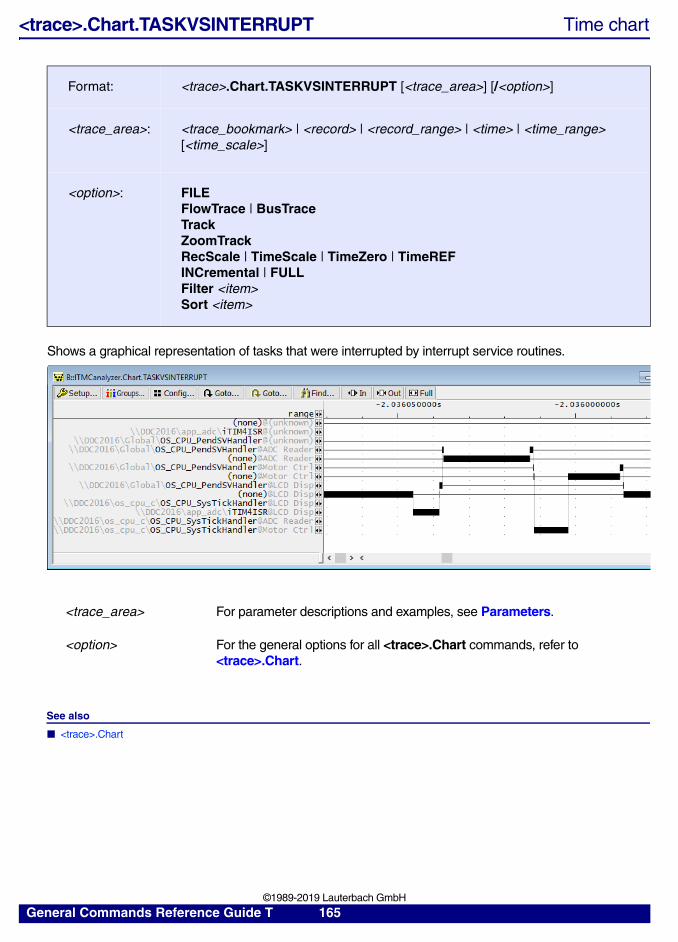
<trace>.Chart.TASKVSINTERRUPT Time chart
Shows a graphical representation of tasks that were interrupted by interrupt service routines.
See also
■ <trace>.Chart
Format: <trace>.Chart.TASKVSINTERRUPT [<trace_area>] [/<option>]
<trace_area>: <trace_bookmark> | <record> | <record_range> | <time> | <time_range> [<time_scale>]
<option>: FILEFlowTrace | BusTraceTrackZoomTrackRecScale | TimeScale | TimeZero | TimeREFINCremental | FULLFilter <item>Sort <item>
<trace_area> For parameter descriptions and examples, see Parameters.
<option> For the general options for all <trace>.Chart commands, refer to <trace>.Chart.
General Commands Reference Guide T 165 ©1989-2019 Lauterbach GmbH
<trace>.Chart.TASKVSINTR Time chart
Displays a time-chart for task-related interrupt service routines.
See also
■ <trace>.Chart
▲ ’OS-Aware Tracing - Single-Core and AMP’ in ’AURIX Trace Training’▲ ’OS-Aware Tracing - SMP Systems’ in ’AURIX Trace Training’
Format: <trace>.Chart.TASKVSINTR [<trace_area>] [/<options> …]
<trace_area>: <trace_bookmark> | <record> | <record_range> | <time> | <time_range> [<time_scale>]
<option>: FILEFlowTrace | BusTraceTrackZoomTrackRecScale | TimeScale | TimeZero | TimeREFINCremental | FULLSort <item>
<trace_area> For parameter descriptions and examples, see Parameters.
<option> For the general options for all <trace>.Chart commands, refer to <trace>.Chart.
General Commands Reference Guide T 166 ©1989-2019 Lauterbach GmbH
<trace>.Chart.TREE Display function chart as tree view
tbd.
See also
■ <trace>.Chart
<trace>.Chart.VarState Variable activity chart
Displays the contents of variables over the time. Each variable access must be sampled with one single CPU cycle. If an address is not a variable it is displayed in form of a single marker. This can be used to track program execution addresses.
Format: <trace>.Chart.TREE [<trace_area>] [/<option>]
<trace_area>: <trace_bookmark> | <record> | <record_range> | <time> | <time_range> [<time_scale>]
<trace_area> For parameter descriptions and examples, see Parameters.
<option> For the general options for all <trace>.Chart commands, refer to <trace>.Chart.
Format: <trace>.Chart.VarState [<trace_area>] [/<option>]
<trace_area>: <trace_bookmark> | <record> | <record_range> | <time> | <time_range> [<time_scale>]
<option>: FILEFlowTrace | BusTrace | CTSTrackRecScale | TimeScale | TimeZero | TimeREFFill | FillFirstDECODE <value> …Filter <item>
<trace_area> For parameter descriptions and examples, see Parameters.
<option> For the general options for all <trace>.Chart commands, refer to <trace>.Chart.
General Commands Reference Guide T 167 ©1989-2019 Lauterbach GmbH
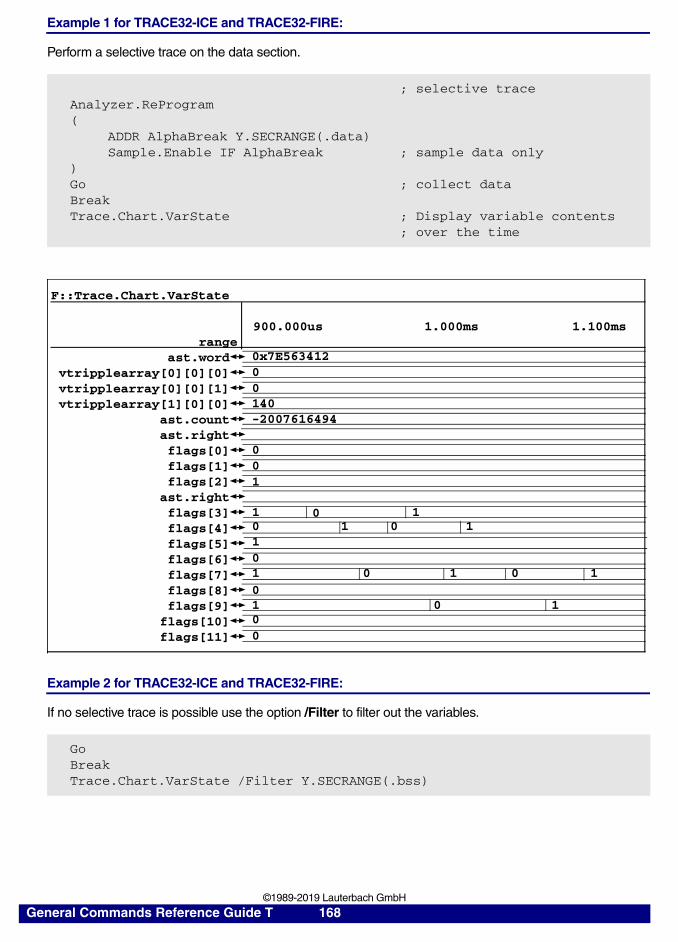
Example 1 for TRACE32-ICE and TRACE32-FIRE:
Perform a selective trace on the data section.
Example 2 for TRACE32-ICE and TRACE32-FIRE:
If no selective trace is possible use the option /Filter to filter out the variables.
Analyzer.ReProgram(
ADDR AlphaBreak Y.SECRANGE(.data)Sample.Enable IF AlphaBreak
)GoBreakTrace.Chart.VarState
; selective trace
; sample data only
; collect data
; Display variable contents; over the time
GoBreakTrace.Chart.VarState /Filter Y.SECRANGE(.bss)
F::Trace.Chart.VarState
900.000us 1.000ms 1.100msrange
ast.wordvtripplearray[0][0][0]vtripplearray[0][0][1]vtripplearray[1][0][0]
ast.countast.rightflags[0]flags[1]flags[2]ast.rightflags[3]flags[4]flags[5]flags[6]flags[7]flags[8]flags[9]flags[10]flags[11]
0x7E563412
00
140-2007616494
001
1 0 10 1 0 1101 0 1 0 101 0 100
General Commands Reference Guide T 168 ©1989-2019 Lauterbach GmbH
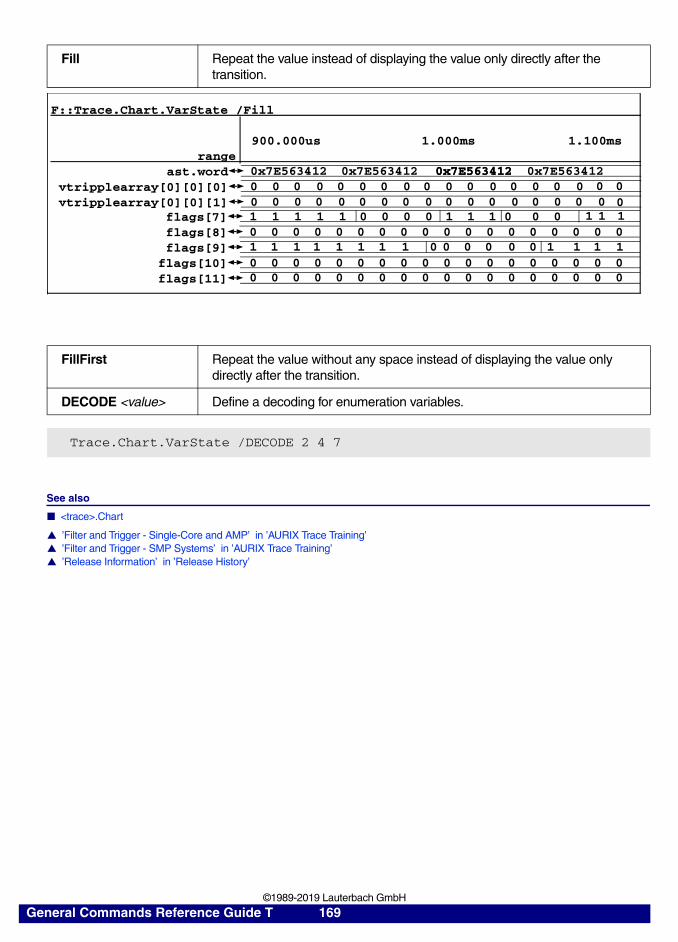
See also
■ <trace>.Chart
▲ ’Filter and Trigger - Single-Core and AMP’ in ’AURIX Trace Training’▲ ’Filter and Trigger - SMP Systems’ in ’AURIX Trace Training’▲ ’Release Information’ in ’Release History’
Fill Repeat the value instead of displaying the value only directly after the transition.
FillFirst Repeat the value without any space instead of displaying the value only directly after the transition.
DECODE <value> Define a decoding for enumeration variables.
Trace.Chart.VarState /DECODE 2 4 7
F::Trace.Chart.VarState /Fill
900.000us 1.000ms 1.100msrange
ast.wordvtripplearray[0][0][0]vtripplearray[0][0][1]
flags[7]flags[8]flags[9]
flags[10]flags[11]
0x7E563412
00
1 0 1 0 101 0 1
0x7E563412 0x7E563412 0x7E5634120x7E5634120 0 00 0 0 0 0 0 0 0 0 0 0 0 0 00 0 0 00 0 0 0 0 0 0 0 0 0 0 0 0
1 1 1 1 0 0 0 1 1 0 0 1 10 0 0 0 0 0 0 0 0 0 0 0 0 0 0 0 0
0 0 0 0 0 0 0 0 0 0 0 0 0 0 0 0 0 00 0 0 0 0 0 0 0 0 0 0 0 0 0 0 0 0 0
1 1 1 1 1 1 1 0 0 0 0 0 1 1 1
General Commands Reference Guide T 169 ©1989-2019 Lauterbach GmbH
<trace>.CLEAR Clear FDX communication buffers
FDX.CLEAR clears the communication buffers of a FDX channel. All buffer contents are lost. Without arguments all FDX channels will be cleared.
<trace>.CLOCK Clock to calculate time out of cycle count information
Some trace protocols can generate cycle count information. TRACE32 can calculate time information out of the cycle count information if the appropriate clock frequency is specified with the Trace.CLOCK command.
For most trace protocols cycle count indicates the number of core clock cycles. That’s why <frequency> has to be the core clock frequency. Please be aware the specifying the core clock frequency only makes sense if the frequency was constant while recording.
Example for the ARM-ETM:
If the cores of an SMP run at different speeds, the frequency can be specified per core.
See also
■ ETM.CycleAccurate
Format: <trace>.CLEAR [<address>]
<trace>: FDX
Format: <trace>.CLOCK <frequency><trace>.CLOCK <frequency0> <frequency1> … (SMP tracing only)
ETM.TImeMode CycleAccurate
Trace.CLOCK 800.MHz
ETM.TImeMode CycleAccurate
Trace.CLOCK 800.MHz 600.MHz 1.GHz
General Commands Reference Guide T 170 ©1989-2019 Lauterbach GmbH
<trace>.CLOSE Close FDX files
Closes the file related to the given FDX channel. Without arguments all files used by FDX are closed.
<trace>.ComPare Compare trace contents[Examples]
Compares the trace contents. If the command <trace>.ComPare is used without arguments the previous compare is repeated.
The compare function will set the pointers for the tracking option. All analyzer windows, which are in track mode, will follow these pointers.
For valid channel names refer to the:
• Processor Architecture Manuals
• Target Guides FIRE
• Target Guides ICE
Format: <trace>.CLOSE [<address>]
Format: <trace>.ComPare [<record_range>] [<record_number>] [{<items>}] [{/<options>}]
<options>: Tolerance <count>FILEBack
<item> Only the given <item> … are compared.
<record_range>, <record_number>
If <record_range> and <record_number> are not used, a comparison of the complete trace is performed.
FILE Compare the trace contents with the loaded file. See also Trace.FILE.
Back Compare backwards.
Tolerance <count> When external asynchronous data are traced, a jitter in the signal will result in different sampling data. In this case the precision of the compare function may be controlled by the option Tolerance.
General Commands Reference Guide T 171 ©1989-2019 Lauterbach GmbH
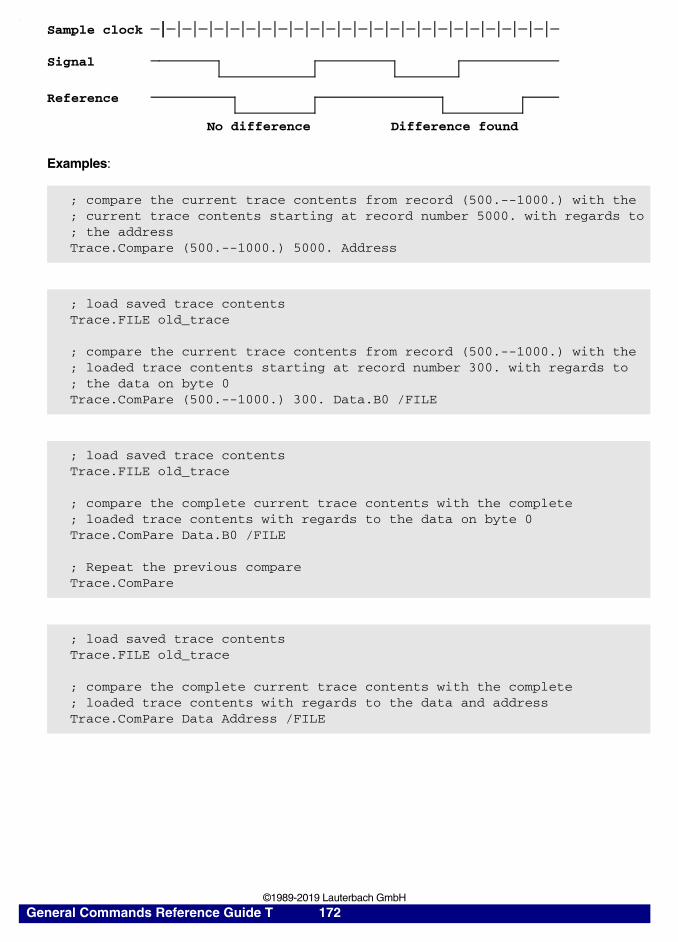
.
Examples:
; compare the current trace contents from record (500.--1000.) with the; current trace contents starting at record number 5000. with regards to; the addressTrace.Compare (500.--1000.) 5000. Address
; load saved trace contentsTrace.FILE old_trace
; compare the current trace contents from record (500.--1000.) with the; loaded trace contents starting at record number 300. with regards to; the data on byte 0Trace.ComPare (500.--1000.) 300. Data.B0 /FILE
; load saved trace contentsTrace.FILE old_trace
; compare the complete current trace contents with the complete; loaded trace contents with regards to the data on byte 0Trace.ComPare Data.B0 /FILE
; Repeat the previous compareTrace.ComPare
; load saved trace contentsTrace.FILE old_trace
; compare the complete current trace contents with the complete; loaded trace contents with regards to the data and addressTrace.ComPare Data Address /FILE
Sample clock
Signal
Reference
No difference Difference found
General Commands Reference Guide T 172 ©1989-2019 Lauterbach GmbH
See also
■ <trace>.state ■ Trace
<trace>.CSELect Select signal for counter
See also
■ Trace
; compare against file TEST1 on line RXD Port.FILE TEST1 ; load reference filePort.ComPare RXD /Tolerance 3. /FILE ; compare line RXDIF FOUND() ; print result if difference PRINT "Difference found" ; will be found…Port.ComPare ; search for next difference
Format: <trace>.CSELect <channel>
General Commands Reference Guide T 173 ©1989-2019 Lauterbach GmbH
<trace>.CustomTrace Custom trace
PRACTICE script examples of custom trace demos can be found in the following *_demo.cmm files:
• ~~/demo/customtrace/pipe_dll/dll_stp_demo.cmm
• ~~/demo/customtrace/pipe_dll/dll_csstm_demo.cmm
• ~~/demo/customtrace/pipe_dll/dll_itm_demo.cmm
For details about these files, refer to the readme.txt in the demo folder.
See also
■ <trace>.CustomTrace.<label>.COMMAND ■ <trace>.CustomTrace.<label>.UNLOAD ■ <trace>.CustomTraceLoad ■ <trace>.state ■ Trace
▲ ’Software Trace with the ITM’ in ’CombiProbe for Cortex-M User’s Guide’▲ ’Software Trace with the ITM’ in ’uTrace for Cortex-M User’s Guide’
<trace>.CustomTrace.<label>.COMMAND Send command to specific DLL
Sends a command to a specific DLL that has been assigned a user-defined <label>.
See also
■ <trace>.CustomTrace
<trace>.CustomTrace.<label>.UNLOAD Unload a single DLL
Unloads a single DLL identified by <label>.
See also
■ <trace>.CustomTrace
Format 1: <trace>.CustomTrace.<label>.COMMAND <command_line_args>
Format 1: <trace>.CustomTrace.<label>.UNLOAD
General Commands Reference Guide T 174 ©1989-2019 Lauterbach GmbH
<trace>.CustomTraceLoad Load a DLL for trace analysis/Unload all DLLs
Format 1: TRACE32 supports a mechanism for passing trace data to a shared library or DLL allowing for custom trace handling. This command loads the shared object.
Format 2: When executed with an empty string, the command unloads all DLLs.
See also
■ <trace>.CustomTrace ■ <trace>.state ■ Trace
Format 1: <trace>.CustomTraceLoad "<name>" <file>
Format 2: <trace>.CustomTraceLoad ""
NOTE: Use the command <trace>.CustomTrace.<label>.UNLOAD to unload a single DLL.
<name> A user-defined name for the DLL or shared object. TRACE32 supports up to 8 loaded shared objects at any one time. The <name> is used to differentiate them.
<file> A shared library or DLL which is appropriate for your host Operating System. This DLL will receive trace data from TRACE32 and perform custom analysis on it.
General Commands Reference Guide T 175 ©1989-2019 Lauterbach GmbH
<trace>.DISable Disable the trace
Disables the trace.
See also
■ CIProbe ■ <trace>.state ■ Trace
<trace>.DISableChannel Disable FDX communication
Disables an FDX communication channel. Without parameters all channels are disabled. Disabling keeps the buffer contents of FDX. Communication can be re-enabled with FDX.ENableChannel.
See also
■ Trace
Format: <trace>.DISable
Format: <trace>.DISableChannel [<address>]
General Commands Reference Guide T 176 ©1989-2019 Lauterbach GmbH
<trace>.DisConfig Trace disassembler configuration
For background information and examples about how to use the <trace>.DisConfig command group, see:
• “PowerIntegrator Trace DisConfig Application Note” (powerintegrator_app_dc.pdf)
• www.lauterbach.com/publications/advanced_debug_with_powerintegrator.pdf
See also
■ <trace>.DisConfig.CYcle ■ <trace>.DisConfig.FlowMode ■ <trace>.DisConfig.RESet ■ <trace>.DisConfig.view ■ <trace>.state ■ Trace
▲ ’General Function’ in ’PowerIntegrator Trace DisConfig Application Note’
Debugger only
<trace>.DisConfig.CYcle Trace disassemble setting
Format: <trace>.DisConfig.CYcle "<name> [, <ext>]" <cycle>
<cycle>: Read <definition>Write <definition>Fetch <definition>FLOW <definition>Fetch1 <definition>ReadOrFetch <definition>ReadSpecial <definition>WriteSpecial <definition>MERGE ["<name>" <offset>...]
<definition>: TransientStrobe [<time>] [<channels>]
Strobe[2|3] [[<channel> [Low | High | Falling | Rising]]
Strobe[2|3]Sample [Last | Next | AT number] [<channel> [Low | High | Falling | Rising]]
Address[2]Sample [Last | Next | AT number] [<channel> [Low | High | Falling | Rising]]
Address[2] [<channels>
Address[2]SHift <value>
General Commands Reference Guide T 177 ©1989-2019 Lauterbach GmbH
The command <trace>.DisConfig.CYcle informs the trace software where to find program-fetch, data-read and data-write cycles in a not qualified trace recording which was taken by the PowerProbe or PowerIntegrator. With this information a standard bus trace listing can be generated.
See also
■ <trace>.DisConfig ■ <trace>.DisConfig.view
AddressBase <address>
Data[2]Sample [Last | Next | AT number] [<channel> [Low | High | Falling | Rising]]
Data[2] [<channels>]
Data[2]SHift <value>
DataUnknown tbd.
DataWidthUnknown
SpaceID | SpaceIDSample tbd.
Word | Group | Integrator.<x> | eXt.<x>
<name>, <ext> “name” is displayed in the cycle-type row of the Trace.List window. Its length is limited to 7. The ”ext” is not displayed but used to differ between cycle types.Example: “rd_byte,0” --> rd_byte.This way it is possible to define different cycle types (rd_byte,0; rd_byte,1 …) which are displayed in the same way (rd_byte)
<cycle> Is used by the trace disassembler• Read: data read cycle• Write: data write cycle• Fetch: program fetch cycle• Fetch1: first program fetch code of an instruction• ReadOrFetch: data-read or program-fetch cycle. The disassembler will do
the final decision out of the program flow knowledge• ReadSpecial: special cycle (e.g. dma)• WriteSpecial: tbd.• MERGE: merge the data of multiple cycles
<definition> Defines where to find a <cycle> in the trace, where to find the appropriate address and data, and how to display them.
General Commands Reference Guide T 178 ©1989-2019 Lauterbach GmbH
Debugger only
<trace>.DisConfig.FlowMode Enable FlowTrace analysis
Enables the analysis of certain FlowTrace protocols like ARM-ETM.
See also
■ <trace>.DisConfig ■ <trace>.DisConfig.view
Debugger only
<trace>.DisConfig.RESet Reset trace disassemble setting
Resets the trace disassemble setting.
See also
■ <trace>.DisConfig ■ <trace>.DisConfig.view
<trace>.DisConfig.view Trace disassemble setting
tbd.
See also
■ <trace>.DisConfig ■ <trace>.DisConfig.CYcle ■ <trace>.DisConfig.FlowMode ■ <trace>.DisConfig.RESet
Format: <trace>.DisConfig.FlowMode [ETMB | ETMK | OFF]
OFF FlowTrace analysis disabled
ETMB ARM-ETM FlowTrace analysis enabled, Mictor probe AB in use.
ETMK ARM-ETM FlowTrace analysis enabled, Mictor probe JK in use.
Format: <trace>.DisConfig.RESet
Format: <trace>.DisConfig.view
General Commands Reference Guide T 179 ©1989-2019 Lauterbach GmbH
<trace>.DRAW Plot trace data against time
The <trace>.DRAW command group can be used to plot the values of recorded trace data against time.
See also
■ <trace>.state ■ Trace ■ <trace>.DRAW.channel ■ <trace>.DRAW.Data ■ <trace>.DRAW.Var ■ CIProbe ■ Data.DRAW ■ Data.DRAWFFT ■ Data.DRAWXY ■ Data.IMAGE ■ Var.DRAW
▲ ’Introduction’ in ’Application Note for the Trace.DRAW Command’▲ ’How to use the PROTOanalyzer’ in ’DigRF Protocol Analyzer’▲ ’Release Information’ in ’Release History’
<trace>.DRAW.channel Plot no-data values against time
Plot specified <item> against time. This command is mainly used to plot no-data items.
Format: <trace>.DRAW.channel [<record_range>] [%<format>] [<items …>] [/<options>]<trace>.Chart.Draw (deprecated)
<record_range>:
<start_record>--<end_record>
<format>: Decimal. [<width>]DecimalU. [<width>]Hex. [<width>]Float. [Ieee | IeeeDbl | IeeeeXt | IeeeMFFP | …]
<width>: DEFault | Byte | Word | Long | Quad | TByte | HByte
<items>: ENERGY.Abs | POWER …
<options>: <draw_options> | FILE | BusTrace | RecScale | TimeScale | TimeZero | TimeREF | MinMax | Color | LOG | FIRST | Filter <filter_items> | Track | ZoomTrack
<draw_options>:
Points | Vector | MarkedVector | Steps | Impulses
<filter_items>: <range> | <address> | <bitmask>
General Commands Reference Guide T 180 ©1989-2019 Lauterbach GmbH
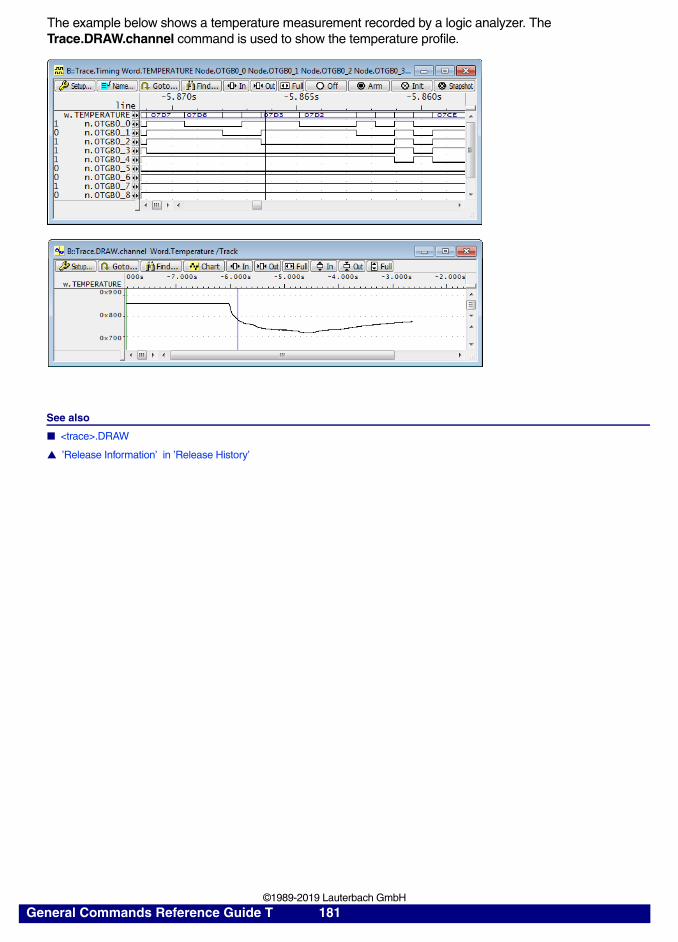
The example below shows a temperature measurement recorded by a logic analyzer. The Trace.DRAW.channel command is used to show the temperature profile.
See also
■ <trace>.DRAW
▲ ’Release Information’ in ’Release History’
General Commands Reference Guide T 181 ©1989-2019 Lauterbach GmbH
<trace>.DRAW.Data Plot data values against time
Plots one or more data values. An introduction to the usage of the Trace.DRAW.Data command is provided in “Application Note for the Trace.DRAW Command” (app_trace_draw.pdf).
Format 1: <trace>.DRAW.Data %[<format>] {<data_address> | <data_range>} [/<options>]
Format 2: <trace>.DRAW.Data [<start> | <range>] [<hscale>] <vscale> <v_offset> [%<format>] {<data_address>} [/<options>]
<format>: [<radix> .]<width>
<start>: <bookmark> | <record> | <time>
<range>: <record_range> | <time_range>
<vscale>:<v_offset>:
<float>
<hscale>: <time>
<radix>: Decimal | DecimalU | Hex | HexS | OCTal
<width>: DEFaultByte | Word | Long | Quad | …
<option>: [<source_option>] [<draw_option>] [<scale_option>] [<zoom_option>]
<source_option>:
FILE | FlowTrace | BusTrace
<draw_option>:
Points | Vector | MarkedVector | Steps | Impulses | MinMax | LOG
<scale_option>:
RecScale | TimeScale | TimeZero | TimeREF
<zoom_option>:
Track | ZoomTrack
General Commands Reference Guide T 182 ©1989-2019 Lauterbach GmbH
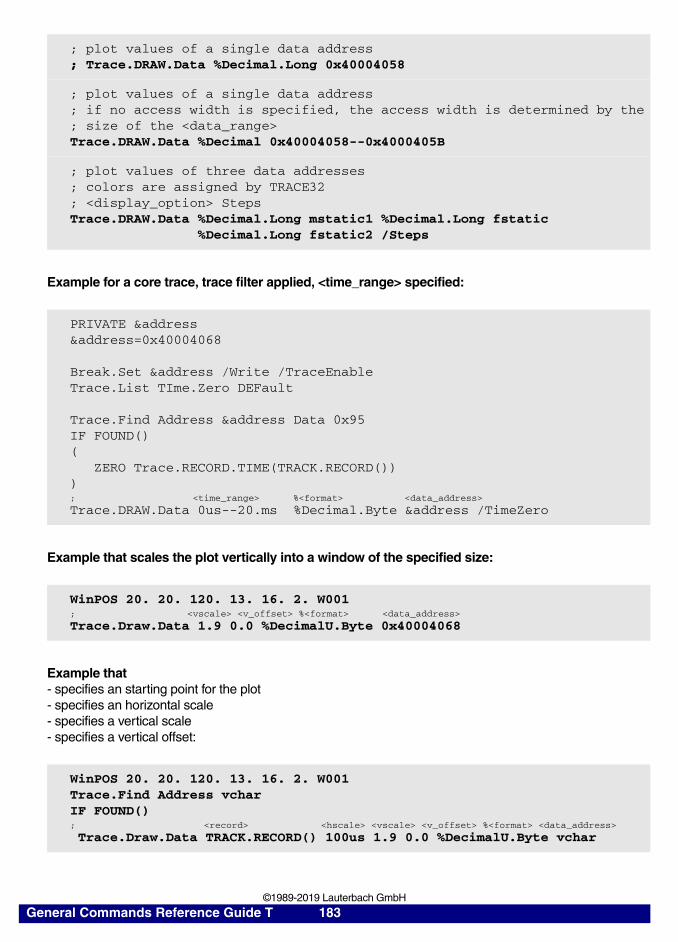
Example for a core trace, trace filter applied, <time_range> specified:
Example that scales the plot vertically into a window of the specified size:
Example that - specifies an starting point for the plot- specifies an horizontal scale- specifies a vertical scale- specifies a vertical offset:
; plot values of a single data address ; Trace.DRAW.Data %Decimal.Long 0x40004058
; plot values of a single data address ; if no access width is specified, the access width is determined by the; size of the <data_range>Trace.DRAW.Data %Decimal 0x40004058--0x4000405B
; plot values of three data addresses; colors are assigned by TRACE32; <display_option> StepsTrace.DRAW.Data %Decimal.Long mstatic1 %Decimal.Long fstatic %Decimal.Long fstatic2 /Steps
PRIVATE &address&address=0x40004068
Break.Set &address /Write /TraceEnableTrace.List TIme.Zero DEFault
Trace.Find Address &address Data 0x95 IF FOUND()( ZERO Trace.RECORD.TIME(TRACK.RECORD())); <time_range> %<format> <data_address>
Trace.DRAW.Data 0us--20.ms %Decimal.Byte &address /TimeZero
WinPOS 20. 20. 120. 13. 16. 2. W001; <vscale> <v_offset> %<format> <data_address>
Trace.Draw.Data 1.9 0.0 %DecimalU.Byte 0x40004068
WinPOS 20. 20. 120. 13. 16. 2. W001Trace.Find Address vcharIF FOUND(); <record> <hscale> <vscale> <v_offset> %<format> <data_address>
Trace.Draw.Data TRACK.RECORD() 100us 1.9 0.0 %DecimalU.Byte vchar
General Commands Reference Guide T 183 ©1989-2019 Lauterbach GmbH
Description of the <trace>.DRAW.Data Parameters
<record_range>To specify the record range, open the Trace.List window. Then choose the record range you want to plot.
Example:
Supported Radices
• Decimal, DecimalU (Decimal Unsigned), Hex, and Float format the display of the y-axis.
• Float. The following floating-point formats are available:
- Ieee | IeeeDbl | IeeeeXt | IeeeQuad | IeeeXt10 | IeeeRev | IeeeS | IeeeDblS | IeeeDblT |
- MFFP | Pdp11 | Pdp11Dbl | RTOSUH | RTOSUHD |
- Dsp16 | Dsp16C | Dsp16Fix | Dsp32Fix |
- M56 | M560 | M561 | LACCUM |
- Fract8 | Fract16 | Fract24 | Fract32 | Fract48 | Fract64 |
- UFract8 | UFract16 | UFract24 | UFract32 | UFract48 | UFract64 | Fract40G |
- MICRO | MICRO64 | MILLI | MILLI64 | NANO64 | PICO64
Basic Options
FILE: Visualizes the trace contents loaded with the command <trace>.FILE.
BusTrace: This option is usually not required. It switches off the FlowTrace decoder. In the bus trace mode, all valid bus cycles are sampled.
; Opens the Trace.List window.Trace.List /Track
; Plot graph for the specified record range.Trace.DRAW.Data (-131072.)--(-121070.) %Hex.Word 0x1234 /Track
General Commands Reference Guide T 184 ©1989-2019 Lauterbach GmbH
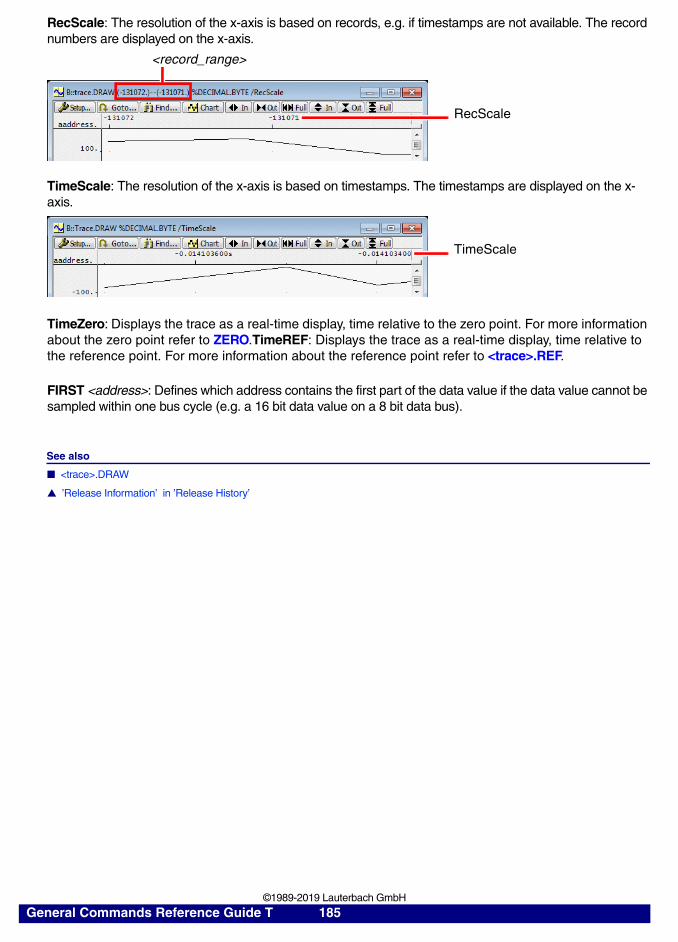
RecScale: The resolution of the x-axis is based on records, e.g. if timestamps are not available. The record numbers are displayed on the x-axis.
TimeScale: The resolution of the x-axis is based on timestamps. The timestamps are displayed on the x-axis.
TimeZero: Displays the trace as a real-time display, time relative to the zero point. For more information about the zero point refer to ZERO.TimeREF: Displays the trace as a real-time display, time relative to the reference point. For more information about the reference point refer to <trace>.REF.
FIRST <address>: Defines which address contains the first part of the data value if the data value cannot be sampled within one bus cycle (e.g. a 16 bit data value on a 8 bit data bus).
See also
■ <trace>.DRAW
▲ ’Release Information’ in ’Release History’
RecScale
<record_range>
TimeScale
General Commands Reference Guide T 185 ©1989-2019 Lauterbach GmbH
<trace>.DRAW.Var Plot variable values against time
Plots the value changes of one or more variables against time, based on the recorded trace information. An introduction to the usage of the Trace.DRAW.Var command is provided in “Application Note for the Trace.DRAW Command” (app_trace_draw.pdf).
Format 1: <trace>.DRAW.Var %[<format>] {<var>} [/<options>]
Format 2: <trace>.DRAW.Var [<start> | <range>] [<hscale>] <vscale> <v_offset> [%<format>] {<var>} [/<options>]
<start>: <bookmark> | <record> | <time>
<range>: <record_range> | <time_range>
<vscale>:<v_offset>:
<float>
<hscale>: <time>
<format>: DEFault | STandDard | Decimal | Hex
<option>: [<source_option>] [<draw_option>] [<scale_option>] [<zoom_option>]
<source_option>:
FILE | FlowTrace | BusTrace
<draw_option>:
Points | Vector | MarkedVector | Steps | Impulses | MinMax | LOG
<scale_option>:
RecScale | TimeScale | TimeZero | TimeREF
<zoom_option>:
Track | ZoomTrack
General Commands Reference Guide T 186 ©1989-2019 Lauterbach GmbH
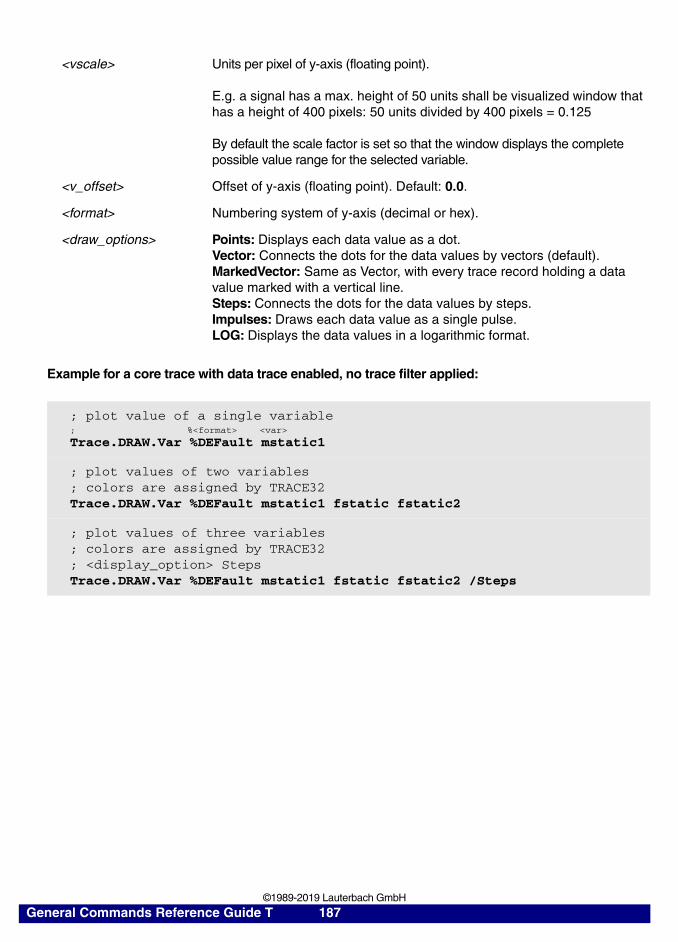
Example for a core trace with data trace enabled, no trace filter applied:
<vscale> Units per pixel of y-axis (floating point).
E.g. a signal has a max. height of 50 units shall be visualized window that has a height of 400 pixels: 50 units divided by 400 pixels = 0.125
By default the scale factor is set so that the window displays the complete possible value range for the selected variable.
<v_offset> Offset of y-axis (floating point). Default: 0.0.
<format> Numbering system of y-axis (decimal or hex).
<draw_options> Points: Displays each data value as a dot.Vector: Connects the dots for the data values by vectors (default).MarkedVector: Same as Vector, with every trace record holding a data value marked with a vertical line.Steps: Connects the dots for the data values by steps.Impulses: Draws each data value as a single pulse.LOG: Displays the data values in a logarithmic format.
; plot value of a single variable; %<format> <var>
Trace.DRAW.Var %DEFault mstatic1
; plot values of two variables; colors are assigned by TRACE32Trace.DRAW.Var %DEFault mstatic1 fstatic fstatic2
; plot values of three variables; colors are assigned by TRACE32; <display_option> StepsTrace.DRAW.Var %DEFault mstatic1 fstatic fstatic2 /Steps
General Commands Reference Guide T 187 ©1989-2019 Lauterbach GmbH
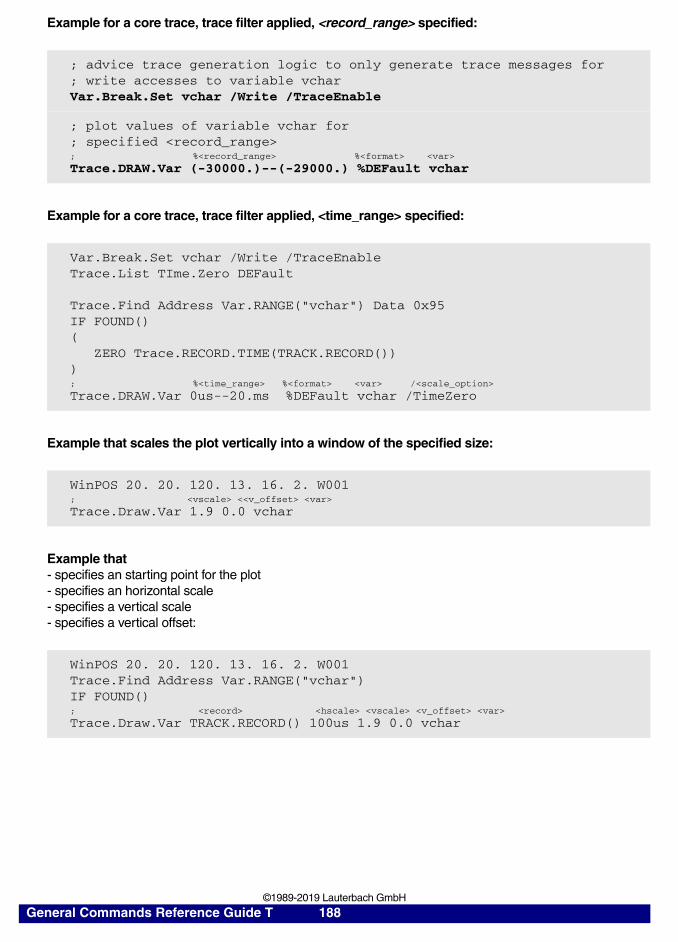
Example for a core trace, trace filter applied, <record_range> specified:
Example for a core trace, trace filter applied, <time_range> specified:
Example that scales the plot vertically into a window of the specified size:
Example that - specifies an starting point for the plot- specifies an horizontal scale- specifies a vertical scale- specifies a vertical offset:
; advice trace generation logic to only generate trace messages for ; write accesses to variable vcharVar.Break.Set vchar /Write /TraceEnable
; plot values of variable vchar for; specified <record_range>; %<record_range> %<format> <var>
Trace.DRAW.Var (-30000.)--(-29000.) %DEFault vchar
Var.Break.Set vchar /Write /TraceEnableTrace.List TIme.Zero DEFault
Trace.Find Address Var.RANGE("vchar") Data 0x95 IF FOUND()( ZERO Trace.RECORD.TIME(TRACK.RECORD())); %<time_range> %<format> <var> /<scale_option>
Trace.DRAW.Var 0us--20.ms %DEFault vchar /TimeZero
WinPOS 20. 20. 120. 13. 16. 2. W001; <vscale> <<v_offset> <var>
Trace.Draw.Var 1.9 0.0 vchar
WinPOS 20. 20. 120. 13. 16. 2. W001Trace.Find Address Var.RANGE("vchar")IF FOUND(); <record> <hscale> <vscale> <v_offset> <var>
Trace.Draw.Var TRACK.RECORD() 100us 1.9 0.0 vchar
General Commands Reference Guide T 188 ©1989-2019 Lauterbach GmbH
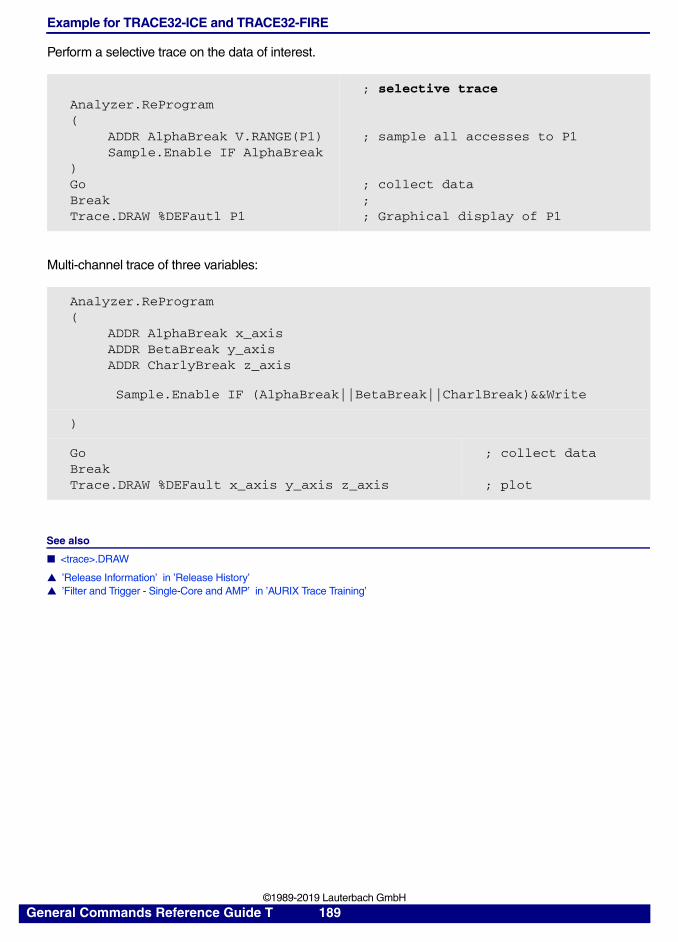
Example for TRACE32-ICE and TRACE32-FIRE
Perform a selective trace on the data of interest.
Multi-channel trace of three variables:
See also
■ <trace>.DRAW
▲ ’Release Information’ in ’Release History’▲ ’Filter and Trigger - Single-Core and AMP’ in ’AURIX Trace Training’
Analyzer.ReProgram(
ADDR AlphaBreak V.RANGE(P1)Sample.Enable IF AlphaBreak
) GoBreakTrace.DRAW %DEFautl P1
; selective trace
; sample all accesses to P1
; collect data;; Graphical display of P1
Analyzer.ReProgram(
ADDR AlphaBreak x_axisADDR BetaBreak y_axisADDR CharlyBreak z_axis
Sample.Enable IF (AlphaBreak||BetaBreak||CharlBreak)&&Write
)
GoBreakTrace.DRAW %DEFault x_axis y_axis z_axis
; collect data
; plot
General Commands Reference Guide T 189 ©1989-2019 Lauterbach GmbH
<trace>.Enable Operation mode
If the port analyzer is in timing mode (not slave), it will be run either totally free or controlled by the emulator operation.
<trace>.ENableChannel Enable FDX communication
Enables the data transfer over a FDX channel. Without parameters all existing FDX channels are enabled.
Format: <trace>.Enable [ALways | Running]
ALways The analyzer can be used independently of the state of the emulator.
Running The port analyzer is enabled only, while the emulator system is in real-time emulation. When running to a breakpoint or stopped by an asynchronous event, the timing analyzer will be stopped, too. The trigger system of the port analyzer is not activated until the emulation is started.
Format: <trace>.ENableChannel [<address>]
General Commands Reference Guide T 190 ©1989-2019 Lauterbach GmbH
<trace>.EXPORT Export trace data for processing in other applications
Using the <trace>.EXPORT command group, you can export trace data for processing in other applications. Various export file formats are available, including ASCII, binary, PGT, VERILOG, etc.
See also
■ <trace>.SAVE ■ <trace>.state ■ Trace ■ <trace>.EXPORT.Ascii ■ <trace>.EXPORT.Bin ■ <trace>.EXPORT.BRANCHFLOW ■ <trace>.EXPORT.CSVFunc ■ <trace>.EXPORT.flow ■ <trace>.EXPORT.Func ■ <trace>.EXPORT.MTV ■ <trace>.EXPORT.TASKEVENTS ■ <trace>.EXPORT.TracePort ■ <trace>.EXPORT.VCD ■ <trace>.EXPORT.VERILOG ■ <trace>.EXPORT.VHDL ■ <trace>.IMPORT
▲ ’Release Information’ in ’Release History’▲ ’Further NEXUS Trace Analysis’ in ’ARM Application Note for MXC Chips’▲ ’Further NEXUS Trace Analysis’ in ’StarCore Application Note for MXC Chips’
NOTE: The various export formats are primarily designed for import into other applications.Trace data exported with the <trace>.EXPORT.* commands can only be imported back into TRACE32 if you inform the debugger about all the trace-relevant circumstances.
We recommend the following approach if you want to view and analyze recorded trace data in a subsequent TRACE32 session:1. Save the trace data to file using <trace>.SAVE. 2. To load this file back into TRACE32, use <trace>.LOAD.
General Commands Reference Guide T 191 ©1989-2019 Lauterbach GmbH
<trace>.EXPORT.Ascii Export trace data as ASCII
Exports the trace contents to an ASCII file. White spaces are used as delimiters.
Example:
The backslash \ is used as a line continuation character. No white space permitted after the backslash.
See also
■ <trace>.EXPORT ■ <trace>.EXPORT.flow
Format: <trace>.EXPORT.Ascii <file> [<record_range>] [<items> …] [/<options>]
<option>: FILE | BusTraceFILTER ShowRecord
<file> The default extension of the file name is *.ad.
FILTER Exports only records matching the filter. For an example, see below.
ShowRecord Includes the trace record numbers in the export file.
<option> For a description of the other <options>, see <trace>.EXPORT.flow.
Trace.EXPORT.Ascii ~~\myfile.ad (-120000.)--(-1.) /ShowRecord \ /FILTER ADDRESS Var.RANGE(sieve)
General Commands Reference Guide T 192 ©1989-2019 Lauterbach GmbH
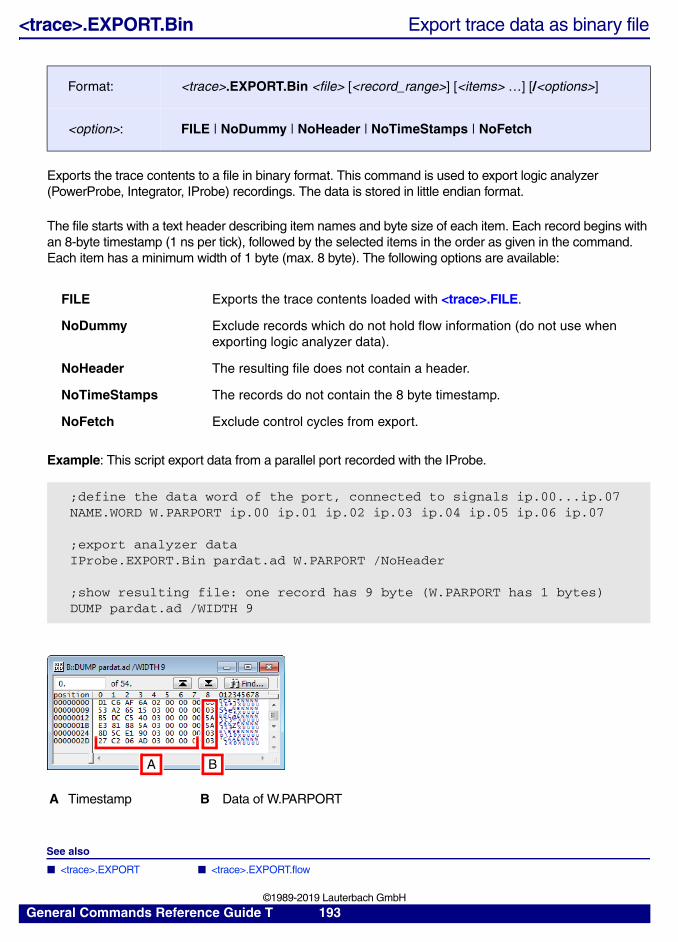
<trace>.EXPORT.Bin Export trace data as binary file
Exports the trace contents to a file in binary format. This command is used to export logic analyzer (PowerProbe, Integrator, IProbe) recordings. The data is stored in little endian format.
The file starts with a text header describing item names and byte size of each item. Each record begins with an 8-byte timestamp (1 ns per tick), followed by the selected items in the order as given in the command. Each item has a minimum width of 1 byte (max. 8 byte). The following options are available:
Example: This script export data from a parallel port recorded with the IProbe.
See also
■ <trace>.EXPORT ■ <trace>.EXPORT.flow
Format: <trace>.EXPORT.Bin <file> [<record_range>] [<items> …] [/<options>]
<option>: FILE | NoDummy | NoHeader | NoTimeStamps | NoFetch
FILE Exports the trace contents loaded with <trace>.FILE.
NoDummy Exclude records which do not hold flow information (do not use when exporting logic analyzer data).
NoHeader The resulting file does not contain a header.
NoTimeStamps The records do not contain the 8 byte timestamp.
NoFetch Exclude control cycles from export.
;define the data word of the port, connected to signals ip.00...ip.07NAME.WORD W.PARPORT ip.00 ip.01 ip.02 ip.03 ip.04 ip.05 ip.06 ip.07
;export analyzer dataIProbe.EXPORT.Bin pardat.ad W.PARPORT /NoHeader
;show resulting file: one record has 9 byte (W.PARPORT has 1 bytes)DUMP pardat.ad /WIDTH 9
A Timestamp B Data of W.PARPORT
A B
General Commands Reference Guide T 193 ©1989-2019 Lauterbach GmbH
<trace>.EXPORT.BRANCHFLOW Export branch events from trace data
Exports the branch events from the trace data.
See also
■ <trace>.EXPORT ■ <trace>.EXPORT.flow
Format: <trace>.EXPORT.BRANCHFLOW <file> [<record_range>] [/<options>]
<option>: TRaceRecord | NOINNER | NOSYMBOL | CALLer
TRaceRecord Branch events are exported with trace record numbers.
NOINNER Only branch events that jump to the current symbol are exported. The internal branch is not exported.
NOSYMBOL Branch events are exported with addresses instead of symbols.
CALLer Branch events are exported with caller events.
General Commands Reference Guide T 194 ©1989-2019 Lauterbach GmbH

<trace>.EXPORT.CSVFunc Export the function nesting to a CSV file
Exports the function nesting of the recorded trace data to a CSV file for processing by an external tool.
Example:
See also
■ <trace>.EXPORT ■ <trace>.EXPORT.flow
▲ ’Release Information’ in ’Release History’
Format: <trace>.EXPORT.CSVFunc <file> [<trace_area>]
<trace_area>: <string><range><value><timerange>
<file> The default extension of the file name is *.csv.
;export the entire function nestingAnalyzer.EXPORT.CSVFunc ~~\csvfunc_all.csv
EDIT ~~\csvfunc_all.csv
General Commands Reference Guide T 195 ©1989-2019 Lauterbach GmbH
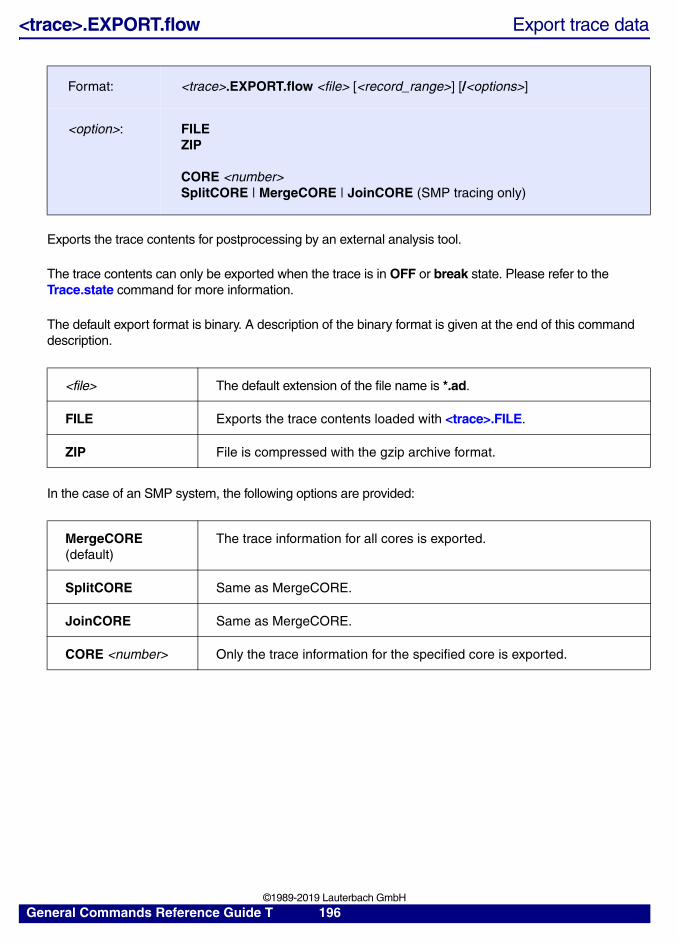
<trace>.EXPORT.flow Export trace data
Exports the trace contents for postprocessing by an external analysis tool.
The trace contents can only be exported when the trace is in OFF or break state. Please refer to the Trace.state command for more information.
The default export format is binary. A description of the binary format is given at the end of this command description.
In the case of an SMP system, the following options are provided:
Format: <trace>.EXPORT.flow <file> [<record_range>] [/<options>]
<option>: FILEZIP
CORE <number>SplitCORE | MergeCORE | JoinCORE (SMP tracing only)
<file> The default extension of the file name is *.ad.
FILE Exports the trace contents loaded with <trace>.FILE.
ZIP File is compressed with the gzip archive format.
MergeCORE(default)
The trace information for all cores is exported.
SplitCORE Same as MergeCORE.
JoinCORE Same as MergeCORE.
CORE <number> Only the trace information for the specified core is exported.
General Commands Reference Guide T 196 ©1989-2019 Lauterbach GmbH
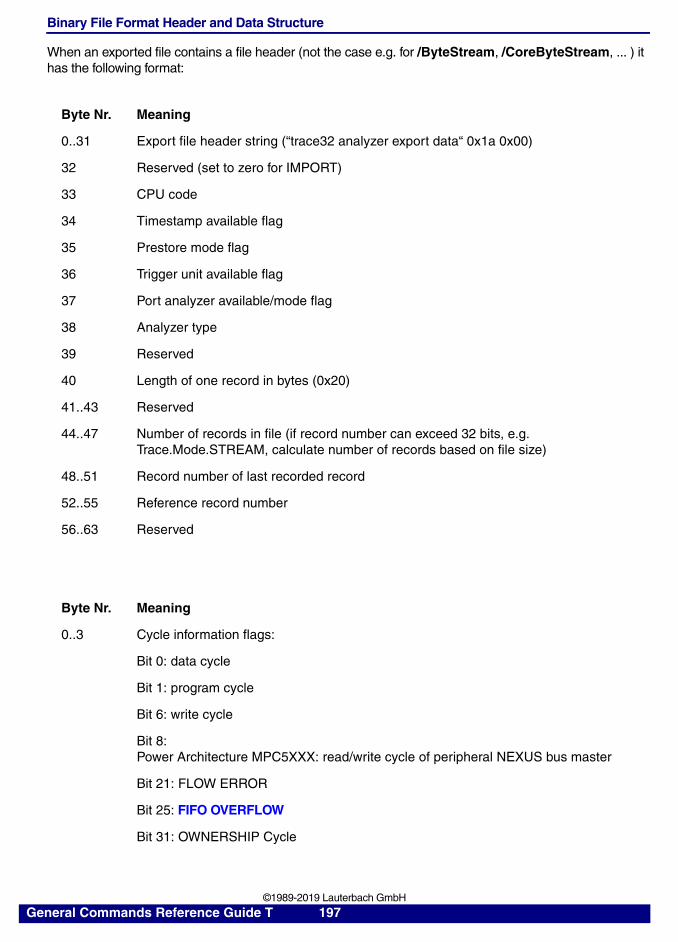
Binary File Format Header and Data Structure
When an exported file contains a file header (not the case e.g. for /ByteStream, /CoreByteStream, ... ) it has the following format:
Byte Nr. Meaning
0..31 Export file header string (“trace32 analyzer export data“ 0x1a 0x00)
32 Reserved (set to zero for IMPORT)
33 CPU code
34 Timestamp available flag
35 Prestore mode flag
36 Trigger unit available flag
37 Port analyzer available/mode flag
38 Analyzer type
39 Reserved
40 Length of one record in bytes (0x20)
41..43 Reserved
44..47 Number of records in file (if record number can exceed 32 bits, e.g. Trace.Mode.STREAM, calculate number of records based on file size)
48..51 Record number of last recorded record
52..55 Reference record number
56..63 Reserved
Byte Nr. Meaning
0..3 Cycle information flags:
Bit 0: data cycle
Bit 1: program cycle
Bit 6: write cycle
Bit 8: Power Architecture MPC5XXX: read/write cycle of peripheral NEXUS bus master
Bit 21: FLOW ERROR
Bit 25: FIFO OVERFLOW
Bit 31: OWNERSHIP Cycle
General Commands Reference Guide T 197 ©1989-2019 Lauterbach GmbH
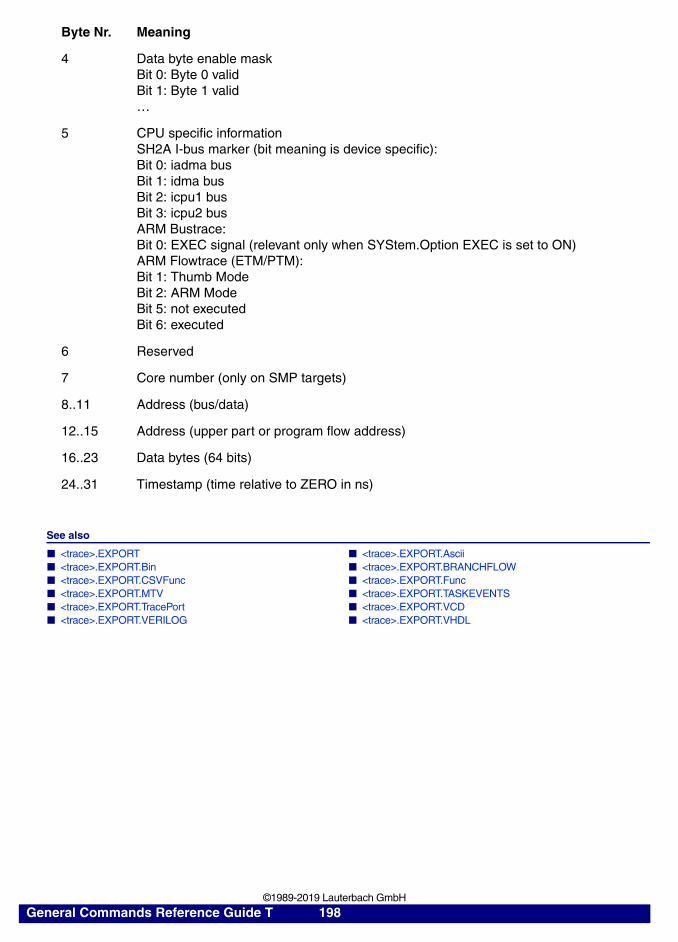
See also
■ <trace>.EXPORT ■ <trace>.EXPORT.Ascii ■ <trace>.EXPORT.Bin ■ <trace>.EXPORT.BRANCHFLOW ■ <trace>.EXPORT.CSVFunc ■ <trace>.EXPORT.Func ■ <trace>.EXPORT.MTV ■ <trace>.EXPORT.TASKEVENTS ■ <trace>.EXPORT.TracePort ■ <trace>.EXPORT.VCD ■ <trace>.EXPORT.VERILOG ■ <trace>.EXPORT.VHDL
4 Data byte enable maskBit 0: Byte 0 validBit 1: Byte 1 valid…
5 CPU specific informationSH2A I-bus marker (bit meaning is device specific):Bit 0: iadma busBit 1: idma busBit 2: icpu1 busBit 3: icpu2 busARM Bustrace:Bit 0: EXEC signal (relevant only when SYStem.Option EXEC is set to ON)ARM Flowtrace (ETM/PTM):Bit 1: Thumb ModeBit 2: ARM ModeBit 5: not executedBit 6: executed
6 Reserved
7 Core number (only on SMP targets)
8..11 Address (bus/data)
12..15 Address (upper part or program flow address)
16..23 Data bytes (64 bits)
24..31 Timestamp (time relative to ZERO in ns)
Byte Nr. Meaning
General Commands Reference Guide T 198 ©1989-2019 Lauterbach GmbH
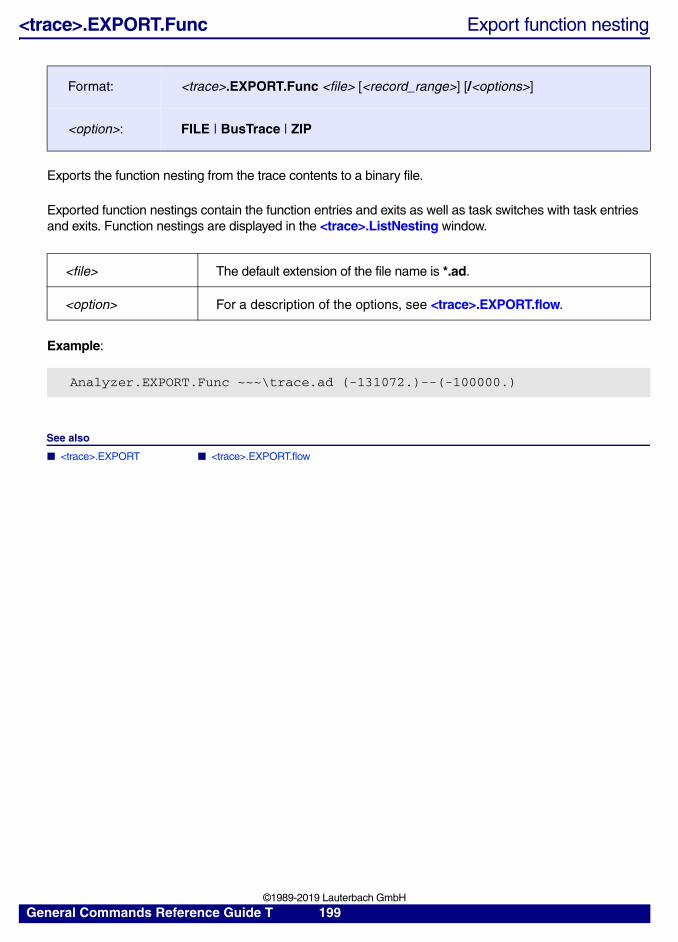
<trace>.EXPORT.Func Export function nesting
Exports the function nesting from the trace contents to a binary file.
Exported function nestings contain the function entries and exits as well as task switches with task entries and exits. Function nestings are displayed in the <trace>.ListNesting window.
Example:
See also
■ <trace>.EXPORT ■ <trace>.EXPORT.flow
Format: <trace>.EXPORT.Func <file> [<record_range>] [/<options>]
<option>: FILE | BusTrace | ZIP
<file> The default extension of the file name is *.ad.
<option> For a description of the options, see <trace>.EXPORT.flow.
Analyzer.EXPORT.Func ~~~\trace.ad (-131072.)--(-100000.)
General Commands Reference Guide T 199 ©1989-2019 Lauterbach GmbH
<trace>.EXPORT.MTV Export in MCDS Trace Viewer formatTriCore, GTM, C166
Exports a trace recording in the MCDS Trace Viewer format.
See also
■ <trace>.EXPORT ■ <trace>.EXPORT.flow
Format: <trace>.EXPORT.MTV <file> [<record_range>] [/<options>]
<option>: FILE | BusTrace | NoDummy
<file> The default extension of the file name is *.mcds.
FILE Exports the trace contents loaded with <trace>.FILE.
BusTrace The trace works as a bus trace. This option is usually not required.
NoDummy Exclude records which do not hold flow information (do not use when exporting logic analyzer data).
General Commands Reference Guide T 200 ©1989-2019 Lauterbach GmbH
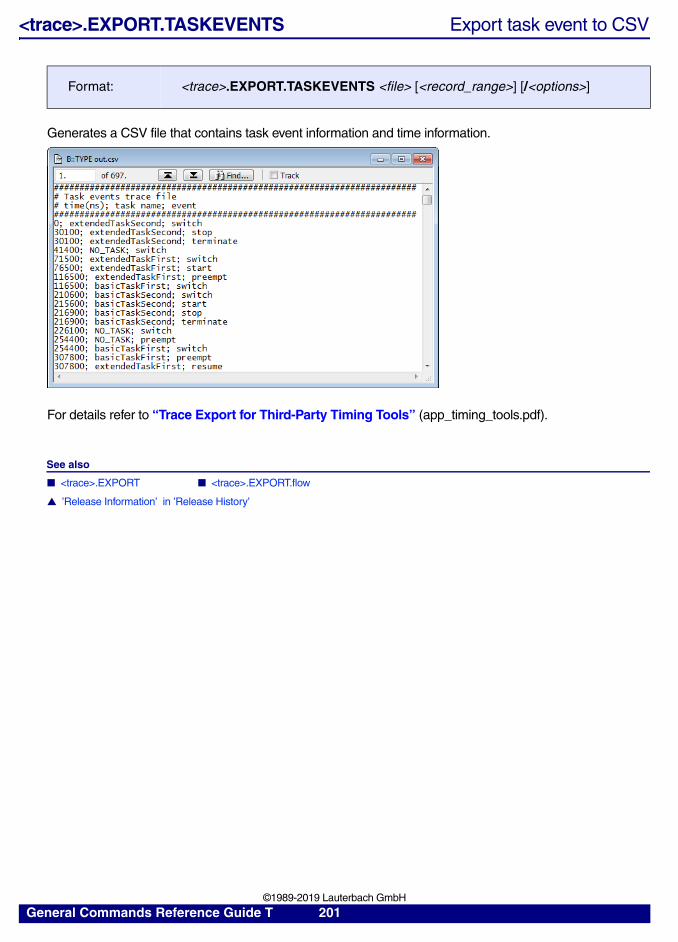
<trace>.EXPORT.TASKEVENTS Export task event to CSV
Generates a CSV file that contains task event information and time information.
For details refer to “Trace Export for Third-Party Timing Tools” (app_timing_tools.pdf).
See also
■ <trace>.EXPORT ■ <trace>.EXPORT.flow
▲ ’Release Information’ in ’Release History’
Format: <trace>.EXPORT.TASKEVENTS <file> [<record_range>] [/<options>]
General Commands Reference Guide T 201 ©1989-2019 Lauterbach GmbH
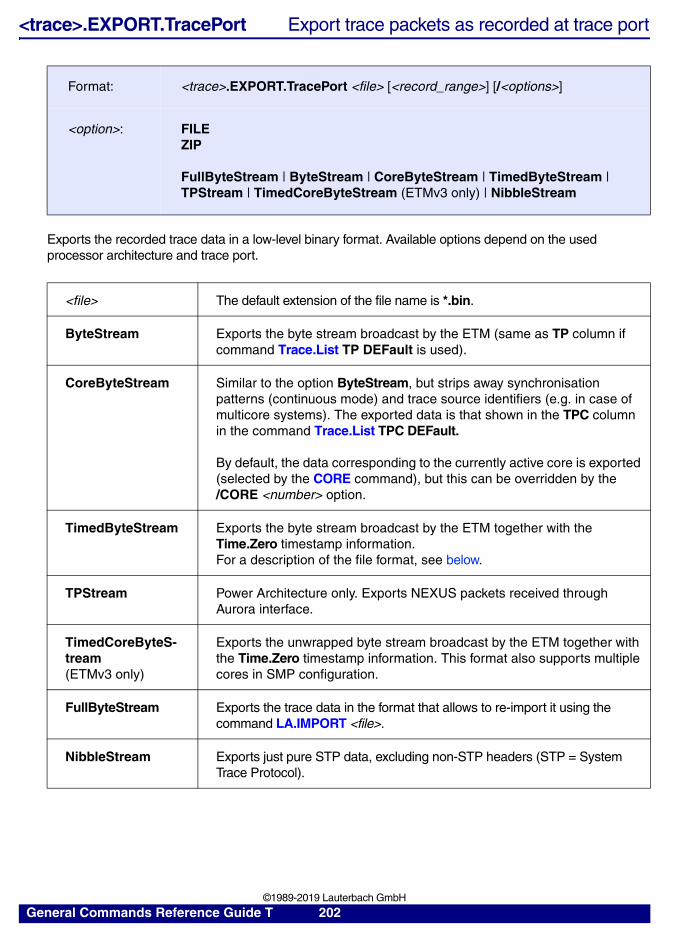
<trace>.EXPORT.TracePort Export trace packets as recorded at trace port
Exports the recorded trace data in a low-level binary format. Available options depend on the used processor architecture and trace port.
Format: <trace>.EXPORT.TracePort <file> [<record_range>] [/<options>]
<option>: FILEZIP
FullByteStream | ByteStream | CoreByteStream | TimedByteStream | TPStream | TimedCoreByteStream (ETMv3 only) | NibbleStream
<file> The default extension of the file name is *.bin.
ByteStream Exports the byte stream broadcast by the ETM (same as TP column if command Trace.List TP DEFault is used).
CoreByteStream Similar to the option ByteStream, but strips away synchronisation patterns (continuous mode) and trace source identifiers (e.g. in case of multicore systems). The exported data is that shown in the TPC column in the command Trace.List TPC DEFault.
By default, the data corresponding to the currently active core is exported (selected by the CORE command), but this can be overridden by the /CORE <number> option.
TimedByteStream Exports the byte stream broadcast by the ETM together with the Time.Zero timestamp information.For a description of the file format, see below.
TPStream Power Architecture only. Exports NEXUS packets received through Aurora interface.
TimedCoreByteS-tream(ETMv3 only)
Exports the unwrapped byte stream broadcast by the ETM together with the Time.Zero timestamp information. This format also supports multiple cores in SMP configuration.
FullByteStream Exports the trace data in the format that allows to re-import it using the command LA.IMPORT <file>.
NibbleStream Exports just pure STP data, excluding non-STP headers (STP = System Trace Protocol).
General Commands Reference Guide T 202 ©1989-2019 Lauterbach GmbH
File Format produced by the option TimedByteStream
The TimedByteStream format consists of two-byte records; possible formats are:
• 0y0xxxxxxx <tracedata_byte>
- xxxxxxx: Time relative to previous records (in nanoseconds).
• 0y10xxxxxx 0yxxxxxxxx
- xxxxxx: Time relative to previous record (bits 7 to 12).
- xxxxxxxx: Upper bits (bits 13 to 20).
• 0y11000xxx 0yxxxxxxxx
- xxx: Selects which part of the absolute time is transferred.
- xxxxxxxx: Byte of absolute timestamp.
• 0y11001000 0yxxxxxxxx
- xxxxxxxx: Selects to which core the following data belongs (only in CoreByteStream with SMP).
See also
■ <trace>.EXPORT ■ <trace>.EXPORT.flow
<trace>.EXPORT.VCD Export trace data in VCD format
Exports the trace contents collected by the TRACE32 logic analyzers PowerProbe and PowerIntegrator to a file in VCD format.
See also
■ <trace>.EXPORT ■ <trace>.EXPORT.flow
Format: <trace>.EXPORT.VCD <file> [<record_range>] [<items> …] [/<option>]
<file> The default extension of the file name is *.vcd.
<option> For a description of the options, see <trace>.EXPORT.flow.
General Commands Reference Guide T 203 ©1989-2019 Lauterbach GmbH
<trace>.EXPORT.VERILOG Export trace data in VERILOG format
Exports the trace contents collected by the TRACE32 logic analyzers PowerProbe and PowerIntegrator to a file in VERILOG format.
See also
■ <trace>.EXPORT ■ <trace>.EXPORT.flow
<trace>.EXPORT.VHDL Export trace data in VHDL format
Exports the trace contents collected by the TRACE32 logic analyzers PowerProbe and PowerIntegrator to a file in VHDL format.
See also
■ <trace>.EXPORT ■ <trace>.EXPORT.flow
Format: <trace>.EXPORT.VERILOG <file> [<record_range>] [<items> …] [/<option>]
<file> The default extension of the file name is *.v.
<option> For a description of the options, see <trace>.EXPORT.flow.
Format: <trace>.EXPORT.VHDL <file> [<record_range>] [<items> …] [/<option>]
<file> The default extension of the file name is *.vhd.
<option> For a description of the options, see <trace>.EXPORT.flow.
General Commands Reference Guide T 204 ©1989-2019 Lauterbach GmbH
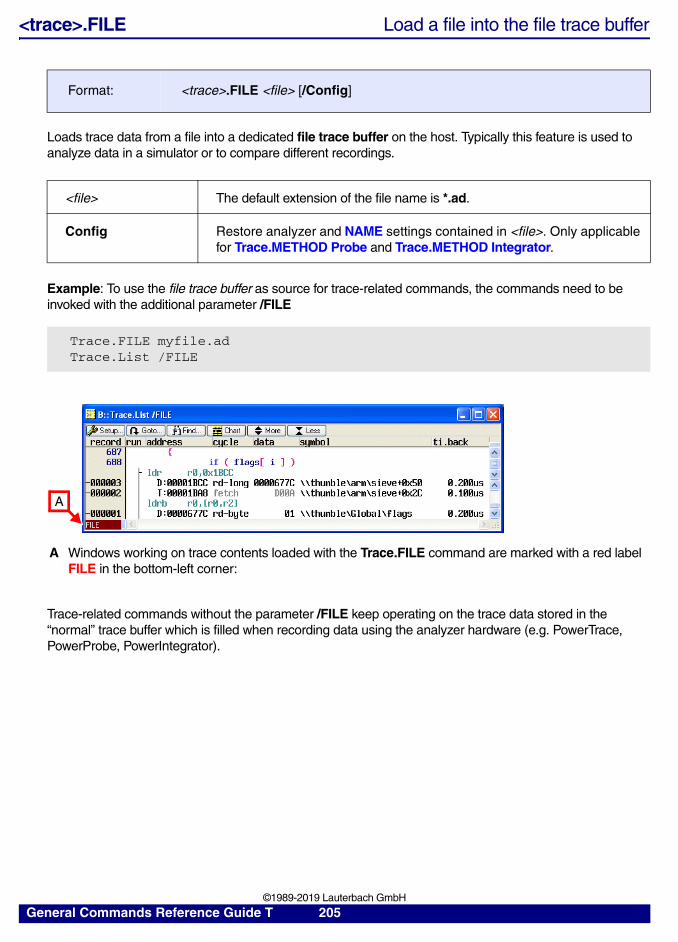
<trace>.FILE Load a file into the file trace buffer
Loads trace data from a file into a dedicated file trace buffer on the host. Typically this feature is used to analyze data in a simulator or to compare different recordings.
Example: To use the file trace buffer as source for trace-related commands, the commands need to be invoked with the additional parameter /FILE
Trace-related commands without the parameter /FILE keep operating on the trace data stored in the “normal” trace buffer which is filled when recording data using the analyzer hardware (e.g. PowerTrace, PowerProbe, PowerIntegrator).
Format: <trace>.FILE <file> [/Config]
<file> The default extension of the file name is *.ad.
Config Restore analyzer and NAME settings contained in <file>. Only applicable for Trace.METHOD Probe and Trace.METHOD Integrator.
Trace.FILE myfile.adTrace.List /FILE
A Windows working on trace contents loaded with the Trace.FILE command are marked with a red label FILE in the bottom-left corner:
A
General Commands Reference Guide T 205 ©1989-2019 Lauterbach GmbH
Using the file trace buffer and the “normal” trace buffer concurrently allows to compare trace data stored in a file from a previous recording with recently recorded data as shown in the following example:
See also
■ <trace>.LOAD ■ <trace>.state ■ Trace
▲ ’Release Information’ in ’Release History’
Trace.FILE test4 ; load trace contents from test4.ad
Trace.List /FILE ; display loaded trace contents
Trace.Chart.sYmbol /FILE ; works on loaded trace data
; compare the recently recorded trace with the trace contents loaded ; from test4.ad regarding to the addressesTrace.ComPare , Address /FILE
NOTE: In addition to Trace.FILE there is a command Trace.LOAD for loading trace data from a file into the “normal” trace buffer. Therefore data loaded with Trace.LOAD is treated as if it was recently recorded by the analyzer hardware. As a consequence all standard trace commands automatically work on the loaded via Trace.LOAD (without specifying additional parameters).
General Commands Reference Guide T 206 ©1989-2019 Lauterbach GmbH
<trace>.Find Find specified entry in trace[Examples]
Searches for matching items in the given range of trace records. The default search range is the complete trace. When the command is invoked without parameters, the previous search is repeated.
If the search finds a matching trace record, the PRACTICE function FOUND() will return TRUE(). If a matching trace record was found, TRACK.RECORD() returns the record number of the matching record.
Details about the <trace>.Find command can be found in “Application Note for the Trace.Find Command” (app_trace_find.pdf).
Format: <trace>.Find [<record_number> | <record_range>] [<item> …] [/<options>]
<item>:(mostly with specified value)
Address <address> | <address_range>Address.MATCH <address> | <address_range>FAddress <address> | <address_range>Data <value> | <value_range>Data !<value> | !<value_range>Data <value>||<value>||… Data <value_range>||<value_range>||… CYcle <cycle_type>VarGROUP <group_name>TIme.Back <time_range>TIme.Zero <time_range>TIme.AddressBack <time_range>TIme.AddressFore <time_range>
<item>:(special events)
EXCEPTION | INTERRUPT | TRAPFIFOFULL | FLOWERROR | TRACEENABLECORE | IGNORE | Var
OR|| (Address item only)AT <offset> (bus trace only)CHANGE <item>
<option>: BackFILENoFindALLFlowTrace | BusTrace
General Commands Reference Guide T 207 ©1989-2019 Lauterbach GmbH
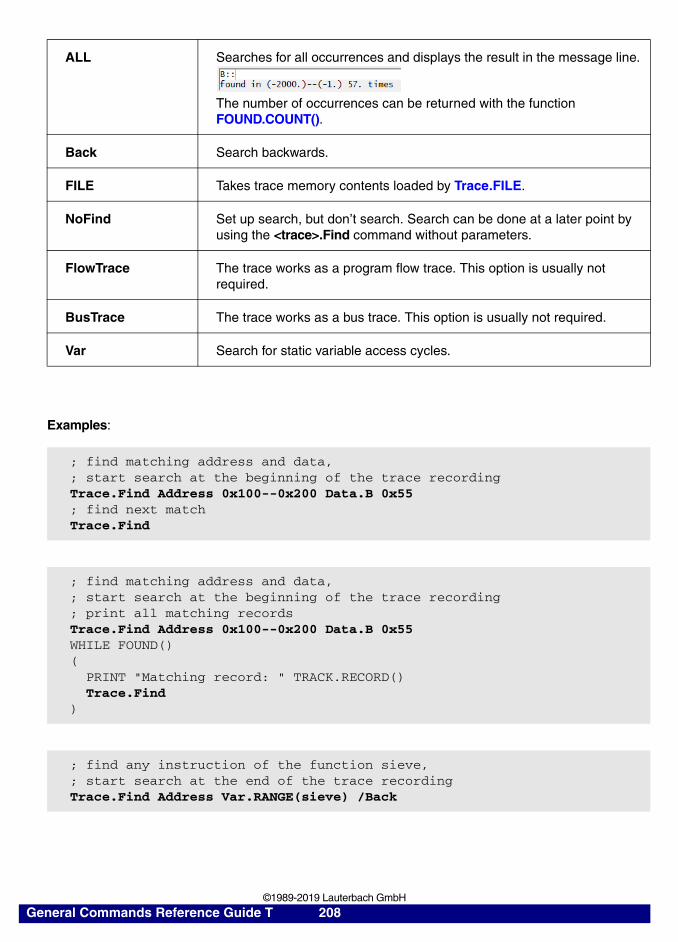
Examples:
ALL Searches for all occurrences and displays the result in the message line.
The number of occurrences can be returned with the function FOUND.COUNT().
Back Search backwards.
FILE Takes trace memory contents loaded by Trace.FILE.
NoFind Set up search, but don’t search. Search can be done at a later point by using the <trace>.Find command without parameters.
FlowTrace The trace works as a program flow trace. This option is usually not required.
BusTrace The trace works as a bus trace. This option is usually not required.
Var Search for static variable access cycles.
; find matching address and data,; start search at the beginning of the trace recordingTrace.Find Address 0x100--0x200 Data.B 0x55; find next matchTrace.Find
; find matching address and data,; start search at the beginning of the trace recording; print all matching recordsTrace.Find Address 0x100--0x200 Data.B 0x55WHILE FOUND()( PRINT "Matching record: " TRACK.RECORD() Trace.Find)
; find any instruction of the function sieve,; start search at the end of the trace recordingTrace.Find Address Var.RANGE(sieve) /Back
General Commands Reference Guide T 208 ©1989-2019 Lauterbach GmbH
; find specified data value in record range (-1000.)--(-700.); start search at the beginning of the trace recordingTrace.Find (-1000.)--(-700.) Data 0x100
; find specified data,; start search at the beginning of the trace recordingTrace.Find Data 0x0--0xAa
; find write accesses to variable flags with specified data values; start search at specified record number down to the end of the ; trace recordingTrace.Find -3224833. Address V.RANGE("flags") Data 0x0--0xaa CYcle Write; find next matchTrace.Find
; find read access to variable flags[3]; start search at the specified record number up to the beginning of the; trace recordingTrace.Find -3224832. Address Var.RANGE("flags[3]") CYcle Read /Back
; find any trace information assigned to the group sieve; start search at the beginning of the trace recordingTrace.Find GROUP "sieve"
; find all trace entries with a TIme.Back time between 500.us--700.usTrace.Find TIMe.Back 0.500us--0.700us
; find ptrace cycle which contains address 0x40000B7CTrace.Find FAddress 0x40000B7C
; find one of the specified data valuesTrace.Find Data 0x5--0x44 OR Data 0x55 OR Data 0x0
; search for rising edge of; the NMI signal
Trace.Find NMI ON AT -1. NMI OFF
General Commands Reference Guide T 209 ©1989-2019 Lauterbach GmbH

See also
■ <trace>.FindAll ■ <trace>.FindChange ■ <trace>.state ■ Trace ❏ FOUND() ❏ FOUND.COUNT()
▲ ’The Trace Find Dialog’ in ’Application Note for the Trace.Find Command’▲ ’Release Information’ in ’Release History’▲ ’Displaying the Trace’ in ’Training FIRE Analyzer’
; search for trace entry generated by core 0 in an SMP systemTrace.Find , CORE 0
; searching for pin RXD highPort.Find Port.RXD High
; searching for pin RXD high and pin CTS lowPort.Find Port.RXD High Port.CTS Low
; searching for pin RXD high or pin CTS lowPort.Find Port.RXD High OR Port.CTS Low
; searching for pin RXD changing from low to highPort.Find Port.RXD Low AT 1. Port.RXD High
; searching for pin RXD changing from low to high, but staying high for; minimum 2 clock cyclesPort.Find Port.RXD Low AT 1. Port.RXD High AT 2. Port.RXD High
General Commands Reference Guide T 210 ©1989-2019 Lauterbach GmbH
<trace>.FindAll Find all specified entries in trace
Searches for and displays all entries matching the item specification. Without range, the complete trace memory is searched for matching entries.
Example:
See also
■ <trace>.Find ■ <trace>.FindChange ■ <trace>.state ■ Trace ❏ FOUND() ❏ FOUND.COUNT()
▲ ’Release Information’ in ’Release History’
Format: <trace>.FindAll [<record_number> | <record_range>] <items> … [/<options>]
<option>: BackFILEFlowTrace | BusTrace<other_options>
Back The option Back reverses the direction of the search command.
BusTrace The trace works as a bus trace. This option is usually not required.
FILE Takes trace memory contents loaded by Trace.FILE.
FlowTrace The trace works as a program flow trace. This option is usually not required.
List Change the default display of the result.
<other_options> Details about the <trace>.FindAll command can be found in “Application Note for the Trace.Find Command” (app_trace_find.pdf).
Trace.FindAll , sYmbol sieve /List TIme.Zero DEFault
General Commands Reference Guide T 211 ©1989-2019 Lauterbach GmbH
<trace>.FindChange Search for changes in trace flow.
Searches for entries in the given range where the specified items have new values. Without range the entry is searched within the complete trace memory. Without items the command searches for changes in program flow. This is useful to search for the end of a complex program loop, or in general to search for “something happens” in a traced program flow.
See also
■ <trace>.Find ■ <trace>.FindAll ■ <trace>.state ■ Trace
Format: <trace>.FindChange [<record_number> | <record_range>] [{<items>]} [/<options>]
<items>: OR<channels>AT <offset>
<option>: BackFILEFlowTrace | BusTrace<other_options>
BACK Reverses the direction of the search command.
FILE Takes trace memory contents loaded by Trace.FILE.
FlowTrace The trace works as a program flow trace. This option is usually not required.
BusTrace The trace works as a bus trace. This option is usually not required.
<other_options> Details about the <trace>.FindChange command can be found in “Application Note for the Trace.Find Command” (app_trace_find.pdf).
General Commands Reference Guide T 212 ©1989-2019 Lauterbach GmbH
<trace>.FLOWPROCESS Process flowtrace
Processes all trace data in the analyzer and calculates the instruction flow for all of it. This is in contrast to <trace>.FLOWSTART which discards the processing results and thus indirectly causes a reprocessing of the limited set of trace data required to draw the currently open windows (reprocessing on demand).
The command is used mostly for diagnostic purposes.
See also
■ <trace>.state ■ Trace
Debugger only
<trace>.FLOWSTART Restart flowtrace processing
Discards all results from previous decoding of instruction flow. This indirectly causes a reprocessing of the limited set of trace data required to draw the currently open windows (reprocessing on demand). Effectively the decoding of flow information is done again “from the start”.
The command is typically used when the memory contents at the time of decoding was wrong and the decoding is therefore incorrect (contains flow errors). The command is executed after providing a correct memory image (e.g. by activating chip selects) to re-initialize the flow processing.
The optional address parameter can be used to indicate the address of the first instruction executed by the processor. In this way the debugger can correctly decode code sequences even before the first sync message appears in the trace stream.
See also
■ <trace>.state ■ Trace ❏ FOUND()
Format: <trace>.FLOWPROCESS [<address>]
Format: <trace>.FLOWSTART [<address>]
General Commands Reference Guide T 213 ©1989-2019 Lauterbach GmbH
<trace>.Get Display input level
Displays the current state of all input lines. The format of the channel definition is similar to the <trace>.View command. This command can be executed, while the port analyzer is running.
For valid channel names refer to the:
• Processor Architecture Manuals
• Target Guides FIRE
• Target Guides ICE
Format: <trace>.Get [%<format>] [<item> …]
<items>: %<format>DEFault | ALL | CPU | LINE | PORTSRunCYcle | Data[.<subitem> | BDATA | List[.<subitem>]Address | BAddress | FAddress| sYmbol | sYmbolN | PAddress | PsYmbol | VarTIme[.<subitem>]FUNC | FUNCR | FUNCVar | IGNORELeVel | MARK[.<marker> | FLAG[.<flag_index>]Trigger | Trigger.A | Trigger.BSPARE<special_lines>
<format>: Ascii | BINary | Decimal | Hex | Signed | UnsignedHighLow | TimingTimeAuto | TimeFixedLEN <size>
<option>: FILETrackFlowTrace | BusTraceMark <item>
General Commands Reference Guide T 214 ©1989-2019 Lauterbach GmbH
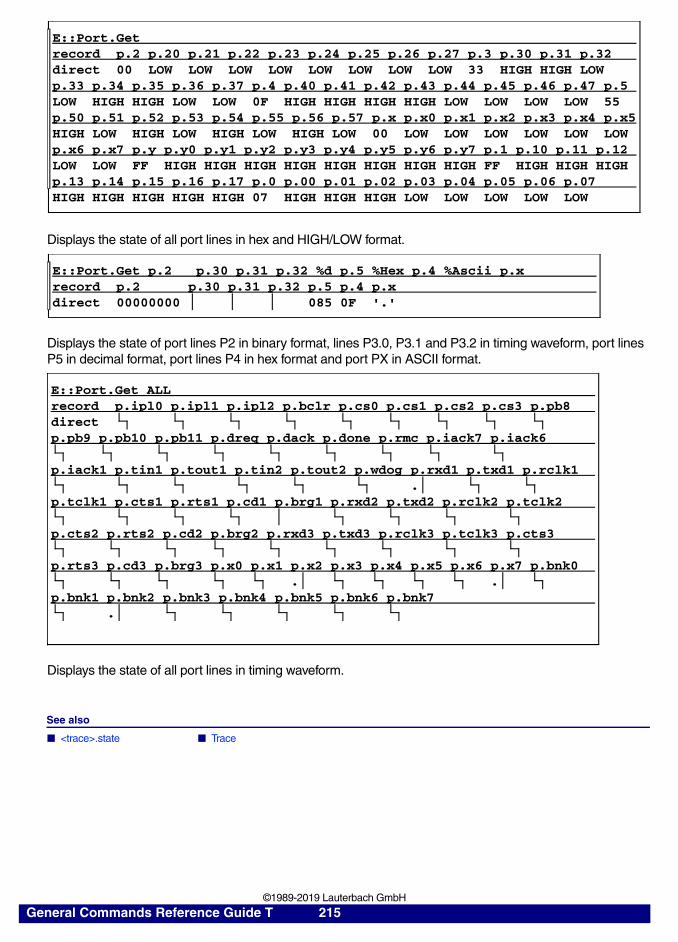
Displays the state of all port lines in hex and HIGH/LOW format.
Displays the state of port lines P2 in binary format, lines P3.0, P3.1 and P3.2 in timing waveform, port lines P5 in decimal format, port lines P4 in hex format and port PX in ASCII format.
Displays the state of all port lines in timing waveform.
See also
■ <trace>.state ■ Trace
E::Port.Getrecord p.2 p.20 p.21 p.22 p.23 p.24 p.25 p.26 p.27 p.3 p.30 p.31 p.32direct 00 LOW LOW LOW LOW LOW LOW LOW LOW 33 HIGH HIGH LOWp.33 p.34 p.35 p.36 p.37 p.4 p.40 p.41 p.42 p.43 p.44 p.45 p.46 p.47 p.5LOW HIGH HIGH LOW LOW 0F HIGH HIGH HIGH HIGH LOW LOW LOW LOW 55p.50 p.51 p.52 p.53 p.54 p.55 p.56 p.57 p.x p.x0 p.x1 p.x2 p.x3 p.x4 p.x5HIGH LOW HIGH LOW HIGH LOW HIGH LOW 00 LOW LOW LOW LOW LOW LOWp.x6 p.x7 p.y p.y0 p.y1 p.y2 p.y3 p.y4 p.y5 p.y6 p.y7 p.1 p.10 p.11 p.12LOW LOW FF HIGH HIGH HIGH HIGH HIGH HIGH HIGH HIGH FF HIGH HIGH HIGHp.13 p.14 p.15 p.16 p.17 p.0 p.00 p.01 p.02 p.03 p.04 p.05 p.06 p.07HIGH HIGH HIGH HIGH HIGH 07 HIGH HIGH HIGH LOW LOW LOW LOW LOW
E::Port.Get p.2 p.30 p.31 p.32 %d p.5 %Hex p.4 %Ascii p.xrecord p.2 p.30 p.31 p.32 p.5 p.4 p.xdirect 00000000 085 0F '.'
E::Port.Get ALLrecord p.ipl0 p.ipl1 p.ipl2 p.bclr p.cs0 p.cs1 p.cs2 p.cs3 p.pb8directp.pb9 p.pb10 p.pb11 p.dreq p.dack p.done p.rmc p.iack7 p.iack6
p.iack1 p.tin1 p.tout1 p.tin2 p.tout2 p.wdog p.rxd1 p.txd1 p.rclk1.
p.tclk1 p.cts1 p.rts1 p.cd1 p.brg1 p.rxd2 p.txd2 p.rclk2 p.tclk2
p.cts2 p.rts2 p.cd2 p.brg2 p.rxd3 p.txd3 p.rclk3 p.tclk3 p.cts3
p.rts3 p.cd3 p.brg3 p.x0 p.x1 p.x2 p.x3 p.x4 p.x5 p.x6 p.x7 p.bnk0. .
p.bnk1 p.bnk2 p.bnk3 p.bnk4 p.bnk5 p.bnk6 p.bnk7.
General Commands Reference Guide T 215 ©1989-2019 Lauterbach GmbH
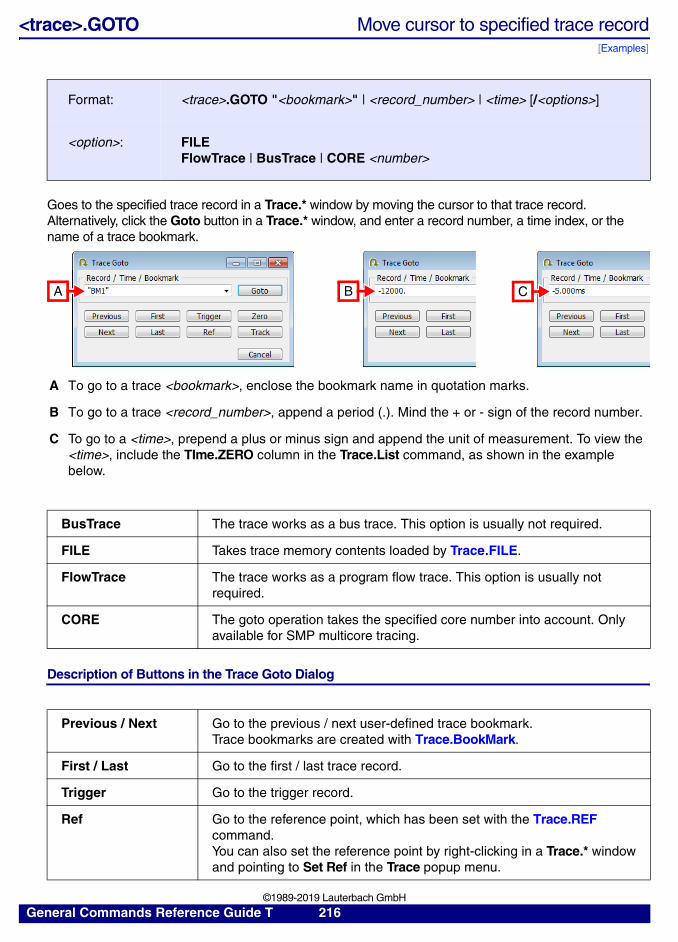
<trace>.GOTO Move cursor to specified trace record[Examples]
Goes to the specified trace record in a Trace.* window by moving the cursor to that trace record. Alternatively, click the Goto button in a Trace.* window, and enter a record number, a time index, or the name of a trace bookmark.
Description of Buttons in the Trace Goto Dialog
Format: <trace>.GOTO "<bookmark>" | <record_number> | <time> [/<options>]
<option>: FILEFlowTrace | BusTrace | CORE <number>
A To go to a trace <bookmark>, enclose the bookmark name in quotation marks.
B To go to a trace <record_number>, append a period (.). Mind the + or - sign of the record number.
C To go to a <time>, prepend a plus or minus sign and append the unit of measurement. To view the <time>, include the TIme.ZERO column in the Trace.List command, as shown in the example below.
BusTrace The trace works as a bus trace. This option is usually not required.
FILE Takes trace memory contents loaded by Trace.FILE.
FlowTrace The trace works as a program flow trace. This option is usually not required.
CORE The goto operation takes the specified core number into account. Only available for SMP multicore tracing.
Previous / Next Go to the previous / next user-defined trace bookmark. Trace bookmarks are created with Trace.BookMark.
First / Last Go to the first / last trace record.
Trigger Go to the trigger record.
Ref Go to the reference point, which has been set with the Trace.REF command.You can also set the reference point by right-clicking in a Trace.* window and pointing to Set Ref in the Trace popup menu.
A B C
General Commands Reference Guide T 216 ©1989-2019 Lauterbach GmbH
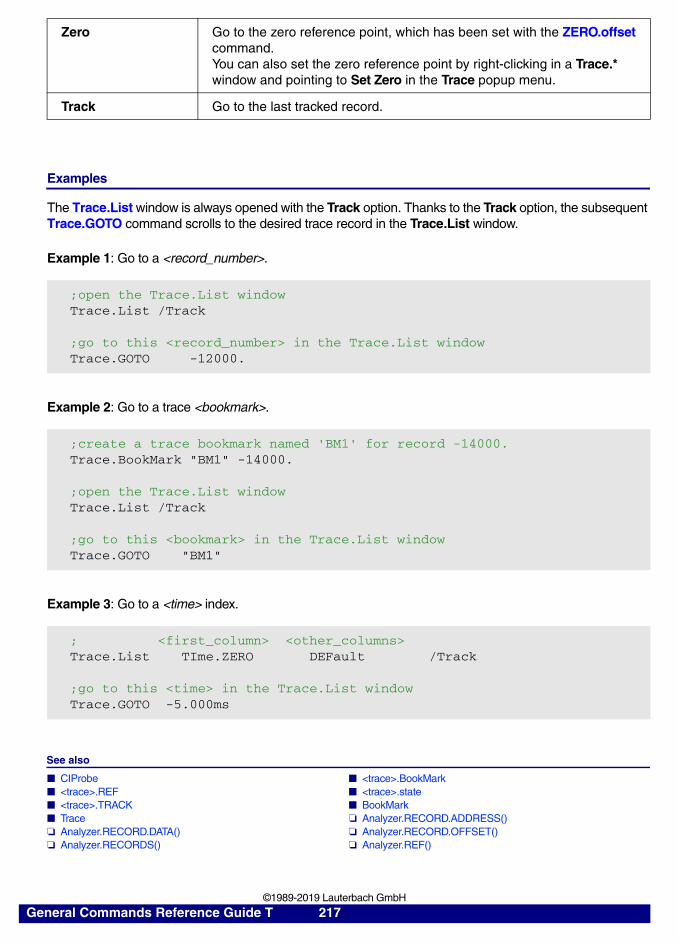
Examples
The Trace.List window is always opened with the Track option. Thanks to the Track option, the subsequent Trace.GOTO command scrolls to the desired trace record in the Trace.List window.
Example 1: Go to a <record_number>.
Example 2: Go to a trace <bookmark>.
Example 3: Go to a <time> index.
See also
■ CIProbe ■ <trace>.BookMark ■ <trace>.REF ■ <trace>.state ■ <trace>.TRACK ■ BookMark ■ Trace ❏ Analyzer.RECORD.ADDRESS() ❏ Analyzer.RECORD.DATA() ❏ Analyzer.RECORD.OFFSET() ❏ Analyzer.RECORDS() ❏ Analyzer.REF()
Zero Go to the zero reference point, which has been set with the ZERO.offset command.You can also set the zero reference point by right-clicking in a Trace.* window and pointing to Set Zero in the Trace popup menu.
Track Go to the last tracked record.
;open the Trace.List windowTrace.List /Track
;go to this <record_number> in the Trace.List windowTrace.GOTO -12000.
;create a trace bookmark named 'BM1' for record -14000.Trace.BookMark "BM1" -14000.
;open the Trace.List windowTrace.List /Track
;go to this <bookmark> in the Trace.List windowTrace.GOTO "BM1"
; <first_column> <other_columns>Trace.List TIme.ZERO DEFault /Track
;go to this <time> in the Trace.List windowTrace.GOTO -5.000ms
General Commands Reference Guide T 217 ©1989-2019 Lauterbach GmbH
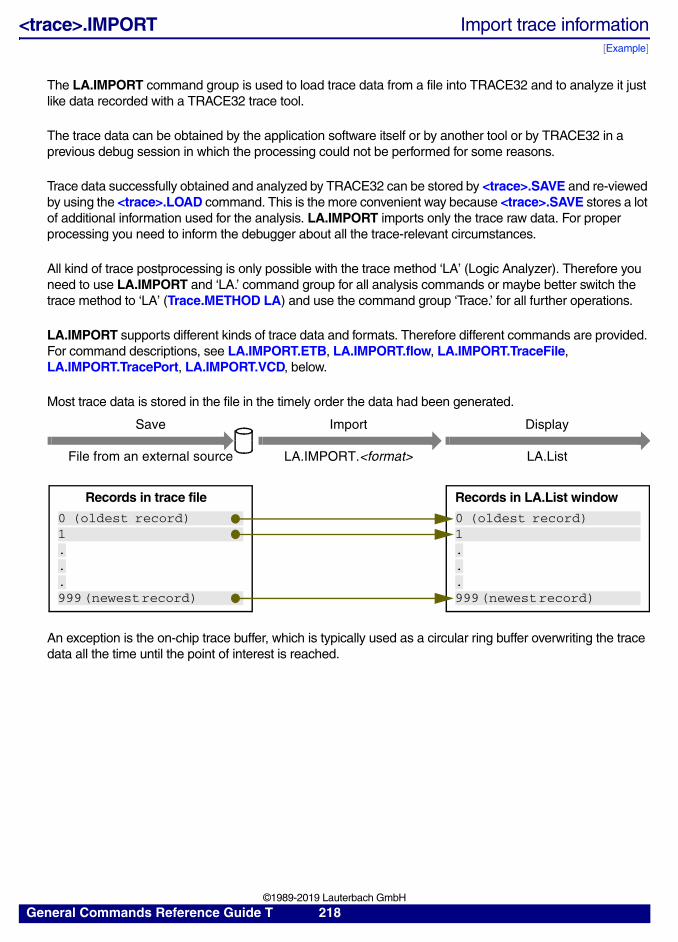
<trace>.IMPORT Import trace information[Example]
The LA.IMPORT command group is used to load trace data from a file into TRACE32 and to analyze it just like data recorded with a TRACE32 trace tool.
The trace data can be obtained by the application software itself or by another tool or by TRACE32 in a previous debug session in which the processing could not be performed for some reasons.
Trace data successfully obtained and analyzed by TRACE32 can be stored by <trace>.SAVE and re-viewed by using the <trace>.LOAD command. This is the more convenient way because <trace>.SAVE stores a lot of additional information used for the analysis. LA.IMPORT imports only the trace raw data. For proper processing you need to inform the debugger about all the trace-relevant circumstances.
All kind of trace postprocessing is only possible with the trace method ‘LA’ (Logic Analyzer). Therefore you need to use LA.IMPORT and ‘LA.’ command group for all analysis commands or maybe better switch the trace method to ‘LA’ (Trace.METHOD LA) and use the command group ‘Trace.’ for all further operations.
LA.IMPORT supports different kinds of trace data and formats. Therefore different commands are provided. For command descriptions, see LA.IMPORT.ETB, LA.IMPORT.flow, LA.IMPORT.TraceFile, LA.IMPORT.TracePort, LA.IMPORT.VCD, below.
Most trace data is stored in the file in the timely order the data had been generated.
An exception is the on-chip trace buffer, which is typically used as a circular ring buffer overwriting the trace data all the time until the point of interest is reached.
Import
LA.IMPORT.<format>
Records in trace file
0 (oldest record) 1 ...999 (newest record)
Records in LA.List window
Save
File from an external source
Display
LA.List
0 (oldest record) 1 ...999 (newest record)
General Commands Reference Guide T 218 ©1989-2019 Lauterbach GmbH

If this buffer is saved into a file, you need to know the wrap pointer for being able to get the data in a timely order. LA.IMPORT.WRAP and LA.IMPORT.GUESSWRAP will deal with this concern.
For post processing trace data loaded by LA.IMPORT you need to take the following steps:
1. Start TRACE32 to run as simulator (config.t32 -> PBI=SIM). You neither need a debugger hardware nor a target. You can run TRACE32 as debugger as well, but for the postprocessing this is not needed.
2. Adjust all trace relevant settings like for a real target by running the start-up script you used for generating the trace data. For postprocessing an ETMv4 even further setups might be needed which normally the debugger would read out from the ETM module (ETM.COND, ETM.INSTPO, ETM.QE).
If the start-up script is not available, then try this:
- At best selecting the chip you are debugging (SYStem.CPU ...) is sufficient.
- For trace data coming from a ARM CoreSight system, all commands describing the trace system on the chip are required (SYStem.CONFIG ...).
- Further all settings for the trace sources done at recording time are needed (e.g. ETM. ...).
3. Load your target application (Data.LOAD ...).
4. Import the trace raw data (LA.IMPORT. ...).
5. Now you can use all trace display and analysis functions, e.g.
LA.List TP TPC TPINFO DEFault List.NoDummy.OFF ; with diagnostics
Import
LA.IMPORT.ETB
0 1 ...996 (newest record)
Records in LA.List window-3 (oldest record) -2 -1
Save
e.g. by external tool
Display
LA.List
Re-order
LA.IMPORT.WRAP
Process:
Circular Ring Buffer
997 (oldest record) 998 999
Records in trace file0 1 ...996 (newest record)
Wrap pointer
Result:
Re-
orde
r
General Commands Reference Guide T 219 ©1989-2019 Lauterbach GmbH
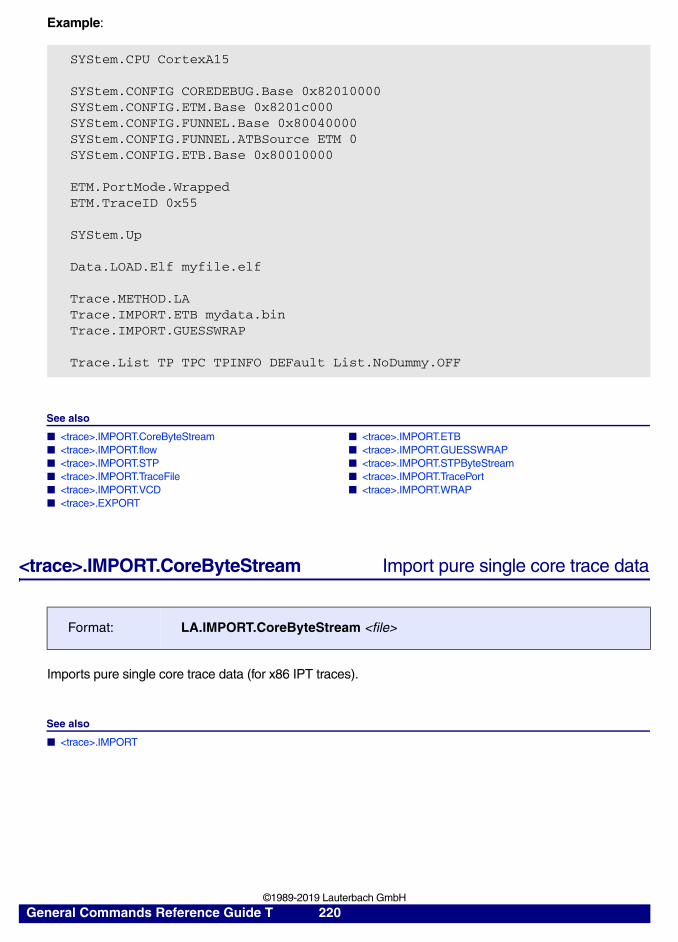
Example:
See also
■ <trace>.IMPORT.CoreByteStream ■ <trace>.IMPORT.ETB ■ <trace>.IMPORT.flow ■ <trace>.IMPORT.GUESSWRAP ■ <trace>.IMPORT.STP ■ <trace>.IMPORT.STPByteStream ■ <trace>.IMPORT.TraceFile ■ <trace>.IMPORT.TracePort ■ <trace>.IMPORT.VCD ■ <trace>.IMPORT.WRAP ■ <trace>.EXPORT
<trace>.IMPORT.CoreByteStream Import pure single core trace data
Imports pure single core trace data (for x86 IPT traces).
See also
■ <trace>.IMPORT
SYStem.CPU CortexA15
SYStem.CONFIG COREDEBUG.Base 0x82010000SYStem.CONFIG.ETM.Base 0x8201c000SYStem.CONFIG.FUNNEL.Base 0x80040000SYStem.CONFIG.FUNNEL.ATBSource ETM 0SYStem.CONFIG.ETB.Base 0x80010000
ETM.PortMode.WrappedETM.TraceID 0x55
SYStem.Up
Data.LOAD.Elf myfile.elf
Trace.METHOD.LATrace.IMPORT.ETB mydata.binTrace.IMPORT.GUESSWRAP
Trace.List TP TPC TPINFO DEFault List.NoDummy.OFF
Format: LA.IMPORT.CoreByteStream <file>
General Commands Reference Guide T 220 ©1989-2019 Lauterbach GmbH
<trace>.IMPORT.ETB Import on-chip trace data
Imports a pure binary trace data file obtained from an on-chip trace buffer like ARM CoreSight ETB, ETF, ETR.
You additionally need to use LA.IMPORT.WRAP or LA.IMPORT.GUESSWRAP if the following conditions apply:
• The on-chip trace buffer was used as a circular ring buffer.
• The on-chip trace data was stored as is, it was not read out in the timely order starting from the write pointer position.
LA.Mode FlowTrace will automatically be set when using this command.
See also
■ <trace>.IMPORT
▲ ’Release Information’ in ’Release History’
<trace>.IMPORT.flow Import bus trace data
Re-imports a file that has been exported with <trace>.EXPORT.flow. This bus trace data comes from capturing the fetched instructions and data accesses done on an external bus to figure out the program behavior. It works only if no cache is used and if the bus accesses can be captured. Nowadays this method is rarely used.
See also
■ <trace>.IMPORT
Format: LA.IMPORT.ETB <file>
Format: LA.IMPORT.flow <file>
General Commands Reference Guide T 221 ©1989-2019 Lauterbach GmbH
<trace>.IMPORT.GUESSWRAP Guess wrap pointer
Reformats external trace data loaded to TRACE32 in a timely order. The external trace data of a circular ring buffer is loaded to TRACE32 using LA.IMPORT.ETB. The command LA.IMPORT.GUESSWRAP scans the loaded trace data and guesses where the wrap pointer might have been.
Optionally, you can pass a record number where the search for the wrap pointer shall start. Without a parameter it starts from the beginning.
Use LA.IMPORT.WRAP if you know where the wrap pointer is.
See the figures in the introduction to <trace>.IMPORT.
See also
■ <trace>.IMPORT ■ <trace>.IMPORT.WRAP
<trace>.IMPORT.STP Import STP recording from file (nibble)
Imports an STP trace from <file> to process it within TRACE32. One trace record is generated per nibble.
In order to unwrap the trace information for processing, TRACE32 needs to know the following information: STM base address and the STP protocol version.
If TRACE32 is aware of the chip characteristic, setting up the chip is sufficient.
Example:
Format: LA.IMPORT.GUESSWRAP [<record_number>]
Format: LA.IMPORT.STP <file>
SYStem.CPU OMAP4430APP1
LA.IMPORT.STP my_recording.stp
STMLA.List
General Commands Reference Guide T 222 ©1989-2019 Lauterbach GmbH
Otherwise the following setup has to be done.
See also
■ <trace>.IMPORT
<trace>.IMPORT.STPByteStream Import STP recording from file (byte)
Same as LA.IMPORT.STP, but one trace record is generated per byte.
See also
■ <trace>.IMPORT
▲ ’Release Information’ in ’Release History’
<trace>.IMPORT.TraceFile Import trace data where processing has failed
Re-imports trace data stored by <trace>.SAVE for re-processing. This is useful if processing was not possible when the trace recording was made. For example if you had no access to the target code at that moment.
Only the trace raw data will be extracted from the saved (*.ad) file.
LA.Mode FlowTrace will automatically be set when using this command.
See also
■ <trace>.IMPORT
▲ ’Release Information’ in ’Release History’
SYStem.CONFIG.STM.Base DAP:0xd4161000 ; any base address != 0x0 is; fine
SYStem.CONFIG.STM.Mode STPv2 ; specify the STP protocol; version
LA.IMPORT.STP my_recording.stp
STMLA.List
Format: LA.IMPORT.STPByteStream <file>
Format: LA.IMPORT.TraceFile <file>
General Commands Reference Guide T 223 ©1989-2019 Lauterbach GmbH
<trace>.IMPORT.TracePort Import off-chip trace data
Imports a pure binary trace data file from an external trace port like an ARM CoreSight TPIU. Unlike on-chip trace data, off-chip trace data includes synchronization packages and depend on the port size of the trace port.
LA.Mode FlowTrace will automatically be set when using this command.
See also
■ <trace>.IMPORT
▲ ’Release Information’ in ’Release History’
<trace>.IMPORT.VCD Import recorded signals in VCD file format
Imports a VCD (Value Change Dump) file, which is an industrial standard format for waveforms (not for program trace). It is used for visualizing and analyzing the captured signals in the <trace>.Timing window.
See also
■ <trace>.IMPORT
Format: LA.IMPORT.TracePort <file>
Format: LA.IMPORT.VCD <file>
General Commands Reference Guide T 224 ©1989-2019 Lauterbach GmbH
<trace>.IMPORT.WRAP Define wrap pointer
Reformats external trace data loaded to TRACE32 in a timely order. The external trace data of a circular ring buffer is loaded to TRACE32 using LA.IMPORT.ETB.
Use LA.IMPORT.GUESSWRAP if you do not know where the wrap pointer is.
See the figures in the introduction to <trace>.IMPORT.
See also
■ <trace>.IMPORT ■ <trace>.IMPORT.GUESSWRAP
Format: LA.IMPORT.WRAP <record_number>
<record_number> You pass the <record_number> of the first trace record in time (wrap pointer). This is the write pointer location of a circular ring buffer the moment the data has been stored.
NOTE: On a CoreSight trace, the write pointer points to a 32-bit value. You need to multiply this value by 4 because each CoreSight trace record is 8 bit in size.
General Commands Reference Guide T 225 ©1989-2019 Lauterbach GmbH
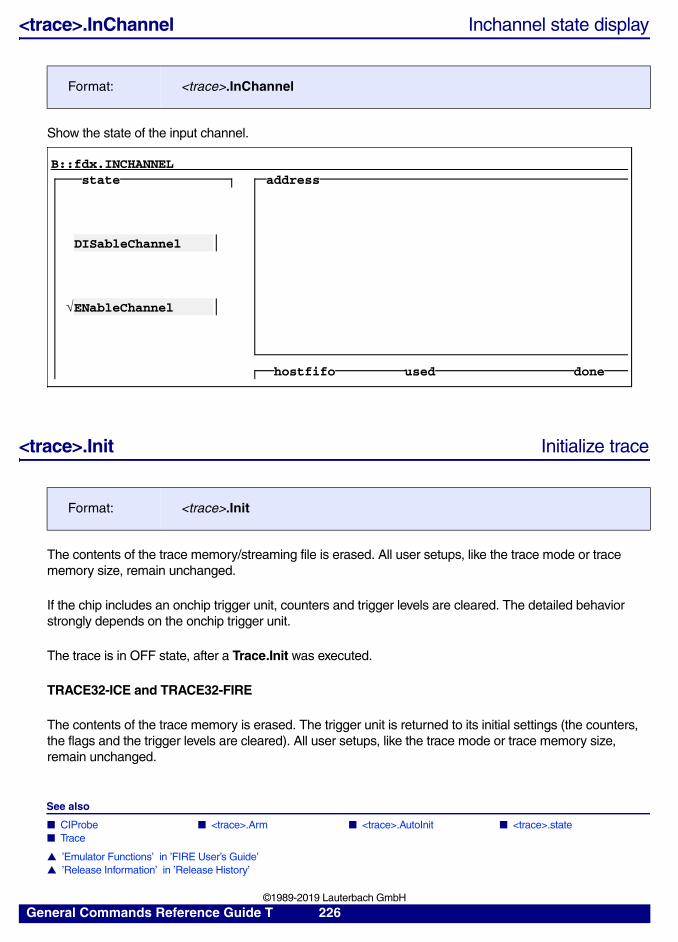
<trace>.InChannel Inchannel state display
Show the state of the input channel.
<trace>.Init Initialize trace
The contents of the trace memory/streaming file is erased. All user setups, like the trace mode or trace memory size, remain unchanged.
If the chip includes an onchip trigger unit, counters and trigger levels are cleared. The detailed behavior strongly depends on the onchip trigger unit.
The trace is in OFF state, after a Trace.Init was executed.
TRACE32-ICE and TRACE32-FIRE
The contents of the trace memory is erased. The trigger unit is returned to its initial settings (the counters, the flags and the trigger levels are cleared). All user setups, like the trace mode or trace memory size, remain unchanged.
See also
■ CIProbe ■ <trace>.Arm ■ <trace>.AutoInit ■ <trace>.state ■ Trace
▲ ’Emulator Functions’ in ’FIRE User’s Guide’▲ ’Release Information’ in ’Release History’
Format: <trace>.InChannel
Format: <trace>.Init
B::fdx.INCHANNELstate address
DISableChannel
ENableChannel
hostfifo used done
General Commands Reference Guide T 226 ©1989-2019 Lauterbach GmbH
<trace>.JKLMNO Sampling configuration for probes JKLMNOPowerIntegrator only
<trace>.JOINFILE Concatenate several trace recordings
Concatenates several trace recordings to increase the volume of trace information to be analyzed.
Format: Integrator.JKLMNO <option>
<option>: 250MHZStateStatePLL
CLKJCLKKFallingRisingSAMPLE
250MHZ Timing Mode 250 MHz.
State State Mode, clocked by CLKJ or CLKK.
StatePLL State PLL Mode, clocked by CLKJ or CLKK.
CLKJ Clock J select for State-Mode or State-PLL-Mode.
CLKK Clock K select for State-Mode or State-PLL-Mode.
Falling sampling on falling edge of selected clock CLKJ or CLKK.
Rising sampling on rising edge of selected clock CLKJ or CLKK.
SAMPLE sampling delay of selected clock CLKJ or CLKK (-3 … +6 ns in steps of 250 ps), State-PLL-Mode only.
Format: <trace>.JOINFILE <file> [<records>] [/<option>]
<records>: <string> | <range> | <value> | <timerange>
<option>: ZIP | NoCompress | Compress | TIMEGAP
General Commands Reference Guide T 227 ©1989-2019 Lauterbach GmbH
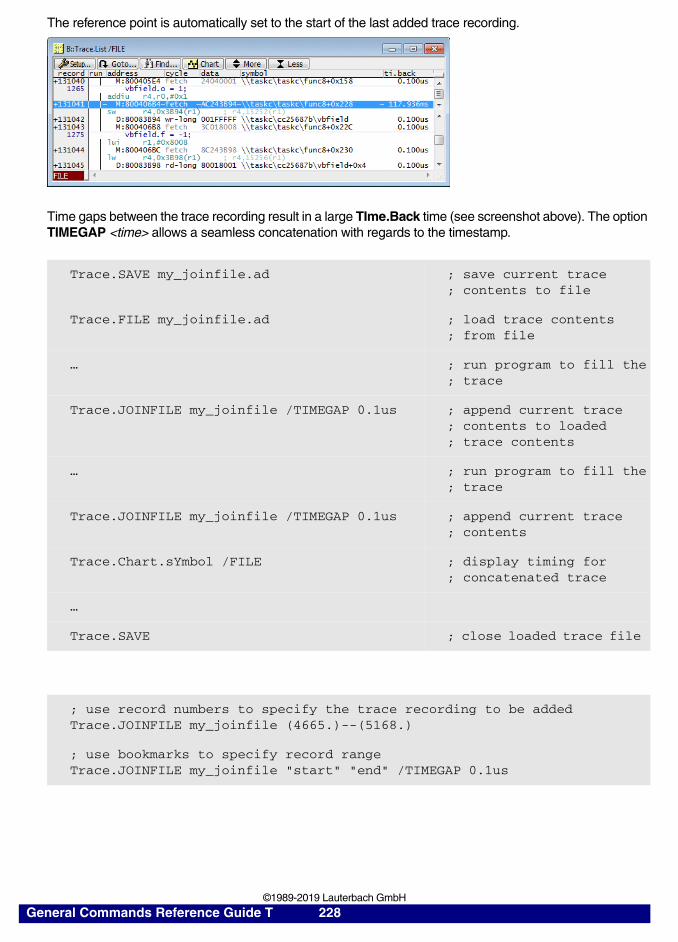
The reference point is automatically set to the start of the last added trace recording.
Time gaps between the trace recording result in a large TIme.Back time (see screenshot above). The option TIMEGAP <time> allows a seamless concatenation with regards to the timestamp.
Trace.SAVE my_joinfile.ad ; save current trace; contents to file
Trace.FILE my_joinfile.ad ; load trace contents; from file
… ; run program to fill the; trace
Trace.JOINFILE my_joinfile /TIMEGAP 0.1us ; append current trace; contents to loaded; trace contents
… ; run program to fill the; trace
Trace.JOINFILE my_joinfile /TIMEGAP 0.1us ; append current trace; contents
Trace.Chart.sYmbol /FILE ; display timing for ; concatenated trace
…
Trace.SAVE ; close loaded trace file
; use record numbers to specify the trace recording to be addedTrace.JOINFILE my_joinfile (4665.)--(5168.)
; use bookmarks to specify record rangeTrace.JOINFILE my_joinfile "start" "end" /TIMEGAP 0.1us
General Commands Reference Guide T 228 ©1989-2019 Lauterbach GmbH
ICE only
<trace>.LEVEL Select trigger level manually
Only valid for Ha120 and SA120.
Selects the level of the analyzer trigger unit manually.
Format: <trace>.LEVEL
General Commands Reference Guide T 229 ©1989-2019 Lauterbach GmbH
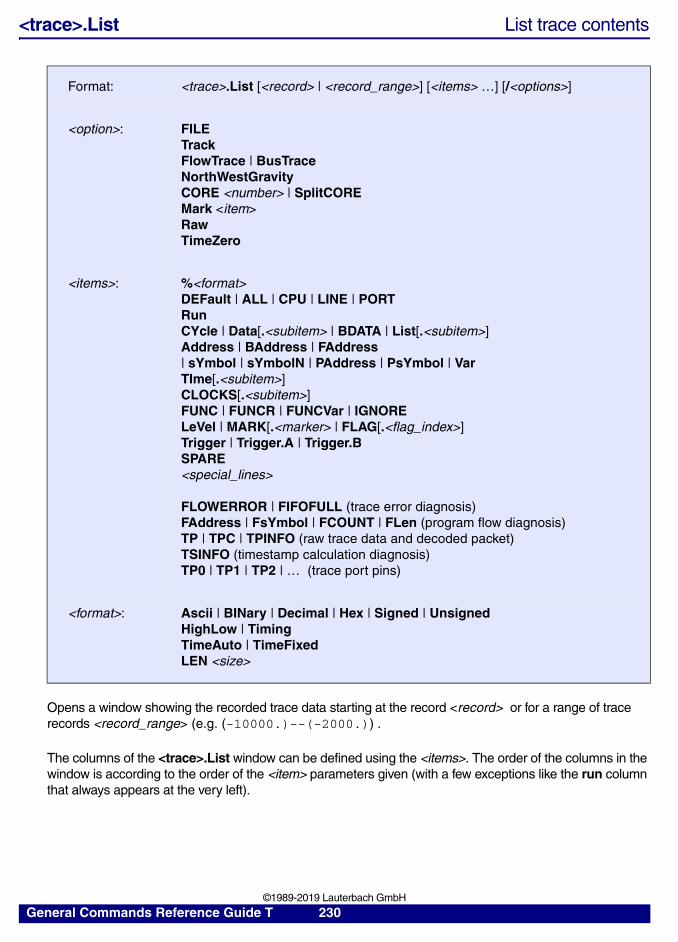
<trace>.List List trace contents
Opens a window showing the recorded trace data starting at the record <record> or for a range of trace records <record_range> (e.g. (-10000.)--(-2000.)) .
The columns of the <trace>.List window can be defined using the <items>. The order of the columns in the window is according to the order of the <item> parameters given (with a few exceptions like the run column that always appears at the very left).
Format: <trace>.List [<record> | <record_range>] [<items> …] [/<options>]
<option>: FILETrackFlowTrace | BusTraceNorthWestGravityCORE <number> | SplitCORE Mark <item>RawTimeZero
<items>: %<format>DEFault | ALL | CPU | LINE | PORTRunCYcle | Data[.<subitem> | BDATA | List[.<subitem>]Address | BAddress | FAddress| sYmbol | sYmbolN | PAddress | PsYmbol | VarTIme[.<subitem>]CLOCKS[.<subitem>]FUNC | FUNCR | FUNCVar | IGNORELeVel | MARK[.<marker> | FLAG[.<flag_index>]Trigger | Trigger.A | Trigger.BSPARE<special_lines>
FLOWERROR | FIFOFULL (trace error diagnosis)FAddress | FsYmbol | FCOUNT | FLen (program flow diagnosis)TP | TPC | TPINFO (raw trace data and decoded packet)TSINFO (timestamp calculation diagnosis)TP0 | TP1 | TP2 | … (trace port pins)
<format>: Ascii | BINary | Decimal | Hex | Signed | UnsignedHighLow | TimingTimeAuto | TimeFixedLEN <size>
General Commands Reference Guide T 230 ©1989-2019 Lauterbach GmbH
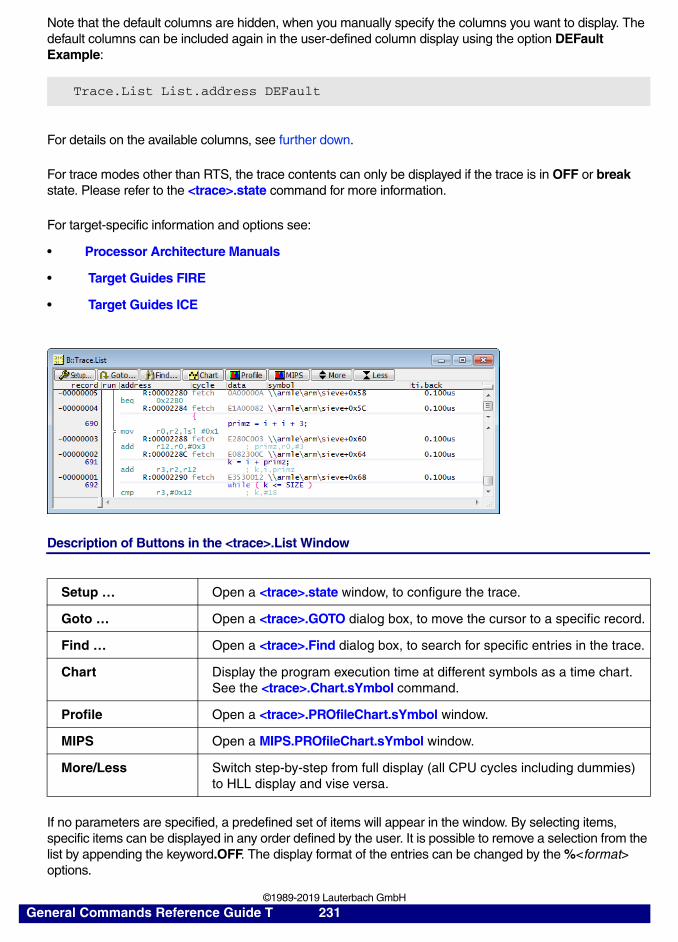
Note that the default columns are hidden, when you manually specify the columns you want to display. The default columns can be included again in the user-defined column display using the option DEFaultExample:
For details on the available columns, see further down.
For trace modes other than RTS, the trace contents can only be displayed if the trace is in OFF or break state. Please refer to the <trace>.state command for more information.
For target-specific information and options see:
• Processor Architecture Manuals
• Target Guides FIRE
• Target Guides ICE
Description of Buttons in the <trace>.List Window
If no parameters are specified, a predefined set of items will appear in the window. By selecting items, specific items can be displayed in any order defined by the user. It is possible to remove a selection from the list by appending the keyword.OFF. The display format of the entries can be changed by the %<format> options.
Trace.List List.address DEFault
Setup … Open a <trace>.state window, to configure the trace.
Goto … Open a <trace>.GOTO dialog box, to move the cursor to a specific record.
Find … Open a <trace>.Find dialog box, to search for specific entries in the trace.
Chart Display the program execution time at different symbols as a time chart. See the <trace>.Chart.sYmbol command.
Profile Open a <trace>.PROfileChart.sYmbol window.
MIPS Open a MIPS.PROfileChart.sYmbol window.
More/Less Switch step-by-step from full display (all CPU cycles including dummies) to HLL display and vise versa.
General Commands Reference Guide T 231 ©1989-2019 Lauterbach GmbH
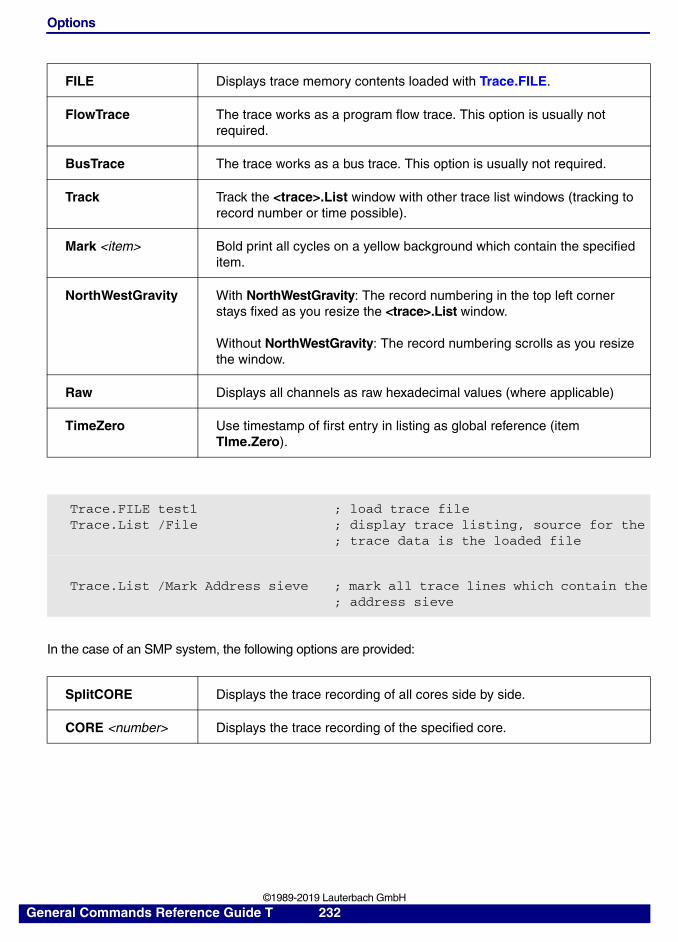
Options
In the case of an SMP system, the following options are provided:
FILE Displays trace memory contents loaded with Trace.FILE.
FlowTrace The trace works as a program flow trace. This option is usually not required.
BusTrace The trace works as a bus trace. This option is usually not required.
Track Track the <trace>.List window with other trace list windows (tracking to record number or time possible).
Mark <item> Bold print all cycles on a yellow background which contain the specified item.
NorthWestGravity With NorthWestGravity: The record numbering in the top left corner stays fixed as you resize the <trace>.List window.
Without NorthWestGravity: The record numbering scrolls as you resize the window.
Raw Displays all channels as raw hexadecimal values (where applicable)
TimeZero Use timestamp of first entry in listing as global reference (item TIme.Zero).
Trace.FILE test1Trace.List /File
; load trace file; display trace listing, source for the; trace data is the loaded file
Trace.List /Mark Address sieve ; mark all trace lines which contain the; address sieve
SplitCORE Displays the trace recording of all cores side by side.
CORE <number> Displays the trace recording of the specified core.
General Commands Reference Guide T 232 ©1989-2019 Lauterbach GmbH
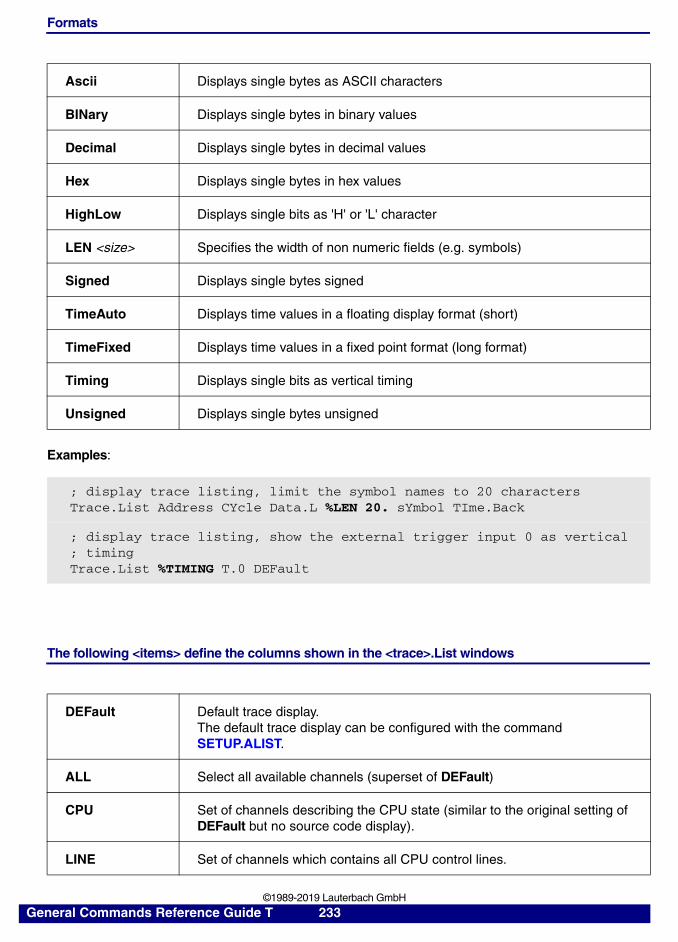
Formats
Examples:
The following <items> define the columns shown in the <trace>.List windows
Ascii Displays single bytes as ASCII characters
BINary Displays single bytes in binary values
Decimal Displays single bytes in decimal values
Hex Displays single bytes in hex values
HighLow Displays single bits as 'H' or 'L' character
LEN <size> Specifies the width of non numeric fields (e.g. symbols)
Signed Displays single bytes signed
TimeAuto Displays time values in a floating display format (short)
TimeFixed Displays time values in a fixed point format (long format)
Timing Displays single bits as vertical timing
Unsigned Displays single bytes unsigned
; display trace listing, limit the symbol names to 20 charactersTrace.List Address CYcle Data.L %LEN 20. sYmbol TIme.Back
; display trace listing, show the external trigger input 0 as vertical; timingTrace.List %TIMING T.0 DEFault
DEFault Default trace display.The default trace display can be configured with the command SETUP.ALIST.
ALL Select all available channels (superset of DEFault)
CPU Set of channels describing the CPU state (similar to the original setting of DEFault but no source code display).
LINE Set of channels which contains all CPU control lines.
General Commands Reference Guide T 233 ©1989-2019 Lauterbach GmbH
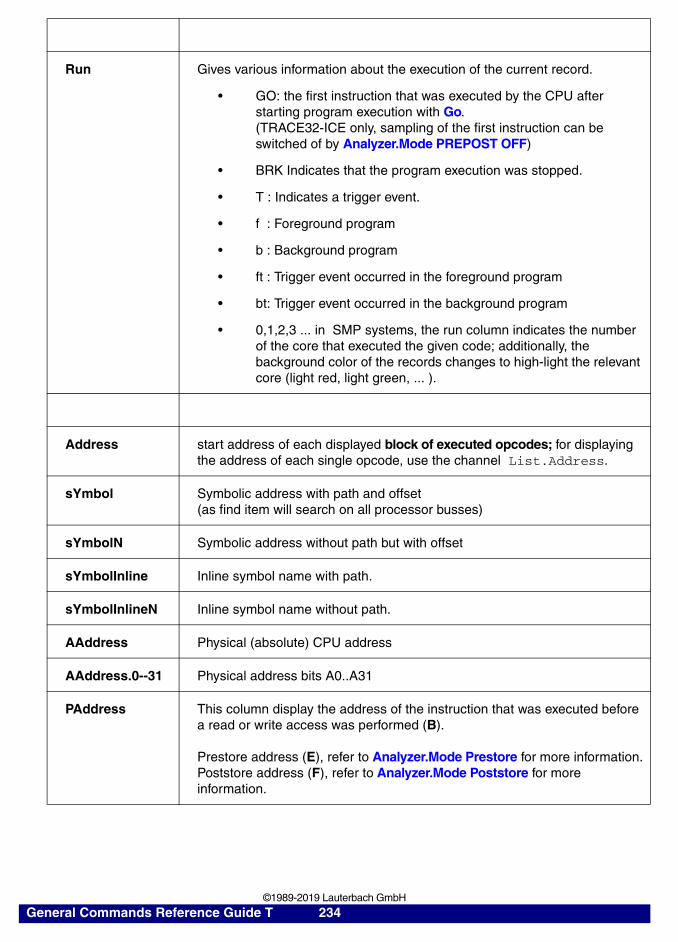
Run Gives various information about the execution of the current record.
• GO: the first instruction that was executed by the CPU after starting program execution with Go.(TRACE32-ICE only, sampling of the first instruction can be switched of by Analyzer.Mode PREPOST OFF)
• BRK Indicates that the program execution was stopped.
• T : Indicates a trigger event.
• f : Foreground program
• b : Background program
• ft : Trigger event occurred in the foreground program
• bt: Trigger event occurred in the background program
• 0,1,2,3 ... in SMP systems, the run column indicates the number of the core that executed the given code; additionally, the background color of the records changes to high-light the relevant core (light red, light green, ... ).
Address start address of each displayed block of executed opcodes; for displaying the address of each single opcode, use the channel List.Address.
sYmbol Symbolic address with path and offset(as find item will search on all processor busses)
sYmbolN Symbolic address without path but with offset
sYmbolInline Inline symbol name with path.
sYmbolInlineN Inline symbol name without path.
AAddress Physical (absolute) CPU address
AAddress.0--31 Physical address bits A0..A31
PAddress This column display the address of the instruction that was executed before a read or write access was performed (B).
Prestore address (E), refer to Analyzer.Mode Prestore for more information.Poststore address (F), refer to Analyzer.Mode Poststore for more information.
General Commands Reference Guide T 234 ©1989-2019 Lauterbach GmbH
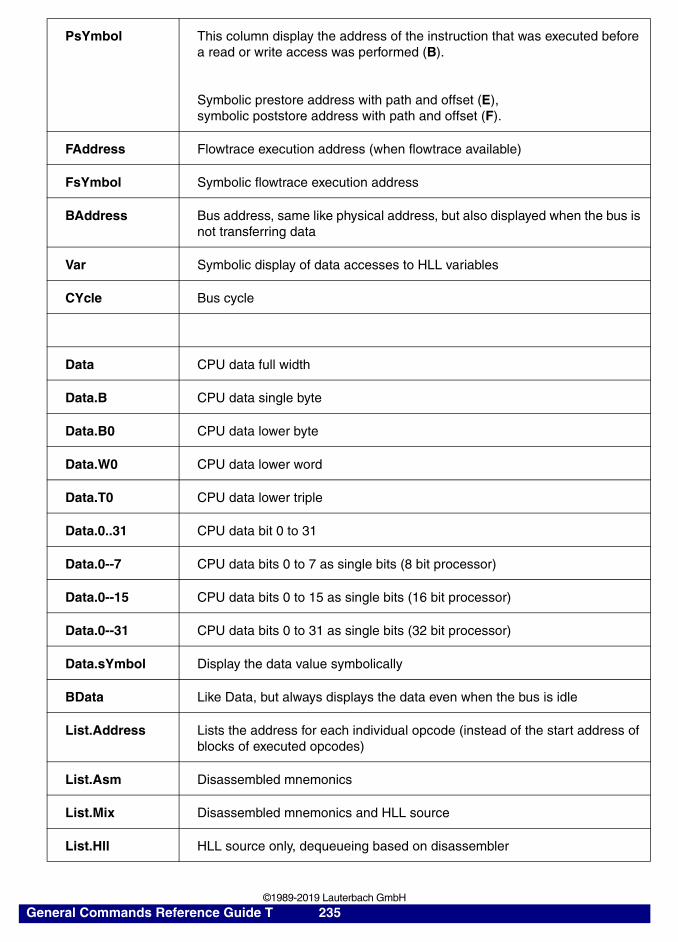
PsYmbol This column display the address of the instruction that was executed before a read or write access was performed (B).
Symbolic prestore address with path and offset (E),symbolic poststore address with path and offset (F).
FAddress Flowtrace execution address (when flowtrace available)
FsYmbol Symbolic flowtrace execution address
BAddress Bus address, same like physical address, but also displayed when the bus is not transferring data
Var Symbolic display of data accesses to HLL variables
CYcle Bus cycle
Data CPU data full width
Data.B CPU data single byte
Data.B0 CPU data lower byte
Data.W0 CPU data lower word
Data.T0 CPU data lower triple
Data.0..31 CPU data bit 0 to 31
Data.0--7 CPU data bits 0 to 7 as single bits (8 bit processor)
Data.0--15 CPU data bits 0 to 15 as single bits (16 bit processor)
Data.0--31 CPU data bits 0 to 31 as single bits (32 bit processor)
Data.sYmbol Display the data value symbolically
BData Like Data, but always displays the data even when the bus is idle
List.Address Lists the address for each individual opcode (instead of the start address of blocks of executed opcodes)
List.Asm Disassembled mnemonics
List.Mix Disassembled mnemonics and HLL source
List.Hll HLL source only, dequeueing based on disassembler
General Commands Reference Guide T 235 ©1989-2019 Lauterbach GmbH
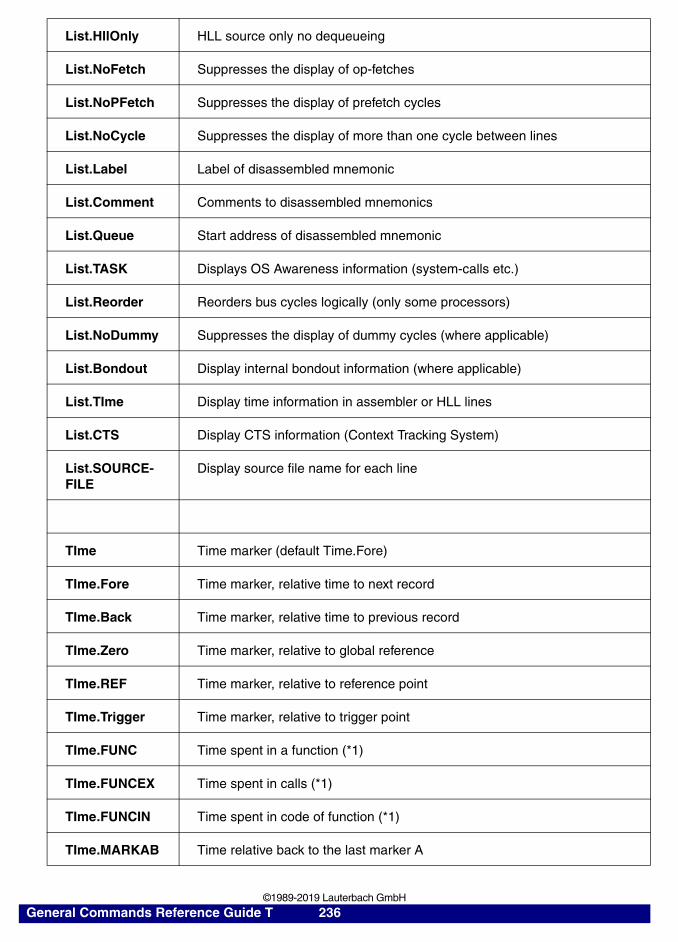
List.HllOnly HLL source only no dequeueing
List.NoFetch Suppresses the display of op-fetches
List.NoPFetch Suppresses the display of prefetch cycles
List.NoCycle Suppresses the display of more than one cycle between lines
List.Label Label of disassembled mnemonic
List.Comment Comments to disassembled mnemonics
List.Queue Start address of disassembled mnemonic
List.TASK Displays OS Awareness information (system-calls etc.)
List.Reorder Reorders bus cycles logically (only some processors)
List.NoDummy Suppresses the display of dummy cycles (where applicable)
List.Bondout Display internal bondout information (where applicable)
List.TIme Display time information in assembler or HLL lines
List.CTS Display CTS information (Context Tracking System)
List.SOURCE-FILE
Display source file name for each line
TIme Time marker (default Time.Fore)
TIme.Fore Time marker, relative time to next record
TIme.Back Time marker, relative time to previous record
TIme.Zero Time marker, relative to global reference
TIme.REF Time marker, relative to reference point
TIme.Trigger Time marker, relative to trigger point
TIme.FUNC Time spent in a function (*1)
TIme.FUNCEX Time spent in calls (*1)
TIme.FUNCIN Time spent in code of function (*1)
TIme.MARKAB Time relative back to the last marker A
General Commands Reference Guide T 236 ©1989-2019 Lauterbach GmbH

TIme.MARKAF Time relative forward to the next marker A
TIme.MARKBB Time relative back to the last marker B
TIme.MARKBF Time relative forward to the next marker B
TIme.MARKCB Time relative back to the last marker C
TIme.MARKCF Time relative forward to the next marker C
TIme.MARKDB Time relative back to the last marker D
TIme.MARKDF Time relative forward to the next marker D
CLOCKS.Back Number of clocks relative time to previous record
CLOCKS.Fore Number of clocks relative time to next record
CLOCKS.Trigger Number of clocks relative to trigger point
CLOCKS.REF Number of clocks relative to reference point
CLOCKS.Zero Number of clocks relative to global zero point
FUNC Function nesting display (*1)
FUNCVar Function nesting plus variables
FUNCR Record number associated with this entry/exit point (*1)
IGNORE Record ignored or used for performance/nesting analysis
LeVel Trigger unit logical level
MARK.all Display markers
MARK.A Display marker A
FLAG.all Flags of the trigger unit in a short form
FLAG.0 Flag 0 of the trigger unit
Trigger.A External trigger input A (E)External trigger input EXTA (bit 0) and EXTB (bit 1) (F)
General Commands Reference Guide T 237 ©1989-2019 Lauterbach GmbH
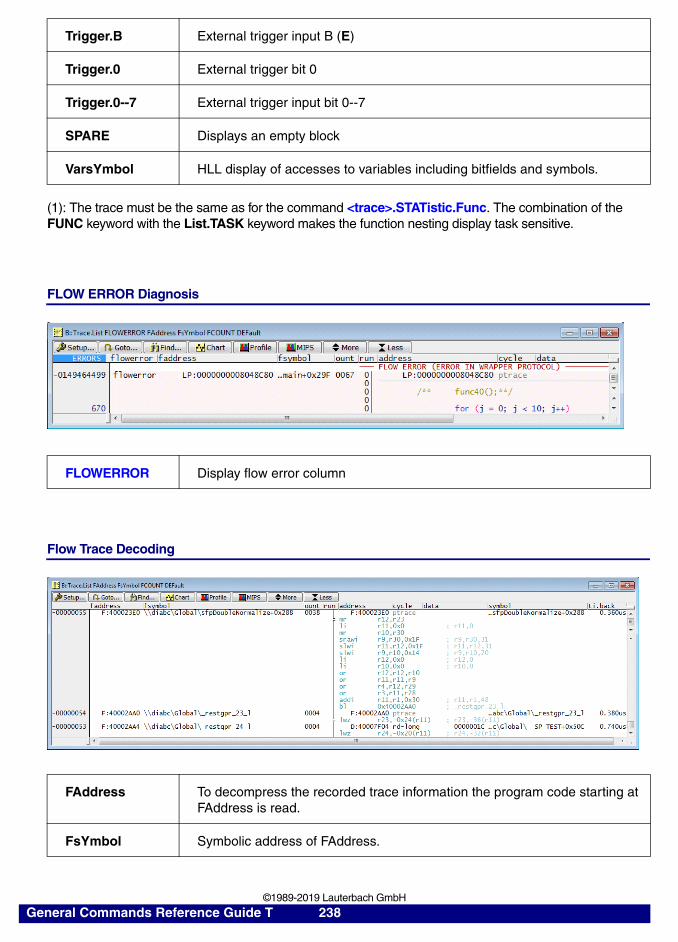
(1): The trace must be the same as for the command <trace>.STATistic.Func. The combination of the FUNC keyword with the List.TASK keyword makes the function nesting display task sensitive.
FLOW ERROR Diagnosis
Flow Trace Decoding
Trigger.B External trigger input B (E)
Trigger.0 External trigger bit 0
Trigger.0--7 External trigger input bit 0--7
SPARE Displays an empty block
VarsYmbol HLL display of accesses to variables including bitfields and symbols.
FLOWERROR Display flow error column
FAddress To decompress the recorded trace information the program code starting at FAddress is read.
FsYmbol Symbolic address of FAddress.
General Commands Reference Guide T 238 ©1989-2019 Lauterbach GmbH
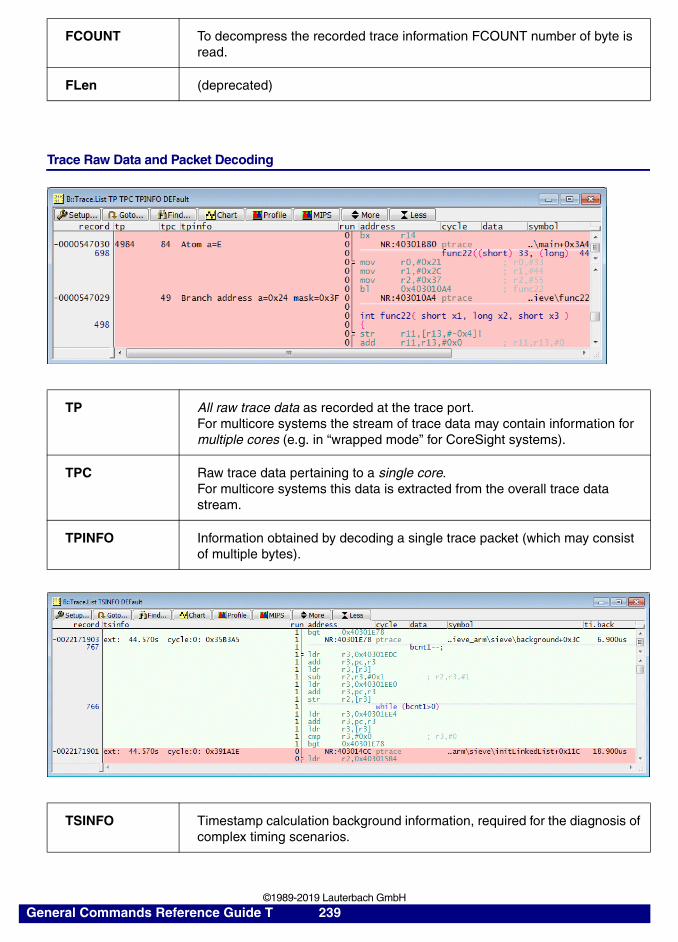
Trace Raw Data and Packet Decoding
FCOUNT To decompress the recorded trace information FCOUNT number of byte is read.
FLen (deprecated)
TP All raw trace data as recorded at the trace port.For multicore systems the stream of trace data may contain information for multiple cores (e.g. in “wrapped mode” for CoreSight systems).
TPC Raw trace data pertaining to a single core.For multicore systems this data is extracted from the overall trace data stream.
TPINFO Information obtained by decoding a single trace packet (which may consist of multiple bytes).
TSINFO Timestamp calculation background information, required for the diagnosis of complex timing scenarios.
General Commands Reference Guide T 239 ©1989-2019 Lauterbach GmbH
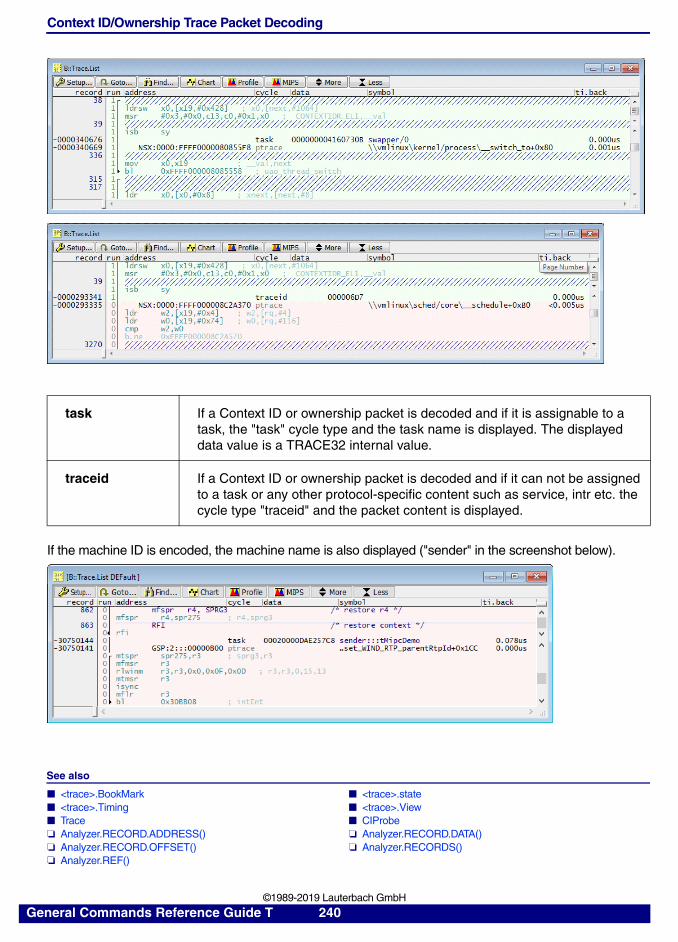
Context ID/Ownership Trace Packet Decoding
If the machine ID is encoded, the machine name is also displayed ("sender" in the screenshot below).
See also
■ <trace>.BookMark ■ <trace>.state ■ <trace>.Timing ■ <trace>.View ■ Trace ■ CIProbe ❏ Analyzer.RECORD.ADDRESS() ❏ Analyzer.RECORD.DATA() ❏ Analyzer.RECORD.OFFSET() ❏ Analyzer.RECORDS() ❏ Analyzer.REF()
task If a Context ID or ownership packet is decoded and if it is assignable to a task, the "task" cycle type and the task name is displayed. The displayed data value is a TRACE32 internal value.
traceid If a Context ID or ownership packet is decoded and if it can not be assigned to a task or any other protocol-specific content such as service, intr etc. the cycle type "traceid" and the packet content is displayed.
General Commands Reference Guide T 240 ©1989-2019 Lauterbach GmbH
▲ ’How to use the PROTOanalyzer’ in ’DigRF Protocol Analyzer’▲ ’How to use the PROTOanalyzer’ in ’FlexRay Protocol Analyzer’▲ ’How to use the PROTOanalyzer’ in ’LIN Bus Protocol Analyzer’▲ ’Displaying the Trace’ in ’Training FIRE Analyzer’▲ ’Emulator Functions’ in ’FIRE User’s Guide’▲ ’Release Information’ in ’Release History’
General Commands Reference Guide T 241 ©1989-2019 Lauterbach GmbH
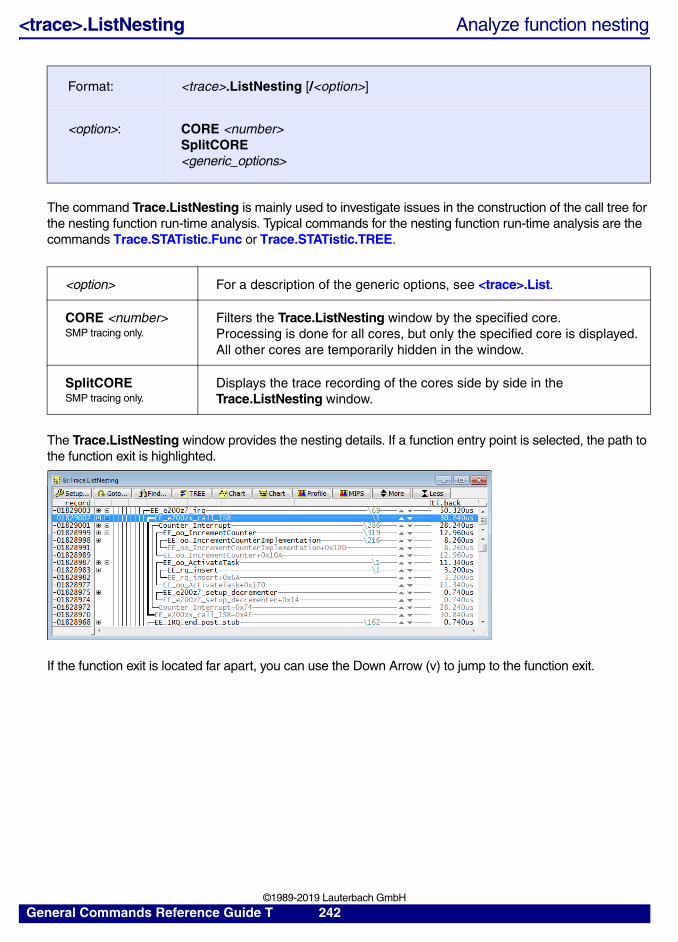
<trace>.ListNesting Analyze function nesting
The command Trace.ListNesting is mainly used to investigate issues in the construction of the call tree for the nesting function run-time analysis. Typical commands for the nesting function run-time analysis are the commands Trace.STATistic.Func or Trace.STATistic.TREE.
The Trace.ListNesting window provides the nesting details. If a function entry point is selected, the path to the function exit is highlighted.
If the function exit is located far apart, you can use the Down Arrow (v) to jump to the function exit.
Format: <trace>.ListNesting [/<option>]
<option>: CORE <number> SplitCORE <generic_options>
<option> For a description of the generic options, see <trace>.List.
CORE <number> SMP tracing only.
Filters the Trace.ListNesting window by the specified core.Processing is done for all cores, but only the specified core is displayed. All other cores are temporarily hidden in the window.
SplitCORE SMP tracing only.
Displays the trace recording of the cores side by side in the Trace.ListNesting window.
General Commands Reference Guide T 242 ©1989-2019 Lauterbach GmbH
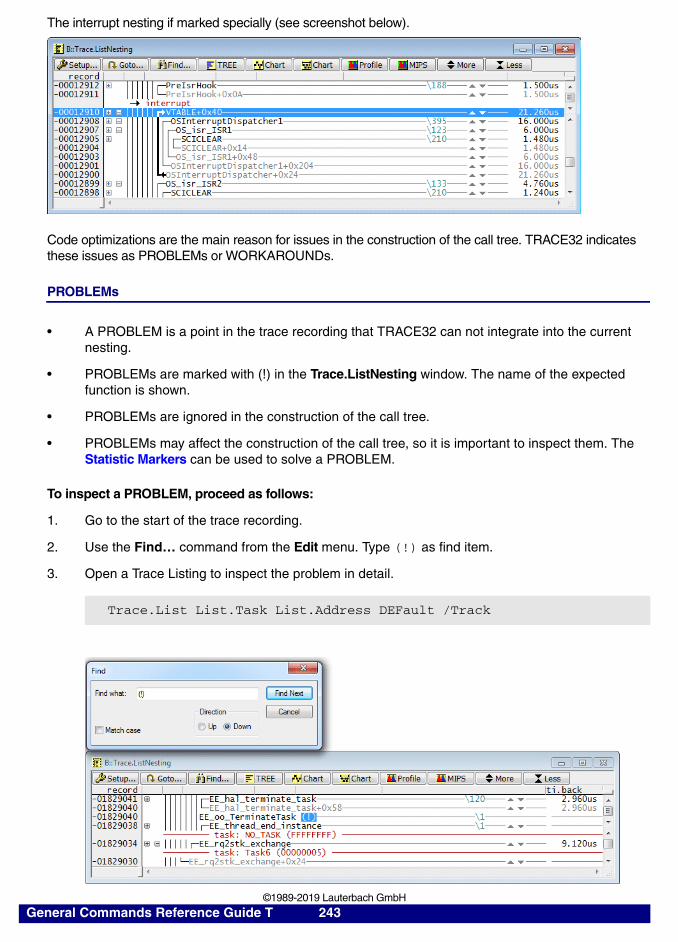
The interrupt nesting if marked specially (see screenshot below).
Code optimizations are the main reason for issues in the construction of the call tree. TRACE32 indicates these issues as PROBLEMs or WORKAROUNDs.
PROBLEMs
• A PROBLEM is a point in the trace recording that TRACE32 can not integrate into the current nesting.
• PROBLEMs are marked with (!) in the Trace.ListNesting window. The name of the expected function is shown.
• PROBLEMs are ignored in the construction of the call tree.
• PROBLEMs may affect the construction of the call tree, so it is important to inspect them. The Statistic Markers can be used to solve a PROBLEM.
To inspect a PROBLEM, proceed as follows:
1. Go to the start of the trace recording.
2. Use the Find… command from the Edit menu. Type (!) as find item.
3. Open a Trace Listing to inspect the problem in detail.
Trace.List List.Task List.Address DEFault /Track
General Commands Reference Guide T 243 ©1989-2019 Lauterbach GmbH
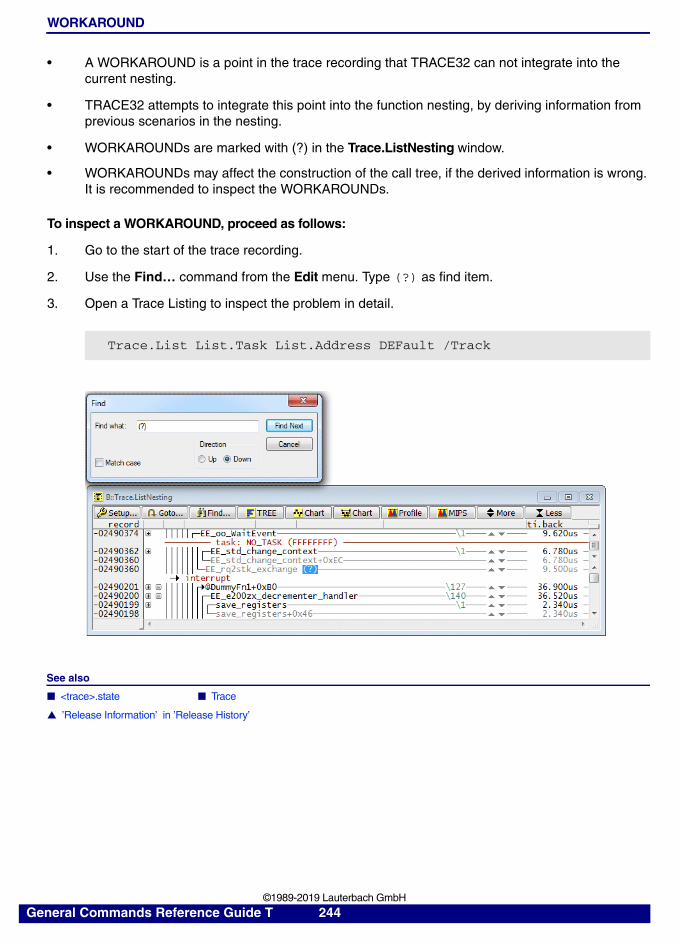
WORKAROUND
• A WORKAROUND is a point in the trace recording that TRACE32 can not integrate into the current nesting.
• TRACE32 attempts to integrate this point into the function nesting, by deriving information from previous scenarios in the nesting.
• WORKAROUNDs are marked with (?) in the Trace.ListNesting window.
• WORKAROUNDs may affect the construction of the call tree, if the derived information is wrong. It is recommended to inspect the WORKAROUNDs.
To inspect a WORKAROUND, proceed as follows:
1. Go to the start of the trace recording.
2. Use the Find… command from the Edit menu. Type (?) as find item.
3. Open a Trace Listing to inspect the problem in detail.
See also
■ <trace>.state ■ Trace
▲ ’Release Information’ in ’Release History’
Trace.List List.Task List.Address DEFault /Track
General Commands Reference Guide T 244 ©1989-2019 Lauterbach GmbH
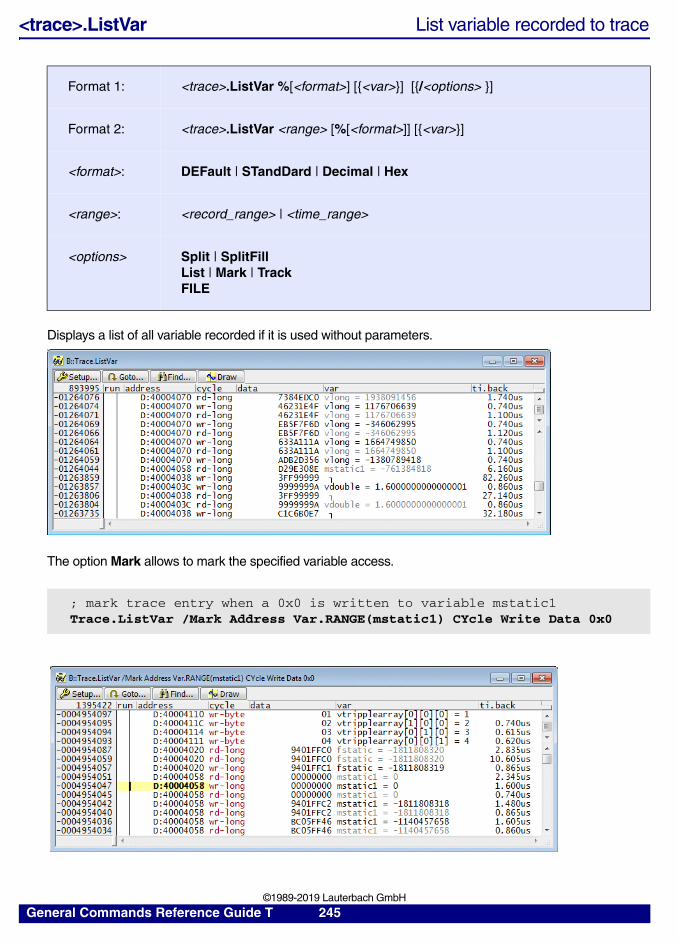
<trace>.ListVar List variable recorded to trace
Displays a list of all variable recorded if it is used without parameters.
The option Mark allows to mark the specified variable access.
Format 1: <trace>.ListVar %[<format>] [{<var>}] [{/<options> }]
Format 2: <trace>.ListVar <range> [%[<format>]] [{<var>}]
<format>: DEFault | STandDard | Decimal | Hex
<range>: <record_range> | <time_range>
<options> Split | SplitFillList | Mark | Track FILE
; mark trace entry when a 0x0 is written to variable mstatic1Trace.ListVar /Mark Address Var.RANGE(mstatic1) CYcle Write Data 0x0
General Commands Reference Guide T 245 ©1989-2019 Lauterbach GmbH
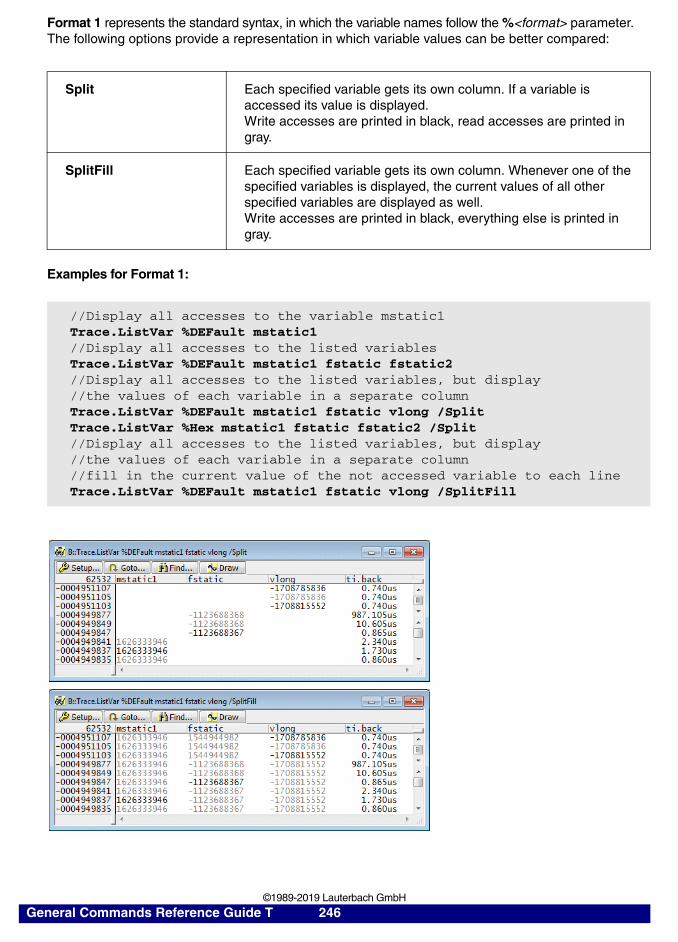
Format 1 represents the standard syntax, in which the variable names follow the %<format> parameter. The following options provide a representation in which variable values can be better compared:
Examples for Format 1:
Split Each specified variable gets its own column. If a variable is accessed its value is displayed. Write accesses are printed in black, read accesses are printed in gray.
SplitFill Each specified variable gets its own column. Whenever one of the specified variables is displayed, the current values of all other specified variables are displayed as well.Write accesses are printed in black, everything else is printed in gray.
//Display all accesses to the variable mstatic1Trace.ListVar %DEFault mstatic1//Display all accesses to the listed variablesTrace.ListVar %DEFault mstatic1 fstatic fstatic2 //Display all accesses to the listed variables, but display//the values of each variable in a separate columnTrace.ListVar %DEFault mstatic1 fstatic vlong /Split Trace.ListVar %Hex mstatic1 fstatic fstatic2 /Split //Display all accesses to the listed variables, but display//the values of each variable in a separate column//fill in the current value of the not accessed variable to each lineTrace.ListVar %DEFault mstatic1 fstatic vlong /SplitFill
General Commands Reference Guide T 246 ©1989-2019 Lauterbach GmbH
Format 2 represents the advanced syntax, here it is possible to restrict the display to the specified <record_range> or <time_range>.
Examples for Format 2:
See also
■ <trace>.state ■ Trace
▲ ’Release Information’ in ’Release History’
Trace.ListVar (-14874903.)--(-14874761.) Trace.ListVar 1.8s--10.8sTrace.ListVar (-14874903.)--(-14874761.) vfloatTrace.ListVar 1.8s--10.8s mstatic1 fstatic fstatic2 /SplitFill
General Commands Reference Guide T 247 ©1989-2019 Lauterbach GmbH
<trace>.LOAD Load trace file for offline processing
Loads trace data from a file into the debugger. Typically <trace>.LOAD is used to analyze data in a simulator or to compare different recordings.
The command loads the data into the “normal” trace buffer i.e. the same buffer that is filled when recording data using an analyzer (e.g. via PowerTrace, PowerProbe, PowerIntegrator etc.). As the standard trace commands work on this buffer, they automatically work on the loaded data. To highlight that loaded data is displayed, windows are marked by a red label LOAD label in the bottom-left corner.
To save trace data, use the command <trace>.SAVE.
An example for working on loaded trace data:
Format: <trace>.LOAD [<file>] [/Config]
<file> The default extension for the file name is *.ad.
NOTE: There is a similar but slightly different command <trace>.FILE. It loads the trace data into a dedicated file trace buffer. To have trace commands (e.g. Trace.List) work on the file trace buffer, they need to be invoked with the parameter /FILE.
Trace.LOAD test4 ; load trace contents from file
Data.LOAD.Elf demo.elf /NoCODE ; load symbol information for the; post-processing
Trace.List ; display loaded trace contents
Trace.Chart.sYmbol ; symbol analysis of trace
Trace.STATistic.Func ; function run-time analysis
General Commands Reference Guide T 248 ©1989-2019 Lauterbach GmbH
The TRACE display and analysis commands are re-directed to the selected trace method if:
• Trace.LOAD is executed without the parameter <file>.
• A trace configuration command is executed.
• The program execution is started while Trace.AutoArm is set to ON.
If the Trace.METHOD Probe or Trace.METHOD Integrator was selected, when the trace contents were saved, the option /Config can be used to re-activate the Probe/Integrator and NAME settings.
See also
■ <trace>.FILE ■ <trace>.SAVE ■ <trace>.state ■ Trace
▲ ’Emulator Functions’ in ’FIRE User’s Guide’▲ ’Release Information’ in ’Release History’
Trace.LOAD ; Re-direct trace display and ; analysis commands to the selected; trace method
Trace.Init ; the trace configuration command; Trace.Init re-directs the trace; display and analysis commands to ; the selected trace method
Trace.METHOD Probe ; select the trace method Probe; for the PowerProbe
…
Trace.SAVE probetest1 ; save the trace contents to the ; file probetest1
…
QUIT ; end TRACE32
; use a TRACE32 instruction set; simulator to postprocess the; PowerProbe trace data
Trace.LOAD probetest1 /Config ; load the trace contents from the; file probetest1
; load the Probe settings and NAMEs
Trace.List
General Commands Reference Guide T 249 ©1989-2019 Lauterbach GmbH
<trace>.MERGEFILE Combine two trace files into one
Combines two trace files into one. This is useful for traces recorded for different cores working in AMP mode.
See also
■ Trace
Format: <trace>.MERGEFILE <file> [<trace_area>] [/<options> …]
<trace_area>: <string><range><value><timerange>
<option>: ZIPNoCompressQuickCompressCompressTIMEGAP <time>
ZIP File is compressed with the gzip archive format.
NoCompress Obsolete.
QuickCompress Obsolete.
Compress Obsolete.
TIMEGAP <time> Allows a seamless concatenation with regards to the timestamp
NOTE: The ZIP or Compress options have meanwhile become obsolete because the resulting file is compressed by default.
General Commands Reference Guide T 250 ©1989-2019 Lauterbach GmbH
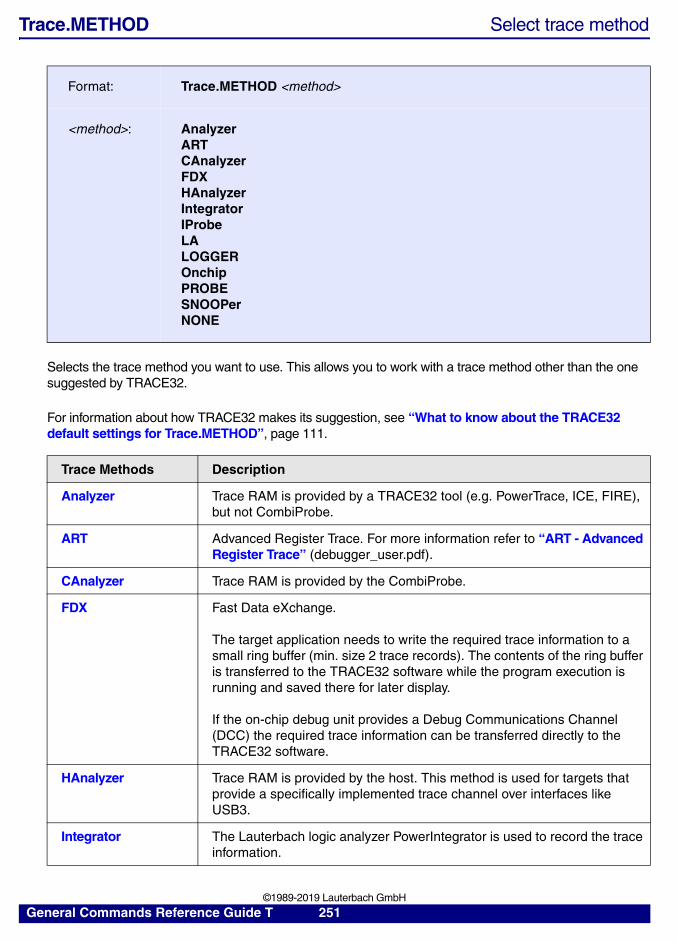
Trace.METHOD Select trace method
Selects the trace method you want to use. This allows you to work with a trace method other than the one suggested by TRACE32.
For information about how TRACE32 makes its suggestion, see “What to know about the TRACE32 default settings for Trace.METHOD”, page 111.
Format: Trace.METHOD <method>
<method>: AnalyzerARTCAnalyzerFDXHAnalyzerIntegratorIProbeLALOGGEROnchipPROBESNOOPerNONE
Trace Methods Description
Analyzer Trace RAM is provided by a TRACE32 tool (e.g. PowerTrace, ICE, FIRE), but not CombiProbe.
ART Advanced Register Trace. For more information refer to “ART - Advanced Register Trace” (debugger_user.pdf).
CAnalyzer Trace RAM is provided by the CombiProbe.
FDX Fast Data eXchange.
The target application needs to write the required trace information to a small ring buffer (min. size 2 trace records). The contents of the ring buffer is transferred to the TRACE32 software while the program execution is running and saved there for later display.
If the on-chip debug unit provides a Debug Communications Channel (DCC) the required trace information can be transferred directly to the TRACE32 software.
HAnalyzer Trace RAM is provided by the host. This method is used for targets that provide a specifically implemented trace channel over interfaces like USB3.
Integrator The Lauterbach logic analyzer PowerIntegrator is used to record the trace information.
General Commands Reference Guide T 251 ©1989-2019 Lauterbach GmbH
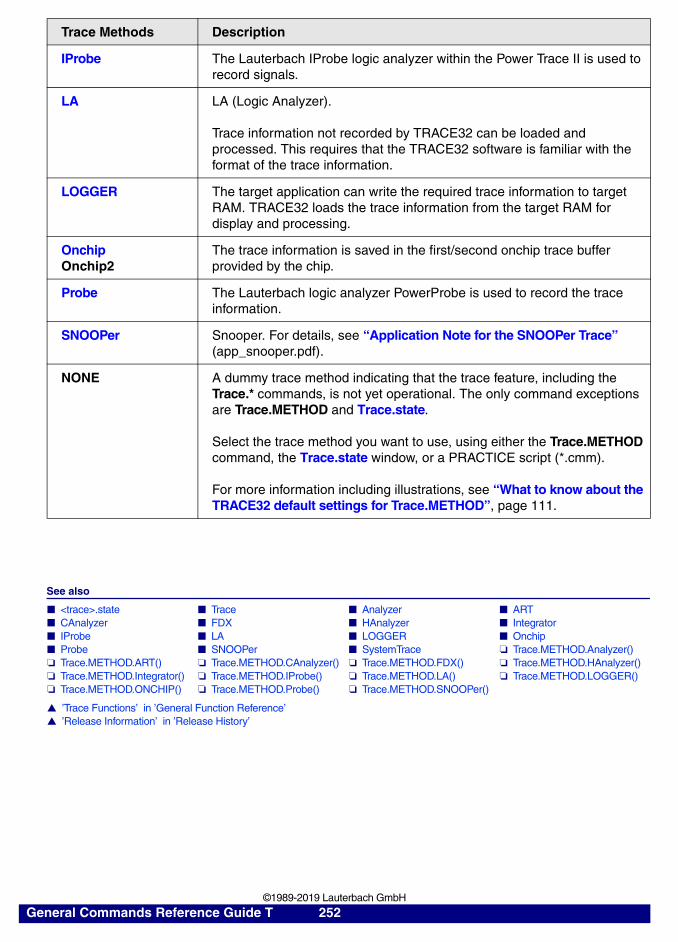
See also
■ <trace>.state ■ Trace ■ Analyzer ■ ART ■ CAnalyzer ■ FDX ■ HAnalyzer ■ Integrator ■ IProbe ■ LA ■ LOGGER ■ Onchip ■ Probe ■ SNOOPer ■ SystemTrace ❏ Trace.METHOD.Analyzer() ❏ Trace.METHOD.ART() ❏ Trace.METHOD.CAnalyzer() ❏ Trace.METHOD.FDX() ❏ Trace.METHOD.HAnalyzer() ❏ Trace.METHOD.Integrator() ❏ Trace.METHOD.IProbe() ❏ Trace.METHOD.LA() ❏ Trace.METHOD.LOGGER() ❏ Trace.METHOD.ONCHIP() ❏ Trace.METHOD.Probe() ❏ Trace.METHOD.SNOOPer()
▲ ’Trace Functions’ in ’General Function Reference’▲ ’Release Information’ in ’Release History’
IProbe The Lauterbach IProbe logic analyzer within the Power Trace II is used to record signals.
LA LA (Logic Analyzer).
Trace information not recorded by TRACE32 can be loaded and processed. This requires that the TRACE32 software is familiar with the format of the trace information.
LOGGER The target application can write the required trace information to target RAM. TRACE32 loads the trace information from the target RAM for display and processing.
OnchipOnchip2
The trace information is saved in the first/second onchip trace buffer provided by the chip.
Probe The Lauterbach logic analyzer PowerProbe is used to record the trace information.
SNOOPer Snooper. For details, see “Application Note for the SNOOPer Trace” (app_snooper.pdf).
NONE A dummy trace method indicating that the trace feature, including the Trace.* commands, is not yet operational. The only command exceptions are Trace.METHOD and Trace.state.
Select the trace method you want to use, using either the Trace.METHOD command, the Trace.state window, or a PRACTICE script (*.cmm).
For more information including illustrations, see “What to know about the TRACE32 default settings for Trace.METHOD”, page 111.
Trace Methods Description
General Commands Reference Guide T 252 ©1989-2019 Lauterbach GmbH

<trace>.Mode Set the trace operation mode
Selects the trace operation mode. The most common operation modes are:
Format: <trace>.Mode [<mode>]
<mode>: FifoStackLeashSTREAMPIPERTS
FASTCreate64BitChangeCompressPrestore [ON | OFF] (deprecated) Use ETM.DataTracePrestore instead.SLAVE [ON | OFF]PrePost [ON | OFF] MasterBrk [ON | OFF]SlaveBrk [ON | OFF]HT [Trace | Prestore | Selective | OFF]100MHZDCCMemoryDetailTraceEventTraceFlowTraceLoopTraceSPB [ON | OFF]RPB [ON | OFF]
Fifo If the trace is full, new records will overwrite older records. The trace records always the last cycles before the break.
Stack If the trace is full recording will be stopped. The trace always records the first cycles after starting the trace.
Leash Stops the program execution when trace is nearly full.
General Commands Reference Guide T 253 ©1989-2019 Lauterbach GmbH
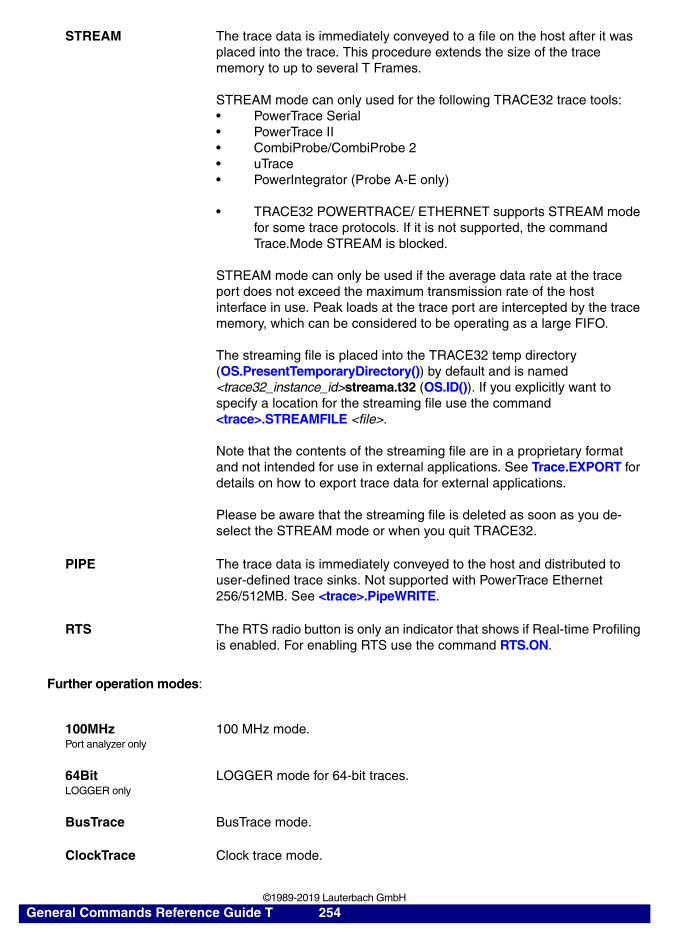
Further operation modes:
STREAM The trace data is immediately conveyed to a file on the host after it was placed into the trace. This procedure extends the size of the trace memory to up to several T Frames.
STREAM mode can only used for the following TRACE32 trace tools:• PowerTrace Serial• PowerTrace II • CombiProbe/CombiProbe 2 • uTrace• PowerIntegrator (Probe A-E only)
• TRACE32 POWERTRACE/ ETHERNET supports STREAM mode for some trace protocols. If it is not supported, the command Trace.Mode STREAM is blocked.
STREAM mode can only be used if the average data rate at the trace port does not exceed the maximum transmission rate of the host interface in use. Peak loads at the trace port are intercepted by the trace memory, which can be considered to be operating as a large FIFO.
The streaming file is placed into the TRACE32 temp directory (OS.PresentTemporaryDirectory()) by default and is named <trace32_instance_id>streama.t32 (OS.ID()). If you explicitly want to specify a location for the streaming file use the command <trace>.STREAMFILE <file>.
Note that the contents of the streaming file are in a proprietary format and not intended for use in external applications. See Trace.EXPORT for details on how to export trace data for external applications.
Please be aware that the streaming file is deleted as soon as you de-select the STREAM mode or when you quit TRACE32.
PIPE The trace data is immediately conveyed to the host and distributed to user-defined trace sinks. Not supported with PowerTrace Ethernet 256/512MB. See <trace>.PipeWRITE.
RTS The RTS radio button is only an indicator that shows if Real-time Profiling is enabled. For enabling RTS use the command RTS.ON.
100MHzPort analyzer only
100 MHz mode.
64BitLOGGER only
LOGGER mode for 64-bit traces.
BusTrace BusTrace mode.
ClockTrace Clock trace mode.
General Commands Reference Guide T 254 ©1989-2019 Lauterbach GmbH
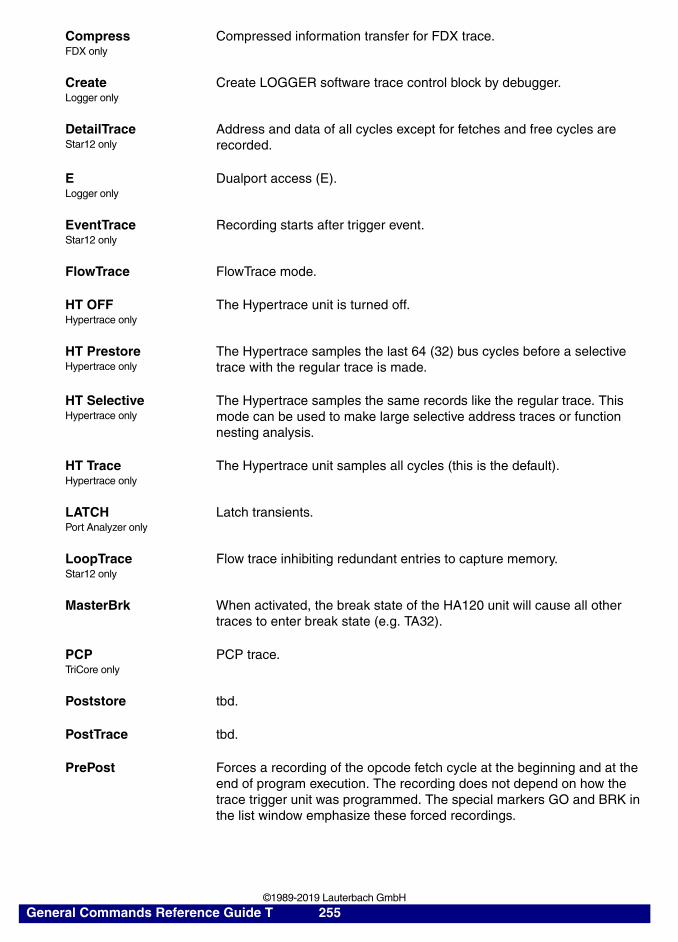
CompressFDX only
Compressed information transfer for FDX trace.
CreateLogger only
Create LOGGER software trace control block by debugger.
DetailTraceStar12 only
Address and data of all cycles except for fetches and free cycles are recorded.
ELogger only
Dualport access (E).
EventTraceStar12 only
Recording starts after trigger event.
FlowTrace FlowTrace mode.
HT OFFHypertrace only
The Hypertrace unit is turned off.
HT PrestoreHypertrace only
The Hypertrace samples the last 64 (32) bus cycles before a selective trace with the regular trace is made.
HT SelectiveHypertrace only
The Hypertrace samples the same records like the regular trace. This mode can be used to make large selective address traces or function nesting analysis.
HT TraceHypertrace only
The Hypertrace unit samples all cycles (this is the default).
LATCHPort Analyzer only
Latch transients.
LoopTraceStar12 only
Flow trace inhibiting redundant entries to capture memory.
MasterBrk When activated, the break state of the HA120 unit will cause all other traces to enter break state (e.g. TA32).
PCPTriCore only
PCP trace.
Poststore tbd.
PostTrace tbd.
PrePost Forces a recording of the opcode fetch cycle at the beginning and at the end of program execution. The recording does not depend on how the trace trigger unit was programmed. The special markers GO and BRK in the list window emphasize these forced recordings.
General Commands Reference Guide T 255 ©1989-2019 Lauterbach GmbH
See also
■ <trace>.state ■ Trace ■ CIProbe ■ COVerage.METHOD ❏ Analyzer.MODE.FLOW()
▲ ’On-chip Trace’ in ’StarCore Debugger and Trace’▲ ’CPU specific Commands’ in ’TriCore Debugger and Trace’▲ ’HCS12 On-chip Debug Module’ in ’FIRE Emulator for HC12/MCS12’▲ ’HCS12 On-chip Debug Module’ in ’FIRE Emulator for HC12/MCS12’▲ ’Release Information’ in ’Release History’▲ ’CPU specific Trace Commands’ in ’Simulator for TriCore’
Prestore(deprecated)
Samples the last opcode-fetch address before a selective data access. The size of the trace memory is halved automatically. By using this mode is it possible to get information about which program has made an access to a variable without tracing the complete program flow.
RPBTriCore only
When enabling a bus trace, all read and write accesses on this bus will be traced by default, including data values and addresses. This trace is independent of Onchip.Mode DataTrace which only affects TriCore and PCP. The recorded data will be mixed into the program flow at the point it was placed into the trace memory by the silicon, e.g. wd-rpb marks a write access on remote peripheral bus. There is no support for data cycle assignment as it is for TriCore LMB bus trace.
SLAVE OFF Separates the trace from the program execution, i.e. trace is recording even when the program execution is stopped (very rarely used command).
SLAVE ON Ties the trace to the execution of the program, i.e. trace and the filter/trigger work only during user program execution (very rarely used command).
SlaveBrk When activated, the break of other traces (e.g. TA32) will cause the HA120 unit to enter break state.NOTE: The break state is not shown in the status window!
SPBTriCore only
When enabling a bus trace, all read and write accesses on this bus will be traced by default, including data values and addresses. This trace is independent of Onchip.Mode DataTrace which only affects TriCore and PCP. The recorded data will be mixed into the program flow at the point it was placed into the trace memory by the silicon, e.g. rd-spb marks a read access on system peripheral bus. There is no support for data cycle assignment as it is for TriCore LMB bus trace.
General Commands Reference Guide T 256 ©1989-2019 Lauterbach GmbH

<trace>.MUX Select channels
Selects which channels are connected to the port analyzer. This option is only available when the emulation head has more than 64 port analyzer channels. The AUTO selection is only available in port analyzer version 2.
See also
■ Trace
<trace>.OFF Switch off
Disables both trace memory and the trigger unit. The trace memory can be read and the trigger unit be programmed.
See also
■ <trace>.state ■ CIProbe ■ Trace ❏ Analyzer.STATE()
▲ ’Emulator Functions’ in ’FIRE User’s Guide’
<trace>.Out tbd.
tbd.
See also
■ <trace>.state ■ Trace
▲ ’Trigger Commands’ in ’MIPS Debugger and Trace’
Format: <trace>.MUX [A | B | AUTO]
Format: <trace>.OFF
Format: <trace>.Out
General Commands Reference Guide T 257 ©1989-2019 Lauterbach GmbH
<trace>.PC Display PC in real-time
A certain hardware on the trace allows the displaying of the PC (program counter), while the CPU is running in real time. Without parameter the PC is displayed in the message line. It is displayed in the state line continuously, with the option ON. This command is useful if the program is running in loops (e.g. waiting for input).
See also
■ <trace>.state ■ Trace ❏ Analyzer.PC()
▲ ’Emulator Functions’ in ’FIRE User’s Guide’
Format: <trace>.PC [ON | OFF]
General Commands Reference Guide T 258 ©1989-2019 Lauterbach GmbH
<trace>.PipePROTO Unload all DLLs
See also
■ <trace>.PipePROTO.COMMAND ■ <trace>.PipePROTO.load ■ <trace>.state ■ Trace
<trace>.PipePROTO.COMMAND Send command to DLLs
See also
■ <trace>.PipePROTO
<trace>.PipePROTO.load Define a user-supplied DLL as trace sink
Loads a user supplied DLL (or “shared object” under Unix) as trace sink. Up to 8 DLLs can be loaded as trace sinks simultaneously. The debugger software will pass each received message to all loaded DLLs. The DLLs can then filter and process the messages in any possible way.
See also
■ <trace>.PipePROTO
Format: <trace>.PipePROTO (deprecated)Use <trace>.CustomTraceLoad "" instead.
Format: <trace>.PipePROTO.COMMAND [<cmd_line_args>] (deprecated)Use <trace>.CustomTrace.<label>.COMMAND instead.
Format: <trace>.PipePROTO.load <dll_name> [<cmd_line_args>] (deprecated)Use <trace>.CustomTraceLoad instead.
General Commands Reference Guide T 259 ©1989-2019 Lauterbach GmbH
<trace>.PipeWRITE Connect to a named pipe to stream trace data
Connect to a named pipe to stream the raw trace data to an external application. If <name> is omitted, the debugger disconnects from the named pipe.
Example: (for Windows)
See also
■ Trace
<trace>.PortFilter Specify utilization of trace memory
If the trace information is conveyed to the host computer at the recording time, it is advantageous to reduce the amount of data to be conveyed. This goal can be achieved by the following:
• No recording of idle cycles (applies only if the on-chip trace logic generates idle cycles).
• No generation of the TRACE32 tool time stamp, if it is not required for the intended analysis.
The command Trace.PortFilter allows the following configurations:
Format: <trace>.PipeWRITE [<name>]
Trace.Mode PIPE ; switch to PIPE mode
Trace.PipeWRITE \\.\pipe\ptrace ; connect to named pipe
; run testGo ; trace data now streamed to... ; external applicationBreak
Trace.PipeWRITE ; disconnect from named pipe
Format: <trace>.PortFilter ON | OFF | PACK | MAX | AUTO
ON Idle cycles are partly not recorded.
This setting is recommended for most accurate TRACE32 tool time stamps. (See also: ETM.TImeMode)
OFF All generated trace information is recorded (diagnose purpose only).
General Commands Reference Guide T 260 ©1989-2019 Lauterbach GmbH
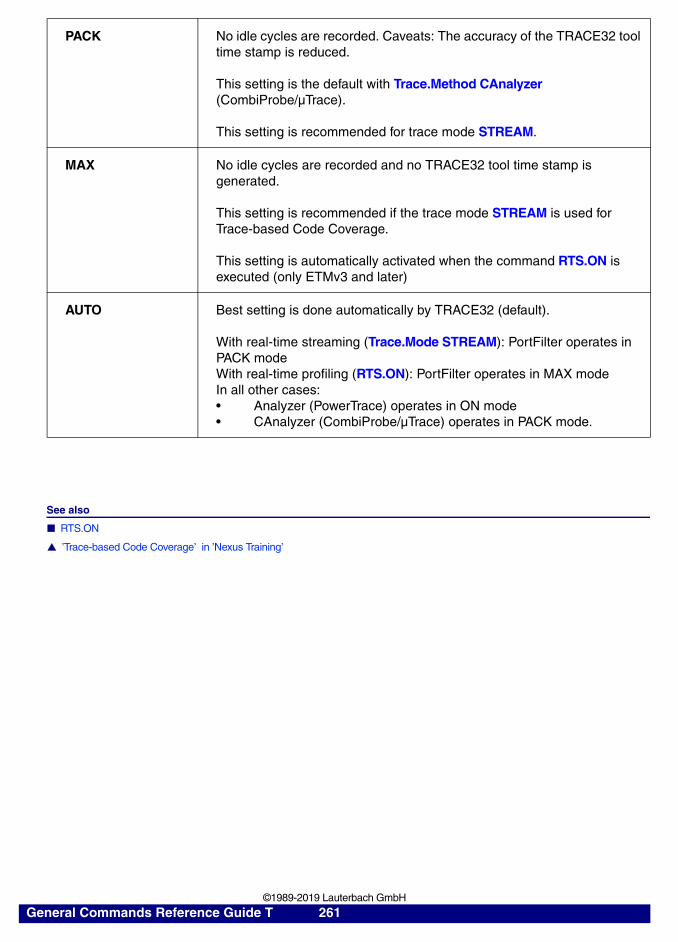
See also
■ RTS.ON
▲ ’Trace-based Code Coverage’ in ’Nexus Training’
PACK No idle cycles are recorded. Caveats: The accuracy of the TRACE32 tool time stamp is reduced.
This setting is the default with Trace.Method CAnalyzer (CombiProbe/µTrace).
This setting is recommended for trace mode STREAM.
MAX No idle cycles are recorded and no TRACE32 tool time stamp is generated.
This setting is recommended if the trace mode STREAM is used for Trace-based Code Coverage.
This setting is automatically activated when the command RTS.ON is executed (only ETMv3 and later)
AUTO Best setting is done automatically by TRACE32 (default).
With real-time streaming (Trace.Mode STREAM): PortFilter operates in PACK modeWith real-time profiling (RTS.ON): PortFilter operates in MAX modeIn all other cases:• Analyzer (PowerTrace) operates in ON mode• CAnalyzer (CombiProbe/µTrace) operates in PACK mode.
General Commands Reference Guide T 261 ©1989-2019 Lauterbach GmbH
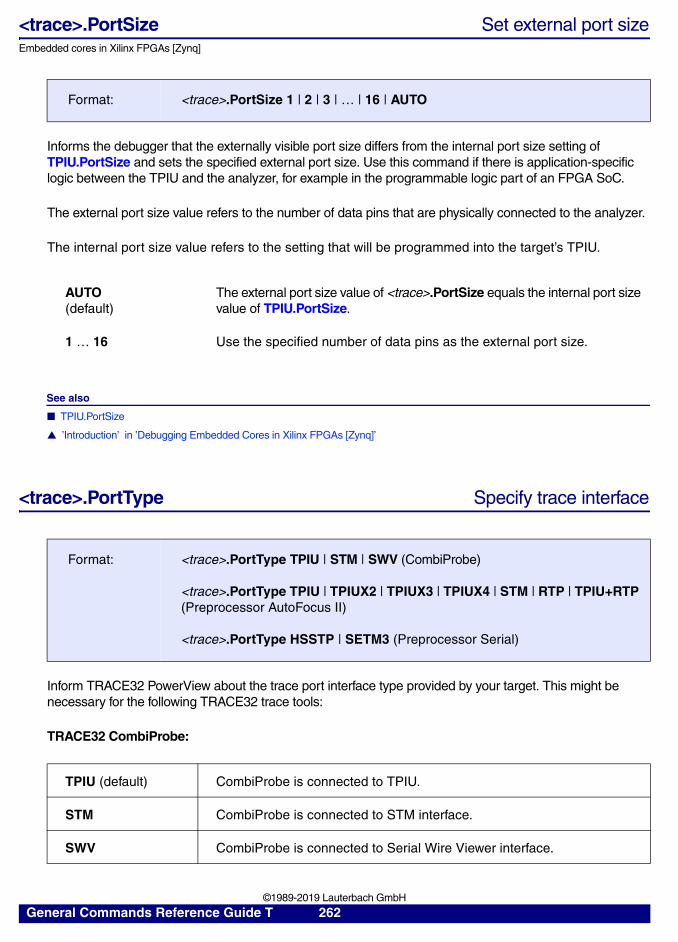
<trace>.PortSize Set external port sizeEmbedded cores in Xilinx FPGAs [Zynq]
Informs the debugger that the externally visible port size differs from the internal port size setting of TPIU.PortSize and sets the specified external port size. Use this command if there is application-specific logic between the TPIU and the analyzer, for example in the programmable logic part of an FPGA SoC.
The external port size value refers to the number of data pins that are physically connected to the analyzer.
The internal port size value refers to the setting that will be programmed into the target’s TPIU.
See also
■ TPIU.PortSize
▲ ’Introduction’ in ’Debugging Embedded Cores in Xilinx FPGAs [Zynq]’
<trace>.PortType Specify trace interface
Inform TRACE32 PowerView about the trace port interface type provided by your target. This might be necessary for the following TRACE32 trace tools:
TRACE32 CombiProbe:
Format: <trace>.PortSize 1 | 2 | 3 | … | 16 | AUTO
AUTO (default)
The external port size value of <trace>.PortSize equals the internal port size value of TPIU.PortSize.
1 … 16 Use the specified number of data pins as the external port size.
Format: <trace>.PortType TPIU | STM | SWV (CombiProbe)
<trace>.PortType TPIU | TPIUX2 | TPIUX3 | TPIUX4 | STM | RTP | TPIU+RTP (Preprocessor AutoFocus II)
<trace>.PortType HSSTP | SETM3 (Preprocessor Serial)
TPIU (default) CombiProbe is connected to TPIU.
STM CombiProbe is connected to STM interface.
SWV CombiProbe is connected to Serial Wire Viewer interface.
General Commands Reference Guide T 262 ©1989-2019 Lauterbach GmbH
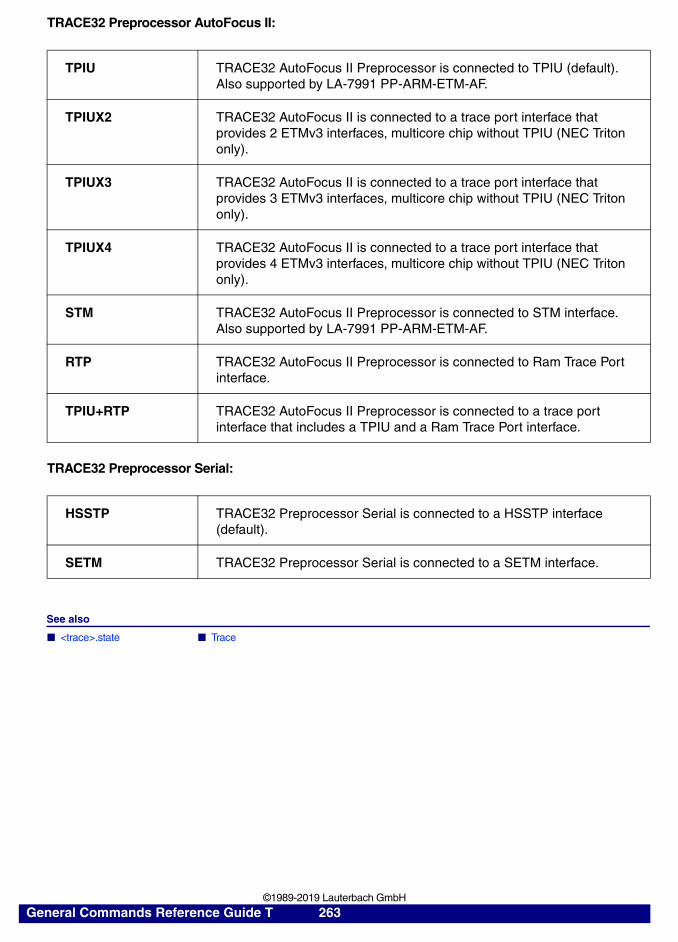
TRACE32 Preprocessor AutoFocus II:
TRACE32 Preprocessor Serial:
See also
■ <trace>.state ■ Trace
TPIU TRACE32 AutoFocus II Preprocessor is connected to TPIU (default).Also supported by LA-7991 PP-ARM-ETM-AF.
TPIUX2 TRACE32 AutoFocus II is connected to a trace port interface that provides 2 ETMv3 interfaces, multicore chip without TPIU (NEC Triton only).
TPIUX3 TRACE32 AutoFocus II is connected to a trace port interface that provides 3 ETMv3 interfaces, multicore chip without TPIU (NEC Triton only).
TPIUX4 TRACE32 AutoFocus II is connected to a trace port interface that provides 4 ETMv3 interfaces, multicore chip without TPIU (NEC Triton only).
STM TRACE32 AutoFocus II Preprocessor is connected to STM interface. Also supported by LA-7991 PP-ARM-ETM-AF.
RTP TRACE32 AutoFocus II Preprocessor is connected to Ram Trace Port interface.
TPIU+RTP TRACE32 AutoFocus II Preprocessor is connected to a trace port interface that includes a TPIU and a Ram Trace Port interface.
HSSTP TRACE32 Preprocessor Serial is connected to a HSSTP interface (default).
SETM TRACE32 Preprocessor Serial is connected to a SETM interface.
General Commands Reference Guide T 263 ©1989-2019 Lauterbach GmbH
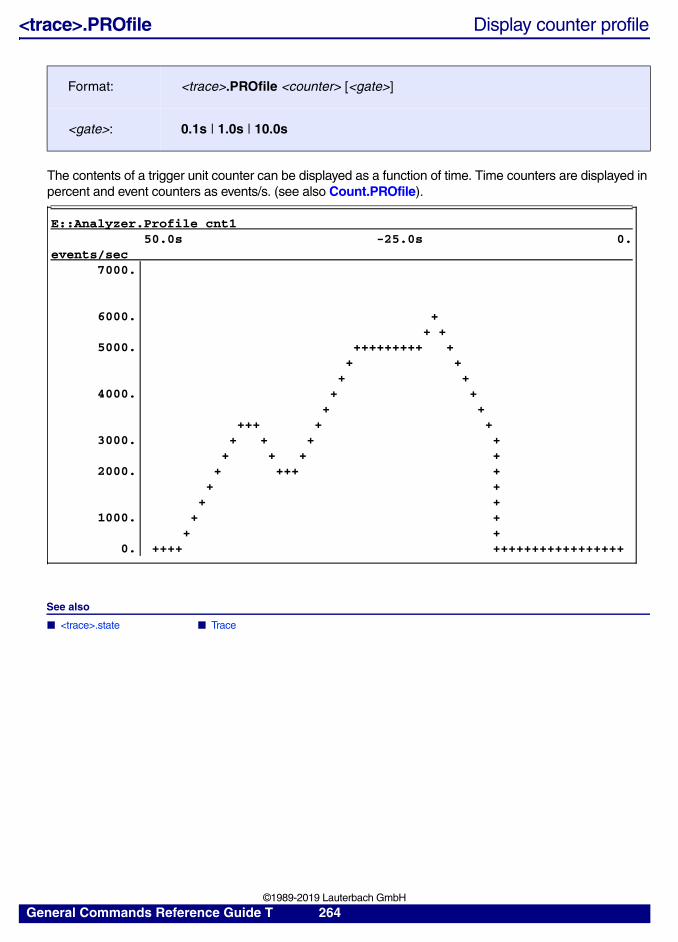
<trace>.PROfile Display counter profile
The contents of a trigger unit counter can be displayed as a function of time. Time counters are displayed in percent and event counters as events/s. (see also Count.PROfile).
See also
■ <trace>.state ■ Trace
Format: <trace>.PROfile <counter> [<gate>]
<gate>: 0.1s | 1.0s | 10.0s
E::Analyzer.Profile cnt150.0s -25.0s 0.
events/sec7000.
6000. ++ +
5000. +++++++++ ++ +
+ +4000. + +
+ ++++ + +
3000. + + + ++ + + +
2000. + +++ ++ +
+ +1000. + +
+ +0. ++++ +++++++++++++++++
General Commands Reference Guide T 264 ©1989-2019 Lauterbach GmbH
<trace>.PROfileChart Profile charts
The <trace>.PROfileChart command group displays distributions versus time graphically. For example, the command group can be used to show the processing ratio of selected tasks versus time.
See also
■ <trace>.state ■ Trace ■ <trace>.Chart ■ <trace>.PROfileChart.COUNTER ■ <trace>.PROfileChart.DIStance ■ <trace>.PROfileChart.DistriB ■ <trace>.PROfileChart.DURation ■ <trace>.PROfileChart.GROUP ■ <trace>.PROfileChart.Rate ■ <trace>.PROfileChart.sYmbol ■ <trace>.PROfileChart.TASK ■ <trace>.PROfileSTATistic ■ <trace>.STATistic
▲ ’Release Information’ in ’Release History’
General Commands Reference Guide T 265 ©1989-2019 Lauterbach GmbH
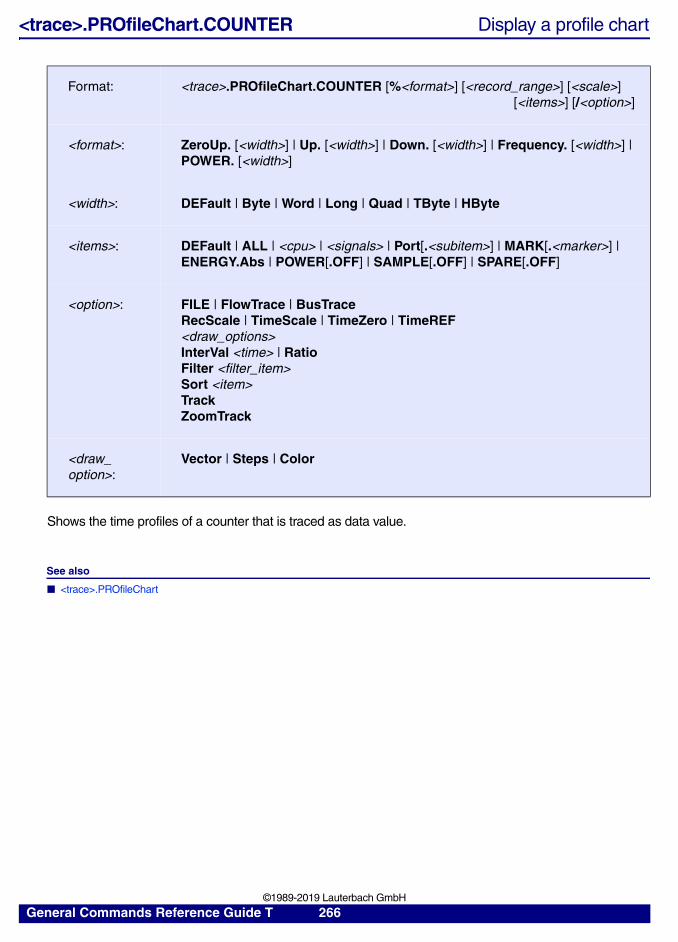
<trace>.PROfileChart.COUNTER Display a profile chart
Shows the time profiles of a counter that is traced as data value.
See also
■ <trace>.PROfileChart
Format: <trace>.PROfileChart.COUNTER [%<format>] [<record_range>] [<scale>] [<items>] [/<option>]
<format>: ZeroUp. [<width>] | Up. [<width>] | Down. [<width>] | Frequency. [<width>] | POWER. [<width>]
<width>: DEFault | Byte | Word | Long | Quad | TByte | HByte
<items>: DEFault | ALL | <cpu> | <signals> | Port[.<subitem>] | MARK[.<marker>] | ENERGY.Abs | POWER[.OFF] | SAMPLE[.OFF] | SPARE[.OFF]
<option>: FILE | FlowTrace | BusTraceRecScale | TimeScale | TimeZero | TimeREF<draw_options> InterVal <time> | RatioFilter <filter_item> Sort <item> TrackZoomTrack
<draw_option>:
Vector | Steps | Color
General Commands Reference Guide T 266 ©1989-2019 Lauterbach GmbH
<trace>.PROfileChart.DIStance Time interval for a single event
Display the time interval for a single event graphically. For the general options for all <trace>.PROfileChart commands refer to <trace>.Chart.
Example for TRACE32 ICD and TRACE32 PowerTrace:
If no selective tracing is possible, use the option /Filter to filter out the event of interest.
Example for TRACE32-ICE or TRACE32-FIRE:
Perform a selective trace on the event of interest.
Format: <trace>.PROfileChart.DIStance [<record_range>] [<scale>] [/<option>]<trace>.Chart.DIStance (deprecated)
<option>: FILEFlowTrace | BusTrace | CTSTrackRecScale | TimeScale | TimeZero | TimeREFFilter <item>
B::GoB::BreakB::Trace.PROfileChart.DIStance /FILTER Address InterruptEntry
Analyzer.ReProgram(
ADDR AlphaB InterruptEntrySample.enable IF AlphaBreak
)Go…BreakTrace.PROfileChart.DIStance
; selective trace
; program the analyzer to sample all; InterruptEntry
; measurement
; display the time interval between; the sampled InterruptEntry; graphically
General Commands Reference Guide T 267 ©1989-2019 Lauterbach GmbH
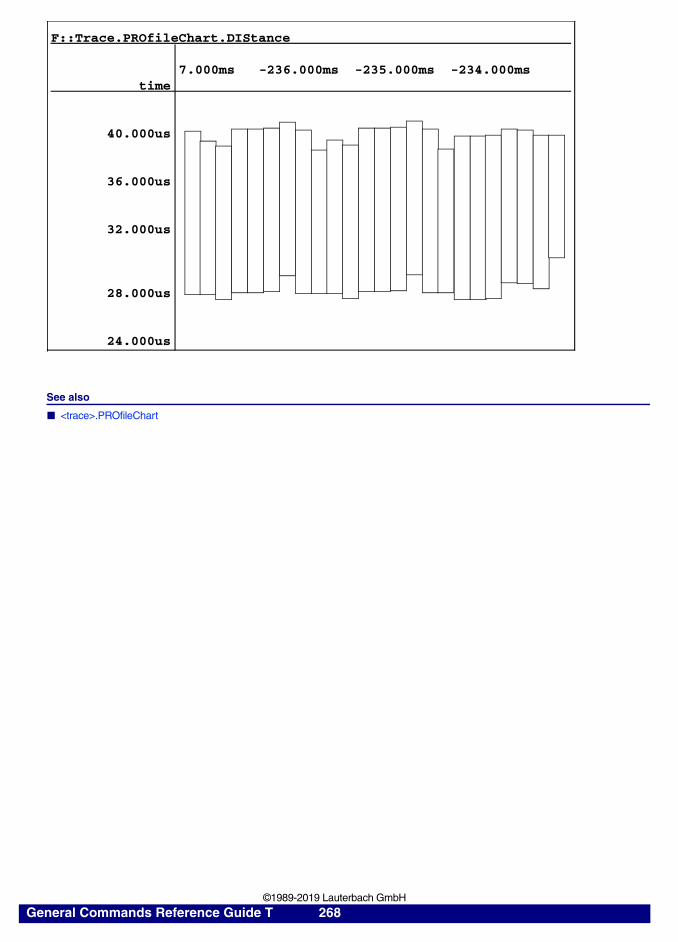
See also
■ <trace>.PROfileChart
F::Trace.PROfileChart.DIStance
7.000ms -236.000ms -235.000ms -234.000mstime
40.000us
36.000us
32.000us
28.000us
24.000us
General Commands Reference Guide T 268 ©1989-2019 Lauterbach GmbH
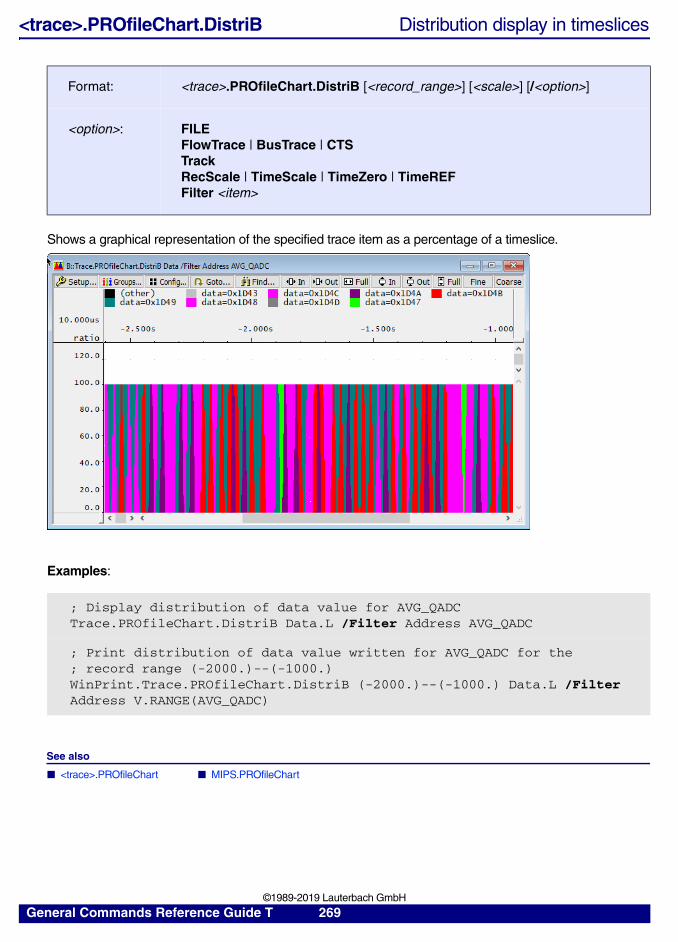
<trace>.PROfileChart.DistriB Distribution display in timeslices
Shows a graphical representation of the specified trace item as a percentage of a timeslice.
Examples:
See also
■ <trace>.PROfileChart ■ MIPS.PROfileChart
Format: <trace>.PROfileChart.DistriB [<record_range>] [<scale>] [/<option>]
<option>: FILEFlowTrace | BusTrace | CTSTrackRecScale | TimeScale | TimeZero | TimeREFFilter <item>
; Display distribution of data value for AVG_QADCTrace.PROfileChart.DistriB Data.L /Filter Address AVG_QADC
; Print distribution of data value written for AVG_QADC for the; record range (-2000.)--(-1000.)WinPrint.Trace.PROfileChart.DistriB (-2000.)--(-1000.) Data.L /Filter Address V.RANGE(AVG_QADC)
General Commands Reference Guide T 269 ©1989-2019 Lauterbach GmbH
<trace>.PROfileChart.DURation Time between two events
Graphical display of time intervals between two events.
TRACE32 PowerTrace
In order to use the command Trace.STATistic.DURation:
• Check if both events are exported by a trace packet. Information reconstructed by TRACE32 is not analyzed.
• Alternatively use a TraceEnable breakpoint export the event as a trace packet.
The options FilterA and FilterB provide you with the means to describe your event.
Format: <trace>.PROfileChart.DURation [<record_range>] [<scale>] [/<option>]<trace>.Chart.DURation (deprecated)
<option>: FILEFlowTrace | BusTraceAccumulate INCremental | FULL ATOA | ATOB BTOA | BTOBFilterA <filter> | FilterB <filter>RecScale | TimeScale | TimeZero | TimeREF
FilterA <item> Specify the first event.
FilterB <item> Specify the second event.
General Commands Reference Guide T 270 ©1989-2019 Lauterbach GmbH
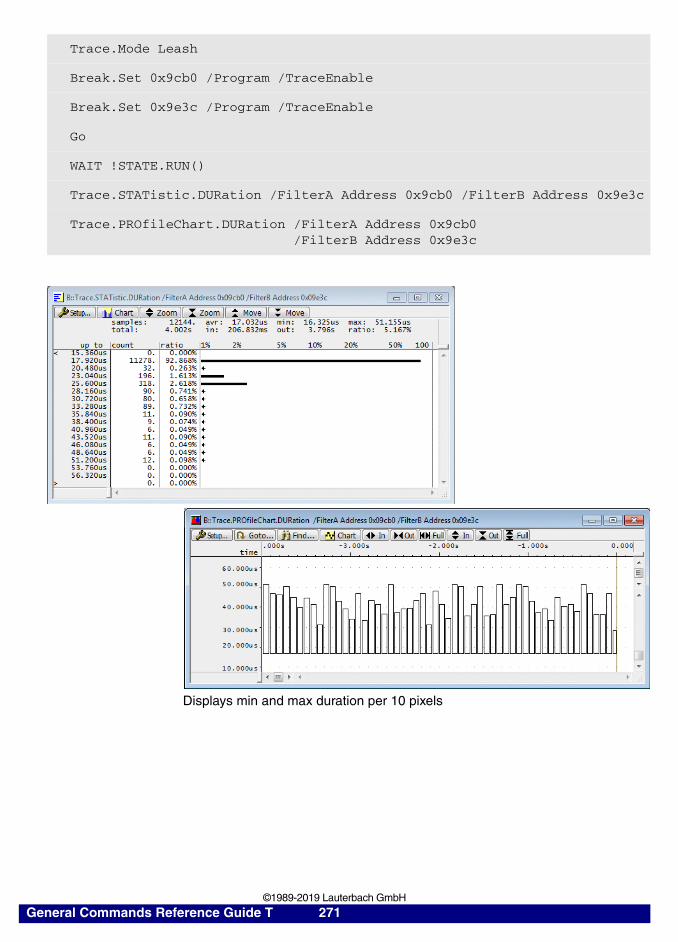
Trace.Mode Leash
Break.Set 0x9cb0 /Program /TraceEnable
Break.Set 0x9e3c /Program /TraceEnable
Go
WAIT !STATE.RUN()
Trace.STATistic.DURation /FilterA Address 0x9cb0 /FilterB Address 0x9e3c
Trace.PROfileChart.DURation /FilterA Address 0x9cb0 /FilterB Address 0x9e3c
Displays min and max duration per 10 pixels
General Commands Reference Guide T 271 ©1989-2019 Lauterbach GmbH
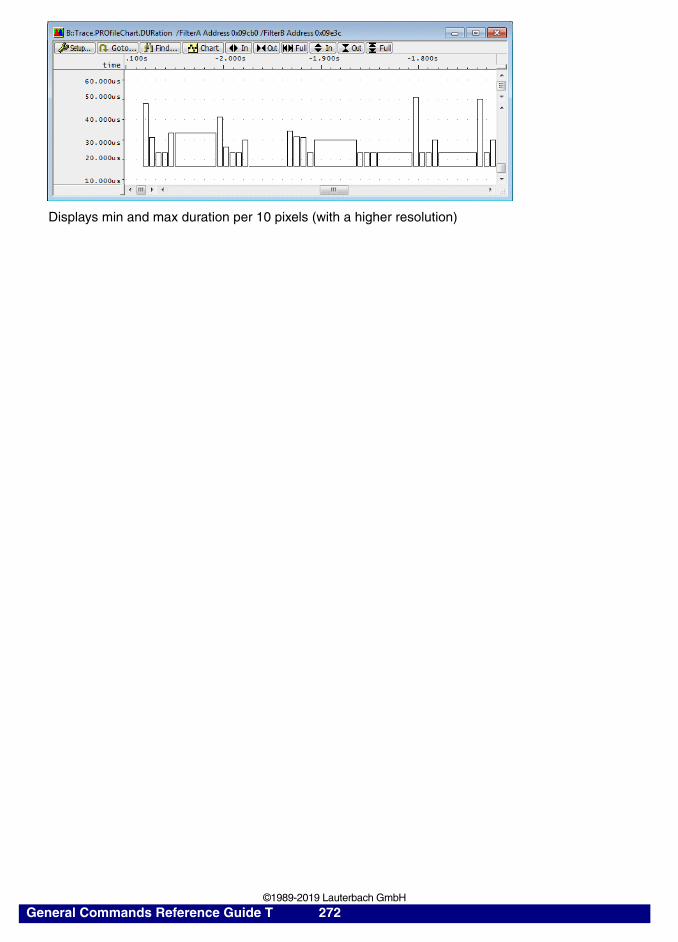
Displays min and max duration per 10 pixels (with a higher resolution)
General Commands Reference Guide T 272 ©1989-2019 Lauterbach GmbH
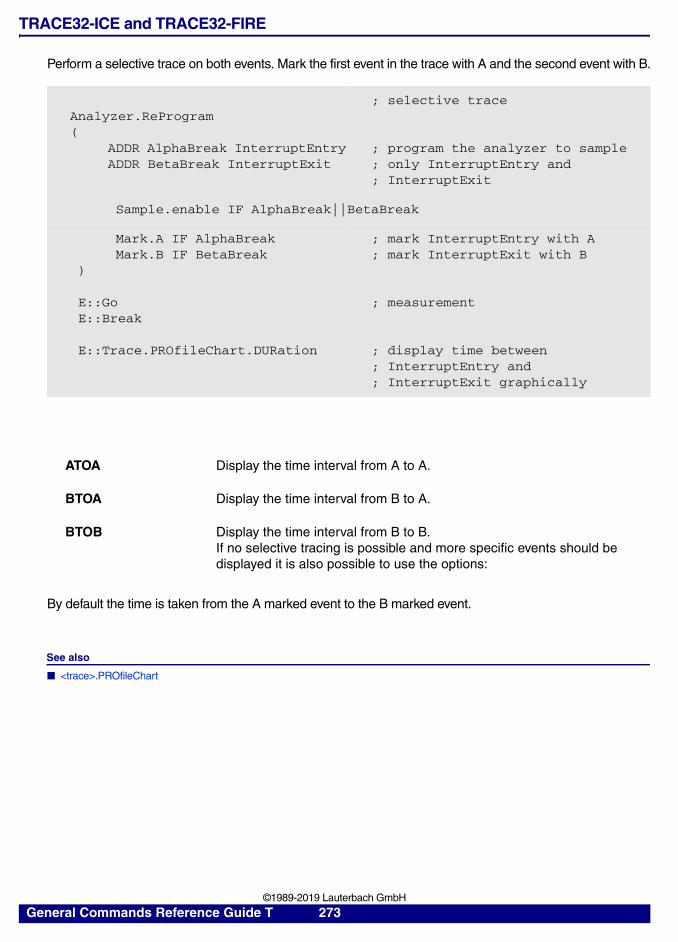
TRACE32-ICE and TRACE32-FIRE
Perform a selective trace on both events. Mark the first event in the trace with A and the second event with B.
By default the time is taken from the A marked event to the B marked event.
See also
■ <trace>.PROfileChart
Analyzer.ReProgram (
ADDR AlphaBreak InterruptEntryADDR BetaBreak InterruptExit
; selective trace
; program the analyzer to sample; only InterruptEntry and; InterruptExit
Sample.enable IF AlphaBreak||BetaBreak
Mark.A IF AlphaBreakMark.B IF BetaBreak
)
E::GoE::Break
E::Trace.PROfileChart.DURation
; mark InterruptEntry with A; mark InterruptExit with B
; measurement
; display time between; InterruptEntry and; InterruptExit graphically
ATOA Display the time interval from A to A.
BTOA Display the time interval from B to A.
BTOB Display the time interval from B to B.If no selective tracing is possible and more specific events should be displayed it is also possible to use the options:
General Commands Reference Guide T 273 ©1989-2019 Lauterbach GmbH
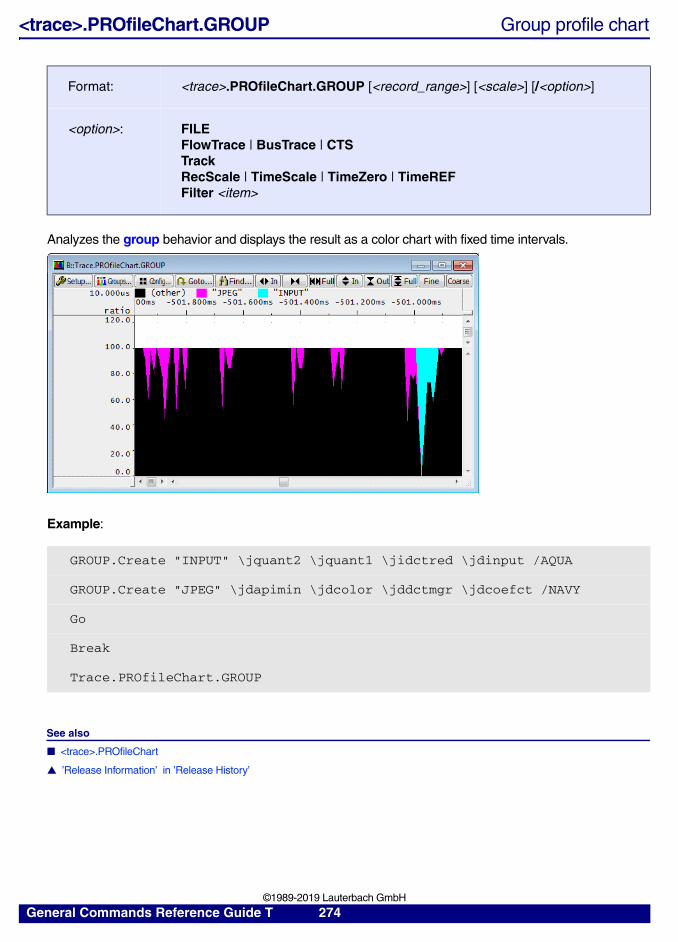
<trace>.PROfileChart.GROUP Group profile chart
Analyzes the group behavior and displays the result as a color chart with fixed time intervals.
Example:
See also
■ <trace>.PROfileChart
▲ ’Release Information’ in ’Release History’
Format: <trace>.PROfileChart.GROUP [<record_range>] [<scale>] [/<option>]
<option>: FILEFlowTrace | BusTrace | CTSTrackRecScale | TimeScale | TimeZero | TimeREFFilter <item>
GROUP.Create "INPUT" \jquant2 \jquant1 \jidctred \jdinput /AQUA
GROUP.Create "JPEG" \jdapimin \jdcolor \jddctmgr \jdcoefct /NAVY
Go
Break
Trace.PROfileChart.GROUP
General Commands Reference Guide T 274 ©1989-2019 Lauterbach GmbH
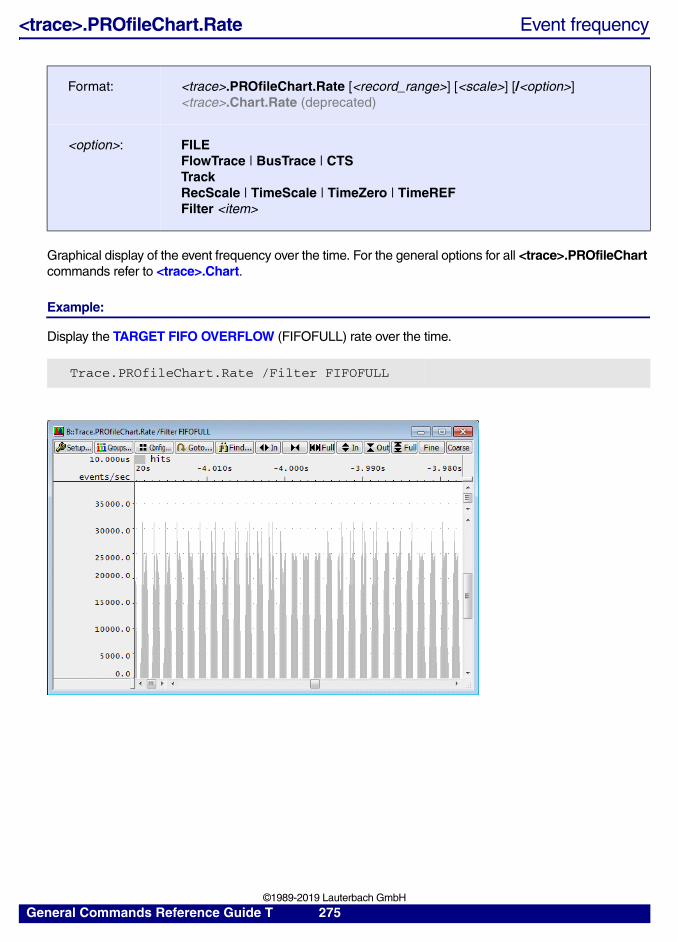
<trace>.PROfileChart.Rate Event frequency
Graphical display of the event frequency over the time. For the general options for all <trace>.PROfileChart commands refer to <trace>.Chart.
Example:
Display the TARGET FIFO OVERFLOW (FIFOFULL) rate over the time.
Format: <trace>.PROfileChart.Rate [<record_range>] [<scale>] [/<option>]<trace>.Chart.Rate (deprecated)
<option>: FILEFlowTrace | BusTrace | CTSTrackRecScale | TimeScale | TimeZero | TimeREFFilter <item>
Trace.PROfileChart.Rate /Filter FIFOFULL
General Commands Reference Guide T 275 ©1989-2019 Lauterbach GmbH
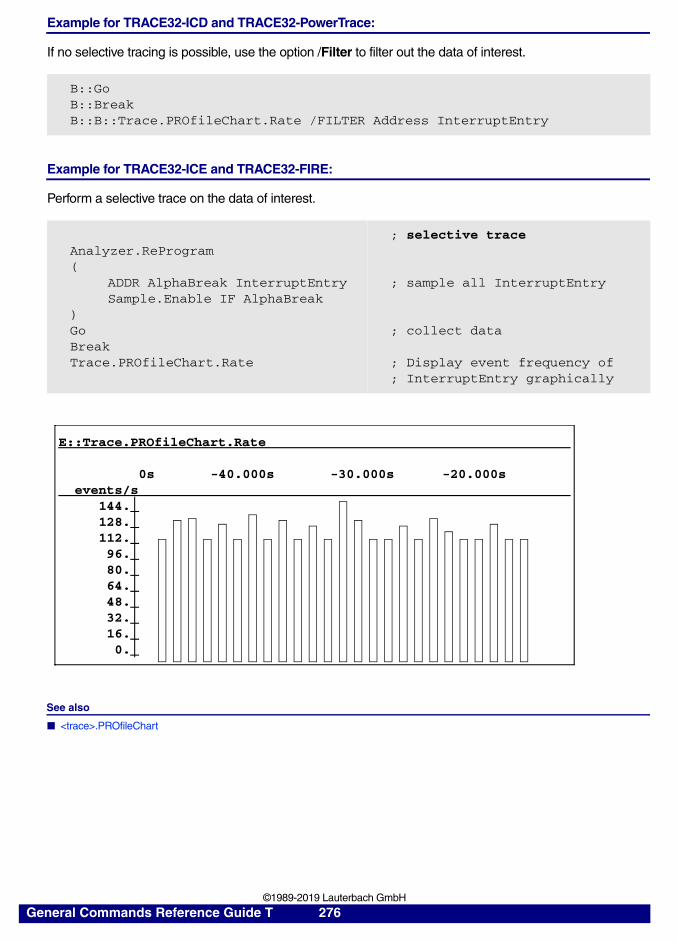
Example for TRACE32-ICD and TRACE32-PowerTrace:
If no selective tracing is possible, use the option /Filter to filter out the data of interest.
Example for TRACE32-ICE and TRACE32-FIRE:
Perform a selective trace on the data of interest.
See also
■ <trace>.PROfileChart
B::GoB::BreakB::B::Trace.PROfileChart.Rate /FILTER Address InterruptEntry
Analyzer.ReProgram(
ADDR AlphaBreak InterruptEntrySample.Enable IF AlphaBreak
)GoBreakTrace.PROfileChart.Rate
; selective trace
; sample all InterruptEntry
; collect data
; Display event frequency of; InterruptEntry graphically
E::Trace.PROfileChart.Rate
0s -40.000s -30.000s -20.000sevents/s
144.128.112.96.80.64.48.32.16.0.
General Commands Reference Guide T 276 ©1989-2019 Lauterbach GmbH
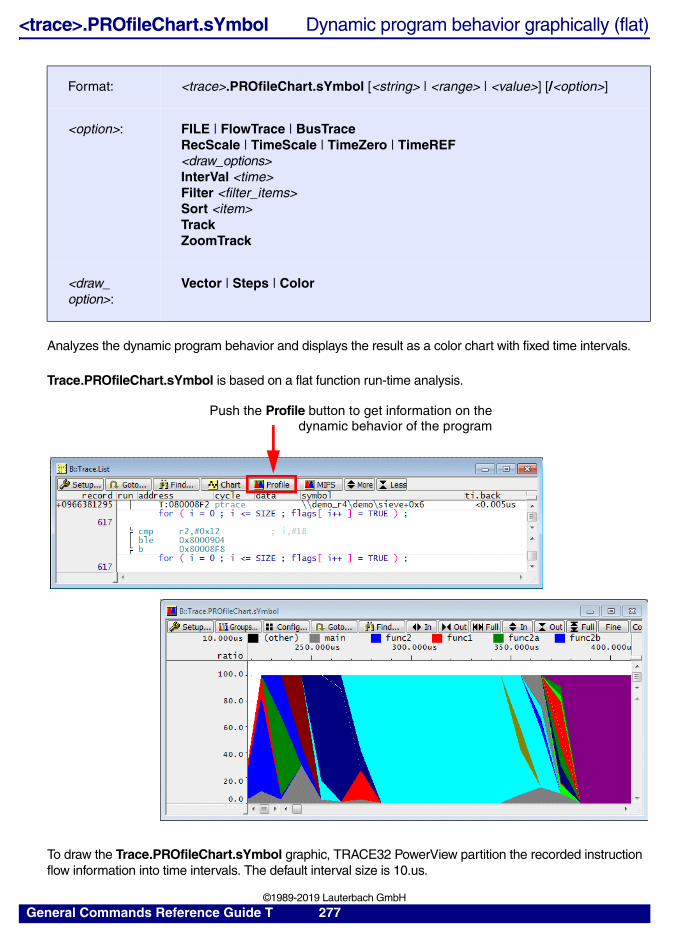
<trace>.PROfileChart.sYmbol Dynamic program behavior graphically (flat)
Analyzes the dynamic program behavior and displays the result as a color chart with fixed time intervals.
Trace.PROfileChart.sYmbol is based on a flat function run-time analysis.
To draw the Trace.PROfileChart.sYmbol graphic, TRACE32 PowerView partition the recorded instruction flow information into time intervals. The default interval size is 10.us.
Format: <trace>.PROfileChart.sYmbol [<string> | <range> | <value>] [/<option>]
<option>: FILE | FlowTrace | BusTraceRecScale | TimeScale | TimeZero | TimeREF<draw_options> InterVal <time> Filter <filter_items> Sort <item> Track ZoomTrack
<draw_option>:
Vector | Steps | Color
Push the Profile button to get information on thedynamic behavior of the program
General Commands Reference Guide T 277 ©1989-2019 Lauterbach GmbH
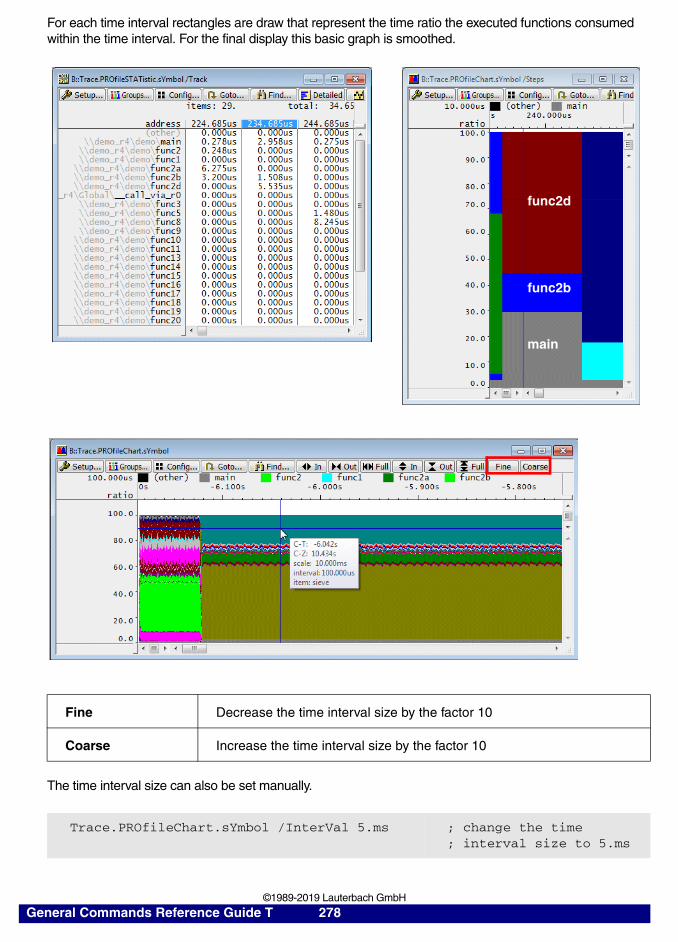
For each time interval rectangles are draw that represent the time ratio the executed functions consumed within the time interval. For the final display this basic graph is smoothed.
The time interval size can also be set manually.
Fine Decrease the time interval size by the factor 10
Coarse Increase the time interval size by the factor 10
Trace.PROfileChart.sYmbol /InterVal 5.ms ; change the time; interval size to 5.ms
func2d
func2b
main
General Commands Reference Guide T 278 ©1989-2019 Lauterbach GmbH
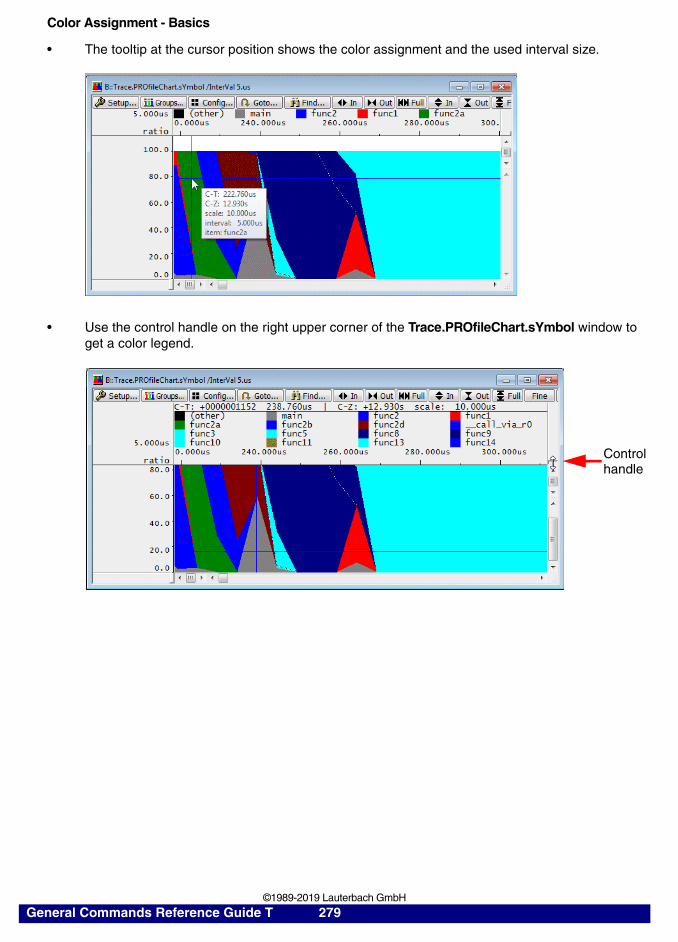
Color Assignment - Basics
• The tooltip at the cursor position shows the color assignment and the used interval size.
• Use the control handle on the right upper corner of the Trace.PROfileChart.sYmbol window to get a color legend.
Controlhandle
General Commands Reference Guide T 279 ©1989-2019 Lauterbach GmbH
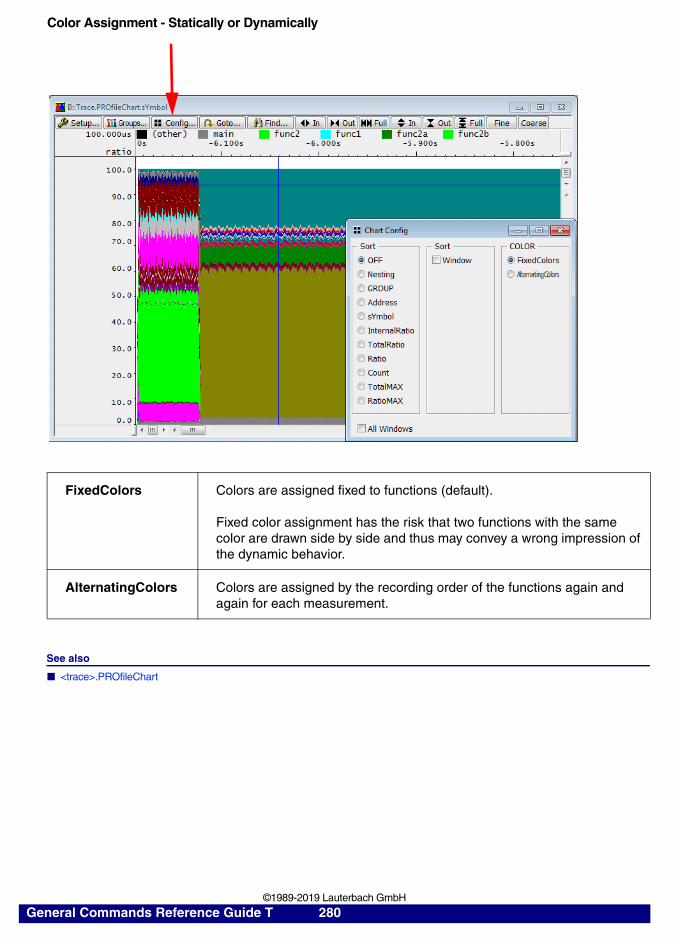
Color Assignment - Statically or Dynamically
See also
■ <trace>.PROfileChart
FixedColors Colors are assigned fixed to functions (default).
Fixed color assignment has the risk that two functions with the same color are drawn side by side and thus may convey a wrong impression of the dynamic behavior.
AlternatingColors Colors are assigned by the recording order of the functions again and again for each measurement.
General Commands Reference Guide T 280 ©1989-2019 Lauterbach GmbH
<trace>.PROfileChart.TASK Dynamic task behavior graphically (flat)
Analyzes the dynamic task behavior and displays the result as a color chart with fixed time intervals. This command requires OS-ware tracing.
Example to analyze CPU load:
Format: <trace>.PROfileChart.TASK [<string> | <range> | <value>] [/<option>]
<option>: FILE | FlowTrace | BusTraceRecScale | TimeScale | TimeZero | TimeREF<draw_options> InterVal <time> Filter <filter_items> Sort <item> Track ZoomTrack
<draw_option>:
Vector | Steps | Color
; group all tasks that contain an idle loop to the group "Idle"; all other tasks are members of the group "other"
; merge the result of all "Idle" group members and; use white as "Idle" group colorGROUP.CreateTASK "Idle" "Idle_Task" /Merge /WHITE
; merge the result of all "other" group membersGROUP.Merge "other"
; use green as "other" group colorGROUP.COLOR "other" GREEN
; display the CPU load graphicallyTrace.PROfileChart.TASK
General Commands Reference Guide T 281 ©1989-2019 Lauterbach GmbH
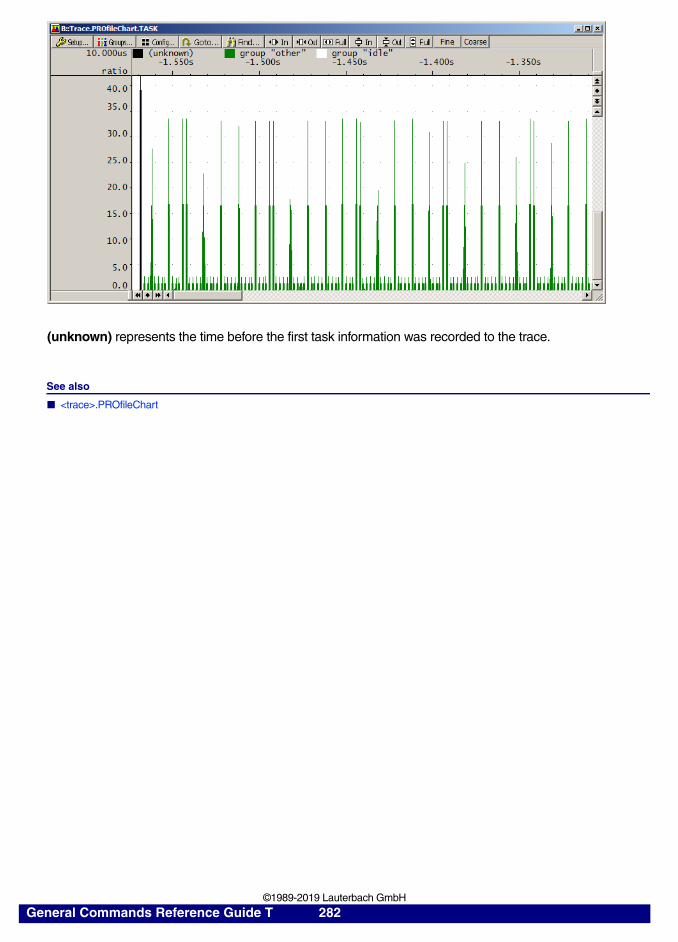
(unknown) represents the time before the first task information was recorded to the trace.
See also
■ <trace>.PROfileChart
General Commands Reference Guide T 282 ©1989-2019 Lauterbach GmbH
<trace>.PROfileSTATistic Statistical analysis in a table versus time
The command group <trace>.PROfileSTATistic shows the results of numerical interval analysis in tabular format.
See also
■ <trace>.state ■ Trace ■ <trace>.Chart ■ <trace>.PROfileChart ■ <trace>.STATistic
▲ ’Release Information’ in ’Release History’
Format: <trace>.PROfileSTATistic [<trace_area>] [/<option>]
<trace_area>: <trace_bookmark> | <record> | <record_range> | <time> | <time_range> [<time_scale>]
General Commands Reference Guide T 283 ©1989-2019 Lauterbach GmbH
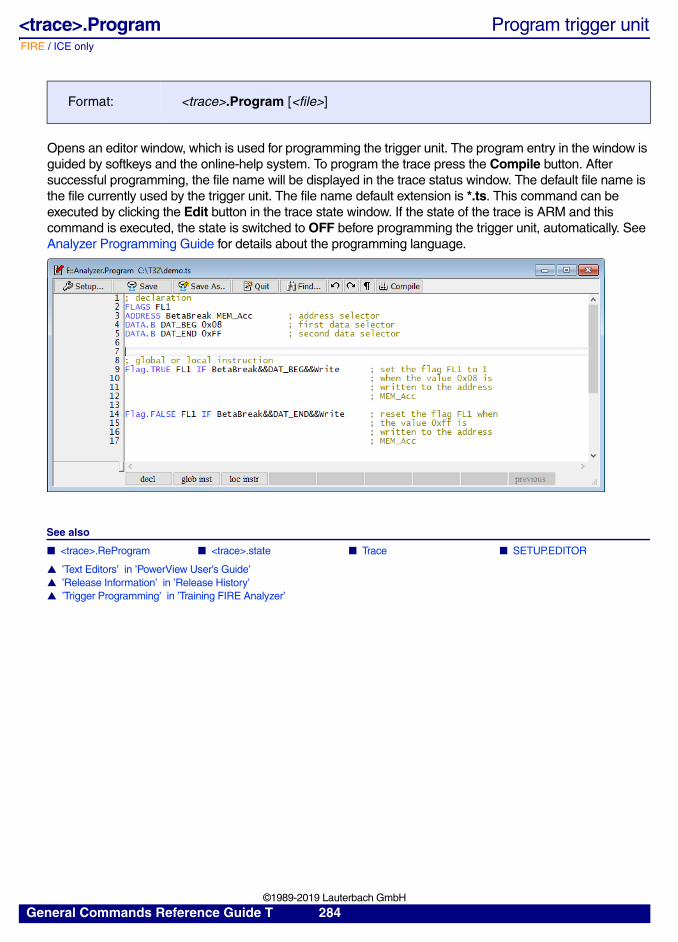
FIRE / ICE only
<trace>.Program Program trigger unit
Opens an editor window, which is used for programming the trigger unit. The program entry in the window is guided by softkeys and the online-help system. To program the trace press the Compile button. After successful programming, the file name will be displayed in the trace status window. The default file name is the file currently used by the trigger unit. The file name default extension is *.ts. This command can be executed by clicking the Edit button in the trace state window. If the state of the trace is ARM and this command is executed, the state is switched to OFF before programming the trigger unit, automatically. See Analyzer Programming Guide for details about the programming language.
See also
■ <trace>.ReProgram ■ <trace>.state ■ Trace ■ SETUP.EDITOR
▲ ’Text Editors’ in ’PowerView User’s Guide’▲ ’Release Information’ in ’Release History’▲ ’Trigger Programming’ in ’Training FIRE Analyzer’
Format: <trace>.Program [<file>]
General Commands Reference Guide T 284 ©1989-2019 Lauterbach GmbH
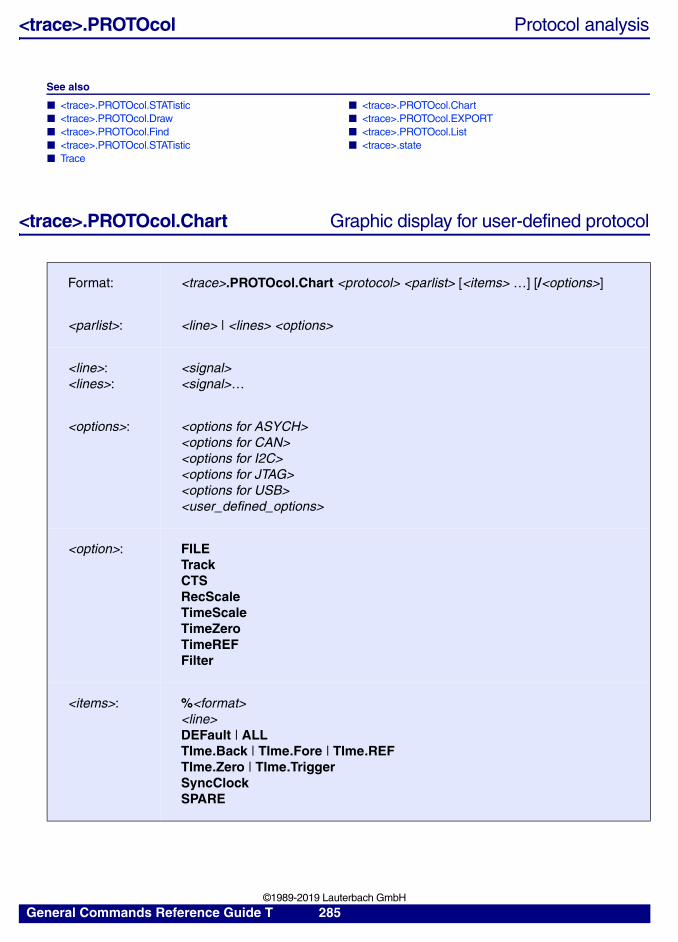
<trace>.PROTOcol Protocol analysis
See also
■ <trace>.PROTOcol.STATistic ■ <trace>.PROTOcol.Chart ■ <trace>.PROTOcol.Draw ■ <trace>.PROTOcol.EXPORT ■ <trace>.PROTOcol.Find ■ <trace>.PROTOcol.List ■ <trace>.PROTOcol.STATistic ■ <trace>.state ■ Trace
<trace>.PROTOcol.Chart Graphic display for user-defined protocol
Format: <trace>.PROTOcol.Chart <protocol> <parlist> [<items> …] [/<options>]
<parlist>: <line> | <lines> <options>
<line>:<lines>:
<signal><signal>…
<options>: <options for ASYCH><options for CAN><options for I2C><options for JTAG><options for USB><user_defined_options>
<option>: FILETrackCTSRecScaleTimeScaleTimeZeroTimeREFFilter
<items>: %<format><line>DEFault | ALLTIme.Back | TIme.Fore | TIme.REFTIme.Zero | TIme.TriggerSyncClockSPARE
General Commands Reference Guide T 285 ©1989-2019 Lauterbach GmbH
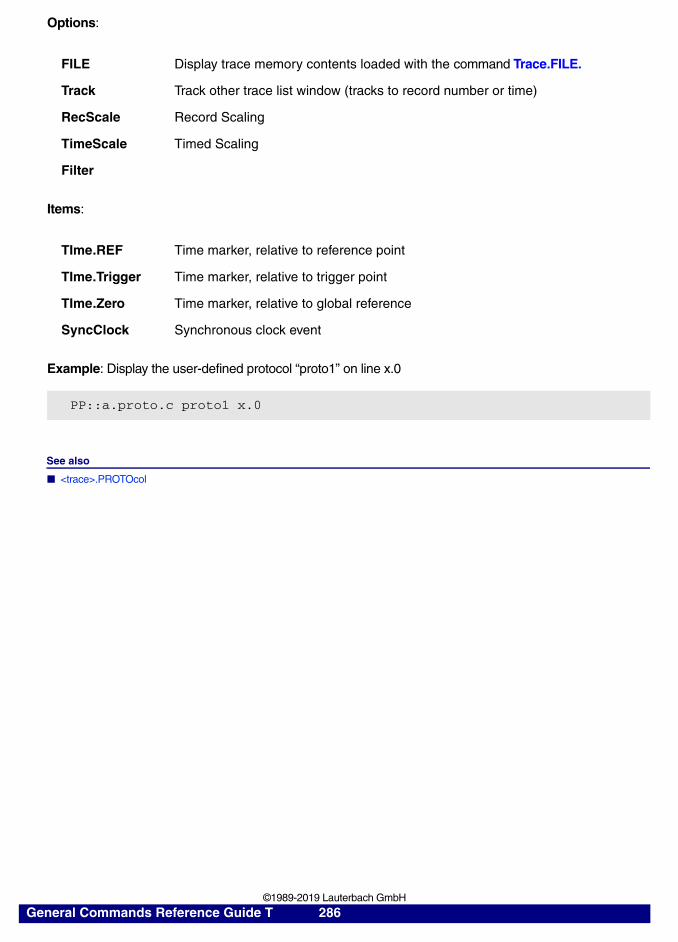
Options:
Items:
Example: Display the user-defined protocol “proto1” on line x.0
See also
■ <trace>.PROTOcol
FILE Display trace memory contents loaded with the command Trace.FILE.
Track Track other trace list window (tracks to record number or time)
RecScale Record Scaling
TimeScale Timed Scaling
Filter
TIme.REF Time marker, relative to reference point
TIme.Trigger Time marker, relative to trigger point
TIme.Zero Time marker, relative to global reference
SyncClock Synchronous clock event
PP::a.proto.c proto1 x.0
General Commands Reference Guide T 286 ©1989-2019 Lauterbach GmbH
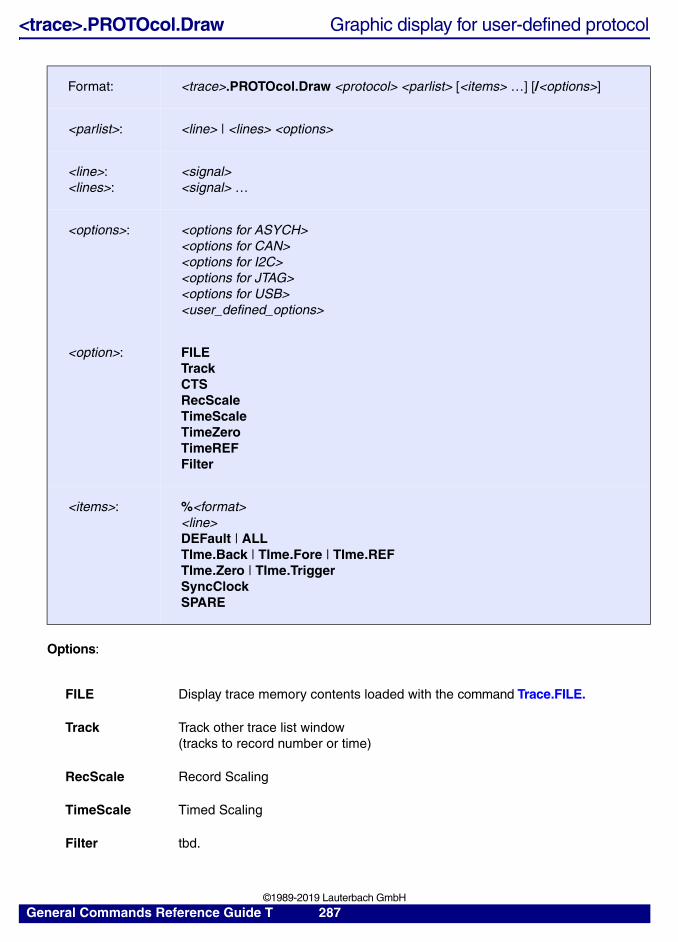
<trace>.PROTOcol.Draw Graphic display for user-defined protocol
Options:
Format: <trace>.PROTOcol.Draw <protocol> <parlist> [<items> …] [/<options>]
<parlist>: <line> | <lines> <options>
<line>:<lines>:
<signal><signal> …
<options>: <options for ASYCH><options for CAN><options for I2C><options for JTAG><options for USB><user_defined_options>
<option>: FILETrackCTSRecScaleTimeScaleTimeZeroTimeREFFilter
<items>: %<format><line>DEFault | ALLTIme.Back | TIme.Fore | TIme.REFTIme.Zero | TIme.TriggerSyncClockSPARE
FILE Display trace memory contents loaded with the command Trace.FILE.
Track Track other trace list window(tracks to record number or time)
RecScale Record Scaling
TimeScale Timed Scaling
Filter tbd.
General Commands Reference Guide T 287 ©1989-2019 Lauterbach GmbH
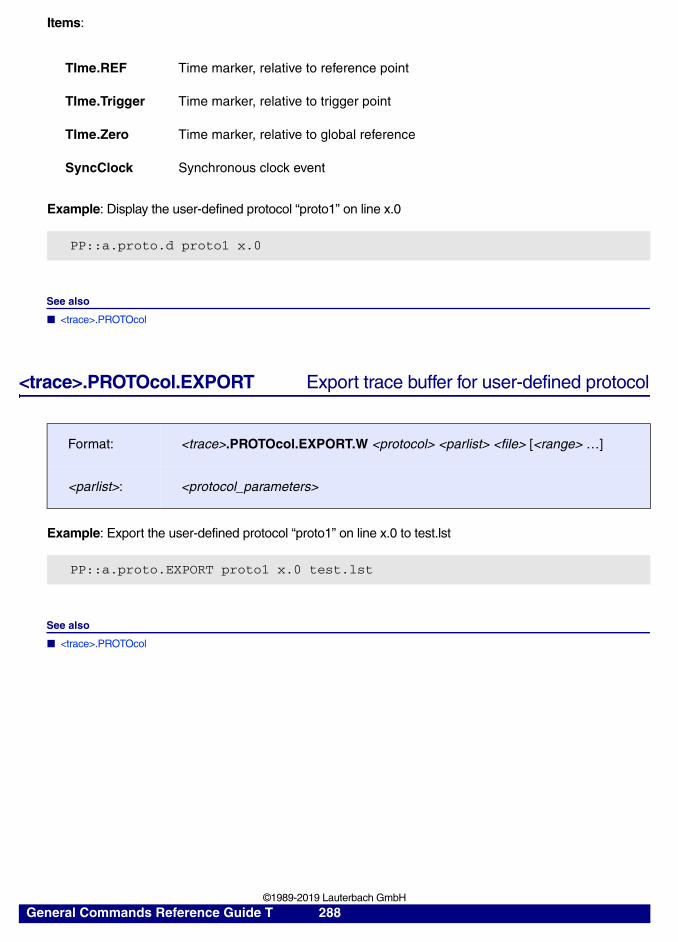
Items:
Example: Display the user-defined protocol “proto1” on line x.0
See also
■ <trace>.PROTOcol
<trace>.PROTOcol.EXPORT Export trace buffer for user-defined protocol
Example: Export the user-defined protocol “proto1” on line x.0 to test.lst
See also
■ <trace>.PROTOcol
TIme.REF Time marker, relative to reference point
TIme.Trigger Time marker, relative to trigger point
TIme.Zero Time marker, relative to global reference
SyncClock Synchronous clock event
PP::a.proto.d proto1 x.0
Format: <trace>.PROTOcol.EXPORT.W <protocol> <parlist> <file> [<range> …]
<parlist>: <protocol_parameters>
PP::a.proto.EXPORT proto1 x.0 test.lst
General Commands Reference Guide T 288 ©1989-2019 Lauterbach GmbH
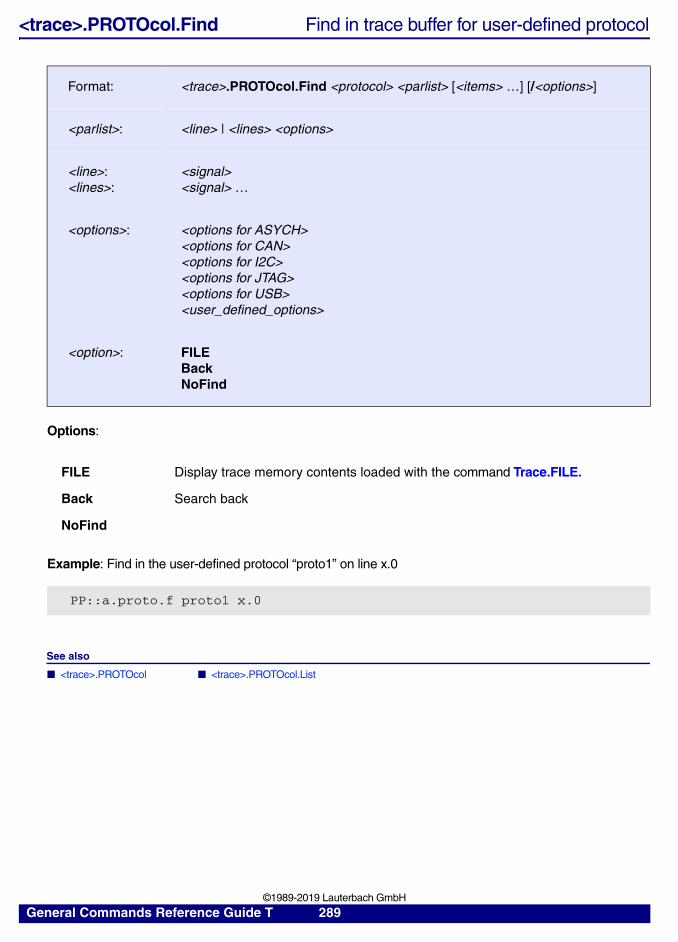
<trace>.PROTOcol.Find Find in trace buffer for user-defined protocol
Options:
Example: Find in the user-defined protocol “proto1” on line x.0
See also
■ <trace>.PROTOcol ■ <trace>.PROTOcol.List
Format: <trace>.PROTOcol.Find <protocol> <parlist> [<items> …] [/<options>]
<parlist>: <line> | <lines> <options>
<line>:<lines>:
<signal><signal> …
<options>: <options for ASYCH><options for CAN><options for I2C><options for JTAG><options for USB><user_defined_options>
<option>: FILEBackNoFind
FILE Display trace memory contents loaded with the command Trace.FILE.
Back Search back
NoFind
PP::a.proto.f proto1 x.0
General Commands Reference Guide T 289 ©1989-2019 Lauterbach GmbH
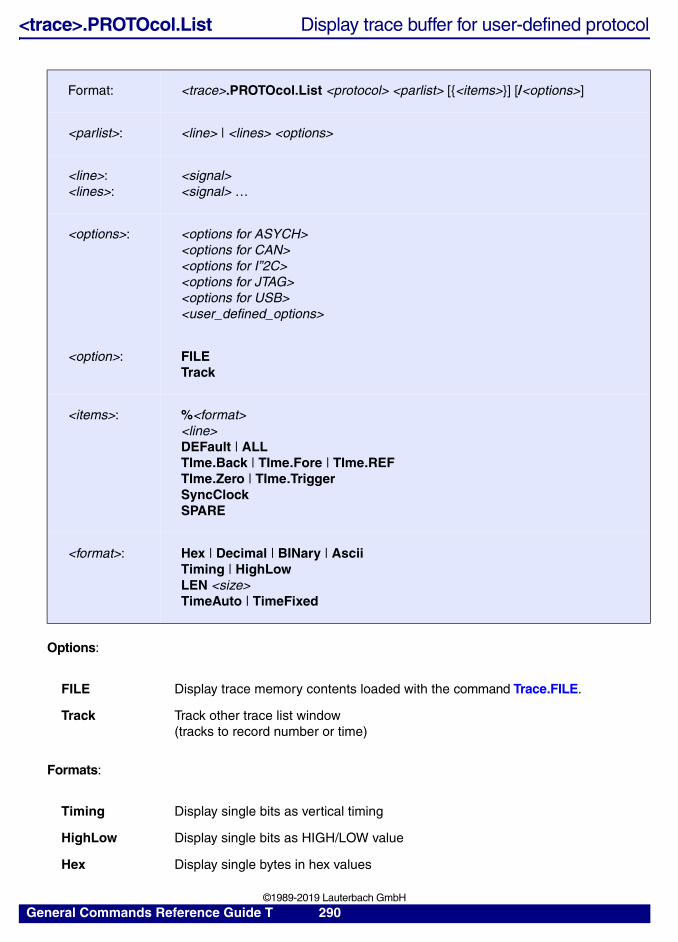
<trace>.PROTOcol.List Display trace buffer for user-defined protocol
Options:
Formats:
Format: <trace>.PROTOcol.List <protocol> <parlist> [{<items>}] [/<options>]
<parlist>: <line> | <lines> <options>
<line>:<lines>:
<signal><signal> …
<options>: <options for ASYCH><options for CAN><options for I”2C><options for JTAG><options for USB><user_defined_options>
<option>: FILETrack
<items>: %<format><line>DEFault | ALLTIme.Back | TIme.Fore | TIme.REFTIme.Zero | TIme.TriggerSyncClockSPARE
<format>: Hex | Decimal | BINary | AsciiTiming | HighLowLEN <size>TimeAuto | TimeFixed
FILE Display trace memory contents loaded with the command Trace.FILE.
Track Track other trace list window(tracks to record number or time)
Timing Display single bits as vertical timing
HighLow Display single bits as HIGH/LOW value
Hex Display single bytes in hex values
General Commands Reference Guide T 290 ©1989-2019 Lauterbach GmbH
Items:
Example: Displays the user-defined protocol “proto1” on line x.0
Decimal Display single bytes in decimal values
BINary Display single bytes in binary values
Ascii Display single bytes as ascii characters
LEN <size> Specify the width of non numeric fields (e.g. symbols)
TimeAuto The unit of time is selected automatically.
TimeFixed The displayed unit of time is fixed.
DEFault Default selections (see list below)
ALL Select all recorded data (superset of DEFault)
TIme Time marker (default Time.Fore)
TIme.Back Time marker, relative time to previous record
TIme.Fore Time marker, relative time to next record
TIme.REF Time marker, relative to reference point
TIme.Trigger Time marker, relative to trigger point
TIme.Zero Time marker, relative to global reference
SyncClock Synchronous clock event
SPARE Displays an empty block
PP::a.proto.l proto1 x.0
General Commands Reference Guide T 291 ©1989-2019 Lauterbach GmbH
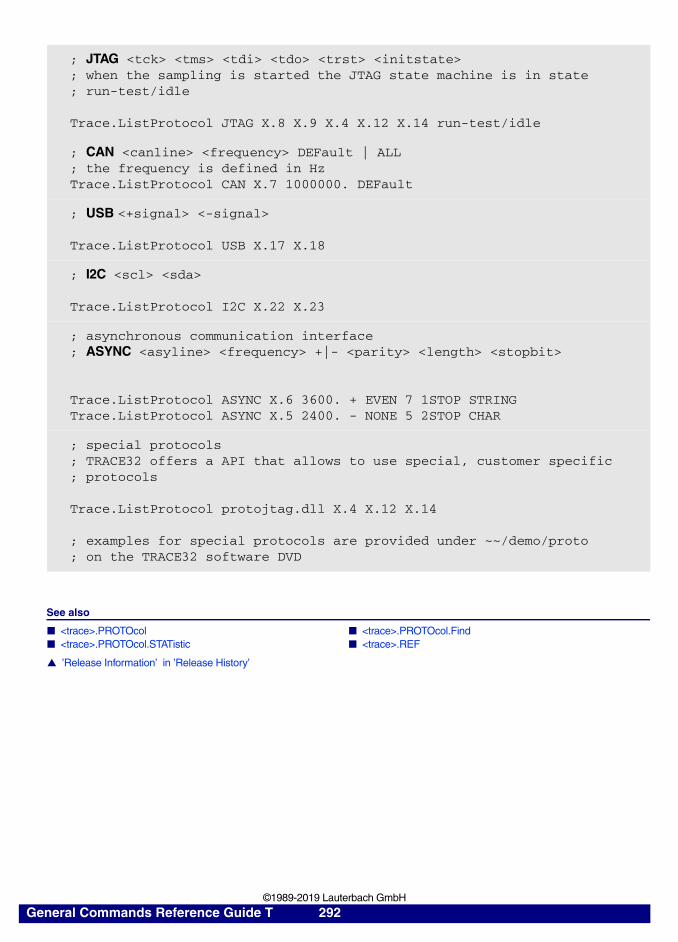
See also
■ <trace>.PROTOcol ■ <trace>.PROTOcol.Find ■ <trace>.PROTOcol.STATistic ■ <trace>.REF
▲ ’Release Information’ in ’Release History’
; JTAG <tck> <tms> <tdi> <tdo> <trst> <initstate>; when the sampling is started the JTAG state machine is in state; run-test/idle
Trace.ListProtocol JTAG X.8 X.9 X.4 X.12 X.14 run-test/idle
; CAN <canline> <frequency> DEFault | ALL; the frequency is defined in HzTrace.ListProtocol CAN X.7 1000000. DEFault
; USB <+signal> <-signal>
Trace.ListProtocol USB X.17 X.18
; I2C <scl> <sda>
Trace.ListProtocol I2C X.22 X.23
; asynchronous communication interface; ASYNC <asyline> <frequency> +|- <parity> <length> <stopbit>
Trace.ListProtocol ASYNC X.6 3600. + EVEN 7 1STOP STRINGTrace.ListProtocol ASYNC X.5 2400. - NONE 5 2STOP CHAR
; special protocols; TRACE32 offers a API that allows to use special, customer specific; protocols
Trace.ListProtocol protojtag.dll X.4 X.12 X.14
; examples for special protocols are provided under ~~/demo/proto; on the TRACE32 software DVD
General Commands Reference Guide T 292 ©1989-2019 Lauterbach GmbH
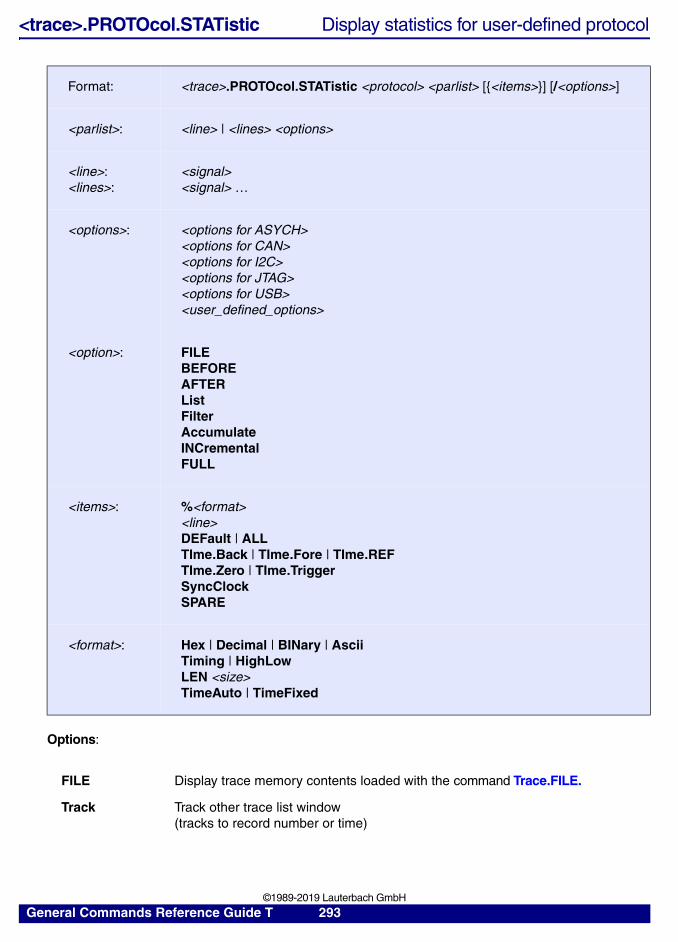
<trace>.PROTOcol.STATistic Display statistics for user-defined protocol
Options:
Format: <trace>.PROTOcol.STATistic <protocol> <parlist> [{<items>}] [/<options>]
<parlist>: <line> | <lines> <options>
<line>:<lines>:
<signal><signal> …
<options>: <options for ASYCH><options for CAN><options for I2C><options for JTAG><options for USB><user_defined_options>
<option>: FILEBEFOREAFTERListFilterAccumulateINCrementalFULL
<items>: %<format><line>DEFault | ALLTIme.Back | TIme.Fore | TIme.REFTIme.Zero | TIme.TriggerSyncClockSPARE
<format>: Hex | Decimal | BINary | AsciiTiming | HighLowLEN <size>TimeAuto | TimeFixed
FILE Display trace memory contents loaded with the command Trace.FILE.
Track Track other trace list window(tracks to record number or time)
General Commands Reference Guide T 293 ©1989-2019 Lauterbach GmbH
Example: Display statistics in the user-defined protocol “proto1” on line x.0
See also
■ <trace>.PROTOcol ■ <trace>.PROTOcol.List
PP::a.proto.stat proto1 x.0
General Commands Reference Guide T 294 ©1989-2019 Lauterbach GmbH
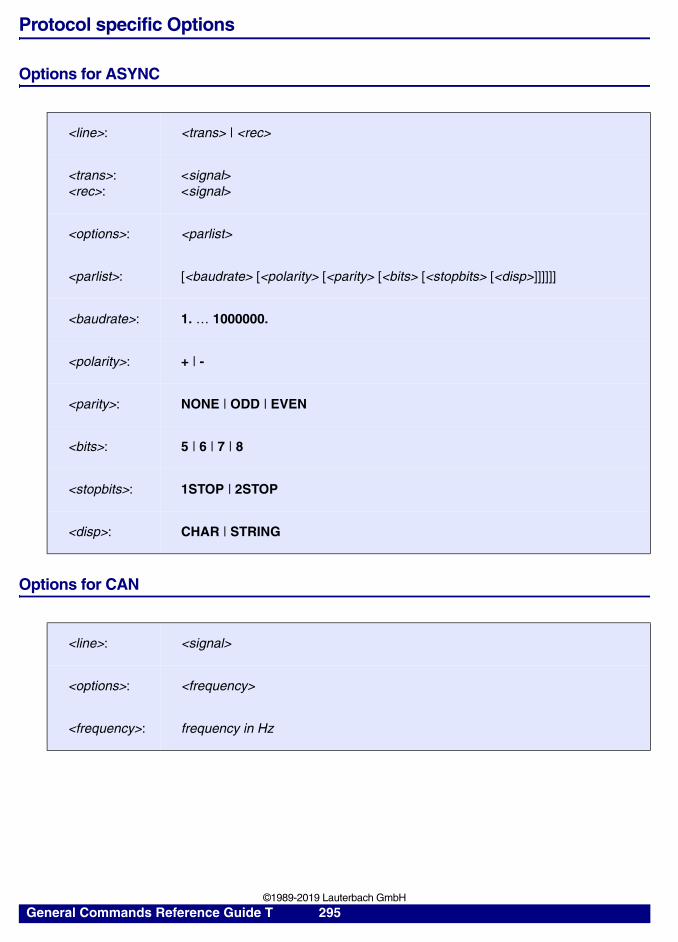
Protocol specific Options
Options for ASYNC
Options for CAN
<line>: <trans> | <rec>
<trans>:<rec>:
<signal><signal>
<options>: <parlist>
<parlist>: [<baudrate> [<polarity> [<parity> [<bits> [<stopbits> [<disp>]]]]]]
<baudrate>: 1. … 1000000.
<polarity>: + | -
<parity>: NONE | ODD | EVEN
<bits>: 5 | 6 | 7 | 8
<stopbits>: 1STOP | 2STOP
<disp>: CHAR | STRING
<line>: <signal>
<options>: <frequency>
<frequency>: frequency in Hz
General Commands Reference Guide T 295 ©1989-2019 Lauterbach GmbH
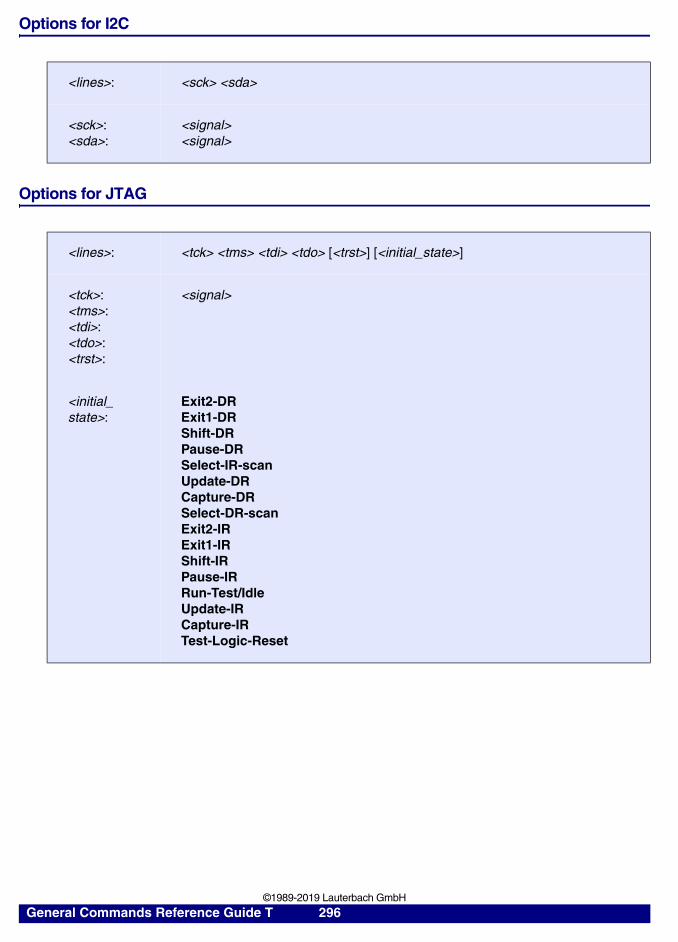
Options for I2C
Options for JTAG
<lines>: <sck> <sda>
<sck>:<sda>:
<signal><signal>
<lines>: <tck> <tms> <tdi> <tdo> [<trst>] [<initial_state>]
<tck>:<tms>:<tdi>:<tdo>:<trst>:
<signal>
<initial_state>:
Exit2-DRExit1-DRShift-DRPause-DRSelect-IR-scanUpdate-DRCapture-DRSelect-DR-scanExit2-IRExit1-IRShift-IRPause-IRRun-Test/IdleUpdate-IRCapture-IRTest-Logic-Reset
General Commands Reference Guide T 296 ©1989-2019 Lauterbach GmbH
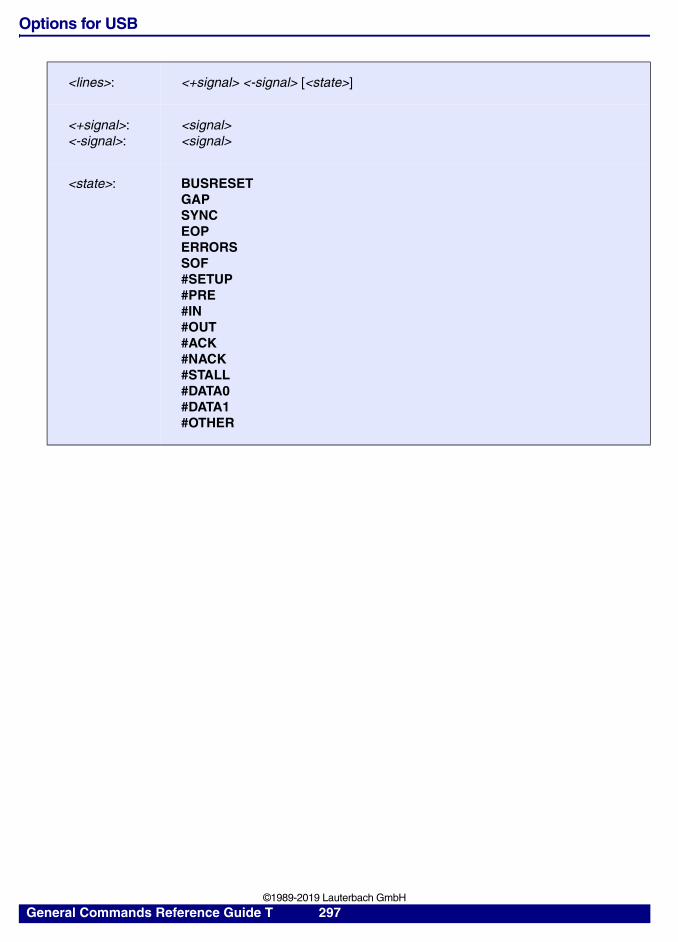
Options for USB
<lines>: <+signal> <-signal> [<state>]
<+signal>:<-signal>:
<signal><signal>
<state>: BUSRESETGAPSYNCEOPERRORSSOF#SETUP#PRE#IN#OUT#ACK#NACK#STALL#DATA0#DATA1#OTHER
General Commands Reference Guide T 297 ©1989-2019 Lauterbach GmbH
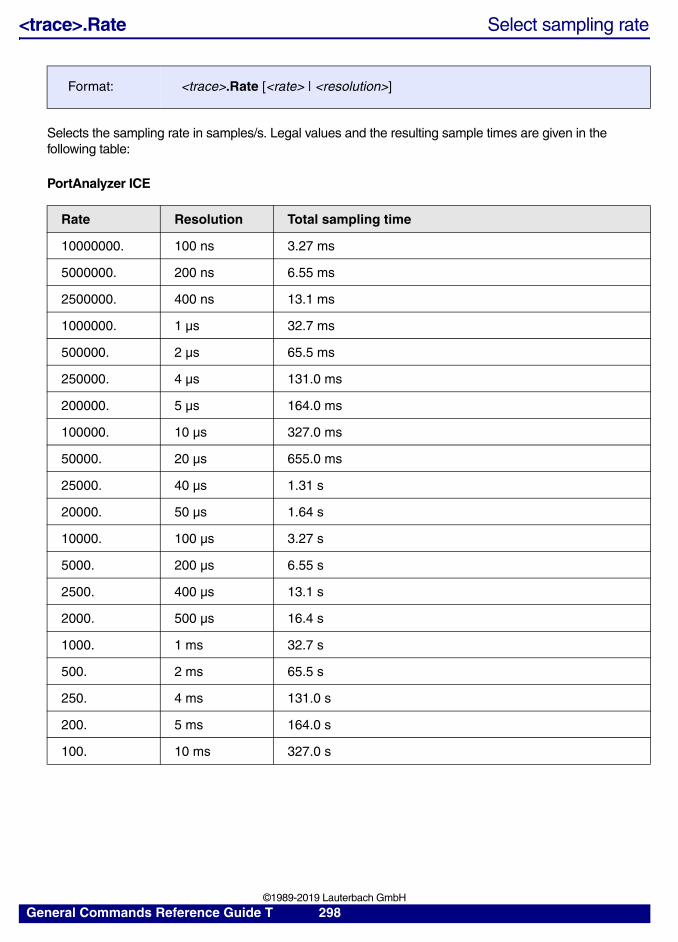
<trace>.Rate Select sampling rate
Selects the sampling rate in samples/s. Legal values and the resulting sample times are given in the following table:
PortAnalyzer ICE
Format: <trace>.Rate [<rate> | <resolution>]
Rate Resolution Total sampling time
10000000. 100 ns 3.27 ms
5000000. 200 ns 6.55 ms
2500000. 400 ns 13.1 ms
1000000. 1 µs 32.7 ms
500000. 2 µs 65.5 ms
250000. 4 µs 131.0 ms
200000. 5 µs 164.0 ms
100000. 10 µs 327.0 ms
50000. 20 µs 655.0 ms
25000. 40 µs 1.31 s
20000. 50 µs 1.64 s
10000. 100 µs 3.27 s
5000. 200 µs 6.55 s
2500. 400 µs 13.1 s
2000. 500 µs 16.4 s
1000. 1 ms 32.7 s
500. 2 ms 65.5 s
250. 4 ms 131.0 s
200. 5 ms 164.0 s
100. 10 ms 327.0 s
General Commands Reference Guide T 298 ©1989-2019 Lauterbach GmbH
With a mouse click to the corresponding area in the port analyzer state window that command can be executed, too.
<trace>.REF Set reference point for time measurement
Sets the reference point for time measurements using the TIme.REF column of the Trace.List window. The default reference point is always the last record in trace memory. The reference point can also be set via context menu entry Set Ref in Trace.List, Trace.Chart, Trace.Timing etc. windows.
Examples:
See also
■ <trace>.GOTO ■ <trace>.PROTOcol.List ■ <trace>.state ■ <trace>.Timing ■ <trace>.View ■ Trace ❏ Analyzer.REF()
Port.Rate 1000000. ; set to 1 MHz sample rate
Port.Rate 1.us ; same operation, 1 MHz sample rate
Format: <trace>.REF [<time> | <record> | "<trace_bookmark>"]
<option>: FILE
<time> Sets the reference point to the global ZERO point. If the time for each trace event is calculated based on timestamps generated by the processor, the global ZERO point is at the start of the trace recording currently stored in the trace buffer. If the time for each trace event is based on timestamps generated by the trace module, the global ZERO point is set to the start of the first debug session after the start of TRACE32 PowerView.
<record> Sets the reference point to the time index of the specified record number.
<trace_bookmark> Sets the reference point to the time index of the specified bookmark location. You can create trace bookmarks with the <trace>.BookMark command.
Trace.REF +2000. ; set reference to record +2000
Trace.REF 100us ; set ref. point to absolute time
Trace.REF "MyRef" ; set ref. point to bookmark "MyRef"
General Commands Reference Guide T 299 ©1989-2019 Lauterbach GmbH
<trace>.ReProgram Program trigger unit
Programs the trigger unit of the trace with an existing program. The program should be error free, when using this command. To write an error free program, use the command <trace>.Program.
See also
■ <trace>.Program ■ <trace>.state ■ Trace
▲ ’Release Information’ in ’Release History’▲ ’Trigger Programming’ in ’Training FIRE Analyzer’
<trace>.RESet Reset command
Resets the trace unit to its default settings.
See also
■ <trace>.state ■ CIProbe ■ Trace
▲ ’Emulator Functions’ in ’FIRE User’s Guide’
Format: <trace>.ReProgram [<file>]
Format: <trace>.RESet
General Commands Reference Guide T 300 ©1989-2019 Lauterbach GmbH
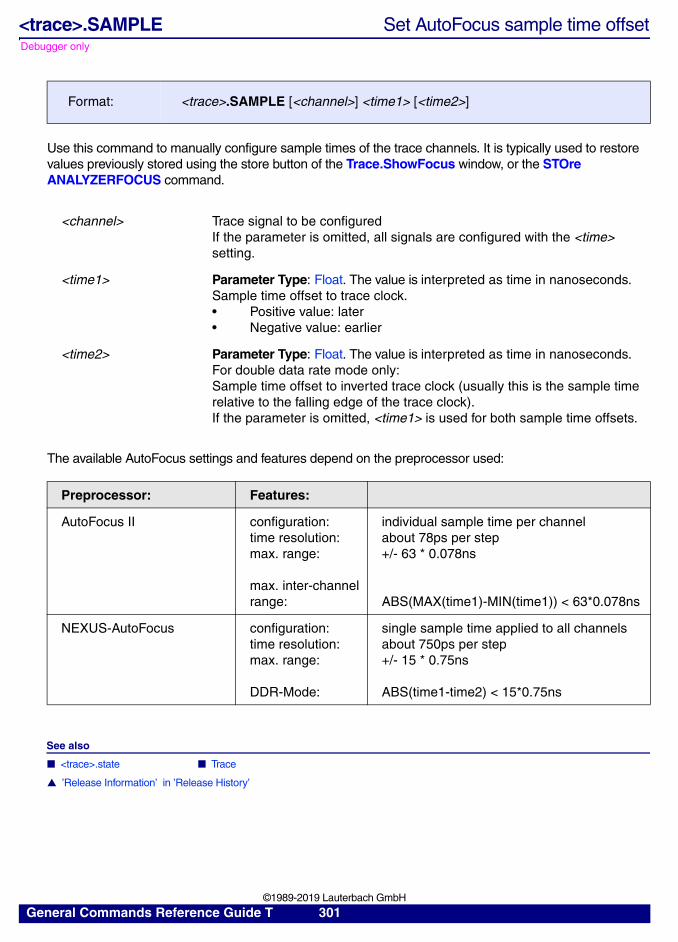
Debugger only
<trace>.SAMPLE Set AutoFocus sample time offset
Use this command to manually configure sample times of the trace channels. It is typically used to restore values previously stored using the store button of the Trace.ShowFocus window, or the STOre ANALYZERFOCUS command.
The available AutoFocus settings and features depend on the preprocessor used:
See also
■ <trace>.state ■ Trace
▲ ’Release Information’ in ’Release History’
Format: <trace>.SAMPLE [<channel>] <time1> [<time2>]
<channel> Trace signal to be configuredIf the parameter is omitted, all signals are configured with the <time> setting.
<time1> Parameter Type: Float. The value is interpreted as time in nanoseconds.Sample time offset to trace clock.• Positive value: later• Negative value: earlier
<time2> Parameter Type: Float. The value is interpreted as time in nanoseconds.For double data rate mode only:Sample time offset to inverted trace clock (usually this is the sample time relative to the falling edge of the trace clock).If the parameter is omitted, <time1> is used for both sample time offsets.
Preprocessor: Features:
AutoFocus II configuration:time resolution:max. range:
max. inter-channel range:
individual sample time per channelabout 78ps per step+/- 63 * 0.078ns
ABS(MAX(time1)-MIN(time1)) < 63*0.078ns
NEXUS-AutoFocus configuration:time resolution:max. range:
DDR-Mode:
single sample time applied to all channelsabout 750ps per step+/- 15 * 0.75ns
ABS(time1-time2) < 15*0.75ns
General Commands Reference Guide T 301 ©1989-2019 Lauterbach GmbH
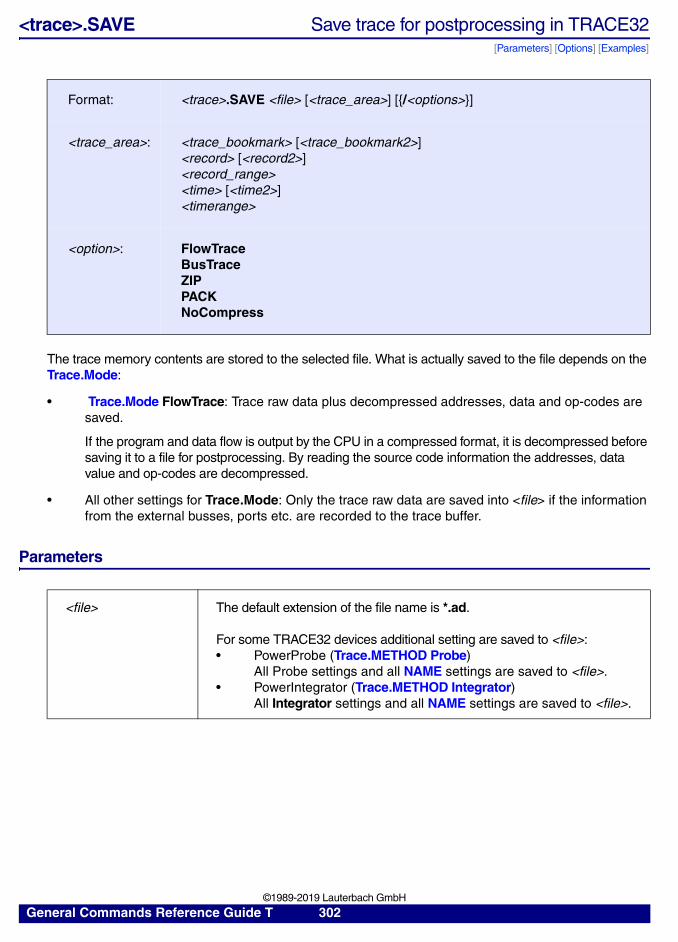
<trace>.SAVE Save trace for postprocessing in TRACE32[Parameters] [Options] [Examples]
The trace memory contents are stored to the selected file. What is actually saved to the file depends on the Trace.Mode:
• Trace.Mode FlowTrace: Trace raw data plus decompressed addresses, data and op-codes are saved.
If the program and data flow is output by the CPU in a compressed format, it is decompressed before saving it to a file for postprocessing. By reading the source code information the addresses, data value and op-codes are decompressed.
• All other settings for Trace.Mode: Only the trace raw data are saved into <file> if the information from the external busses, ports etc. are recorded to the trace buffer.
Parameters
Format: <trace>.SAVE <file> [<trace_area>] [{/<options>}]
<trace_area>: <trace_bookmark> [<trace_bookmark2>]<record> [<record2>]<record_range><time> [<time2>]<timerange>
<option>: FlowTraceBusTraceZIPPACKNoCompress
<file> The default extension of the file name is *.ad.
For some TRACE32 devices additional setting are saved to <file>:• PowerProbe (Trace.METHOD Probe)
All Probe settings and all NAME settings are saved to <file>. • PowerIntegrator (Trace.METHOD Integrator)
All Integrator settings and all NAME settings are saved to <file>.
General Commands Reference Guide T 302 ©1989-2019 Lauterbach GmbH
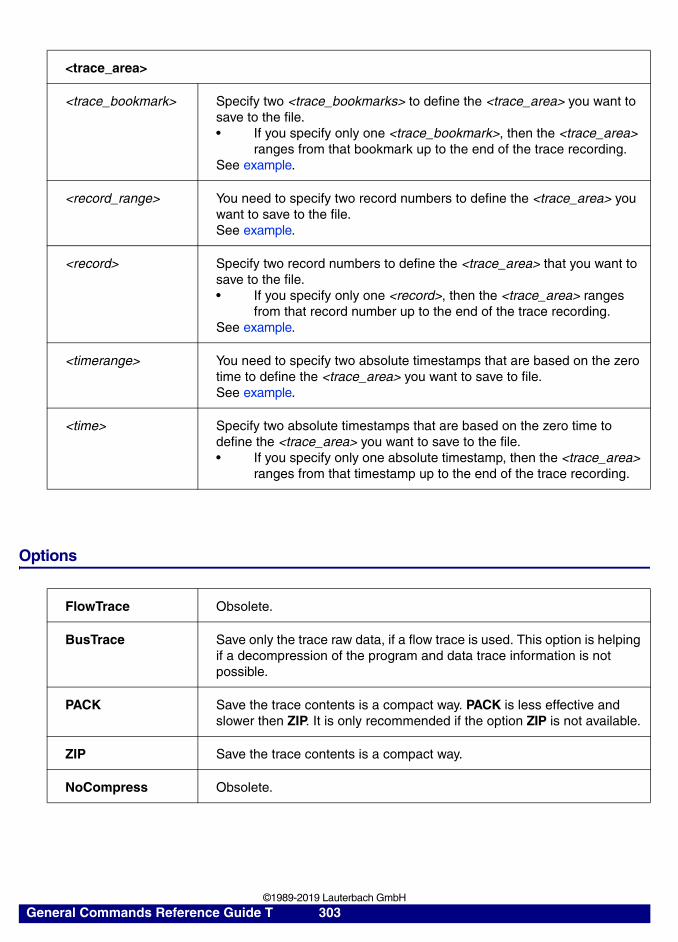
Options
<trace_area>
<trace_bookmark> Specify two <trace_bookmarks> to define the <trace_area> you want to save to the file. • If you specify only one <trace_bookmark>, then the <trace_area>
ranges from that bookmark up to the end of the trace recording.See example.
<record_range> You need to specify two record numbers to define the <trace_area> you want to save to the file. See example.
<record> Specify two record numbers to define the <trace_area> that you want to save to the file. • If you specify only one <record>, then the <trace_area> ranges
from that record number up to the end of the trace recording.See example.
<timerange> You need to specify two absolute timestamps that are based on the zero time to define the <trace_area> you want to save to file. See example.
<time> Specify two absolute timestamps that are based on the zero time to define the <trace_area> you want to save to the file.• If you specify only one absolute timestamp, then the <trace_area>
ranges from that timestamp up to the end of the trace recording.
FlowTrace Obsolete.
BusTrace Save only the trace raw data, if a flow trace is used. This option is helping if a decompression of the program and data trace information is not possible.
PACK Save the trace contents is a compact way. PACK is less effective and slower then ZIP. It is only recommended if the option ZIP is not available.
ZIP Save the trace contents is a compact way.
NoCompress Obsolete.
General Commands Reference Guide T 303 ©1989-2019 Lauterbach GmbH
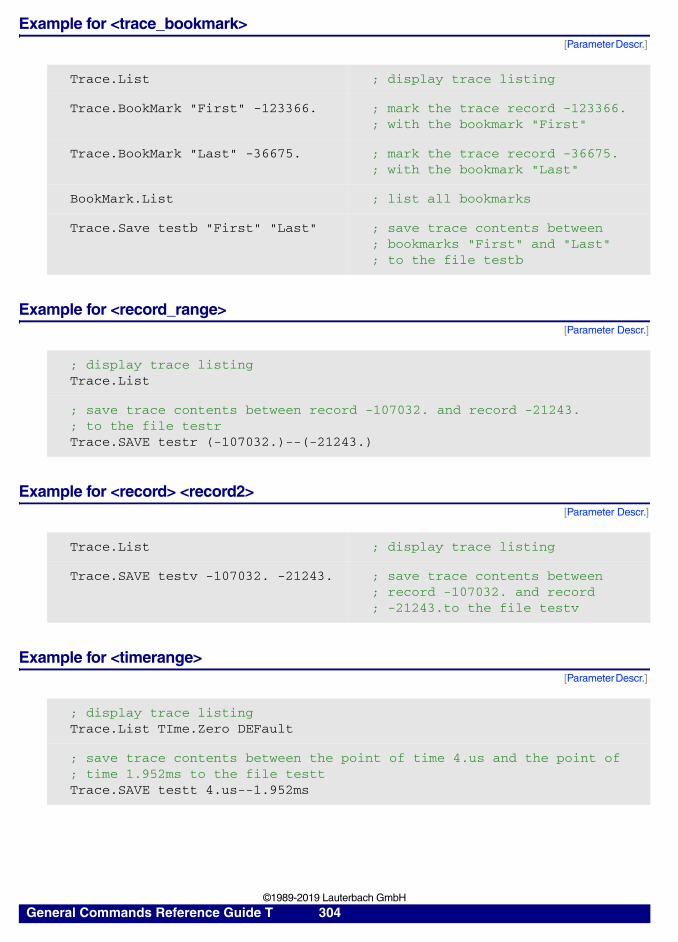
Example for <trace_bookmark>[Parameter Descr.]
Example for <record_range>[Parameter Descr.]
Example for <record> <record2>[Parameter Descr.]
Example for <timerange>[Parameter Descr.]
Trace.List ; display trace listing
Trace.BookMark "First" -123366. ; mark the trace record -123366.; with the bookmark "First"
Trace.BookMark "Last" -36675. ; mark the trace record -36675.; with the bookmark "Last"
BookMark.List ; list all bookmarks
Trace.Save testb "First" "Last" ; save trace contents between; bookmarks "First" and "Last"; to the file testb
; display trace listingTrace.List
; save trace contents between record -107032. and record -21243.; to the file testrTrace.SAVE testr (-107032.)--(-21243.)
Trace.List ; display trace listing
Trace.SAVE testv -107032. -21243. ; save trace contents between; record -107032. and record; -21243.to the file testv
; display trace listingTrace.List TIme.Zero DEFault
; save trace contents between the point of time 4.us and the point of ; time 1.952ms to the file testtTrace.SAVE testt 4.us--1.952ms
General Commands Reference Guide T 304 ©1989-2019 Lauterbach GmbH
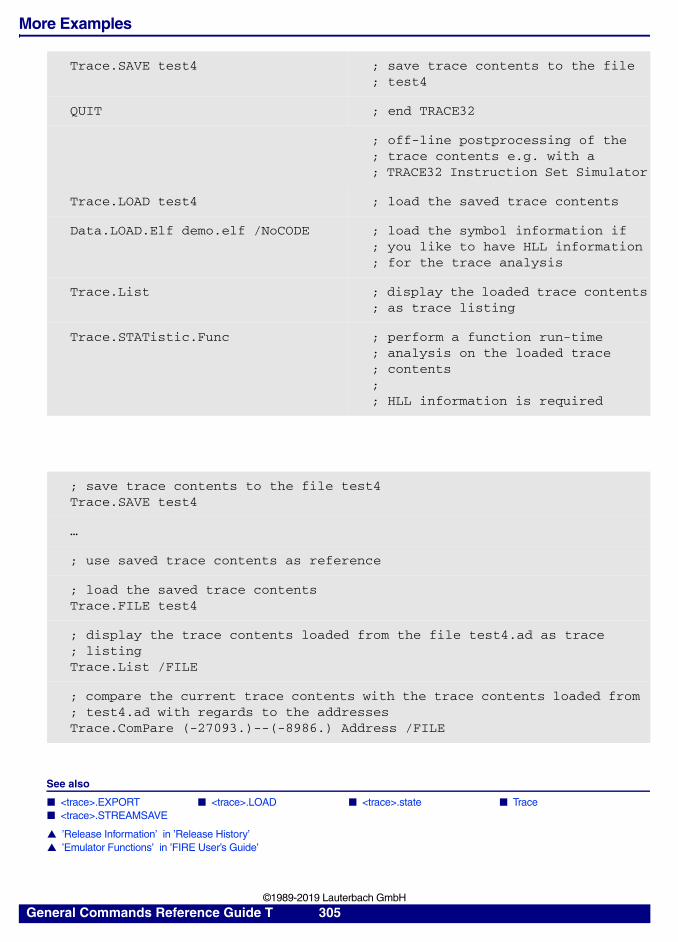
More Examples
See also
■ <trace>.EXPORT ■ <trace>.LOAD ■ <trace>.state ■ Trace ■ <trace>.STREAMSAVE
▲ ’Release Information’ in ’Release History’▲ ’Emulator Functions’ in ’FIRE User’s Guide’
Trace.SAVE test4 ; save trace contents to the file; test4
QUIT ; end TRACE32
; off-line postprocessing of the ; trace contents e.g. with a; TRACE32 Instruction Set Simulator
Trace.LOAD test4 ; load the saved trace contents
Data.LOAD.Elf demo.elf /NoCODE ; load the symbol information if; you like to have HLL information; for the trace analysis
Trace.List ; display the loaded trace contents; as trace listing
Trace.STATistic.Func ; perform a function run-time; analysis on the loaded trace ; contents;; HLL information is required
; save trace contents to the file test4Trace.SAVE test4
…
; use saved trace contents as reference
; load the saved trace contentsTrace.FILE test4
; display the trace contents loaded from the file test4.ad as trace; listingTrace.List /FILE
; compare the current trace contents with the trace contents loaded from ; test4.ad with regards to the addressesTrace.ComPare (-27093.)--(-8986.) Address /FILE
General Commands Reference Guide T 305 ©1989-2019 Lauterbach GmbH
<trace>.Select Select trigger/counter line
Selects a port line for the frequency counter and the glitch detector. If in the "TSelect" area of the state window "Port" is active, this port will be used to trigger the port analyzer.
For valid channel names refer to the:
• Processor Architecture Manuals
• Target Guides FIRE
• Target Guides ICE
Examples:
<trace>.SelfArm Automatic restart of trace recording
Trace.SelfArm ON automatically restarts the trace recording. There are mainly two use cases for this command.
Snapshot without stopping the program execution
If stopping the program execution it not advisable, but you are interested in the target state at a specific point of the program execution, proceed as follows:
1. Display the information of interest on the screen.
Please make sure to display only information that can be updated while the program execution is running.
2. Use a trigger to specify your point of interest.
3. Activate the self-arm mode.
Whenever the trace recording is stopped by the trigger, all information displayed by TRACE32 is updated before the trace recording is automatically restarted.
Format: Port.Select [<channel>]
Port.Select Port.20Port.Select Port.RXD
Format: <trace>.SelfArm [ON | OFF]
General Commands Reference Guide T 306 ©1989-2019 Lauterbach GmbH
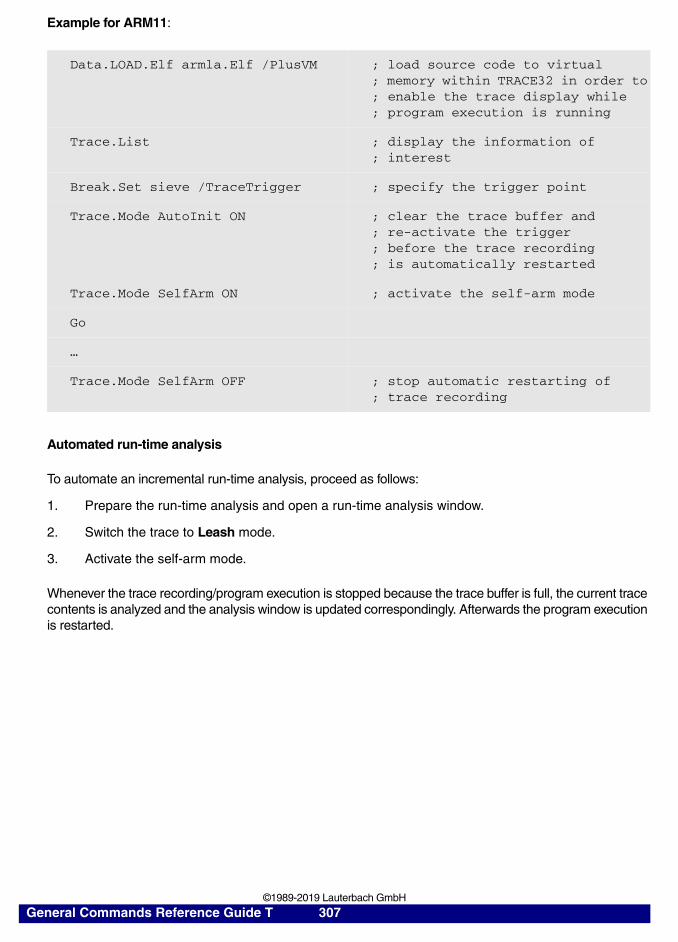
Example for ARM11:
Automated run-time analysis
To automate an incremental run-time analysis, proceed as follows:
1. Prepare the run-time analysis and open a run-time analysis window.
2. Switch the trace to Leash mode.
3. Activate the self-arm mode.
Whenever the trace recording/program execution is stopped because the trace buffer is full, the current trace contents is analyzed and the analysis window is updated correspondingly. Afterwards the program execution is restarted.
Data.LOAD.Elf armla.Elf /PlusVM ; load source code to virtual; memory within TRACE32 in order to; enable the trace display while; program execution is running
Trace.List ; display the information of; interest
Break.Set sieve /TraceTrigger ; specify the trigger point
Trace.Mode AutoInit ON ; clear the trace buffer and; re-activate the trigger; before the trace recording ; is automatically restarted
Trace.Mode SelfArm ON ; activate the self-arm mode
Go
…
Trace.Mode SelfArm OFF ; stop automatic restarting of ; trace recording
General Commands Reference Guide T 307 ©1989-2019 Lauterbach GmbH
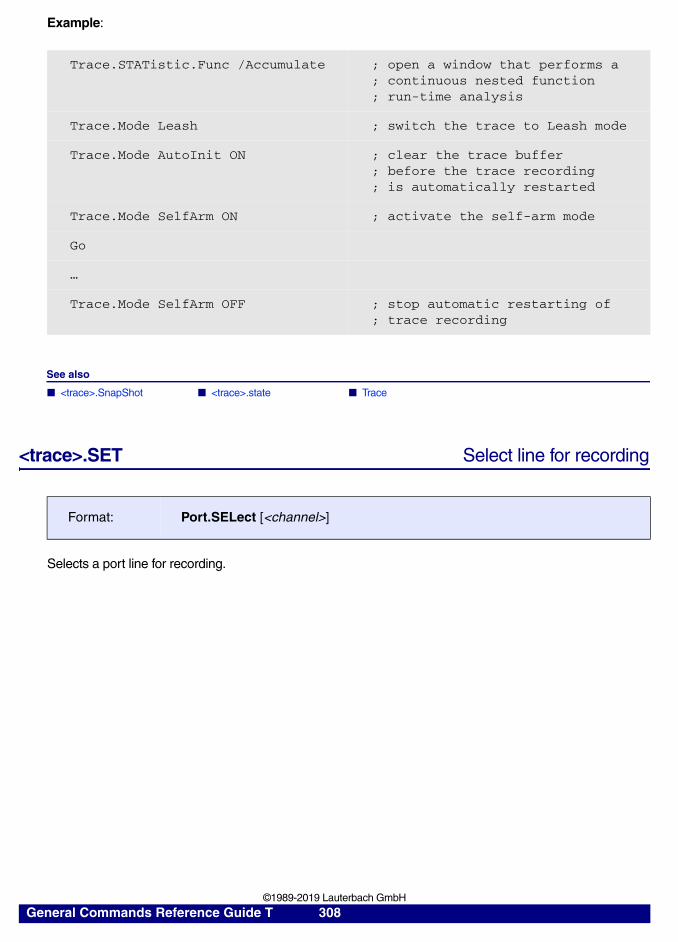
Example:
See also
■ <trace>.SnapShot ■ <trace>.state ■ Trace
<trace>.SET Select line for recording
Selects a port line for recording.
Trace.STATistic.Func /Accumulate ; open a window that performs a; continuous nested function ; run-time analysis
Trace.Mode Leash ; switch the trace to Leash mode
Trace.Mode AutoInit ON ; clear the trace buffer; before the trace recording ; is automatically restarted
Trace.Mode SelfArm ON ; activate the self-arm mode
Go
…
Trace.Mode SelfArm OFF ; stop automatic restarting of ; trace recording
Format: Port.SELect [<channel>]
General Commands Reference Guide T 308 ©1989-2019 Lauterbach GmbH
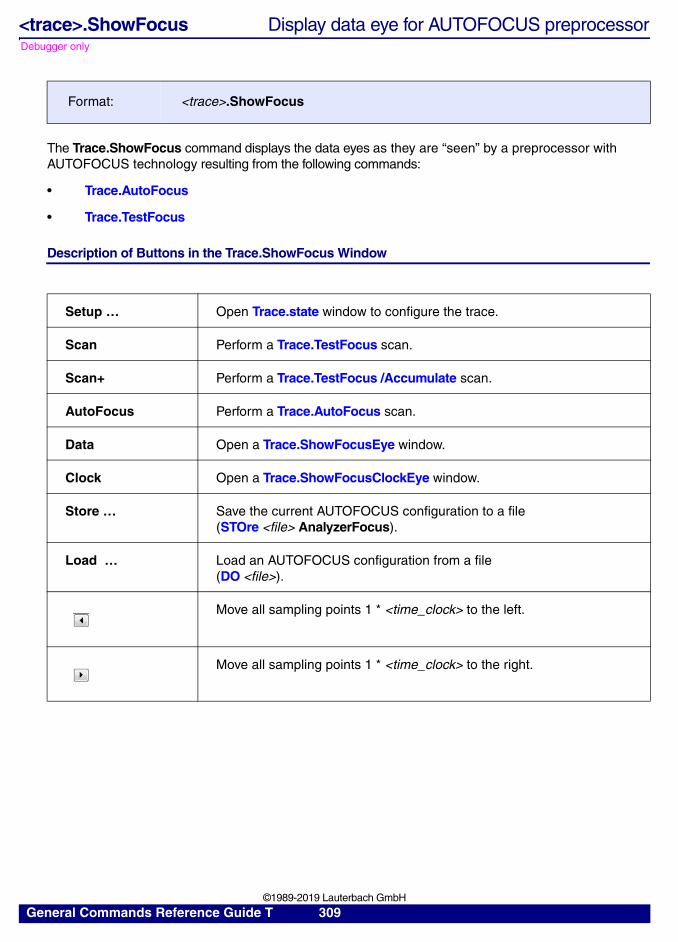
Debugger only
<trace>.ShowFocus Display data eye for AUTOFOCUS preprocessor
The Trace.ShowFocus command displays the data eyes as they are “seen” by a preprocessor with AUTOFOCUS technology resulting from the following commands:
• Trace.AutoFocus
• Trace.TestFocus
Description of Buttons in the Trace.ShowFocus Window
Format: <trace>.ShowFocus
Setup … Open Trace.state window to configure the trace.
Scan Perform a Trace.TestFocus scan.
Scan+ Perform a Trace.TestFocus /Accumulate scan.
AutoFocus Perform a Trace.AutoFocus scan.
Data Open a Trace.ShowFocusEye window.
Clock Open a Trace.ShowFocusClockEye window.
Store … Save the current AUTOFOCUS configuration to a file (STOre <file> AnalyzerFocus).
Load … Load an AUTOFOCUS configuration from a file(DO <file>).
Move all sampling points 1 * <time_clock> to the left.
Move all sampling points 1 * <time_clock> to the right.
General Commands Reference Guide T 309 ©1989-2019 Lauterbach GmbH
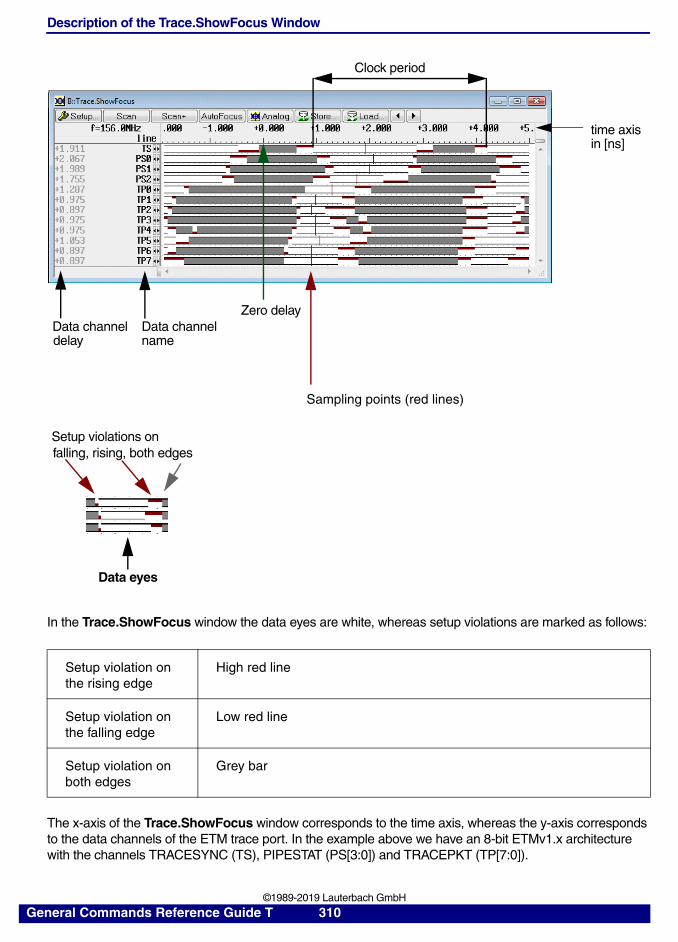
Description of the Trace.ShowFocus Window
In the Trace.ShowFocus window the data eyes are white, whereas setup violations are marked as follows:
The x-axis of the Trace.ShowFocus window corresponds to the time axis, whereas the y-axis corresponds to the data channels of the ETM trace port. In the example above we have an 8-bit ETMv1.x architecture with the channels TRACESYNC (TS), PIPESTAT (PS[3:0]) and TRACEPKT (TP[7:0]).
Setup violation on the rising edge
High red line
Setup violation on the falling edge
Low red line
Setup violation on both edges
Grey bar
Zero delay
Sampling points (red lines)
time axis
Data channeldelay
Clock period
Data channelname
in [ns]
Setup violations onfalling, rising, both edges
Data eyes
General Commands Reference Guide T 310 ©1989-2019 Lauterbach GmbH
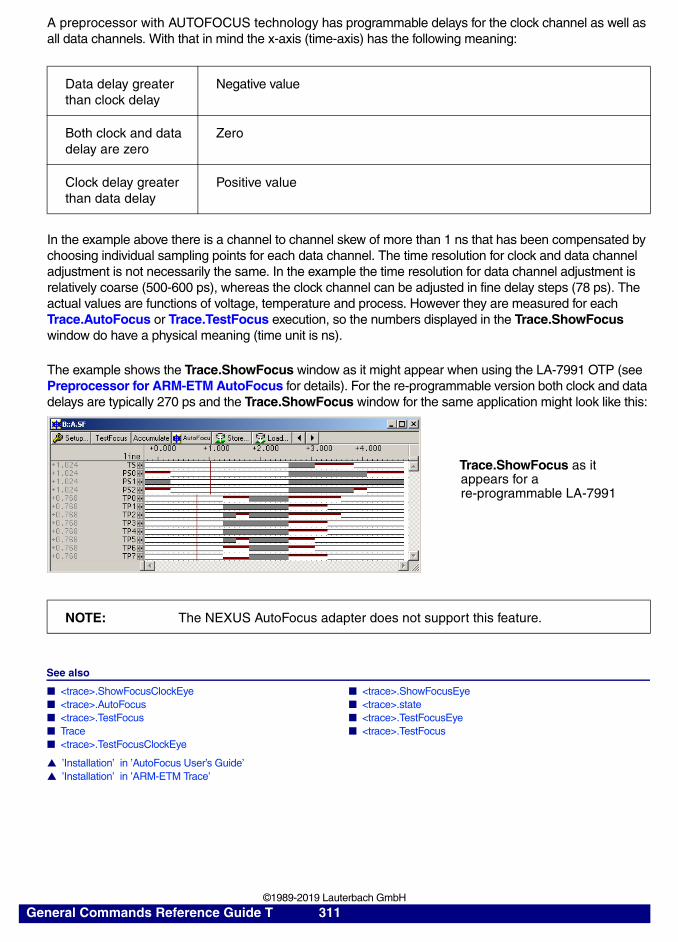
A preprocessor with AUTOFOCUS technology has programmable delays for the clock channel as well as all data channels. With that in mind the x-axis (time-axis) has the following meaning:
In the example above there is a channel to channel skew of more than 1 ns that has been compensated by choosing individual sampling points for each data channel. The time resolution for clock and data channel adjustment is not necessarily the same. In the example the time resolution for data channel adjustment is relatively coarse (500-600 ps), whereas the clock channel can be adjusted in fine delay steps (78 ps). The actual values are functions of voltage, temperature and process. However they are measured for each Trace.AutoFocus or Trace.TestFocus execution, so the numbers displayed in the Trace.ShowFocus window do have a physical meaning (time unit is ns).
The example shows the Trace.ShowFocus window as it might appear when using the LA-7991 OTP (see Preprocessor for ARM-ETM AutoFocus for details). For the re-programmable version both clock and data delays are typically 270 ps and the Trace.ShowFocus window for the same application might look like this:
See also
■ <trace>.ShowFocusClockEye ■ <trace>.ShowFocusEye ■ <trace>.AutoFocus ■ <trace>.state ■ <trace>.TestFocus ■ <trace>.TestFocusEye ■ Trace ■ <trace>.TestFocus ■ <trace>.TestFocusClockEye
▲ ’Installation’ in ’AutoFocus User’s Guide’▲ ’Installation’ in ’ARM-ETM Trace’
Data delay greater than clock delay
Negative value
Both clock and data delay are zero
Zero
Clock delay greater than data delay
Positive value
NOTE: The NEXUS AutoFocus adapter does not support this feature.
Trace.ShowFocus as it appears for a re-programmable LA-7991
General Commands Reference Guide T 311 ©1989-2019 Lauterbach GmbH
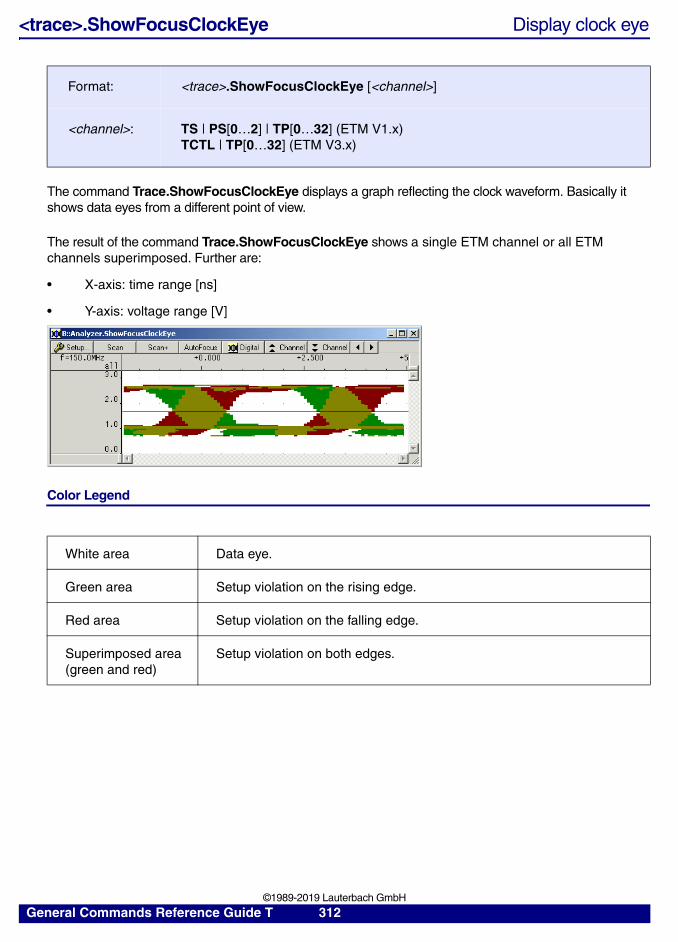
<trace>.ShowFocusClockEye Display clock eye
The command Trace.ShowFocusClockEye displays a graph reflecting the clock waveform. Basically it shows data eyes from a different point of view.
The result of the command Trace.ShowFocusClockEye shows a single ETM channel or all ETM channels superimposed. Further are:
• X-axis: time range [ns]
• Y-axis: voltage range [V]
Color Legend
Format: <trace>.ShowFocusClockEye [<channel>]
<channel>: TS | PS[0…2] | TP[0…32] (ETM V1.x)TCTL | TP[0…32] (ETM V3.x)
White area Data eye.
Green area Setup violation on the rising edge.
Red area Setup violation on the falling edge.
Superimposed area(green and red)
Setup violation on both edges.
General Commands Reference Guide T 312 ©1989-2019 Lauterbach GmbH
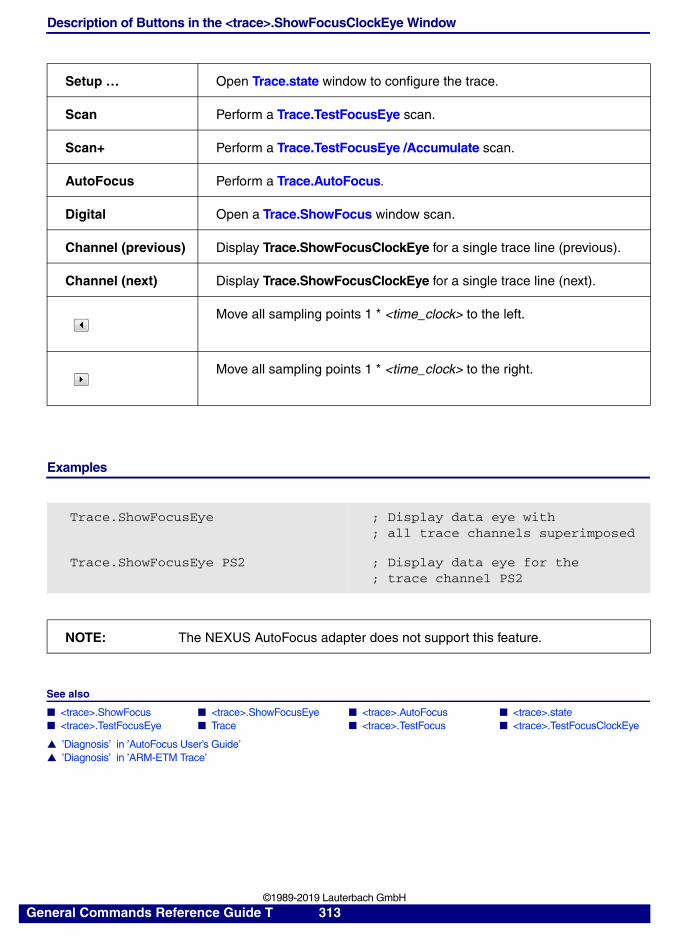
Description of Buttons in the <trace>.ShowFocusClockEye Window
Examples
See also
■ <trace>.ShowFocus ■ <trace>.ShowFocusEye ■ <trace>.AutoFocus ■ <trace>.state ■ <trace>.TestFocusEye ■ Trace ■ <trace>.TestFocus ■ <trace>.TestFocusClockEye
▲ ’Diagnosis’ in ’AutoFocus User’s Guide’▲ ’Diagnosis’ in ’ARM-ETM Trace’
Setup … Open Trace.state window to configure the trace.
Scan Perform a Trace.TestFocusEye scan.
Scan+ Perform a Trace.TestFocusEye /Accumulate scan.
AutoFocus Perform a Trace.AutoFocus.
Digital Open a Trace.ShowFocus window scan.
Channel (previous) Display Trace.ShowFocusClockEye for a single trace line (previous).
Channel (next) Display Trace.ShowFocusClockEye for a single trace line (next).
Move all sampling points 1 * <time_clock> to the left.
Move all sampling points 1 * <time_clock> to the right.
Trace.ShowFocusEye ; Display data eye with; all trace channels superimposed
Trace.ShowFocusEye PS2 ; Display data eye for the; trace channel PS2
NOTE: The NEXUS AutoFocus adapter does not support this feature.
General Commands Reference Guide T 313 ©1989-2019 Lauterbach GmbH
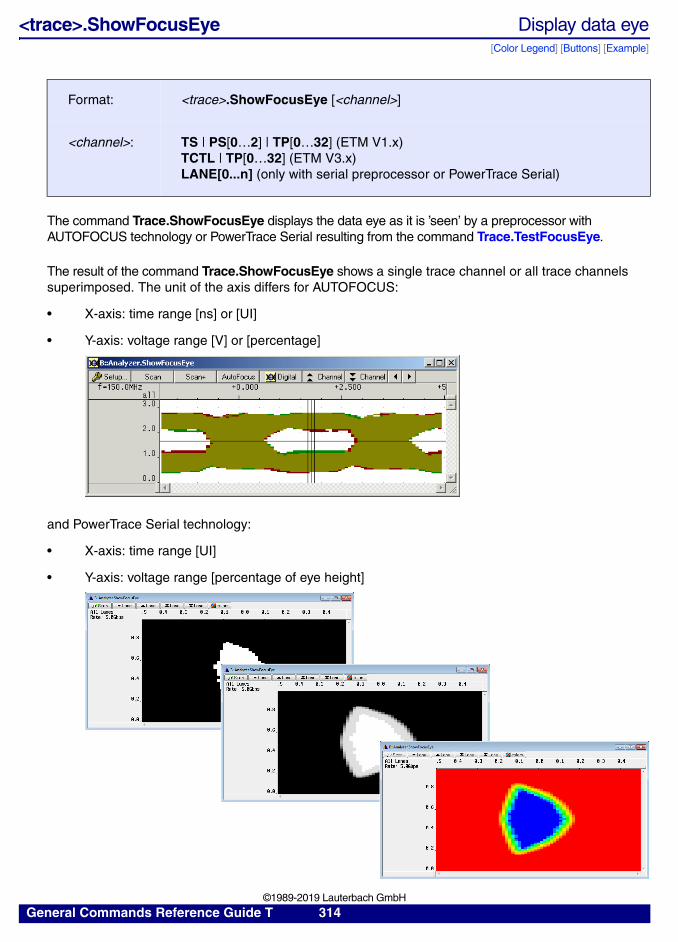
<trace>.ShowFocusEye Display data eye[Color Legend] [Buttons] [Example]
The command Trace.ShowFocusEye displays the data eye as it is ’seen’ by a preprocessor with AUTOFOCUS technology or PowerTrace Serial resulting from the command Trace.TestFocusEye.
The result of the command Trace.ShowFocusEye shows a single trace channel or all trace channels superimposed. The unit of the axis differs for AUTOFOCUS:
• X-axis: time range [ns] or [UI]
• Y-axis: voltage range [V] or [percentage]
and PowerTrace Serial technology:
• X-axis: time range [UI]
• Y-axis: voltage range [percentage of eye height]
Format: <trace>.ShowFocusEye [<channel>]
<channel>: TS | PS[0…2] | TP[0…32] (ETM V1.x)TCTL | TP[0…32] (ETM V3.x)LANE[0...n] (only with serial preprocessor or PowerTrace Serial)
General Commands Reference Guide T 314 ©1989-2019 Lauterbach GmbH
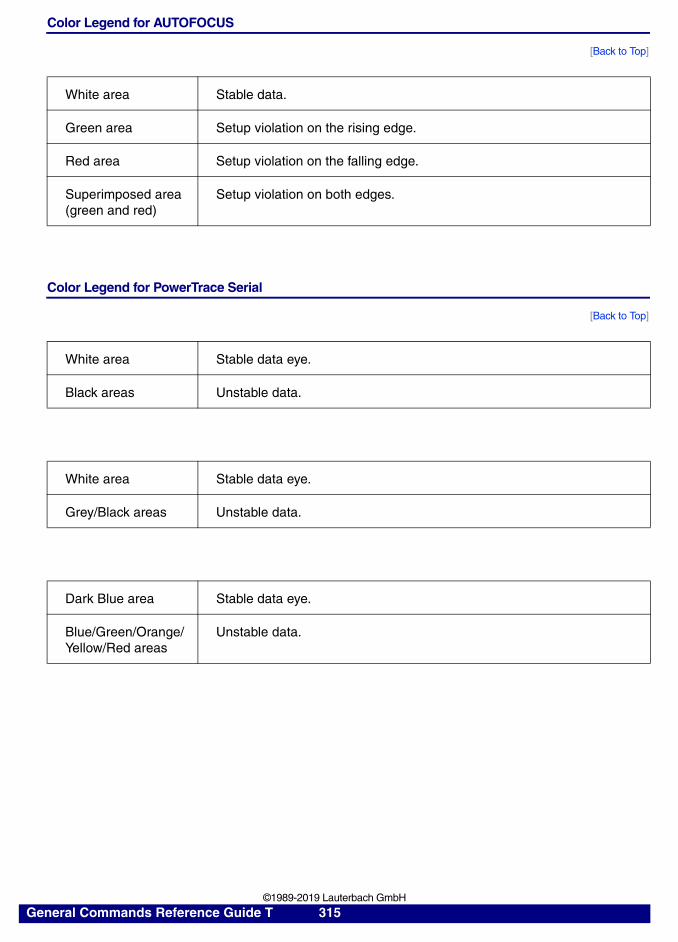
Color Legend for AUTOFOCUS
[Back to Top]
Color Legend for PowerTrace Serial
[Back to Top]
White area Stable data.
Green area Setup violation on the rising edge.
Red area Setup violation on the falling edge.
Superimposed area(green and red)
Setup violation on both edges.
White area Stable data eye.
Black areas Unstable data.
White area Stable data eye.
Grey/Black areas Unstable data.
Dark Blue area Stable data eye.
Blue/Green/Orange/Yellow/Red areas
Unstable data.
General Commands Reference Guide T 315 ©1989-2019 Lauterbach GmbH
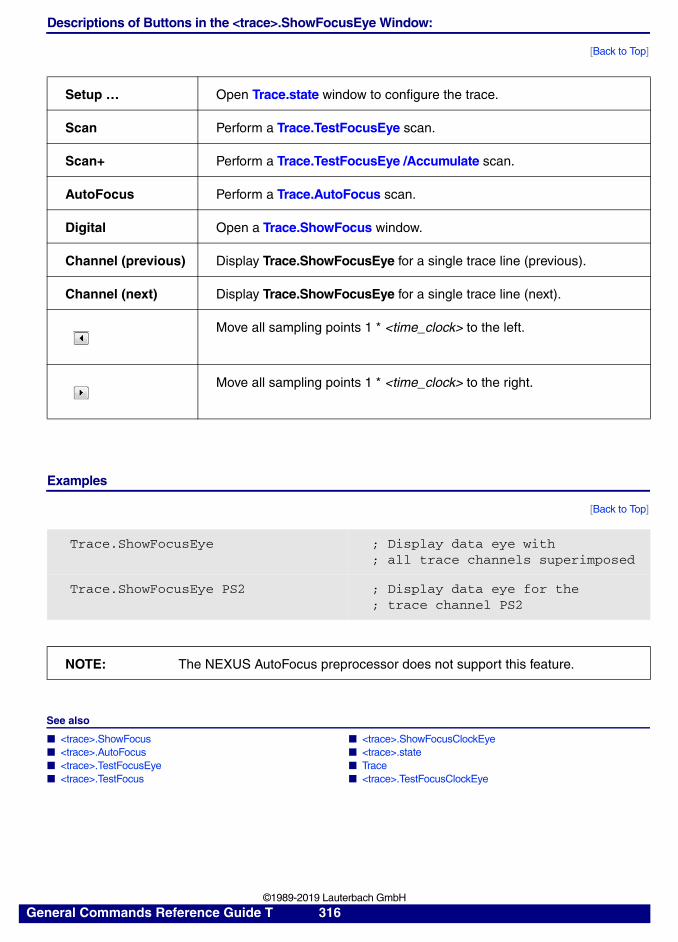
Descriptions of Buttons in the <trace>.ShowFocusEye Window:
[Back to Top]
Examples
[Back to Top]
See also
■ <trace>.ShowFocus ■ <trace>.ShowFocusClockEye ■ <trace>.AutoFocus ■ <trace>.state ■ <trace>.TestFocusEye ■ Trace ■ <trace>.TestFocus ■ <trace>.TestFocusClockEye
Setup … Open Trace.state window to configure the trace.
Scan Perform a Trace.TestFocusEye scan.
Scan+ Perform a Trace.TestFocusEye /Accumulate scan.
AutoFocus Perform a Trace.AutoFocus scan.
Digital Open a Trace.ShowFocus window.
Channel (previous) Display Trace.ShowFocusEye for a single trace line (previous).
Channel (next) Display Trace.ShowFocusEye for a single trace line (next).
Move all sampling points 1 * <time_clock> to the left.
Move all sampling points 1 * <time_clock> to the right.
Trace.ShowFocusEye ; Display data eye with; all trace channels superimposed
Trace.ShowFocusEye PS2 ; Display data eye for the; trace channel PS2
NOTE: The NEXUS AutoFocus preprocessor does not support this feature.
General Commands Reference Guide T 316 ©1989-2019 Lauterbach GmbH
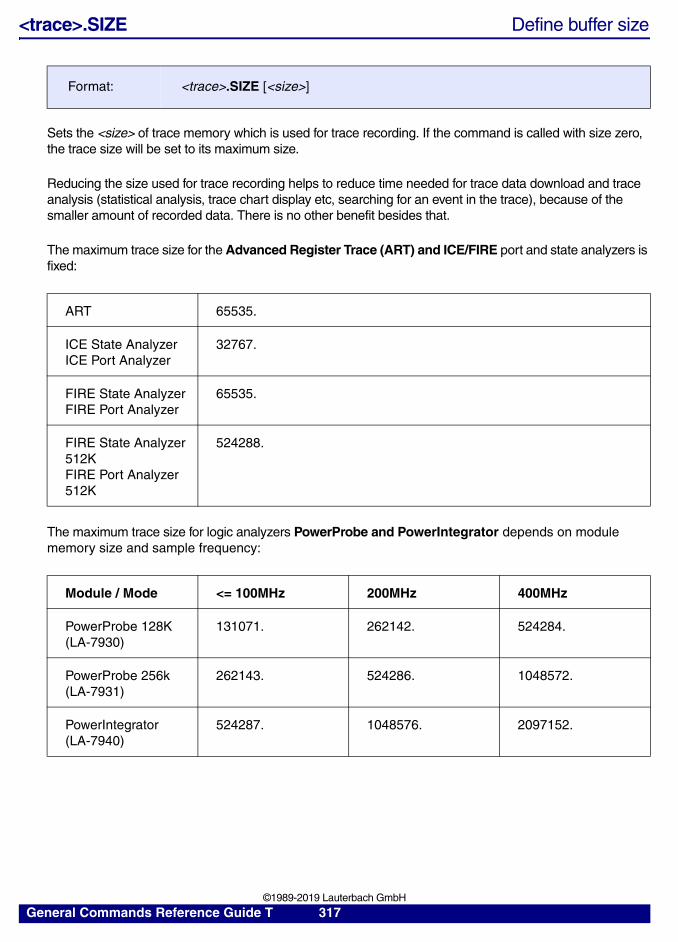
<trace>.SIZE Define buffer size
Sets the <size> of trace memory which is used for trace recording. If the command is called with size zero, the trace size will be set to its maximum size.
Reducing the size used for trace recording helps to reduce time needed for trace data download and trace analysis (statistical analysis, trace chart display etc, searching for an event in the trace), because of the smaller amount of recorded data. There is no other benefit besides that.
The maximum trace size for the Advanced Register Trace (ART) and ICE/FIRE port and state analyzers is fixed:
The maximum trace size for logic analyzers PowerProbe and PowerIntegrator depends on module memory size and sample frequency:
Format: <trace>.SIZE [<size>]
ART 65535.
ICE State AnalyzerICE Port Analyzer
32767.
FIRE State AnalyzerFIRE Port Analyzer
65535.
FIRE State Analyzer 512KFIRE Port Analyzer 512K
524288.
Module / Mode <= 100MHz 200MHz 400MHz
PowerProbe 128K(LA-7930)
131071. 262142. 524284.
PowerProbe 256k(LA-7931)
262143. 524286. 1048572.
PowerIntegrator(LA-7940)
524287. 1048576. 2097152.
General Commands Reference Guide T 317 ©1989-2019 Lauterbach GmbH
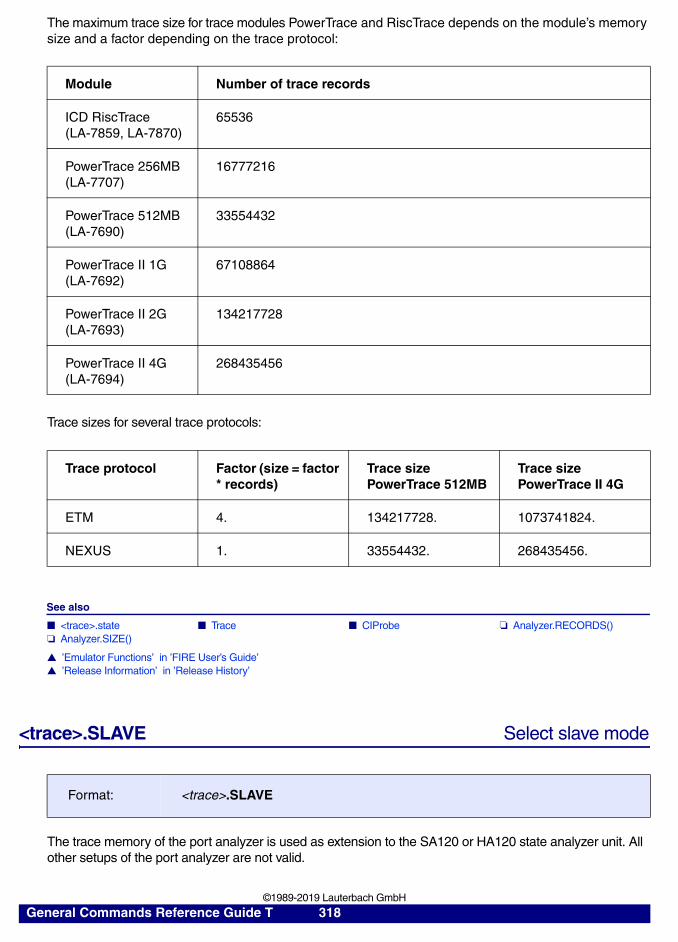
The maximum trace size for trace modules PowerTrace and RiscTrace depends on the module’s memory size and a factor depending on the trace protocol:
Trace sizes for several trace protocols:
See also
■ <trace>.state ■ Trace ■ CIProbe ❏ Analyzer.RECORDS() ❏ Analyzer.SIZE()
▲ ’Emulator Functions’ in ’FIRE User’s Guide’▲ ’Release Information’ in ’Release History’
<trace>.SLAVE Select slave mode
The trace memory of the port analyzer is used as extension to the SA120 or HA120 state analyzer unit. All other setups of the port analyzer are not valid.
Module Number of trace records
ICD RiscTrace(LA-7859, LA-7870)
65536
PowerTrace 256MB(LA-7707)
16777216
PowerTrace 512MB(LA-7690)
33554432
PowerTrace II 1G(LA-7692)
67108864
PowerTrace II 2G(LA-7693)
134217728
PowerTrace II 4G(LA-7694)
268435456
Trace protocol Factor (size = factor * records)
Trace sizePowerTrace 512MB
Trace sizePowerTrace II 4G
ETM 4. 134217728. 1073741824.
NEXUS 1. 33554432. 268435456.
Format: <trace>.SLAVE
General Commands Reference Guide T 318 ©1989-2019 Lauterbach GmbH
<trace>.SnapShot Restart trace capturing once
Restart the trace capturing. Effectively the same as executing the commands Trace.OFF, Trace.Init and Trace.Arm.
Most often used to restart the trace recording:
• After the trace capturing was stopped by a trigger (e.g. by a TraceTrigger breakpoint).
• When the trace works in Stack mode and trace capturing was stopped because the trace buffer was full.
See also
■ <trace>.SelfArm ■ <trace>.state ■ Trace
<trace>.SPY Adaptive Stream and Analysis
Trace.SPY allows display intermediate trace analysis results while streaming (see <trace>.Mode STREAM). If the average data rate at the trace port is high, the analysis time is reduced, and vise versa.
The Trace.SPY command required that trace decoding is possible while the program execution is running. This is possible, if the core architecture in use provides run-time access to memory or if the object code is loaded to the TRACE32 virtual memory. It is recommended to load the object code to the TRACE32 Virtual Memory in any case, because the trace analysis is then faster.
The Trace.SPY command only works if the trace is currently in Arm mode.
Example:
Format: <trace>.SnapShot<trace>.TEST (deprecated)
Format: <trace>.SPY
…
Data.LOAD.Elf demo.elf /VM ; copy object code to TRACE32; Virtual Memory
Analyzer.Mode STREAM ; select trace mode STREAM
Go ; start the program execution
…
General Commands Reference Guide T 319 ©1989-2019 Lauterbach GmbH
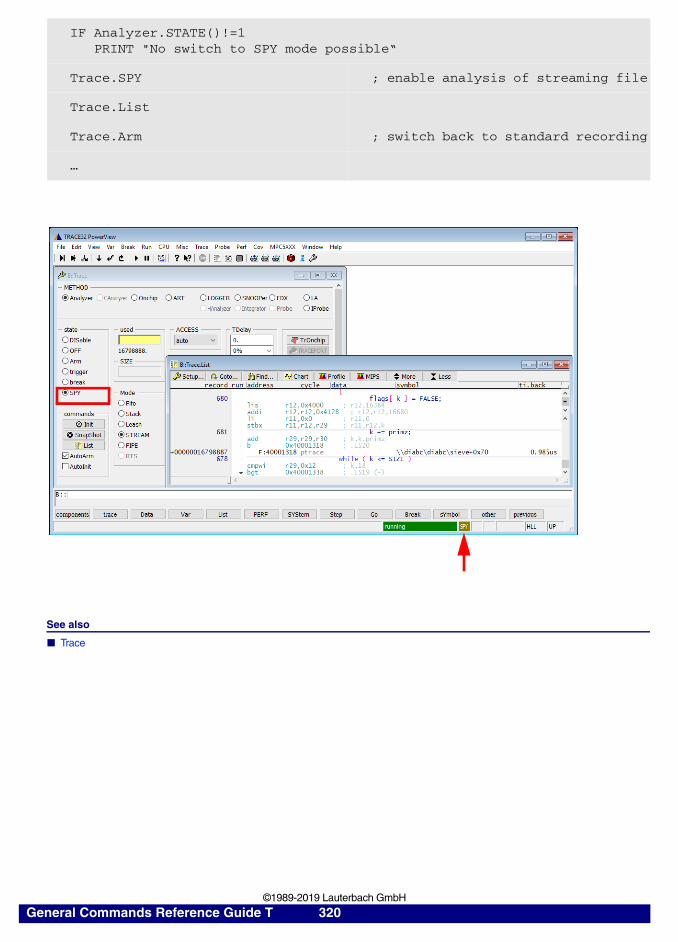
See also
■ Trace
IF Analyzer.STATE()!=1 PRINT "No switch to SPY mode possible“
Trace.SPY ; enable analysis of streaming file
Trace.List
Trace.Arm ; switch back to standard recording
…
General Commands Reference Guide T 320 ©1989-2019 Lauterbach GmbH
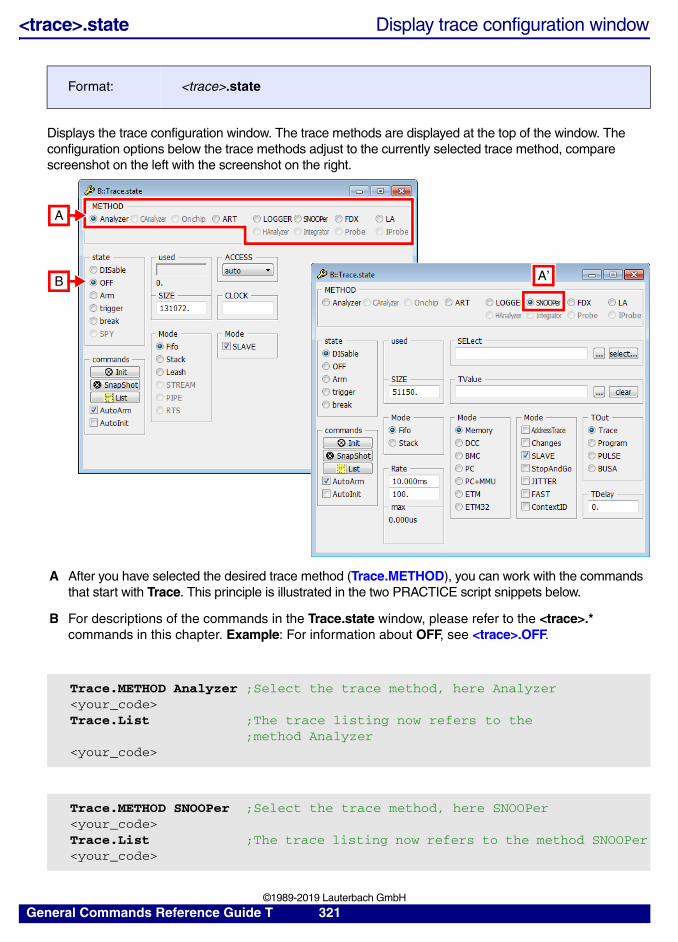
<trace>.state Display trace configuration window
Displays the trace configuration window. The trace methods are displayed at the top of the window. The configuration options below the trace methods adjust to the currently selected trace method, compare screenshot on the left with the screenshot on the right.
Format: <trace>.state
A After you have selected the desired trace method (Trace.METHOD), you can work with the commands that start with Trace. This principle is illustrated in the two PRACTICE script snippets below.
B For descriptions of the commands in the Trace.state window, please refer to the <trace>.* commands in this chapter. Example: For information about OFF, see <trace>.OFF.
Trace.METHOD Analyzer ;Select the trace method, here Analyzer<your_code>Trace.List ;The trace listing now refers to the ;method Analyzer<your_code>
Trace.METHOD SNOOPer ;Select the trace method, here SNOOPer<your_code>Trace.List ;The trace listing now refers to the method SNOOPer<your_code>
A’
A
B
General Commands Reference Guide T 321 ©1989-2019 Lauterbach GmbH
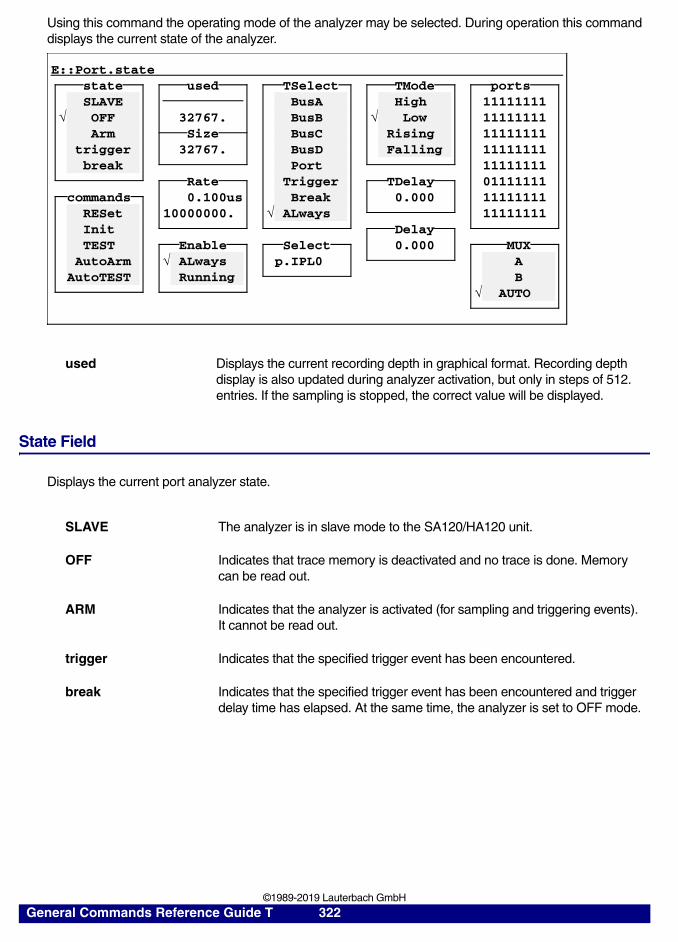
Using this command the operating mode of the analyzer may be selected. During operation this command displays the current state of the analyzer.
State Field
Displays the current port analyzer state.
used Displays the current recording depth in graphical format. Recording depth display is also updated during analyzer activation, but only in steps of 512. entries. If the sampling is stopped, the correct value will be displayed.
SLAVE The analyzer is in slave mode to the SA120/HA120 unit.
OFF Indicates that trace memory is deactivated and no trace is done. Memory can be read out.
ARM Indicates that the analyzer is activated (for sampling and triggering events). It cannot be read out.
trigger Indicates that the specified trigger event has been encountered.
break Indicates that the specified trigger event has been encountered and trigger delay time has elapsed. At the same time, the analyzer is set to OFF mode.
E::Port.statestate used TSelect TMode portsSLAVE BusA High 11111111
OFF 32767. BusB Low 11111111Arm Size BusC Rising 11111111
trigger 32767. BusD Falling 11111111break Port 11111111
Rate Trigger TDelay 01111111commands 0.100us Break 0.000 11111111
RESet 10000000. ALways 11111111Init DelayTEST Enable Select 0.000 MUX
AutoArm ALways p.IPL0 AAutoTEST Running B
AUTO
General Commands Reference Guide T 322 ©1989-2019 Lauterbach GmbH
Ports
Displays continuously the state of the ports. The order is physically (logically depending on the emulated microcontroller) just as the order, used in the list command.
With a mouse click to the corresponding area all commands can be executed or selects can be switched on or off.
See also
■ <trace>.ACCESS ■ <trace>.ADDRESS ■ <trace>.Arm ■ <trace>.AutoArm ■ <trace>.AutoFocus ■ <trace>.AutoInit ■ <trace>.AutoStart ■ <trace>.AutoTEST ■ <trace>.BookMark ■ <trace>.Chart ■ <trace>.ComPare ■ <trace>.CustomTrace ■ <trace>.CustomTraceLoad ■ <trace>.DISable ■ <trace>.DisConfig ■ <trace>.DRAW ■ <trace>.EXPORT ■ <trace>.FILE ■ <trace>.Find ■ <trace>.FindAll ■ <trace>.FindChange ■ <trace>.FLOWPROCESS ■ <trace>.FLOWSTART ■ <trace>.Get ■ <trace>.GOTO ■ <trace>.Init ■ <trace>.List ■ <trace>.ListNesting ■ <trace>.ListVar ■ <trace>.LOAD ■ <trace>.Mode ■ <trace>.OFF ■ <trace>.Out ■ <trace>.PC ■ <trace>.PipePROTO ■ <trace>.PortType ■ <trace>.PROfile ■ <trace>.PROfileChart ■ <trace>.PROfileSTATistic ■ <trace>.Program ■ <trace>.PROTOcol ■ <trace>.REF ■ <trace>.ReProgram ■ <trace>.RESet ■ <trace>.SAMPLE ■ <trace>.SAVE ■ <trace>.SelfArm ■ <trace>.ShowFocus ■ <trace>.ShowFocusClockEye ■ <trace>.ShowFocusEye ■ <trace>.SIZE ■ <trace>.SnapShot ■ <trace>.STATistic ■ <trace>.TDelay ■ <trace>.TERMination ■ <trace>.TestFocus ■ <trace>.TestFocusEye ■ <trace>.THreshold ■ <trace>.Timing ■ <trace>.TraceCONNECT ■ <trace>.TRACK ■ <trace>.View ■ <trace>.XTrack ■ <trace>.ZERO ■ Trace ■ Trace.METHOD ❏ Trace.METHOD() ❏ Trace.RECORDS() ❏ Trace.STATE()
▲ ’Trace Functions’ in ’General Function Reference’▲ ’Displaying the Trace’ in ’Training FIRE Analyzer’▲ ’HCS12 On-chip Debug Module’ in ’FIRE Emulator for HC12/MCS12’▲ ’Emulator Functions’ in ’FIRE User’s Guide’▲ ’Release Information’ in ’Release History’
General Commands Reference Guide T 323 ©1989-2019 Lauterbach GmbH
<trace>.STATistic Statistic analysis
The <trace>.STATistic commands can be used for statistical analysis based on the information sampled to the trace buffer.
In contrast to the performance analyzer (PERF commands), the statistical analysis commands provide a higher precision and much more information about the analyzed item, but since the size of the trace buffer is limited, the observation time is limited. Statistic evaluations can be made after the trace memory stops sampling. For short calculation time minimize the trace buffer size.
See also
■ <trace>.state ■ Trace ■ <trace>.Chart ■ <trace>.PROfileChart ■ <trace>.PROfileSTATistic ■ <trace>.STATistic.Address ■ <trace>.STATistic.AddressDIStance ■ <trace>.STATistic.AddressDURation ■ <trace>.STATistic.BondOut ■ <trace>.STATistic.ChildTREE ■ <trace>.STATistic.COLOR ■ <trace>.STATistic.CYcle ■ <trace>.STATistic.DatasYmbol ■ <trace>.STATistic.DIStance ■ <trace>.STATistic.DistriB ■ <trace>.STATistic.DURation ■ <trace>.STATistic.FIRST ■ <trace>.STATistic.Func ■ <trace>.STATistic.FuncDURation ■ <trace>.STATistic.FuncDURationInternal ■ <trace>.STATistic.GROUP ■ <trace>.STATistic.Ignore ■ <trace>.STATistic.INTERRUPT ■ <trace>.STATistic.InterruptIsFunction ■ <trace>.STATistic.INTERRUPTTREE ■ <trace>.STATistic.LAST ■ <trace>.STATistic.Line ■ <trace>.STATistic.LINKage ■ <trace>.STATistic.LISTCONFIG ■ <trace>.STATistic.Measure ■ <trace>.STATistic.MODULE ■ <trace>.STATistic.PAddress ■ <trace>.STATistic.ParentTREE ■ <trace>.STATistic.PIPELINE ■ <trace>.STATistic.PreFetch ■ <trace>.STATistic.PROGRAM ■ <trace>.STATistic.PsYmbol ■ <trace>.STATistic.Sort ■ <trace>.STATistic.sYmbol ■ <trace>.STATistic.TASK ■ <trace>.STATistic.TASKFunc ■ <trace>.STATistic.TASKKernel ■ <trace>.STATistic.TASKORINTERRUPT ■ <trace>.STATistic.TASKSRV ■ <trace>.STATistic.TASKState ■ <trace>.STATistic.TASKTREE ■ <trace>.STATistic.TASKVSINTERRUPT ■ <trace>.STATistic.TREE ■ <trace>.STATistic.Use ❏ Analyzer.RECORDS() ❏ Analyzer.SIZE()
▲ ’How to use the PROTOanalyzer’ in ’DigRF Protocol Analyzer’▲ ’How to use the PROTOanalyzer’ in ’FlexRay Protocol Analyzer’▲ ’How to use the PROTOanalyzer’ in ’LIN Bus Protocol Analyzer’▲ ’Release Information’ in ’Release History’
General Commands Reference Guide T 324 ©1989-2019 Lauterbach GmbH
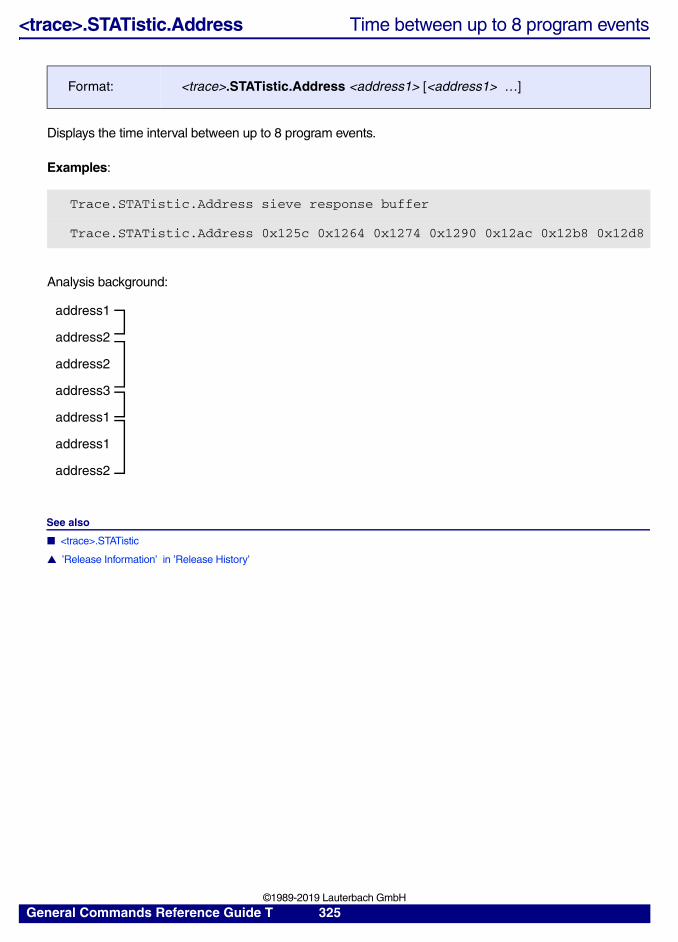
<trace>.STATistic.Address Time between up to 8 program events
Displays the time interval between up to 8 program events.
Examples:
Analysis background:
See also
■ <trace>.STATistic
▲ ’Release Information’ in ’Release History’
Format: <trace>.STATistic.Address <address1> [<address1> …]
Trace.STATistic.Address sieve response buffer
Trace.STATistic.Address 0x125c 0x1264 0x1274 0x1290 0x12ac 0x12b8 0x12d8
address1
address2
address2
address3
address1
address1
address2
General Commands Reference Guide T 325 ©1989-2019 Lauterbach GmbH
<trace>.STATistic.AddressDIStance Time interval for single program event
Displays the time interval for a single program event. Without parameter the assignment of classes (16) is done automatically. With arguments the classes can be set up manually.
The following 2 commands are equivalents:
If selective tracing is possible, use the /TraceEnable filter to extend the observation time:
In the case of an SMP system, the following options are provided:
See also
■ <trace>.STATistic ■ <trace>.STATistic.DIStance
▲ ’Release Information’ in ’Release History’
Format: <trace>.STATistic.AddressDIStance <address> [<timemin>] [<increment>] [/<option>]
<option>: CORE <number> | SplitCORE | MergeCORE | JoinCORE (SMP tracing only)
B::Trace.STATistic.AddressDIStance InterruptEntry
B::Trace.STATistic.DIStance /FILTER Address InterruptEntry
B::Trace.STATistic.AddressDIStance InterruptEntry 15.0us 1.0us
B::Break.Set InterruptEntry /Program /TraceEnable
B::Go
B::Break
B::Trace.STATistic.AddressDIStance InterruptEntry
JoinCORE(default)
Analysis is performed for all cores. The core information is discarded.
SplitCORE Same as JoinCORE.
MergeCORE Same as JoinCORE.
CORE <number> Analysis is performed for the specified core.
General Commands Reference Guide T 326 ©1989-2019 Lauterbach GmbH
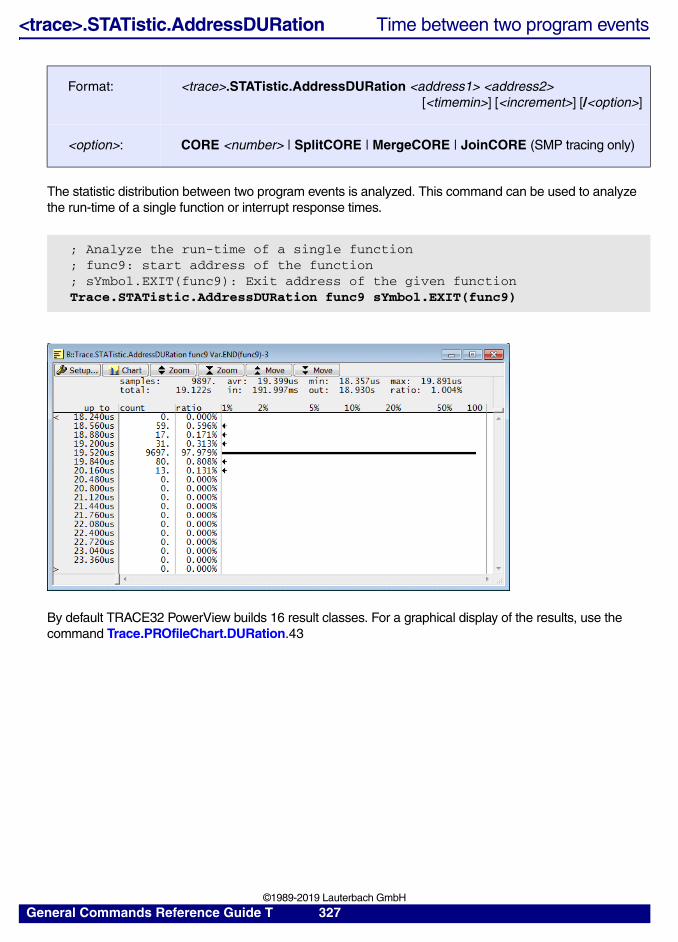
<trace>.STATistic.AddressDURation Time between two program events
The statistic distribution between two program events is analyzed. This command can be used to analyze the run-time of a single function or interrupt response times.
By default TRACE32 PowerView builds 16 result classes. For a graphical display of the results, use the command Trace.PROfileChart.DURation.43
Format: <trace>.STATistic.AddressDURation <address1> <address2> [<timemin>] [<increment>] [/<option>]
<option>: CORE <number> | SplitCORE | MergeCORE | JoinCORE (SMP tracing only)
; Analyze the run-time of a single function; func9: start address of the function; sYmbol.EXIT(func9): Exit address of the given functionTrace.STATistic.AddressDURation func9 sYmbol.EXIT(func9)
General Commands Reference Guide T 327 ©1989-2019 Lauterbach GmbH
The <option> Number allows a user-defined number of result classes.
The parameter <timemin> allows to specify the time for the first result class, the parameter <increment> allows to specify the increment for the next result class.
Trace filter allow a more effective usage of the trace memory:
In the case of an SMP system, the following options are provided:
See also
■ <trace>.STATistic
▲ ’Release Information’ in ’Release History’
Trace.STATistic.AddressDURation func9 sYmbol.EXIT(func9) /Number 6.
Trace.STATistic.AddressDURation func9 sYmbol.EXIT(func9) 15.us 1.us
Trace.Mode Leash
Break.Set func9 /Program /TraceEnable
Break.Set sYmbol.EXIT(func9) /Program /TraceEnable
Go
WAIT !STATE.RUN()
Trace.STATistic.AddressDURation func9 sYmbol.EXIT(func9)
JoinCORE(default)
Analysis is performed for all cores. The core information is discarded.
SplitCORE Same as JoinCORE.
MergeCORE Same as JoinCORE.
CORE <number> Analysis is performed for the specified core.
General Commands Reference Guide T 328 ©1989-2019 Lauterbach GmbH
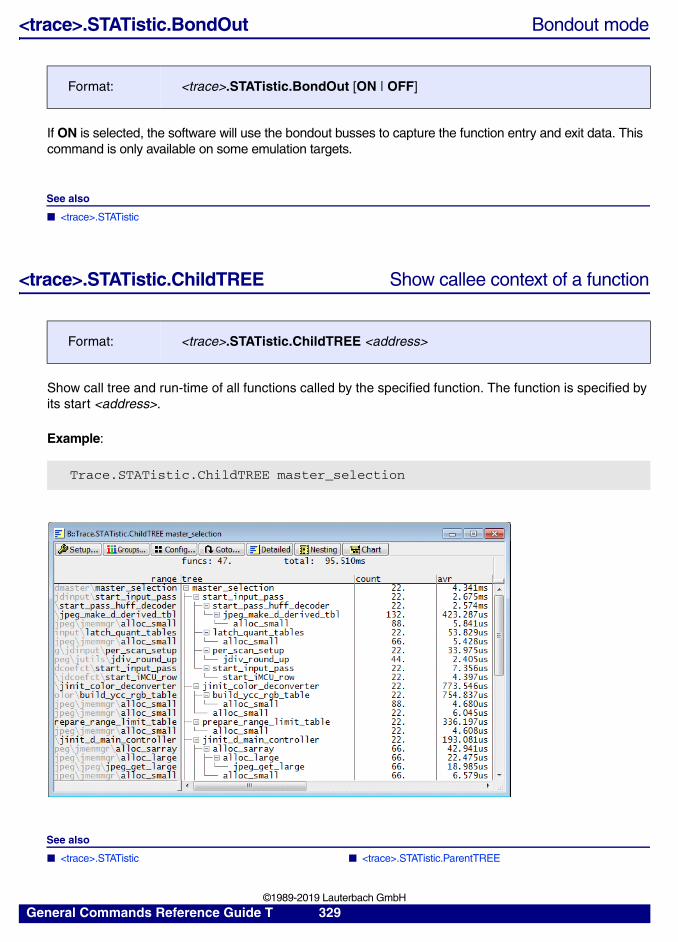
<trace>.STATistic.BondOut Bondout mode
If ON is selected, the software will use the bondout busses to capture the function entry and exit data. This command is only available on some emulation targets.
See also
■ <trace>.STATistic
<trace>.STATistic.ChildTREE Show callee context of a function
Show call tree and run-time of all functions called by the specified function. The function is specified by its start <address>.
Example:
See also
■ <trace>.STATistic ■ <trace>.STATistic.ParentTREE
Format: <trace>.STATistic.BondOut [ON | OFF]
Format: <trace>.STATistic.ChildTREE <address>
Trace.STATistic.ChildTREE master_selection
General Commands Reference Guide T 329 ©1989-2019 Lauterbach GmbH
<trace>.STATistic.COLOR Assign colors to function for colored graphics
See also
■ <trace>.STATistic
▲ ’PowerView - Screen Display’ in ’PowerView User’s Guide’
<trace>.STATistic.CYcle Analyze cycle types
Performs a statistical analysis of the cycle types.
In the case of an SMP system, the following options are provided:
Format: <trace>.STATistic.COLOR FixedColors | AlternatingColors
FixedColors(default)
Colors are assigned fixed to functions.
AlternatingColors Colors are assigned by the recording order of the functions for each measurement.
Format: <trace>.STATistic.CYcle [<timerange>] [/<option>]
<option>: FILE | AccumulateINCremental | FULLIdleThreshold <clocks>CORE <number> | SplitCORE | MergeCORE | JoinCORE (SMP tracing only)
MergeCORE(default)
Analysis is performed independently for each core. The results are summarized and displayed as a single result.
SplitCORE Same as MergeCORE.
JoinCORE Same as MergeCORE.
CORE <number> Analysis is performed for the specified core.
General Commands Reference Guide T 330 ©1989-2019 Lauterbach GmbH
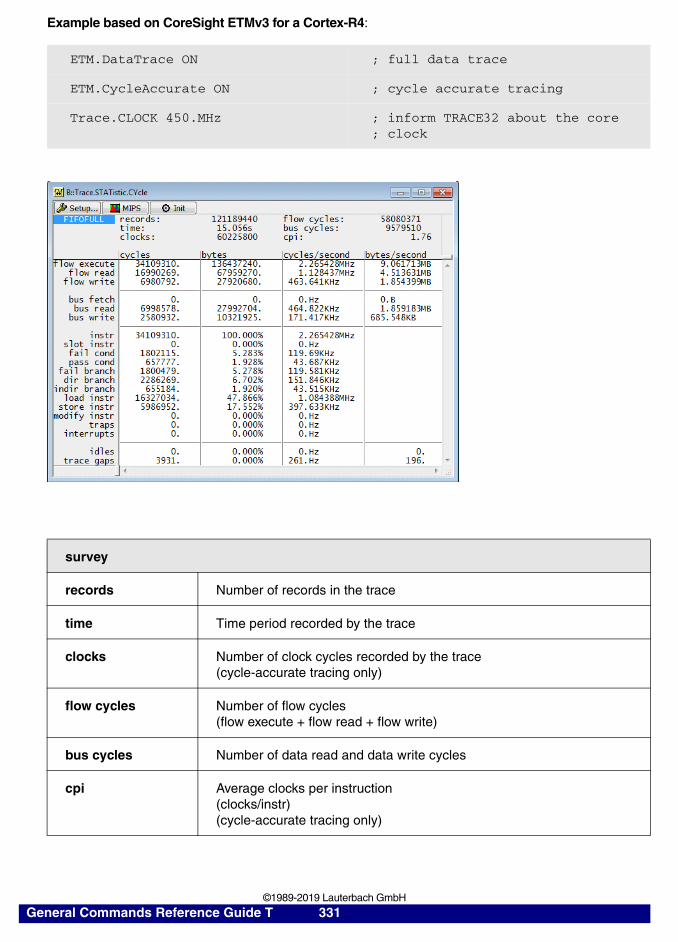
Example based on CoreSight ETMv3 for a Cortex-R4:
ETM.DataTrace ON ; full data trace
ETM.CycleAccurate ON ; cycle accurate tracing
Trace.CLOCK 450.MHz ; inform TRACE32 about the core; clock
survey
records Number of records in the trace
time Time period recorded by the trace
clocks Number of clock cycles recorded by the trace(cycle-accurate tracing only)
flow cycles Number of flow cycles(flow execute + flow read + flow write)
bus cycles Number of data read and data write cycles
cpi Average clocks per instruction(clocks/instr)(cycle-accurate tracing only)
General Commands Reference Guide T 331 ©1989-2019 Lauterbach GmbH
details
flow execute Number of cycles that executed/not executed instructions
flow read Number of cycles that performed a read access
flow write Number of cycles the performed a write access
bus fetch —
bus read Number of data read cycles
bus write Number of date write cycles
instr Number of executed/not executed instruction
slot instr —
fail cond Number of conditional instructions that failed (failed branch instructions not included)
pass cond Number of conditional instructions that passed (taken branches not included)
fail branch Number of failed branch instructions
dir branch Number of direct branches
indir branch Number of indirect branches
load instr Number of load instructions
store instr Number of store instructions
modify instr Number of modify instructions (swp, swpb)
traps Number of traps
interrupts Number of interrupts
idles Number of “wait for interrupt” (coprocessor instruction or WFI instruction) or number of times that 1000. clock cycles passed without a broadcast of trace information.
The option IdleThreshold allows to modify the number of clock cycles that need to pass for a idle detection.
trace gaps Number of trace gaps (FIFOFULL, filtered trace information …)
General Commands Reference Guide T 332 ©1989-2019 Lauterbach GmbH
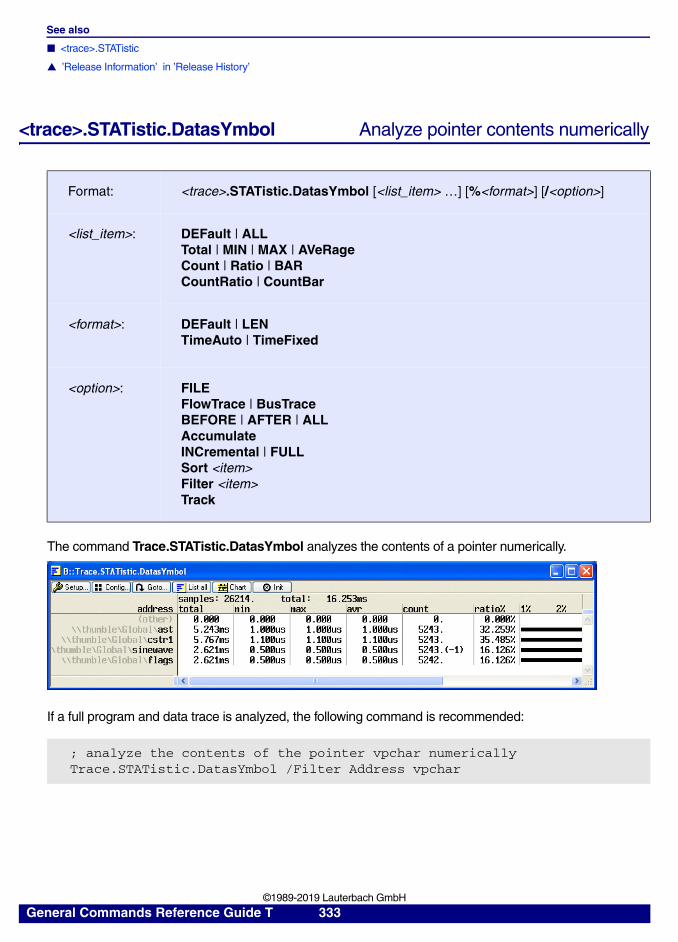
See also
■ <trace>.STATistic
▲ ’Release Information’ in ’Release History’
<trace>.STATistic.DatasYmbol Analyze pointer contents numerically
The command Trace.STATistic.DatasYmbol analyzes the contents of a pointer numerically.
If a full program and data trace is analyzed, the following command is recommended:
Format: <trace>.STATistic.DatasYmbol [<list_item> …] [%<format>] [/<option>]
<list_item>: DEFault | ALLTotal | MIN | MAX | AVeRageCount | Ratio | BAR CountRatio | CountBar
<format>: DEFault | LEN TimeAuto | TimeFixed
<option>: FILEFlowTrace | BusTraceBEFORE | AFTER | ALLAccumulate INCremental | FULL Sort <item>Filter <item>Track
; analyze the contents of the pointer vpchar numericallyTrace.STATistic.DatasYmbol /Filter Address vpchar
General Commands Reference Guide T 333 ©1989-2019 Lauterbach GmbH
A more effective usage of the trace memory is possible, if only write accesses to the pointer are recorded in the trace.
See also
■ <trace>.STATistic
▲ ’Release Information’ in ’Release History’
; set a filter to record only write cycles to the pointer vpchar to the; traceVar.Break.Set vpchar /Write /TraceEnable
…
; analyze the contents of the pointerTrace.STATistic.DatasYmbol
; analyze the contents of the pointer, sort the result by symbol namesTrace.STATistic.DatasYmbol /Sort sYmbol
General Commands Reference Guide T 334 ©1989-2019 Lauterbach GmbH
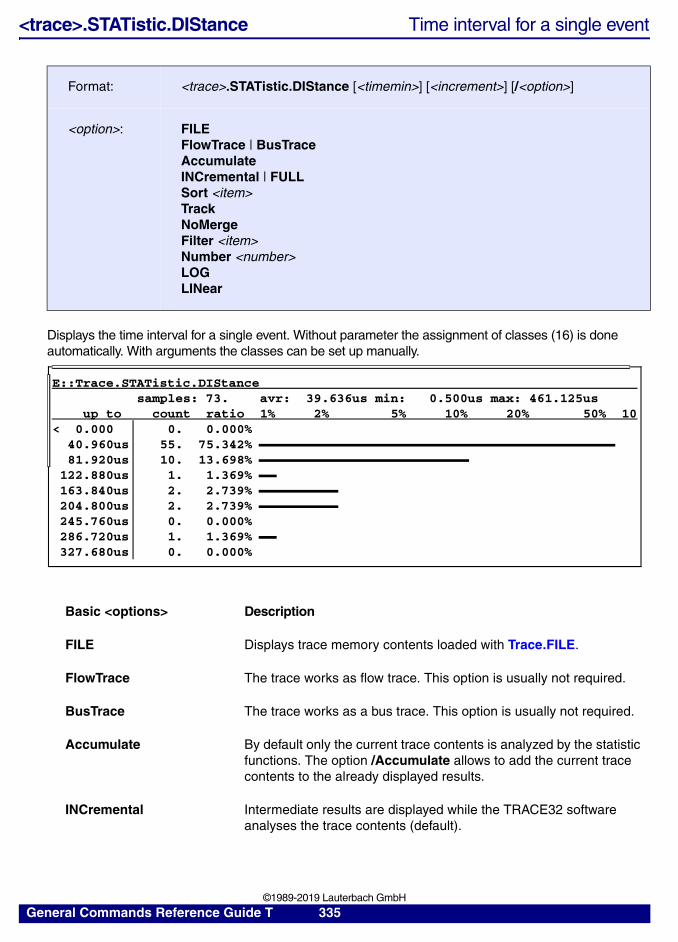
<trace>.STATistic.DIStance Time interval for a single event
Displays the time interval for a single event. Without parameter the assignment of classes (16) is done automatically. With arguments the classes can be set up manually.
Format: <trace>.STATistic.DIStance [<timemin>] [<increment>] [/<option>]
<option>: FILEFlowTrace | BusTraceAccumulate INCremental | FULL Sort <item>TrackNoMergeFilter <item>Number <number>LOGLINear
Basic <options> Description
FILE Displays trace memory contents loaded with Trace.FILE.
FlowTrace The trace works as flow trace. This option is usually not required.
BusTrace The trace works as a bus trace. This option is usually not required.
Accumulate By default only the current trace contents is analyzed by the statistic functions. The option /Accumulate allows to add the current trace contents to the already displayed results.
INCremental Intermediate results are displayed while the TRACE32 software analyses the trace contents (default).
E::Trace.STATistic.DIStancesamples: 73. avr: 39.636us min: 0.500us max: 461.125us
up to count ratio 1% 2% 5% 10% 20% 50% 10< 0.000 0. 0.000%
40.960us 55. 75.342%81.920us 10. 13.698%
122.880us 1. 1.369%163.840us 2. 2.739%204.800us 2. 2.739%245.760us 0. 0.000%286.720us 1. 1.369%327.680us 0. 0.000%
General Commands Reference Guide T 335 ©1989-2019 Lauterbach GmbH
Example for TRACE32-ICD and TRACE32-PowerTrace:
If no selective tracing is possible, use the option /Filter to filter out the event of interest.
If selective tracing is possible, use the /TraceEnable filter to extend the observation time:
FULL The result is displayed after the TRACE32 software finished the analysis.
Track Track the Trace.STATistic window with other trace list windows (tracking to record number or time possible).
NoMerge (For diagnosis purpose only).
Filter <item> Filter the described item.
Number Define the number of classes.
LOG Display the bars in the result display in a logarithmic format (default).
LINear Display the bars in the result display in a linear format.
B::Trace.SAVE measure1B::Trace.FILE measure1B::Trace.STATistic.DIStance /FILE
B::Trace.STATistic.DIStance /Accumulate
B::Trace.STATistic.DIStance /Number 10.
B::GoB::BreakB::Trace.STATistic.DIStance /FILTER Address InterruptEntry
B::Trace.STATistic.DIStance 10.ms 0.2ms /FILTER Address InterruptEntry
B::Break.Set InterruptEntry /Program /TraceEnableB::GoB::BreakB::Trace.STATistic.DIStance /FILTER Address InterruptEntry
Basic <options> Description
General Commands Reference Guide T 336 ©1989-2019 Lauterbach GmbH
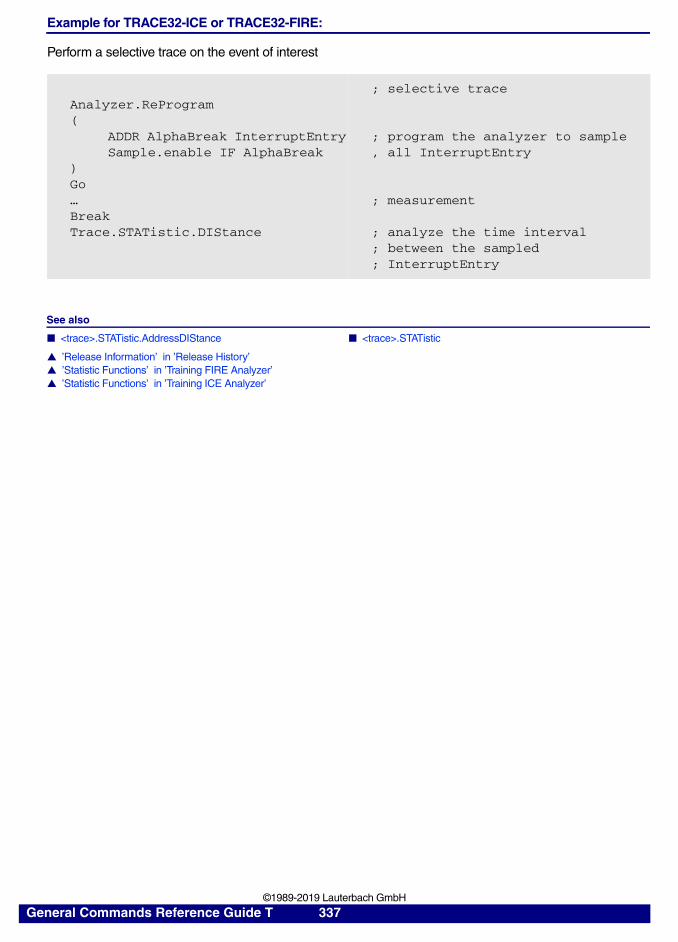
Example for TRACE32-ICE or TRACE32-FIRE:
Perform a selective trace on the event of interest
See also
■ <trace>.STATistic.AddressDIStance ■ <trace>.STATistic
▲ ’Release Information’ in ’Release History’▲ ’Statistic Functions’ in ’Training FIRE Analyzer’▲ ’Statistic Functions’ in ’Training ICE Analyzer’
Analyzer.ReProgram (
ADDR AlphaBreak InterruptEntrySample.enable IF AlphaBreak
)Go…BreakTrace.STATistic.DIStance
; selective trace
; program the analyzer to sample, all InterruptEntry
; measurement
; analyze the time interval; between the sampled; InterruptEntry
General Commands Reference Guide T 337 ©1989-2019 Lauterbach GmbH
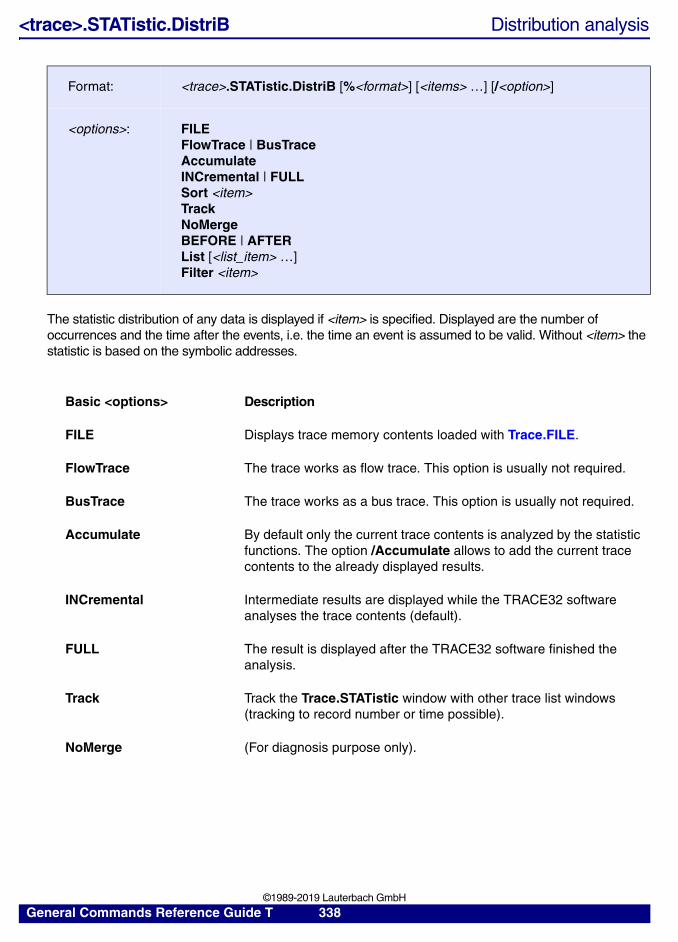
<trace>.STATistic.DistriB Distribution analysis
The statistic distribution of any data is displayed if <item> is specified. Displayed are the number of occurrences and the time after the events, i.e. the time an event is assumed to be valid. Without <item> the statistic is based on the symbolic addresses.
Format: <trace>.STATistic.DistriB [%<format>] [<items> …] [/<option>]
<options>: FILEFlowTrace | BusTraceAccumulate INCremental | FULL Sort <item>TrackNoMergeBEFORE | AFTERList [<list_item> …]Filter <item>
Basic <options> Description
FILE Displays trace memory contents loaded with Trace.FILE.
FlowTrace The trace works as flow trace. This option is usually not required.
BusTrace The trace works as a bus trace. This option is usually not required.
Accumulate By default only the current trace contents is analyzed by the statistic functions. The option /Accumulate allows to add the current trace contents to the already displayed results.
INCremental Intermediate results are displayed while the TRACE32 software analyses the trace contents (default).
FULL The result is displayed after the TRACE32 software finished the analysis.
Track Track the Trace.STATistic window with other trace list windows (tracking to record number or time possible).
NoMerge (For diagnosis purpose only).
General Commands Reference Guide T 338 ©1989-2019 Lauterbach GmbH
The List option defines which values are calculated and displayed. The <list_items> can be arranged by pushing the Config button in the Trace.STATistic.DistriB window.
All time displays depend on the options AFTER or BEFORE.
BEFORE Display the time before the event. That means how long the previous state lasted until the listed state was reached.
AFTER Display the time after the event. That means how long the state lasted after it was reached (default).
List <list_items> Specify the result that should be displayed in the window.
Filter <item> Filter the described item.
<list_item>
TIme Total time the event was true.
MIN, MAX Minimum and maximum time the event was true.
AVeRage Average time the event was true.
Count Number of occurrences of the event.
Ratio, BAR.log, BAR.LINear
Ratio of time spent in events to total measurement time in percent and as graphical bars.
CRatio, CBAR.log, CBAR.LINear
Ratio of count to total count in percent and as graphical bars.
General Commands Reference Guide T 339 ©1989-2019 Lauterbach GmbH
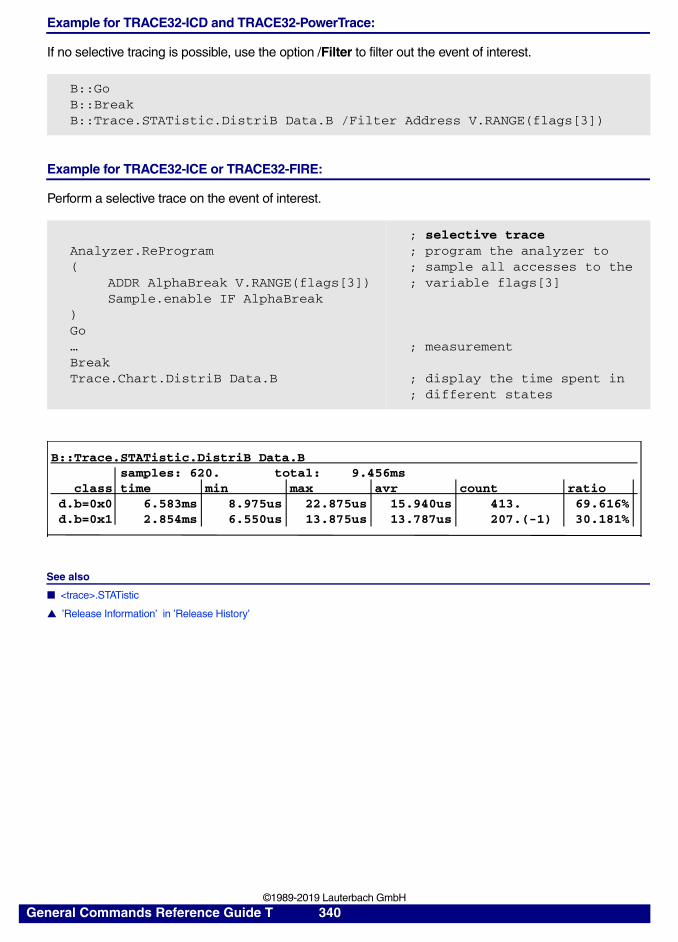
Example for TRACE32-ICD and TRACE32-PowerTrace:
If no selective tracing is possible, use the option /Filter to filter out the event of interest.
Example for TRACE32-ICE or TRACE32-FIRE:
Perform a selective trace on the event of interest.
See also
■ <trace>.STATistic
▲ ’Release Information’ in ’Release History’
B::GoB::BreakB::Trace.STATistic.DistriB Data.B /Filter Address V.RANGE(flags[3])
Analyzer.ReProgram (
ADDR AlphaBreak V.RANGE(flags[3])Sample.enable IF AlphaBreak
)Go…BreakTrace.Chart.DistriB Data.B
; selective trace; program the analyzer to; sample all accesses to the; variable flags[3]
; measurement
; display the time spent in; different states
B::Trace.STATistic.DistriB Data.Bsamples: 620. total: 9.456ms
class time min max avr count ratiod.b=0x0 6.583ms 8.975us 22.875us 15.940us 413. 69.616%d.b=0x1 2.854ms 6.550us 13.875us 13.787us 207.(-1) 30.181%
General Commands Reference Guide T 340 ©1989-2019 Lauterbach GmbH
<trace>.STATistic.DURation Time between two events
Analyzes the statistic distribution between two events.
Format: <trace>.STATistic.DURation [<timemin>] [<increment>] [/<option>]
<option>: FILEFlowTrace | BusTraceAccumulate INCremental | FULL ATOA | ATOB | ATOC | ATODBTOA | BTOB | BTOC | BTODCTOA | CTOB | CTOC | CTODDTOA | DTOB | DTOC | DTODFilterA <filter> | FilterB <filter>Number | LOG | LINear
<option> Basic Options
FILE Displays trace memory contents loaded with Trace.FILE.
FlowTrace The trace works as flow trace. This option is usually not required.
BusTrace The trace works as a bus trace. This option is usually not required.
Accumulate By default only the current trace contents is analyzed by the statistic functions. The option /Accumulate allows to add the current trace contents to the already displayed results.
INCremental Intermediate results are displayed while the TRACE32 software analyzes the trace contents (default).
FULL The result is displayed after the TRACE32 software finished the analysis.
Number Define the number of classes.
LOG Display the bars in the result display in a logarithmic format (default).
LINear Display the bars in the result display in a linear format.
General Commands Reference Guide T 341 ©1989-2019 Lauterbach GmbH
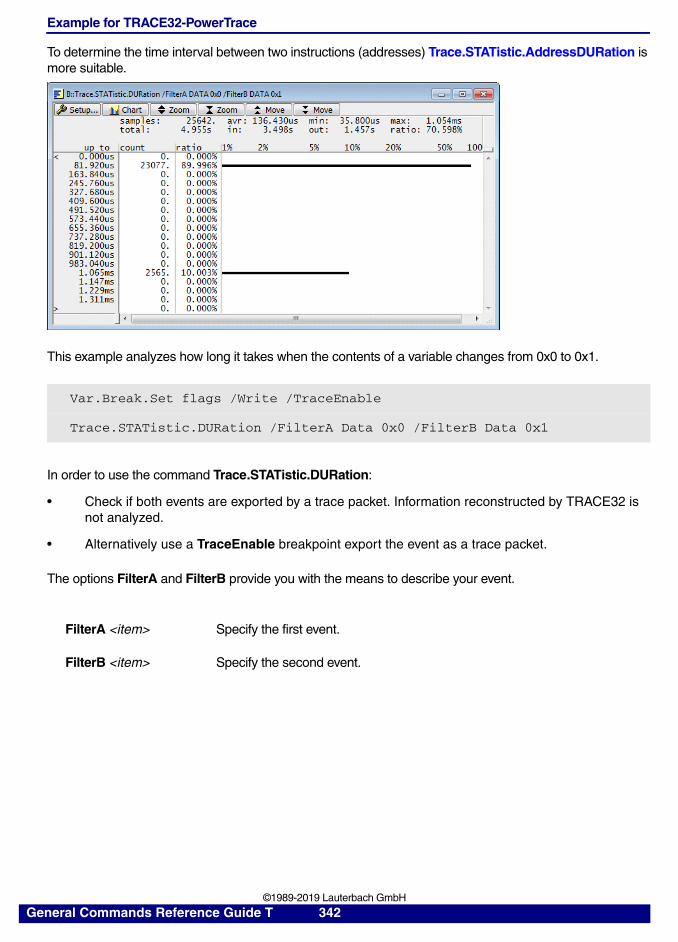
Example for TRACE32-PowerTrace
To determine the time interval between two instructions (addresses) Trace.STATistic.AddressDURation is more suitable.
This example analyzes how long it takes when the contents of a variable changes from 0x0 to 0x1.
In order to use the command Trace.STATistic.DURation:
• Check if both events are exported by a trace packet. Information reconstructed by TRACE32 is not analyzed.
• Alternatively use a TraceEnable breakpoint export the event as a trace packet.
The options FilterA and FilterB provide you with the means to describe your event.
Var.Break.Set flags /Write /TraceEnable
Trace.STATistic.DURation /FilterA Data 0x0 /FilterB Data 0x1
FilterA <item> Specify the first event.
FilterB <item> Specify the second event.
General Commands Reference Guide T 342 ©1989-2019 Lauterbach GmbH
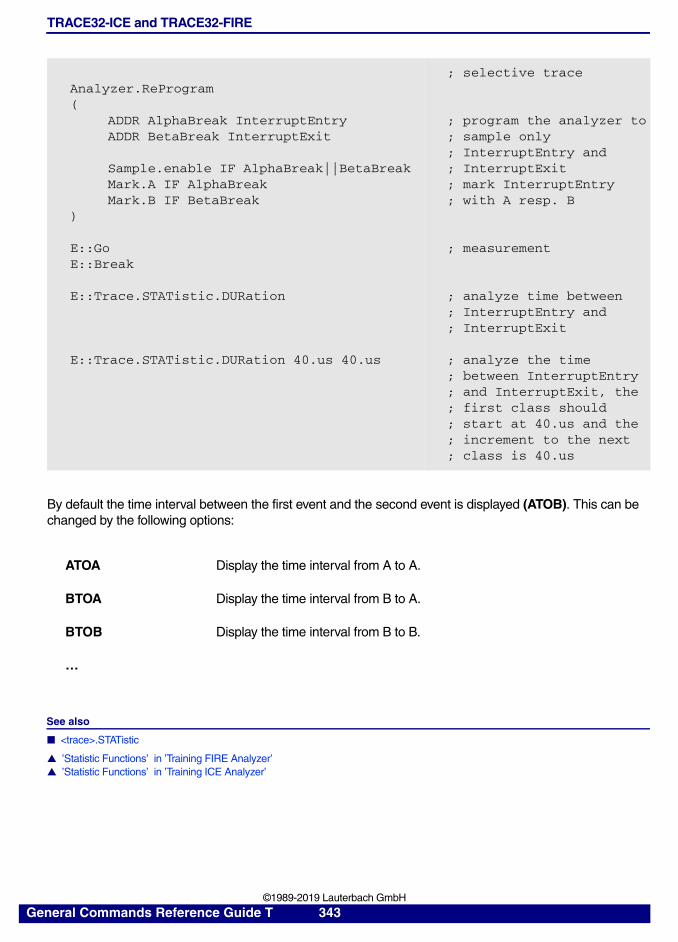
TRACE32-ICE and TRACE32-FIRE
By default the time interval between the first event and the second event is displayed (ATOB). This can be changed by the following options:
See also
■ <trace>.STATistic
▲ ’Statistic Functions’ in ’Training FIRE Analyzer’▲ ’Statistic Functions’ in ’Training ICE Analyzer’
Analyzer.ReProgram (
ADDR AlphaBreak InterruptEntryADDR BetaBreak InterruptExit
Sample.enable IF AlphaBreak||BetaBreakMark.A IF AlphaBreakMark.B IF BetaBreak
)
E::GoE::Break
E::Trace.STATistic.DURation
E::Trace.STATistic.DURation 40.us 40.us
; selective trace
; program the analyzer to; sample only; InterruptEntry and; InterruptExit; mark InterruptEntry; with A resp. B
; measurement
; analyze time between; InterruptEntry and; InterruptExit
; analyze the time; between InterruptEntry; and InterruptExit, the; first class should; start at 40.us and the; increment to the next; class is 40.us
ATOA Display the time interval from A to A.
BTOA Display the time interval from B to A.
BTOB Display the time interval from B to B.
…
General Commands Reference Guide T 343 ©1989-2019 Lauterbach GmbH
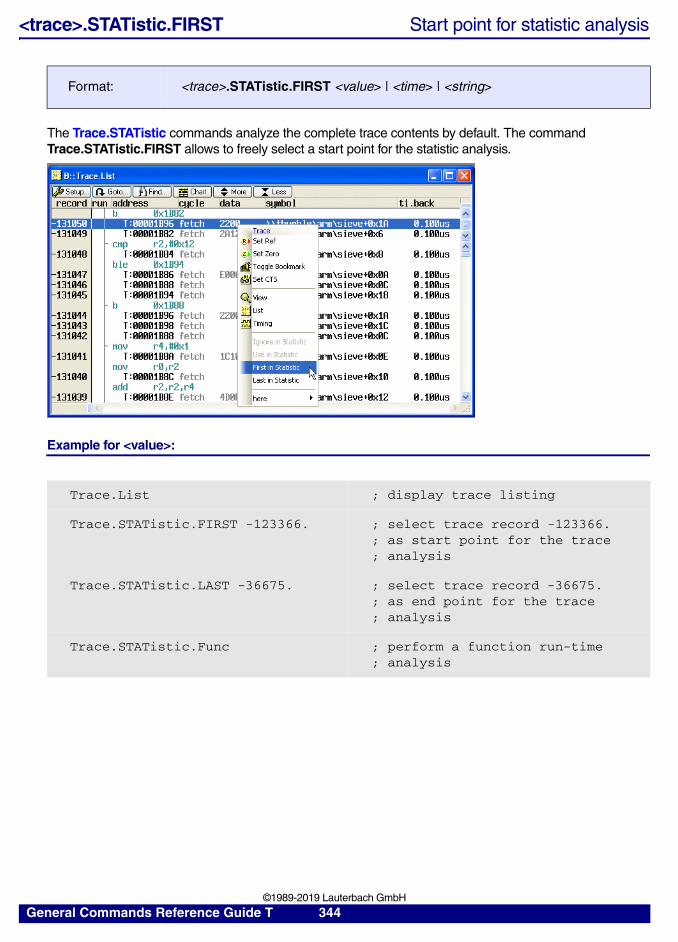
<trace>.STATistic.FIRST Start point for statistic analysis
The Trace.STATistic commands analyze the complete trace contents by default. The command Trace.STATistic.FIRST allows to freely select a start point for the statistic analysis.
Example for <value>:
Format: <trace>.STATistic.FIRST <value> | <time> | <string>
Trace.List ; display trace listing
Trace.STATistic.FIRST -123366. ; select trace record -123366.; as start point for the trace; analysis
Trace.STATistic.LAST -36675. ; select trace record -36675.; as end point for the trace; analysis
Trace.STATistic.Func ; perform a function run-time; analysis
General Commands Reference Guide T 344 ©1989-2019 Lauterbach GmbH
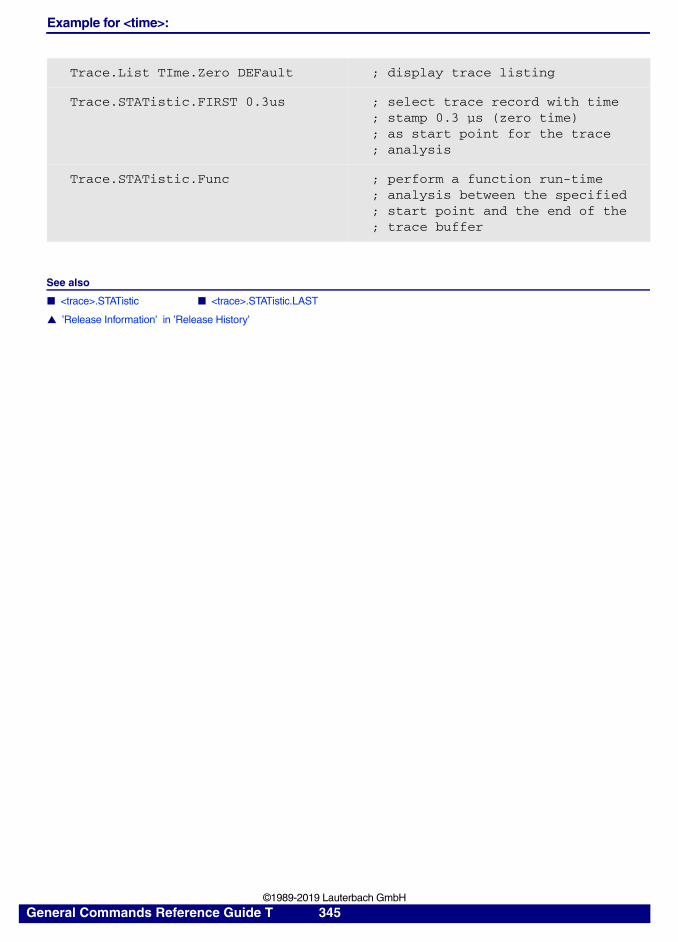
Example for <time>:
See also
■ <trace>.STATistic ■ <trace>.STATistic.LAST
▲ ’Release Information’ in ’Release History’
Trace.List TIme.Zero DEFault ; display trace listing
Trace.STATistic.FIRST 0.3us ; select trace record with time; stamp 0.3 µs (zero time); as start point for the trace; analysis
Trace.STATistic.Func ; perform a function run-time; analysis between the specified; start point and the end of the; trace buffer
General Commands Reference Guide T 345 ©1989-2019 Lauterbach GmbH
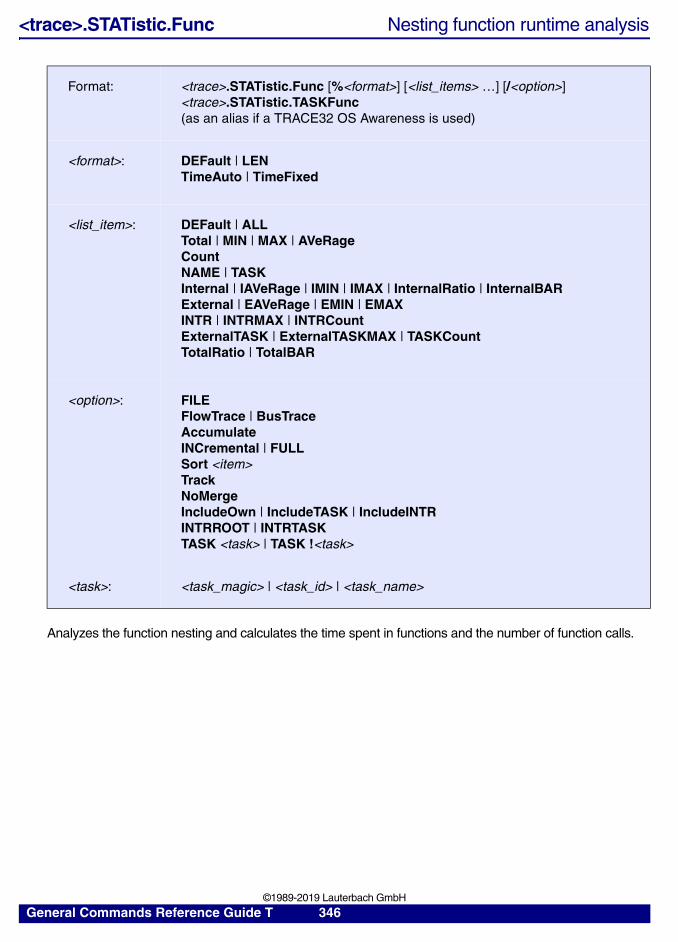
<trace>.STATistic.Func Nesting function runtime analysis
Analyzes the function nesting and calculates the time spent in functions and the number of function calls.
Format: <trace>.STATistic.Func [%<format>] [<list_items> …] [/<option>]<trace>.STATistic.TASKFunc (as an alias if a TRACE32 OS Awareness is used)
<format>: DEFault | LENTimeAuto | TimeFixed
<list_item>: DEFault | ALLTotal | MIN | MAX | AVeRage Count NAME | TASKInternal | IAVeRage | IMIN | IMAX | InternalRatio | InternalBARExternal | EAVeRage | EMIN | EMAXINTR | INTRMAX | INTRCount ExternalTASK | ExternalTASKMAX | TASKCountTotalRatio | TotalBAR
<option>: FILEFlowTrace | BusTraceAccumulate INCremental | FULL Sort <item>TrackNoMergeIncludeOwn | IncludeTASK | IncludeINTRINTRROOT | INTRTASKTASK <task> | TASK !<task>
<task>: <task_magic> | <task_id> | <task_name>
General Commands Reference Guide T 346 ©1989-2019 Lauterbach GmbH
PowerTrace
Considerations
The trace can be tested for FIFOFULLs as follows:
If it is not possible to eliminate the FIFOFULLs, it is recommended to use the command Trace.STATistic.sYmbol.
Please be aware that any gap in the trace recording (FIFOFULL) might result in a incorrect analysis results.
; Process the complete trace contentsTrace.FLOWPROCESS
IF A.FLOW.FIFOFULL()!=0PRINT "Trace.STATistic.Func not possible due to FIFOFULL errors."
General Commands Reference Guide T 347 ©1989-2019 Lauterbach GmbH
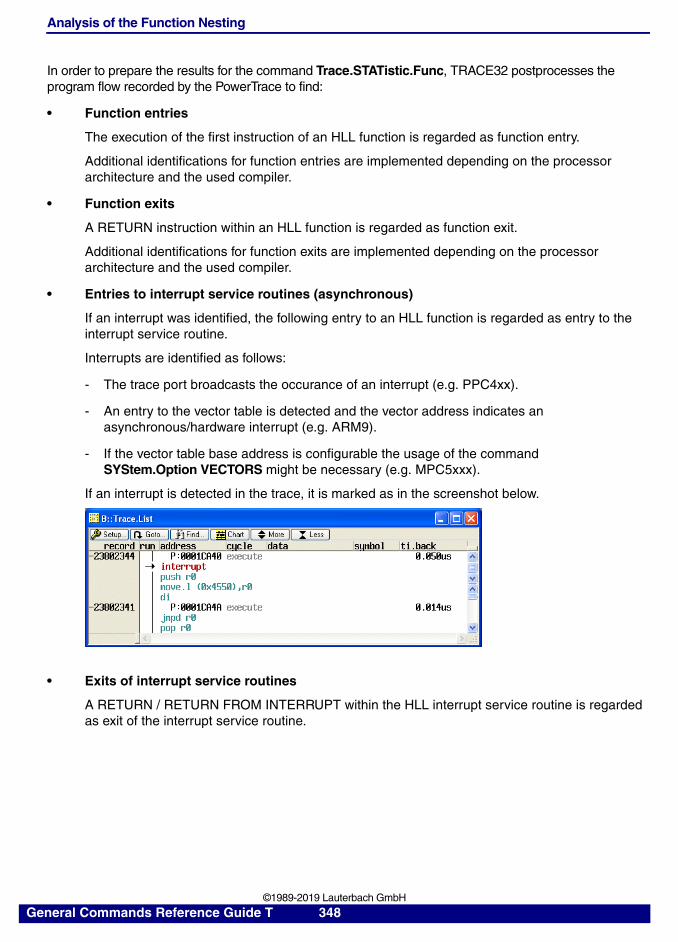
Analysis of the Function Nesting
In order to prepare the results for the command Trace.STATistic.Func, TRACE32 postprocesses the program flow recorded by the PowerTrace to find:
• Function entries
The execution of the first instruction of an HLL function is regarded as function entry.
Additional identifications for function entries are implemented depending on the processor architecture and the used compiler.
• Function exits
A RETURN instruction within an HLL function is regarded as function exit.
Additional identifications for function exits are implemented depending on the processor architecture and the used compiler.
• Entries to interrupt service routines (asynchronous)
If an interrupt was identified, the following entry to an HLL function is regarded as entry to the interrupt service routine.
Interrupts are identified as follows:
- The trace port broadcasts the occurance of an interrupt (e.g. PPC4xx).
- An entry to the vector table is detected and the vector address indicates an asynchronous/hardware interrupt (e.g. ARM9).
- If the vector table base address is configurable the usage of the command SYStem.Option VECTORS might be necessary (e.g. MPC5xxx).
If an interrupt is detected in the trace, it is marked as in the screenshot below.
• Exits of interrupt service routines
A RETURN / RETURN FROM INTERRUPT within the HLL interrupt service routine is regarded as exit of the interrupt service routine.
General Commands Reference Guide T 348 ©1989-2019 Lauterbach GmbH
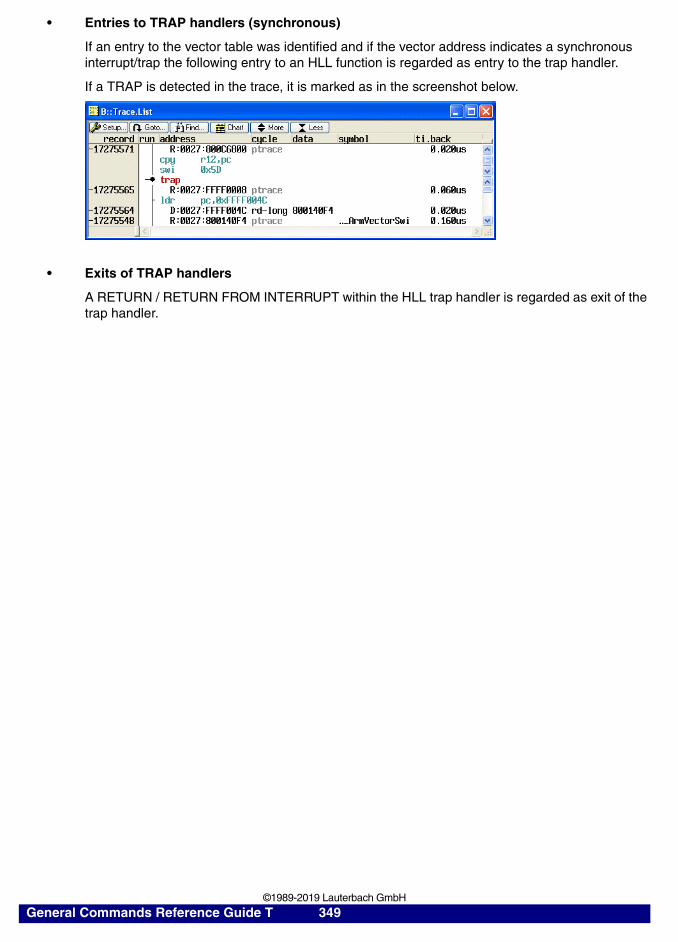
• Entries to TRAP handlers (synchronous)
If an entry to the vector table was identified and if the vector address indicates a synchronous interrupt/trap the following entry to an HLL function is regarded as entry to the trap handler.
If a TRAP is detected in the trace, it is marked as in the screenshot below.
• Exits of TRAP handlers
A RETURN / RETURN FROM INTERRUPT within the HLL trap handler is regarded as exit of the trap handler.
General Commands Reference Guide T 349 ©1989-2019 Lauterbach GmbH
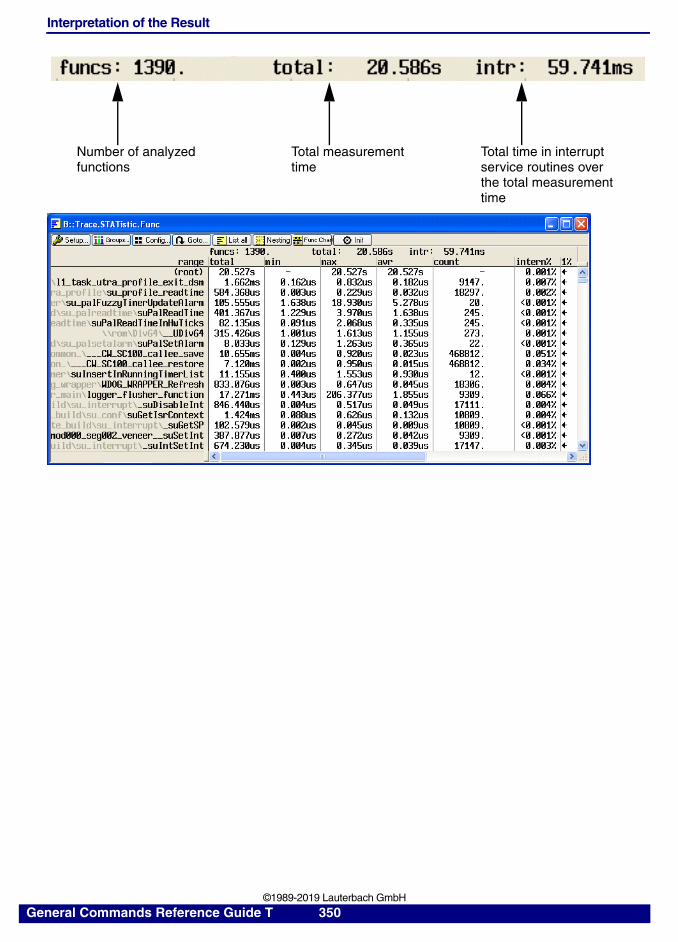
Interpretation of the Result
Number of analyzedfunctions
Total measurementtime
Total time in interrupt service routines overthe total measurement time
General Commands Reference Guide T 350 ©1989-2019 Lauterbach GmbH
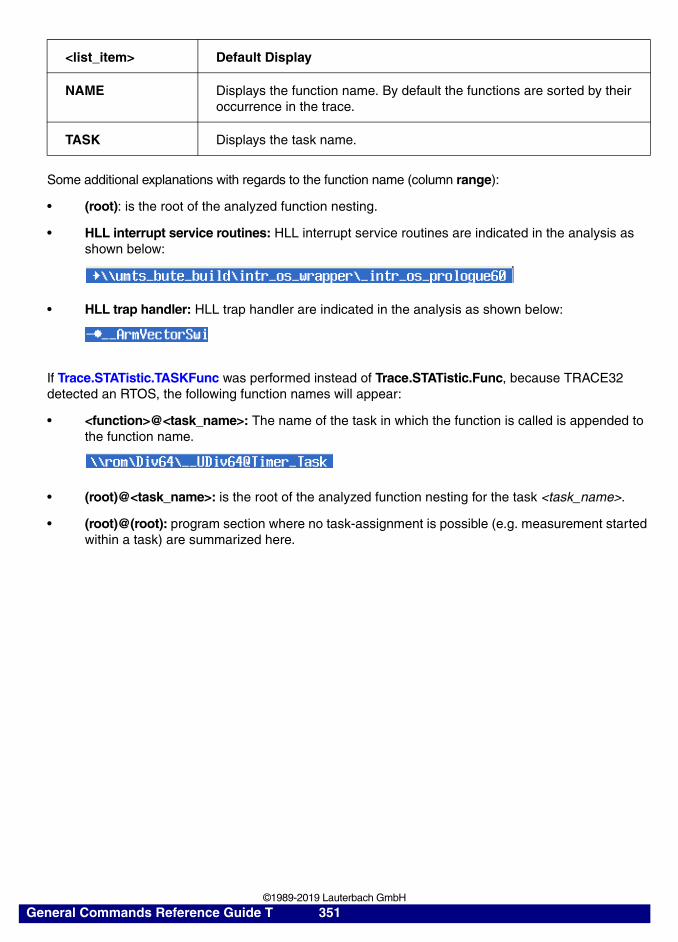
Some additional explanations with regards to the function name (column range):
• (root): is the root of the analyzed function nesting.
• HLL interrupt service routines: HLL interrupt service routines are indicated in the analysis as shown below:
• HLL trap handler: HLL trap handler are indicated in the analysis as shown below:
If Trace.STATistic.TASKFunc was performed instead of Trace.STATistic.Func, because TRACE32 detected an RTOS, the following function names will appear:
• <function>@<task_name>: The name of the task in which the function is called is appended to the function name.
• (root)@<task_name>: is the root of the analyzed function nesting for the task <task_name>.
• (root)@(root): program section where no task-assignment is possible (e.g. measurement started within a task) are summarized here.
<list_item> Default Display
NAME Displays the function name. By default the functions are sorted by their occurrence in the trace.
TASK Displays the task name.
General Commands Reference Guide T 351 ©1989-2019 Lauterbach GmbH
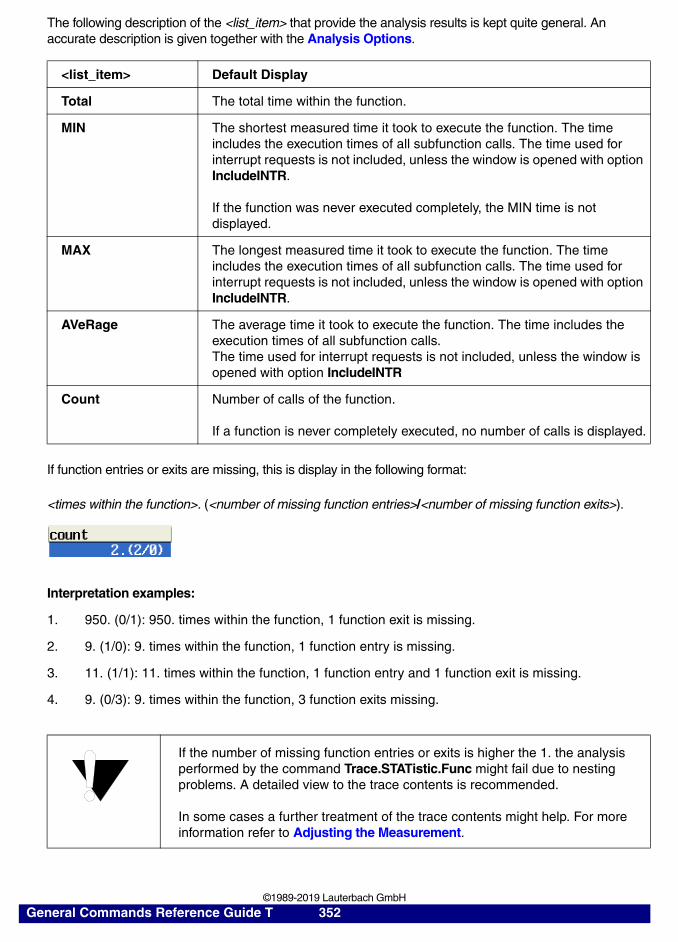
The following description of the <list_item> that provide the analysis results is kept quite general. An accurate description is given together with the Analysis Options.
If function entries or exits are missing, this is display in the following format:
<times within the function>. (<number of missing function entries>/<number of missing function exits>).
Interpretation examples:
1. 950. (0/1): 950. times within the function, 1 function exit is missing.
2. 9. (1/0): 9. times within the function, 1 function entry is missing.
3. 11. (1/1): 11. times within the function, 1 function entry and 1 function exit is missing.
4. 9. (0/3): 9. times within the function, 3 function exits missing.
<list_item> Default Display
Total The total time within the function.
MIN The shortest measured time it took to execute the function. The time includes the execution times of all subfunction calls. The time used for interrupt requests is not included, unless the window is opened with option IncludeINTR.
If the function was never executed completely, the MIN time is not displayed.
MAX The longest measured time it took to execute the function. The time includes the execution times of all subfunction calls. The time used for interrupt requests is not included, unless the window is opened with option IncludeINTR.
AVeRage The average time it took to execute the function. The time includes the execution times of all subfunction calls.The time used for interrupt requests is not included, unless the window is opened with option IncludeINTR
Count Number of calls of the function.
If a function is never completely executed, no number of calls is displayed.
If the number of missing function entries or exits is higher the 1. the analysis performed by the command Trace.STATistic.Func might fail due to nesting problems. A detailed view to the trace contents is recommended.
In some cases a further treatment of the trace contents might help. For more information refer to Adjusting the Measurement.
General Commands Reference Guide T 352 ©1989-2019 Lauterbach GmbH
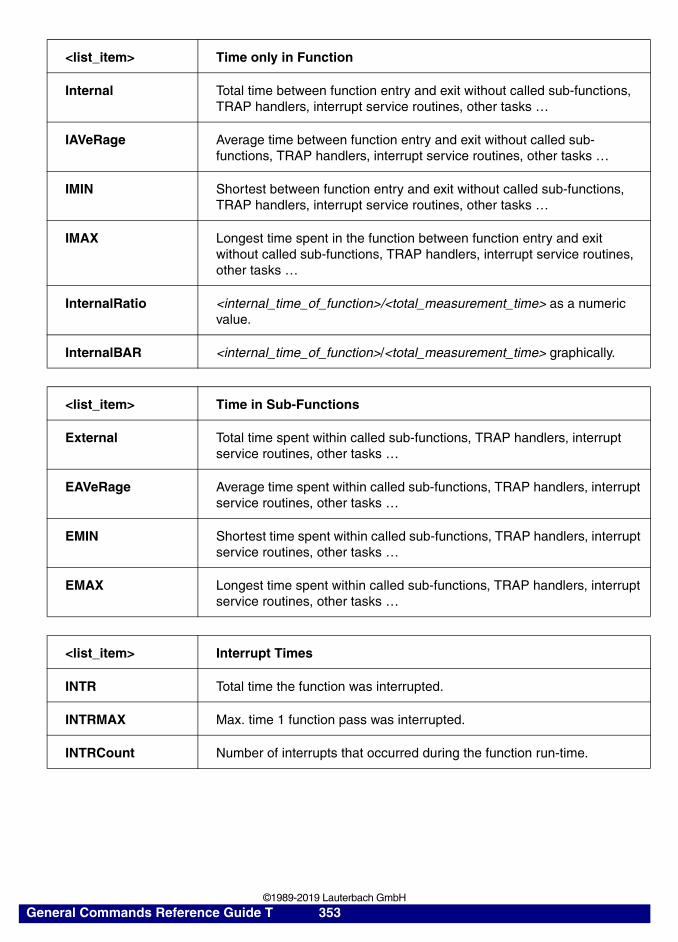
<list_item> Time only in Function
Internal Total time between function entry and exit without called sub-functions, TRAP handlers, interrupt service routines, other tasks …
IAVeRage Average time between function entry and exit without called sub-functions, TRAP handlers, interrupt service routines, other tasks …
IMIN Shortest between function entry and exit without called sub-functions, TRAP handlers, interrupt service routines, other tasks …
IMAX Longest time spent in the function between function entry and exit without called sub-functions, TRAP handlers, interrupt service routines, other tasks …
InternalRatio <internal_time_of_function>/<total_measurement_time> as a numeric value.
InternalBAR <internal_time_of_function>/<total_measurement_time> graphically.
<list_item> Time in Sub-Functions
External Total time spent within called sub-functions, TRAP handlers, interrupt service routines, other tasks …
EAVeRage Average time spent within called sub-functions, TRAP handlers, interrupt service routines, other tasks …
EMIN Shortest time spent within called sub-functions, TRAP handlers, interrupt service routines, other tasks …
EMAX Longest time spent within called sub-functions, TRAP handlers, interrupt service routines, other tasks …
<list_item> Interrupt Times
INTR Total time the function was interrupted.
INTRMAX Max. time 1 function pass was interrupted.
INTRCount Number of interrupts that occurred during the function run-time.
General Commands Reference Guide T 353 ©1989-2019 Lauterbach GmbH
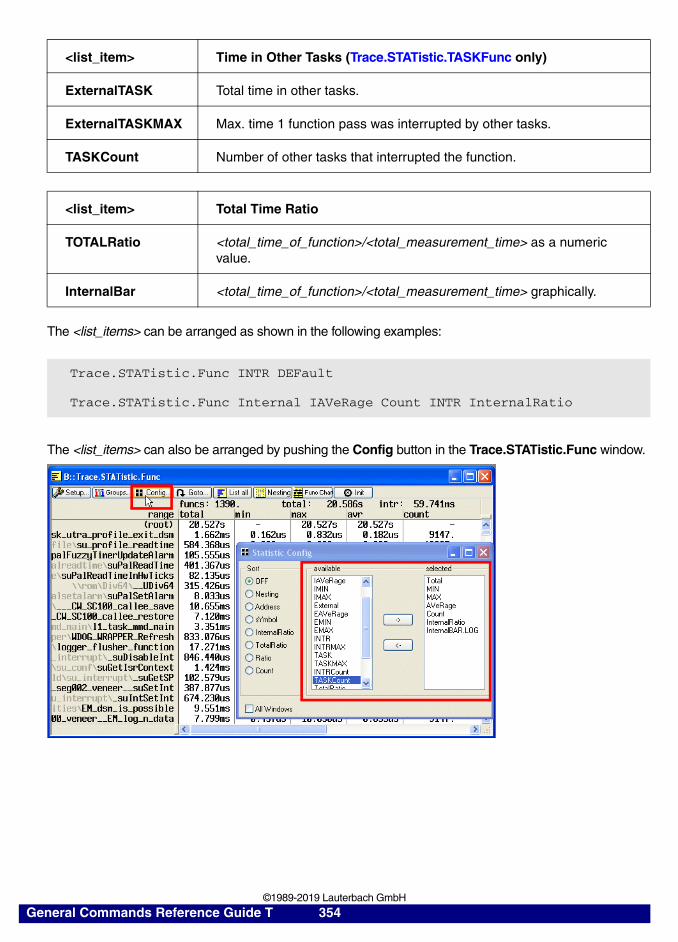
The <list_items> can be arranged as shown in the following examples:
The <list_items> can also be arranged by pushing the Config button in the Trace.STATistic.Func window.
<list_item> Time in Other Tasks (Trace.STATistic.TASKFunc only)
ExternalTASK Total time in other tasks.
ExternalTASKMAX Max. time 1 function pass was interrupted by other tasks.
TASKCount Number of other tasks that interrupted the function.
<list_item> Total Time Ratio
TOTALRatio <total_time_of_function>/<total_measurement_time> as a numeric value.
InternalBar <total_time_of_function>/<total_measurement_time> graphically.
Trace.STATistic.Func INTR DEFault
Trace.STATistic.Func Internal IAVeRage Count INTR InternalRatio
General Commands Reference Guide T 354 ©1989-2019 Lauterbach GmbH
Basic Options
Basic <options> Description
FILE Displays trace memory contents loaded with Trace.FILE.
FlowTrace The trace works as flow trace. This option is usually not required.
BusTrace The trace works as a bus trace. This option is usually not required.
Accumulate By default only the current trace contents is analyzed by the statistic functions. The option /Accumulate allows to add the current trace contents to the already displayed results.
INCremental Intermediate results are displayed while the TRACE32 software analyses the trace contents (default).
FULL The result is displayed after the TRACE32 software finished the analysis.
Track Track the Trace.STATistic window with other trace list windows (tracking to record number or time possible).
NoMerge (For diagnosis purpose only).
General Commands Reference Guide T 355 ©1989-2019 Lauterbach GmbH
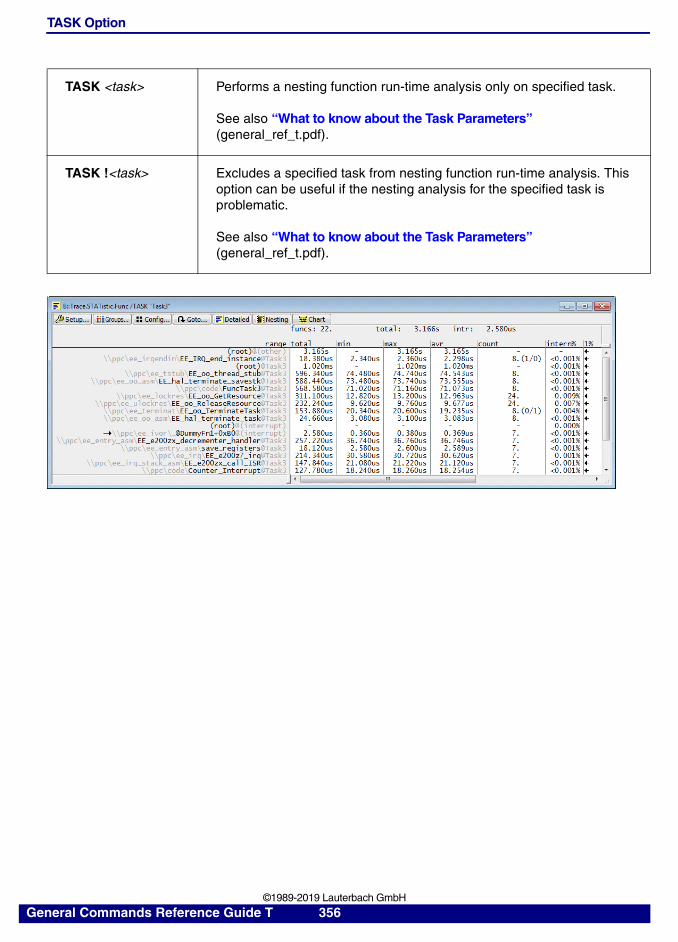
TASK Option
TASK <task> Performs a nesting function run-time analysis only on specified task.
See also “What to know about the Task Parameters” (general_ref_t.pdf).
TASK !<task> Excludes a specified task from nesting function run-time analysis. This option can be useful if the nesting analysis for the specified task is problematic.
See also “What to know about the Task Parameters” (general_ref_t.pdf).
General Commands Reference Guide T 356 ©1989-2019 Lauterbach GmbH
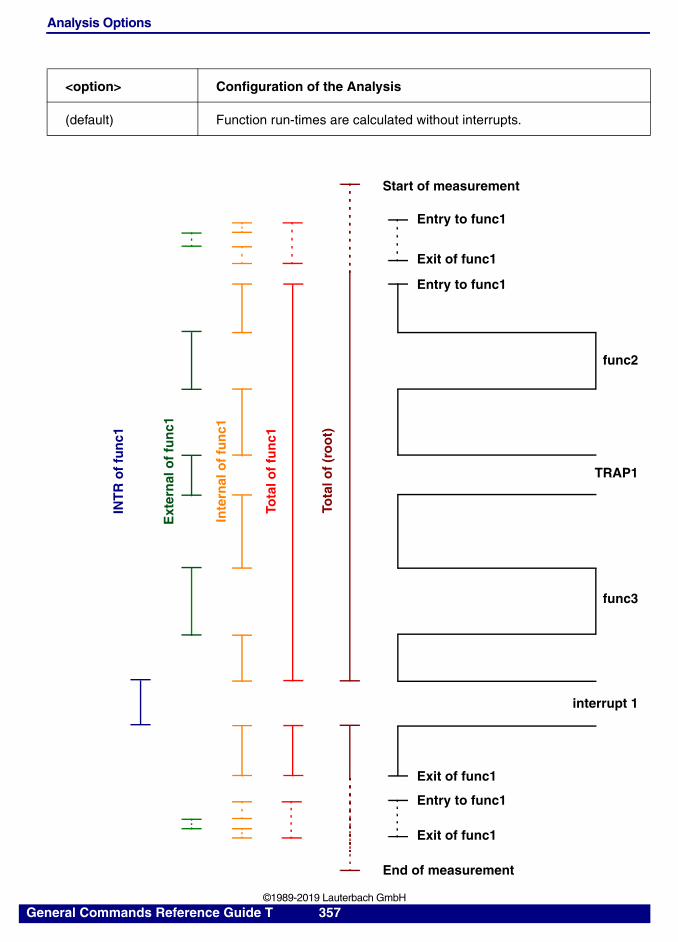
Analysis Options
<option> Configuration of the Analysis
(default) Function run-times are calculated without interrupts.
Entry to func1
func2
TRAP1
func3
interrupt 1
Exit of func1
Tota
l of
(ro
ot)
Start of measurement
End of measurement
Tota
l of
fun
c1
Inte
rnal
of
fun
c1
Ext
ern
al o
f fu
nc1
INT
R o
f fu
nc1
Entry to func1
Exit of func1
Exit of func1
Entry to func1
General Commands Reference Guide T 357 ©1989-2019 Lauterbach GmbH
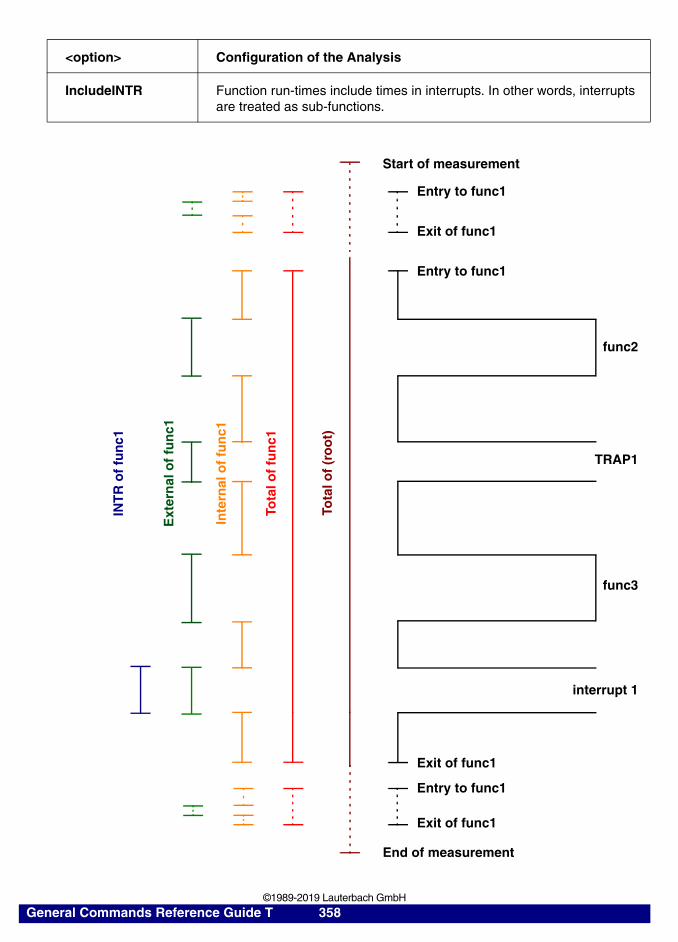
<option> Configuration of the Analysis
IncludeINTR Function run-times include times in interrupts. In other words, interrupts are treated as sub-functions.
Entry to func1
func2
TRAP1
func3
interrupt 1
Exit of func1
Tota
l of
(ro
ot)
Start of measurement
End of measurement
Tota
l of
fun
c1
Inte
rnal
of
fun
c1
Ext
ern
al o
f fu
nc1
INT
R o
f fu
nc1
Entry to func1
Exit of func1
Exit of func1
Entry to func1
General Commands Reference Guide T 358 ©1989-2019 Lauterbach GmbH
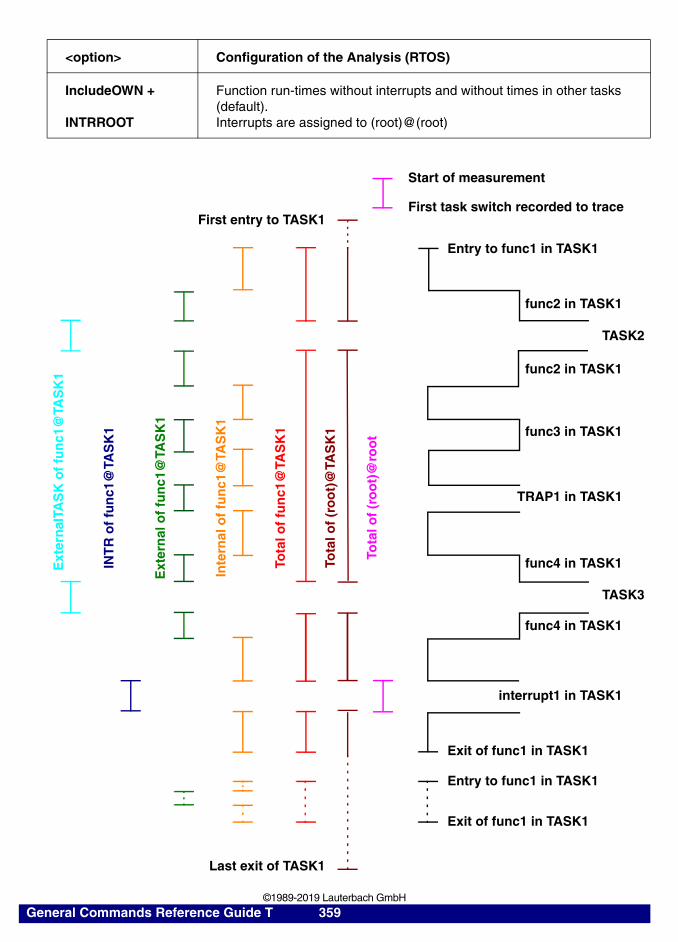
<option> Configuration of the Analysis (RTOS)
IncludeOWN +
INTRROOT
Function run-times without interrupts and without times in other tasks (default). Interrupts are assigned to (root)@(root)
Entry to func1 in TASK1
func2 in TASK1
TASK2
func2 in TASK1
func3 in TASK1
TRAP1 in TASK1
func4 in TASK1
TASK3
func4 in TASK1
interrupt1 in TASK1
Exit of func1 in TASK1
Tota
l of
(ro
ot)
@ro
ot
Start of measurement
First entry to TASK1
Last exit of TASK1
Tota
l of
(ro
ot)
@TA
SK
1
Inte
rnal
of
fun
c1@
TAS
K1
Ext
ern
al o
f fu
nc1
@TA
SK
1
INT
R o
f fu
nc1
@TA
SK
1
Ext
ern
alTA
SK
of
fun
c1@
TAS
K1
First task switch recorded to trace
Tota
l of
fun
c1@
TAS
K1
Entry to func1 in TASK1
Exit of func1 in TASK1
General Commands Reference Guide T 359 ©1989-2019 Lauterbach GmbH
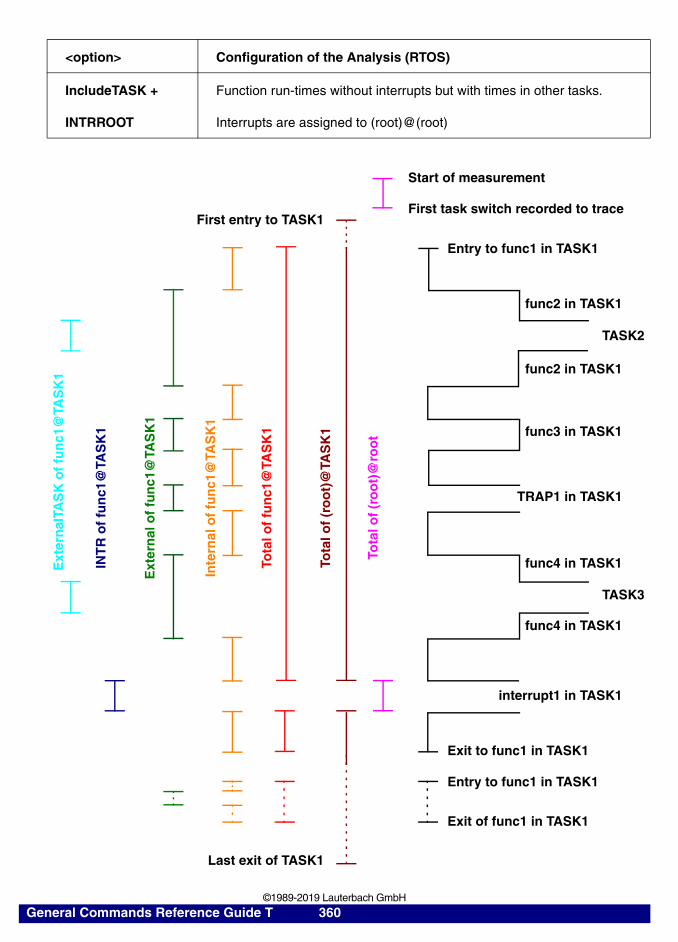
<option> Configuration of the Analysis (RTOS)
IncludeTASK +
INTRROOT
Function run-times without interrupts but with times in other tasks.
Interrupts are assigned to (root)@(root)
Entry to func1 in TASK1
func2 in TASK1
TASK2
func2 in TASK1
func3 in TASK1
TRAP1 in TASK1
func4 in TASK1
TASK3
func4 in TASK1
interrupt1 in TASK1
Exit to func1 in TASK1
Tota
l of
(ro
ot)
@ro
ot
Start of measurement
First entry to TASK1
Last exit of TASK1
Tota
l of
(ro
ot)
@TA
SK
1
Inte
rnal
of
fun
c1@
TAS
K1
Ext
ern
al o
f fu
nc1
@TA
SK
1
INT
R o
f fu
nc1
@TA
SK
1
Ext
ern
alTA
SK
of
fun
c1@
TAS
K1
First task switch recorded to trace
Tota
l of
fun
c1@
TAS
K1
Entry to func1 in TASK1
Exit of func1 in TASK1
General Commands Reference Guide T 360 ©1989-2019 Lauterbach GmbH
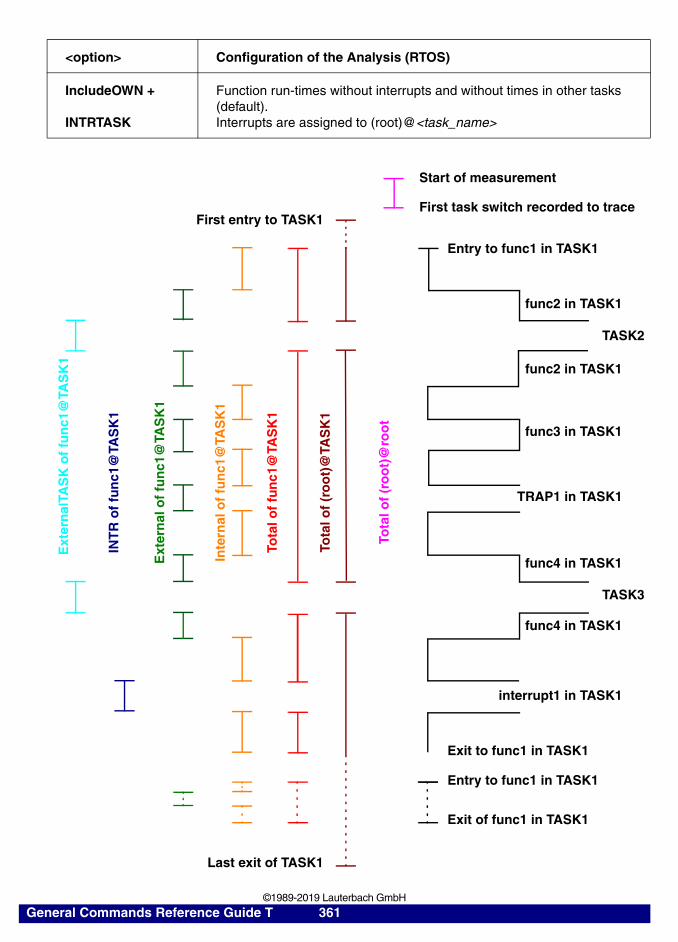
<option> Configuration of the Analysis (RTOS)
IncludeOWN +
INTRTASK
Function run-times without interrupts and without times in other tasks (default). Interrupts are assigned to (root)@<task_name>
Entry to func1 in TASK1
func2 in TASK1
TASK2
func2 in TASK1
func3 in TASK1
TRAP1 in TASK1
func4 in TASK1
TASK3
func4 in TASK1
interrupt1 in TASK1
Exit to func1 in TASK1
Tota
l of
(ro
ot)
@ro
ot
Start of measurement
First entry to TASK1
Last exit of TASK1
Tota
l of
(ro
ot)
@TA
SK
1
Inte
rnal
of
fun
c1@
TAS
K1
INT
R o
f fu
nc1
@TA
SK
1
Ext
ern
alTA
SK
of
fun
c1@
TAS
K1
First task switch recorded to trace
Tota
l of
fun
c1@
TAS
K1
Ext
ern
al o
f fu
nc1
@TA
SK
1
Entry to func1 in TASK1
Exit of func1 in TASK1
General Commands Reference Guide T 361 ©1989-2019 Lauterbach GmbH
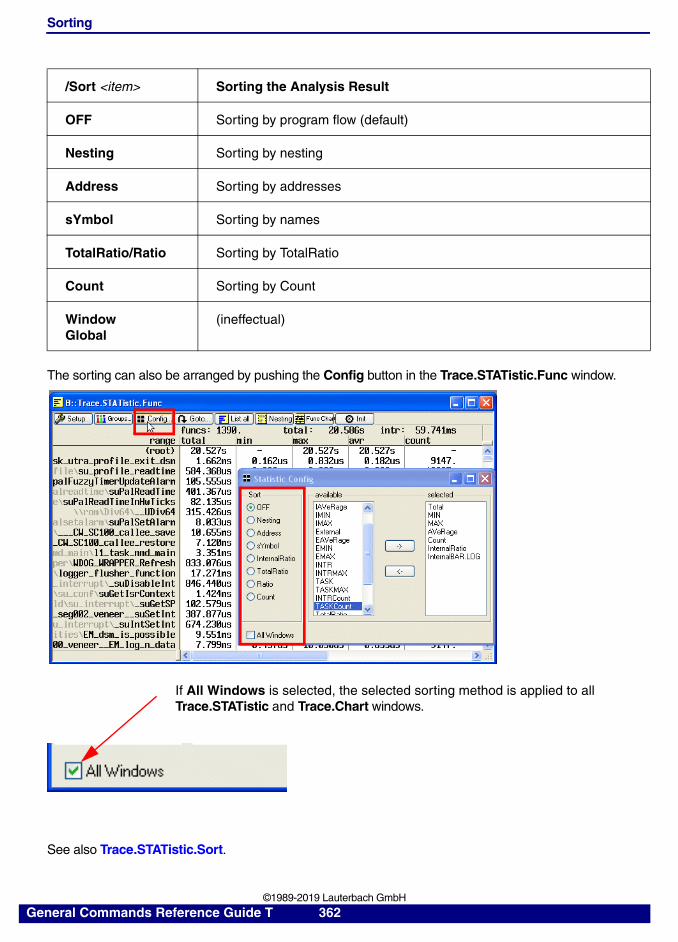
Sorting
The sorting can also be arranged by pushing the Config button in the Trace.STATistic.Func window.
See also Trace.STATistic.Sort.
/Sort <item> Sorting the Analysis Result
OFF Sorting by program flow (default)
Nesting Sorting by nesting
Address Sorting by addresses
sYmbol Sorting by names
TotalRatio/Ratio Sorting by TotalRatio
Count Sorting by Count
WindowGlobal
(ineffectual)
If All Windows is selected, the selected sorting method is applied to all Trace.STATistic and Trace.Chart windows.
General Commands Reference Guide T 362 ©1989-2019 Lauterbach GmbH
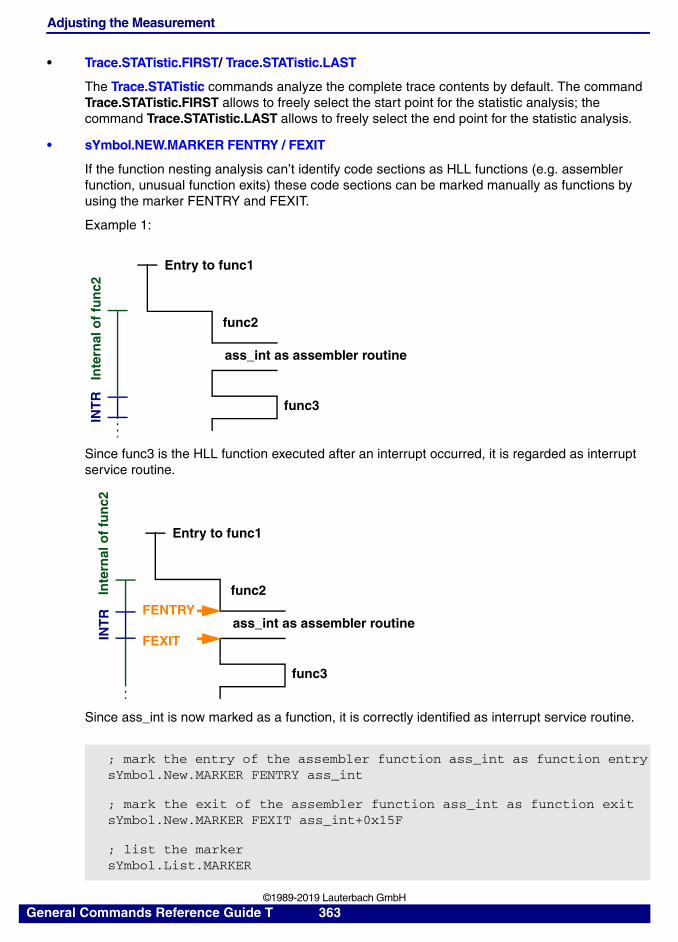
Adjusting the Measurement
• Trace.STATistic.FIRST/ Trace.STATistic.LAST
The Trace.STATistic commands analyze the complete trace contents by default. The command Trace.STATistic.FIRST allows to freely select the start point for the statistic analysis; the command Trace.STATistic.LAST allows to freely select the end point for the statistic analysis.
• sYmbol.NEW.MARKER FENTRY / FEXIT
If the function nesting analysis can’t identify code sections as HLL functions (e.g. assembler function, unusual function exits) these code sections can be marked manually as functions by using the marker FENTRY and FEXIT.
Example 1:
Since func3 is the HLL function executed after an interrupt occurred, it is regarded as interrupt service routine.
Since ass_int is now marked as a function, it is correctly identified as interrupt service routine.
; mark the entry of the assembler function ass_int as function entrysYmbol.New.MARKER FENTRY ass_int
; mark the exit of the assembler function ass_int as function exitsYmbol.New.MARKER FEXIT ass_int+0x15F
; list the markersYmbol.List.MARKER
Entry to func1
func2
ass_int as assembler routine
func3
INT
RIn
tern
al o
f fu
nc2
Entry to func1
func2
ass_int as assembler routine
func3
INT
R FENTRY
FEXIT
Inte
rnal
of
fun
c2
General Commands Reference Guide T 363 ©1989-2019 Lauterbach GmbH
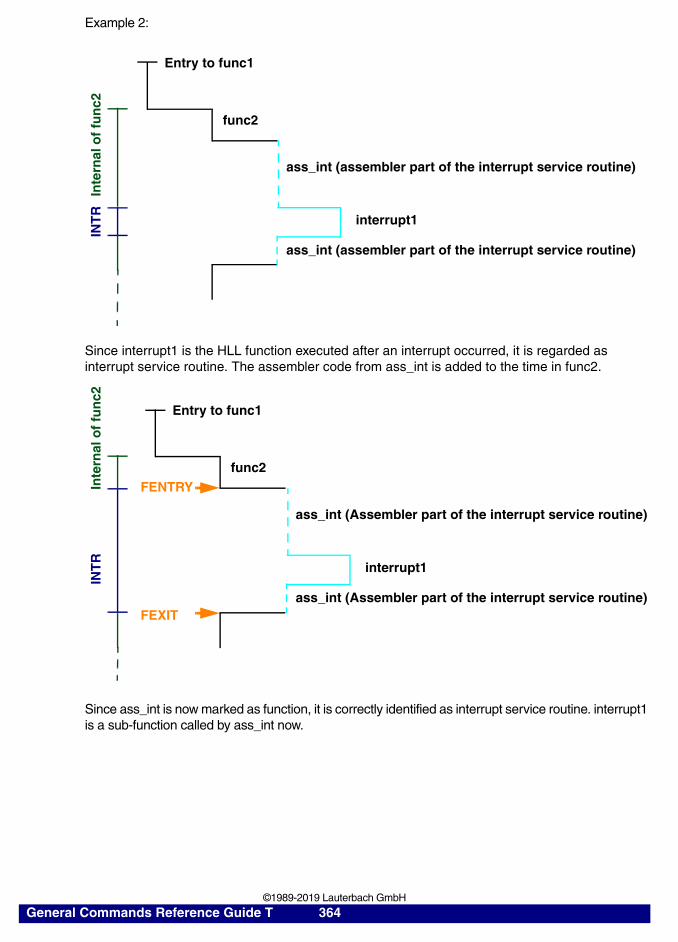
Example 2:
Since interrupt1 is the HLL function executed after an interrupt occurred, it is regarded as interrupt service routine. The assembler code from ass_int is added to the time in func2.
Since ass_int is now marked as function, it is correctly identified as interrupt service routine. interrupt1 is a sub-function called by ass_int now.
Entry to func1
func2
INT
R
ass_int (assembler part of the interrupt service routine)
Inte
rnal
of
fun
c2
ass_int (assembler part of the interrupt service routine)
interrupt1
Entry to func1
func2
INT
RIn
tern
al o
f fu
nc2
FENTRY
FEXIT
ass_int (Assembler part of the interrupt service routine)
ass_int (Assembler part of the interrupt service routine)
interrupt1
General Commands Reference Guide T 364 ©1989-2019 Lauterbach GmbH
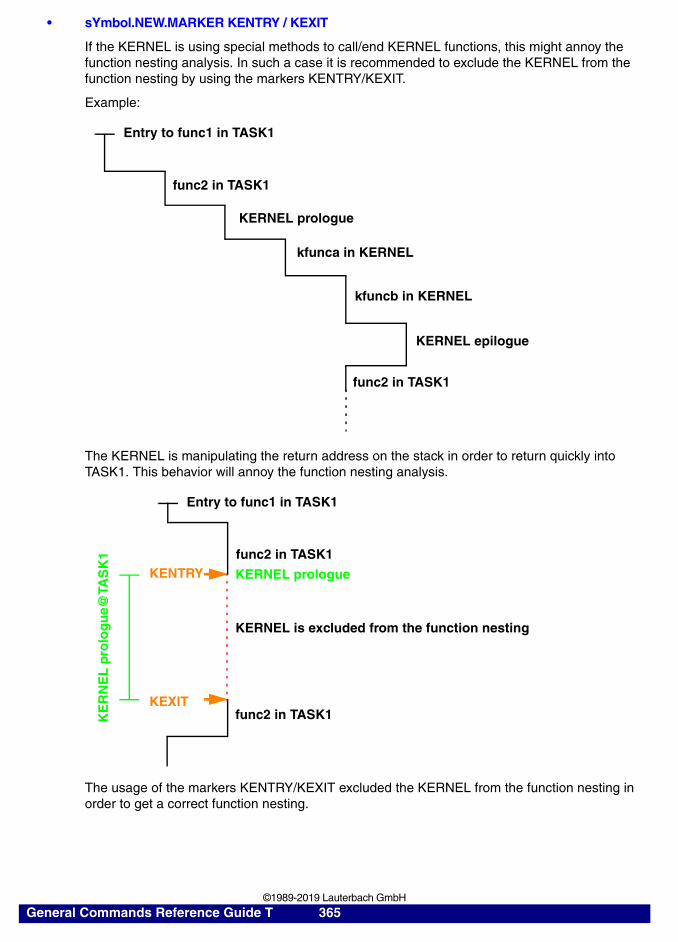
• sYmbol.NEW.MARKER KENTRY / KEXIT
If the KERNEL is using special methods to call/end KERNEL functions, this might annoy the function nesting analysis. In such a case it is recommended to exclude the KERNEL from the function nesting by using the markers KENTRY/KEXIT.
Example:
The KERNEL is manipulating the return address on the stack in order to return quickly into TASK1. This behavior will annoy the function nesting analysis.
The usage of the markers KENTRY/KEXIT excluded the KERNEL from the function nesting in order to get a correct function nesting.
Entry to func1 in TASK1
func2 in TASK1
KERNEL prologue
kfunca in KERNEL
KERNEL epilogue
kfuncb in KERNEL
func2 in TASK1
Entry to func1 in TASK1
func2 in TASK1KENTRY
KEXITfunc2 in TASK1
KERNEL is excluded from the function nesting
KERNEL prologue
KE
RN
EL
pro
log
ue@
TAS
K1
General Commands Reference Guide T 365 ©1989-2019 Lauterbach GmbH
Advanced example for RTOS RTXC on a StarCore CPU:
Procedure for Measurement for TRACE32-ICE and TRACE32-FIRE
Mark the Functions
The measurement is based on a selective trace of all function entries and exits. In order to perform this measurement all function entries have to be marked with an Alpha breakpoint, and all function exits have to be marked with a Beta breakpoint.
These breakpoints can be set automatically with the command Break.SetFunc, if HLL-functions are loaded. Assembler functions or e.g. loops within HLL-functions can also be marked manually.
The entry points of interrupt routines should be marked with Alpha and Charly (or Beta on ECC8) breakpoints. Thus the analysis ignores interrupt function times and takes care about double fetches caused by interrupted programs.
If all interrupt routines are located in a specific memory range or within a specific HLL module the interrupt routines can be marked automatically by using the command Break.SetFunction <range>| <module> /INTR.
If there is a name convention for interrupt routines use the sYmbol.ForEach command to mark the interrupt routines.
; mark all interrupt service routines as kernel entriessYmbol.ForEach "sYmbol.NEW.MARKER KENTRY *" "_isr_*"
; mark all RTE instructions in the specified program range as kernel exitData.Find P:RTXCProlog--P:RTXCProlog_end %Word 0x9f73WHILE FOUND()(
sYmbol.NEW.MARKER KEXIT P:TRACK.ADDRESS()Data.Find
)
sYmbol.List.MARKER
General Commands Reference Guide T 366 ©1989-2019 Lauterbach GmbH
Programming of the Trigger Unit
The analyzer is programmed to record accesses to ALPHA or BETA breakpoints and mark the records in the trace buffer as follows:
• Function entries are marked with an A marker.
• Function exits are marked with a B marker.
• Interrupt entries are marked with an A and a C marker.
• Interrupt exits are marked with a B marker.
Recording
The interesting program flow is recorded. The trace memory should be cleared before starting the recording. This is automatically done if Analyzer.AutoInit is ON.
Check the trace by viewing the records with <trace>.List MARK DEFault.
The display of the nesting is possible with the command Analyzer.List FUNC FUNCR (this command uses the same strategy to determine function entries and exits).
If the nesting of the functions is not correct (each function-entry must have a corresponding function-exit), the results will be incorrect and an error message will be displayed in the statistic window. In this case use the command <trace>.STATistic.PreFetch to solve the problem. If still single records are wrong, the command <trace>.STATistic.Ignore can be used to remove them from the measurement.
Analyzer.ReProgram(
Sample.Enable IF AlphaBreak||BetaBreakMark.A if AlphaBreakMark.B if BetaBreakMark.C if CharlyBreak
); not on ECC8
General Commands Reference Guide T 367 ©1989-2019 Lauterbach GmbH
Options
Basic <options> Description
FILE Displays trace memory contents loaded with Trace.FILE.
FlowTrace The trace works as flow trace. This option is usually not required.
BusTrace The trace works as a bus trace. This option is usually not required.
Accumulate By default only the current trace contents is analyzed by the statistic functions. The option /Accumulate allows to add the current trace contents to the already displayed results.
INCremental Intermediate results are displayed while the TRACE32 software analyses the trace contents (default).
FULL The result is displayed after the TRACE32 software finished the analysis.
Track Track the Trace.STATistic window with other trace list windows (tracking to record number or time possible).
NoMerge (For diagnosis purpose only).
CTS Use Context Tracking System to fill trace gaps and then perform the <trace>.STATistic.FUNC command. This is only useful for the ARM-ETM, SH4 and NEXUS.
INTR The time spent in interrupts is included to the measurement like a function call.
General Commands Reference Guide T 368 ©1989-2019 Lauterbach GmbH
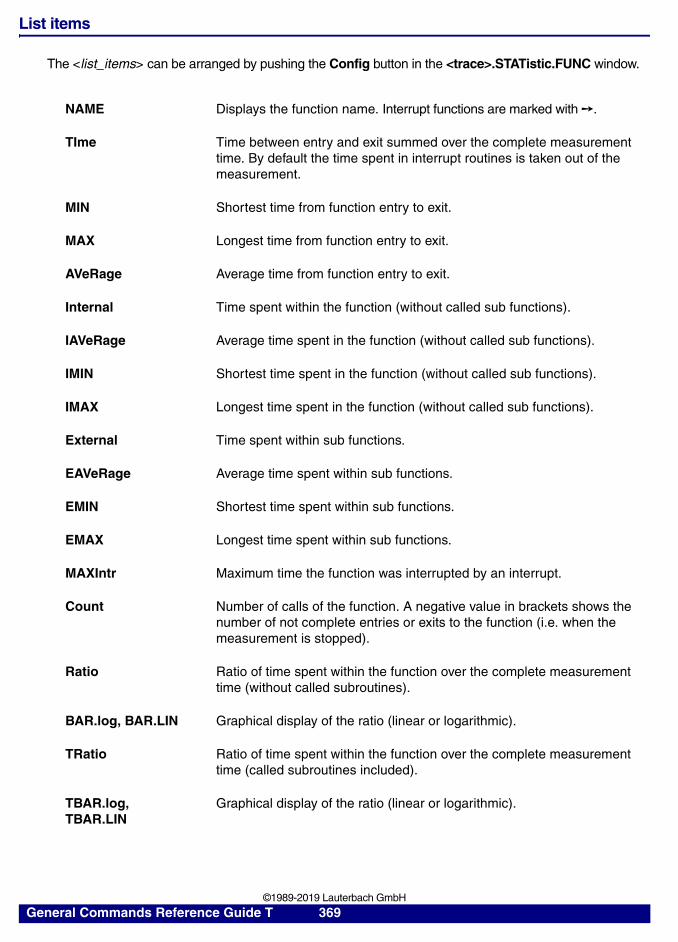
List items
The <list_items> can be arranged by pushing the Config button in the <trace>.STATistic.FUNC window.
NAME Displays the function name. Interrupt functions are marked with ➙.
TIme Time between entry and exit summed over the complete measurement time. By default the time spent in interrupt routines is taken out of the measurement.
MIN Shortest time from function entry to exit.
MAX Longest time from function entry to exit.
AVeRage Average time from function entry to exit.
Internal Time spent within the function (without called sub functions).
IAVeRage Average time spent in the function (without called sub functions).
IMIN Shortest time spent in the function (without called sub functions).
IMAX Longest time spent in the function (without called sub functions).
External Time spent within sub functions.
EAVeRage Average time spent within sub functions.
EMIN Shortest time spent within sub functions.
EMAX Longest time spent within sub functions.
MAXIntr Maximum time the function was interrupted by an interrupt.
Count Number of calls of the function. A negative value in brackets shows the number of not complete entries or exits to the function (i.e. when the measurement is stopped).
Ratio Ratio of time spent within the function over the complete measurement time (without called subroutines).
BAR.log, BAR.LIN Graphical display of the ratio (linear or logarithmic).
TRatio Ratio of time spent within the function over the complete measurement time (called subroutines included).
TBAR.log, TBAR.LIN
Graphical display of the ratio (linear or logarithmic).
General Commands Reference Guide T 369 ©1989-2019 Lauterbach GmbH
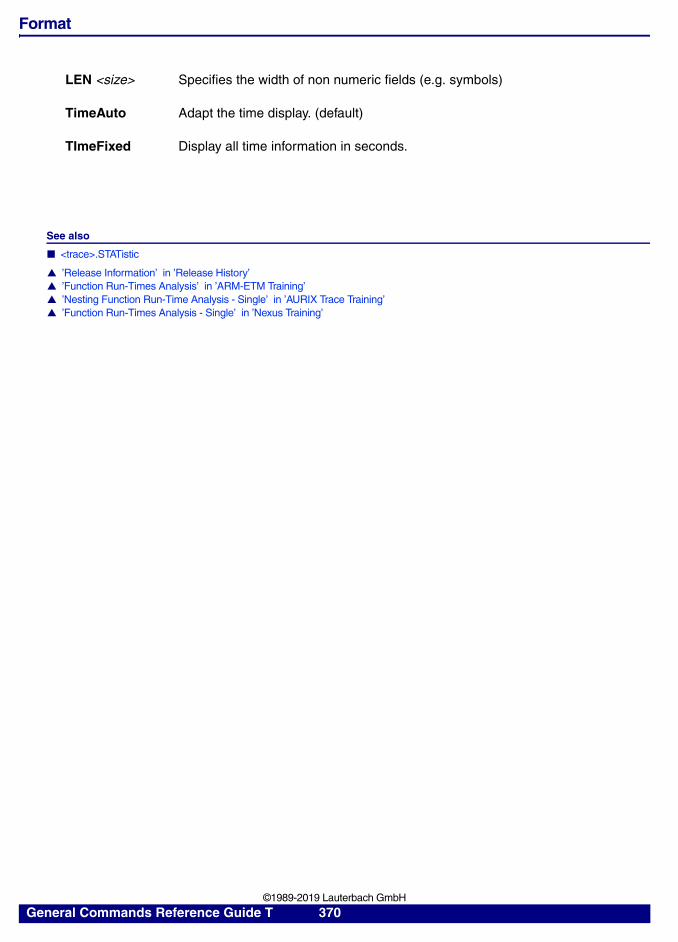
Format
See also
■ <trace>.STATistic
▲ ’Release Information’ in ’Release History’▲ ’Function Run-Times Analysis’ in ’ARM-ETM Training’▲ ’Nesting Function Run-Time Analysis - Single’ in ’AURIX Trace Training’▲ ’Function Run-Times Analysis - Single’ in ’Nexus Training’
LEN <size> Specifies the width of non numeric fields (e.g. symbols)
TimeAuto Adapt the time display. (default)
TImeFixed Display all time information in seconds.
General Commands Reference Guide T 370 ©1989-2019 Lauterbach GmbH
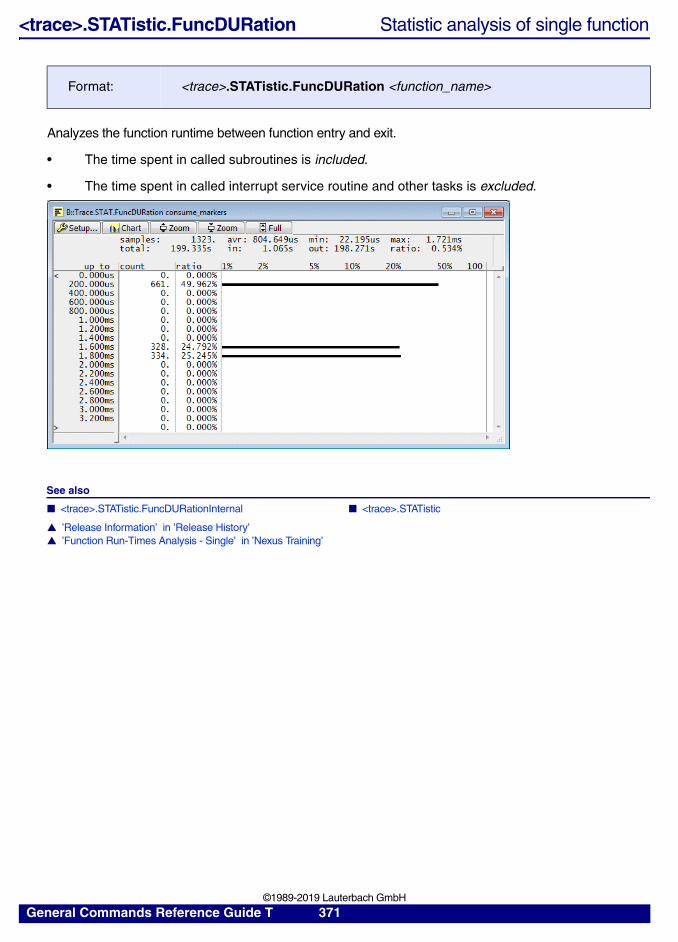
<trace>.STATistic.FuncDURation Statistic analysis of single function
Analyzes the function runtime between function entry and exit.
• The time spent in called subroutines is included.
• The time spent in called interrupt service routine and other tasks is excluded.
See also
■ <trace>.STATistic.FuncDURationInternal ■ <trace>.STATistic
▲ ’Release Information’ in ’Release History’▲ ’Function Run-Times Analysis - Single’ in ’Nexus Training’
Format: <trace>.STATistic.FuncDURation <function_name>
General Commands Reference Guide T 371 ©1989-2019 Lauterbach GmbH
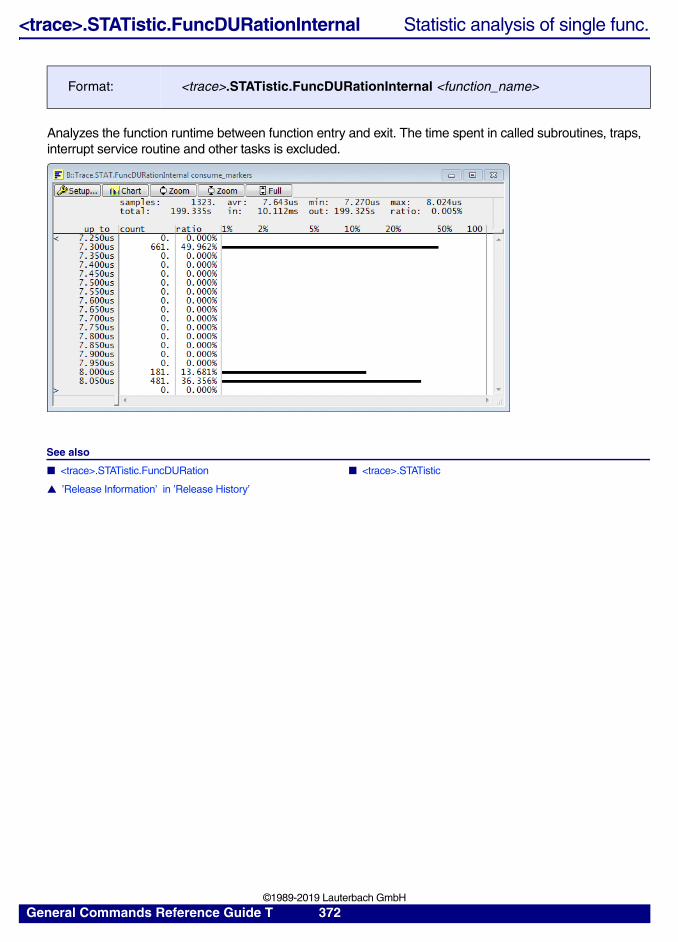
<trace>.STATistic.FuncDURationInternal Statistic analysis of single func.
Analyzes the function runtime between function entry and exit. The time spent in called subroutines, traps, interrupt service routine and other tasks is excluded.
See also
■ <trace>.STATistic.FuncDURation ■ <trace>.STATistic
▲ ’Release Information’ in ’Release History’
Format: <trace>.STATistic.FuncDURationInternal <function_name>
General Commands Reference Guide T 372 ©1989-2019 Lauterbach GmbH
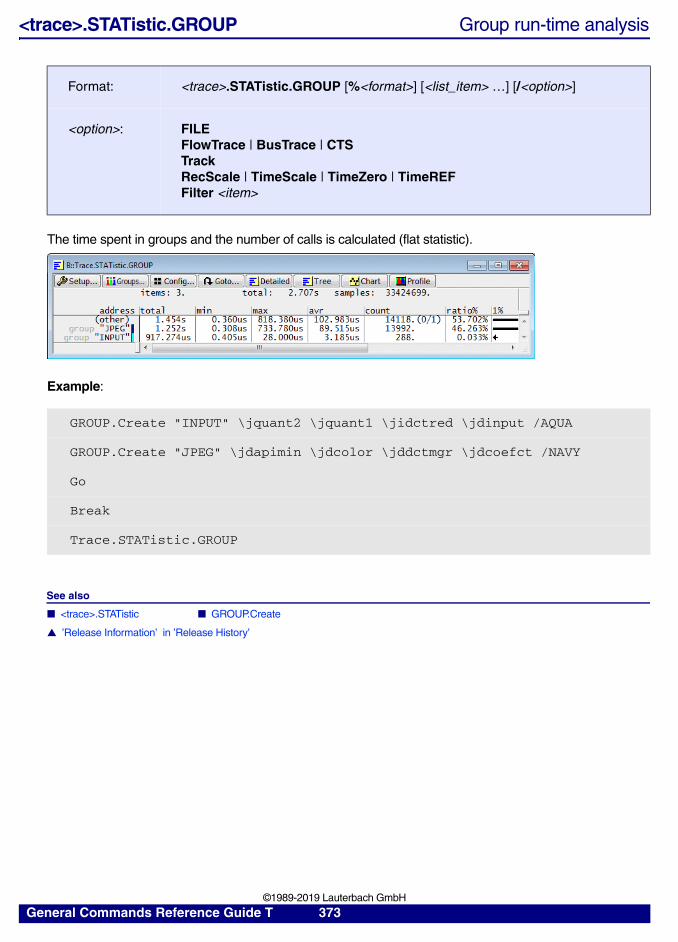
<trace>.STATistic.GROUP Group run-time analysis
The time spent in groups and the number of calls is calculated (flat statistic).
Example:
See also
■ <trace>.STATistic ■ GROUP.Create
▲ ’Release Information’ in ’Release History’
Format: <trace>.STATistic.GROUP [%<format>] [<list_item> …] [/<option>]
<option>: FILEFlowTrace | BusTrace | CTSTrackRecScale | TimeScale | TimeZero | TimeREFFilter <item>
GROUP.Create "INPUT" \jquant2 \jquant1 \jidctred \jdinput /AQUA
GROUP.Create "JPEG" \jdapimin \jdcolor \jddctmgr \jdcoefct /NAVY
Go
Break
Trace.STATistic.GROUP
General Commands Reference Guide T 373 ©1989-2019 Lauterbach GmbH
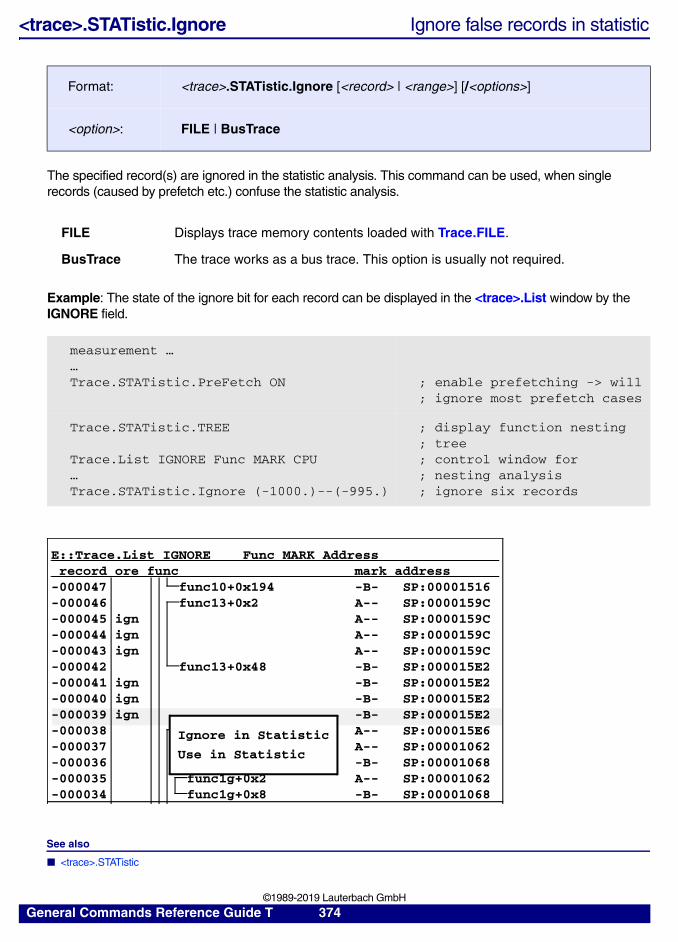
<trace>.STATistic.Ignore Ignore false records in statistic
The specified record(s) are ignored in the statistic analysis. This command can be used, when single records (caused by prefetch etc.) confuse the statistic analysis.
Example: The state of the ignore bit for each record can be displayed in the <trace>.List window by the IGNORE field.
See also
■ <trace>.STATistic
Format: <trace>.STATistic.Ignore [<record> | <range>] [/<options>]
<option>: FILE | BusTrace
FILE Displays trace memory contents loaded with Trace.FILE.
BusTrace The trace works as a bus trace. This option is usually not required.
measurement ……Trace.STATistic.PreFetch ON ; enable prefetching -> will
; ignore most prefetch cases
Trace.STATistic.TREE
Trace.List IGNORE Func MARK CPU…Trace.STATistic.Ignore (-1000.)--(-995.)
; display function nesting; tree; control window for; nesting analysis; ignore six records
E::Trace.List IGNORE Func MARK Addressrecord ore func mark address
-000047 func10+0x194 -B- SP:00001516-000046 func13+0x2 A-- SP:0000159C-000045 ign A-- SP:0000159C-000044 ign A-- SP:0000159C-000043 ign A-- SP:0000159C-000042 func13+0x48 -B- SP:000015E2-000041 ign -B- SP:000015E2-000040 ign -B- SP:000015E2-000039 ign -B- SP:000015E2-000038 func13a+0x2 A-- SP:000015E6-000037 func1g+0x2 A-- SP:00001062-000036 func1g+0x8 -B- SP:00001068-000035 func1g+0x2 A-- SP:00001062-000034 func1g+0x8 -B- SP:00001068
Ignore in Statistic
Use in Statistic
General Commands Reference Guide T 374 ©1989-2019 Lauterbach GmbH
<trace>.STATistic.INTERRUPT Interrupt statistic
tbd.
See also
■ <trace>.STATistic
▲ ’Release Information’ in ’Release History’
Format: <trace>.STATistic.INTERRUPT [%<format>] [<list_item> …] [/<option>]
General Commands Reference Guide T 375 ©1989-2019 Lauterbach GmbH
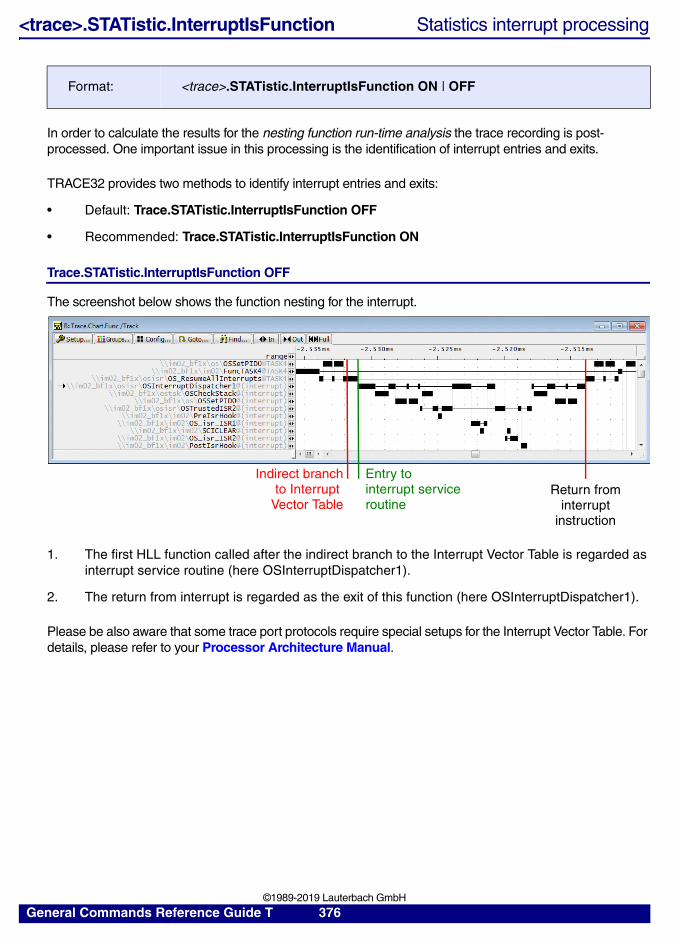
<trace>.STATistic.InterruptIsFunction Statistics interrupt processing
In order to calculate the results for the nesting function run-time analysis the trace recording is post-processed. One important issue in this processing is the identification of interrupt entries and exits.
TRACE32 provides two methods to identify interrupt entries and exits:
• Default: Trace.STATistic.InterruptIsFunction OFF
• Recommended: Trace.STATistic.InterruptIsFunction ON
Trace.STATistic.InterruptIsFunction OFF
The screenshot below shows the function nesting for the interrupt.
1. The first HLL function called after the indirect branch to the Interrupt Vector Table is regarded as interrupt service routine (here OSInterruptDispatcher1).
2. The return from interrupt is regarded as the exit of this function (here OSInterruptDispatcher1).
Please be also aware that some trace port protocols require special setups for the Interrupt Vector Table. For details, please refer to your Processor Architecture Manual.
Format: <trace>.STATistic.InterruptIsFunction ON | OFF
Indirect branchto Interrupt
Vector TableReturn from
interrupt
Entry to interrupt service routine
instruction
General Commands Reference Guide T 376 ©1989-2019 Lauterbach GmbH
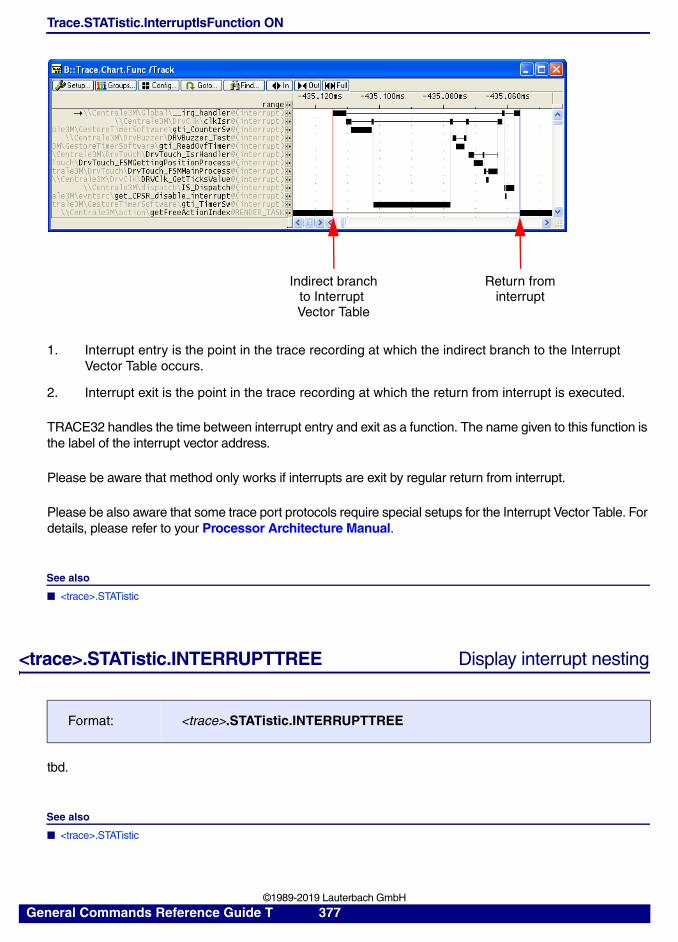
Trace.STATistic.InterruptIsFunction ON
1. Interrupt entry is the point in the trace recording at which the indirect branch to the Interrupt Vector Table occurs.
2. Interrupt exit is the point in the trace recording at which the return from interrupt is executed.
TRACE32 handles the time between interrupt entry and exit as a function. The name given to this function is the label of the interrupt vector address.
Please be aware that method only works if interrupts are exit by regular return from interrupt.
Please be also aware that some trace port protocols require special setups for the Interrupt Vector Table. For details, please refer to your Processor Architecture Manual.
See also
■ <trace>.STATistic
<trace>.STATistic.INTERRUPTTREE Display interrupt nesting
tbd.
See also
■ <trace>.STATistic
Format: <trace>.STATistic.INTERRUPTTREE
Indirect branchto Interrupt Vector Table
Return frominterrupt
General Commands Reference Guide T 377 ©1989-2019 Lauterbach GmbH
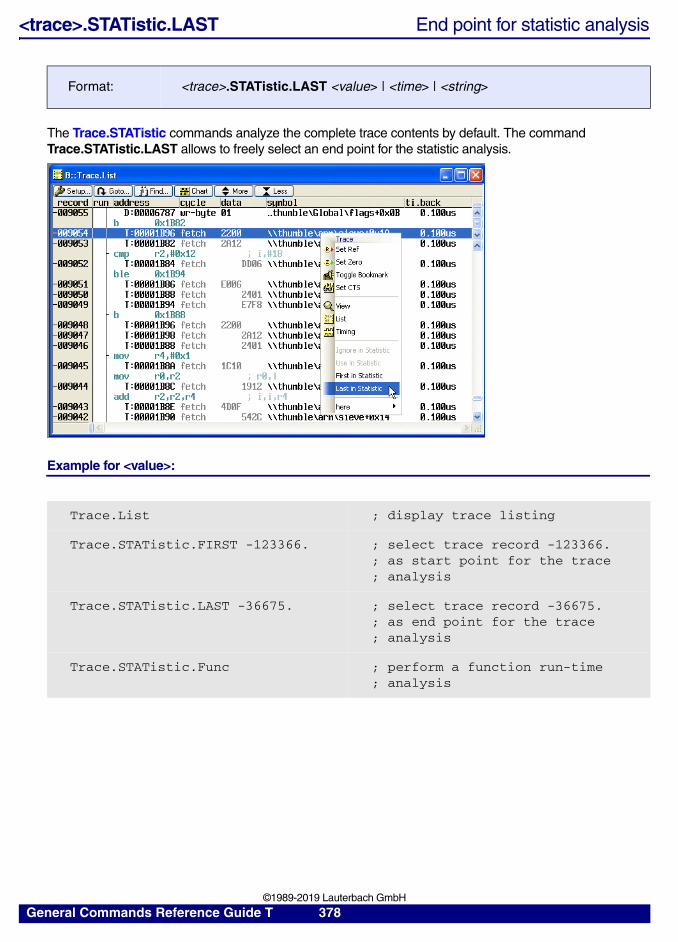
<trace>.STATistic.LAST End point for statistic analysis
The Trace.STATistic commands analyze the complete trace contents by default. The command Trace.STATistic.LAST allows to freely select an end point for the statistic analysis.
Example for <value>:
Format: <trace>.STATistic.LAST <value> | <time> | <string>
Trace.List ; display trace listing
Trace.STATistic.FIRST -123366. ; select trace record -123366.; as start point for the trace; analysis
Trace.STATistic.LAST -36675. ; select trace record -36675.; as end point for the trace; analysis
Trace.STATistic.Func ; perform a function run-time; analysis
General Commands Reference Guide T 378 ©1989-2019 Lauterbach GmbH
Exampe for <time>:
See also
■ <trace>.STATistic ■ <trace>.STATistic.FIRST
▲ ’Release Information’ in ’Release History’
Trace.List TIme.Zero DEFault ; display trace listing
Trace.STATistic.LAST 468.2us ; select trace record with timestamp; 468.2 µs (zero time) as end point for; the trace analysis
Trace.STATistic.Func ; perform a function run-time analysis; from the beginning of the trace buffer; to the specified end point
General Commands Reference Guide T 379 ©1989-2019 Lauterbach GmbH
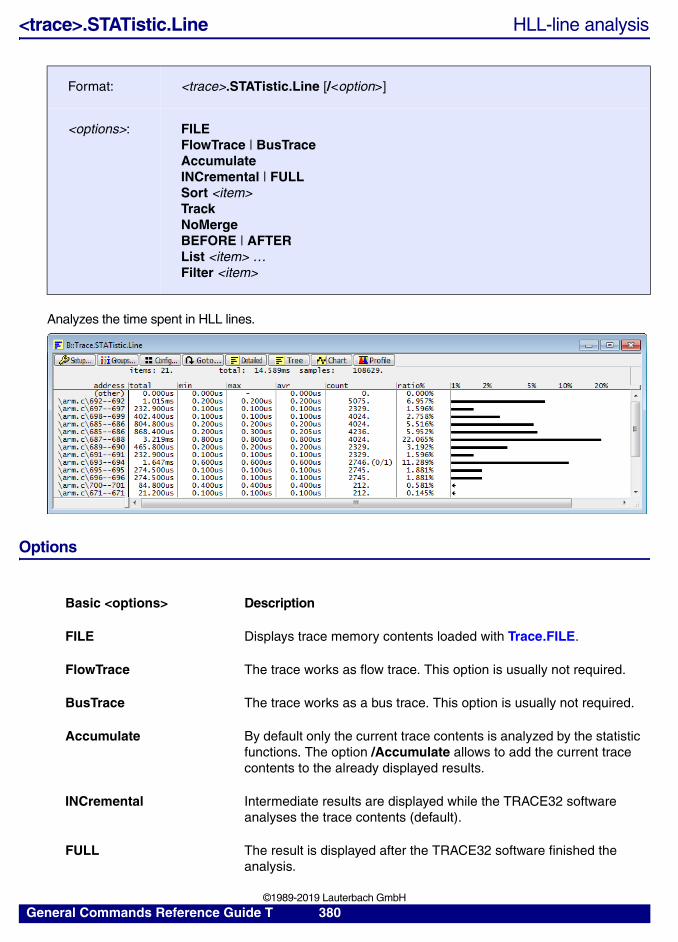
<trace>.STATistic.Line HLL-line analysis
Analyzes the time spent in HLL lines.
Options
Format: <trace>.STATistic.Line [/<option>]
<options>: FILEFlowTrace | BusTraceAccumulate INCremental | FULL Sort <item>TrackNoMergeBEFORE | AFTERList <item> …Filter <item>
Basic <options> Description
FILE Displays trace memory contents loaded with Trace.FILE.
FlowTrace The trace works as flow trace. This option is usually not required.
BusTrace The trace works as a bus trace. This option is usually not required.
Accumulate By default only the current trace contents is analyzed by the statistic functions. The option /Accumulate allows to add the current trace contents to the already displayed results.
INCremental Intermediate results are displayed while the TRACE32 software analyses the trace contents (default).
FULL The result is displayed after the TRACE32 software finished the analysis.
General Commands Reference Guide T 380 ©1989-2019 Lauterbach GmbH
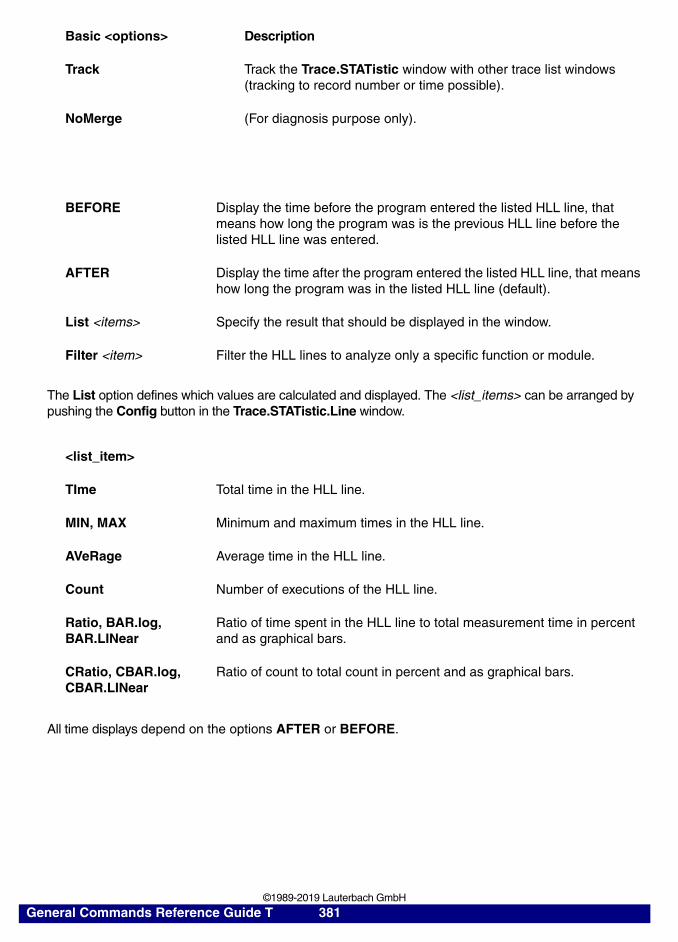
The List option defines which values are calculated and displayed. The <list_items> can be arranged by pushing the Config button in the Trace.STATistic.Line window.
All time displays depend on the options AFTER or BEFORE.
Track Track the Trace.STATistic window with other trace list windows (tracking to record number or time possible).
NoMerge (For diagnosis purpose only).
BEFORE Display the time before the program entered the listed HLL line, that means how long the program was is the previous HLL line before the listed HLL line was entered.
AFTER Display the time after the program entered the listed HLL line, that means how long the program was in the listed HLL line (default).
List <items> Specify the result that should be displayed in the window.
Filter <item> Filter the HLL lines to analyze only a specific function or module.
<list_item>
TIme Total time in the HLL line.
MIN, MAX Minimum and maximum times in the HLL line.
AVeRage Average time in the HLL line.
Count Number of executions of the HLL line.
Ratio, BAR.log, BAR.LINear
Ratio of time spent in the HLL line to total measurement time in percent and as graphical bars.
CRatio, CBAR.log, CBAR.LINear
Ratio of count to total count in percent and as graphical bars.
Basic <options> Description
General Commands Reference Guide T 381 ©1989-2019 Lauterbach GmbH
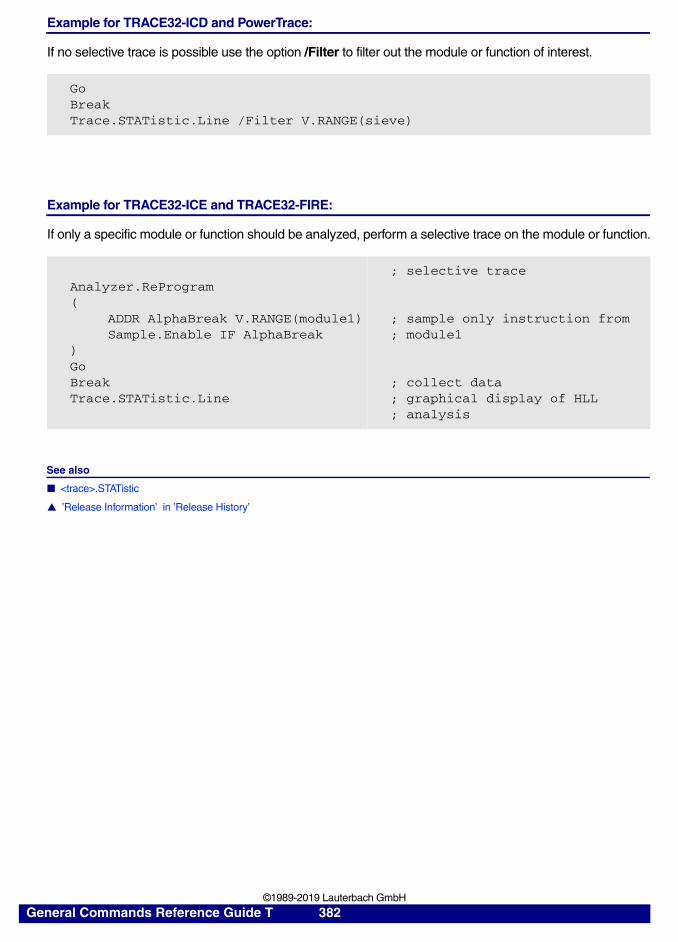
Example for TRACE32-ICD and PowerTrace:
If no selective trace is possible use the option /Filter to filter out the module or function of interest.
Example for TRACE32-ICE and TRACE32-FIRE:
If only a specific module or function should be analyzed, perform a selective trace on the module or function.
See also
■ <trace>.STATistic
▲ ’Release Information’ in ’Release History’
GoBreakTrace.STATistic.Line /Filter V.RANGE(sieve)
Analyzer.ReProgram(
ADDR AlphaBreak V.RANGE(module1)Sample.Enable IF AlphaBreak
) GoBreakTrace.STATistic.Line
; selective trace
; sample only instruction from; module1
; collect data; graphical display of HLL; analysis
General Commands Reference Guide T 382 ©1989-2019 Lauterbach GmbH
<trace>.STATistic.LINKage Per caller statistic of function
Performs a function run-time statistic for a single function itemized by its callers. The procedure for recording the data is the same as for the <trace>.STATistic.Func command.
Format: <trace>.STATistic.LINKage <address> [<items> …] [/<option>]
<format>: DEFault | LENTimeAuto | TimeFixed
<list_item>: DEFault | ALLTotal | MIN | MAX | AVeRage Count NAME | TASKInternal | IAVeRage | IMIN | IMAX | InternalRatio | InternalBARExternal | EAVeRage | EMIN | EMAXINTR | INTRMAX | INTRCount ExternalTASK | ExternalTASKMAX | TASKCountTotalRatio | TotalBAR
<option>: FILEFlowTrace | BusTraceAccumulate INCremental | FULL Sort <item>TrackNoMergeIncludeOwn | IncludeTASK | IncludeINTRINTRROOT | INTRTASK
<address> Has to be the function entry address.
General Commands Reference Guide T 383 ©1989-2019 Lauterbach GmbH
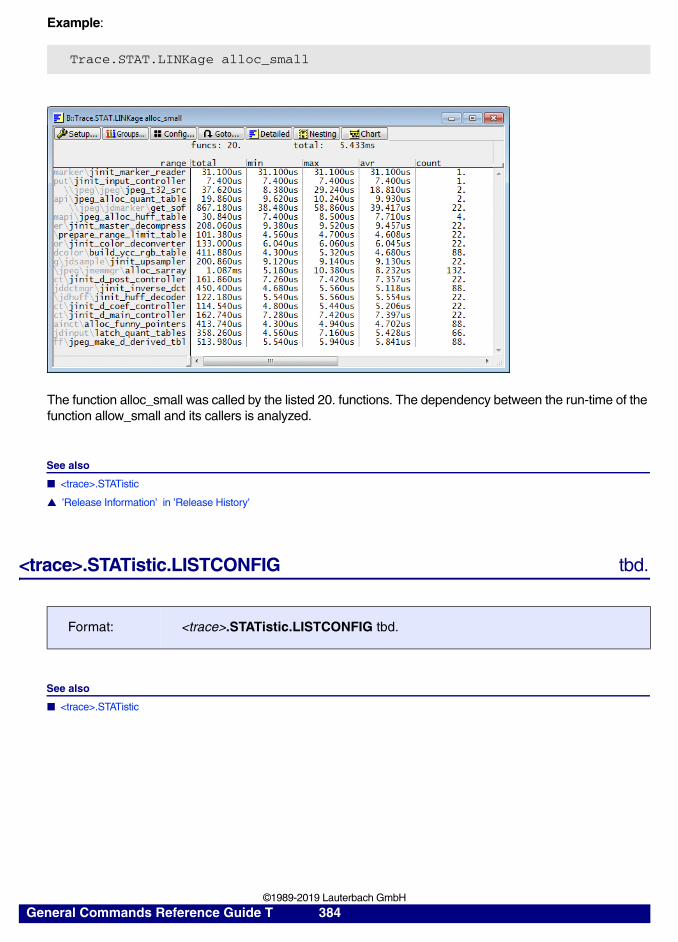
Example:
The function alloc_small was called by the listed 20. functions. The dependency between the run-time of the function allow_small and its callers is analyzed.
See also
■ <trace>.STATistic
▲ ’Release Information’ in ’Release History’
<trace>.STATistic.LISTCONFIG tbd.
See also
■ <trace>.STATistic
Trace.STAT.LINKage alloc_small
Format: <trace>.STATistic.LISTCONFIG tbd.
General Commands Reference Guide T 384 ©1989-2019 Lauterbach GmbH
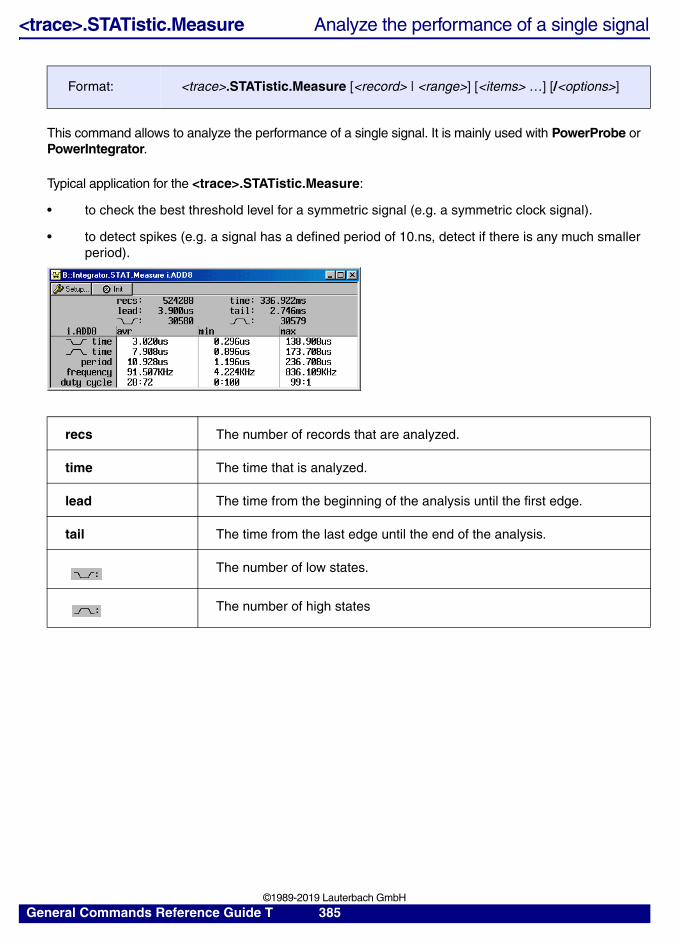
<trace>.STATistic.Measure Analyze the performance of a single signal
This command allows to analyze the performance of a single signal. It is mainly used with PowerProbe or PowerIntegrator.
Typical application for the <trace>.STATistic.Measure:
• to check the best threshold level for a symmetric signal (e.g. a symmetric clock signal).
• to detect spikes (e.g. a signal has a defined period of 10.ns, detect if there is any much smaller period).
Format: <trace>.STATistic.Measure [<record> | <range>] [<items> …] [/<options>]
recs The number of records that are analyzed.
time The time that is analyzed.
lead The time from the beginning of the analysis until the first edge.
tail The time from the last edge until the end of the analysis.
The number of low states.
The number of high states
General Commands Reference Guide T 385 ©1989-2019 Lauterbach GmbH
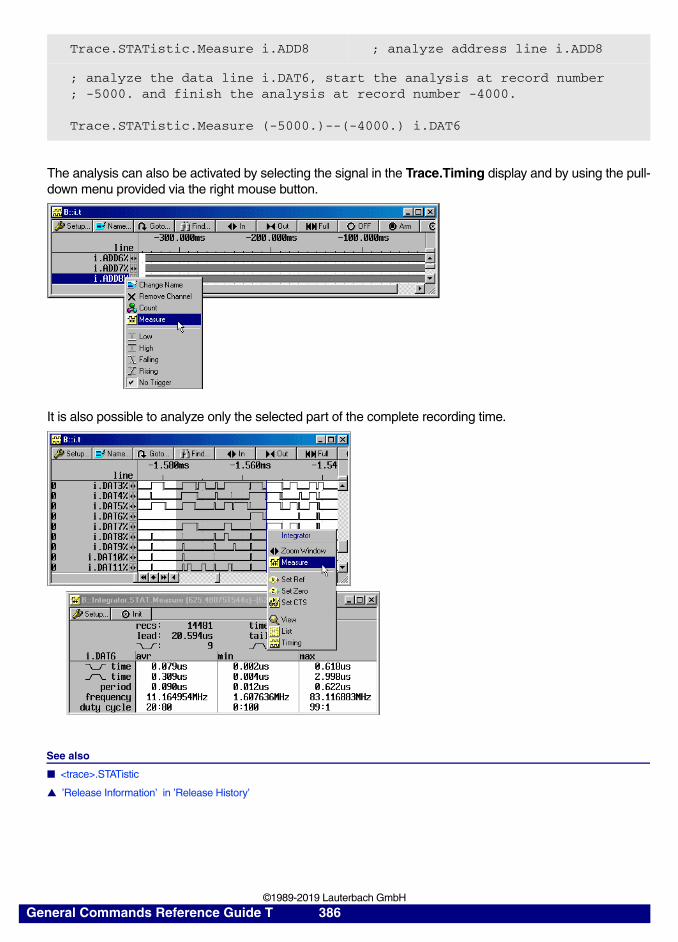
The analysis can also be activated by selecting the signal in the Trace.Timing display and by using the pull-down menu provided via the right mouse button.
It is also possible to analyze only the selected part of the complete recording time.
See also
■ <trace>.STATistic
▲ ’Release Information’ in ’Release History’
Trace.STATistic.Measure i.ADD8 ; analyze address line i.ADD8
; analyze the data line i.DAT6, start the analysis at record number ; -5000. and finish the analysis at record number -4000.
Trace.STATistic.Measure (-5000.)--(-4000.) i.DAT6
General Commands Reference Guide T 386 ©1989-2019 Lauterbach GmbH
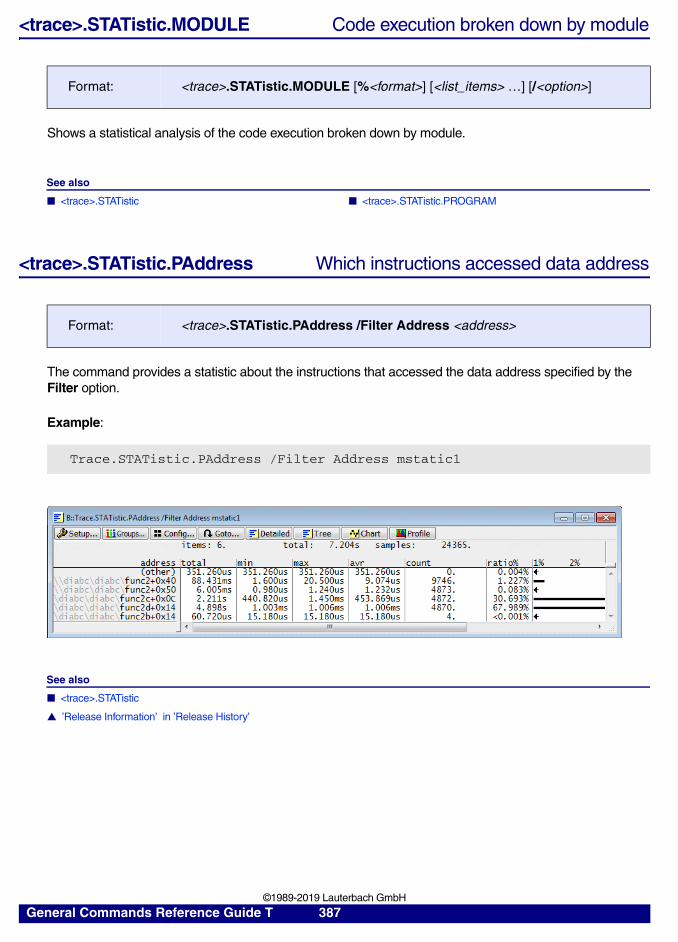
<trace>.STATistic.MODULE Code execution broken down by module
Shows a statistical analysis of the code execution broken down by module.
See also
■ <trace>.STATistic ■ <trace>.STATistic.PROGRAM
<trace>.STATistic.PAddress Which instructions accessed data address
The command provides a statistic about the instructions that accessed the data address specified by the Filter option.
Example:
See also
■ <trace>.STATistic
▲ ’Release Information’ in ’Release History’
Format: <trace>.STATistic.MODULE [%<format>] [<list_items> …] [/<option>]
Format: <trace>.STATistic.PAddress /Filter Address <address>
Trace.STATistic.PAddress /Filter Address mstatic1
General Commands Reference Guide T 387 ©1989-2019 Lauterbach GmbH
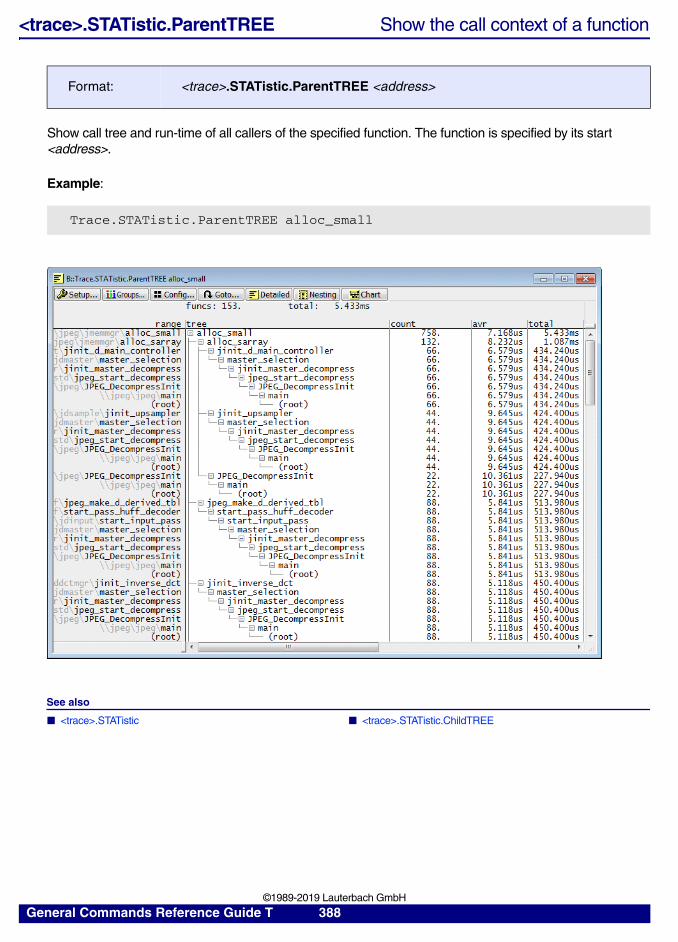
<trace>.STATistic.ParentTREE Show the call context of a function
Show call tree and run-time of all callers of the specified function. The function is specified by its start <address>.
Example:
See also
■ <trace>.STATistic ■ <trace>.STATistic.ChildTREE
Format: <trace>.STATistic.ParentTREE <address>
Trace.STATistic.ParentTREE alloc_small
General Commands Reference Guide T 388 ©1989-2019 Lauterbach GmbH
<trace>.STATistic.PIPELINE tbd.HC12 only
tbd.
See also
■ <trace>.STATistic
Format: <trace>.STATistic.PIPELINE tbd.
General Commands Reference Guide T 389 ©1989-2019 Lauterbach GmbH
<trace>.STATistic.PreFetch Prefetch detection
This command should only be used when a prefetching CPUs is used!
If ON is selected, the software will try to eliminate the errors in statistics generated by prefetches. The command affects the result of the commands <trace>.STATistic, <trace>.Chart and <trace>.List FUNC (and all related commands).
When the option cycles is used, another software prefetch detection strategy is added. In this case after each marked record there must be a number of consecutive cycles, otherwise the record is treated as a prefetch cycle. This technique can be used to eliminate false entry/exits detections caused by prefetching and interrupts.
If the prefetch problem cannot be solved by this command, an alternative can be tagging the code (command Data.TAGFunc) or by manually removing records from the measurement (command <trace>.STATistic.Ignore).
The following typical prefetch conditions are detected:
Alpha/Beta prefetched direct after Beta
The beginning of a function may be sampled during leaving the prior function by a prefetch. This may happen, if the breakpoints were set manually or with the command Break.SetFunc /NPreFetch. The prefetch will be detected by the software, if an access to Alpha or Beta is made directly after an access to Beta, without any other program fetch cycles between. If the record after the ignored record is also prefetched, it will be ignored too.
Double fetches after interrupts
Problems with the prefetch may occur, if interrupts are handled by the program during the analysis. After accessing a tag breakpoint on processors with prefetch it is possible that the interrupt program is entered. After leaving the interrupt program the same breakpoint is read again, causing a nesting error in the analysis. If the PreFetch option is active and the interrupt program is marked with a Charly breakpoint, the software will assume that a second read of a breakpoint tag after the interrupt function was caused by a prefetch. A result may be that recursive functions may cause nesting errors, if the interrupt occurs in such a procedure. A 100% solution is not possible, when working with prefetching CPUs and sampling program fetches. The best solution in this case is to use data tags (see command Break.SetFunc).
Multiple prefetched Beta through program structure
If the epilog code of a function contains a loop, which accesses the Beta breakpoint more than once, it will be detected. The last access to the Beta will be taken into account. If the beta breakpoint is accessed by a prefetch, but the function continues this will also be detected.
See also
■ <trace>.STATistic
Format: <trace>.STATistic.PreFetch [ON | OFF [<cycles>]]
General Commands Reference Guide T 390 ©1989-2019 Lauterbach GmbH
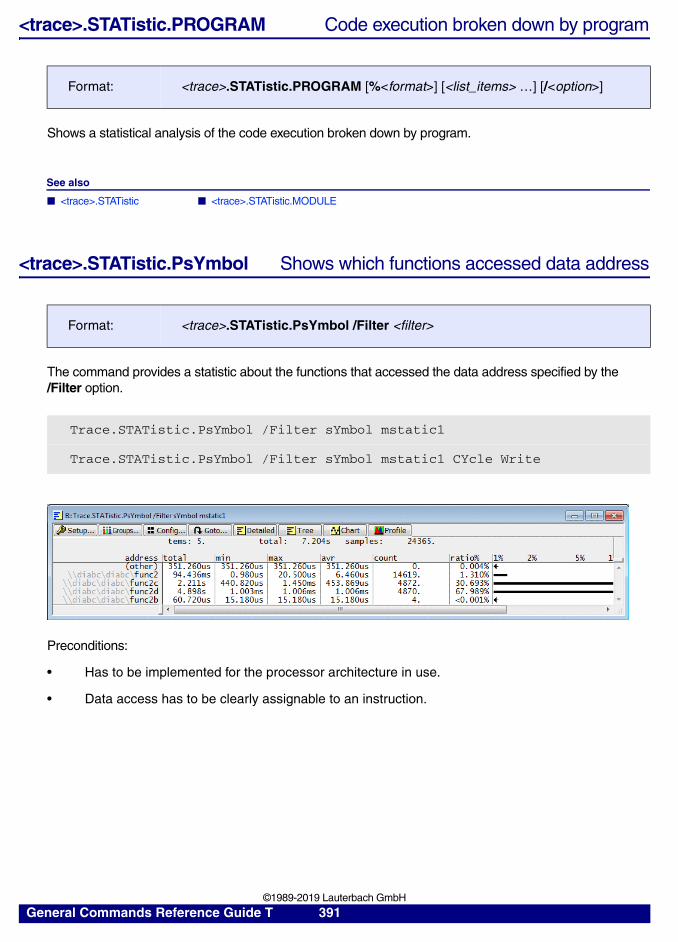
<trace>.STATistic.PROGRAM Code execution broken down by program
Shows a statistical analysis of the code execution broken down by program.
See also
■ <trace>.STATistic ■ <trace>.STATistic.MODULE
<trace>.STATistic.PsYmbol Shows which functions accessed data address
The command provides a statistic about the functions that accessed the data address specified by the /Filter option.
Preconditions:
• Has to be implemented for the processor architecture in use.
• Data access has to be clearly assignable to an instruction.
Format: <trace>.STATistic.PROGRAM [%<format>] [<list_items> …] [/<option>]
Format: <trace>.STATistic.PsYmbol /Filter <filter>
Trace.STATistic.PsYmbol /Filter sYmbol mstatic1
Trace.STATistic.PsYmbol /Filter sYmbol mstatic1 CYcle Write
General Commands Reference Guide T 391 ©1989-2019 Lauterbach GmbH
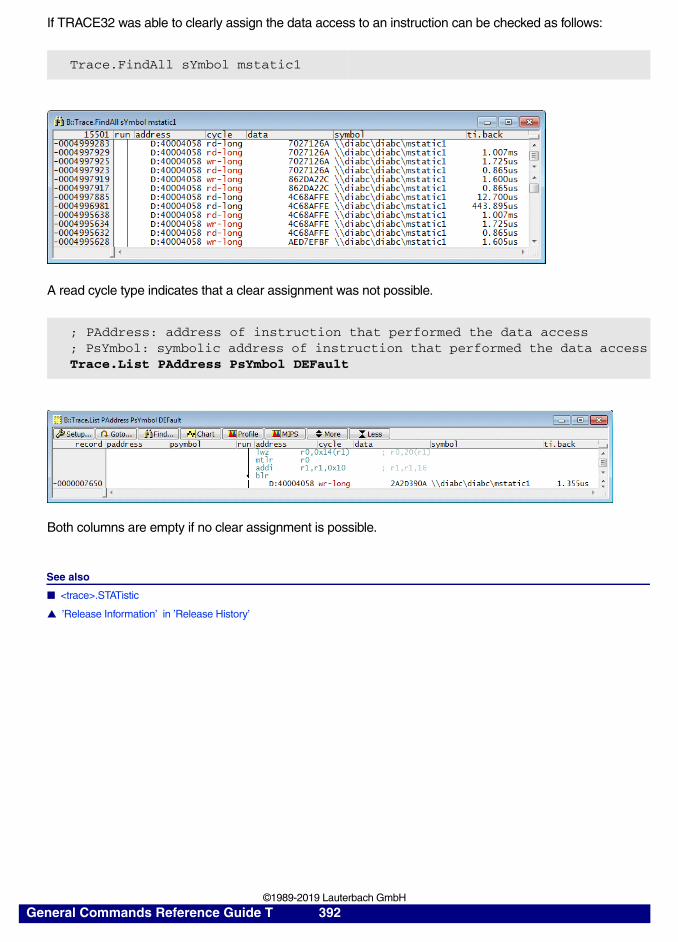
If TRACE32 was able to clearly assign the data access to an instruction can be checked as follows:
A read cycle type indicates that a clear assignment was not possible.
Both columns are empty if no clear assignment is possible.
See also
■ <trace>.STATistic
▲ ’Release Information’ in ’Release History’
Trace.FindAll sYmbol mstatic1
; PAddress: address of instruction that performed the data access; PsYmbol: symbolic address of instruction that performed the data accessTrace.List PAddress PsYmbol DEFault
General Commands Reference Guide T 392 ©1989-2019 Lauterbach GmbH
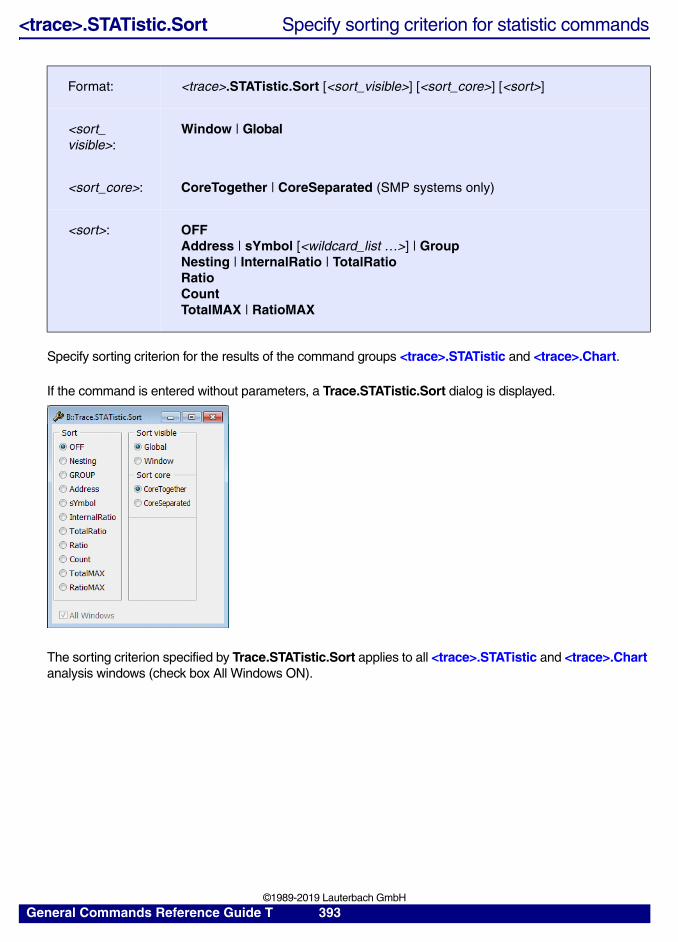
<trace>.STATistic.Sort Specify sorting criterion for statistic commands
Specify sorting criterion for the results of the command groups <trace>.STATistic and <trace>.Chart.
If the command is entered without parameters, a Trace.STATistic.Sort dialog is displayed.
The sorting criterion specified by Trace.STATistic.Sort applies to all <trace>.STATistic and <trace>.Chart analysis windows (check box All Windows ON).
Format: <trace>.STATistic.Sort [<sort_visible>] [<sort_core>] [<sort>]
<sort_visible>:
Window | Global
<sort_core>: CoreTogether | CoreSeparated (SMP systems only)
<sort>: OFFAddress | sYmbol [<wildcard_list …>] | Group Nesting | InternalRatio | TotalRatioRatioCountTotalMAX | RatioMAX
General Commands Reference Guide T 393 ©1989-2019 Lauterbach GmbH

To specify the sorting criterium for an individual statistic window use the Config button of this statistic window or use the /Sort option when you enter the command.
Default Sorting Criterion
OFF is the default mode for most statistic windows. OFF means that the analyzed items are displayed in their recording order.
Statistic windows that are focused on the program’s call hierarchy e.g Trace.STATistic.TREE use Nesting as default mode.
Trace.Chart.sYmbol /Sort TotalRatio ; sort the time chart by the; criterion TotalRatio
General Commands Reference Guide T 394 ©1989-2019 Lauterbach GmbH
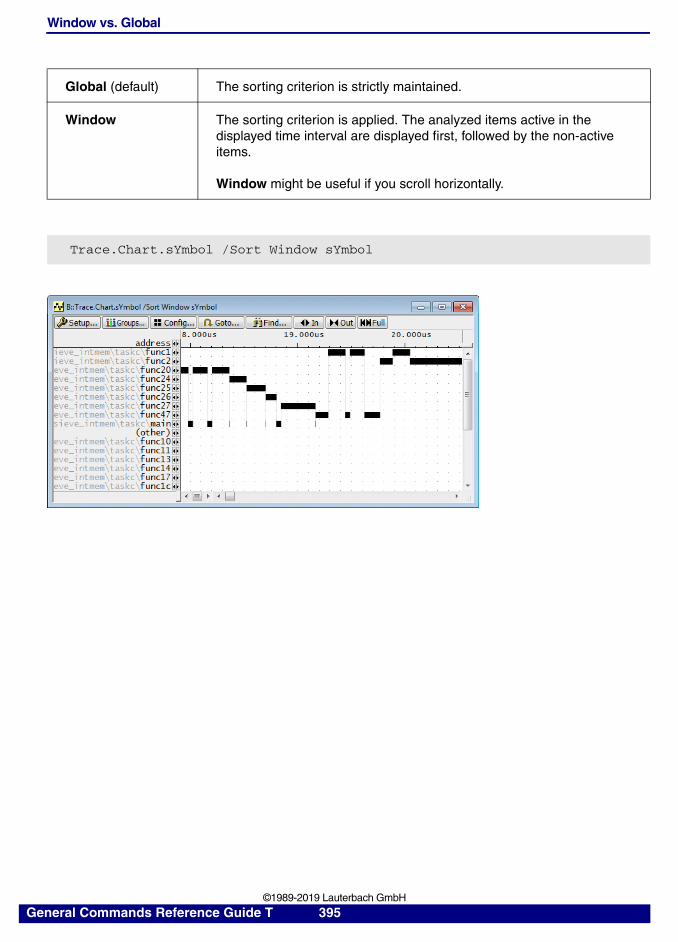
Window vs. Global
Global (default) The sorting criterion is strictly maintained.
Window The sorting criterion is applied. The analyzed items active in the displayed time interval are displayed first, followed by the non-active items.
Window might be useful if you scroll horizontally.
Trace.Chart.sYmbol /Sort Window sYmbol
General Commands Reference Guide T 395 ©1989-2019 Lauterbach GmbH
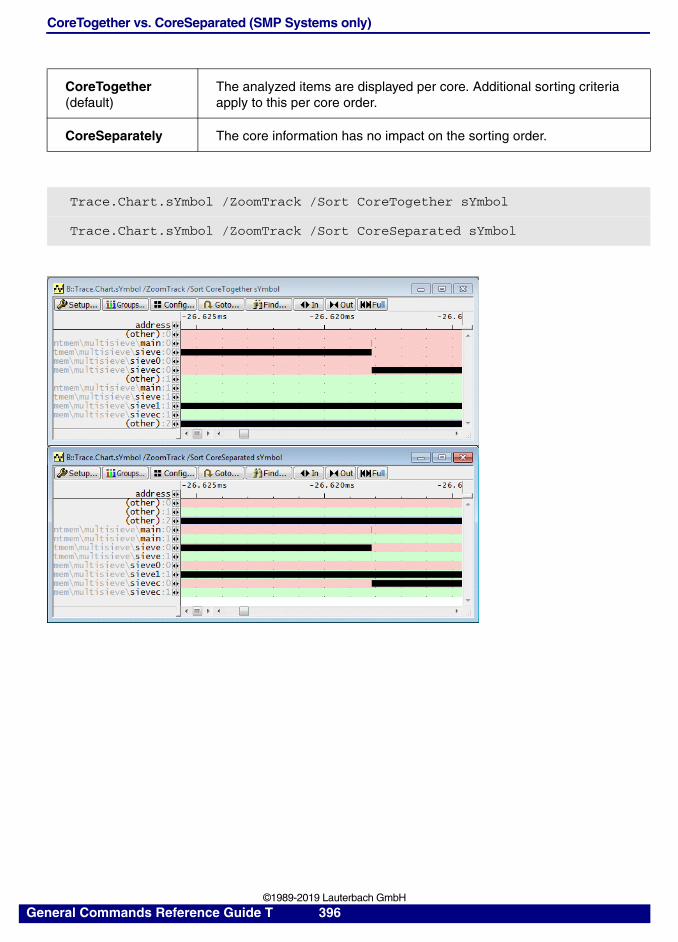
CoreTogether vs. CoreSeparated (SMP Systems only)
CoreTogether (default)
The analyzed items are displayed per core. Additional sorting criteria apply to this per core order.
CoreSeparately The core information has no impact on the sorting order.
Trace.Chart.sYmbol /ZoomTrack /Sort CoreTogether sYmbol
Trace.Chart.sYmbol /ZoomTrack /Sort CoreSeparated sYmbol
General Commands Reference Guide T 396 ©1989-2019 Lauterbach GmbH
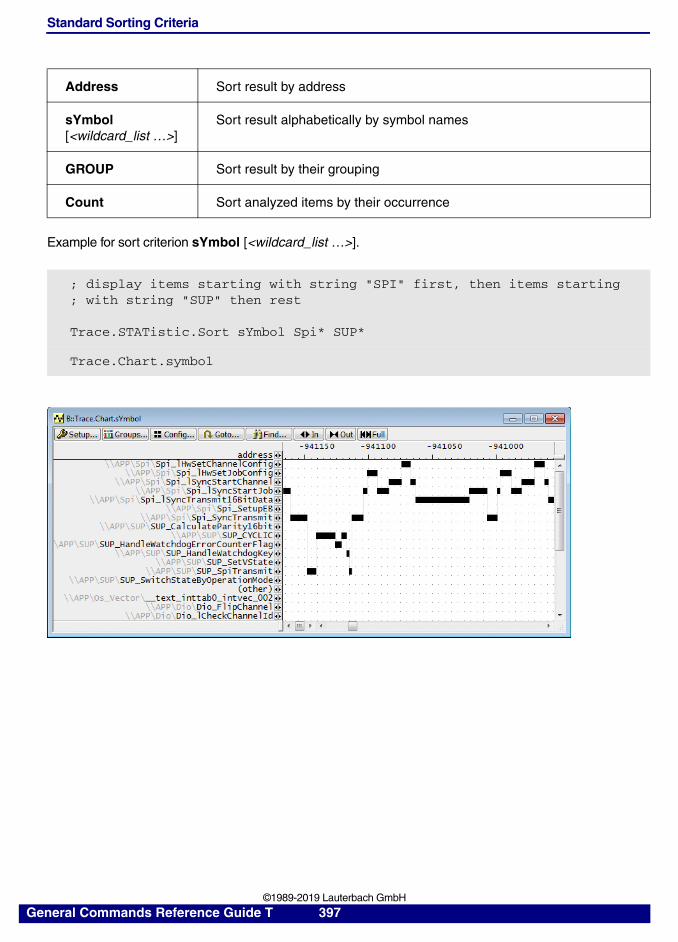
Standard Sorting Criteria
Example for sort criterion sYmbol [<wildcard_list …>].
Address Sort result by address
sYmbol [<wildcard_list …>]
Sort result alphabetically by symbol names
GROUP Sort result by their grouping
Count Sort analyzed items by their occurrence
; display items starting with string "SPI" first, then items starting; with string "SUP" then rest
Trace.STATistic.Sort sYmbol Spi* SUP*
Trace.Chart.symbol
General Commands Reference Guide T 397 ©1989-2019 Lauterbach GmbH
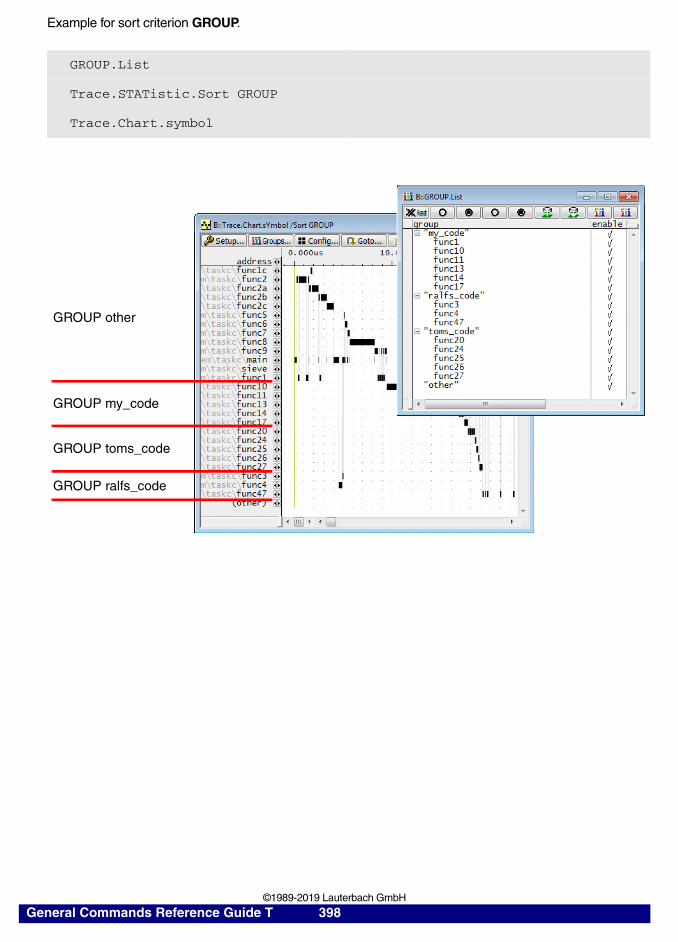
Example for sort criterion GROUP.
GROUP.List
Trace.STATistic.Sort GROUP
Trace.Chart.symbol
GROUP my_code
GROUP toms_code
GROUP ralfs_code
GROUP other
General Commands Reference Guide T 398 ©1989-2019 Lauterbach GmbH
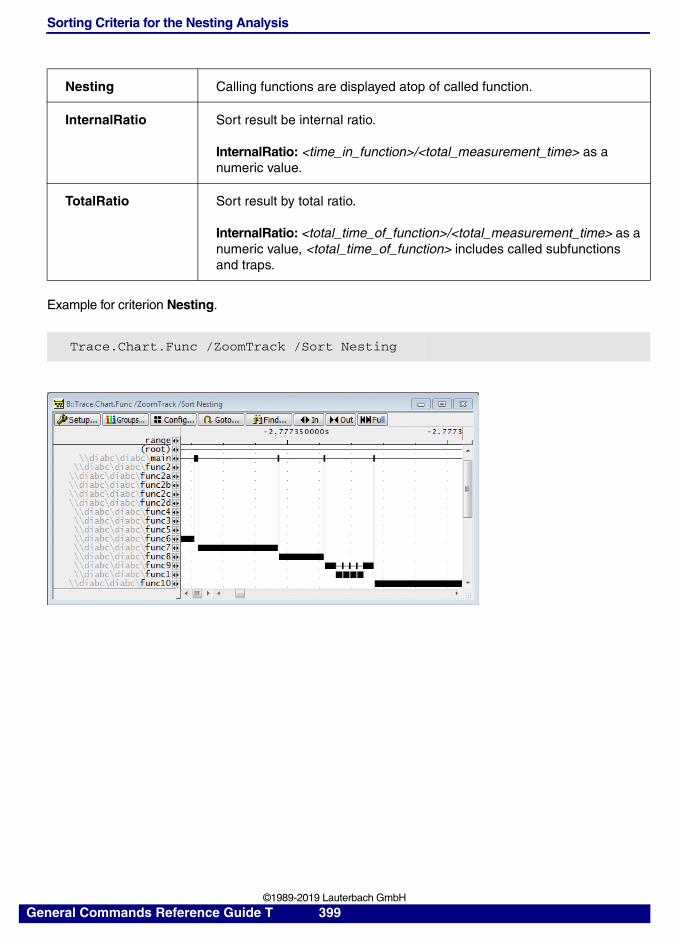
Sorting Criteria for the Nesting Analysis
Example for criterion Nesting.
Nesting Calling functions are displayed atop of called function.
InternalRatio Sort result be internal ratio.
InternalRatio: <time_in_function>/<total_measurement_time> as a numeric value.
TotalRatio Sort result by total ratio.
InternalRatio: <total_time_of_function>/<total_measurement_time> as a numeric value, <total_time_of_function> includes called subfunctions and traps.
Trace.Chart.Func /ZoomTrack /Sort Nesting
General Commands Reference Guide T 399 ©1989-2019 Lauterbach GmbH
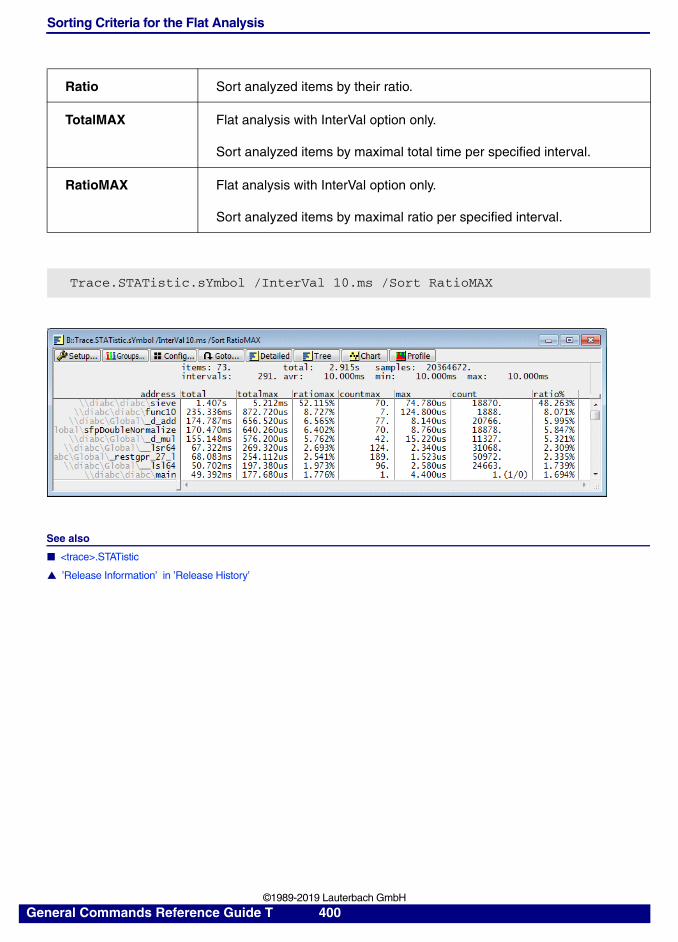
Sorting Criteria for the Flat Analysis
See also
■ <trace>.STATistic
▲ ’Release Information’ in ’Release History’
Ratio Sort analyzed items by their ratio.
TotalMAX Flat analysis with InterVal option only.
Sort analyzed items by maximal total time per specified interval.
RatioMAX Flat analysis with InterVal option only.
Sort analyzed items by maximal ratio per specified interval.
Trace.STATistic.sYmbol /InterVal 10.ms /Sort RatioMAX
General Commands Reference Guide T 400 ©1989-2019 Lauterbach GmbH
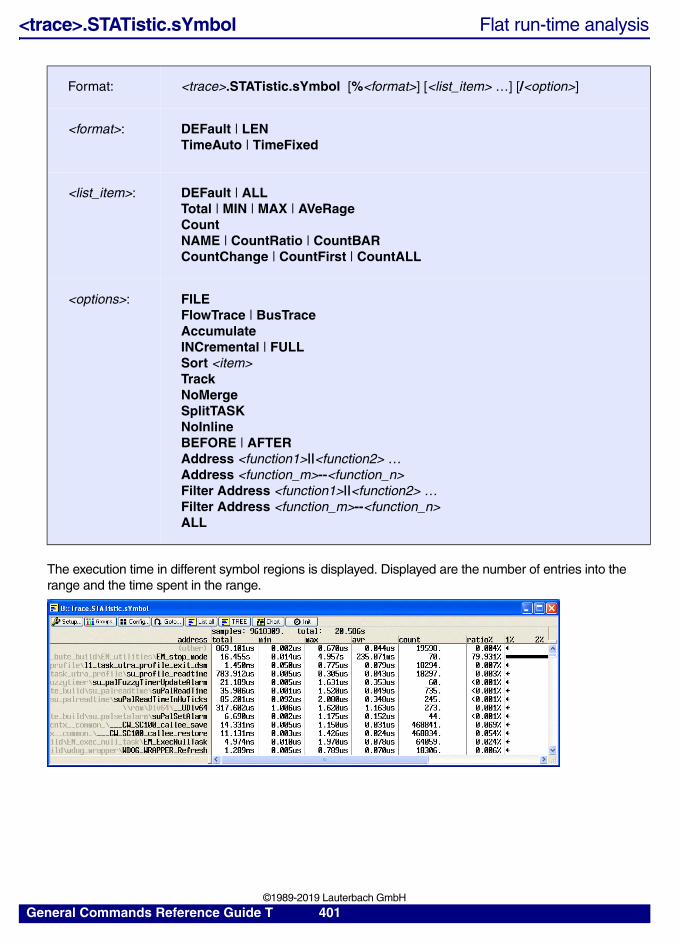
<trace>.STATistic.sYmbol Flat run-time analysis
The execution time in different symbol regions is displayed. Displayed are the number of entries into the range and the time spent in the range.
Format: <trace>.STATistic.sYmbol [%<format>] [<list_item> …] [/<option>]
<format>: DEFault | LENTimeAuto | TimeFixed
<list_item>: DEFault | ALLTotal | MIN | MAX | AVeRage Count NAME | CountRatio | CountBARCountChange | CountFirst | CountALL
<options>: FILEFlowTrace | BusTraceAccumulate INCremental | FULL Sort <item>TrackNoMergeSplitTASKNoInlineBEFORE | AFTERAddress <function1>||<function2> …Address <function_m>--<function_n>Filter Address <function1>||<function2> …Filter Address <function_m>--<function_n>ALL
General Commands Reference Guide T 401 ©1989-2019 Lauterbach GmbH
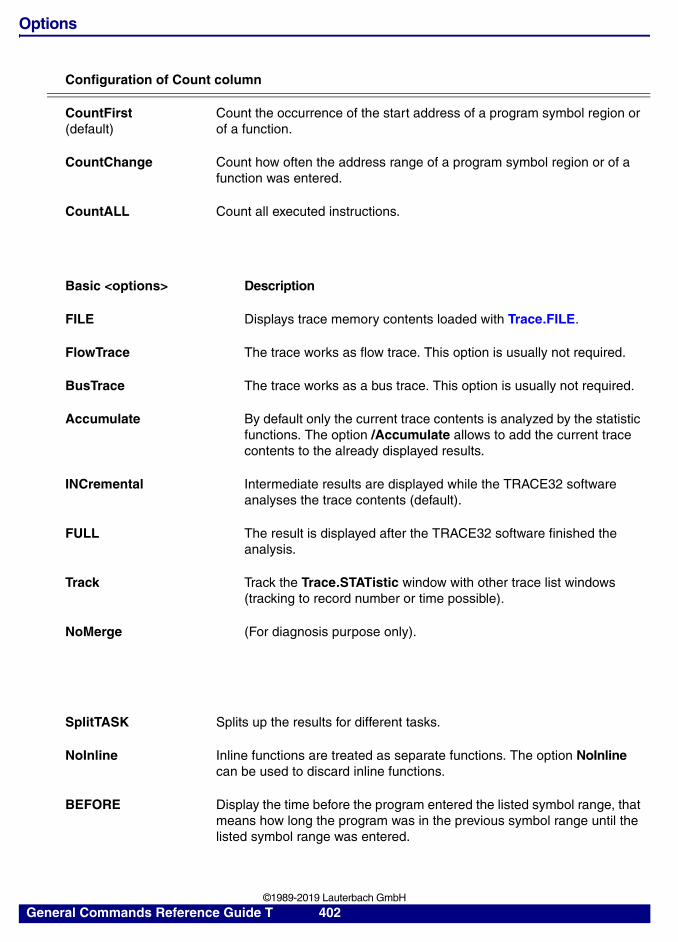
Options
Configuration of Count column
CountFirst (default)
Count the occurrence of the start address of a program symbol region or of a function.
CountChange Count how often the address range of a program symbol region or of a function was entered.
CountALL Count all executed instructions.
Basic <options> Description
FILE Displays trace memory contents loaded with Trace.FILE.
FlowTrace The trace works as flow trace. This option is usually not required.
BusTrace The trace works as a bus trace. This option is usually not required.
Accumulate By default only the current trace contents is analyzed by the statistic functions. The option /Accumulate allows to add the current trace contents to the already displayed results.
INCremental Intermediate results are displayed while the TRACE32 software analyses the trace contents (default).
FULL The result is displayed after the TRACE32 software finished the analysis.
Track Track the Trace.STATistic window with other trace list windows (tracking to record number or time possible).
NoMerge (For diagnosis purpose only).
SplitTASK Splits up the results for different tasks.
NoInline Inline functions are treated as separate functions. The option NoInline can be used to discard inline functions.
BEFORE Display the time before the program entered the listed symbol range, that means how long the program was in the previous symbol range until the listed symbol range was entered.
General Commands Reference Guide T 402 ©1989-2019 Lauterbach GmbH
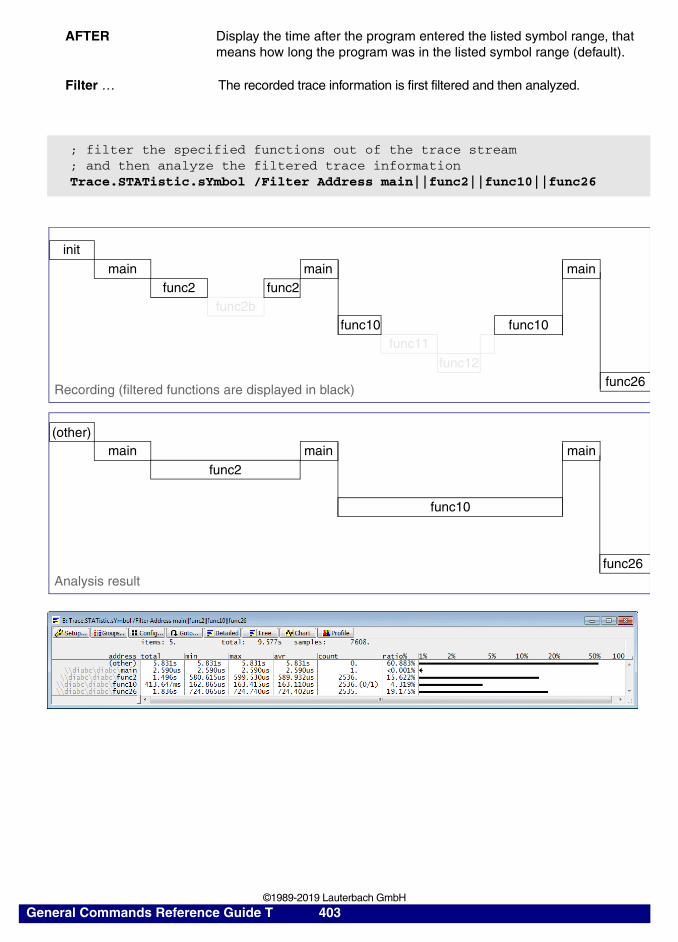
AFTER Display the time after the program entered the listed symbol range, that means how long the program was in the listed symbol range (default).
Filter … The recorded trace information is first filtered and then analyzed.
; filter the specified functions out of the trace stream ; and then analyze the filtered trace informationTrace.STATistic.sYmbol /Filter Address main||func2||func10||func26
func26
main
func2
main
func10
main
func26
Recording (filtered functions are displayed in black)
Analysis result
(other)
main main
func11func10
main
func2b
init
func2 func2
func12
func10
General Commands Reference Guide T 403 ©1989-2019 Lauterbach GmbH
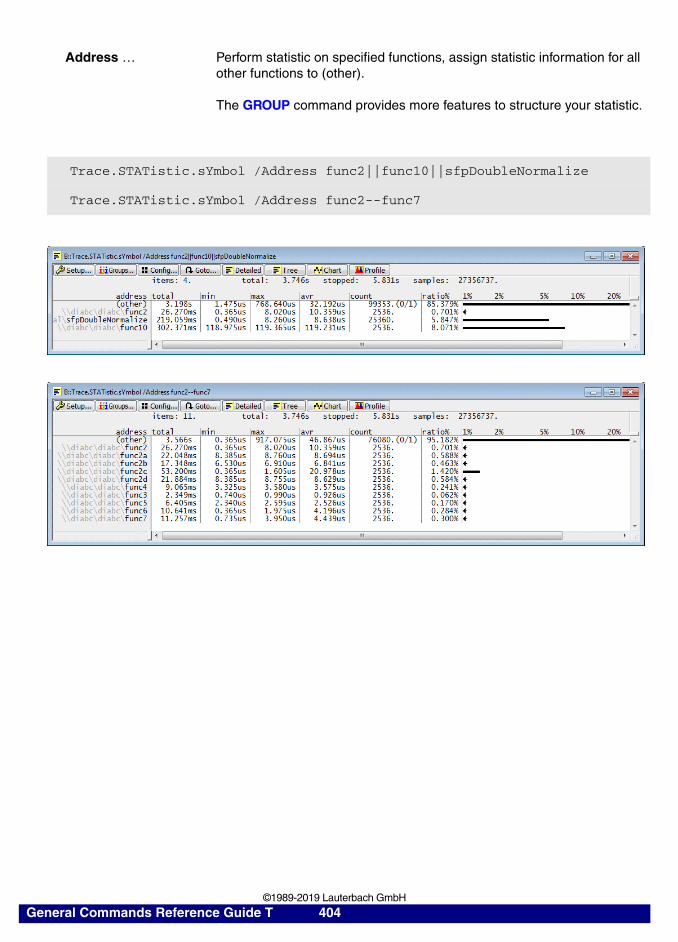
Address … Perform statistic on specified functions, assign statistic information for all other functions to (other).
The GROUP command provides more features to structure your statistic.
Trace.STATistic.sYmbol /Address func2||func10||sfpDoubleNormalize
Trace.STATistic.sYmbol /Address func2--func7
General Commands Reference Guide T 404 ©1989-2019 Lauterbach GmbH
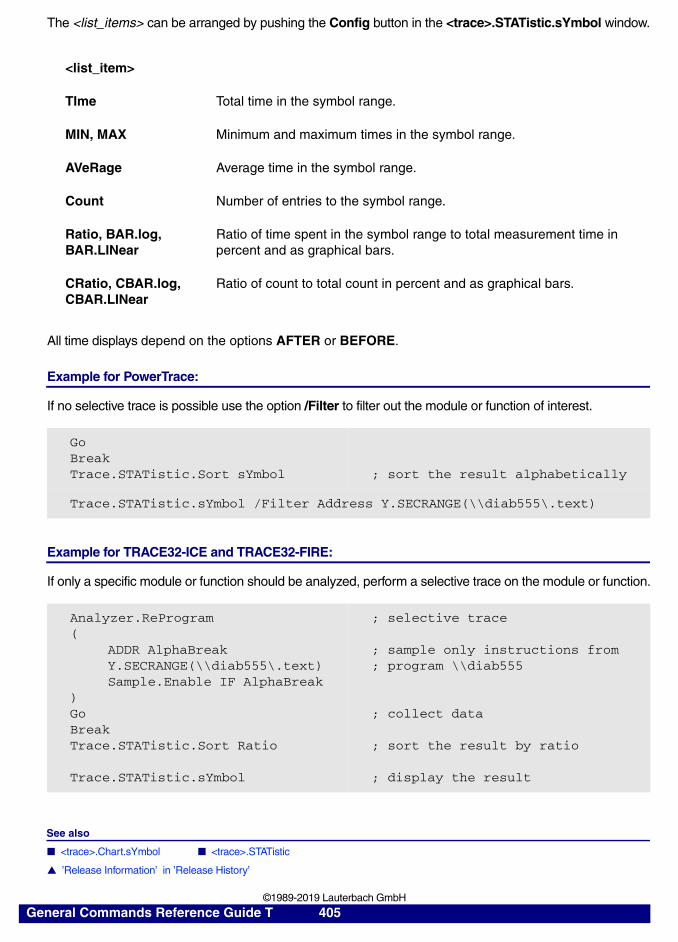
The <list_items> can be arranged by pushing the Config button in the <trace>.STATistic.sYmbol window.
All time displays depend on the options AFTER or BEFORE.
Example for PowerTrace:
If no selective trace is possible use the option /Filter to filter out the module or function of interest.
Example for TRACE32-ICE and TRACE32-FIRE:
If only a specific module or function should be analyzed, perform a selective trace on the module or function.
See also
■ <trace>.Chart.sYmbol ■ <trace>.STATistic
▲ ’Release Information’ in ’Release History’
<list_item>
TIme Total time in the symbol range.
MIN, MAX Minimum and maximum times in the symbol range.
AVeRage Average time in the symbol range.
Count Number of entries to the symbol range.
Ratio, BAR.log, BAR.LINear
Ratio of time spent in the symbol range to total measurement time in percent and as graphical bars.
CRatio, CBAR.log, CBAR.LINear
Ratio of count to total count in percent and as graphical bars.
GoBreakTrace.STATistic.Sort sYmbol ; sort the result alphabetically
Trace.STATistic.sYmbol /Filter Address Y.SECRANGE(\\diab555\.text)
Analyzer.ReProgram(
ADDR AlphaBreak Y.SECRANGE(\\diab555\.text)Sample.Enable IF AlphaBreak
) GoBreakTrace.STATistic.Sort Ratio
Trace.STATistic.sYmbol
; selective trace
; sample only instructions from ; program \\diab555
; collect data
; sort the result by ratio
; display the result
General Commands Reference Guide T 405 ©1989-2019 Lauterbach GmbH
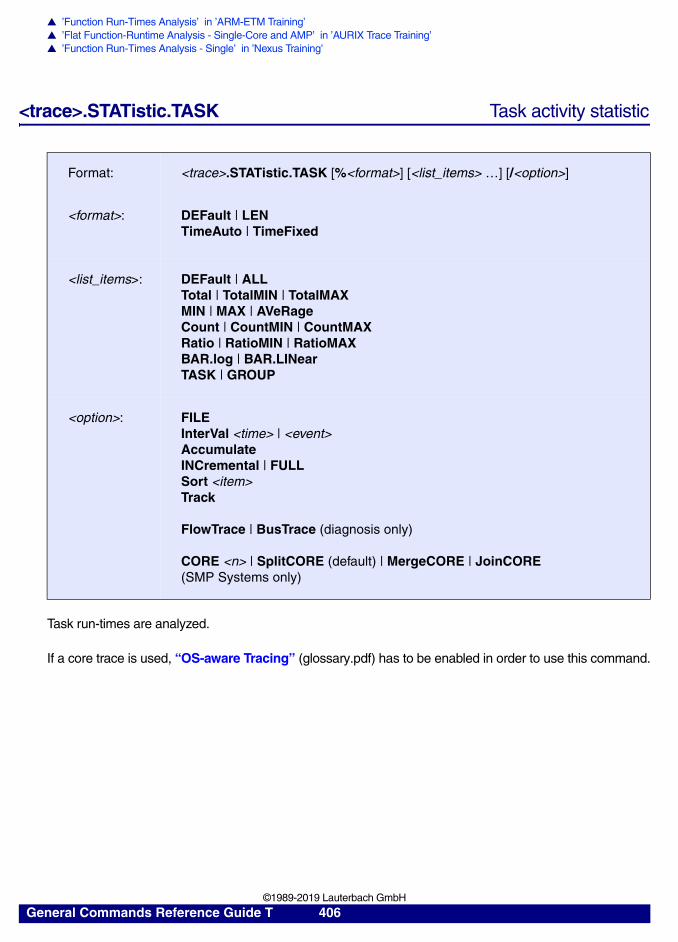
▲ ’Function Run-Times Analysis’ in ’ARM-ETM Training’▲ ’Flat Function-Runtime Analysis - Single-Core and AMP’ in ’AURIX Trace Training’▲ ’Function Run-Times Analysis - Single’ in ’Nexus Training’
<trace>.STATistic.TASK Task activity statistic
Task run-times are analyzed.
If a core trace is used, “OS-aware Tracing” (glossary.pdf) has to be enabled in order to use this command.
Format: <trace>.STATistic.TASK [%<format>] [<list_items> …] [/<option>]
<format>: DEFault | LENTimeAuto | TimeFixed
<list_items>: DEFault | ALLTotal | TotalMIN | TotalMAXMIN | MAX | AVeRage Count | CountMIN | CountMAXRatio | RatioMIN | RatioMAX BAR.log | BAR.LINearTASK | GROUP
<option>: FILEInterVal <time> | <event>Accumulate INCremental | FULL Sort <item>Track
FlowTrace | BusTrace (diagnosis only)
CORE <n> | SplitCORE (default) | MergeCORE | JoinCORE (SMP Systems only)
General Commands Reference Guide T 406 ©1989-2019 Lauterbach GmbH
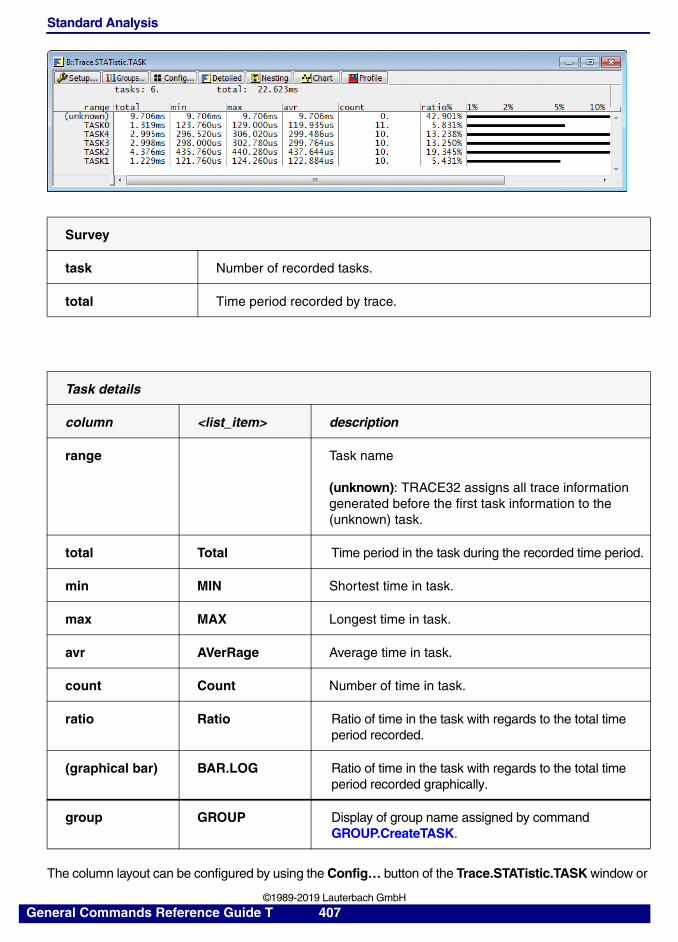
Standard Analysis
The column layout can be configured by using the Config… button of the Trace.STATistic.TASK window or
Survey
task Number of recorded tasks.
total Time period recorded by trace.
Task details
column <list_item> description
range Task name
(unknown): TRACE32 assigns all trace information generated before the first task information to the (unknown) task.
total Total Time period in the task during the recorded time period.
min MIN Shortest time in task.
max MAX Longest time in task.
avr AVerRage Average time in task.
count Count Number of time in task.
ratio Ratio Ratio of time in the task with regards to the total time period recorded.
(graphical bar) BAR.LOG Ratio of time in the task with regards to the total time period recorded graphically.
group GROUP Display of group name assigned by command GROUP.CreateTASK.
General Commands Reference Guide T 407 ©1989-2019 Lauterbach GmbH
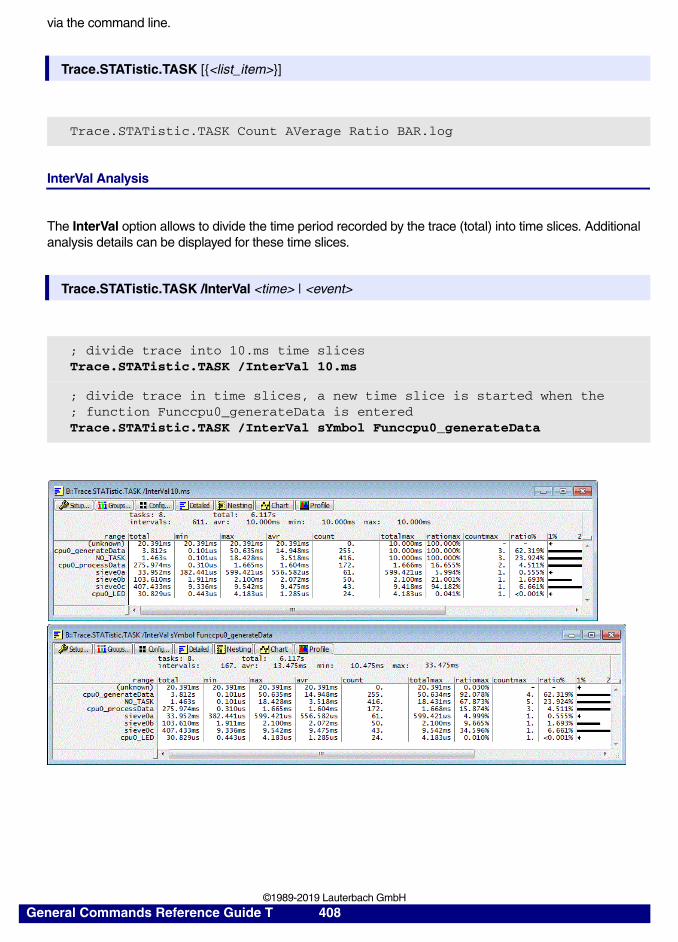
via the command line.
InterVal Analysis
The InterVal option allows to divide the time period recorded by the trace (total) into time slices. Additional analysis details can be displayed for these time slices.
Trace.STATistic.TASK [{<list_item>}]
Trace.STATistic.TASK Count AVerage Ratio BAR.log
Trace.STATistic.TASK /InterVal <time> | <event>
; divide trace into 10.ms time slicesTrace.STATistic.TASK /InterVal 10.ms
; divide trace in time slices, a new time slice is started when the; function Funccpu0_generateData is enteredTrace.STATistic.TASK /InterVal sYmbol Funccpu0_generateData
General Commands Reference Guide T 408 ©1989-2019 Lauterbach GmbH
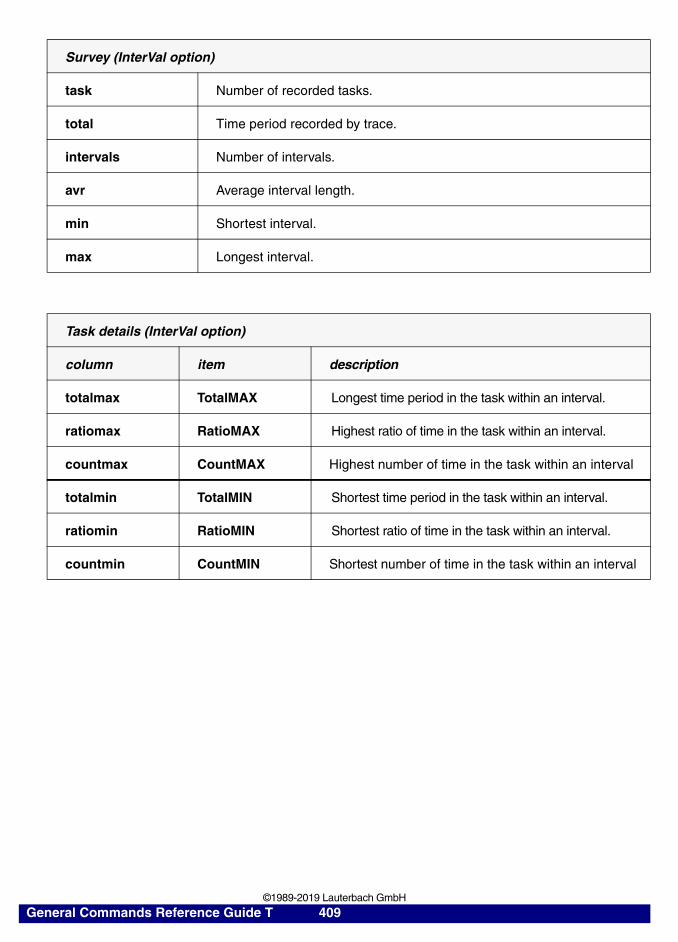
Survey (InterVal option)
task Number of recorded tasks.
total Time period recorded by trace.
intervals Number of intervals.
avr Average interval length.
min Shortest interval.
max Longest interval.
Task details (InterVal option)
column item description
totalmax TotalMAX Longest time period in the task within an interval.
ratiomax RatioMAX Highest ratio of time in the task within an interval.
countmax CountMAX Highest number of time in the task within an interval
totalmin TotalMIN Shortest time period in the task within an interval.
ratiomin RatioMIN Shortest ratio of time in the task within an interval.
countmin CountMIN Shortest number of time in the task within an interval
General Commands Reference Guide T 409 ©1989-2019 Lauterbach GmbH
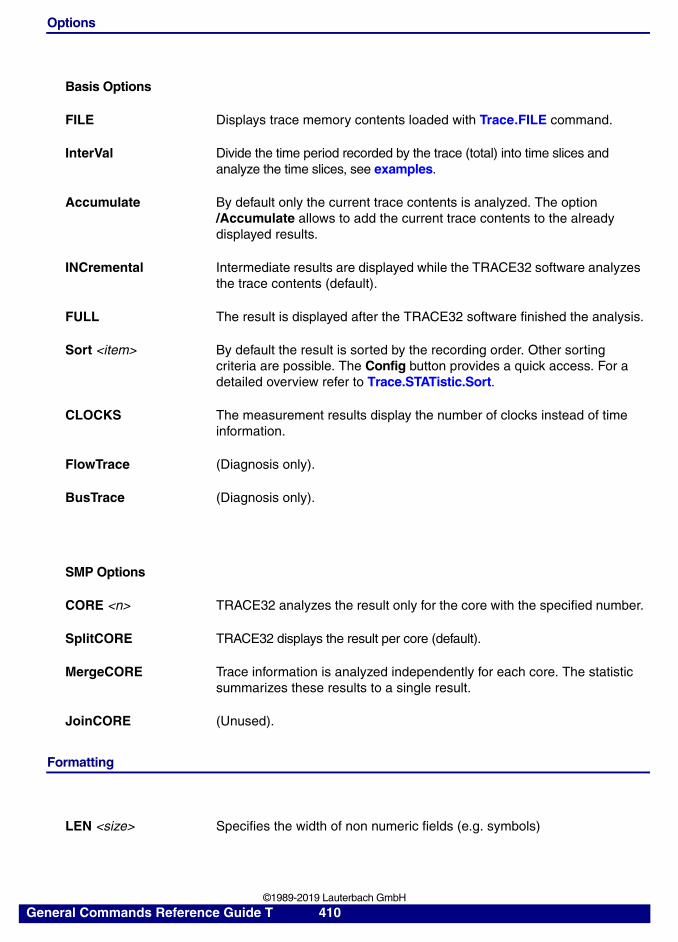
Options
Formatting
Basis Options
FILE Displays trace memory contents loaded with Trace.FILE command.
InterVal Divide the time period recorded by the trace (total) into time slices and analyze the time slices, see examples.
Accumulate By default only the current trace contents is analyzed. The option /Accumulate allows to add the current trace contents to the already displayed results.
INCremental Intermediate results are displayed while the TRACE32 software analyzes the trace contents (default).
FULL The result is displayed after the TRACE32 software finished the analysis.
Sort <item> By default the result is sorted by the recording order. Other sorting criteria are possible. The Config button provides a quick access. For a detailed overview refer to Trace.STATistic.Sort.
CLOCKS The measurement results display the number of clocks instead of time information.
FlowTrace (Diagnosis only).
BusTrace (Diagnosis only).
SMP Options
CORE <n> TRACE32 analyzes the result only for the core with the specified number.
SplitCORE TRACE32 displays the result per core (default).
MergeCORE Trace information is analyzed independently for each core. The statistic summarizes these results to a single result.
JoinCORE (Unused).
LEN <size> Specifies the width of non numeric fields (e.g. symbols)
General Commands Reference Guide T 410 ©1989-2019 Lauterbach GmbH
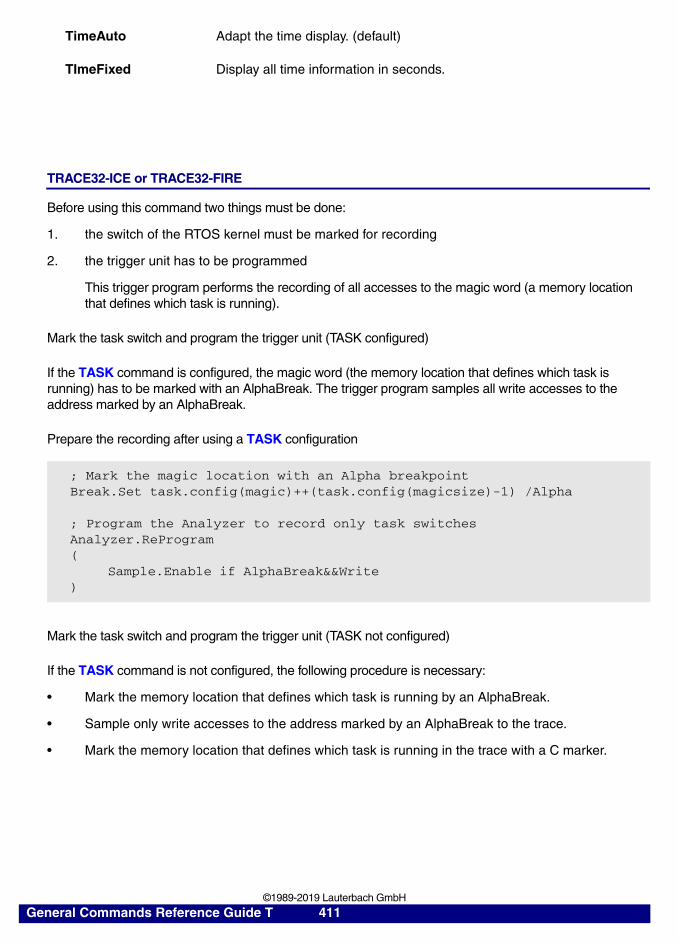
TRACE32-ICE or TRACE32-FIRE
Before using this command two things must be done:
1. the switch of the RTOS kernel must be marked for recording
2. the trigger unit has to be programmed
This trigger program performs the recording of all accesses to the magic word (a memory location that defines which task is running).
Mark the task switch and program the trigger unit (TASK configured)
If the TASK command is configured, the magic word (the memory location that defines which task is running) has to be marked with an AlphaBreak. The trigger program samples all write accesses to the address marked by an AlphaBreak.
Prepare the recording after using a TASK configuration
Mark the task switch and program the trigger unit (TASK not configured)
If the TASK command is not configured, the following procedure is necessary:
• Mark the memory location that defines which task is running by an AlphaBreak.
• Sample only write accesses to the address marked by an AlphaBreak to the trace.
• Mark the memory location that defines which task is running in the trace with a C marker.
TimeAuto Adapt the time display. (default)
TImeFixed Display all time information in seconds.
; Mark the magic location with an Alpha breakpointBreak.Set task.config(magic)++(task.config(magicsize)-1) /Alpha
; Program the Analyzer to record only task switchesAnalyzer.ReProgram(
Sample.Enable if AlphaBreak&&Write)
General Commands Reference Guide T 411 ©1989-2019 Lauterbach GmbH
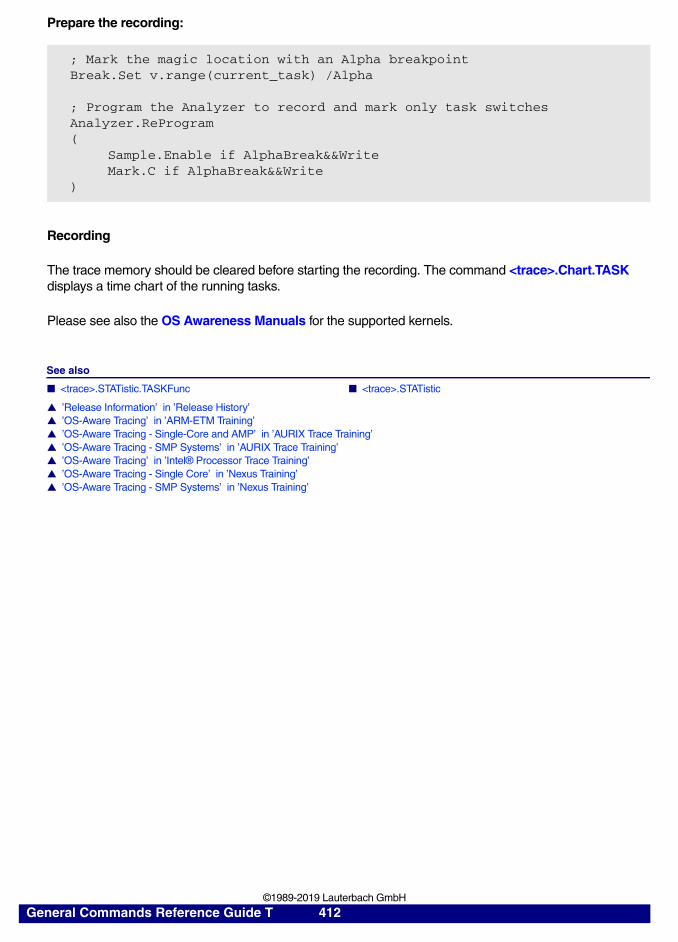
Prepare the recording:
Recording
The trace memory should be cleared before starting the recording. The command <trace>.Chart.TASK displays a time chart of the running tasks.
Please see also the OS Awareness Manuals for the supported kernels.
See also
■ <trace>.STATistic.TASKFunc ■ <trace>.STATistic
▲ ’Release Information’ in ’Release History’▲ ’OS-Aware Tracing’ in ’ARM-ETM Training’▲ ’OS-Aware Tracing - Single-Core and AMP’ in ’AURIX Trace Training’▲ ’OS-Aware Tracing - SMP Systems’ in ’AURIX Trace Training’▲ ’OS-Aware Tracing’ in ’Intel® Processor Trace Training’▲ ’OS-Aware Tracing - Single Core’ in ’Nexus Training’▲ ’OS-Aware Tracing - SMP Systems’ in ’Nexus Training’
; Mark the magic location with an Alpha breakpointBreak.Set v.range(current_task) /Alpha
; Program the Analyzer to record and mark only task switchesAnalyzer.ReProgram(
Sample.Enable if AlphaBreak&&WriteMark.C if AlphaBreak&&Write
)
General Commands Reference Guide T 412 ©1989-2019 Lauterbach GmbH
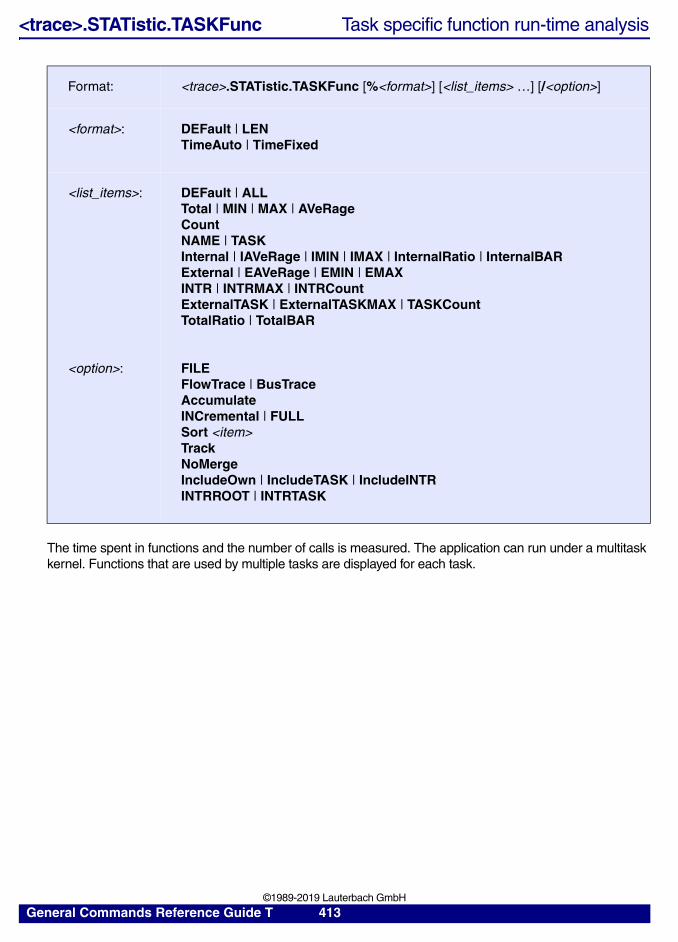
<trace>.STATistic.TASKFunc Task specific function run-time analysis
The time spent in functions and the number of calls is measured. The application can run under a multitask kernel. Functions that are used by multiple tasks are displayed for each task.
Format: <trace>.STATistic.TASKFunc [%<format>] [<list_items> …] [/<option>]
<format>: DEFault | LENTimeAuto | TimeFixed
<list_items>: DEFault | ALLTotal | MIN | MAX | AVeRage Count NAME | TASKInternal | IAVeRage | IMIN | IMAX | InternalRatio | InternalBARExternal | EAVeRage | EMIN | EMAXINTR | INTRMAX | INTRCount ExternalTASK | ExternalTASKMAX | TASKCountTotalRatio | TotalBAR
<option>: FILEFlowTrace | BusTraceAccumulate INCremental | FULL Sort <item>TrackNoMergeIncludeOwn | IncludeTASK | IncludeINTRINTRROOT | INTRTASK
General Commands Reference Guide T 413 ©1989-2019 Lauterbach GmbH
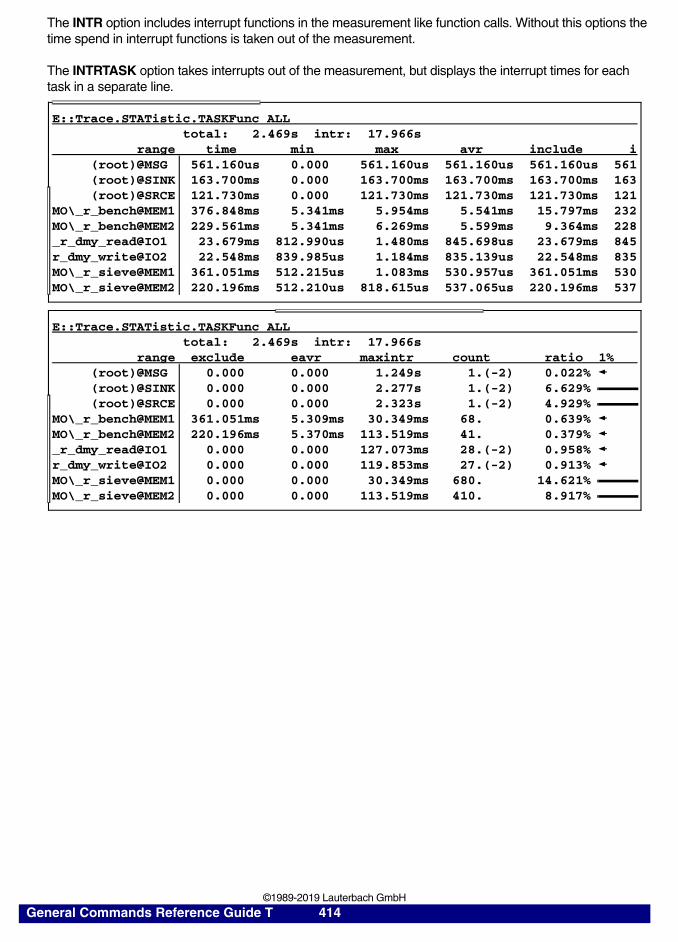
The INTR option includes interrupt functions in the measurement like function calls. Without this options the time spend in interrupt functions is taken out of the measurement.
The INTRTASK option takes interrupts out of the measurement, but displays the interrupt times for each task in a separate line.
E::Trace.STATistic.TASKFunc ALLtotal: 2.469s intr: 17.966s
range time min max avr include i(root)@MSG 561.160us 0.000 561.160us 561.160us 561.160us 561(root)@SINK 163.700ms 0.000 163.700ms 163.700ms 163.700ms 163(root)@SRCE 121.730ms 0.000 121.730ms 121.730ms 121.730ms 121
MO\_r_bench@MEM1 376.848ms 5.341ms 5.954ms 5.541ms 15.797ms 232MO\_r_bench@MEM2 229.561ms 5.341ms 6.269ms 5.599ms 9.364ms 228_r_dmy_read@IO1 23.679ms 812.990us 1.480ms 845.698us 23.679ms 845r_dmy_write@IO2 22.548ms 839.985us 1.184ms 835.139us 22.548ms 835MO\_r_sieve@MEM1 361.051ms 512.215us 1.083ms 530.957us 361.051ms 530MO\_r_sieve@MEM2 220.196ms 512.210us 818.615us 537.065us 220.196ms 537
E::Trace.STATistic.TASKFunc ALLtotal: 2.469s intr: 17.966s
range exclude eavr maxintr count ratio 1%(root)@MSG 0.000 0.000 1.249s 1.(-2) 0.022%(root)@SINK 0.000 0.000 2.277s 1.(-2) 6.629%(root)@SRCE 0.000 0.000 2.323s 1.(-2) 4.929%
MO\_r_bench@MEM1 361.051ms 5.309ms 30.349ms 68. 0.639%MO\_r_bench@MEM2 220.196ms 5.370ms 113.519ms 41. 0.379%_r_dmy_read@IO1 0.000 0.000 127.073ms 28.(-2) 0.958%r_dmy_write@IO2 0.000 0.000 119.853ms 27.(-2) 0.913%MO\_r_sieve@MEM1 0.000 0.000 30.349ms 680. 14.621%MO\_r_sieve@MEM2 0.000 0.000 113.519ms 410. 8.917%
General Commands Reference Guide T 414 ©1989-2019 Lauterbach GmbH
Procedure for Measurement for TRACE32-ICD and PowerTrace
The command Trace.STATistic.TASKFunc can be used, if the trace information output by the processor includes data write cycles.
The measurement is based on marking:
• All function entries and exits
• All task switches
Mark the Functions
Here for most CPUs it isn’t possible to perform a selective trace. In order to perform the measurement set Alpha breakpoints implemented as software breakpoints to all function entries and Beta breakpoints implemented as software breakpoints to all function exits.
These breakpoints can be set automatically with the command Break.SetFunc, if HLL-functions are loaded. Assembler functions or e.g. loops within HLL-functions can also be marked manually.
The entry points of interrupt routines should be marked with Alpha and Charly breakpoints. Thus the analysis ignores interrupt function times and takes care about double fetches caused by interrupted programs.
If all interrupt routines are located in a specific memory range or within a specific HLL module the interrupt routines can be marked automatically by using the command Break.SetFunction <range>| <module> /INTR.
If there is a name convention for interrupt routines use the sYmbol.ForEach command to mark the interrupt routines.
Mark the Task Switch (TASK configured)
If a TASK configuration is used, no extra preparations are necessary. If the processor allows to restrict the output to specific data write cycles, it is recommended to restrict the output to write cycles to task.config(magic)++(task.config(magicsize)-1) since more information can be sampled into the trace buffer.
Mark the Task Switch (TASK not configured)
If no TASK configuration is used, set an Alpha, Beta and Charly breakpoint implemented as software breakpoint to “current_task” (assuming “current_task” to be the variable which holds the ID of the current running task). The data present at this cycle will be used in the statistic to identify the task.
If the time spent in the kernel should be excluded from the measurement the entry of the kernel has to be marked with a Charly breakpoint implemented as software breakpoint and exit of the kernel have to be marked with a Charly and a Beta breakpoint implemented as software breakpoint.
Break.Set v.range(current_task) /Alpha /Beta /Charly /Soft
General Commands Reference Guide T 415 ©1989-2019 Lauterbach GmbH
Recording
The complete program flow is recorded and the records of interest (function entries, function exits, interrupt entries and interrupt exits) are marked in the trace. The trace memory should be cleared before starting the recording. This is automatically done if Analyzer.AutoInit is ON.
Check the trace by viewing the record with <trace>.List MARK DEFault.
Procedure for Measurement for TRACE32-ICE and TRACE32-FIRE
The measurement is based on selective tracing of:
• all function entries and exits
• all task switches
Mark the Functions
In order to perform this measurement all function entries have to be marked with an Alpha breakpoint, and all function exits have to be marked with a Beta breakpoint. These breakpoints can be set automatically with the command Break.SetFunc, if HLL-functions are loaded. Assembler functions or e.g. loops within HLL-functions can also be marked manually.
The entry points of interrupt routines should be marked with Alpha and Charly (or Beta on ECC8) breakpoints. Thus the analysis ignores interrupt function times and takes care about double fetches caused by interrupted programs.
If all interrupt routines are located in a specific memory range or within a specific HLL module the interrupt routines can be marked automatically by using the command Break.SetFunction <range>| <module> /INTR.
If there is a name convention for interrupt routines use the sYmbol.ForEach command to mark the interrupt routines.
Mark the Task Switch (TASK configured)
If the TASK command is configured, the magic word (the memory location that defines which task is running) has to be marked with an AlphaBreak.
Mark the Task Switch (without TASK configured)
If the TASK command is not configured, the access cycle identifying the next running task has to be traced and marked in the trace by 'A'+'B'+'C' markers. The data present at this cycle will be displayed in the statistic to identify the task. If the time spent in the kernel should be excluded from the measurement the entry and exit of the kernel have to be traced and marked with 'C' and 'C'+'B'.
General Commands Reference Guide T 416 ©1989-2019 Lauterbach GmbH
Programming of the Trigger Unit
The trigger unit is programmed to record accesses to ALPHA, BETA or CHARLY breakpoints and mark the record in the trace buffer as follows:
• Function entries are marked with an A marker.
• Function exits are marked with a B marker.
• Interrupt entries are marked with an A and a C marker.
• Interrupt exits are marked with a B marker.
• Task switches are marked with an A, B and C marker (without TASK configuration only)
• Entries to the kernel are marked with a C marker (without TASK configuration only)
• Exits of the kernel are marked with a B and C marker (without TASK configuration only)
Recording
The trace memory should be cleared before starting the recording. Check the trace by viewing the record with <trace>.List MARK List.TASK DEFault.
A display of the nesting is possible with the command <trace>.List FUNC FUNCR List.TASK (this command uses the same strategy to determine function entries and exits). If the nesting of the functions is not correct (each function entry must have its corresponding function exit), the results will be incorrect and an error message will be displayed in the statistic window. If single records are wrong, the commands <trace>.STATistic.PreFetch or <trace>.STATistic.Ignore can be used to remove them from the measurement.
The command <trace>.STATistic.TASKTREE can also be used to verify the correct function nesting. The command <trace>.Chart.TASKFunc displays a time chart of the function usage.
Analyzer.ReProgram(
Sample.Enable IF AlphaBreak||BetaBreak||CharlyBreakMark.A IF AlphaBreakMark.B IF BetaBreakMark.C IF CharlyBreak
)
General Commands Reference Guide T 417 ©1989-2019 Lauterbach GmbH
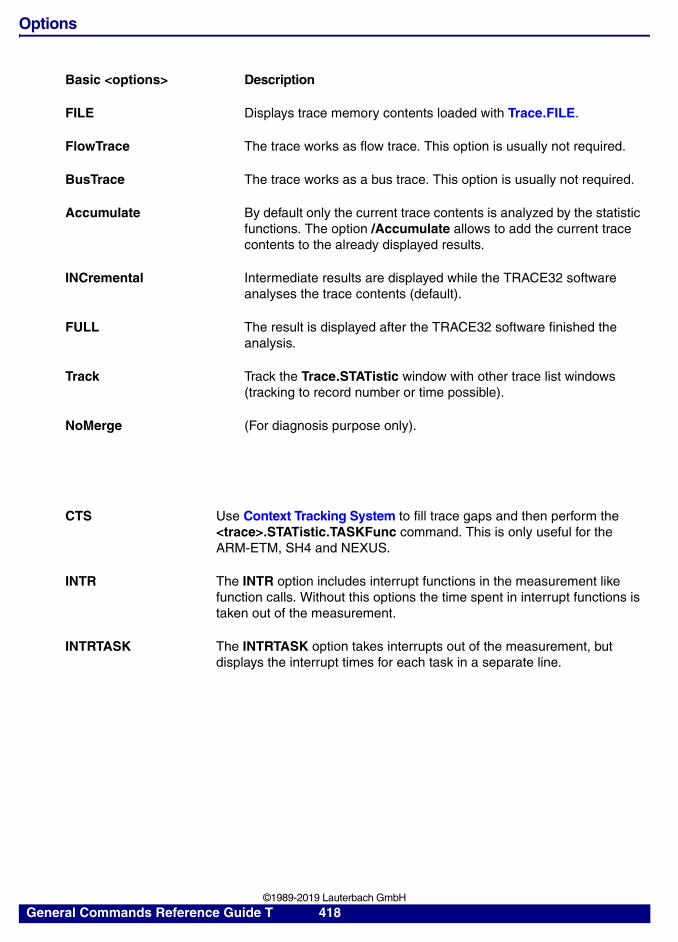
Options
Basic <options> Description
FILE Displays trace memory contents loaded with Trace.FILE.
FlowTrace The trace works as flow trace. This option is usually not required.
BusTrace The trace works as a bus trace. This option is usually not required.
Accumulate By default only the current trace contents is analyzed by the statistic functions. The option /Accumulate allows to add the current trace contents to the already displayed results.
INCremental Intermediate results are displayed while the TRACE32 software analyses the trace contents (default).
FULL The result is displayed after the TRACE32 software finished the analysis.
Track Track the Trace.STATistic window with other trace list windows (tracking to record number or time possible).
NoMerge (For diagnosis purpose only).
CTS Use Context Tracking System to fill trace gaps and then perform the <trace>.STATistic.TASKFunc command. This is only useful for the ARM-ETM, SH4 and NEXUS.
INTR The INTR option includes interrupt functions in the measurement like function calls. Without this options the time spent in interrupt functions is taken out of the measurement.
INTRTASK The INTRTASK option takes interrupts out of the measurement, but displays the interrupt times for each task in a separate line.
General Commands Reference Guide T 418 ©1989-2019 Lauterbach GmbH
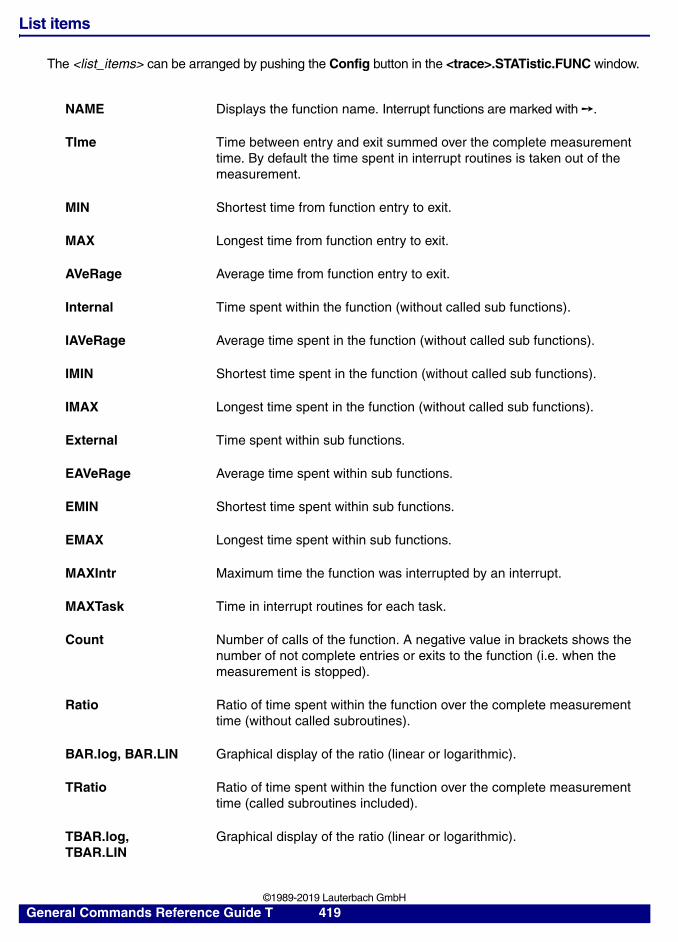
List items
The <list_items> can be arranged by pushing the Config button in the <trace>.STATistic.FUNC window.
NAME Displays the function name. Interrupt functions are marked with ➙.
TIme Time between entry and exit summed over the complete measurement time. By default the time spent in interrupt routines is taken out of the measurement.
MIN Shortest time from function entry to exit.
MAX Longest time from function entry to exit.
AVeRage Average time from function entry to exit.
Internal Time spent within the function (without called sub functions).
IAVeRage Average time spent in the function (without called sub functions).
IMIN Shortest time spent in the function (without called sub functions).
IMAX Longest time spent in the function (without called sub functions).
External Time spent within sub functions.
EAVeRage Average time spent within sub functions.
EMIN Shortest time spent within sub functions.
EMAX Longest time spent within sub functions.
MAXIntr Maximum time the function was interrupted by an interrupt.
MAXTask Time in interrupt routines for each task.
Count Number of calls of the function. A negative value in brackets shows the number of not complete entries or exits to the function (i.e. when the measurement is stopped).
Ratio Ratio of time spent within the function over the complete measurement time (without called subroutines).
BAR.log, BAR.LIN Graphical display of the ratio (linear or logarithmic).
TRatio Ratio of time spent within the function over the complete measurement time (called subroutines included).
TBAR.log, TBAR.LIN
Graphical display of the ratio (linear or logarithmic).
General Commands Reference Guide T 419 ©1989-2019 Lauterbach GmbH

Formats
See also
■ <trace>.STATistic.TASK ■ <trace>.STATistic
▲ ’Release Information’ in ’Release History’
LEN <size> Specifies the width of non numeric fields (e.g. symbols)
TimeAuto Adapt the time display. (default)
TImeFixed Display all time information in seconds.
General Commands Reference Guide T 420 ©1989-2019 Lauterbach GmbH
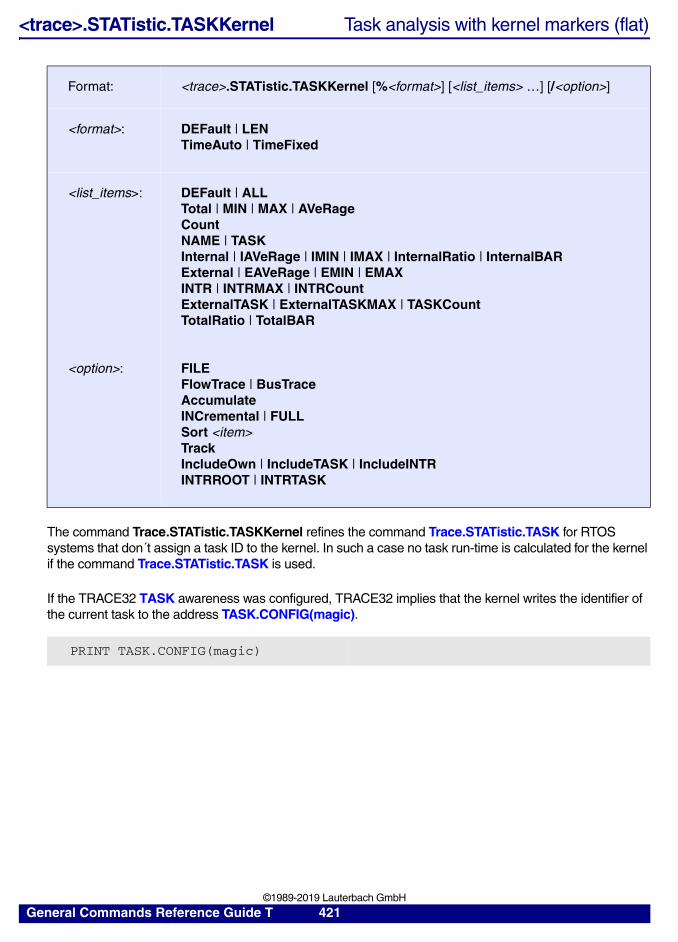
<trace>.STATistic.TASKKernel Task analysis with kernel markers (flat)
The command Trace.STATistic.TASKKernel refines the command Trace.STATistic.TASK for RTOS systems that don´t assign a task ID to the kernel. In such a case no task run-time is calculated for the kernel if the command Trace.STATistic.TASK is used.
If the TRACE32 TASK awareness was configured, TRACE32 implies that the kernel writes the identifier of the current task to the address TASK.CONFIG(magic).
Format: <trace>.STATistic.TASKKernel [%<format>] [<list_items> …] [/<option>]
<format>: DEFault | LENTimeAuto | TimeFixed
<list_items>: DEFault | ALLTotal | MIN | MAX | AVeRage Count NAME | TASKInternal | IAVeRage | IMIN | IMAX | InternalRatio | InternalBARExternal | EAVeRage | EMIN | EMAXINTR | INTRMAX | INTRCount ExternalTASK | ExternalTASKMAX | TASKCountTotalRatio | TotalBAR
<option>: FILEFlowTrace | BusTraceAccumulate INCremental | FULL Sort <item>TrackIncludeOwn | IncludeTASK | IncludeINTRINTRROOT | INTRTASK
PRINT TASK.CONFIG(magic)
General Commands Reference Guide T 421 ©1989-2019 Lauterbach GmbH
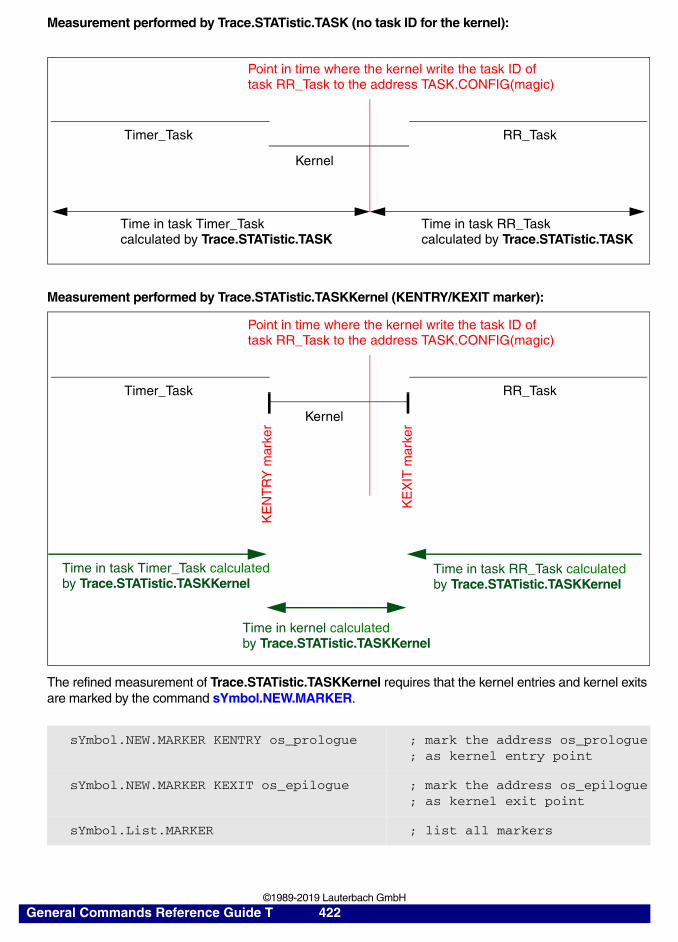
Measurement performed by Trace.STATistic.TASK (no task ID for the kernel):
Measurement performed by Trace.STATistic.TASKKernel (KENTRY/KEXIT marker):
The refined measurement of Trace.STATistic.TASKKernel requires that the kernel entries and kernel exits are marked by the command sYmbol.NEW.MARKER.
sYmbol.NEW.MARKER KENTRY os_prologue ; mark the address os_prologue; as kernel entry point
sYmbol.NEW.MARKER KEXIT os_epilogue ; mark the address os_epilogue; as kernel exit point
sYmbol.List.MARKER ; list all markers
Timer_Task
Kernel
RR_Task
Point in time where the kernel write the task ID of task RR_Task to the address TASK.CONFIG(magic)
Time in task Timer_Taskcalculated by Trace.STATistic.TASK
Time in task RR_Taskcalculated by Trace.STATistic.TASK
Timer_Task
Kernel
RR_Task
Point in time where the kernel write the task ID of task RR_Task to the address TASK.CONFIG(magic)
Time in task Timer_Task calculated by Trace.STATistic.TASKKernel
Time in kernel calculated by Trace.STATistic.TASKKernel
Time in task RR_Task calculated by Trace.STATistic.TASKKernel
KE
NT
RY
mar
ker
KE
XIT
mar
ker
General Commands Reference Guide T 422 ©1989-2019 Lauterbach GmbH
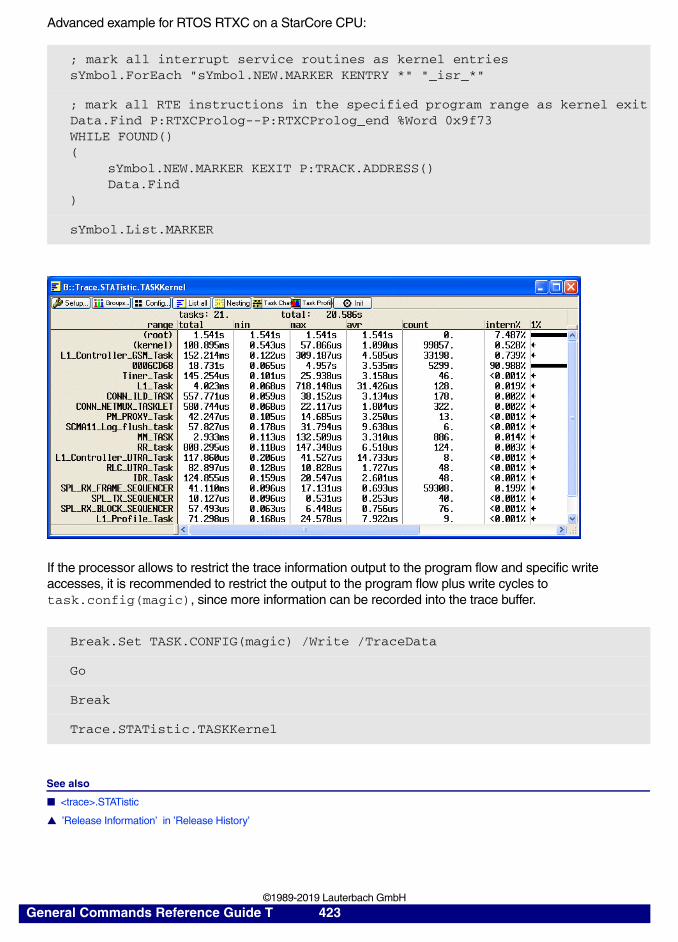
Advanced example for RTOS RTXC on a StarCore CPU:
If the processor allows to restrict the trace information output to the program flow and specific write accesses, it is recommended to restrict the output to the program flow plus write cycles to task.config(magic), since more information can be recorded into the trace buffer.
See also
■ <trace>.STATistic
▲ ’Release Information’ in ’Release History’
; mark all interrupt service routines as kernel entriessYmbol.ForEach "sYmbol.NEW.MARKER KENTRY *" "_isr_*"
; mark all RTE instructions in the specified program range as kernel exitData.Find P:RTXCProlog--P:RTXCProlog_end %Word 0x9f73WHILE FOUND()(
sYmbol.NEW.MARKER KEXIT P:TRACK.ADDRESS()Data.Find
)
sYmbol.List.MARKER
Break.Set TASK.CONFIG(magic) /Write /TraceData
Go
Break
Trace.STATistic.TASKKernel
General Commands Reference Guide T 423 ©1989-2019 Lauterbach GmbH
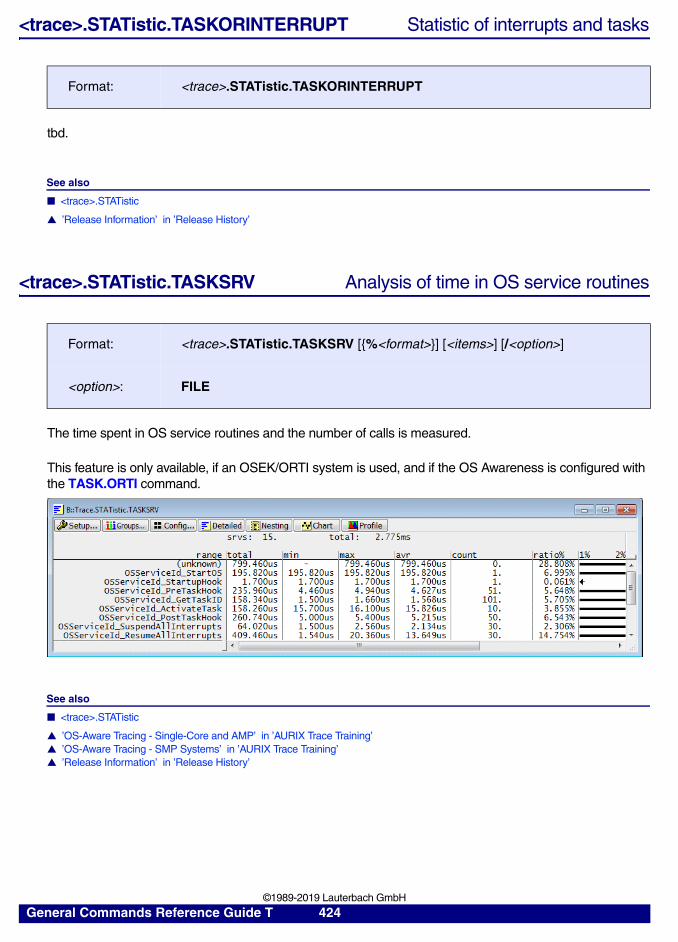
<trace>.STATistic.TASKORINTERRUPT Statistic of interrupts and tasks
tbd.
See also
■ <trace>.STATistic
▲ ’Release Information’ in ’Release History’
<trace>.STATistic.TASKSRV Analysis of time in OS service routines
The time spent in OS service routines and the number of calls is measured.
This feature is only available, if an OSEK/ORTI system is used, and if the OS Awareness is configured with the TASK.ORTI command.
See also
■ <trace>.STATistic
▲ ’OS-Aware Tracing - Single-Core and AMP’ in ’AURIX Trace Training’▲ ’OS-Aware Tracing - SMP Systems’ in ’AURIX Trace Training’▲ ’Release Information’ in ’Release History’
Format: <trace>.STATistic.TASKORINTERRUPT
Format: <trace>.STATistic.TASKSRV [{%<format>}] [<items>] [/<option>]
<option>: FILE
General Commands Reference Guide T 424 ©1989-2019 Lauterbach GmbH
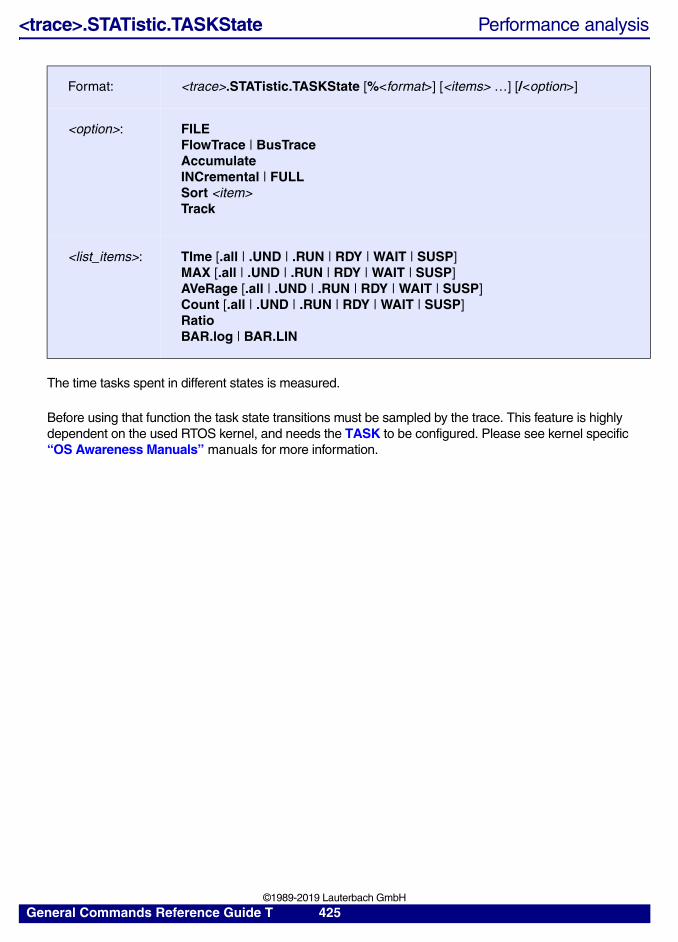
<trace>.STATistic.TASKState Performance analysis
The time tasks spent in different states is measured.
Before using that function the task state transitions must be sampled by the trace. This feature is highly dependent on the used RTOS kernel, and needs the TASK to be configured. Please see kernel specific “OS Awareness Manuals” manuals for more information.
Format: <trace>.STATistic.TASKState [%<format>] [<items> …] [/<option>]
<option>: FILEFlowTrace | BusTraceAccumulate INCremental | FULL Sort <item>Track
<list_items>: TIme [.all | .UND | .RUN | RDY | WAIT | SUSP] MAX [.all | .UND | .RUN | RDY | WAIT | SUSP] AVeRage [.all | .UND | .RUN | RDY | WAIT | SUSP] Count [.all | .UND | .RUN | RDY | WAIT | SUSP] RatioBAR.log | BAR.LIN
General Commands Reference Guide T 425 ©1989-2019 Lauterbach GmbH
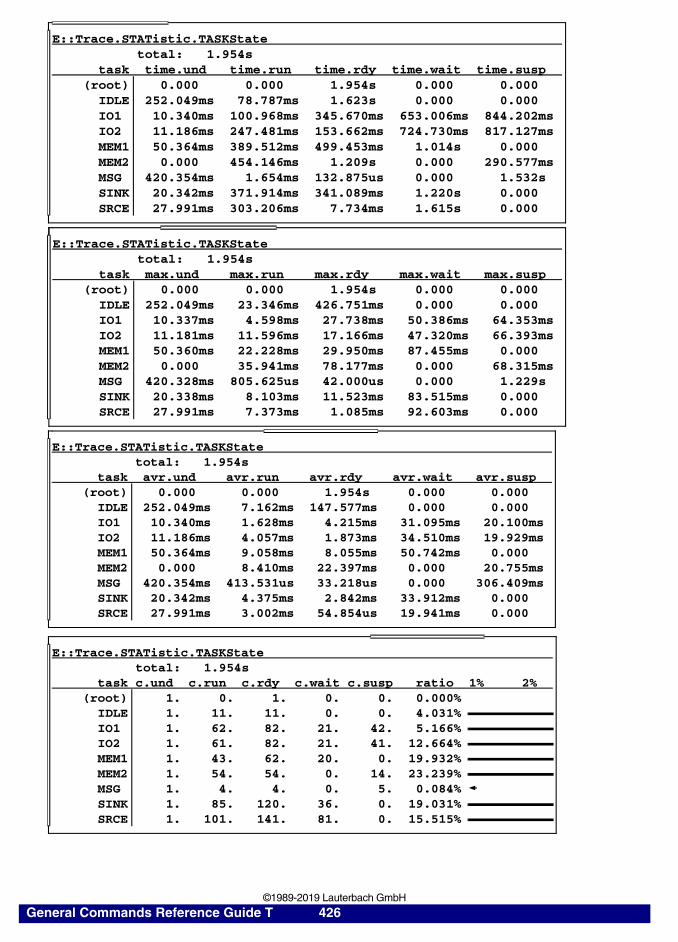
E::Trace.STATistic.TASKStatetotal: 1.954s
task time.und time.run time.rdy time.wait time.susp(root) 0.000 0.000 1.954s 0.000 0.000
IDLE 252.049ms 78.787ms 1.623s 0.000 0.000IO1 10.340ms 100.968ms 345.670ms 653.006ms 844.202msIO2 11.186ms 247.481ms 153.662ms 724.730ms 817.127msMEM1 50.364ms 389.512ms 499.453ms 1.014s 0.000MEM2 0.000 454.146ms 1.209s 0.000 290.577msMSG 420.354ms 1.654ms 132.875us 0.000 1.532sSINK 20.342ms 371.914ms 341.089ms 1.220s 0.000SRCE 27.991ms 303.206ms 7.734ms 1.615s 0.000
E::Trace.STATistic.TASKStatetotal: 1.954s
task max.und max.run max.rdy max.wait max.susp(root) 0.000 0.000 1.954s 0.000 0.000
IDLE 252.049ms 23.346ms 426.751ms 0.000 0.000IO1 10.337ms 4.598ms 27.738ms 50.386ms 64.353msIO2 11.181ms 11.596ms 17.166ms 47.320ms 66.393msMEM1 50.360ms 22.228ms 29.950ms 87.455ms 0.000MEM2 0.000 35.941ms 78.177ms 0.000 68.315msMSG 420.328ms 805.625us 42.000us 0.000 1.229sSINK 20.338ms 8.103ms 11.523ms 83.515ms 0.000SRCE 27.991ms 7.373ms 1.085ms 92.603ms 0.000
E::Trace.STATistic.TASKStatetotal: 1.954s
task avr.und avr.run avr.rdy avr.wait avr.susp(root) 0.000 0.000 1.954s 0.000 0.000
IDLE 252.049ms 7.162ms 147.577ms 0.000 0.000IO1 10.340ms 1.628ms 4.215ms 31.095ms 20.100msIO2 11.186ms 4.057ms 1.873ms 34.510ms 19.929msMEM1 50.364ms 9.058ms 8.055ms 50.742ms 0.000MEM2 0.000 8.410ms 22.397ms 0.000 20.755msMSG 420.354ms 413.531us 33.218us 0.000 306.409msSINK 20.342ms 4.375ms 2.842ms 33.912ms 0.000SRCE 27.991ms 3.002ms 54.854us 19.941ms 0.000
E::Trace.STATistic.TASKStatetotal: 1.954s
task c.und c.run c.rdy c.wait c.susp ratio 1% 2%(root) 1. 0. 1. 0. 0. 0.000%
IDLE 1. 11. 11. 0. 0. 4.031%IO1 1. 62. 82. 21. 42. 5.166%IO2 1. 61. 82. 21. 41. 12.664%MEM1 1. 43. 62. 20. 0. 19.932%MEM2 1. 54. 54. 0. 14. 23.239%MSG 1. 4. 4. 0. 5. 0.084%SINK 1. 85. 120. 36. 0. 19.031%SRCE 1. 101. 141. 81. 0. 15.515%
General Commands Reference Guide T 426 ©1989-2019 Lauterbach GmbH
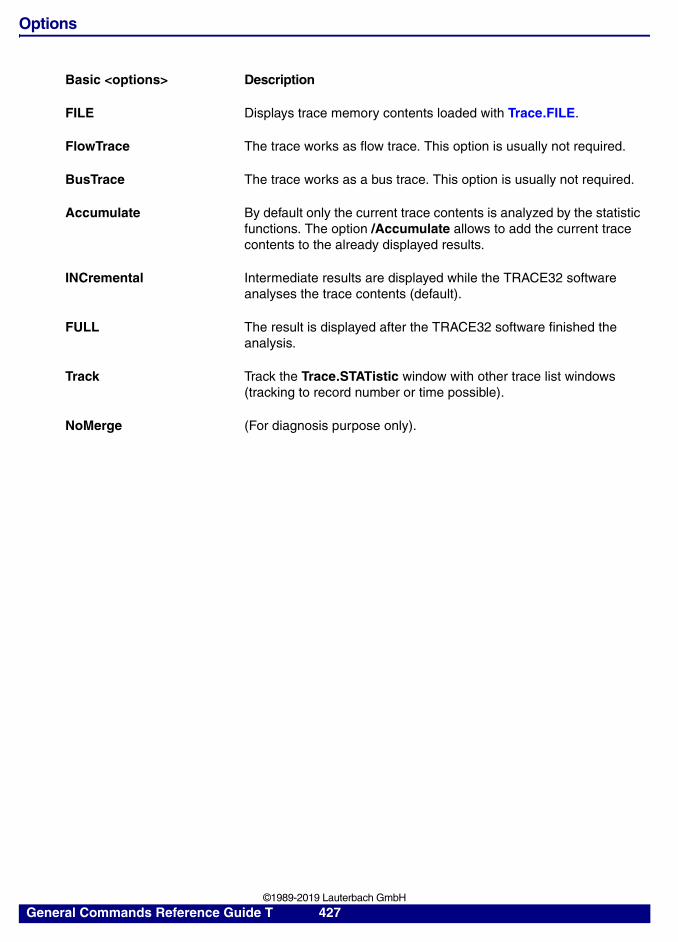
Options
Basic <options> Description
FILE Displays trace memory contents loaded with Trace.FILE.
FlowTrace The trace works as flow trace. This option is usually not required.
BusTrace The trace works as a bus trace. This option is usually not required.
Accumulate By default only the current trace contents is analyzed by the statistic functions. The option /Accumulate allows to add the current trace contents to the already displayed results.
INCremental Intermediate results are displayed while the TRACE32 software analyses the trace contents (default).
FULL The result is displayed after the TRACE32 software finished the analysis.
Track Track the Trace.STATistic window with other trace list windows (tracking to record number or time possible).
NoMerge (For diagnosis purpose only).
General Commands Reference Guide T 427 ©1989-2019 Lauterbach GmbH
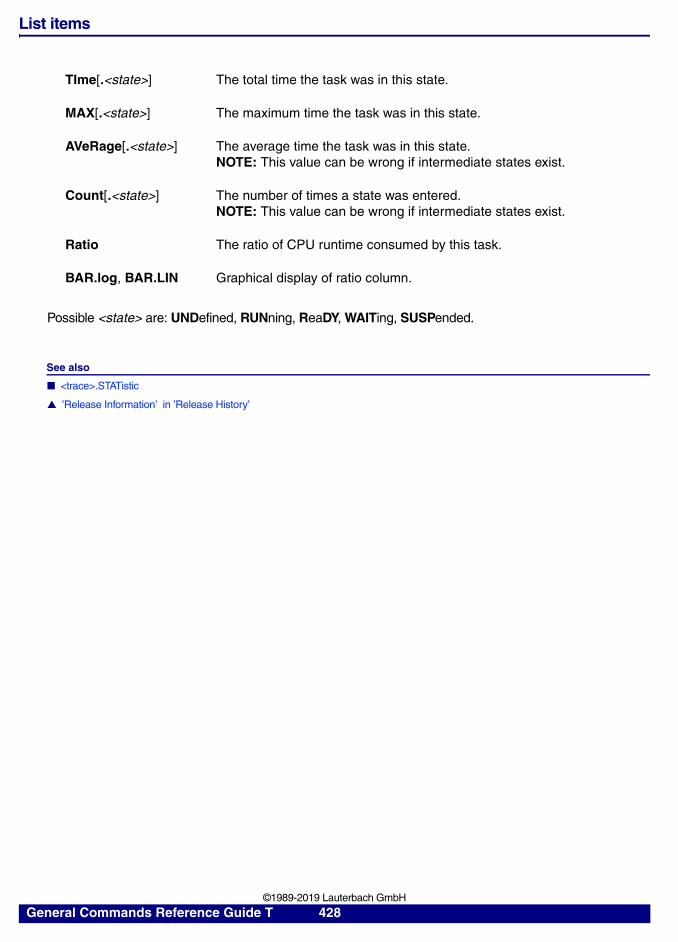
List items
Possible <state> are: UNDefined, RUNning, ReaDY, WAITing, SUSPended.
See also
■ <trace>.STATistic
▲ ’Release Information’ in ’Release History’
TIme[.<state>] The total time the task was in this state.
MAX[.<state>] The maximum time the task was in this state.
AVeRage[.<state>] The average time the task was in this state. NOTE: This value can be wrong if intermediate states exist.
Count[.<state>] The number of times a state was entered.NOTE: This value can be wrong if intermediate states exist.
Ratio The ratio of CPU runtime consumed by this task.
BAR.log, BAR.LIN Graphical display of ratio column.
General Commands Reference Guide T 428 ©1989-2019 Lauterbach GmbH
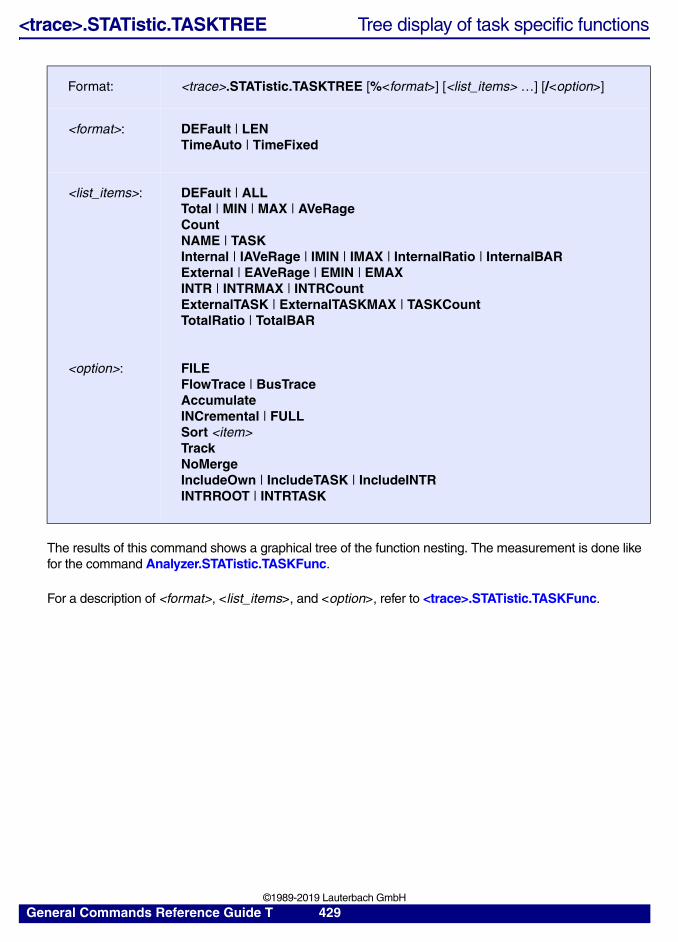
<trace>.STATistic.TASKTREE Tree display of task specific functions
The results of this command shows a graphical tree of the function nesting. The measurement is done like for the command Analyzer.STATistic.TASKFunc.
For a description of <format>, <list_items>, and <option>, refer to <trace>.STATistic.TASKFunc.
Format: <trace>.STATistic.TASKTREE [%<format>] [<list_items> …] [/<option>]
<format>: DEFault | LENTimeAuto | TimeFixed
<list_items>: DEFault | ALLTotal | MIN | MAX | AVeRage Count NAME | TASKInternal | IAVeRage | IMIN | IMAX | InternalRatio | InternalBARExternal | EAVeRage | EMIN | EMAXINTR | INTRMAX | INTRCount ExternalTASK | ExternalTASKMAX | TASKCountTotalRatio | TotalBAR
<option>: FILEFlowTrace | BusTraceAccumulate INCremental | FULL Sort <item>TrackNoMergeIncludeOwn | IncludeTASK | IncludeINTRINTRROOT | INTRTASK
General Commands Reference Guide T 429 ©1989-2019 Lauterbach GmbH
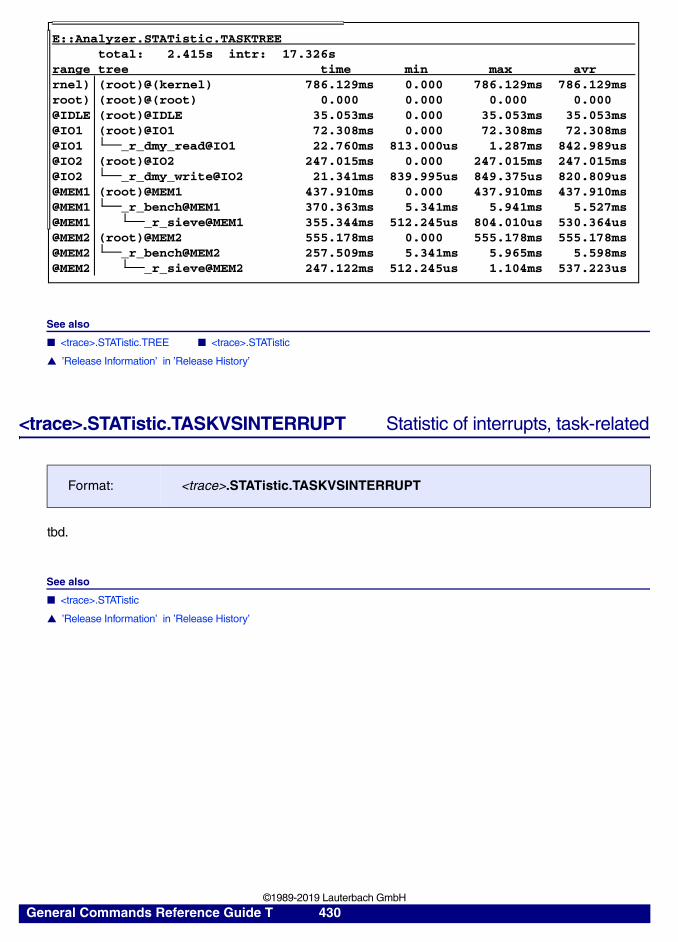
See also
■ <trace>.STATistic.TREE ■ <trace>.STATistic
▲ ’Release Information’ in ’Release History’
<trace>.STATistic.TASKVSINTERRUPT Statistic of interrupts, task-related
tbd.
See also
■ <trace>.STATistic
▲ ’Release Information’ in ’Release History’
Format: <trace>.STATistic.TASKVSINTERRUPT
E::Analyzer.STATistic.TASKTREEtotal: 2.415s intr: 17.326s
range tree time min max avrrnel) (root)@(kernel) 786.129ms 0.000 786.129ms 786.129msroot) (root)@(root) 0.000 0.000 0.000 0.000@IDLE (root)@IDLE 35.053ms 0.000 35.053ms 35.053ms@IO1 (root)@IO1 72.308ms 0.000 72.308ms 72.308ms@IO1 _r_dmy_read@IO1 22.760ms 813.000us 1.287ms 842.989us@IO2 (root)@IO2 247.015ms 0.000 247.015ms 247.015ms@IO2 _r_dmy_write@IO2 21.341ms 839.995us 849.375us 820.809us@MEM1 (root)@MEM1 437.910ms 0.000 437.910ms 437.910ms@MEM1 _r_bench@MEM1 370.363ms 5.341ms 5.941ms 5.527ms@MEM1 _r_sieve@MEM1 355.344ms 512.245us 804.010us 530.364us@MEM2 (root)@MEM2 555.178ms 0.000 555.178ms 555.178ms@MEM2 _r_bench@MEM2 257.509ms 5.341ms 5.965ms 5.598ms@MEM2 _r_sieve@MEM2 247.122ms 512.245us 1.104ms 537.223us
General Commands Reference Guide T 430 ©1989-2019 Lauterbach GmbH
<trace>.STATistic.TREE Tree display of nesting function run-time analysis
The results of this command shows a graphical tree of the function nesting. The measurement is done like for the command Analyzer.STATistic.TASKFunc.
Format: <trace>.STATistic.TREE [%<format>] [{<list_items>}] [/<option>]
<format>: DEFault | LENTimeAuto | TimeFixed
<list_items>: DEFault | ALLTotal | MIN | MAX | AVeRage Count NAME | TASKInternal | IAVeRage | IMIN | IMAX | InternalRatio | InternalBARExternal | EAVeRage | EMIN | EMAXINTR | INTRMAX | INTRCount ExternalTASK | ExternalTASKMAX | TASKCountTotalRatio | TotalBAR
<option>: FILEFlowTrace | BusTraceAccumulate INCremental | FULL Sort <item>TrackNoMergeIncludeOwn | IncludeTASK | IncludeINTRINTRROOT | INTRTASK
General Commands Reference Guide T 431 ©1989-2019 Lauterbach GmbH
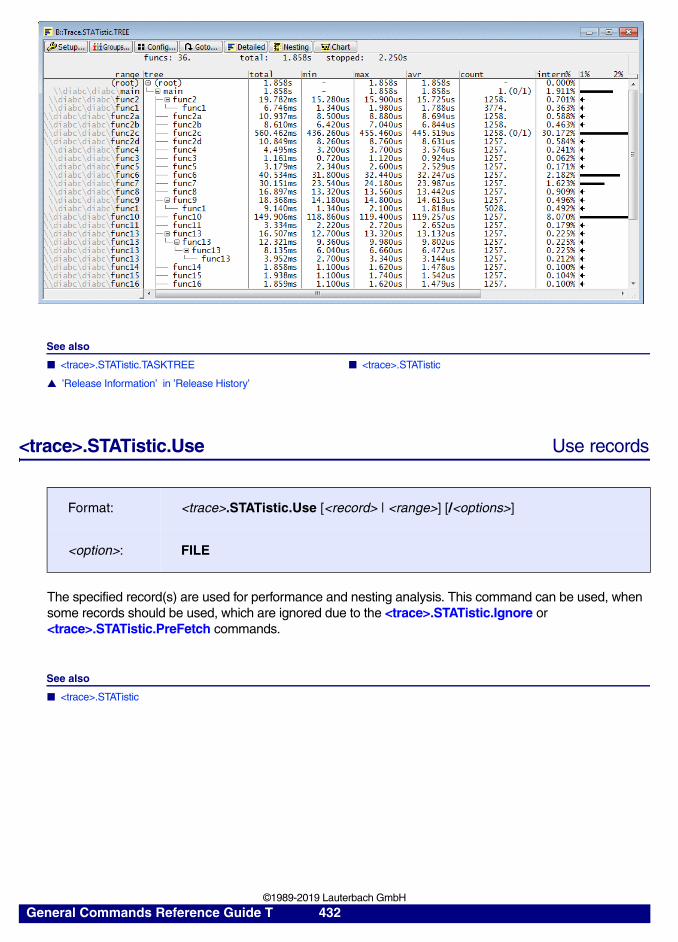
See also
■ <trace>.STATistic.TASKTREE ■ <trace>.STATistic
▲ ’Release Information’ in ’Release History’
<trace>.STATistic.Use Use records
The specified record(s) are used for performance and nesting analysis. This command can be used, when some records should be used, which are ignored due to the <trace>.STATistic.Ignore or <trace>.STATistic.PreFetch commands.
See also
■ <trace>.STATistic
Format: <trace>.STATistic.Use [<record> | <range>] [/<options>]
<option>: FILE
General Commands Reference Guide T 432 ©1989-2019 Lauterbach GmbH
<trace>.STREAMCompression Select compression mode for streaming
Example:
See also
■ <trace>.STREAMFILE ■ <trace>.STREAMFileLimit ■ <trace>.STREAMLOAD ■ <trace>.STREAMSAVE ■ CIProbe
Format: <trace>.STREAMCompression OFF | LOW | MID | HIGH
OFF Trace information is streamed uncompressed and saved uncompressed to file on hard-disk (diagnose purpose only).
LOW(default)
Trace information is streamed compressed (hardware compression for all ETMv3 and higher, software compression otherwise). Trace information is saved to file on hard-disk as received.
MID Trace information is streamed compressed (hardware compression for all ETMv3s and higher, software compression otherwise). Trace information is zipped before it is saved to file on hard-disk.
HIGH Trace information is streamed compressed (hardware compression for all ETMv3s and higher, software compression otherwise). Trace information is zipped very compact before it is saved to file on hard-disk.
Trace.STREAMCompression LOW
Trace.Mode STREAM
General Commands Reference Guide T 433 ©1989-2019 Lauterbach GmbH
<trace>.STREAMFILE Specify temporary streaming file path
Set the path and file name for the temporary stream file. By default, TRACE32 will choose the standard TEMP folder set in the operating system. he only intention of this command is to select a different path / drive, e.g. a high-capacity drive dedicated for this use case.
The contents of the streaming file are in a proprietary format and not intended for use in external applications. Also it is not possible to use this file for later analysis.
In order to store a trace recording for later analysis, either use Trace.SAVE or Trace.STREAMSAVE. In order to export trace data for use in external applications, see Trace.EXPORT.
Example:
See also
■ <trace>.STREAMFileLimit ■ <trace>.STREAMCompression ■ <trace>.STREAMLOAD ■ <trace>.STREAMSAVE ■ CIProbe
Format: <trace>.STREAMFILE <file>
Trace.STREAMFILE d:\temp\mystream.t32 ; specify the location for; your streaming file
Trace.Mode STREAM ; select the trace mode STREAM
General Commands Reference Guide T 434 ©1989-2019 Lauterbach GmbH
<trace>.STREAMFileLimit Set size limit for streaming file
Sets the maximum size allowed for a streaming file. If the maximum size is exceeded, streaming is stopped.
The limit value is given in bytes and can have a positive or negative sign:
• Positive value: The maximum size of the streaming file in bytes
• Negative value: Specifies the amount of space to leave on the disk before stopping streaming. The maximum file size is calculated based on the amount of available disk space at the time of starting streaming.
The default setting is -1.000.000.000 i.e. stops streaming when less than a GB of space is left on the target storage medium.
Slow trace ports allow high compression. Fast trace ports allow no compression.
Example:
See also
■ <trace>.STREAMFILE ■ <trace>.STREAMCompression ■ <trace>.STREAMLOAD ■ <trace>.STREAMSAVE
Format: <trace>.STREAMFileLimit <+/- limit_in _bytes>
NOTE: The file limit and the name of the streaming file must be set before starting streaming. Later changes are not taken into account.
Trace.STREAMCompression LOW ; select software compression; mode LOW for streaming file
Trace.Mode STREAM ; select the trace mode STREAM
General Commands Reference Guide T 435 ©1989-2019 Lauterbach GmbH
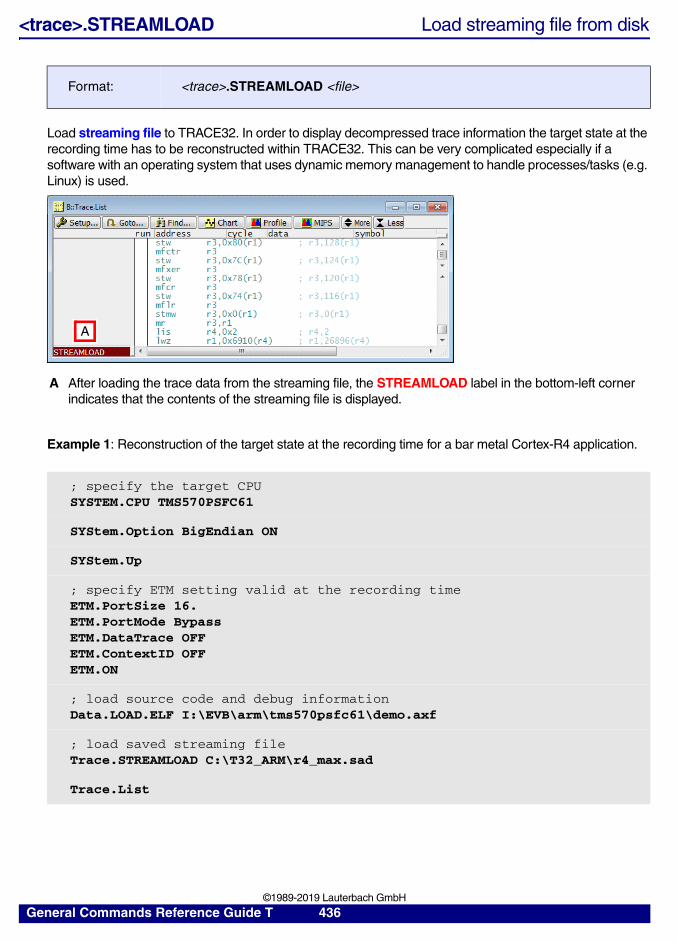
<trace>.STREAMLOAD Load streaming file from disk
Load streaming file to TRACE32. In order to display decompressed trace information the target state at the recording time has to be reconstructed within TRACE32. This can be very complicated especially if a software with an operating system that uses dynamic memory management to handle processes/tasks (e.g. Linux) is used.
Example 1: Reconstruction of the target state at the recording time for a bar metal Cortex-R4 application.
Format: <trace>.STREAMLOAD <file>
A After loading the trace data from the streaming file, the STREAMLOAD label in the bottom-left corner indicates that the contents of the streaming file is displayed.
; specify the target CPUSYSTEM.CPU TMS570PSFC61
SYStem.Option BigEndian ON
SYStem.Up
; specify ETM setting valid at the recording timeETM.PortSize 16.ETM.PortMode BypassETM.DataTrace OFFETM.ContextID OFFETM.ON
; load source code and debug informationData.LOAD.ELF I:\EVB\arm\tms570psfc61\demo.axf
; load saved streaming fileTrace.STREAMLOAD C:\T32_ARM\r4_max.sad
Trace.List
A
General Commands Reference Guide T 436 ©1989-2019 Lauterbach GmbH
Example 2: Reconstruction of the target state at the recording time for NEXUS Power Architecture:
See also
■ <trace>.STREAMCompression ■ <trace>.STREAMFILE ■ <trace>.STREAMFileLimit ■ <trace>.STREAMSAVE
; specify the target CPUSYStem.CPU MPC5646C
; specify the NEXUS setting valid at the recording timeNEXUS.PortSize MDO12NEXUS.PortMode 1/2NEXUS.BTM ONNEXUS.HTM ONNEXUS.PTCM BL_HTM ONNEXUS.ON
SYStem.Up
; mapping logical to physical address is 1:1
; load source code and debug informationData.LOAD.Elf J:\AND\PPC5XXXX_OTM\im02_bf1x.elf
; load the OS AwarenessTASK.ORTI J:\AND\PPC5XXXX_OTM\im02_bf1x.ort
; load saved streaming fileTrace.STREAMLOAD J:\AND\PPC5XXXX_OTM\my_stream
Trace.List
General Commands Reference Guide T 437 ©1989-2019 Lauterbach GmbH
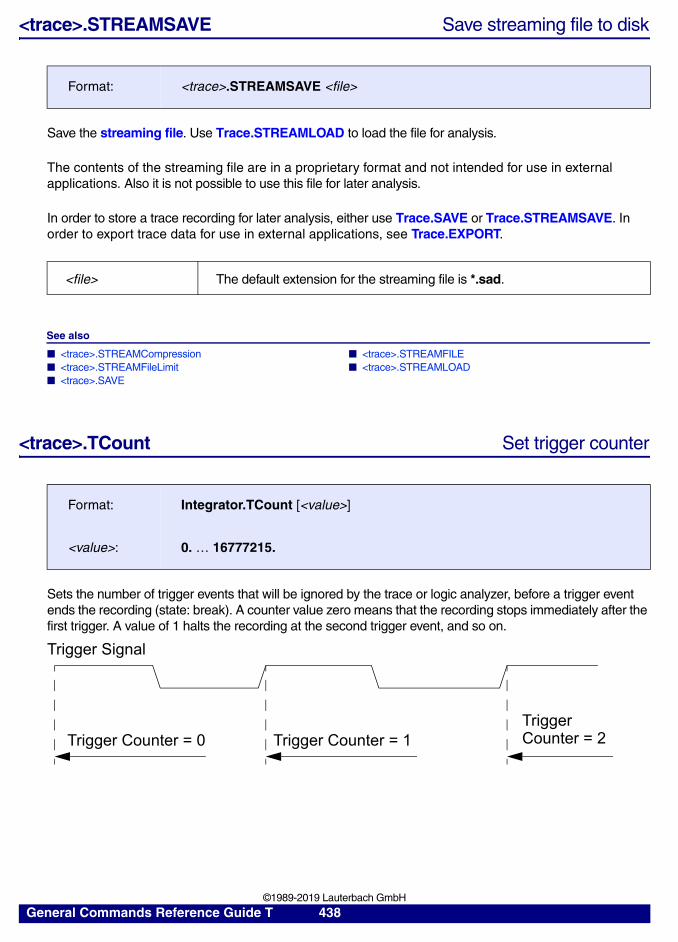
<trace>.STREAMSAVE Save streaming file to disk
Save the streaming file. Use Trace.STREAMLOAD to load the file for analysis.
The contents of the streaming file are in a proprietary format and not intended for use in external applications. Also it is not possible to use this file for later analysis.
In order to store a trace recording for later analysis, either use Trace.SAVE or Trace.STREAMSAVE. In order to export trace data for use in external applications, see Trace.EXPORT.
See also
■ <trace>.STREAMCompression ■ <trace>.STREAMFILE ■ <trace>.STREAMFileLimit ■ <trace>.STREAMLOAD ■ <trace>.SAVE
<trace>.TCount Set trigger counter
Sets the number of trigger events that will be ignored by the trace or logic analyzer, before a trigger event ends the recording (state: break). A counter value zero means that the recording stops immediately after the first trigger. A value of 1 halts the recording at the second trigger event, and so on.
Format: <trace>.STREAMSAVE <file>
<file> The default extension for the streaming file is *.sad.
Format: Integrator.TCount [<value>]
<value>: 0. … 16777215.
Trigger Signal
Trigger Counter = 0 Trigger Counter = 1Trigger Counter = 2
General Commands Reference Guide T 438 ©1989-2019 Lauterbach GmbH
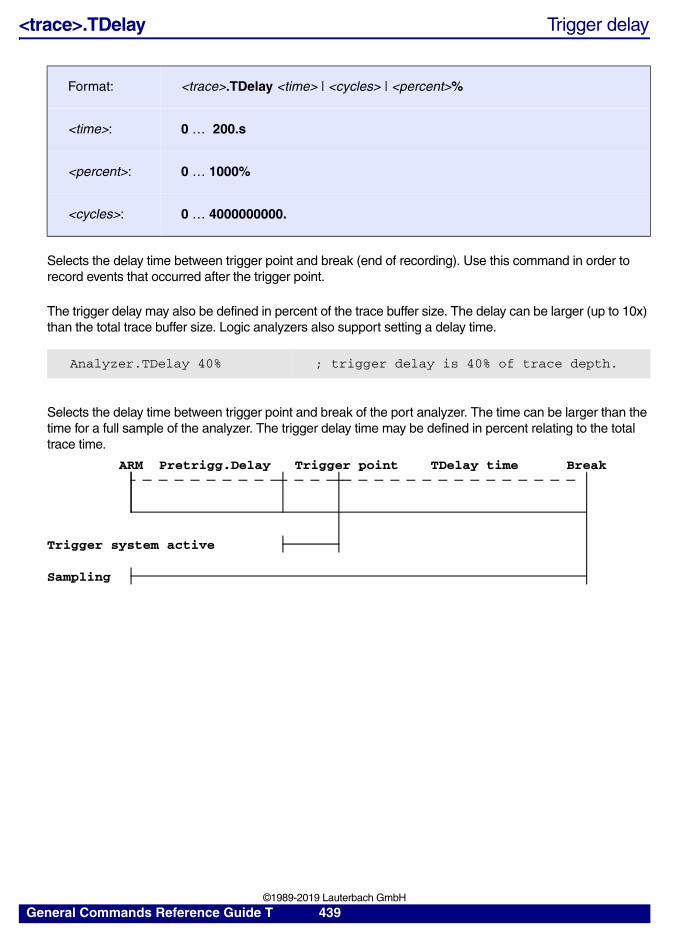
<trace>.TDelay Trigger delay
Selects the delay time between trigger point and break (end of recording). Use this command in order to record events that occurred after the trigger point.
The trigger delay may also be defined in percent of the trace buffer size. The delay can be larger (up to 10x) than the total trace buffer size. Logic analyzers also support setting a delay time.
Selects the delay time between trigger point and break of the port analyzer. The time can be larger than the time for a full sample of the analyzer. The trigger delay time may be defined in percent relating to the total trace time.
Format: <trace>.TDelay <time> | <cycles> | <percent>%
<time>: 0 … 200.s
<percent>: 0 … 1000%
<cycles>: 0 … 4000000000.
Analyzer.TDelay 40% ; trigger delay is 40% of trace depth.
ARM Pretrigg.Delay Trigger point TDelay time Break
Trigger system active
Sampling
General Commands Reference Guide T 439 ©1989-2019 Lauterbach GmbH
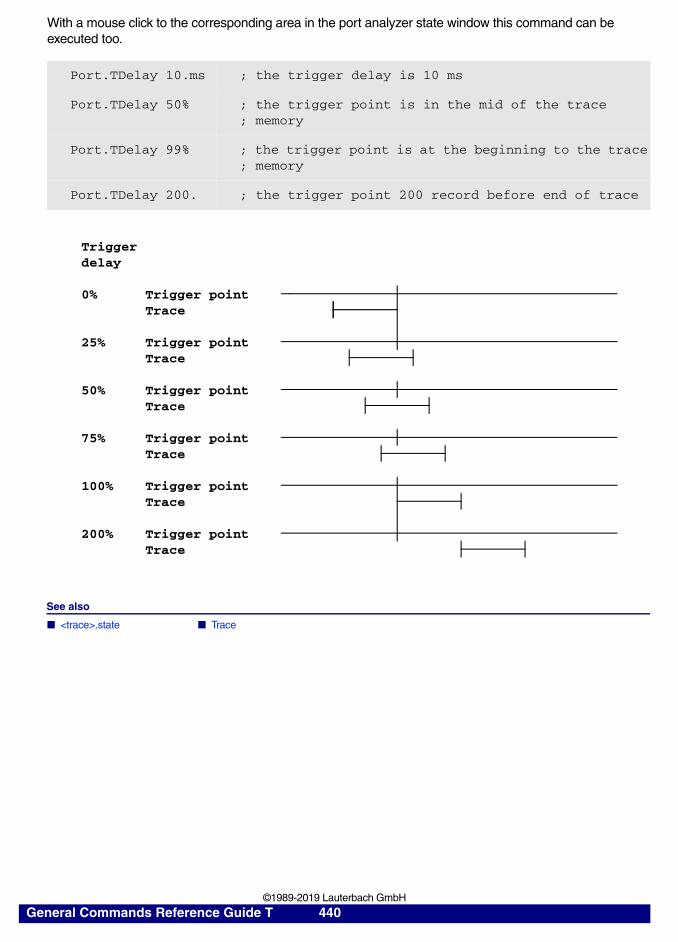
With a mouse click to the corresponding area in the port analyzer state window this command can be executed too.
See also
■ <trace>.state ■ Trace
Port.TDelay 10.ms ; the trigger delay is 10 ms
Port.TDelay 50% ; the trigger point is in the mid of the trace; memory
Port.TDelay 99% ; the trigger point is at the beginning to the trace; memory
Port.TDelay 200. ; the trigger point 200 record before end of trace
Triggerdelay
0% Trigger pointTrace
25% Trigger pointTrace
50% Trigger pointTrace
75% Trigger pointTrace
100% Trigger pointTrace
200% Trigger pointTrace
General Commands Reference Guide T 440 ©1989-2019 Lauterbach GmbH
<trace>.TERMination Use trace line termination of preprocessor
By default the trace line termination of the preprocessor is used during a trace capture. Undefinable FLOWERRORs may occur if the output drivers of the CPU are not strong enough. In this case it is recommended to switch the trace line termination OFF.
See also
■ <trace>.state ■ Trace
Format: <trace>.TERMination ON | OFF
General Commands Reference Guide T 441 ©1989-2019 Lauterbach GmbH
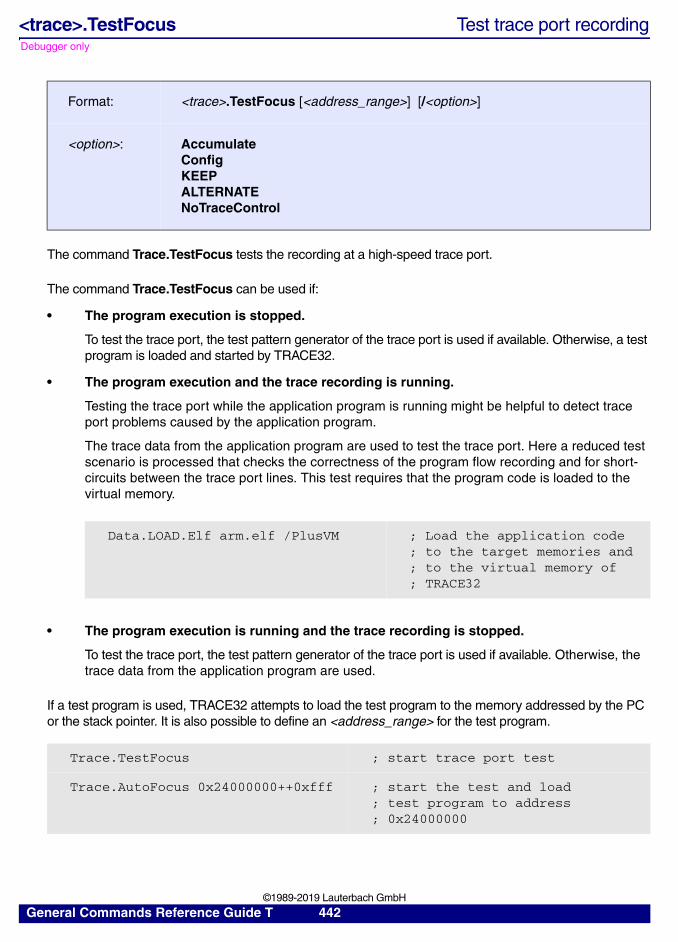
Debugger only
<trace>.TestFocus Test trace port recording
The command Trace.TestFocus tests the recording at a high-speed trace port.
The command Trace.TestFocus can be used if:
• The program execution is stopped.
To test the trace port, the test pattern generator of the trace port is used if available. Otherwise, a test program is loaded and started by TRACE32.
• The program execution and the trace recording is running.
Testing the trace port while the application program is running might be helpful to detect trace port problems caused by the application program.
The trace data from the application program are used to test the trace port. Here a reduced test scenario is processed that checks the correctness of the program flow recording and for short-circuits between the trace port lines. This test requires that the program code is loaded to the virtual memory.
• The program execution is running and the trace recording is stopped.
To test the trace port, the test pattern generator of the trace port is used if available. Otherwise, the trace data from the application program are used.
If a test program is used, TRACE32 attempts to load the test program to the memory addressed by the PC or the stack pointer. It is also possible to define an <address_range> for the test program.
Format: <trace>.TestFocus [<address_range>] [/<option>]
<option>: AccumulateConfigKEEPALTERNATENoTraceControl
Data.LOAD.Elf arm.elf /PlusVM ; Load the application code; to the target memories and; to the virtual memory of; TRACE32
Trace.TestFocus ; start trace port test
Trace.AutoFocus 0x24000000++0xfff ; start the test and load; test program to address; 0x24000000
General Commands Reference Guide T 442 ©1989-2019 Lauterbach GmbH
If TRACE32 is unable to load the test program the following error message is displayed: “Don‘t know where to execute the test code”.
By default, the original RAM content is restored after the trace port test and the trace recording is deleted.
The result of the command Trace.TestFocus can be processed in a PRACTICE script as follows:
Accumulate If the application program varies the CPU clock frequency, this affects also the trace port. In such a case it is recommended to overlay the test results for all relevant CPU clock frequencies by using the option /Accumulate.
Config Allows to define a RAM address range for the download of the test program.
KEEP After a trace port test the trace is cleared and any loaded test program is removed from the target RAM.
With the option /KEEP, the test trace is not cleared and can be viewed with the Trace.List command. If a test program was loaded by TRACE32, it also remains in the target RAM.
ALTERNATE If the trace port provides a test pattern generator, it is always used for the test. The option /ALTERNATE forces TRACE32 to use its own test program.
NoTraceControl Informs the TRACE32 software that the trace control signal is not available on the trace connector.
; advise the command Trace.TestFocus to download the test program ; always to the address range 0x24000000++0xfffTrace.TestFocus 0x24000000++0xfff /Config
Trace.TestFocus
IF FOUND() PRINT %ERROR "Trace port test failed"
ELSE PRINT "Trace port recording ok"
General Commands Reference Guide T 443 ©1989-2019 Lauterbach GmbH
Preprocessor with AutoFocus Technology
The Trace.TestFocus command calls the data eye finder for the current hardware configuration of a preprocessor with AUTOFOCUS technology and verifies the correctness of traced test data. In contrast to Trace.AutoFocus, the preprocessor configuration remains unchanged.
A complete trace port test executes the following steps:
1. The data eye finder is called. The source for the trace data for the test are the trace port’s pattern generator, a test program or the application program.
2. When the eye finder is done, the test is started once again to verify the correctness of the trace recording.
3. The data eyes resulting from the <trace>.TestFocus command can be viewed in the <trace>.ShowFocus window.
See also
■ <trace>.TestFocusEye ■ <trace>.AutoFocus ■ <trace>.ShowFocus ■ <trace>.ShowFocusClockEye ■ <trace>.ShowFocusEye ■ <trace>.state ■ Trace ■ <trace>.TestFocusClockEye ❏ AUTOFOCUS.FREQUENCY() ❏ AUTOFOCUS.OK()
▲ ’Release Information’ in ’Release History’
<trace>.TestFocusClockEye Scan clock eye
Scans the clock eye. To view the result, use the command Trace.ShowFocusClockEye.
See also
■ <trace>.TestFocus ■ <trace>.AutoFocus ■ <trace>.ShowFocus ■ <trace>.ShowFocusClockEye ■ <trace>.ShowFocusEye ■ <trace>.TestFocusEye
Format: <trace>.TestFocusClockEye [<address_range>] [/<option>]
<option>: Accumulate | Config | KEEP | ALTERNATE | Utilisation | NoTraceControl
NOTE: The NEXUS AutoFocus adapter does not support this feature.
<option> For a description of the options, see Trace.TestFocus.
General Commands Reference Guide T 444 ©1989-2019 Lauterbach GmbH
Debugger only
<trace>.TestFocusEye Check signal integrity
Scans the data eye to determine the integrity of the electrical trace signals.
The command Trace.TestFocusEye starts an eye finder to test the quality of the trace signals, if a preprocessor with AUTOFOCUS technology is used. The test result can be displayed with the command Trace.ShowFocusEye. If the result shows that an individual trace signal has a significantly smaller data eye than other signals, the hardware layout should be checked to see if this signal shows any unusual features.
The test procedure and the options used by the command Trace.TestFocusEye are similar to the command Trace.TestFocus.
The command Trace.TestFocusEye can also be used with PowerTrace Serial. For this tool no additional parameters (e.g. <address_range>) or options are available.
See also
■ <trace>.AutoFocus ■ <trace>.ShowFocus ■ <trace>.ShowFocusClockEye ■ <trace>.ShowFocusEye ■ <trace>.state ■ Trace ■ <trace>.TestFocus ■ <trace>.TestFocusClockEye
▲ ’Release Information’ in ’Release History’
Format: <trace>.TestFocusEye [<address_range>] [/<option>]
<option>: AccumulateConfigKEEPALTERNATENoTraceControl
<option> For a description of the options, see Trace.TestFocus.
General Commands Reference Guide T 445 ©1989-2019 Lauterbach GmbH
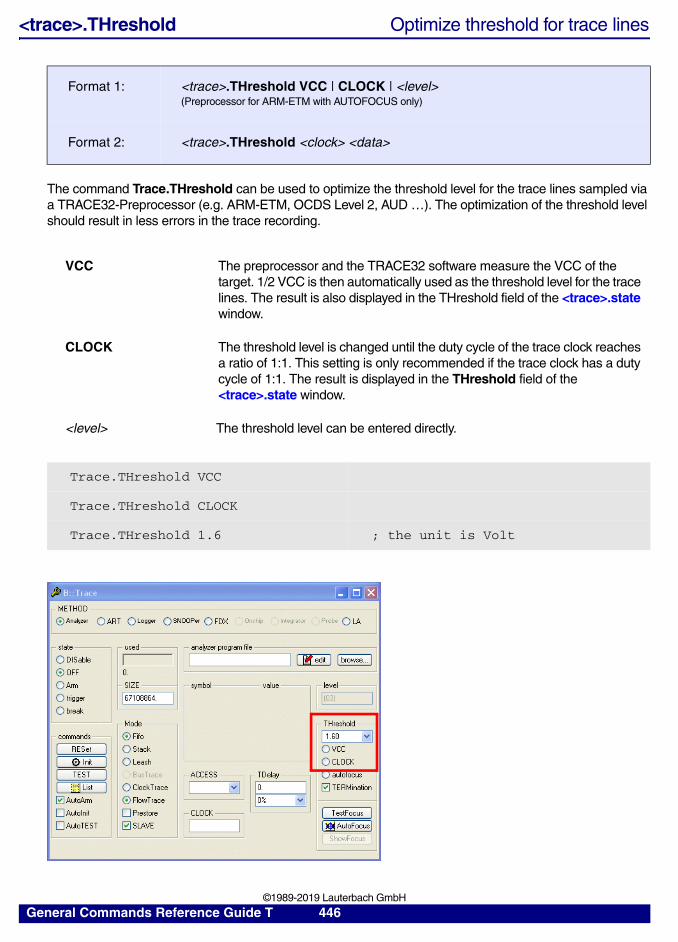
<trace>.THreshold Optimize threshold for trace lines
The command Trace.THreshold can be used to optimize the threshold level for the trace lines sampled via a TRACE32-Preprocessor (e.g. ARM-ETM, OCDS Level 2, AUD …). The optimization of the threshold level should result in less errors in the trace recording.
Format 1: <trace>.THreshold VCC | CLOCK | <level>(Preprocessor for ARM-ETM with AUTOFOCUS only)
Format 2: <trace>.THreshold <clock> <data>
VCC The preprocessor and the TRACE32 software measure the VCC of the target. 1/2 VCC is then automatically used as the threshold level for the trace lines. The result is also displayed in the THreshold field of the <trace>.state window.
CLOCK The threshold level is changed until the duty cycle of the trace clock reaches a ratio of 1:1. This setting is only recommended if the trace clock has a duty cycle of 1:1. The result is displayed in the THreshold field of the <trace>.state window.
<level> The threshold level can be entered directly.
Trace.THreshold VCC
Trace.THreshold CLOCK
Trace.THreshold 1.6 ; the unit is Volt
General Commands Reference Guide T 446 ©1989-2019 Lauterbach GmbH
Enhanced parameters for the Preprocessor for ARM-ETM with AUTOFOCUS:
<clock> <data>
For the Preprocessor for ARM-ETM with AUTOFOCUS different threshold levels can be defined for the clock and the data lines
See also
■ <trace>.state ■ Trace
▲ ’Release Information’ in ’Release History’
<trace>.TimeStamp Configure timestamp usage of LOGGER traceLOGGER only
Configure timestamps for the LOGGER trace. The LOGGER trace record format includes a timestamp field for up to 48 bit timestamps. The direction and rate information passed by this command is required to convert the timestamp into the time in seconds.
Trace.THreshold 0.86 0.79 ; the unit is Volt
Format: LOGGER.TimeStamp OFF | Up | Down | Rate <rate>
OFF (default)
Disable timestamps. Use this setting if the LOGGER target code does not store timestamps in the LOGGER trace records. When this setting is used, the x-direction in chart views is the record number axis instead of the time axis.
Up Enable timestamp counter, counting upwards. Use this setting if the LOGGER target code stores timestamps in the LOGGER trace records and if the timestamp increments with each timer tick.
Down Enable timestamp counter, counting downwards. Use this setting if the LOGGER target code stores timestamps in the LOGGER trace records and if the timestamp decrements with each timer tick.
Rate <rate> Frequency of the timestamp in ticks per second.
AllCycles[ON | OFF]SH only
Set timestamp generation frequency.• OFF (default): Generate a single timestamp for 6 trace cycles.• ON: Generate dedicated timestamps for all trace cycles.
General Commands Reference Guide T 447 ©1989-2019 Lauterbach GmbH
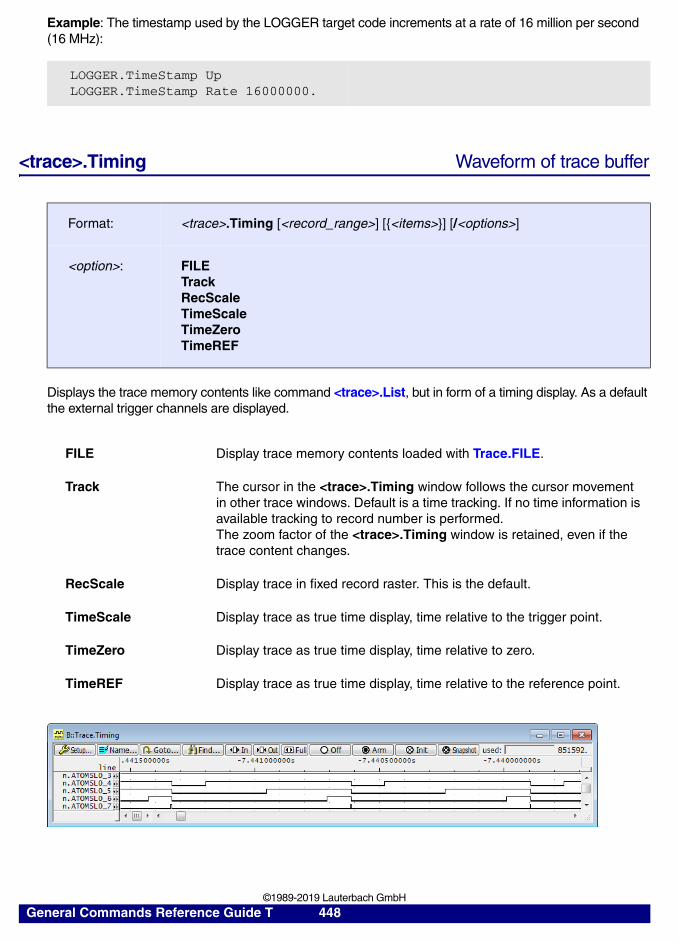
Example: The timestamp used by the LOGGER target code increments at a rate of 16 million per second (16 MHz):
<trace>.Timing Waveform of trace buffer
Displays the trace memory contents like command <trace>.List, but in form of a timing display. As a default the external trigger channels are displayed.
LOGGER.TimeStamp UpLOGGER.TimeStamp Rate 16000000.
Format: <trace>.Timing [<record_range>] [{<items>}] [/<options>]
<option>: FILETrackRecScaleTimeScaleTimeZeroTimeREF
FILE Display trace memory contents loaded with Trace.FILE.
Track The cursor in the <trace>.Timing window follows the cursor movement in other trace windows. Default is a time tracking. If no time information is available tracking to record number is performed.The zoom factor of the <trace>.Timing window is retained, even if the trace content changes.
RecScale Display trace in fixed record raster. This is the default.
TimeScale Display trace as true time display, time relative to the trigger point.
TimeZero Display trace as true time display, time relative to zero.
TimeREF Display trace as true time display, time relative to the reference point.
General Commands Reference Guide T 448 ©1989-2019 Lauterbach GmbH
Examples:
See also
■ <trace>.List ■ <trace>.REF ■ <trace>.state ■ <trace>.View ■ Trace ❏ Analyzer.RECORD.ADDRESS() ❏ Analyzer.RECORD.DATA() ❏ Analyzer.RECORD.OFFSET() ❏ Analyzer.RECORDS() ❏ Analyzer.REF()
▲ ’Release Information’ in ’Release History’▲ ’Displaying the Trace’ in ’Training FIRE Analyzer’▲ ’Emulator Functions’ in ’FIRE User’s Guide’
Buttons
Zoom In T Zooms in Trace by a factor of 2.
Zoom Out T Zooms out Trace by a factor of 2.
Zoom Full T Display the complete trace buffer in the window.
Goto … Open an <trace>.GOTO dialog box.
Find … Open an <trace>.Find dialog box.
Set Ref Set an analyzer reference point to the current record.
Set Zero Set the global time reference to the current record.
View Display all information about the current record (<trace>.View).
List Open an <trace>.List window.
; Open Port Analyzer timing window in standard display formatE::Port.Timing
; Open Port Analyzer timing window and display last file loaded with; " Port.FILE <file>"E::Port.Timing /FILE
; Open Port Analyzer timing window starting at record -100. in standard; display formatE::Port.Timing -100. DEFault
General Commands Reference Guide T 449 ©1989-2019 Lauterbach GmbH
<trace>.TMode Select trigger mode
Selects the trigger condition, edge or level trigger and the corresponding line polarity. The edge trigger is asynchronous and needs a minimum pulse width of 20 ns.
Example:
See also
■ Trace
<trace>.TOut Enable trigger output line (PowerIntegrator)
Enables or disables the trigger output line of the integrator.
See also
■ Trace
Format: <trace>.TMode [High | Low | Rising | Falling]
E::Port.TMode RisingE::Port.TSelect PortE::Port.Select Port.00E::Port.TDelay 100.us
; trigger on the rising edge of P.00; sample till 100.us after trigger
Format: Integrator.TOut ON | OFF
General Commands Reference Guide T 450 ©1989-2019 Lauterbach GmbH
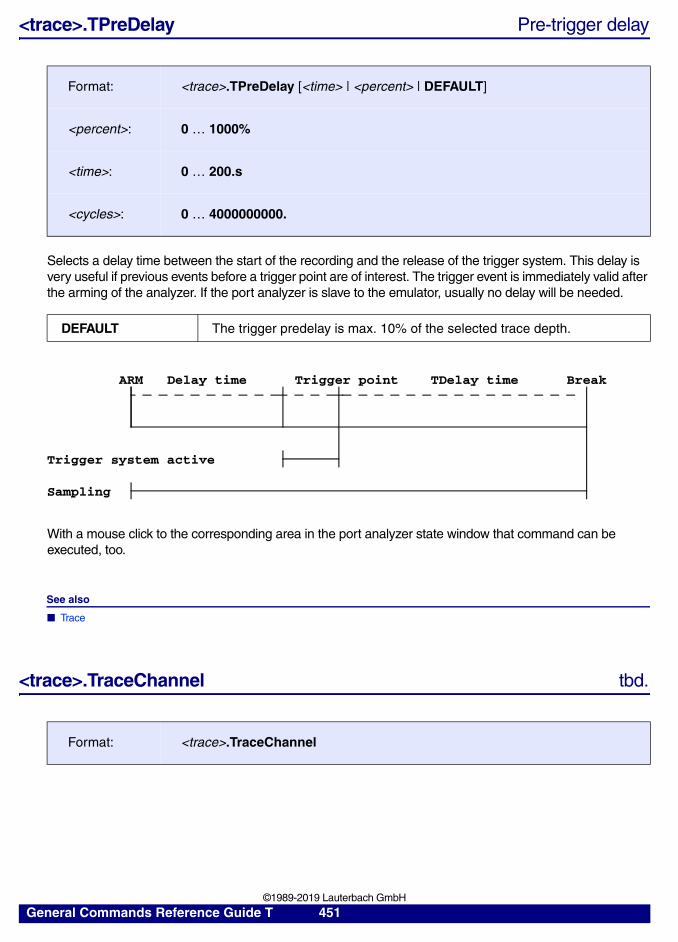
<trace>.TPreDelay Pre-trigger delay
Selects a delay time between the start of the recording and the release of the trigger system. This delay is very useful if previous events before a trigger point are of interest. The trigger event is immediately valid after the arming of the analyzer. If the port analyzer is slave to the emulator, usually no delay will be needed.
With a mouse click to the corresponding area in the port analyzer state window that command can be executed, too.
See also
■ Trace
<trace>.TraceChannel tbd.
Format: <trace>.TPreDelay [<time> | <percent> | DEFAULT]
<percent>: 0 … 1000%
<time>: 0 … 200.s
<cycles>: 0 … 4000000000.
DEFAULT The trigger predelay is max. 10% of the selected trace depth.
Format: <trace>.TraceChannel
ARM Delay time Trigger point TDelay time Break
Trigger system active
Sampling
General Commands Reference Guide T 451 ©1989-2019 Lauterbach GmbH
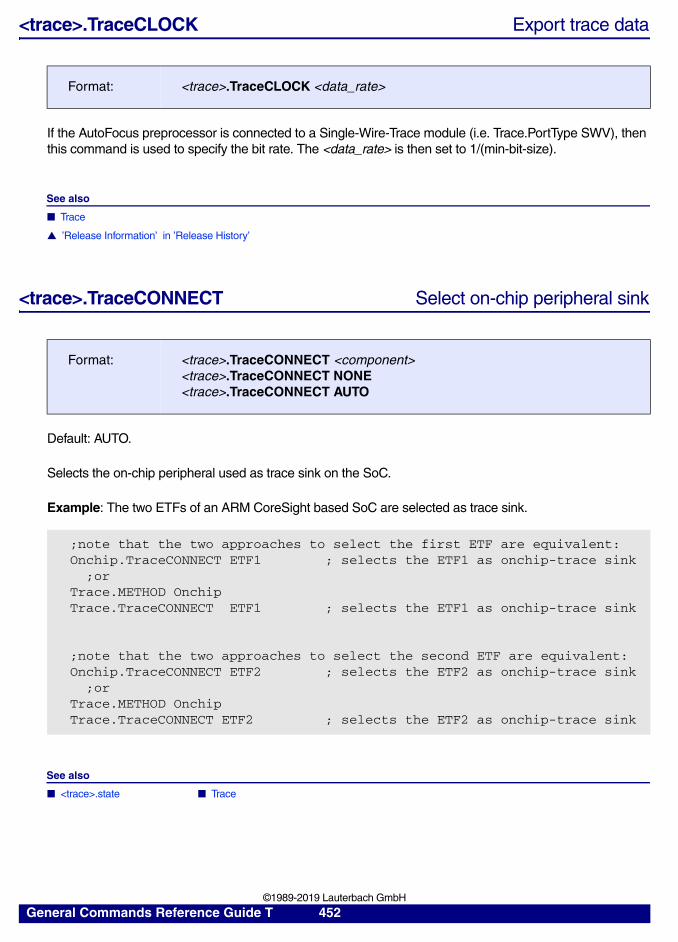
<trace>.TraceCLOCK Export trace data
If the AutoFocus preprocessor is connected to a Single-Wire-Trace module (i.e. Trace.PortType SWV), then this command is used to specify the bit rate. The <data_rate> is then set to 1/(min-bit-size).
See also
■ Trace
▲ ’Release Information’ in ’Release History’
<trace>.TraceCONNECT Select on-chip peripheral sink
Default: AUTO.
Selects the on-chip peripheral used as trace sink on the SoC.
Example: The two ETFs of an ARM CoreSight based SoC are selected as trace sink.
See also
■ <trace>.state ■ Trace
Format: <trace>.TraceCLOCK <data_rate>
Format: <trace>.TraceCONNECT <component><trace>.TraceCONNECT NONE<trace>.TraceCONNECT AUTO
;note that the two approaches to select the first ETF are equivalent:Onchip.TraceCONNECT ETF1 ; selects the ETF1 as onchip-trace sink ;orTrace.METHOD OnchipTrace.TraceCONNECT ETF1 ; selects the ETF1 as onchip-trace sink
;note that the two approaches to select the second ETF are equivalent:Onchip.TraceCONNECT ETF2 ; selects the ETF2 as onchip-trace sink ;orTrace.METHOD OnchipTrace.TraceCONNECT ETF2 ; selects the ETF2 as onchip-trace sink
General Commands Reference Guide T 452 ©1989-2019 Lauterbach GmbH
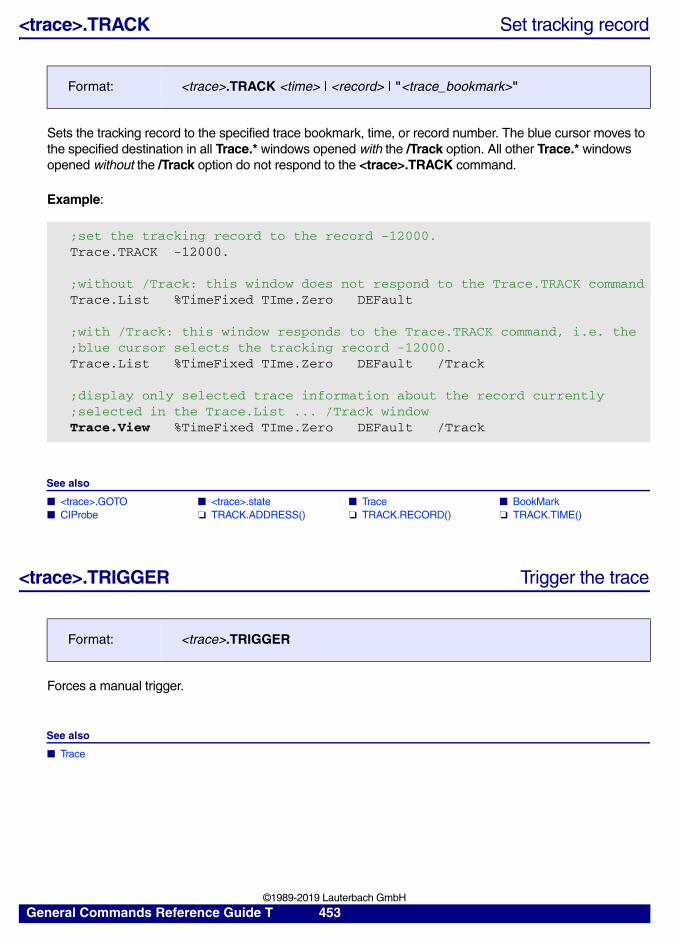
<trace>.TRACK Set tracking record
Sets the tracking record to the specified trace bookmark, time, or record number. The blue cursor moves to the specified destination in all Trace.* windows opened with the /Track option. All other Trace.* windows opened without the /Track option do not respond to the <trace>.TRACK command.
Example:
See also
■ <trace>.GOTO ■ <trace>.state ■ Trace ■ BookMark ■ CIProbe ❏ TRACK.ADDRESS() ❏ TRACK.RECORD() ❏ TRACK.TIME()
<trace>.TRIGGER Trigger the trace
Forces a manual trigger.
See also
■ Trace
Format: <trace>.TRACK <time> | <record> | "<trace_bookmark>"
;set the tracking record to the record -12000.Trace.TRACK -12000.
;without /Track: this window does not respond to the Trace.TRACK commandTrace.List %TimeFixed TIme.Zero DEFault
;with /Track: this window responds to the Trace.TRACK command, i.e. the;blue cursor selects the tracking record -12000.Trace.List %TimeFixed TIme.Zero DEFault /Track
;display only selected trace information about the record currently ;selected in the Trace.List ... /Track windowTrace.View %TimeFixed TIme.Zero DEFault /Track
Format: <trace>.TRIGGER
General Commands Reference Guide T 453 ©1989-2019 Lauterbach GmbH
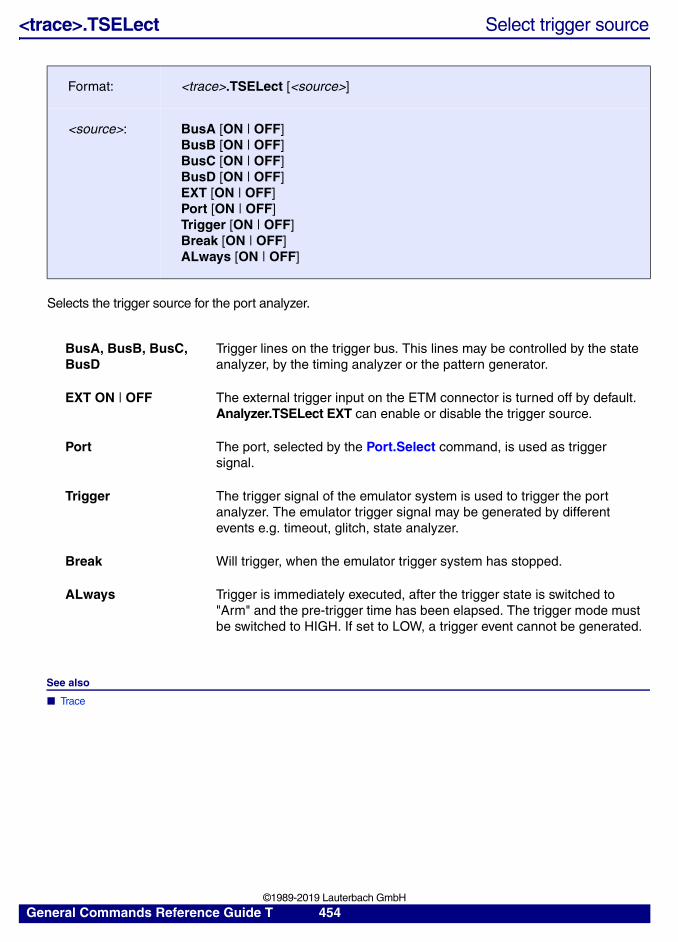
<trace>.TSELect Select trigger source
Selects the trigger source for the port analyzer.
See also
■ Trace
Format: <trace>.TSELect [<source>]
<source>: BusA [ON | OFF]BusB [ON | OFF]BusC [ON | OFF]BusD [ON | OFF]EXT [ON | OFF]Port [ON | OFF]Trigger [ON | OFF]Break [ON | OFF]ALways [ON | OFF]
BusA, BusB, BusC, BusD
Trigger lines on the trigger bus. This lines may be controlled by the state analyzer, by the timing analyzer or the pattern generator.
EXT ON | OFF The external trigger input on the ETM connector is turned off by default. Analyzer.TSELect EXT can enable or disable the trigger source.
Port The port, selected by the Port.Select command, is used as trigger signal.
Trigger The trigger signal of the emulator system is used to trigger the port analyzer. The emulator trigger signal may be generated by different events e.g. timeout, glitch, state analyzer.
Break Will trigger, when the emulator trigger system has stopped.
ALways Trigger is immediately executed, after the trigger state is switched to "Arm" and the pre-trigger time has been elapsed. The trigger mode must be switched to HIGH. If set to LOW, a trigger event cannot be generated.
General Commands Reference Guide T 454 ©1989-2019 Lauterbach GmbH
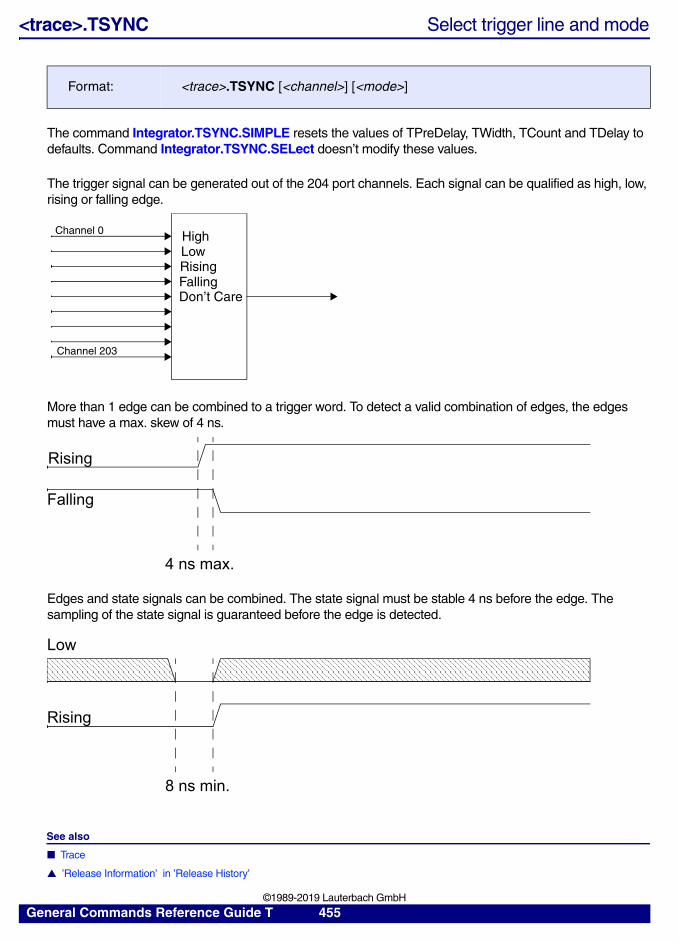
<trace>.TSYNC Select trigger line and mode
The command Integrator.TSYNC.SIMPLE resets the values of TPreDelay, TWidth, TCount and TDelay to defaults. Command Integrator.TSYNC.SELect doesn’t modify these values.
The trigger signal can be generated out of the 204 port channels. Each signal can be qualified as high, low, rising or falling edge.
More than 1 edge can be combined to a trigger word. To detect a valid combination of edges, the edges must have a max. skew of 4 ns.
Edges and state signals can be combined. The state signal must be stable 4 ns before the edge. The sampling of the state signal is guaranteed before the edge is detected.
See also
■ Trace
▲ ’Release Information’ in ’Release History’
Format: <trace>.TSYNC [<channel>] [<mode>]
HighLowRisingFallingDon’t Care
Channel 0
Channel 203
4 ns max.
Rising
Falling
8 ns min.
Rising
Low
General Commands Reference Guide T 455 ©1989-2019 Lauterbach GmbH
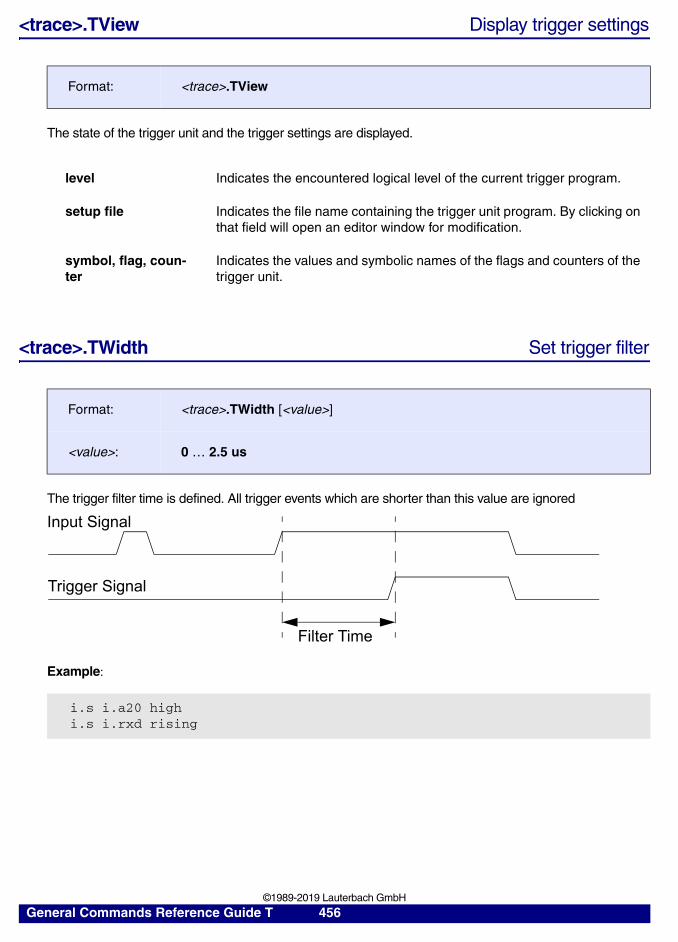
<trace>.TView Display trigger settings
The state of the trigger unit and the trigger settings are displayed.
<trace>.TWidth Set trigger filter
The trigger filter time is defined. All trigger events which are shorter than this value are ignored
Example:
Format: <trace>.TView
level Indicates the encountered logical level of the current trigger program.
setup file Indicates the file name containing the trigger unit program. By clicking on that field will open an editor window for modification.
symbol, flag, coun-ter
Indicates the values and symbolic names of the flags and counters of the trigger unit.
Format: <trace>.TWidth [<value>]
<value>: 0 … 2.5 us
i.s i.a20 highi.s i.rxd rising
Filter Time
Input Signal
Trigger Signal
General Commands Reference Guide T 456 ©1989-2019 Lauterbach GmbH
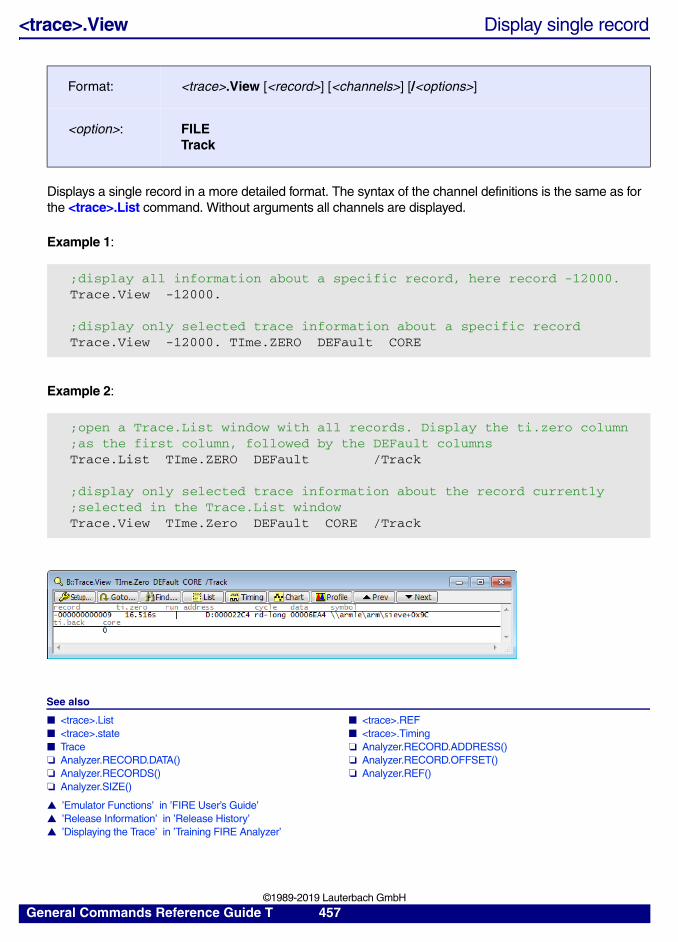
<trace>.View Display single record
Displays a single record in a more detailed format. The syntax of the channel definitions is the same as for the <trace>.List command. Without arguments all channels are displayed.
Example 1:
Example 2:
See also
■ <trace>.List ■ <trace>.REF ■ <trace>.state ■ <trace>.Timing ■ Trace ❏ Analyzer.RECORD.ADDRESS() ❏ Analyzer.RECORD.DATA() ❏ Analyzer.RECORD.OFFSET() ❏ Analyzer.RECORDS() ❏ Analyzer.REF() ❏ Analyzer.SIZE()
▲ ’Emulator Functions’ in ’FIRE User’s Guide’▲ ’Release Information’ in ’Release History’▲ ’Displaying the Trace’ in ’Training FIRE Analyzer’
Format: <trace>.View [<record>] [<channels>] [/<options>]
<option>: FILETrack
;display all information about a specific record, here record -12000.Trace.View -12000.
;display only selected trace information about a specific recordTrace.View -12000. TIme.ZERO DEFault CORE
;open a Trace.List window with all records. Display the ti.zero column;as the first column, followed by the DEFault columnsTrace.List TIme.ZERO DEFault /Track
;display only selected trace information about the record currently ;selected in the Trace.List windowTrace.View TIme.Zero DEFault CORE /Track
General Commands Reference Guide T 457 ©1989-2019 Lauterbach GmbH
<trace>.XTrack Cross system tracking
The cross system tracking allows to use the Track option for all trace windows between multiple emulators. This allows to correlate events in the analyzer in a multiprocessor environment. The communication between the different emulators is done by the InterCom system. InterCom allows the exchange of data between different emulators. The InterCom name is either the name and port number of a UDP port used by another emulator (see Installation Manuals for details) or the file name used by another emulator (see command InterCom for details). Using TCP/IP for communication is preferred. The tracking can be based on two different synchronization techniques: full time correlation between the system with a synch cable or triggering the systems at the same time. When a synch cable is used and the SYnch command is turned on, then the timestamps of all systems will show the same time. If the synch cable is not available then the emulators may be triggered by an event that is available on all units. The tracking assumes that the trigger event, sampled by the analyzers of all emulators, was sampled at the same time on all systems. Triggering all systems at the same time can be done by using trigger input and output lines. The bidirectional coaxial trigger A line of SA120 and HA120 units are very useful for triggering in multiprocessor systems.
The following examples uses TCP/IP for the cross tracking:
If TCP/IP is not available the communication can by made by a file:
The following analyzer trigger program can serve as a template:
See also
■ <trace>.state ■ Trace
Format: <trace>.XTrack <intercom_name> (deprecated)Use SYnch.XTrack instead.
NOTE: As the time bases of the systems are then not correlated, long measurements can lead to small errors, due to inexact local times.
emulator 1 emulator 2
'Analyzer.XTrackste:20002' 'Analyzer.XTrackste:20001'
emulator 1 emulator 2
InterCom c:\tmp\emu_1'Analyzer.XTrackc:\tmp\emu_2'
InterCom c:\tmp\emu_2'Analyzer.XTrackc:\tmp\emu_1'
Out.A IF <local_trigger_condition>
Trigger.A IF inouta
; trigger all emulators if the; local trigger condition arrives; local trigger if any processors; in the system triggers
General Commands Reference Guide T 458 ©1989-2019 Lauterbach GmbH
<trace>.ZERO Align timestamps of trace and timing analyzers
Use this command to align the zero time point for trace and timing analyzer sources with time bases of different origin.
The table below shows the different sources for time information. As the different sources are not related, they all have an individual zero time point.
Due to the different zero time points of the various data sources, it is required to align the zero time points, before trace or timing recordings can be observed in a correlated manner. This is usually achieved by locating a common event in the different sources and selecting this event as common zero time point.
Example tbd.
See also
■ <trace>.state ■ Trace
Format: <trace>.ZERO [<time> | <record> | "<trace_bookmark>"]
<time> Moves the ZERO point by specified time.
<record> Sets the ZERO point to the time index of the specified record number.
<bookmark> Sets the ZERO point to the time index of the specified bookmark location. You can create trace bookmarks with the <trace>.BookMark command.
no parameter Reset zero time point back to initial location.
Timestamp Trace data source Original zero time point
Timestamps generated by TRACE32 hardware
Analyzer (no processor generated timestamps)PowerProbe, Integrator, IProbe, etc.
Permanently set to beginning of first debug session or trace recording after starting up TRACE32 PowerView.All trace data sources using TRACE32 hardware generated timestamps have a common zero time point.
Timestamps generated by target processor
Onchip TraceAnalyzer Trace (with processor generated timestamps enabled)
Depends on CPU architecture and trace protocol. Starting a new trace recording usually moves the zero time point to a new location.
Timestamps loaded from files.
Trace.LOAD <file> /FILE Same as in original recording
General Commands Reference Guide T 459 ©1989-2019 Lauterbach GmbH
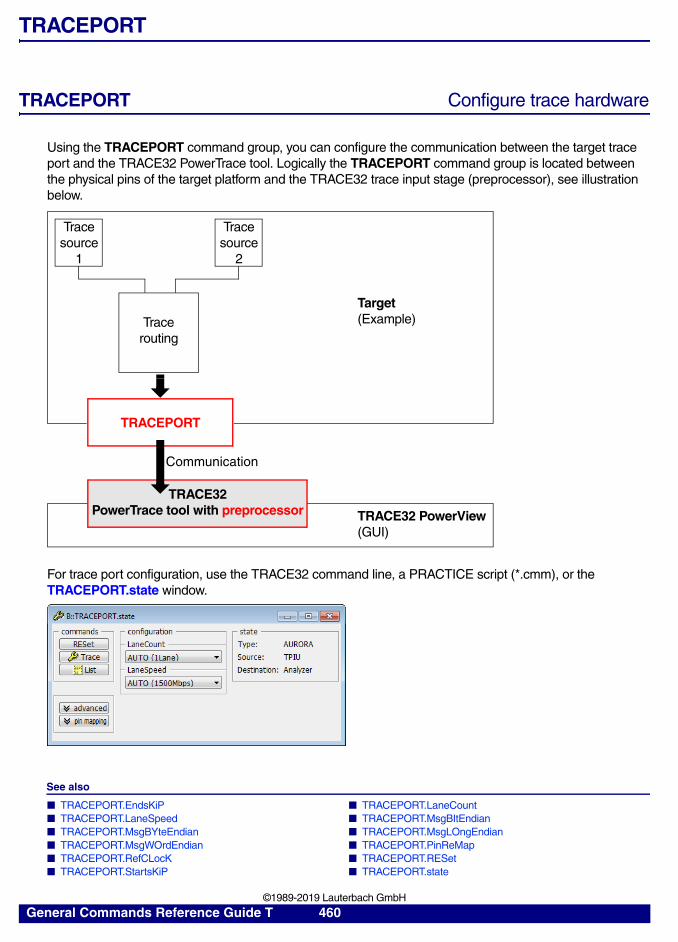
TRACEPORT
TRACEPORT Configure trace hardware
Using the TRACEPORT command group, you can configure the communication between the target trace port and the TRACE32 PowerTrace tool. Logically the TRACEPORT command group is located between the physical pins of the target platform and the TRACE32 trace input stage (preprocessor), see illustration below.
For trace port configuration, use the TRACE32 command line, a PRACTICE script (*.cmm), or the TRACEPORT.state window.
See also
■ TRACEPORT.EndsKiP ■ TRACEPORT.LaneCount ■ TRACEPORT.LaneSpeed ■ TRACEPORT.MsgBItEndian ■ TRACEPORT.MsgBYteEndian ■ TRACEPORT.MsgLOngEndian ■ TRACEPORT.MsgWOrdEndian ■ TRACEPORT.PinReMap ■ TRACEPORT.RefCLocK ■ TRACEPORT.RESet ■ TRACEPORT.StartsKiP ■ TRACEPORT.state
TRACEPORT
Trace source
1
Target(Example)
TRACE32 PowerView(GUI)
Trace source
2
TRACE32PowerTrace tool with preprocessor
Trace routing
Communication
General Commands Reference Guide T 460 ©1989-2019 Lauterbach GmbH
■ SYStem.CONFIG TRACEPORT ❏ TRACEPORT.LaneCount()
▲ ’TRACEPORT Function’ in ’General Function Reference’▲ ’Trace Port Utilization’ in ’PowerTrace Serial User´s Guide’
TRACEPORT.EndsKiP Define number of bytes skipped at the end of frameFor serial trace ports (AURORA) only
Allows to cut off data bytes at the end of each data packet or data frame. Depending on the target configuration, the last bytes of a frame contain CRC information, which is not used by TRACE32. With the command TRACEPORT.EndsKiP it is possible to remove the unused bytes.
See also
■ TRACEPORT ■ TRACEPORT.state
Format: TRACEPORT.EndsKiP [<option>]
<option>: AUTO | 0 | 2 | 8
AUTO TRACE32 defines the number of bytes to be cut.
0 Don’t cut any bytes.
2 Cut 2 bytes at the end of each frame.
8 Cut 8 bytes at the end of each frame.
General Commands Reference Guide T 461 ©1989-2019 Lauterbach GmbH
TRACEPORT.LaneCount Select port size of the trace portFor serial trace ports (AURORA/PCIe) only
Specifies the number of used lanes for the trace port. The number must match the target configuration, else the trace link between the target and the TRACE32 hardware cannot be established.
See also
■ TRACEPORT ■ TRACEPORT.state ❏ TRACEPORT.LaneCount()
TRACEPORT.LaneSpeed Inform debugger about trace port frequencyFor serial trace ports (AURORA/PCIe) only
Informs the debugger about the lane <data_rate>. The data rate must match the configuration on the target side, else the link between the target and the TRACE32 hardware (Aurora trace channel) cannot be established.
Format: TRACEPORT.LaneCount <size>
<size>: AUTO | 1Lane | 2Lane | 3Lane | 4Lane | 5Lane | 6Lane | 7Lane | 8Lane
AUTO TRACE32 defines the lane count.
1Lane, 2Lane, 3Lane, 4Lane, 5Lane, 6Lane, 7Lane, 8Lane
Number of used lanes.In case of PCIe the lane setup will be done automatically.
Format: TRACEPORT.LaneSpeed <data_rate>
<data_rate>:For AURORA only
AUTO | 625Mbps | 750Mbps | 850Mbps | 931Mbps | 1000Mbps | 1040Mbps | 1250Mbps | 1500Mbps | 1563Mbps | 1700Mbps | 1862Mbps | 2000Mbps 2079Mbps | 2500Mbps | 3000Mbps | 3125Mbps | 3400Mbps | 3724Mbps | 4000Mbps | 4158Mbps | 4250Mbps | 5000Mbps | 6000Mbps | 6250Mbps | 6800Mbps | 7448Mbps | 8000Mbps | 10000Mbps | 12000Mbps | 12500Mbps
<data_rate>:For PCIe only
GEN1 | GEN2 | GEN3
General Commands Reference Guide T 462 ©1989-2019 Lauterbach GmbH
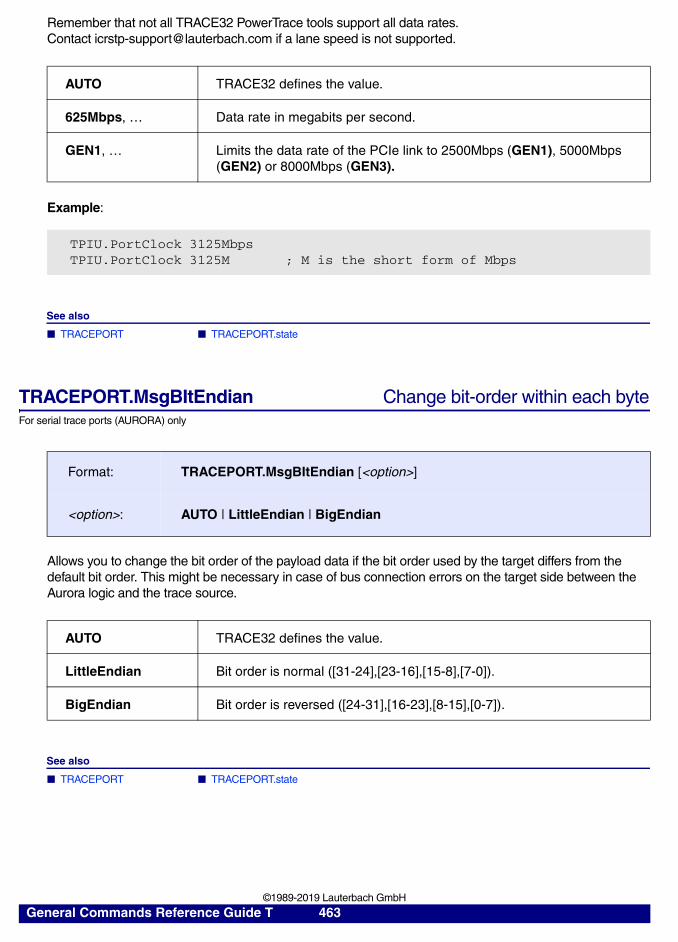
Remember that not all TRACE32 PowerTrace tools support all data rates. Contact [email protected] if a lane speed is not supported.
Example:
See also
■ TRACEPORT ■ TRACEPORT.state
TRACEPORT.MsgBItEndian Change bit-order within each byteFor serial trace ports (AURORA) only
Allows you to change the bit order of the payload data if the bit order used by the target differs from the default bit order. This might be necessary in case of bus connection errors on the target side between the Aurora logic and the trace source.
See also
■ TRACEPORT ■ TRACEPORT.state
AUTO TRACE32 defines the value.
625Mbps, … Data rate in megabits per second.
GEN1, … Limits the data rate of the PCIe link to 2500Mbps (GEN1), 5000Mbps (GEN2) or 8000Mbps (GEN3).
TPIU.PortClock 3125MbpsTPIU.PortClock 3125M ; M is the short form of Mbps
Format: TRACEPORT.MsgBItEndian [<option>]
<option>: AUTO | LittleEndian | BigEndian
AUTO TRACE32 defines the value.
LittleEndian Bit order is normal ([31-24],[23-16],[15-8],[7-0]).
BigEndian Bit order is reversed ([24-31],[16-23],[8-15],[0-7]).
General Commands Reference Guide T 463 ©1989-2019 Lauterbach GmbH
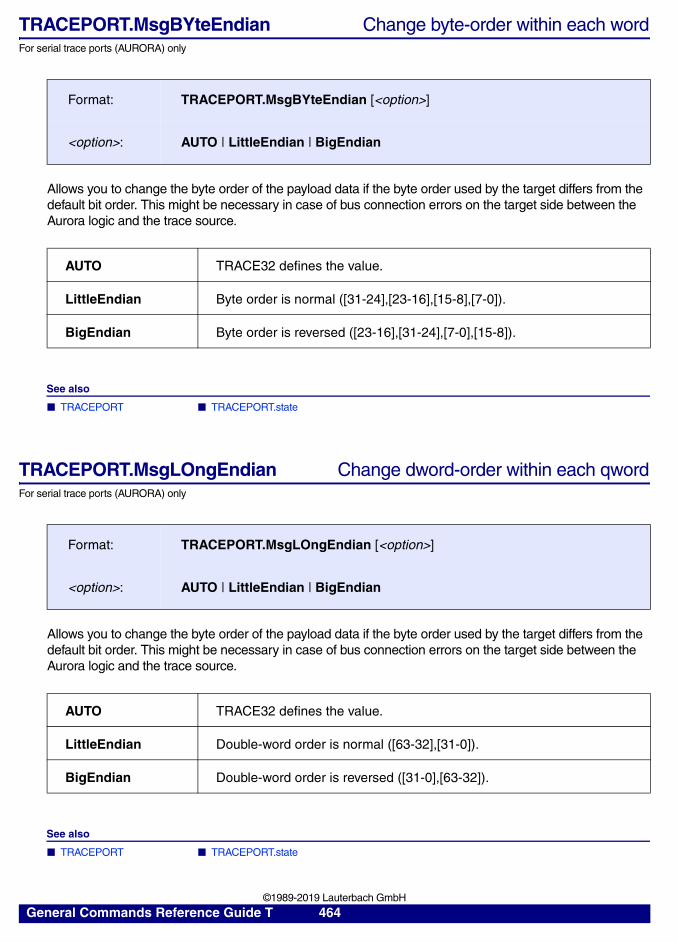
TRACEPORT.MsgBYteEndian Change byte-order within each wordFor serial trace ports (AURORA) only
Allows you to change the byte order of the payload data if the byte order used by the target differs from the default bit order. This might be necessary in case of bus connection errors on the target side between the Aurora logic and the trace source.
See also
■ TRACEPORT ■ TRACEPORT.state
TRACEPORT.MsgLOngEndian Change dword-order within each qwordFor serial trace ports (AURORA) only
Allows you to change the byte order of the payload data if the byte order used by the target differs from the default bit order. This might be necessary in case of bus connection errors on the target side between the Aurora logic and the trace source.
See also
■ TRACEPORT ■ TRACEPORT.state
Format: TRACEPORT.MsgBYteEndian [<option>]
<option>: AUTO | LittleEndian | BigEndian
AUTO TRACE32 defines the value.
LittleEndian Byte order is normal ([31-24],[23-16],[15-8],[7-0]).
BigEndian Byte order is reversed ([23-16],[31-24],[7-0],[15-8]).
Format: TRACEPORT.MsgLOngEndian [<option>]
<option>: AUTO | LittleEndian | BigEndian
AUTO TRACE32 defines the value.
LittleEndian Double-word order is normal ([63-32],[31-0]).
BigEndian Double-word order is reversed ([31-0],[63-32]).
General Commands Reference Guide T 464 ©1989-2019 Lauterbach GmbH
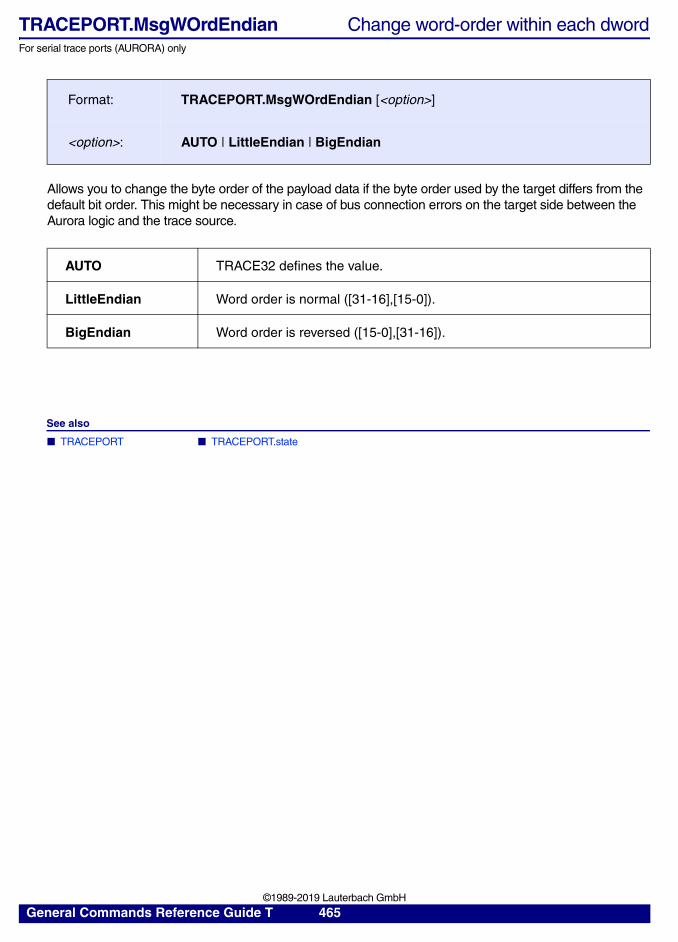
TRACEPORT.MsgWOrdEndian Change word-order within each dwordFor serial trace ports (AURORA) only
Allows you to change the byte order of the payload data if the byte order used by the target differs from the default bit order. This might be necessary in case of bus connection errors on the target side between the Aurora logic and the trace source.
See also
■ TRACEPORT ■ TRACEPORT.state
Format: TRACEPORT.MsgWOrdEndian [<option>]
<option>: AUTO | LittleEndian | BigEndian
AUTO TRACE32 defines the value.
LittleEndian Word order is normal ([31-16],[15-0]).
BigEndian Word order is reversed ([15-0],[31-16]).
General Commands Reference Guide T 465 ©1989-2019 Lauterbach GmbH
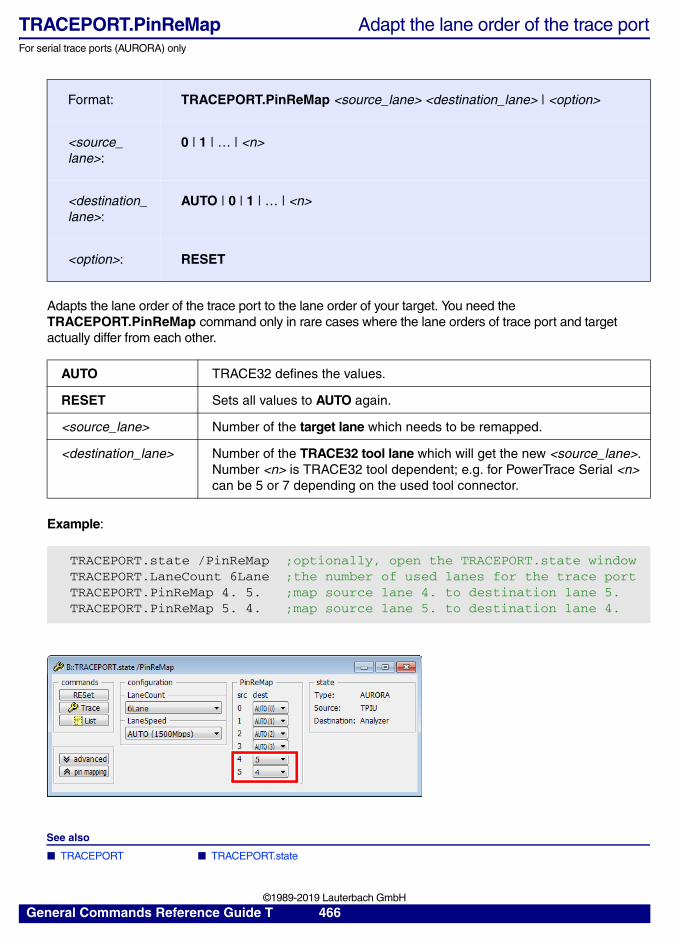
TRACEPORT.PinReMap Adapt the lane order of the trace portFor serial trace ports (AURORA) only
Adapts the lane order of the trace port to the lane order of your target. You need the TRACEPORT.PinReMap command only in rare cases where the lane orders of trace port and target actually differ from each other.
Example:
See also
■ TRACEPORT ■ TRACEPORT.state
Format: TRACEPORT.PinReMap <source_lane> <destination_lane> | <option>
<source_lane>:
0 | 1 | … | <n>
<destination_lane>:
AUTO | 0 | 1 | … | <n>
<option>: RESET
AUTO TRACE32 defines the values.
RESET Sets all values to AUTO again.
<source_lane> Number of the target lane which needs to be remapped.
<destination_lane> Number of the TRACE32 tool lane which will get the new <source_lane>. Number <n> is TRACE32 tool dependent; e.g. for PowerTrace Serial <n> can be 5 or 7 depending on the used tool connector.
TRACEPORT.state /PinReMap ;optionally, open the TRACEPORT.state windowTRACEPORT.LaneCount 6Lane ;the number of used lanes for the trace portTRACEPORT.PinReMap 4. 5. ;map source lane 4. to destination lane 5.TRACEPORT.PinReMap 5. 4. ;map source lane 5. to destination lane 4.
General Commands Reference Guide T 466 ©1989-2019 Lauterbach GmbH
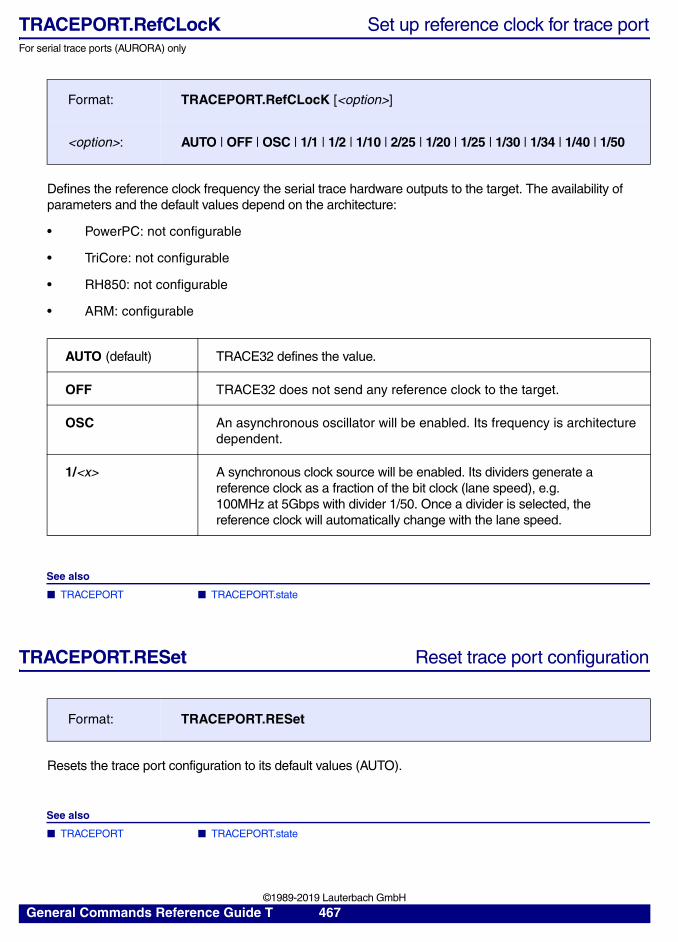
TRACEPORT.RefCLocK Set up reference clock for trace portFor serial trace ports (AURORA) only
Defines the reference clock frequency the serial trace hardware outputs to the target. The availability of parameters and the default values depend on the architecture:
• PowerPC: not configurable
• TriCore: not configurable
• RH850: not configurable
• ARM: configurable
See also
■ TRACEPORT ■ TRACEPORT.state
TRACEPORT.RESet Reset trace port configuration
Resets the trace port configuration to its default values (AUTO).
See also
■ TRACEPORT ■ TRACEPORT.state
Format: TRACEPORT.RefCLocK [<option>]
<option>: AUTO | OFF | OSC | 1/1 | 1/2 | 1/10 | 2/25 | 1/20 | 1/25 | 1/30 | 1/34 | 1/40 | 1/50
AUTO (default) TRACE32 defines the value.
OFF TRACE32 does not send any reference clock to the target.
OSC An asynchronous oscillator will be enabled. Its frequency is architecture dependent.
1/<x> A synchronous clock source will be enabled. Its dividers generate a reference clock as a fraction of the bit clock (lane speed), e.g. 100MHz at 5Gbps with divider 1/50. Once a divider is selected, the reference clock will automatically change with the lane speed.
Format: TRACEPORT.RESet
General Commands Reference Guide T 467 ©1989-2019 Lauterbach GmbH
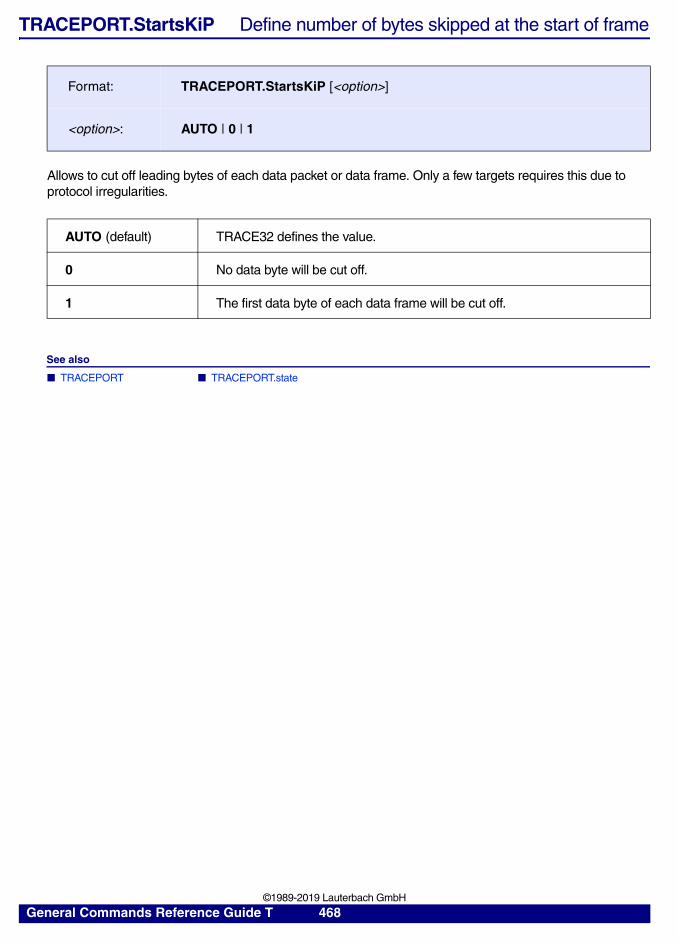
TRACEPORT.StartsKiP Define number of bytes skipped at the start of frame
Allows to cut off leading bytes of each data packet or data frame. Only a few targets requires this due to protocol irregularities.
See also
■ TRACEPORT ■ TRACEPORT.state
Format: TRACEPORT.StartsKiP [<option>]
<option>: AUTO | 0 | 1
AUTO (default) TRACE32 defines the value.
0 No data byte will be cut off.
1 The first data byte of each data frame will be cut off.
General Commands Reference Guide T 468 ©1989-2019 Lauterbach GmbH
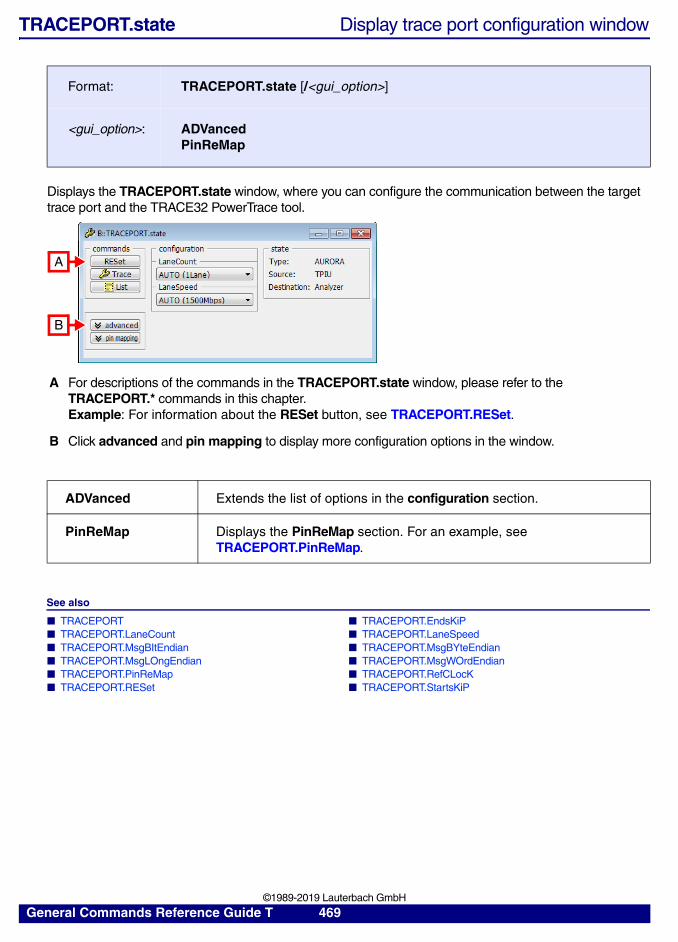
TRACEPORT.state Display trace port configuration window
Displays the TRACEPORT.state window, where you can configure the communication between the target trace port and the TRACE32 PowerTrace tool.
See also
■ TRACEPORT ■ TRACEPORT.EndsKiP ■ TRACEPORT.LaneCount ■ TRACEPORT.LaneSpeed ■ TRACEPORT.MsgBItEndian ■ TRACEPORT.MsgBYteEndian ■ TRACEPORT.MsgLOngEndian ■ TRACEPORT.MsgWOrdEndian ■ TRACEPORT.PinReMap ■ TRACEPORT.RefCLocK ■ TRACEPORT.RESet ■ TRACEPORT.StartsKiP
Format: TRACEPORT.state [/<gui_option>]
<gui_option>: ADVancedPinReMap
A For descriptions of the commands in the TRACEPORT.state window, please refer to the TRACEPORT.* commands in this chapter. Example: For information about the RESet button, see TRACEPORT.RESet.
B Click advanced and pin mapping to display more configuration options in the window.
ADVanced Extends the list of options in the configuration section.
PinReMap Displays the PinReMap section. For an example, see TRACEPORT.PinReMap.
A
B
General Commands Reference Guide T 469 ©1989-2019 Lauterbach GmbH
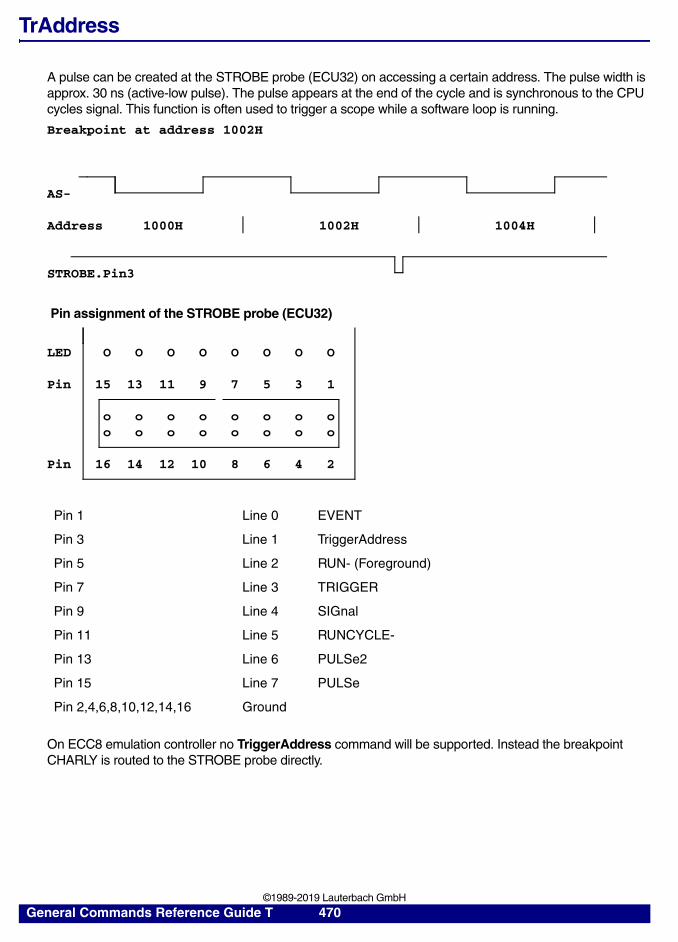
TrAddress
A pulse can be created at the STROBE probe (ECU32) on accessing a certain address. The pulse width is approx. 30 ns (active-low pulse). The pulse appears at the end of the cycle and is synchronous to the CPU cycles signal. This function is often used to trigger a scope while a software loop is running.
Pin assignment of the STROBE probe (ECU32)
On ECC8 emulation controller no TriggerAddress command will be supported. Instead the breakpoint CHARLY is routed to the STROBE probe directly.
Pin 1 Line 0 EVENT
Pin 3 Line 1 TriggerAddress
Pin 5 Line 2 RUN- (Foreground)
Pin 7 Line 3 TRIGGER
Pin 9 Line 4 SIGnal
Pin 11 Line 5 RUNCYCLE-
Pin 13 Line 6 PULSe2
Pin 15 Line 7 PULSe
Pin 2,4,6,8,10,12,14,16 Ground
Breakpoint at address 1002H
AS-
Address 1000H 1002H 1004H
STROBE.Pin3
LED O O O O O O O O
Pin 15 13 11 9 7 5 3 1
o o o o o o o oo o o o o o o o
Pin 16 14 12 10 8 6 4 2
General Commands Reference Guide T 470 ©1989-2019 Lauterbach GmbH
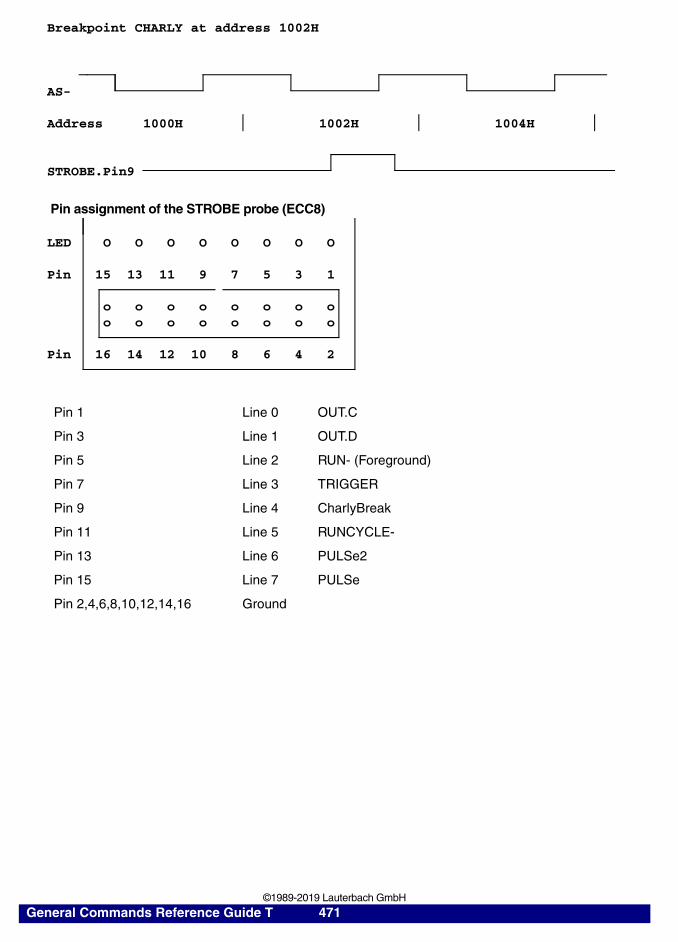
Pin assignment of the STROBE probe (ECC8)
Pin 1 Line 0 OUT.C
Pin 3 Line 1 OUT.D
Pin 5 Line 2 RUN- (Foreground)
Pin 7 Line 3 TRIGGER
Pin 9 Line 4 CharlyBreak
Pin 11 Line 5 RUNCYCLE-
Pin 13 Line 6 PULSe2
Pin 15 Line 7 PULSe
Pin 2,4,6,8,10,12,14,16 Ground
Breakpoint CHARLY at address 1002H
AS-
Address 1000H 1002H 1004H
STROBE.Pin9
LED O O O O O O O O
Pin 15 13 11 9 7 5 3 1
o o o o o o o oo o o o o o o o
Pin 16 14 12 10 8 6 4 2
General Commands Reference Guide T 471 ©1989-2019 Lauterbach GmbH
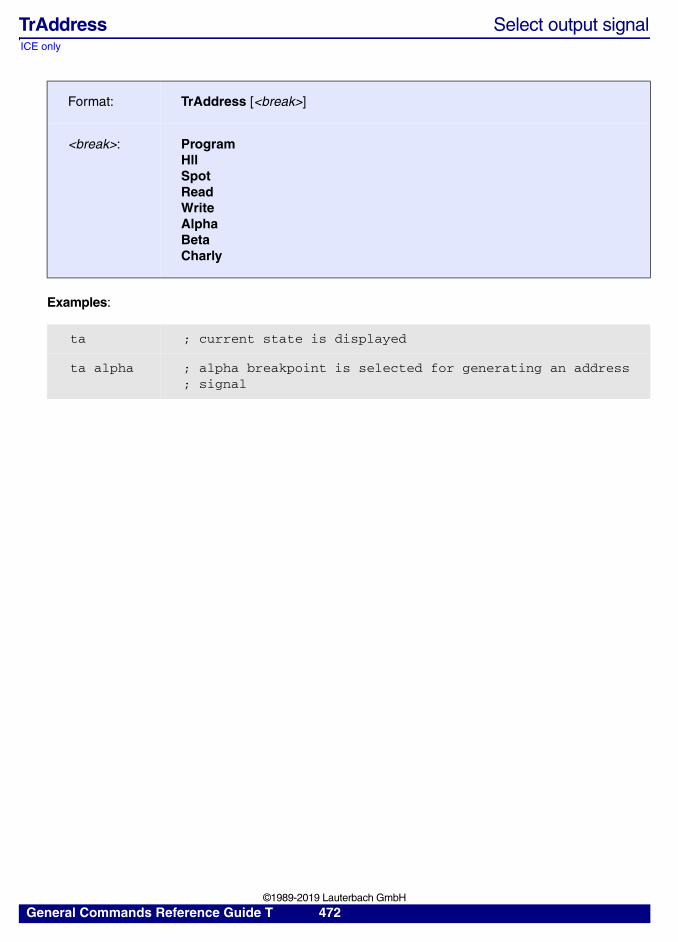
ICE only
TrAddress Select output signal
Examples:
Format: TrAddress [<break>]
<break>: ProgramHllSpotReadWriteAlphaBetaCharly
ta ; current state is displayed
ta alpha ; alpha breakpoint is selected for generating an address; signal
General Commands Reference Guide T 472 ©1989-2019 Lauterbach GmbH
TRANSlation
TRANSlation Debugger address translation
See also
■ TRANSlation.AutoEnable ■ TRANSlation.AutoSCAN ■ TRANSlation.CacheFlush ■ TRANSlation.CLEANUP ■ TRANSlation.COMMON ■ TRANSlation.Create ■ TRANSlation.CreateID ■ TRANSlation.CreateTab ■ TRANSlation.Delete ■ TRANSlation.DeleteID ■ TRANSlation.List ■ TRANSlation.ListID ■ TRANSlation.NoProtect ■ TRANSlation.OFF ■ TRANSlation.ON ■ TRANSlation.PAGER ■ TRANSlation.Protect ■ TRANSlation.RESet ■ TRANSlation.SCANall ■ TRANSlation.ScanID ■ TRANSlation.SHADOW ■ TRANSlation.state ■ TRANSlation.TableWalk ■ TRANSlation.TlbAutoScan ■ TRANSlation.TRANSparent ■ MMU ■ MMU.FORMAT ■ SYStem.Option MMUSPACES ❏ TRANS.ENABLE() ❏ TRANS.INTERMEDIATE() ❏ TRANS.INTERMEDIATEEX() ❏ TRANS.LINEAR() ❏ TRANS.LINEAREX() ❏ TRANS.LOGICAL() ❏ TRANS.LOGICALEX() ❏ TRANS.PHYSICAL() ❏ TRANS.PHYSICALEX() ❏ TRANS.TABLEWALK()
▲ ’TRANS Functions (Debugger Address Translation)’ in ’General Function Reference’▲ ’Release Information’ in ’Release History’
Overview TRANSlation
What is the difference between the command groups...?
NOTE: Formerly, the MMU command group was used for address translation inside the debugger. With the wide-spread adoption of hardware MMUs, it was necessary to rename this command group to TRANSlation to avoid confusion with hardware MMUs.
TRANSlation MMU
Configures and controls the TRACE32 internal debugger address translation.This feature is used to mimic the translations within the real hardware MMU so that the debugger can access code and data of any OS process at any time.
Lets you access and view the real hardware MMU.
General Commands Reference Guide T 473 ©1989-2019 Lauterbach GmbH
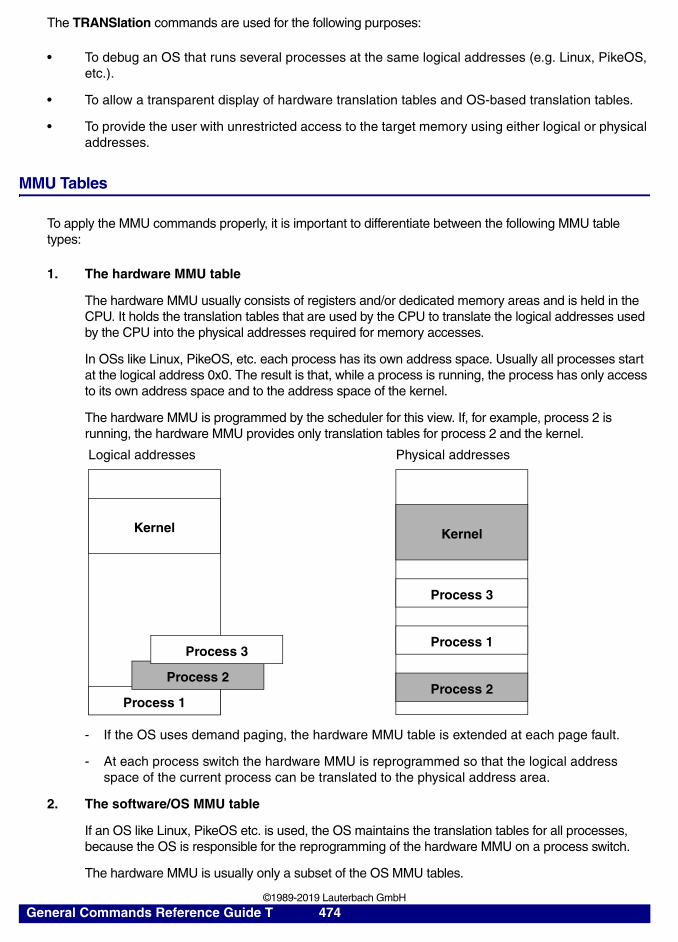
The TRANSlation commands are used for the following purposes:
• To debug an OS that runs several processes at the same logical addresses (e.g. Linux, PikeOS, etc.).
• To allow a transparent display of hardware translation tables and OS-based translation tables.
• To provide the user with unrestricted access to the target memory using either logical or physical addresses.
MMU Tables
To apply the MMU commands properly, it is important to differentiate between the following MMU table types:
1. The hardware MMU table
The hardware MMU usually consists of registers and/or dedicated memory areas and is held in the CPU. It holds the translation tables that are used by the CPU to translate the logical addresses used by the CPU into the physical addresses required for memory accesses.
In OSs like Linux, PikeOS, etc. each process has its own address space. Usually all processes start at the logical address 0x0. The result is that, while a process is running, the process has only access to its own address space and to the address space of the kernel.
The hardware MMU is programmed by the scheduler for this view. If, for example, process 2 is running, the hardware MMU provides only translation tables for process 2 and the kernel.
- If the OS uses demand paging, the hardware MMU table is extended at each page fault.
- At each process switch the hardware MMU is reprogrammed so that the logical address space of the current process can be translated to the physical address area.
2. The software/OS MMU table
If an OS like Linux, PikeOS etc. is used, the OS maintains the translation tables for all processes, because the OS is responsible for the reprogramming of the hardware MMU on a process switch.
The hardware MMU is usually only a subset of the OS MMU tables.
Logical addresses
Kernel
Process 1
Physical addresses
Kernel
Process 2
Process 3
Process 3
Process 2
Process 1
General Commands Reference Guide T 474 ©1989-2019 Lauterbach GmbH
3. The debugger MMU table
If an OS that runs several processes at the same logical addresses (e.g. Linux) is used, the hardware MMU in the CPU only holds translation tables that allow the debugger memory accesses to the code/data of the kernel and the currently running process.
The debugger can access code/data from a not currently running process only with the help of the OS MMU tables. Based on the information held in the translation tables of the OS MMU, the debugger can translate any logical address to a physical address and that way perform a memory access without changing the hardware MMU. If demand paging is used, the OS MMU table contains the translation from the logical to the physical address only if the page was loaded before.
Reading the OS MMU tables on every memory access in quite time consuming. Therefore the debugger can scan the OS MMU tables once and re-use the scan for all following accesses.
The OS MMU table is scanned into the so-called debugger MMU. The debugger MMU provides also the flexibility to add user-defined entries.
tbd.
Example
tbd.
Please be aware that as soon as the debugger MMU is active, all memory accesses performed by the debugger use only the information of the debugger MMU.Please be aware that the OS MMU tables have to be scanned again if the OS has added or removed entries from these tables while running.
General Commands Reference Guide T 475 ©1989-2019 Lauterbach GmbH
TRANSlation.AutoEnable Auto-enable debugger MMU translation
Auto-enable the debugger address translation if the CPU’s hardware MMU is enabled. When the hardware MMU is on, the debugger also performs translations. When the hardware MMU is off, the debugger performs no translation and treats all logical addresses as physical addresses. The state of the hardware MMU is read from the CPU-specific MMU-enable bit in a system control register. This command is only available for certain CPUs.
See also
■ TRANSlation ■ TRANSlation.List ■ TRANSlation.OFF ■ TRANSlation.ON
TRANSlation.AutoSCAN Autoscan feature for debugger MMU
If the operating system adds or removes entries from its page table while running those changes are not performed within the debugger MMU. Trying to access those newly created logical addresses with the debugger may cause an error. If TRANSlation.AutoSCAN is set to ON the translation tables hold by the operating system are automatically scanned into the debugger MMU, if the debugger fails to access a logical address.
See also
■ TRANSlation ■ TRANSlation.List
Format: TRANSlation.AutoEnable
Format: TRANSlation.AutoSCAN ON | OFF
TRANSlation.AutoSCAN scans only pages that are already present.Depending on the JTAG speed of the processor and on the number of processes in the system scanning the translation tables can take some time. In this cases autoscanning may be more disturbing than helping.
General Commands Reference Guide T 476 ©1989-2019 Lauterbach GmbH
TRANSlation.CacheFlush Flush TRACE32 address translation cache
Successful MMU address translations are cached internally by TRACE32. This speeds up recurring accesses to a logical address in debug mode - mostly when the OS Awareness is enabled. Caching is most beneficial for translations done via an MMU table walk as this generates many memory accesses while parsing the OS page table.
TRANSlation.CacheFlush flushes the TRACE32 internal address translation caches, so a new readout of the OS page table is enforced for the next memory access. This can be useful when modifying page table content or debugging MMU table walks.
See also
■ TRANSlation ■ TRANSlation.List ■ TRANSlation.TableWalk
TRANSlation.CLEANUP Clean up MMU table
Removes multiple translations for one physical address, directly joining translations and double translations.
See also
■ TRANSlation ■ TRANSlation.List
Format: TRANSlation.CacheFlush [ALL]
ALL Additionally invalidates the complete register set cached by the debugger, including all cached MMU registers. Upon the next MMU page table walk, the registers will be re-read from the target.
Format: TRANSlation.CLEANUPMMU.CLEANUP (deprecated)
General Commands Reference Guide T 477 ©1989-2019 Lauterbach GmbH
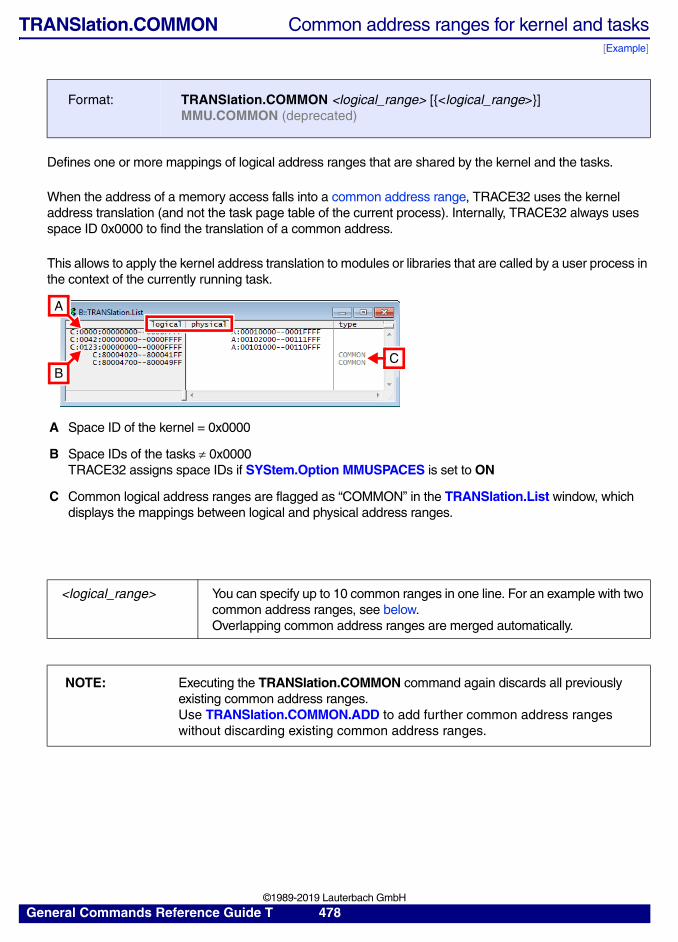
TRANSlation.COMMON Common address ranges for kernel and tasks[Example]
Defines one or more mappings of logical address ranges that are shared by the kernel and the tasks.
When the address of a memory access falls into a common address range, TRACE32 uses the kernel address translation (and not the task page table of the current process). Internally, TRACE32 always uses space ID 0x0000 to find the translation of a common address.
This allows to apply the kernel address translation to modules or libraries that are called by a user process in the context of the currently running task.
Format: TRANSlation.COMMON <logical_range> [{<logical_range>}]MMU.COMMON (deprecated)
A Space ID of the kernel = 0x0000
B Space IDs of the tasks 0x0000TRACE32 assigns space IDs if SYStem.Option MMUSPACES is set to ON
C Common logical address ranges are flagged as “COMMON” in the TRANSlation.List window, which displays the mappings between logical and physical address ranges.
<logical_range> You can specify up to 10 common ranges in one line. For an example with two common address ranges, see below. Overlapping common address ranges are merged automatically.
NOTE: Executing the TRANSlation.COMMON command again discards all previously existing common address ranges. Use TRANSlation.COMMON.ADD to add further common address ranges without discarding existing common address ranges.
A
BC
General Commands Reference Guide T 478 ©1989-2019 Lauterbach GmbH
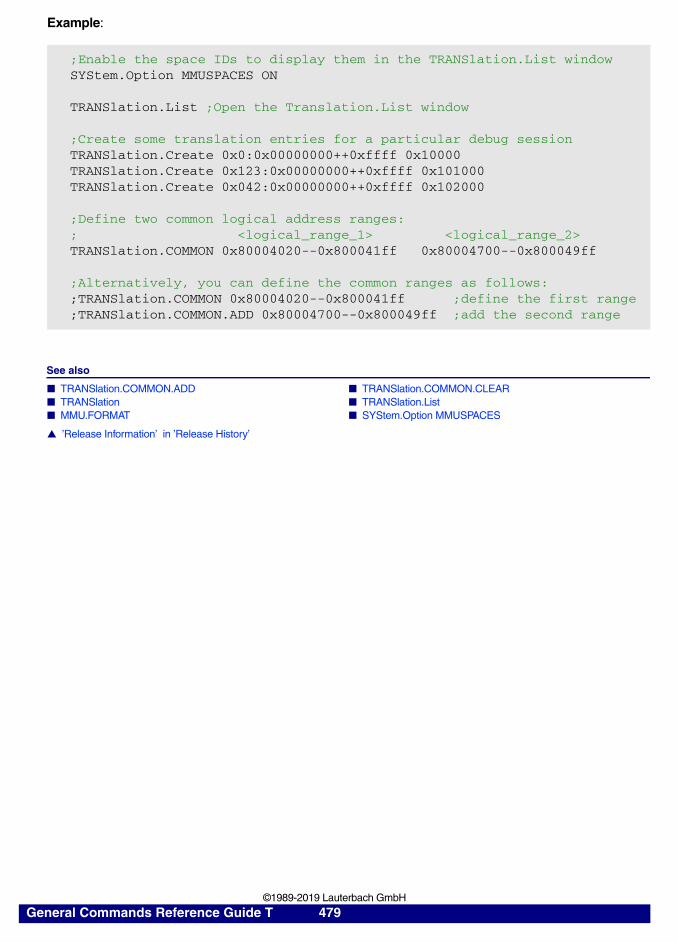
Example:
See also
■ TRANSlation.COMMON.ADD ■ TRANSlation.COMMON.CLEAR ■ TRANSlation ■ TRANSlation.List ■ MMU.FORMAT ■ SYStem.Option MMUSPACES
▲ ’Release Information’ in ’Release History’
;Enable the space IDs to display them in the TRANSlation.List windowSYStem.Option MMUSPACES ON
TRANSlation.List ;Open the Translation.List window
;Create some translation entries for a particular debug sessionTRANSlation.Create 0x0:0x00000000++0xffff 0x10000TRANSlation.Create 0x123:0x00000000++0xffff 0x101000TRANSlation.Create 0x042:0x00000000++0xffff 0x102000
;Define two common logical address ranges:; <logical_range_1> <logical_range_2>TRANSlation.COMMON 0x80004020--0x800041ff 0x80004700--0x800049ff
;Alternatively, you can define the common ranges as follows:;TRANSlation.COMMON 0x80004020--0x800041ff ;define the first range;TRANSlation.COMMON.ADD 0x80004700--0x800049ff ;add the second range
General Commands Reference Guide T 479 ©1989-2019 Lauterbach GmbH
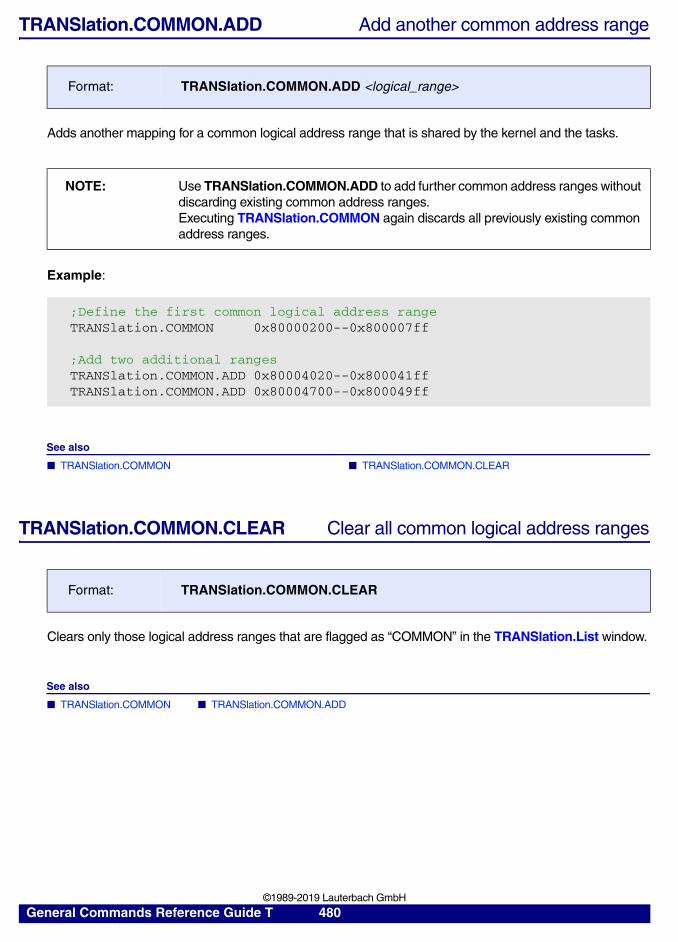
TRANSlation.COMMON.ADD Add another common address range
Adds another mapping for a common logical address range that is shared by the kernel and the tasks.
Example:
See also
■ TRANSlation.COMMON ■ TRANSlation.COMMON.CLEAR
TRANSlation.COMMON.CLEAR Clear all common logical address ranges
Clears only those logical address ranges that are flagged as “COMMON” in the TRANSlation.List window.
See also
■ TRANSlation.COMMON ■ TRANSlation.COMMON.ADD
Format: TRANSlation.COMMON.ADD <logical_range>
NOTE: Use TRANSlation.COMMON.ADD to add further common address ranges without discarding existing common address ranges.Executing TRANSlation.COMMON again discards all previously existing common address ranges.
;Define the first common logical address rangeTRANSlation.COMMON 0x80000200--0x800007ff
;Add two additional rangesTRANSlation.COMMON.ADD 0x80004020--0x800041ffTRANSlation.COMMON.ADD 0x80004700--0x800049ff
Format: TRANSlation.COMMON.CLEAR
General Commands Reference Guide T 480 ©1989-2019 Lauterbach GmbH
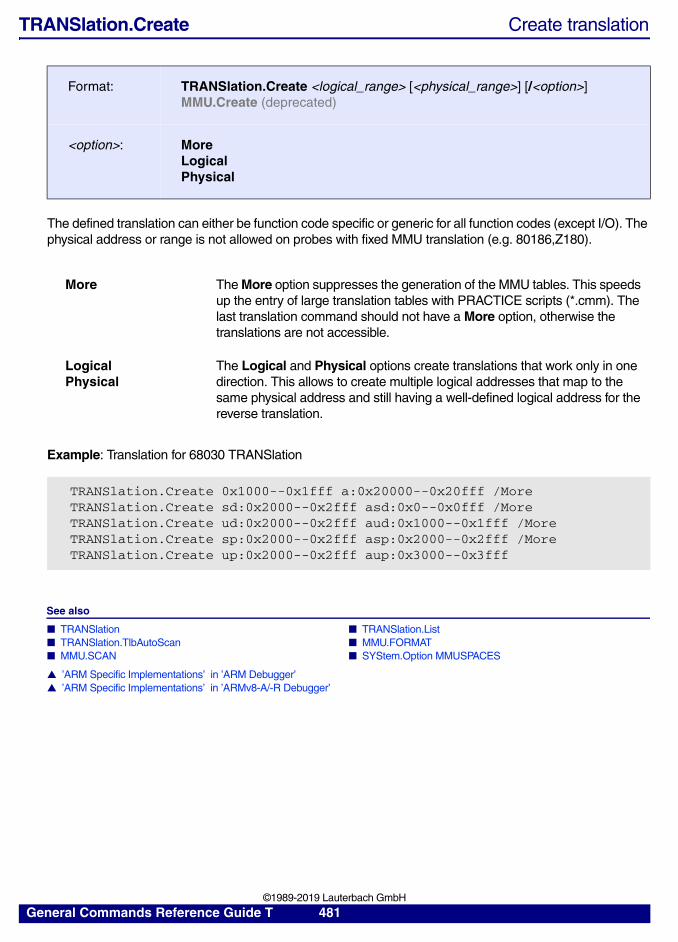
TRANSlation.Create Create translation
The defined translation can either be function code specific or generic for all function codes (except I/O). The physical address or range is not allowed on probes with fixed MMU translation (e.g. 80186,Z180).
Example: Translation for 68030 TRANSlation
See also
■ TRANSlation ■ TRANSlation.List ■ TRANSlation.TlbAutoScan ■ MMU.FORMAT ■ MMU.SCAN ■ SYStem.Option MMUSPACES
▲ ’ARM Specific Implementations’ in ’ARM Debugger’▲ ’ARM Specific Implementations’ in ’ARMv8-A/-R Debugger’
Format: TRANSlation.Create <logical_range> [<physical_range>] [/<option>]MMU.Create (deprecated)
<option>: MoreLogicalPhysical
More The More option suppresses the generation of the MMU tables. This speeds up the entry of large translation tables with PRACTICE scripts (*.cmm). The last translation command should not have a More option, otherwise the translations are not accessible.
LogicalPhysical
The Logical and Physical options create translations that work only in one direction. This allows to create multiple logical addresses that map to the same physical address and still having a well-defined logical address for the reverse translation.
TRANSlation.Create 0x1000--0x1fff a:0x20000--0x20fff /MoreTRANSlation.Create sd:0x2000--0x2fff asd:0x0--0x0fff /MoreTRANSlation.Create ud:0x2000--0x2fff aud:0x1000--0x1fff /MoreTRANSlation.Create sp:0x2000--0x2fff asp:0x2000--0x2fff /MoreTRANSlation.Create up:0x2000--0x2fff aup:0x3000--0x3fff
General Commands Reference Guide T 481 ©1989-2019 Lauterbach GmbH
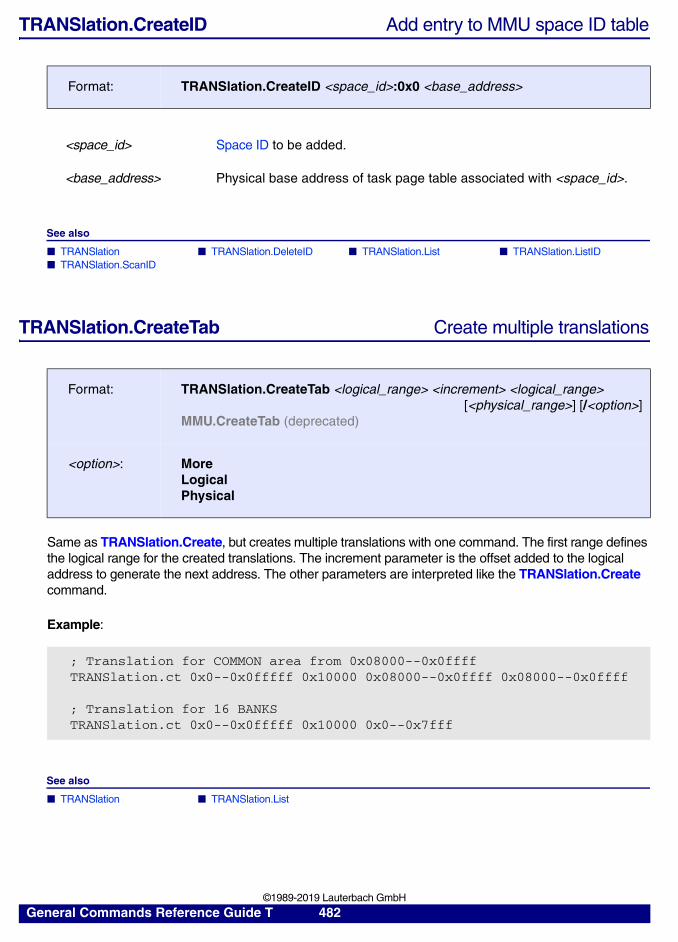
TRANSlation.CreateID Add entry to MMU space ID table
See also
■ TRANSlation ■ TRANSlation.DeleteID ■ TRANSlation.List ■ TRANSlation.ListID ■ TRANSlation.ScanID
TRANSlation.CreateTab Create multiple translations
Same as TRANSlation.Create, but creates multiple translations with one command. The first range defines the logical range for the created translations. The increment parameter is the offset added to the logical address to generate the next address. The other parameters are interpreted like the TRANSlation.Create command.
Example:
See also
■ TRANSlation ■ TRANSlation.List
Format: TRANSlation.CreateID <space_id>:0x0 <base_address>
<space_id> Space ID to be added.
<base_address> Physical base address of task page table associated with <space_id>.
Format: TRANSlation.CreateTab <logical_range> <increment> <logical_range> [<physical_range>] [/<option>]MMU.CreateTab (deprecated)
<option>: MoreLogicalPhysical
; Translation for COMMON area from 0x08000--0x0ffffTRANSlation.ct 0x0--0x0fffff 0x10000 0x08000--0x0ffff 0x08000--0x0ffff
; Translation for 16 BANKSTRANSlation.ct 0x0--0x0fffff 0x10000 0x0--0x7fff
General Commands Reference Guide T 482 ©1989-2019 Lauterbach GmbH
TRANSlation.Delete Delete translation
The defined translation is removed from the list; see TRANSlation.List. Use the command TRANSlation.RESet to clear the whole list.
Example:
See also
■ TRANSlation ■ TRANSlation.List
TRANSlation.DeleteID Remove entry from MMU space ID table
See also
■ TRANSlation ■ TRANSlation.CreateID ■ TRANSlation.List ■ TRANSlation.ListID ■ TRANSlation.ScanID
Format: TRANSlation.Delete <logical_range>MMU.Delete (deprecated)
TRANSlation.Delete 0x1000--0x1fff
Format: TRANSlation.DeleteID <space_id>:0x0
<space_id> Space ID to be removed.
General Commands Reference Guide T 483 ©1989-2019 Lauterbach GmbH
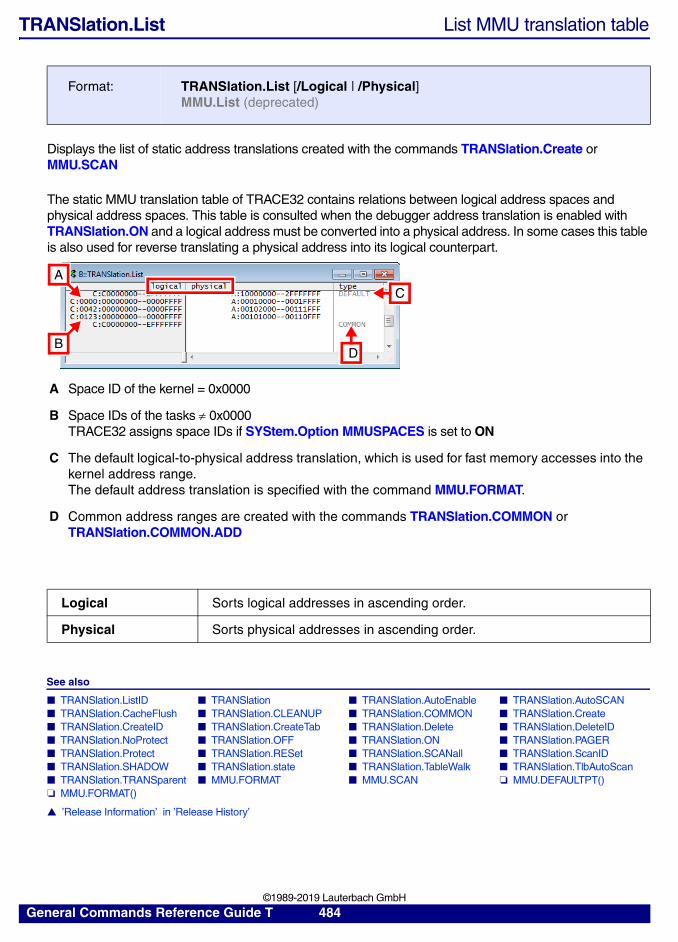
TRANSlation.List List MMU translation table
Displays the list of static address translations created with the commands TRANSlation.Create or MMU.SCAN
The static MMU translation table of TRACE32 contains relations between logical address spaces and physical address spaces. This table is consulted when the debugger address translation is enabled with TRANSlation.ON and a logical address must be converted into a physical address. In some cases this table is also used for reverse translating a physical address into its logical counterpart.
See also
■ TRANSlation.ListID ■ TRANSlation ■ TRANSlation.AutoEnable ■ TRANSlation.AutoSCAN ■ TRANSlation.CacheFlush ■ TRANSlation.CLEANUP ■ TRANSlation.COMMON ■ TRANSlation.Create ■ TRANSlation.CreateID ■ TRANSlation.CreateTab ■ TRANSlation.Delete ■ TRANSlation.DeleteID ■ TRANSlation.NoProtect ■ TRANSlation.OFF ■ TRANSlation.ON ■ TRANSlation.PAGER ■ TRANSlation.Protect ■ TRANSlation.RESet ■ TRANSlation.SCANall ■ TRANSlation.ScanID ■ TRANSlation.SHADOW ■ TRANSlation.state ■ TRANSlation.TableWalk ■ TRANSlation.TlbAutoScan ■ TRANSlation.TRANSparent ■ MMU.FORMAT ■ MMU.SCAN ❏ MMU.DEFAULTPT() ❏ MMU.FORMAT()
▲ ’Release Information’ in ’Release History’
Format: TRANSlation.List [/Logical | /Physical]MMU.List (deprecated)
A Space ID of the kernel = 0x0000
B Space IDs of the tasks 0x0000TRACE32 assigns space IDs if SYStem.Option MMUSPACES is set to ON
C The default logical-to-physical address translation, which is used for fast memory accesses into the kernel address range. The default address translation is specified with the command MMU.FORMAT.
D Common address ranges are created with the commands TRANSlation.COMMON or TRANSlation.COMMON.ADD
Logical Sorts logical addresses in ascending order.
Physical Sorts physical addresses in ascending order.
A
B
C
D
General Commands Reference Guide T 484 ©1989-2019 Lauterbach GmbH
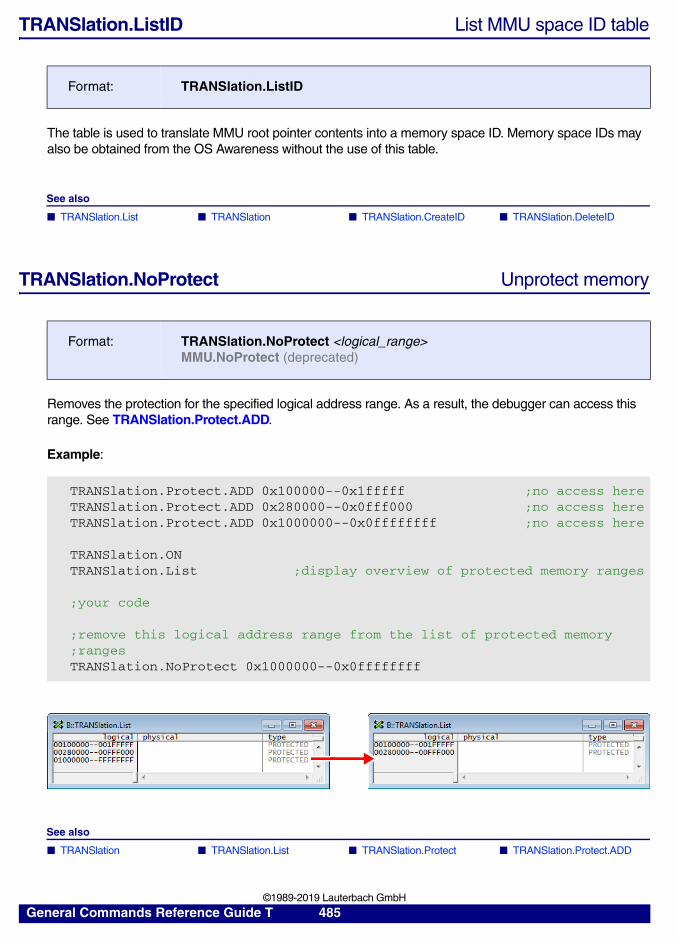
TRANSlation.ListID List MMU space ID table
The table is used to translate MMU root pointer contents into a memory space ID. Memory space IDs may also be obtained from the OS Awareness without the use of this table.
See also
■ TRANSlation.List ■ TRANSlation ■ TRANSlation.CreateID ■ TRANSlation.DeleteID
TRANSlation.NoProtect Unprotect memory
Removes the protection for the specified logical address range. As a result, the debugger can access this range. See TRANSlation.Protect.ADD.
Example:
See also
■ TRANSlation ■ TRANSlation.List ■ TRANSlation.Protect ■ TRANSlation.Protect.ADD
Format: TRANSlation.ListID
Format: TRANSlation.NoProtect <logical_range>MMU.NoProtect (deprecated)
TRANSlation.Protect.ADD 0x100000--0x1fffff ;no access hereTRANSlation.Protect.ADD 0x280000--0x0fff000 ;no access hereTRANSlation.Protect.ADD 0x1000000--0x0ffffffff ;no access here
TRANSlation.ONTRANSlation.List ;display overview of protected memory ranges
;your code
;remove this logical address range from the list of protected memory;rangesTRANSlation.NoProtect 0x1000000--0x0ffffffff
General Commands Reference Guide T 485 ©1989-2019 Lauterbach GmbH
TRANSlation.OFF Deactivate debugger address translation
Deactivates the TRACE32 internal debugger address translation.
Logical addresses used by the debugger are directly sent to the target CPU without translation. Also, the protection of address ranges which have been declared as protected is disabled.
See also
■ TRANSlation.ON ■ TRANSlation ■ TRANSlation.AutoEnable ■ TRANSlation.List
TRANSlation.ON Activate debugger address translation
Activates the TRACE32 internal debugger address translation. For Intel® architecture debuggers, the address translation is enabled by default. For all other architectures, the default is TRANSlation.OFF.
With TRANSlation.ON, the following features are enabled:
• Logical addresses are translated to physical addresses. The address translation is based on the following translation tables:
- The static address translation list (see TRANSlation.List)
- Intel® architectures only: the segment translation for boot mode, real mode and protected mode (see MMU.view, MMU.DUMP.GDT, MMU.DUMP.LDT and SYStem.Option.MEMoryMODEL)
- MIPS architectures only: the EVA or fixed mapping KSEG0/1 translations are done.
- OS page tables if the TRACE32 table walk is enabled (see TRANSlation.TableWalk and MMU.FORMAT).
- For some architectures, TLBs can be evaluated. This feature is also enabled with TRANSlation.TableWalk and MMU.FORMAT.
• Address ranges declared as protected are no longer accessible to the debugger (see TRANSlation.Protect).
Format: TRANSlation.OFFMMU.OFF (deprecated)
Format: TRANSlation.ONMMU.ON (deprecated)
General Commands Reference Guide T 486 ©1989-2019 Lauterbach GmbH
For an overview of the state of the debugger address translation, see TRANSlation.state.
See also
■ TRANSlation.OFF ■ TRANSlation ■ TRANSlation.AutoEnable ■ TRANSlation.List ❏ TRANS.ENABLE()
TRANSlation.PAGER Allow paged breakpoints for Linux
The TRACE32 software and a suitable Linux patch enable a software breakpoint to be set for program code that has not yet been loaded.
Details on the Linux patch can be found in the directory ~~/demo/arm/kernel/linux/etc/t32pager
See also
■ TRANSlation ■ TRANSlation.List
Format: TRANSlation.PAGER ON <address> | OFFMMU.Protect (deprecated)
General Commands Reference Guide T 487 ©1989-2019 Lauterbach GmbH
TRANSlation.Protect Protect memory
Using the TRANSlation.Protect command group, you can protect the entire logical address range or individual logical address ranges from debugger access. This can be useful if an access would otherwise cause a fatal hardware error or cause the debugger to go down.
What is the difference between...?
See also
■ TRANSlation.Protect.ADD ■ TRANSlation.Protect.OFF ■ TRANSlation.Protect.ON ■ TRANSlation ■ TRANSlation.List ■ TRANSlation.NoProtect
TRANSlation.Protect.ADD Add range to protected memory ranges[Example]
Protects the specified logical address range from debugger access.
TRANSlation.Protect.ON TRANSlation.Protect.ADD
• Protects the entire logical address range from debugger access.
• However, you can allow debugger access to individual logical address ranges by specifying them with TRANSlation.Create <logical_range>.
• Protects individual logical address ranges from debugger access.
• TRANSlation.Protect must not be set to ON.
Format: TRANSlation.Protect.ADD <logical_range>
NOTE: Use MAP.DenyAccess to protect physical address ranges from debugger access.Use TRANSlation.Protect.ADD to protect logical address ranges from debugger access.
General Commands Reference Guide T 488 ©1989-2019 Lauterbach GmbH
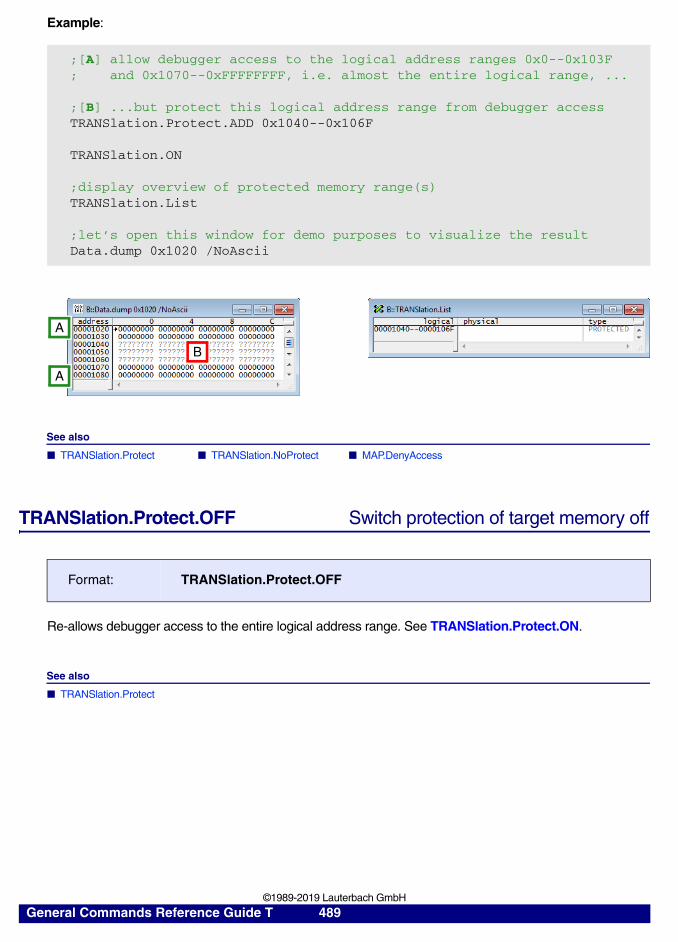
Example:
See also
■ TRANSlation.Protect ■ TRANSlation.NoProtect ■ MAP.DenyAccess
TRANSlation.Protect.OFF Switch protection of target memory off
Re-allows debugger access to the entire logical address range. See TRANSlation.Protect.ON.
See also
■ TRANSlation.Protect
;[A] allow debugger access to the logical address ranges 0x0--0x103F; and 0x1070--0xFFFFFFFF, i.e. almost the entire logical range, ...
;[B] ...but protect this logical address range from debugger accessTRANSlation.Protect.ADD 0x1040--0x106F
TRANSlation.ON
;display overview of protected memory range(s)TRANSlation.List
;let’s open this window for demo purposes to visualize the resultData.dump 0x1020 /NoAscii
Format: TRANSlation.Protect.OFF
B
A
A
General Commands Reference Guide T 489 ©1989-2019 Lauterbach GmbH
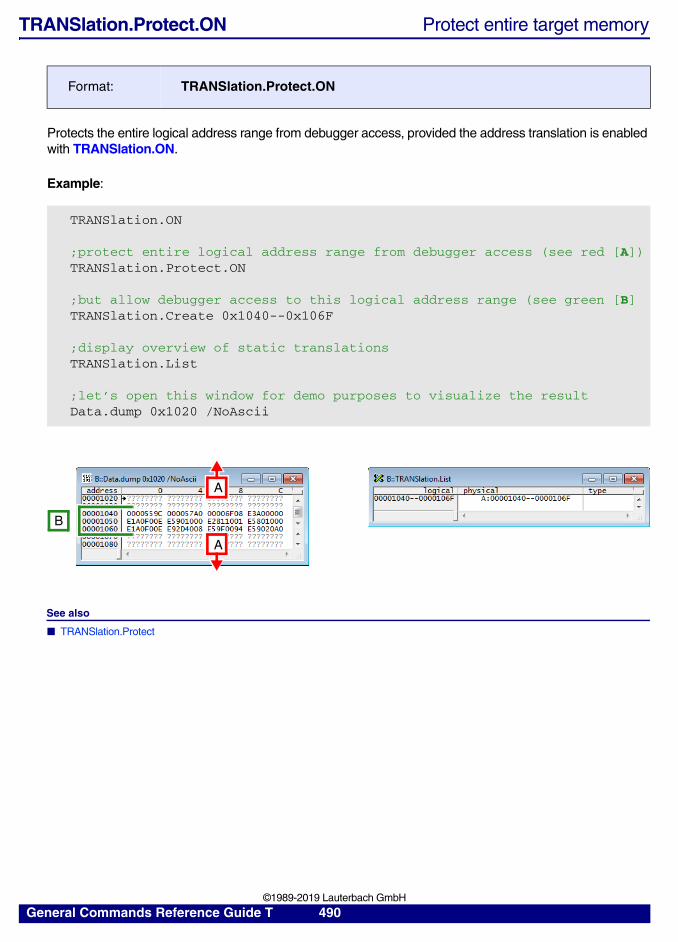
TRANSlation.Protect.ON Protect entire target memory
Protects the entire logical address range from debugger access, provided the address translation is enabled with TRANSlation.ON.
Example:
See also
■ TRANSlation.Protect
Format: TRANSlation.Protect.ON
TRANSlation.ON
;protect entire logical address range from debugger access (see red [A])TRANSlation.Protect.ON
;but allow debugger access to this logical address range (see green [B]TRANSlation.Create 0x1040--0x106F
;display overview of static translationsTRANSlation.List
;let’s open this window for demo purposes to visualize the resultData.dump 0x1020 /NoAscii
B
A
A
General Commands Reference Guide T 490 ©1989-2019 Lauterbach GmbH
TRANSlation.RESet Reset MMU configuration
The translation table is cleared and all setups are set to the defaults.
See also
■ TRANSlation ■ TRANSlation.List
TRANSlation.SCANall Scan MMU tables
Scans all page translation tables known to the debugger into the static translation list. That is, this command is a repeated call of the MMU.SCAN command for all known page tables of an architecture known to the debugger.
See also
■ TRANSlation ■ TRANSlation.List
TRANSlation.ScanID Scan MMU address space tables from kernel
Scans the translation information from the kernel into the MMU space ID table. The operation is target and kernel dependent.
See also
■ TRANSlation ■ TRANSlation.CreateID ■ TRANSlation.DeleteID ■ TRANSlation.List
Format: TRANSlation.RESetMMU.RESet (deprecated)
Format: TRANSlation.SCANallMMU.SCAN ALL (as an alias)MMU.SCANALL (deprecated)
Format: TRANSlation.ScanID
General Commands Reference Guide T 491 ©1989-2019 Lauterbach GmbH
TRANSlation.SHADOW Enable shadow access to target memory
Use VM: for data access, if the address translation on the target failed.
The debugger first tries to resolve a logical address with the standard address translation, and then accesses the target to read the requested data. If the translation fails (due to missing table entries, or due to an access error), and if TRANSlation.SHADOW is ON, the debugger uses the data within VM: at the requested address.
The debugger provides a “virtual memory” (access class VM:) that is not accessible from the CPU, but only by the debugger (stored within the host). The idea is to have a (partial) copy of the target memory in the host for unlimited access.
VM: usually is a “virtual physical memory”. The debugger does an address translation (logical -> physical), then accesses VM: with the physical address. I.e. VM: maps a physical memory.
If TRANSlation.SHADOW and SYStem.Option MMUSPACES is ON, VM: is used as several logical addressed memory areas, separated by the space ID. No address translation is done, instead the debugger directly accesses the memory in VM: with space ID:address. I.e. VM: maps several logical memory areas. In complex OS target systems (e.g. Linux), you may load the code of several processes into VM: to have access to the code, even if the target does currently not allow memory access.
See also
■ TRANSlation ■ TRANSlation.List
Format: TRANSlation.SHADOW [ON | OFF | ANY]
General Commands Reference Guide T 492 ©1989-2019 Lauterbach GmbH
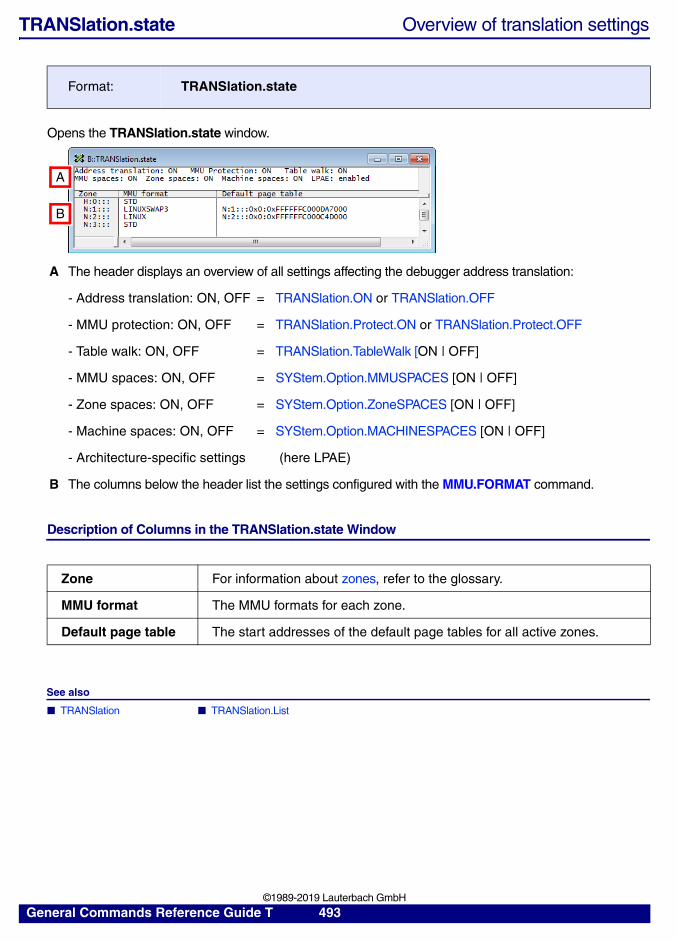
TRANSlation.state Overview of translation settings
Opens the TRANSlation.state window.
Description of Columns in the TRANSlation.state Window
See also
■ TRANSlation ■ TRANSlation.List
Format: TRANSlation.state
A The header displays an overview of all settings affecting the debugger address translation:
- Address translation: ON, OFF = TRANSlation.ON or TRANSlation.OFF
- MMU protection: ON, OFF = TRANSlation.Protect.ON or TRANSlation.Protect.OFF
- Table walk: ON, OFF = TRANSlation.TableWalk [ON | OFF]
- MMU spaces: ON, OFF = SYStem.Option.MMUSPACES [ON | OFF]
- Zone spaces: ON, OFF = SYStem.Option.ZoneSPACES [ON | OFF]
- Machine spaces: ON, OFF = SYStem.Option.MACHINESPACES [ON | OFF]
- Architecture-specific settings (here LPAE)
B The columns below the header list the settings configured with the MMU.FORMAT command.
Zone For information about zones, refer to the glossary.
MMU format The MMU formats for each zone.
Default page table The start addresses of the default page tables for all active zones.
A
B
General Commands Reference Guide T 493 ©1989-2019 Lauterbach GmbH
TRANSlation.TableWalk Automatic MMU page table walk
Configures the debugger to perform an MMU page table walk (short: table walk). If enabled, the debugger will try the following steps upon a logical-to-physical address translation request:
1. Look up the logical address in the debugger’s static address translation table (see TRANSla-tion.List and TRANSlation.Create for details about the static address translation table).
2. If the address lookup in the static address translation table fails, walk through the software/OS MMU tables to find a valid logical-to-physical translation.
3. For Intel® architecture debuggers, the boot mode, real mode, or protected mode segment translation is done before the page table walk is performed.
4. For MIPS architectures only: the EVA or fixed mapping KSEG0/1 translations are done before the page table walk is performed.
Valid address translations found are cached by TRACE32. When debug mode is left, i.e. at a Go or Step, the cached translations are flushed because page table contents may change when the target continues execution.
Format: TRANSlation.TableWalk [ON | OFF]
ON Configure TRACE32 to use the automatic MMU table walk.Only physical addresses are sent to the target.
NOTE for expert users:For some architectures, although a valid translation is available, TRACE32 sends logical addresses in certain situations in order to ensure cache coherency.This behavior can be controlled with the architecture-specific command SYStem.Option.MMUPhysLogMemaccess.
OFF Configure TRACE32 to not use the automatic MMU table walk.
NOTE: Page tables are dynamic structures and are frequently modified by the OS.
The MMU page table walk of the debugger dynamically parses the page tables on demand for every debugger address translation. The table walk ensures that the debugger address translations correspond to the current OS address translations.
General Commands Reference Guide T 494 ©1989-2019 Lauterbach GmbH
If no valid translation could be found for a logical address in any available translation table, then the error handling depends on whether TRANSlation.TableWalk is set to OFF or ON:
See also
■ TRANSlation ■ TRANSlation.CacheFlush ■ TRANSlation.List ■ MMU.FORMAT ❏ TRANS.TABLEWALK()
▲ ’ARM Specific Implementations’ in ’ARM Debugger’▲ ’ARM Specific Implementations’ in ’ARMv8-A/-R Debugger’▲ ’Release Information’ in ’Release History’
TRANSlation.TlbAutoScan Allow automatic TLB scans during table walk
Enable automatic scan of the TLBs for missing kernel address translations during MMU table walks. Ignore TLB entries with logical addresses outside the specified <logical_range>.
Some OS specify logical base addresses for kernel or task page tables. The table walk algorithm must translate them to physical addresses before the page table can be parsed. If there is no suitable user-defined default translation (MMU.FORMAT) or debugger MMU table (TRANSlation.List) entry, TRANSlation.TlbAutoScan will search the target MMU TLBs for a suitable translation that has been set up and used by the OS itself. If a suitable translation is found, it is copied into the debugger MMU table. This automatism can prevent debugger memory access failures caused by incomplete MMU setup scripts.
OFF No error will be produced by TRACE32.The logical address will be sent to the target CPU without translation.
ON A “MMU translation failed” error will be produced by TRACE32. Scripts will stop upon a failing translation. This mimics the behavior of the target MMU, where a failing translation causes an exception.
Format: TRANSlation.TlbAutoScan [ON | OFF] [<logical_range> [<logical_range>]]
NOTE: This command is not available for all architectures
NOTE: Only TLB entries in the kernel address range must be auto-extracted from TLBs. If you specify the typical kernel address range(s) for your target’s OS in <logical_range>, TRANSlation.TlbAutoScan will ignore dynamic TLB entries used for user processes.
General Commands Reference Guide T 495 ©1989-2019 Lauterbach GmbH
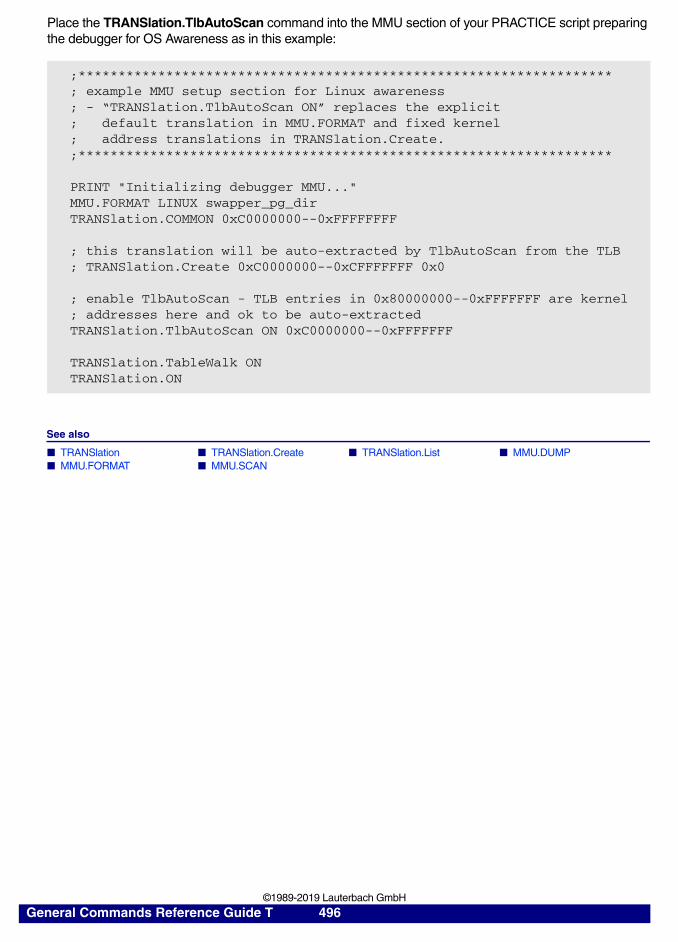
Place the TRANSlation.TlbAutoScan command into the MMU section of your PRACTICE script preparing the debugger for OS Awareness as in this example:
See also
■ TRANSlation ■ TRANSlation.Create ■ TRANSlation.List ■ MMU.DUMP ■ MMU.FORMAT ■ MMU.SCAN
;*******************************************************************; example MMU setup section for Linux awareness; - “TRANSlation.TlbAutoScan ON” replaces the explicit ; default translation in MMU.FORMAT and fixed kernel; address translations in TRANSlation.Create.;*******************************************************************
PRINT "Initializing debugger MMU..."MMU.FORMAT LINUX swapper_pg_dirTRANSlation.COMMON 0xC0000000--0xFFFFFFFF
; this translation will be auto-extracted by TlbAutoScan from the TLB; TRANSlation.Create 0xC0000000--0xCFFFFFFF 0x0
; enable TlbAutoScan - TLB entries in 0x80000000--0xFFFFFFF are kernel; addresses here and ok to be auto-extractedTRANSlation.TlbAutoScan ON 0xC0000000--0xFFFFFFF
TRANSlation.TableWalk ONTRANSlation.ON
General Commands Reference Guide T 496 ©1989-2019 Lauterbach GmbH
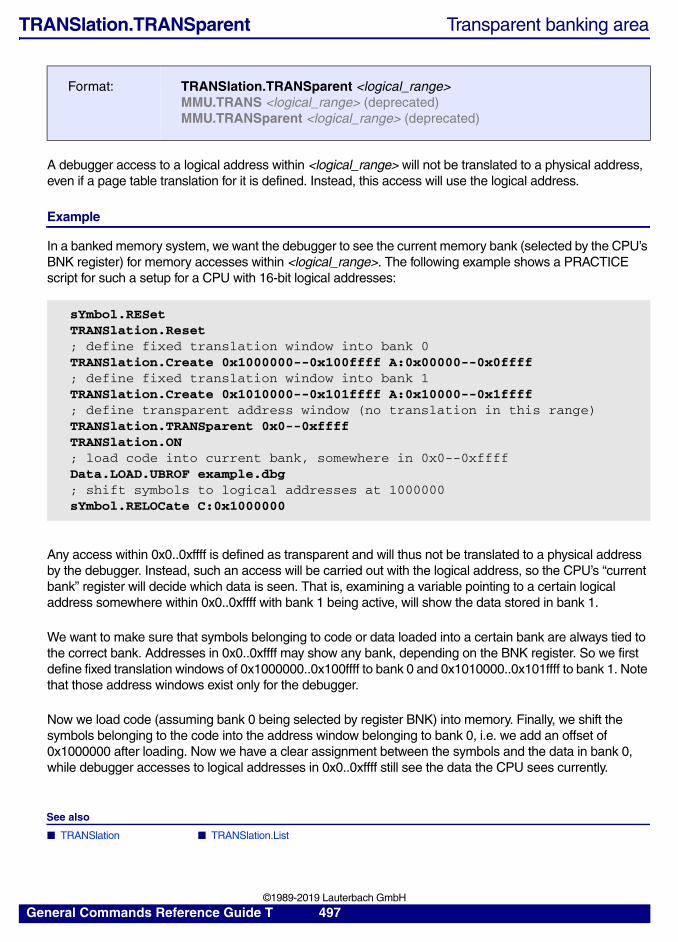
TRANSlation.TRANSparent Transparent banking area
A debugger access to a logical address within <logical_range> will not be translated to a physical address, even if a page table translation for it is defined. Instead, this access will use the logical address.
Example
In a banked memory system, we want the debugger to see the current memory bank (selected by the CPU’s BNK register) for memory accesses within <logical_range>. The following example shows a PRACTICE script for such a setup for a CPU with 16-bit logical addresses:
Any access within 0x0..0xffff is defined as transparent and will thus not be translated to a physical address by the debugger. Instead, such an access will be carried out with the logical address, so the CPU’s “current bank” register will decide which data is seen. That is, examining a variable pointing to a certain logical address somewhere within 0x0..0xffff with bank 1 being active, will show the data stored in bank 1.
We want to make sure that symbols belonging to code or data loaded into a certain bank are always tied to the correct bank. Addresses in 0x0..0xffff may show any bank, depending on the BNK register. So we first define fixed translation windows of 0x1000000..0x100ffff to bank 0 and 0x1010000..0x101ffff to bank 1. Note that those address windows exist only for the debugger.
Now we load code (assuming bank 0 being selected by register BNK) into memory. Finally, we shift the symbols belonging to the code into the address window belonging to bank 0, i.e. we add an offset of 0x1000000 after loading. Now we have a clear assignment between the symbols and the data in bank 0, while debugger accesses to logical addresses in 0x0..0xffff still see the data the CPU sees currently.
See also
■ TRANSlation ■ TRANSlation.List
Format: TRANSlation.TRANSparent <logical_range> MMU.TRANS <logical_range> (deprecated)MMU.TRANSparent <logical_range> (deprecated)
sYmbol.RESetTRANSlation.Reset; define fixed translation window into bank 0TRANSlation.Create 0x1000000--0x100ffff A:0x00000--0x0ffff; define fixed translation window into bank 1TRANSlation.Create 0x1010000--0x101ffff A:0x10000--0x1ffff; define transparent address window (no translation in this range)TRANSlation.TRANSparent 0x0--0xffffTRANSlation.ON; load code into current bank, somewhere in 0x0--0xffffData.LOAD.UBROF example.dbg; shift symbols to logical addresses at 1000000sYmbol.RELOCate C:0x1000000
General Commands Reference Guide T 497 ©1989-2019 Lauterbach GmbH
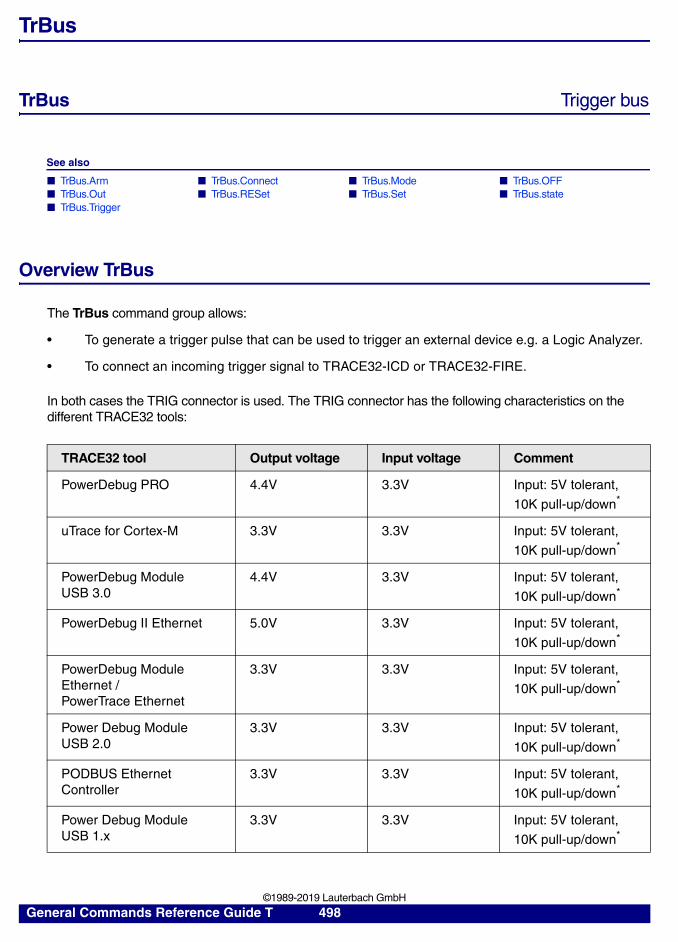
TrBus
TrBus Trigger bus
See also
■ TrBus.Arm ■ TrBus.Connect ■ TrBus.Mode ■ TrBus.OFF ■ TrBus.Out ■ TrBus.RESet ■ TrBus.Set ■ TrBus.state ■ TrBus.Trigger
Overview TrBus
The TrBus command group allows:
• To generate a trigger pulse that can be used to trigger an external device e.g. a Logic Analyzer.
• To connect an incoming trigger signal to TRACE32-ICD or TRACE32-FIRE.
In both cases the TRIG connector is used. The TRIG connector has the following characteristics on the different TRACE32 tools:
TRACE32 tool Output voltage Input voltage Comment
PowerDebug PRO 4.4V 3.3V Input: 5V tolerant,
10K pull-up/down*
uTrace for Cortex-M 3.3V 3.3V Input: 5V tolerant,
10K pull-up/down*
PowerDebug Module USB 3.0
4.4V 3.3V Input: 5V tolerant,
10K pull-up/down*
PowerDebug II Ethernet 5.0V 3.3V Input: 5V tolerant,
10K pull-up/down*
PowerDebug Module Ethernet /PowerTrace Ethernet
3.3V 3.3V Input: 5V tolerant,
10K pull-up/down*
Power Debug Module USB 2.0
3.3V 3.3V Input: 5V tolerant,
10K pull-up/down*
PODBUS Ethernet Controller
3.3V 3.3V Input: 5V tolerant,
10K pull-up/down*
Power Debug Module USB 1.x
3.3V 3.3V Input: 5V tolerant,
10K pull-up/down*
General Commands Reference Guide T 498 ©1989-2019 Lauterbach GmbH
* Pull-up/down selected automatically depending on low-active or high-active settings.
An external trigger pulse of at least 100ns can be generated when:
• The program execution is stopped.
• A trigger is generated for the trace (not available on all CPUs, depends on the implementation of the trace trigger feature).
• The sampling to the trace buffer is stopped ((not available on all CPUs, depends on the implementation of the trace trigger feature).
• A breakpoint with the Action BusTrigger is used (not available on all CPUs).
An incoming trigger signal can be used:
• To stop the program execution.
• To generate a trigger for the trace (not available on all CPUs, depends on the implementation of the trace trigger feature).
The sources for the external trigger pulse and the targets for the incoming trigger signal are connected to the trigger bus.
General Commands Reference Guide T 499 ©1989-2019 Lauterbach GmbH
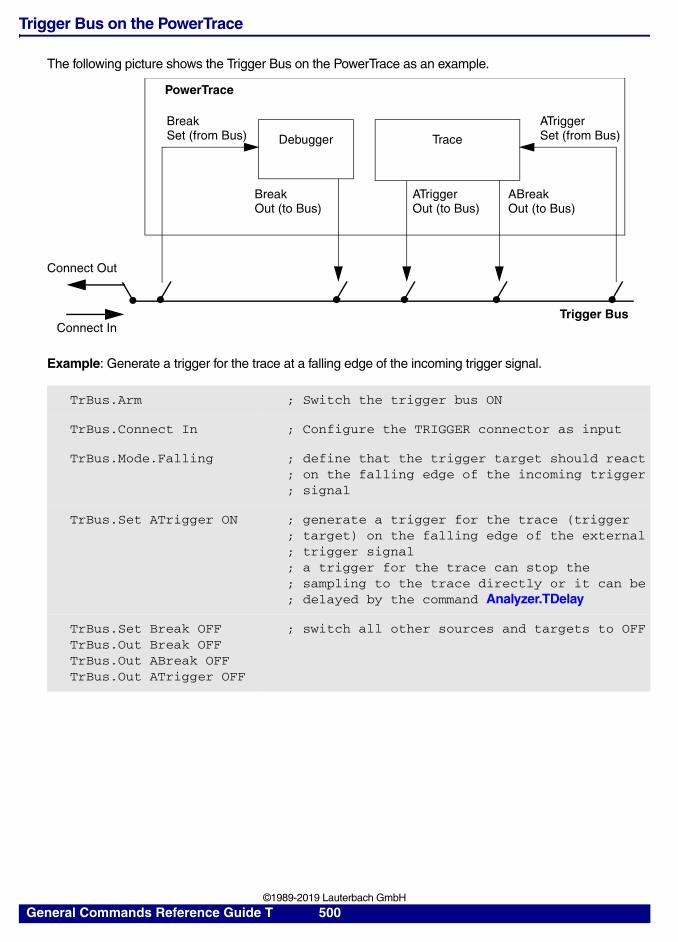
Trigger Bus on the PowerTrace
The following picture shows the Trigger Bus on the PowerTrace as an example.
Example: Generate a trigger for the trace at a falling edge of the incoming trigger signal.
TrBus.Arm ; Switch the trigger bus ON
TrBus.Connect In ; Configure the TRIGGER connector as input
TrBus.Mode.Falling ; define that the trigger target should react; on the falling edge of the incoming trigger; signal
TrBus.Set ATrigger ON ; generate a trigger for the trace (trigger; target) on the falling edge of the external; trigger signal; a trigger for the trace can stop the; sampling to the trace directly or it can be; delayed by the command Analyzer.TDelay
TrBus.Set Break OFFTrBus.Out Break OFFTrBus.Out ABreak OFFTrBus.Out ATrigger OFF
; switch all other sources and targets to OFF
PowerTrace
Debugger Trace
Break Set (from Bus)
ATrigger Set (from Bus)
Break Out (to Bus)
ATriggerOut (to Bus)
ABreak Out (to Bus)
Trigger Bus
Connect Out
Connect In
General Commands Reference Guide T 500 ©1989-2019 Lauterbach GmbH
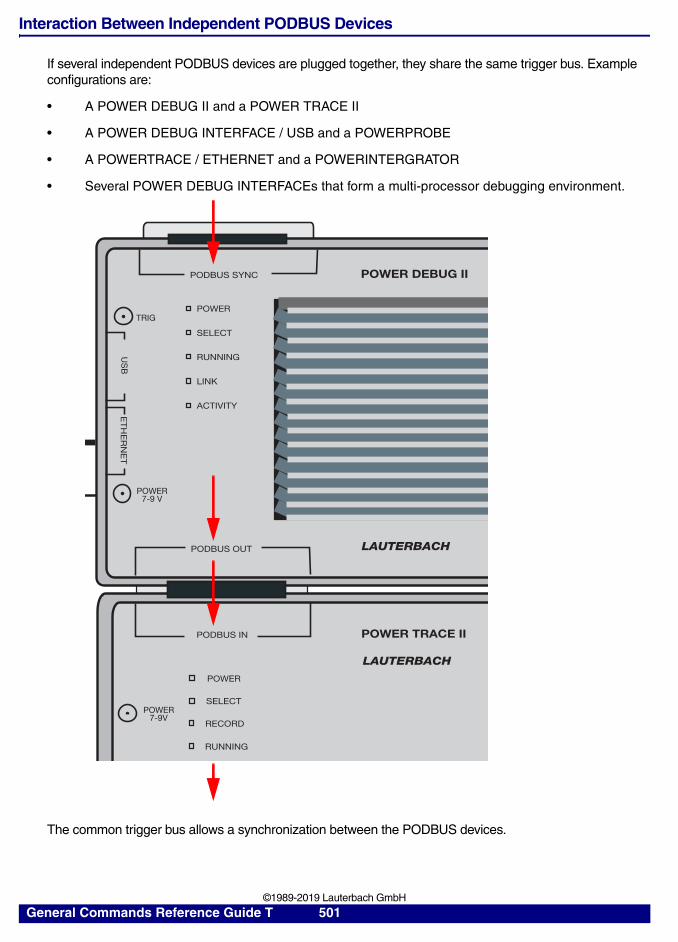
Interaction Between Independent PODBUS Devices
If several independent PODBUS devices are plugged together, they share the same trigger bus. Example configurations are:
• A POWER DEBUG II and a POWER TRACE II
• A POWER DEBUG INTERFACE / USB and a POWERPROBE
• A POWERTRACE / ETHERNET and a POWERINTERGRATOR
• Several POWER DEBUG INTERFACEs that form a multi-processor debugging environment.
The common trigger bus allows a synchronization between the PODBUS devices.
POWER TRACE IIPODBUS IN
POWER
SELECT
RECORD
RUNNING
POWER7-9V
LAUTERBACH
POWER DEBUG IIPODBUS SYNC
TRIG
POWER7-9 V
US
BLAUTERBACHPODBUS OUT
POWER
SELECT
RUNNING
LINK
ACTIVITY
ET
HE
RN
ET
General Commands Reference Guide T 501 ©1989-2019 Lauterbach GmbH
Example: A soon as the POWERPROBE is stopped by a trigger, the program execution should be stopped via the connected POWER DEBUG INTERFACE:
The trigger bus also allows to stop the processors in a multi-processor configuration synchronously. Precondition is that the JTAG/OCDS/BDM … connector provides:
• A signal which indicates that the program execution was stopped (stop indication).
• A signal that allows to stop the program execution immediately (stop request).
After the configuration for the synchronous start and stop by the SYnch command is done, you can configure the stop synchronization per hardware by the TrBus commands.
PowerProbe
…PP:Analyzer.TOut BUSA ON
; definition of the trigger condition; generate a trigger for the trigger bus; when the defined trigger event occurs
Debugger
TrBus.ArmTrBus.Connect OutTrBus.Set Break ON
; switch the trigger bus ON; Configure the TRIGGER connector as output; allow any trigger from the trigger bus to; stop the program execution
Multicore chip sets provide normally internal (chip specific) trigger connections.
General Commands Reference Guide T 502 ©1989-2019 Lauterbach GmbH
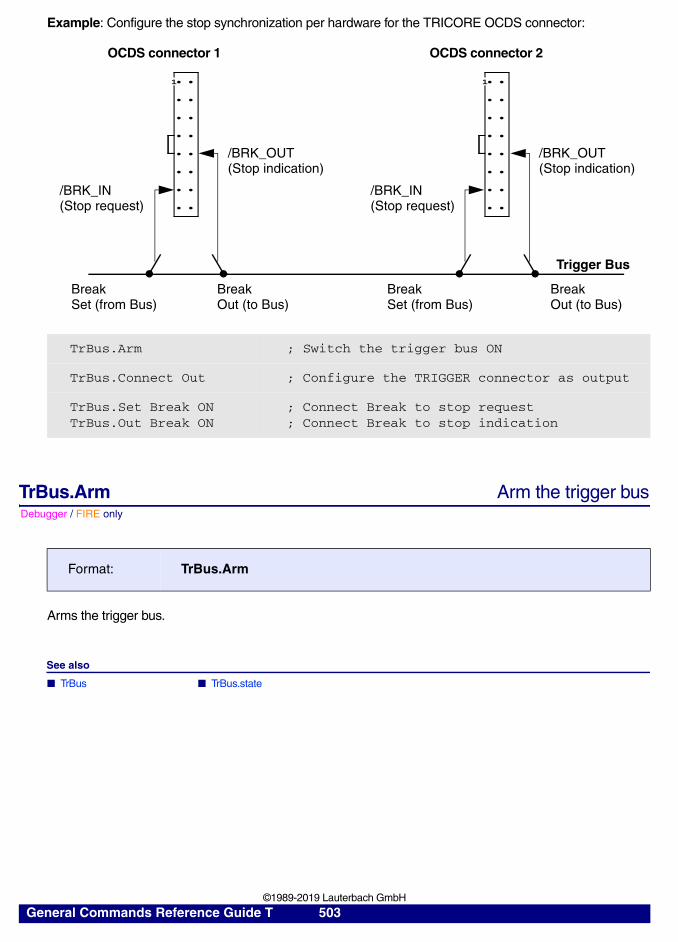
Example: Configure the stop synchronization per hardware for the TRICORE OCDS connector:
Debugger / FIRE only
TrBus.Arm Arm the trigger bus
Arms the trigger bus.
See also
■ TrBus ■ TrBus.state
TrBus.Arm ; Switch the trigger bus ON
TrBus.Connect Out ; Configure the TRIGGER connector as output
TrBus.Set Break ONTrBus.Out Break ON
; Connect Break to stop request; Connect Break to stop indication
Format: TrBus.Arm
1
1
OCDS connector 1 OCDS connector 2
/BRK_IN(Stop request)
/BRK_IN(Stop request)
/BRK_OUT(Stop indication)
/BRK_OUT(Stop indication)
Trigger Bus
Break Set (from Bus)
Break Set (from Bus)
Break Out (to Bus)
Break Out (to Bus)
General Commands Reference Guide T 503 ©1989-2019 Lauterbach GmbH
Debugger / FIRE only
TrBus.Connect Configure TRIGGER as input or output
The TRIGGER connector should work as:
• Input for an incoming trigger signal.
• Output for the generation of an external trigger signal.
See also
■ TrBus ■ TrBus.state
Debugger / FIRE only
TrBus.Mode Define polarity/edge for the trigger signal
If TrBus.Connect Out is set a Low or High pulse is generated on TRIGGER (at least 100 ns) as soon as the defined source becomes active.
If TrBus.Connect In is set, the defined target can react on a Low/High pulse or Falling/Rising edge of the incoming trigger signal.
See also
■ TrBus ■ TrBus.state
Debugger / FIRE only
TrBus.OFF Switch trigger bus off
Switches the trigger bus off.
See also
■ TrBus ■ TrBus.state
Format: TrBus.Connect In | Out
Format: TrBus.Mode Low | High | Falling | Rising
Format: TrBus.OFF
General Commands Reference Guide T 504 ©1989-2019 Lauterbach GmbH
TrBus.Out Define source for the external trigger pulse
Defines the source for the external trigger pulse.
See also
■ TrBus ■ TrBus.state
▲ ’Trigger Commands’ in ’FIRE Emulator for C166 Cell-Based-Core’▲ ’CPU specific Trigger Commands’ in ’MAC71xx/72xx NEXUS Debugger and Trace’▲ ’Release Information’ in ’Release History’
Debugger / FIRE only
TrBus.RESet Reset setting for trigger bus
Resets the settings for the trigger bus.
See also
■ TrBus ■ TrBus.state
Format: TrBus.Out Break | ABreak | ATrigger [ON | OFF]
Break Generate an external trigger pulse when the program execution is stopped.
ABreak Generate an external trigger pulse when the sampling to the trace buffer is stopped.
ATrigger Generate an external trigger pulse when a trigger is generated for the trace. A trigger for the trace can be used to stop the sampling to the trace buffer after a specified delay Analyzer.TDelay.
Format: TrBus.RESet
General Commands Reference Guide T 505 ©1989-2019 Lauterbach GmbH
Debugger / FIRE only
TrBus.Set Define the target for the incoming trigger
Selects the target for the incoming trigger signal.
See also
■ TrBus ■ TrBus.state
▲ ’Trigger Commands’ in ’FIRE Emulator for C166 Cell-Based-Core’▲ ’CPU specific Trigger Commands’ in ’MAC71xx/72xx NEXUS Debugger and Trace’
Debugger / FIRE only
TrBus.state Display settings for the trigger bus
Displays all settings for the trigger bus.
See also
■ TrBus ■ TrBus.Arm ■ TrBus.Connect ■ TrBus.Mode ■ TrBus.OFF ■ TrBus.Out ■ TrBus.RESet ■ TrBus.Set ■ TrBus.Trigger
Format: TrBus.Set Break | ATrigger [ON | OFF]
Break Stop the program execution as soon as the external trigger signal becomes active.
ATrigger Generate a trigger for the trace as soon as the external trigger signal becomes active. A trigger for the trace can be used to stop the sampling to the trace buffer directly or after a specified delay Analyzer.TDelay.
Format: TrBus.stateTrBus.view (deprecated)
General Commands Reference Guide T 506 ©1989-2019 Lauterbach GmbH
Debugger / FIRE only
TrBus.Trigger Stimulate a trigger on the trigger bus
Stimulates a trigger on the trigger bus.
See also
■ TrBus ■ TrBus.state
Format: TrBus.Trigger
General Commands Reference Guide T 507 ©1989-2019 Lauterbach GmbH
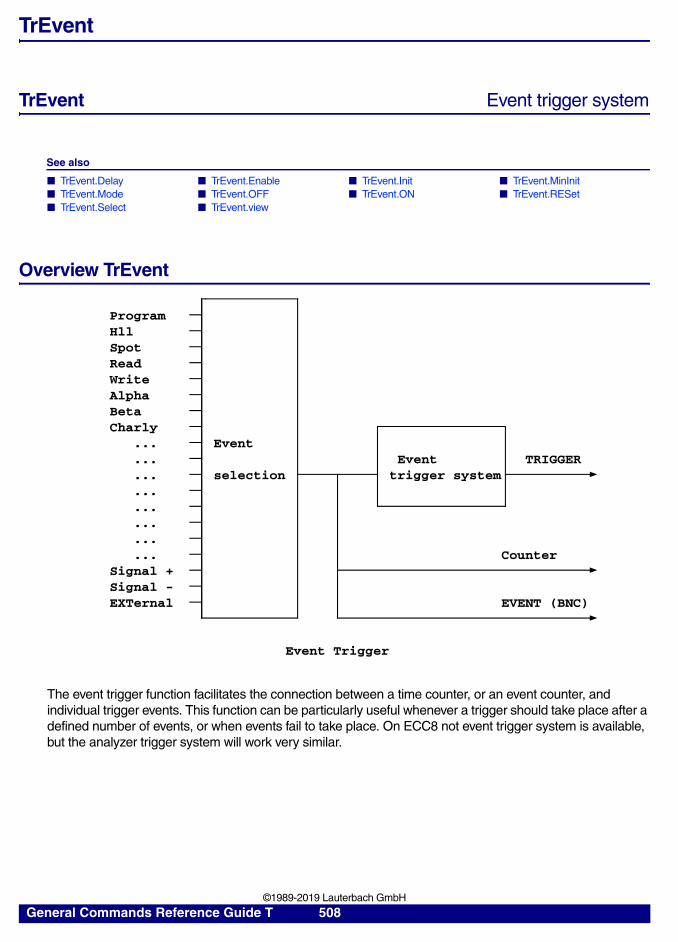
TrEvent
TrEvent Event trigger system
See also
■ TrEvent.Delay ■ TrEvent.Enable ■ TrEvent.Init ■ TrEvent.MinInit ■ TrEvent.Mode ■ TrEvent.OFF ■ TrEvent.ON ■ TrEvent.RESet ■ TrEvent.Select ■ TrEvent.view
Overview TrEvent
The event trigger function facilitates the connection between a time counter, or an event counter, and individual trigger events. This function can be particularly useful whenever a trigger should take place after a defined number of events, or when events fail to take place. On ECC8 not event trigger system is available, but the analyzer trigger system will work very similar.
ProgramHllSpotReadWriteAlphaBetaCharly
... Event
... Event TRIGGER
... selection trigger system
...
...
...
...
... CounterSignal +Signal -EXTernal EVENT (BNC)
Event Trigger
General Commands Reference Guide T 508 ©1989-2019 Lauterbach GmbH
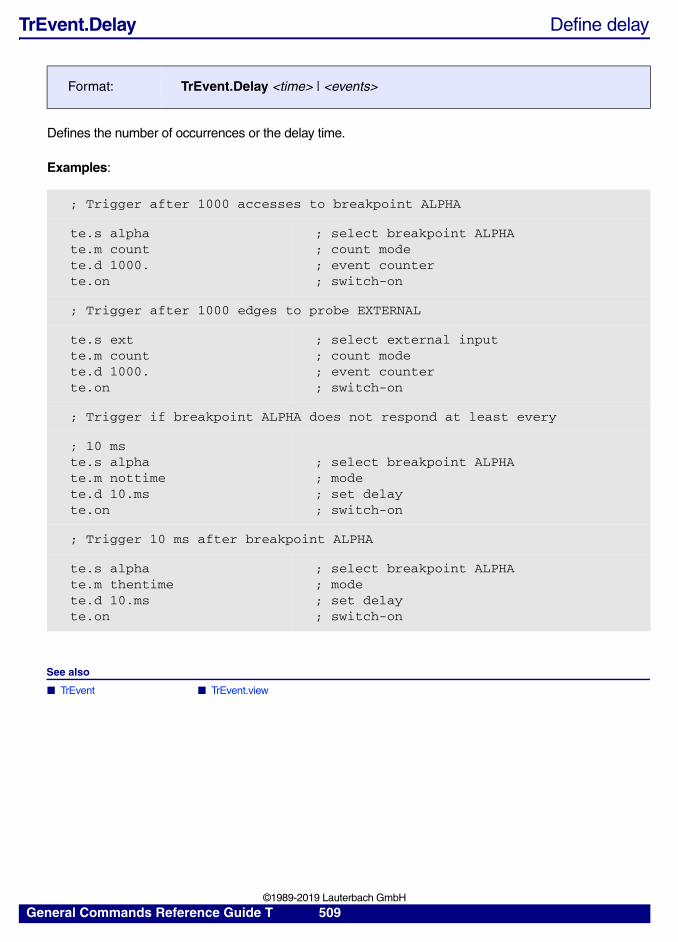
TrEvent.Delay Define delay
Defines the number of occurrences or the delay time.
Examples:
See also
■ TrEvent ■ TrEvent.view
Format: TrEvent.Delay <time> | <events>
; Trigger after 1000 accesses to breakpoint ALPHA
te.s alphate.m countte.d 1000.te.on
; select breakpoint ALPHA; count mode; event counter; switch-on
; Trigger after 1000 edges to probe EXTERNAL
te.s ext te.m countte.d 1000.te.on
; select external input; count mode; event counter; switch-on
; Trigger if breakpoint ALPHA does not respond at least every
; 10 mste.s alphate.m nottimete.d 10.mste.on
; select breakpoint ALPHA; mode; set delay; switch-on
; Trigger 10 ms after breakpoint ALPHA
te.s alphate.m thentimete.d 10.ms te.on
; select breakpoint ALPHA; mode; set delay; switch-on
General Commands Reference Guide T 509 ©1989-2019 Lauterbach GmbH
ICE only
TrEvent.Enable Select time windows
If Always is selected, the event trigger system will be active (time counters are running) when the emulation has stopped. On default set to Running.
See also
■ TrEvent ■ TrEvent.view
▲ ’Event Trigger System’ in ’ICE User’s Guide’▲ ’Event Trigger System’ in ’ICE User’s Guide’
TrEvent.Init Initialization
Event or time counters are initialized.
See also
■ TrEvent ■ TrEvent.view
▲ ’Event Trigger System’ in ’ICE User’s Guide’
ICE only
TrEvent.MinInit Initialization
The minimum value of the event display is reset to the maximum value.
See also
■ TrEvent ■ TrEvent.view
Format: TrEvent.Enable Always | Running
Format: TrEvent.Init
Format: TrEvent.MinInit
General Commands Reference Guide T 510 ©1989-2019 Lauterbach GmbH
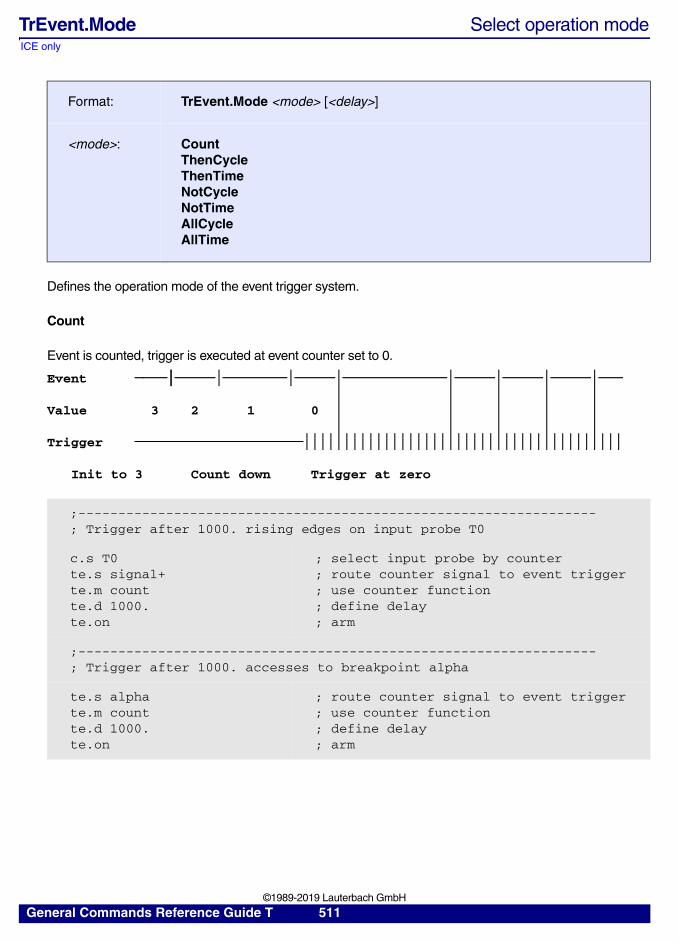
ICE only
TrEvent.Mode Select operation mode
Defines the operation mode of the event trigger system.
Count
Event is counted, trigger is executed at event counter set to 0.
Format: TrEvent.Mode <mode> [<delay>]
<mode>: CountThenCycleThenTimeNotCycleNotTimeAllCycleAllTime
;-----------------------------------------------------------------; Trigger after 1000. rising edges on input probe T0
c.s T0te.s signal+te.m countte.d 1000.te.on
; select input probe by counter; route counter signal to event trigger; use counter function; define delay; arm
;-----------------------------------------------------------------; Trigger after 1000. accesses to breakpoint alpha
te.s alphate.m countte.d 1000.te.on
; route counter signal to event trigger; use counter function; define delay; arm
Event
Value 3 2 1 0
Trigger
Init to 3 Count down Trigger at zero
General Commands Reference Guide T 511 ©1989-2019 Lauterbach GmbH
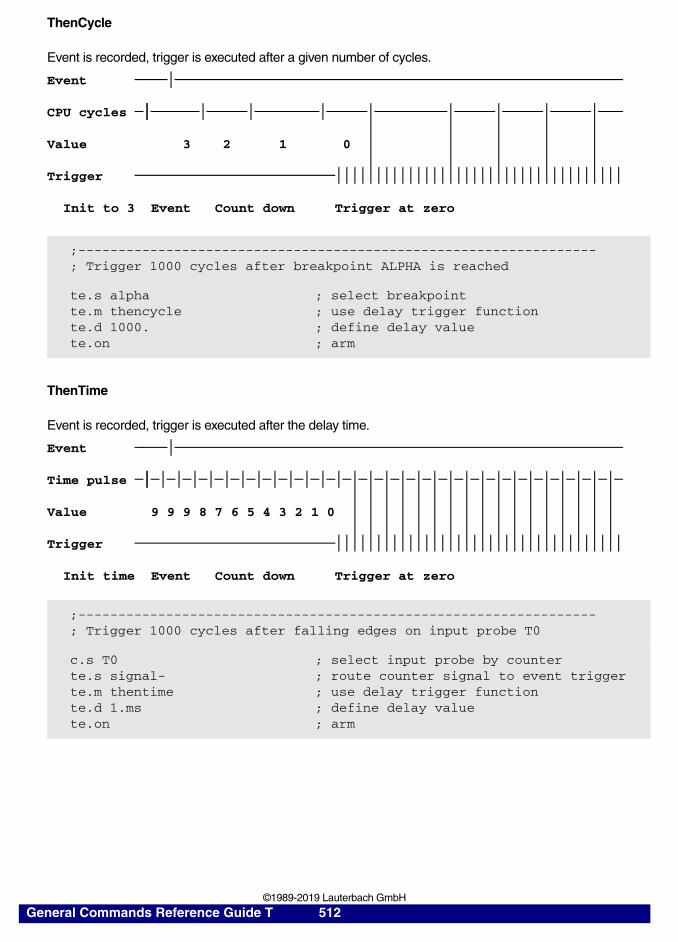
ThenCycle
Event is recorded, trigger is executed after a given number of cycles.
ThenTime
Event is recorded, trigger is executed after the delay time.
;-----------------------------------------------------------------; Trigger 1000 cycles after breakpoint ALPHA is reached
te.s alphate.m thencyclete.d 1000.te.on
; select breakpoint; use delay trigger function; define delay value; arm
;-----------------------------------------------------------------; Trigger 1000 cycles after falling edges on input probe T0
c.s T0te.s signal-te.m thentimete.d 1.mste.on
; select input probe by counter; route counter signal to event trigger; use delay trigger function; define delay value; arm
Event
CPU cycles
Value 3 2 1 0
Trigger
Init to 3 Event Count down Trigger at zero
Event
Time pulse
Value 9 9 9 8 7 6 5 4 3 2 1 0
Trigger
Init time Event Count down Trigger at zero
General Commands Reference Guide T 512 ©1989-2019 Lauterbach GmbH
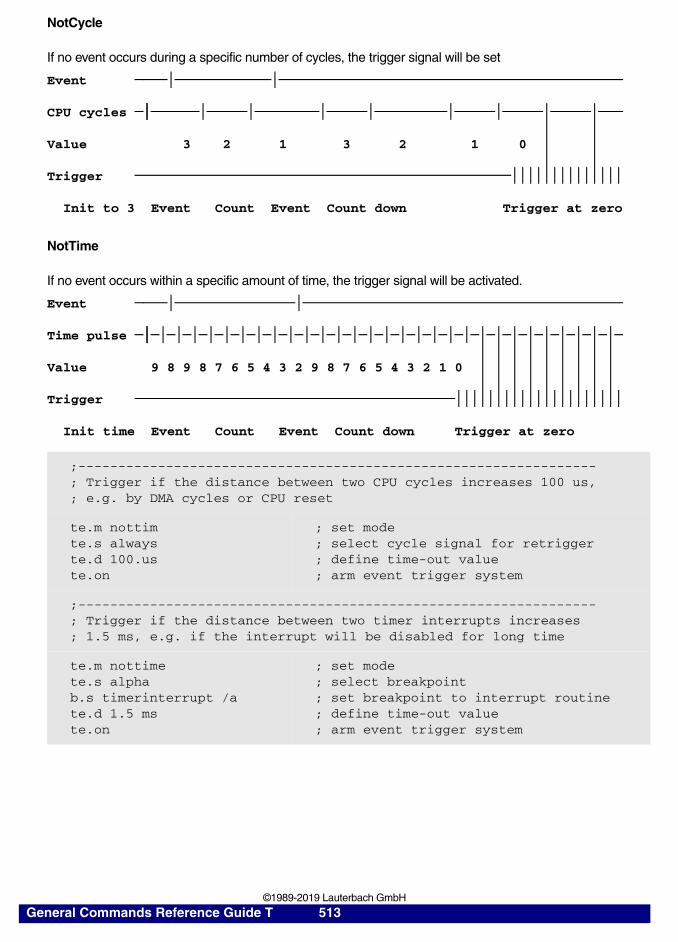
NotCycle
If no event occurs during a specific number of cycles, the trigger signal will be set
NotTime
If no event occurs within a specific amount of time, the trigger signal will be activated.
;-----------------------------------------------------------------; Trigger if the distance between two CPU cycles increases 100 us,; e.g. by DMA cycles or CPU reset
te.m nottimte.s alwayste.d 100.uste.on
; set mode; select cycle signal for retrigger; define time-out value; arm event trigger system
;-----------------------------------------------------------------; Trigger if the distance between two timer interrupts increases; 1.5 ms, e.g. if the interrupt will be disabled for long time
te.m nottimete.s alphab.s timerinterrupt /ate.d 1.5 ms te.on
; set mode; select breakpoint; set breakpoint to interrupt routine; define time-out value; arm event trigger system
Event
CPU cycles
Value 3 2 1 3 2 1 0
Trigger
Init to 3 Event Count Event Count down Trigger at zero
Event
Time pulse
Value 9 8 9 8 7 6 5 4 3 2 9 8 7 6 5 4 3 2 1 0
Trigger
Init time Event Count Event Count down Trigger at zero
General Commands Reference Guide T 513 ©1989-2019 Lauterbach GmbH
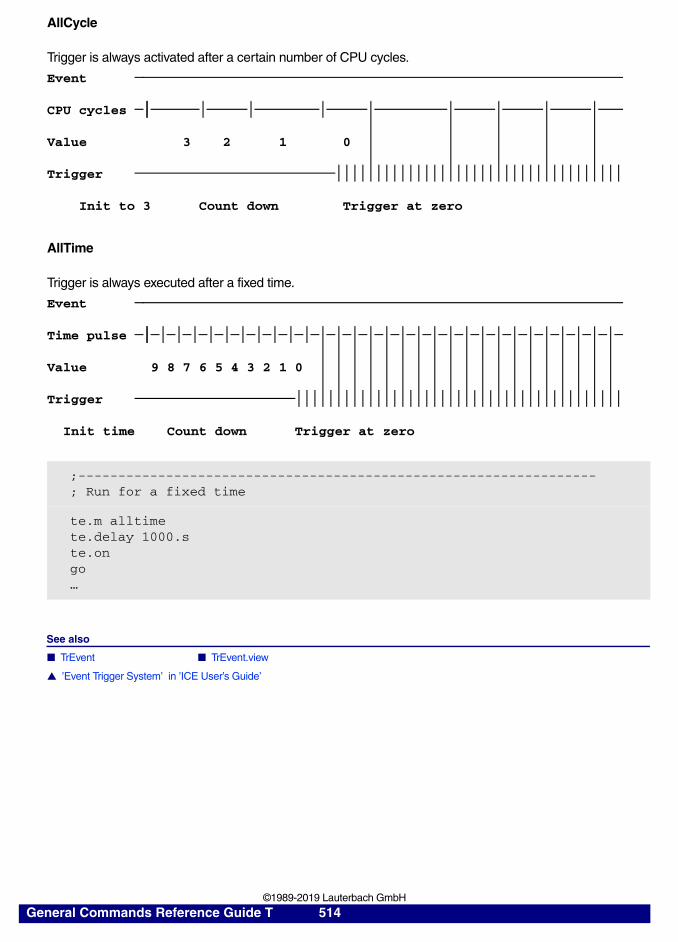
AllCycle
Trigger is always activated after a certain number of CPU cycles.
AllTime
Trigger is always executed after a fixed time.
See also
■ TrEvent ■ TrEvent.view
▲ ’Event Trigger System’ in ’ICE User’s Guide’
;-----------------------------------------------------------------; Run for a fixed time
te.m alltimete.delay 1000.ste.ongo …
Event
CPU cycles
Value 3 2 1 0
Trigger
Init to 3 Count down Trigger at zero
Event
Time pulse
Value 9 8 7 6 5 4 3 2 1 0
Trigger
Init time Count down Trigger at zero
General Commands Reference Guide T 514 ©1989-2019 Lauterbach GmbH
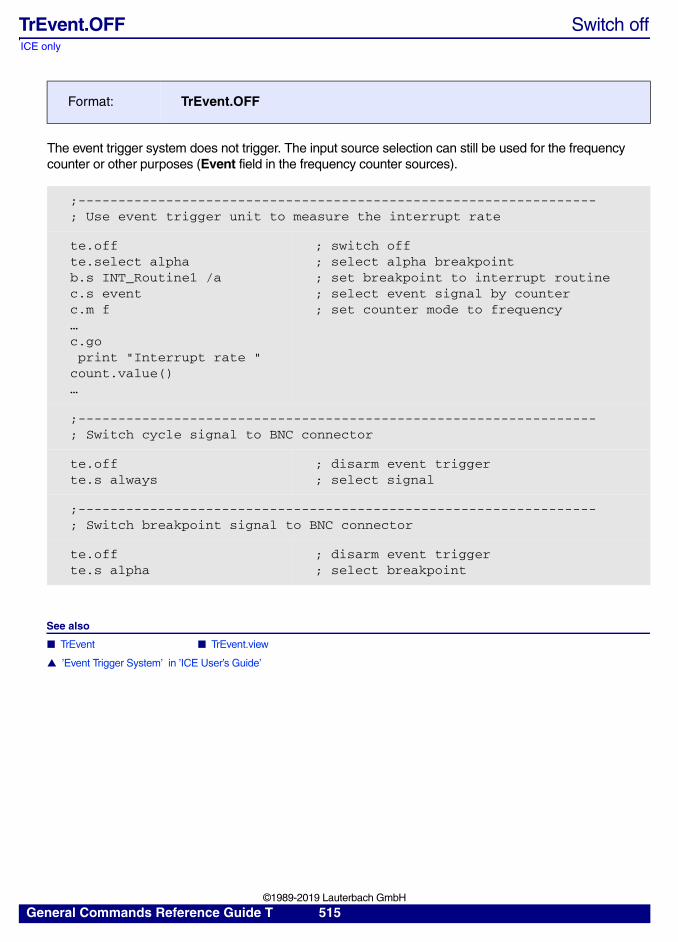
ICE only
TrEvent.OFF Switch off
The event trigger system does not trigger. The input source selection can still be used for the frequency counter or other purposes (Event field in the frequency counter sources).
See also
■ TrEvent ■ TrEvent.view
▲ ’Event Trigger System’ in ’ICE User’s Guide’
Format: TrEvent.OFF
;-----------------------------------------------------------------; Use event trigger unit to measure the interrupt rate
te.offte.select alphab.s INT_Routine1 /ac.s eventc.m f…c.go print "Interrupt rate " count.value()…
; switch off; select alpha breakpoint; set breakpoint to interrupt routine; select event signal by counter; set counter mode to frequency
;-----------------------------------------------------------------; Switch cycle signal to BNC connector
te.offte.s always
; disarm event trigger; select signal
;-----------------------------------------------------------------; Switch breakpoint signal to BNC connector
te.offte.s alpha
; disarm event trigger; select breakpoint
General Commands Reference Guide T 515 ©1989-2019 Lauterbach GmbH
ICE only
TrEvent.ON Switch on
The event trigger system is activated and will trigger if the defined event occurs.
See also
■ TrEvent ■ TrEvent.view
▲ ’Event Trigger System’ in ’ICE User’s Guide’
ICE only
TrEvent.RESet Reset command
Reset to original condition, event trigger is disabled.
See also
■ TrEvent ■ TrEvent.view
▲ ’Event Trigger System’ in ’ICE User’s Guide’
Format: TrEvent.ON
Format: TrEvent.RESet
General Commands Reference Guide T 516 ©1989-2019 Lauterbach GmbH
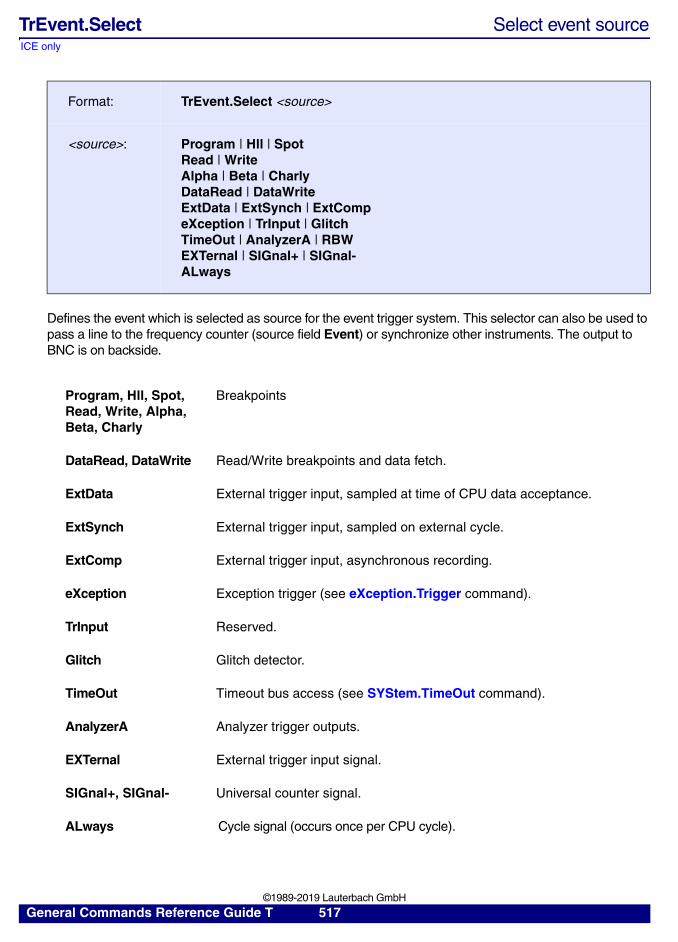
ICE only
TrEvent.Select Select event source
Defines the event which is selected as source for the event trigger system. This selector can also be used to pass a line to the frequency counter (source field Event) or synchronize other instruments. The output to BNC is on backside.
Format: TrEvent.Select <source>
<source>: Program | Hll | SpotRead | WriteAlpha | Beta | CharlyDataRead | DataWriteExtData | ExtSynch | ExtCompeXception | TrInput | GlitchTimeOut | AnalyzerA | RBWEXTernal | SIGnal+ | SIGnal-ALways
Program, Hll, Spot, Read, Write, Alpha, Beta, Charly
Breakpoints
DataRead, DataWrite Read/Write breakpoints and data fetch.
ExtData External trigger input, sampled at time of CPU data acceptance.
ExtSynch External trigger input, sampled on external cycle.
ExtComp External trigger input, asynchronous recording.
eXception Exception trigger (see eXception.Trigger command).
TrInput Reserved.
Glitch Glitch detector.
TimeOut Timeout bus access (see SYStem.TimeOut command).
AnalyzerA Analyzer trigger outputs.
EXTernal External trigger input signal.
SIGnal+, SIGnal- Universal counter signal.
ALways Cycle signal (occurs once per CPU cycle).
General Commands Reference Guide T 517 ©1989-2019 Lauterbach GmbH
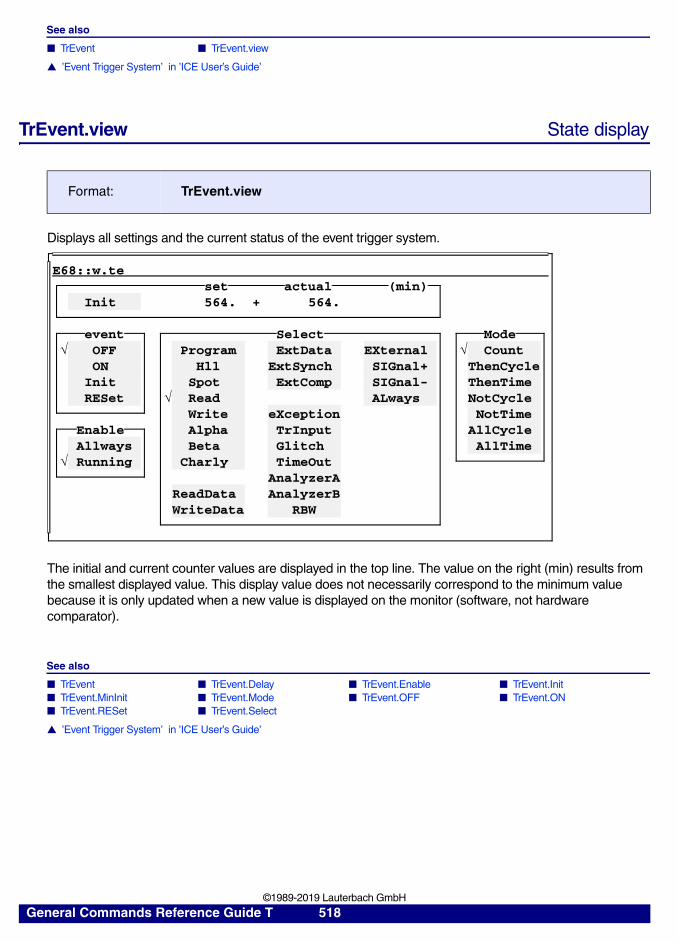
See also
■ TrEvent ■ TrEvent.view
▲ ’Event Trigger System’ in ’ICE User’s Guide’
TrEvent.view State display
Displays all settings and the current status of the event trigger system.
The initial and current counter values are displayed in the top line. The value on the right (min) results from the smallest displayed value. This display value does not necessarily correspond to the minimum value because it is only updated when a new value is displayed on the monitor (software, not hardware comparator).
See also
■ TrEvent ■ TrEvent.Delay ■ TrEvent.Enable ■ TrEvent.Init ■ TrEvent.MinInit ■ TrEvent.Mode ■ TrEvent.OFF ■ TrEvent.ON ■ TrEvent.RESet ■ TrEvent.Select
▲ ’Event Trigger System’ in ’ICE User’s Guide’
Format: TrEvent.view
E68::w.teset actual (min)
Init 564. + 564.
event Select Mode OFF Program ExtData EXternal Count
ON Hll ExtSynch SIGnal+ ThenCycleInit Spot ExtComp SIGnal- ThenTimeRESet Read ALways NotCycle
Write eXception NotTimeEnable Alpha TrInput AllCycleAllways Beta Glitch AllTime
Running Charly TimeOutAnalyzerA
ReadData AnalyzerBWriteData RBW
General Commands Reference Guide T 518 ©1989-2019 Lauterbach GmbH
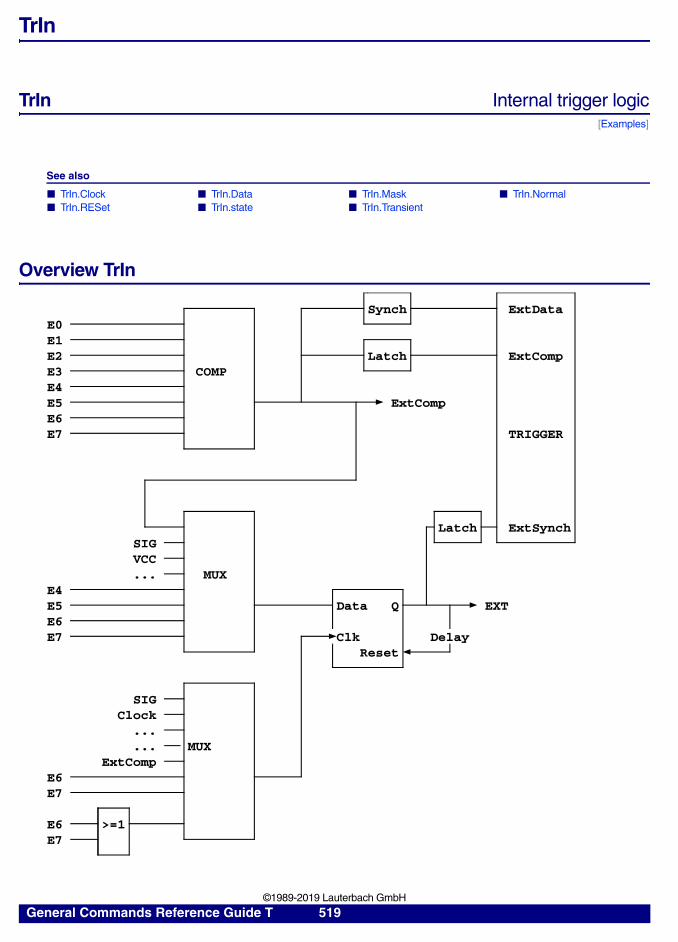
TrIn
TrIn Internal trigger logic[Examples]
See also
■ TrIn.Clock ■ TrIn.Data ■ TrIn.Mask ■ TrIn.Normal ■ TrIn.RESet ■ TrIn.state ■ TrIn.Transient
Overview TrIn
Synch ExtDataE0E1E2 Latch ExtCompE3 COMPE4E5 ExtCompE6E7 TRIGGER
Latch ExtSynchSIGVCC... MUX
E4E5 Data Q EXTE6E7 Clk Delay
Reset
SIGClock
...
... MUXExtComp
E6E7
E6 >=1E7
General Commands Reference Guide T 519 ©1989-2019 Lauterbach GmbH
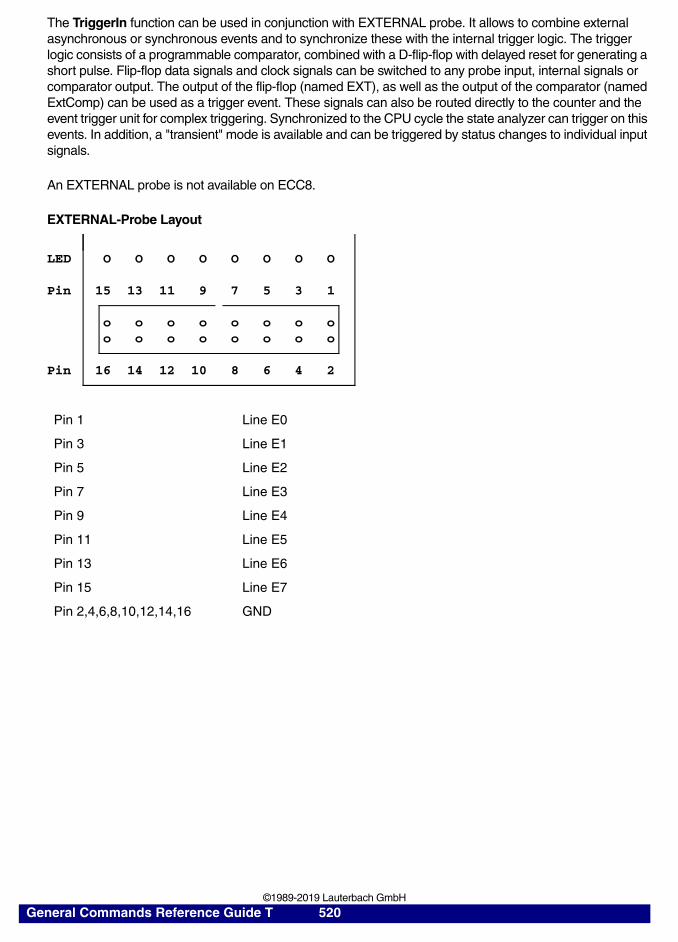
The TriggerIn function can be used in conjunction with EXTERNAL probe. It allows to combine external asynchronous or synchronous events and to synchronize these with the internal trigger logic. The trigger logic consists of a programmable comparator, combined with a D-flip-flop with delayed reset for generating a short pulse. Flip-flop data signals and clock signals can be switched to any probe input, internal signals or comparator output. The output of the flip-flop (named EXT), as well as the output of the comparator (named ExtComp) can be used as a trigger event. These signals can also be routed directly to the counter and the event trigger unit for complex triggering. Synchronized to the CPU cycle the state analyzer can trigger on this events. In addition, a "transient" mode is available and can be triggered by status changes to individual input signals.
An EXTERNAL probe is not available on ECC8.
EXTERNAL-Probe Layout
Pin 1 Line E0
Pin 3 Line E1
Pin 5 Line E2
Pin 7 Line E3
Pin 9 Line E4
Pin 11 Line E5
Pin 13 Line E6
Pin 15 Line E7
Pin 2,4,6,8,10,12,14,16 GND
LED O O O O O O O O
Pin 15 13 11 9 7 5 3 1
o o o o o o o oo o o o o o o o
Pin 16 14 12 10 8 6 4 2
General Commands Reference Guide T 520 ©1989-2019 Lauterbach GmbH
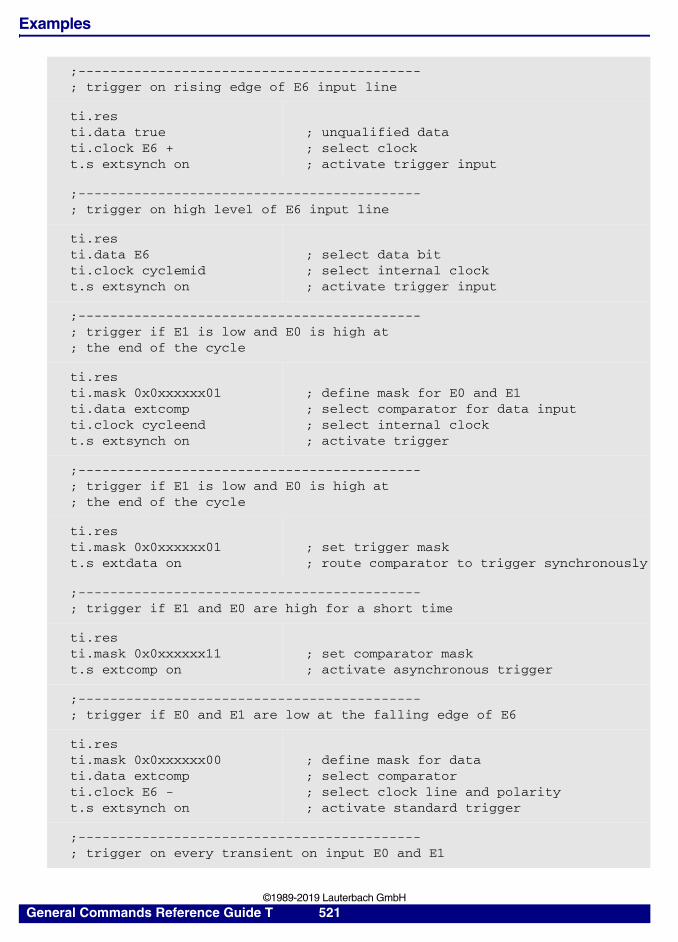
Examples
;-------------------------------------------; trigger on rising edge of E6 input line
ti.resti.data trueti.clock E6 +t.s extsynch on
; unqualified data; select clock; activate trigger input
;-------------------------------------------; trigger on high level of E6 input line
ti.resti.data E6ti.clock cyclemidt.s extsynch on
; select data bit; select internal clock; activate trigger input
;-------------------------------------------; trigger if E1 is low and E0 is high at ; the end of the cycle
ti.resti.mask 0x0xxxxxx01ti.data extcompti.clock cycleendt.s extsynch on
; define mask for E0 and E1; select comparator for data input; select internal clock; activate trigger
;-------------------------------------------; trigger if E1 is low and E0 is high at ; the end of the cycle
ti.resti.mask 0x0xxxxxx01t.s extdata on
; set trigger mask; route comparator to trigger synchronously
;-------------------------------------------; trigger if E1 and E0 are high for a short time
ti.resti.mask 0x0xxxxxx11t.s extcomp on
; set comparator mask; activate asynchronous trigger
;-------------------------------------------; trigger if E0 and E1 are low at the falling edge of E6
ti.res ti.mask 0x0xxxxxx00ti.data extcompti.clock E6 -t.s extsynch on
; define mask for data; select comparator; select clock line and polarity; activate standard trigger
;-------------------------------------------; trigger on every transient on input E0 and E1
General Commands Reference Guide T 521 ©1989-2019 Lauterbach GmbH
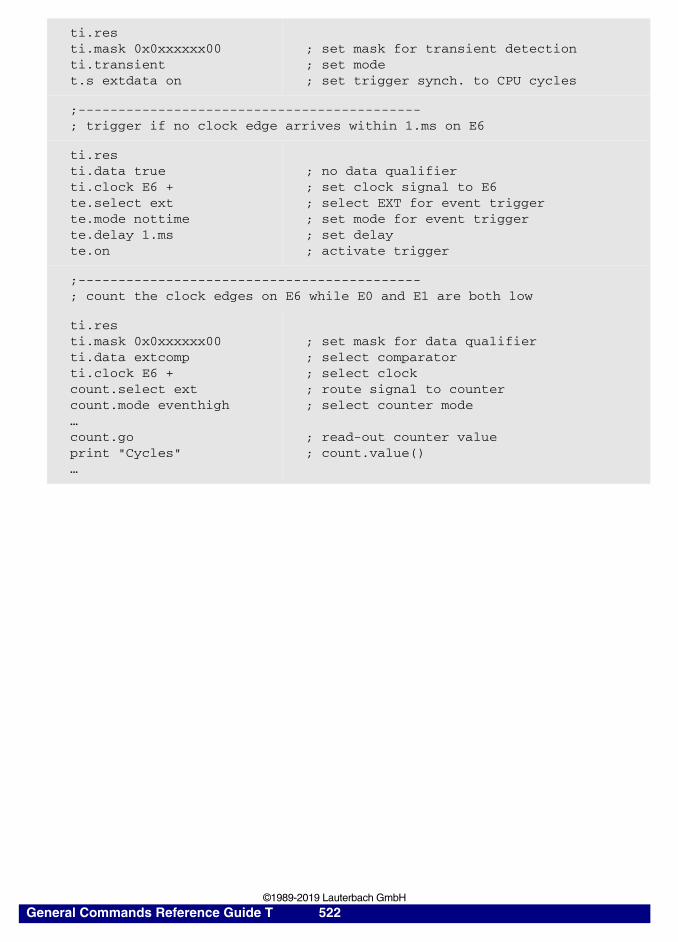
ti.resti.mask 0x0xxxxxx00ti.transientt.s extdata on
; set mask for transient detection; set mode; set trigger synch. to CPU cycles
;-------------------------------------------; trigger if no clock edge arrives within 1.ms on E6
ti.resti.data trueti.clock E6 +te.select extte.mode nottimete.delay 1.mste.on
; no data qualifier; set clock signal to E6; select EXT for event trigger; set mode for event trigger; set delay; activate trigger
;-------------------------------------------; count the clock edges on E6 while E0 and E1 are both low
ti.resti.mask 0x0xxxxxx00ti.data extcomp ti.clock E6 +count.select extcount.mode eventhigh…count.go print "Cycles"…
; set mask for data qualifier; select comparator; select clock; route signal to counter; select counter mode
; read-out counter value; count.value()
General Commands Reference Guide T 522 ©1989-2019 Lauterbach GmbH
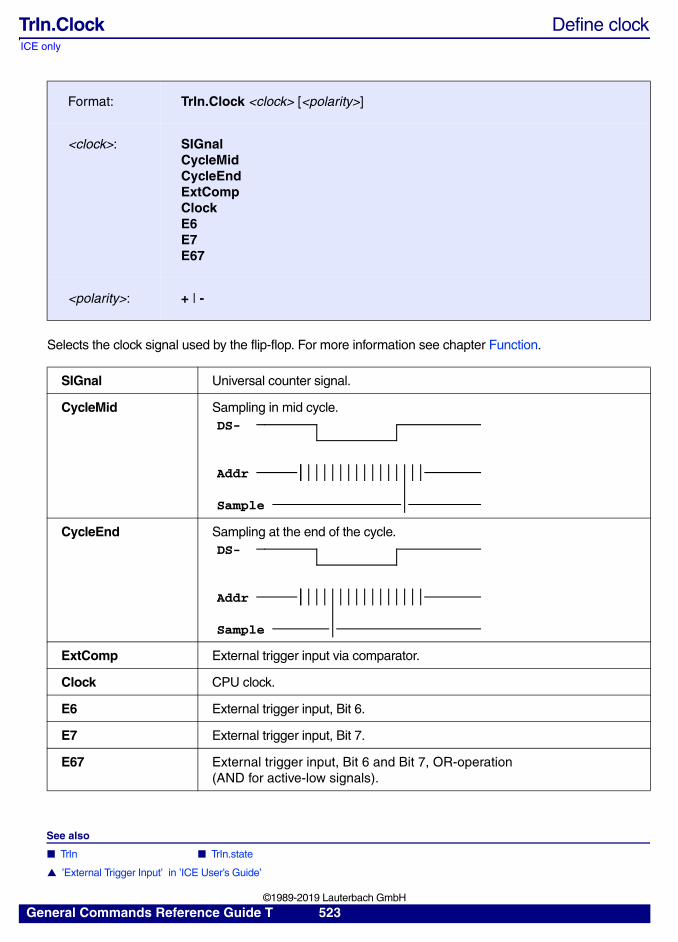
ICE only
TrIn.Clock Define clock
Selects the clock signal used by the flip-flop. For more information see chapter Function.
See also
■ TrIn ■ TrIn.state
▲ ’External Trigger Input’ in ’ICE User’s Guide’
Format: TrIn.Clock <clock> [<polarity>]
<clock>: SIGnalCycleMidCycleEndExtCompClockE6E7E67
<polarity>: + | -
SIGnal Universal counter signal.
CycleMid Sampling in mid cycle.
CycleEnd Sampling at the end of the cycle.
ExtComp External trigger input via comparator.
Clock CPU clock.
E6 External trigger input, Bit 6.
E7 External trigger input, Bit 7.
E67 External trigger input, Bit 6 and Bit 7, OR-operation (AND for active-low signals).
DS-
Addr
Sample
DS-
Addr
Sample
General Commands Reference Guide T 523 ©1989-2019 Lauterbach GmbH
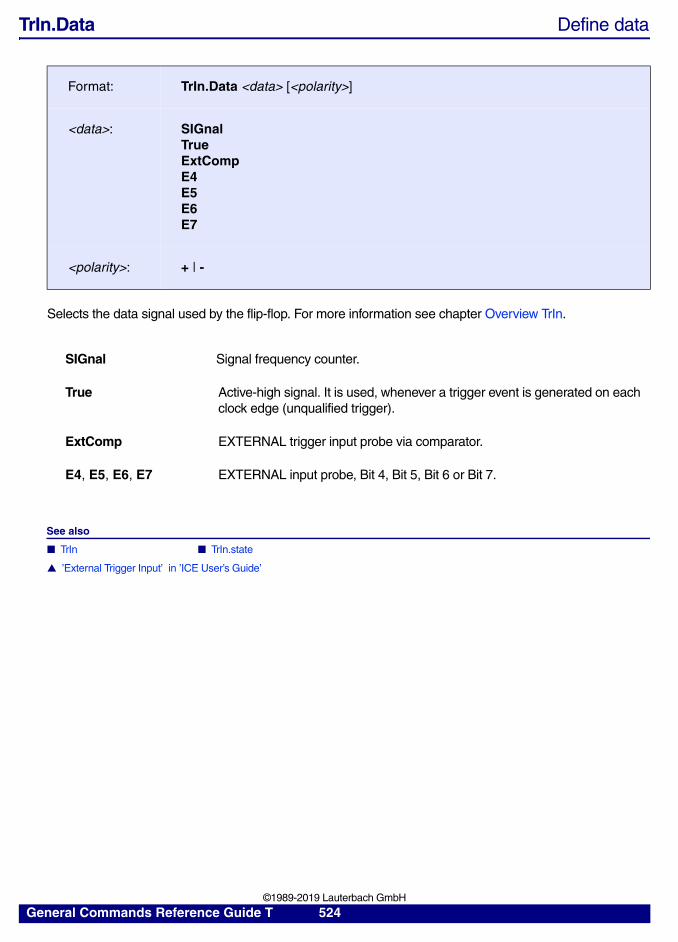
TrIn.Data Define data
Selects the data signal used by the flip-flop. For more information see chapter Overview TrIn.
See also
■ TrIn ■ TrIn.state
▲ ’External Trigger Input’ in ’ICE User’s Guide’
Format: TrIn.Data <data> [<polarity>]
<data>: SIGnalTrueExtCompE4E5E6E7
<polarity>: + | -
SIGnal Signal frequency counter.
True Active-high signal. It is used, whenever a trigger event is generated on each clock edge (unqualified trigger).
ExtComp EXTERNAL trigger input probe via comparator.
E4, E5, E6, E7 EXTERNAL input probe, Bit 4, Bit 5, Bit 6 or Bit 7.
General Commands Reference Guide T 524 ©1989-2019 Lauterbach GmbH
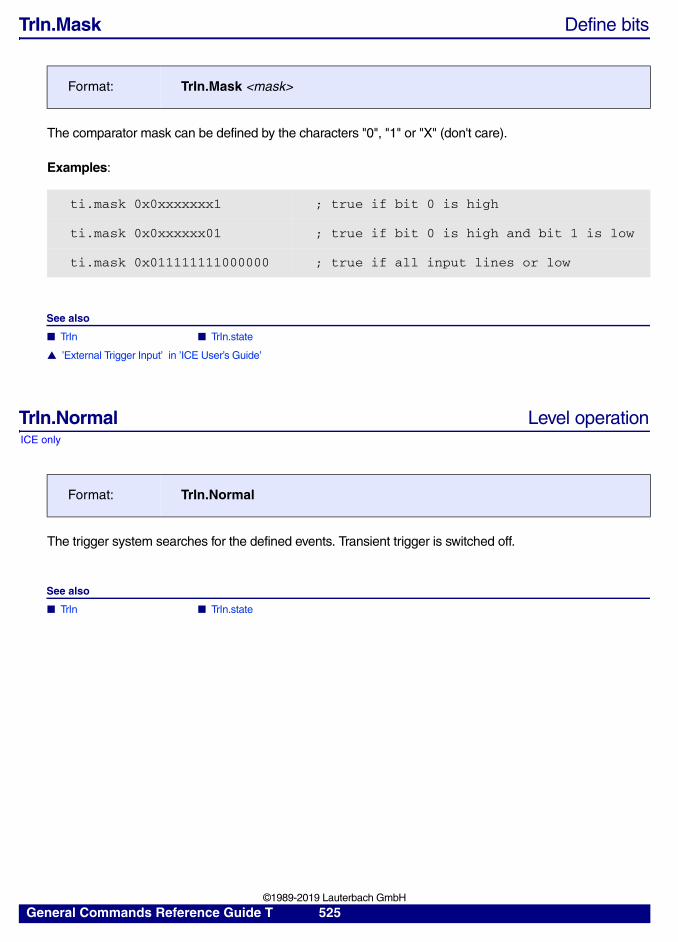
TrIn.Mask Define bits
The comparator mask can be defined by the characters "0", "1" or "X" (don't care).
Examples:
See also
■ TrIn ■ TrIn.state
▲ ’External Trigger Input’ in ’ICE User’s Guide’
ICE only
TrIn.Normal Level operation
The trigger system searches for the defined events. Transient trigger is switched off.
See also
■ TrIn ■ TrIn.state
Format: TrIn.Mask <mask>
ti.mask 0x0xxxxxxx1 ; true if bit 0 is high
ti.mask 0x0xxxxxx01 ; true if bit 0 is high and bit 1 is low
ti.mask 0x011111111000000 ; true if all input lines or low
Format: TrIn.Normal
General Commands Reference Guide T 525 ©1989-2019 Lauterbach GmbH
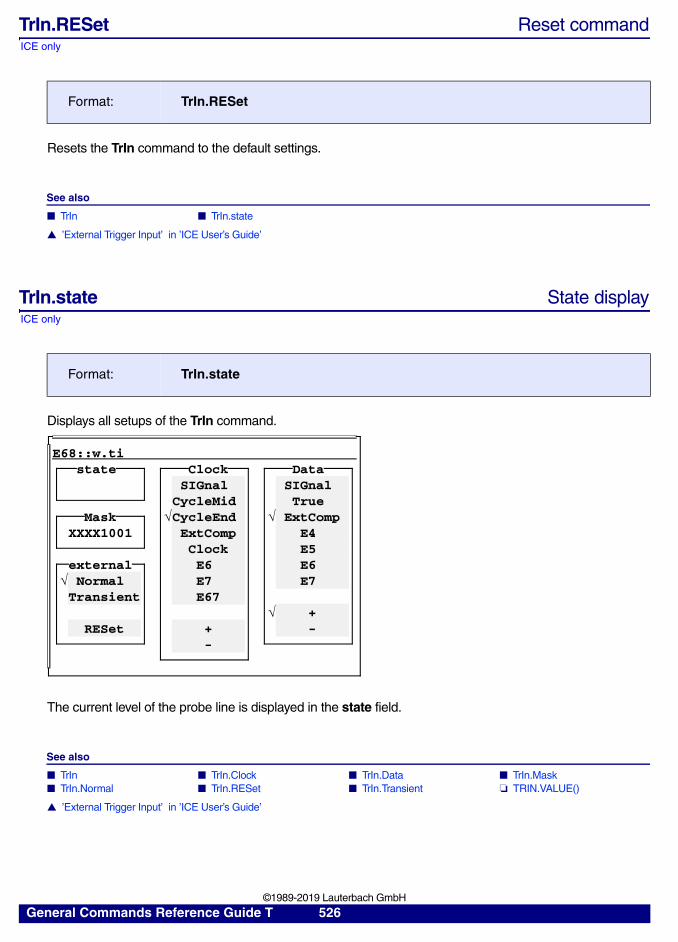
ICE only
TrIn.RESet Reset command
Resets the TrIn command to the default settings.
See also
■ TrIn ■ TrIn.state
▲ ’External Trigger Input’ in ’ICE User’s Guide’
ICE only
TrIn.state State display
Displays all setups of the TrIn command.
The current level of the probe line is displayed in the state field.
See also
■ TrIn ■ TrIn.Clock ■ TrIn.Data ■ TrIn.Mask ■ TrIn.Normal ■ TrIn.RESet ■ TrIn.Transient ❏ TRIN.VALUE()
▲ ’External Trigger Input’ in ’ICE User’s Guide’
Format: TrIn.RESet
Format: TrIn.state
E68::w.tistate Clock Data
SIGnal SIGnalCycleMid True
Mask CycleEnd ExtCompXXXX1001 ExtComp E4
Clock E5external E6 E6
Normal E7 E7Transient E67
+RESet + -
-
General Commands Reference Guide T 526 ©1989-2019 Lauterbach GmbH
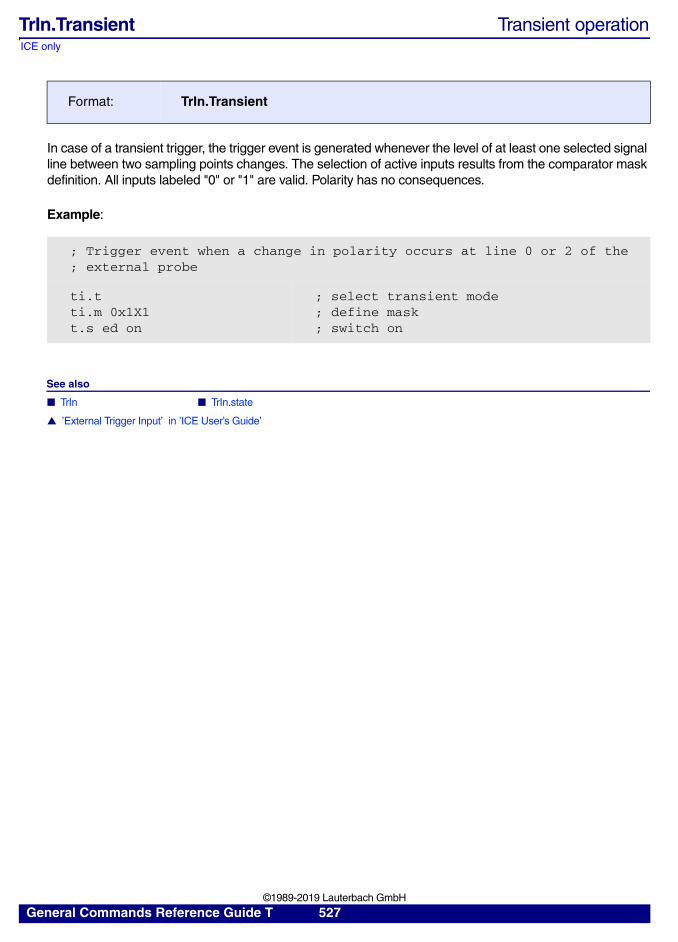
ICE only
TrIn.Transient Transient operation
In case of a transient trigger, the trigger event is generated whenever the level of at least one selected signal line between two sampling points changes. The selection of active inputs results from the comparator mask definition. All inputs labeled "0" or "1" are valid. Polarity has no consequences.
Example:
See also
■ TrIn ■ TrIn.state
▲ ’External Trigger Input’ in ’ICE User’s Guide’
Format: TrIn.Transient
; Trigger event when a change in polarity occurs at line 0 or 2 of the; external probe
ti.tti.m 0x1X1t.s ed on
; select transient mode; define mask; switch on
General Commands Reference Guide T 527 ©1989-2019 Lauterbach GmbH
TrMain
TrMain Trigger system of TRACE32-ICE
See also
■ TrMain.ALways ■ TrMain.Arm ■ TrMain.AutoInit ■ TrMain.AutoStart ■ TrMain.Break ■ TrMain.Count ■ TrMain.Delay ■ TrMain.Init ■ TrMain.Mode ■ TrMain.OFF ■ TrMain.Out ■ TrMain.RESet ■ TrMain.Set ■ TrMain.state ■ TrMain.Trigger
▲ ’TRIGGER Functions (ICE only)’ in ’General Function Reference’
Overview TrMain
The trigger system is used for collecting asynchronous events, converting them into a trigger signal, and passing this trigger signal on to the analyzer and emulation controller. The trigger system can exhibit the following conditions: OFF, ARMED, TRIGGERED or BREAKED. If the trigger system is in the ARMED condition and a trigger event occurs, the TRIGGERED condition will be the result. After the trigger delay sequence is completed the BREAK state will be the result.
Reaching the break state the emulation system or the analyzer will be stopped.The trigger source and trigger address (not ECC8) will be displayed.
There are three trigger modes:
• Emulator Trigger: The emulation system is stopped. The real-time emulation will be stopped at the next HLL or ASM line. If the analyzer slave mode is selected, it will be stopped too.
• Analyzer Trigger: The state analyzer is stopped, the real-time emulation is not affected.
• Memory Trigger: In memory trigger mode the state of emulation memory is locked (write protection). This function is useful only if emulation memory is 'shadowed' to the target memory.
NOTE: The trigger system will be blocked, if the PERF function is activated.
General Commands Reference Guide T 528 ©1989-2019 Lauterbach GmbH
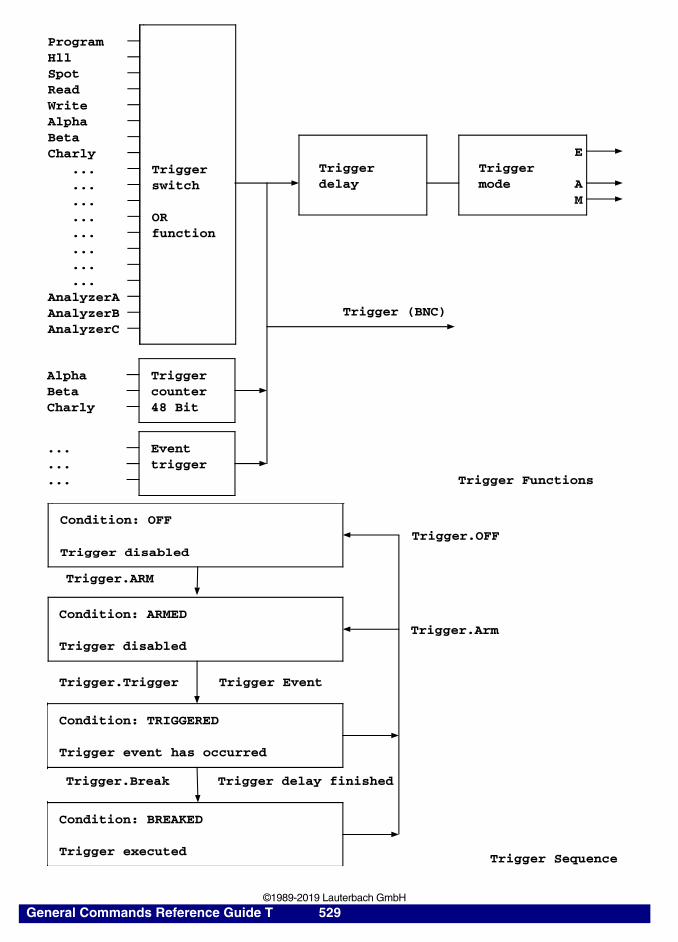
ProgramHllSpotReadWriteAlphaBetaCharly
... TriggerE
... switchTrigger Trigger
...delay mode A
... ORM
... function
...
...
...AnalyzerAAnalyzerBAnalyzerC
Trigger (BNC)
Alpha TriggerBeta counterCharly 48 Bit
... Event
... trigger
... Trigger Functions
Condition: OFFTrigger.OFF
Trigger disabled
Trigger.ARM
Condition: ARMEDTrigger.Arm
Trigger disabled
Trigger.Trigger Trigger Event
Condition: TRIGGERED
Trigger event has occurred
Trigger.Break Trigger delay finished
Condition: BREAKED
Trigger executedTrigger Sequence
General Commands Reference Guide T 529 ©1989-2019 Lauterbach GmbH
Functions
TRIGGER.STATE() State of the trigger system0 = OFF1 = ARMED2 = TRIGGERED3 = BREAKED
TRIGGER.ADDRESS() Address of the trigger event
TRIGGER.COUNT.ALPHA()TRIGGER.COUNT.BETA()TRIGGER.COUNT.CHARLY()
Value of the trigger counter
TRIGGER.DELAY.TIME()TRIGGER.DELAY.CYCLE()TRIGGER.DELAY.TRACE()
Value of the trigger delay counter
TRIGGER.SOURCE() Source of last trigger event as hex code (not ECC8).
TRIGGER.CYCLE() Cycle type of the trigger cycle, bit 0 is read/write (not ECC8).
TRIGGER.BYTES() Upper four bits contain the byte enable signals on a 32-bit bus (not ECC8).
General Commands Reference Guide T 530 ©1989-2019 Lauterbach GmbH
TrMain.ALways Constant triggering
Ensures that a trigger event is always generated at each cycle during real-time emulation. This function is normally used together with the TrMain.Delay option to run for a fixed time.
See also
■ TrMain ■ TrMain.state
▲ ’Trigger System’ in ’ICE User’s Guide’
ICE only
TrMain.Arm Release and activate trigger system
After being armed, the trigger system waits for a trigger event. If the option AutoArm is set, the trigger system would be activated (ARMED) automatically.
See also
■ TrMain.AutoInit ■ TrMain.AutoStart ■ TrMain ■ TrMain.state
▲ ’Trigger System’ in ’ICE User’s Guide’
Format: TrMain.ALways [ON | OFF]
; Program breaks immediately after 100 µs
tm.m emulatortm.al ontm.d time 100.usg
; emulator mode; trigger at first cycle; delay time is 100.us; start emulation
; Analyzer break after 1000 sampled CPU cycles
tm.restm.m analyzertm.always ontm.delay trace 1000.tm.a
; reset trigger system; break analyzer only ; trigger immediately; delay set to 1000 traced cycles; arm trigger system
Format: TrMain.Arm
tm.a ; Initialize and activate trigger system
General Commands Reference Guide T 531 ©1989-2019 Lauterbach GmbH
ICE only
TrMain.AutoInit Automatic trigger initialization
The trigger logic can be used independently of emulation commands and emulator state. In most cases, however, both trigger and emulation system must work together. Using the TrMain.AutoInit command, the trigger logic will be initialized whenever real-time emulation is started.
See also
■ TrMain.Arm ■ TrMain ■ TrMain.state
▲ ’Trigger System’ in ’ICE User’s Guide’
ICE only
TrMain.AutoStart Automatic trigger initialization
The trigger logic will be restarted only, if the trigger system is in Break state and emulation is started. No action is done, if the trigger system remains in ARMED or TRIGGERED state.
See also
■ TrMain.Arm ■ TrMain ■ TrMain.state
▲ ’Trigger System’ in ’ICE User’s Guide’
Format: TrMain.AutoInit [ON | OFF]
tm.ai on ; Activate AUTOINIT mode
Format: TrMain.AutoStart [ON | OFF]
tm.ai on ss…g…g
; activate AUTOSTART mode
; no trigger
; trigger event is reached
; trigger is ARMED, the real-time; emulation is started
General Commands Reference Guide T 532 ©1989-2019 Lauterbach GmbH
ICE only
TrMain.Break Break
Forces the trigger system to enter the Break state. The command will work only, if the CPU generates cycles and the real-time emulation is running.
See also
■ TrMain ■ TrMain.state
▲ ’Trigger System’ in ’ICE User’s Guide’
ICE only
TrMain.Count Set trigger counter
The three trigger counters (one in case of ECC8) can be used to count the number of accesses to a certain address. They are directly coupled with the breakpoint memory bits. If a counter is set, it will generate a trigger signal running through zero (not for ECC8).
See also
■ TrMain ■ TrMain.state
▲ ’Trigger System’ in ’ICE User’s Guide’
Format: TrMain.Break
Format: TrMain.Count <counter> [<delay> | ON | OFF]
<counter>: Alpha | Beta | Charly
<delay>: 0. …
E::b.s flags /alpha E::tm.c alpha 100000.
; set breakpoint; trigger after 100000 accesses
E::b.s flags /aE::tm.c a 1000.E::tm.c a off
; set breakpoint; set delay count; switch off trigger function
General Commands Reference Guide T 533 ©1989-2019 Lauterbach GmbH
ICE only
TrMain.Delay Set trigger delay
Three different delay modes, occurring between trigger event and break state, can be defined:
Trigger delays can be used together. The first delay function which runs to zero will force the trigger system to BREAK state.
See also
■ TrMain ■ TrMain.state
▲ ’Trigger System’ in ’ICE User’s Guide’
Format: TrMain.Delay <counter> [<delay> | ON | OFF]
<counter>: TRace | TIme | Cycle
<delay>: 0. …
TRace The number of traced records in trace memory.
TIme The trigger delay can be set from 100 ns to 300 days.
Cycle The trigger delay after CPU cycles.
tm.d trace 1000. ; Delay of 1000 trace cycles
tm.d time 100.us ; Delay of 100 µs
tm.d cycle 100. ; Delay of 100 cycles
General Commands Reference Guide T 534 ©1989-2019 Lauterbach GmbH
ICE only
TrMain.Init Initialize trigger system
This function is similar to that of TrMain.Arm. If the trigger system was OFF, it would not automatically be switched-on.
See also
■ TrMain ■ TrMain.state
▲ ’Trigger System’ in ’ICE User’s Guide’
ICE only
TrMain.Mode Select mode
The trigger mode defines the destination of the break signal.
See also
■ TrMain ■ TrMain.state
▲ ’Trigger System’ in ’ICE User’s Guide’
Format: TrMain.Init
Format: TrMain.Mode <mode> [ON | OFF]
<mode>: Emulator | Analyzer | Memory
Emulator Real-time emulation is stopped on the next HLL or ASM instruction. If the analyzer is in SLAVE mode, it will be stopped too.
Analyzer Analyzer triggering. Sampling is stopped, the analyzer will be ready for read-out. Real-time emulation is not terminated.
Memory Memory triggering. Emulation memory and flag memory are locked. Access to target system memory is not affected.
General Commands Reference Guide T 535 ©1989-2019 Lauterbach GmbH
ICE only
TrMain.OFF Switch off trigger system
The trigger system will not break or trigger, regardless of the other settings.
See also
■ TrMain ■ TrMain.state
▲ ’Trigger System’ in ’ICE User’s Guide’
Debugger only
TrMain.Out Output trigger pulse
Outputs a high pulse of 200ns.
An analyzer trigger program of the TRACE32-ICE system controls the reaction to a trigger pulse of the BDM Debugger.
See also
■ TrMain ■ TrMain.state
TrMain.RESet Reset trigger system
Resets trigger system to its original condition.
Format: TrMain.OFF
NOTE: Program and HLL-breakpoints are not affected, because they are not part of the trigger system.
Format: TrMain.Out
trigger.a if busa ; asserts trigger A of the TRACE32-ICE system,; when the BDM Debugger outputs a trigger pulse
Format: TrMain.RESet
General Commands Reference Guide T 536 ©1989-2019 Lauterbach GmbH
(E) ReadData, WriteData and AnalyzerA are selected as sources, AutoStart is activated and emulator triggering is selected.
See also
■ TrMain ■ TrMain.state
▲ ’Trigger System’ in ’ICE User’s Guide’
TrMain.Set Select trigger sources
Selects the possible trigger sources. The selected sources are ored together, i.e. the trigger will occur if one source becomes true.
Program, Hll, Spot, Read, Write, Alpha, Beta, Charly (E)
This function activates breakpoints (address markers) for triggering (default OFF). The trigger system makes no difference if the bus cycle is data-fetch, op-fetch, or pre-fetch only.
DataRead, DataWrite (E)
Format: TrMain.Set <source> [ON | OFF]
<source>: Program | Hll | SpotRead | WriteAlpha | Beta | CharlyDataRead | DataWriteExtData | ExtSynch | ExtCompeXception | TrInput | GlitchTimeOut | AnalyzerA | RBWBUSA
b.s flags /atm.s a on
; set single breakpoint to variable; activate for trigger (read/write/opfetch)
b.s v.range(flags) /atm.s a on
; set single breakpoint to data structure; activate trigger function (read/write/; opfetch)
b.s stack-0x100tm.s a on
; protect against stack overflow; activate trigger function
b.s 0x10000--0x0fffffftm.s a on
; protect range outside of working area; activate trigger function
b.s x:0x0--0x0fffftm.s a on
; protect selective (one bus cycle type only)
General Commands Reference Guide T 537 ©1989-2019 Lauterbach GmbH
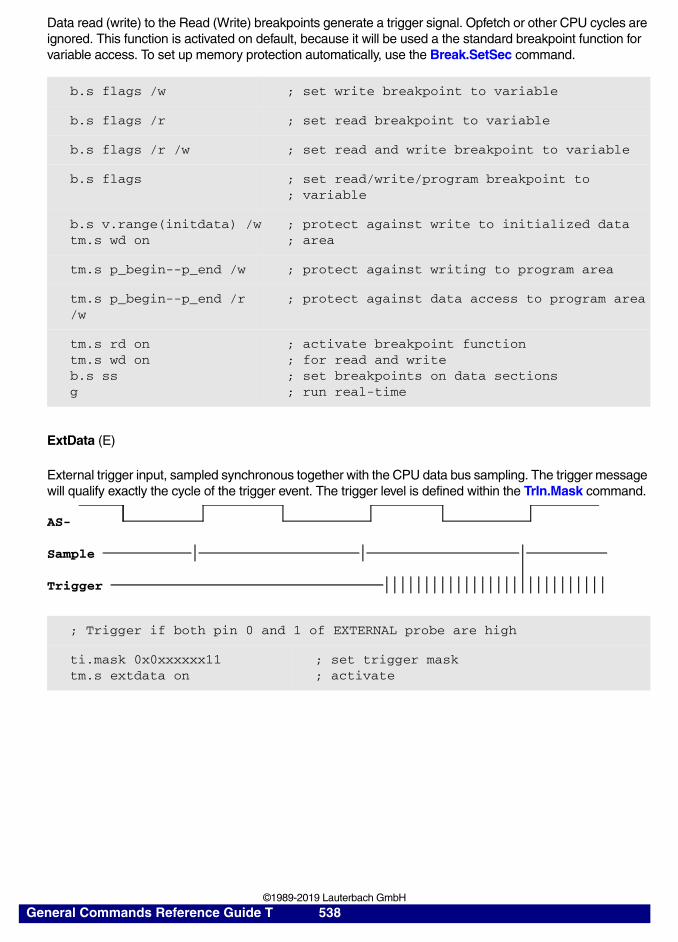
Data read (write) to the Read (Write) breakpoints generate a trigger signal. Opfetch or other CPU cycles are ignored. This function is activated on default, because it will be used a the standard breakpoint function for variable access. To set up memory protection automatically, use the Break.SetSec command.
ExtData (E)
External trigger input, sampled synchronous together with the CPU data bus sampling. The trigger message will qualify exactly the cycle of the trigger event. The trigger level is defined within the TrIn.Mask command.
b.s flags /w ; set write breakpoint to variable
b.s flags /r ; set read breakpoint to variable
b.s flags /r /w ; set read and write breakpoint to variable
b.s flags ; set read/write/program breakpoint to; variable
b.s v.range(initdata) /wtm.s wd on
; protect against write to initialized data; area
tm.s p_begin--p_end /w ; protect against writing to program area
tm.s p_begin--p_end /r /w
; protect against data access to program area
tm.s rd ontm.s wd onb.s ssg
; activate breakpoint function; for read and write; set breakpoints on data sections; run real-time
; Trigger if both pin 0 and 1 of EXTERNAL probe are high
ti.mask 0x0xxxxxx11tm.s extdata on
; set trigger mask; activate
AS-
Sample
Trigger
General Commands Reference Guide T 538 ©1989-2019 Lauterbach GmbH
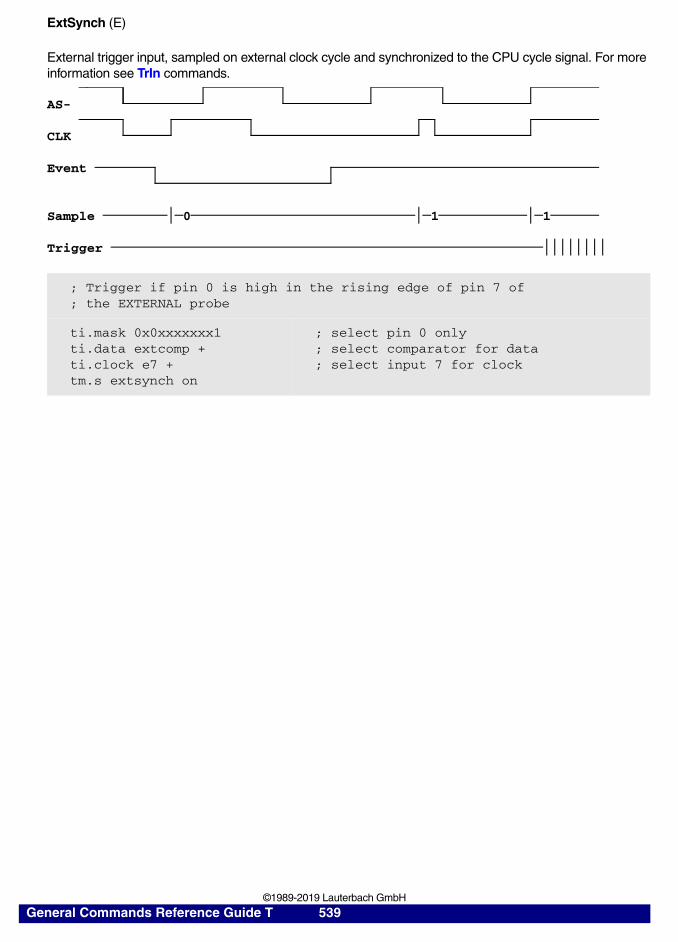
ExtSynch (E)
External trigger input, sampled on external clock cycle and synchronized to the CPU cycle signal. For more information see TrIn commands.
; Trigger if pin 0 is high in the rising edge of pin 7 of; the EXTERNAL probe
ti.mask 0x0xxxxxxx1ti.data extcomp +ti.clock e7 + tm.s extsynch on
; select pin 0 only; select comparator for data; select input 7 for clock
AS-
CLK
Event
Sample 0 1 1
Trigger
General Commands Reference Guide T 539 ©1989-2019 Lauterbach GmbH
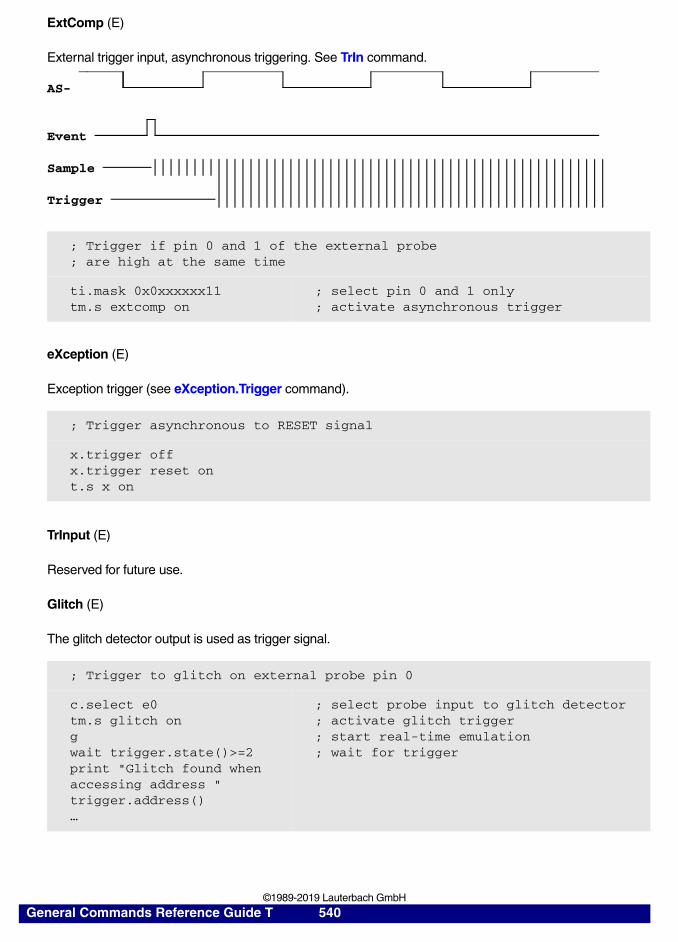
ExtComp (E)
External trigger input, asynchronous triggering. See TrIn command.
eXception (E)
Exception trigger (see eXception.Trigger command).
TrInput (E)
Reserved for future use.
Glitch (E)
The glitch detector output is used as trigger signal.
; Trigger if pin 0 and 1 of the external probe ; are high at the same time
ti.mask 0x0xxxxxx11 tm.s extcomp on
; select pin 0 and 1 only; activate asynchronous trigger
; Trigger asynchronous to RESET signal
x.trigger offx.trigger reset ont.s x on
; Trigger to glitch on external probe pin 0
c.select e0tm.s glitch ongwait trigger.state()>=2print "Glitch found when accessing address " trigger.address()…
; select probe input to glitch detector; activate glitch trigger; start real-time emulation; wait for trigger
AS-
Event
Sample
Trigger
General Commands Reference Guide T 540 ©1989-2019 Lauterbach GmbH
TimeOut (E)
Time-out on bus access (see SYStem.TimeOut command).
AnalyzerA (E)
Analyzer trigger output.
RWB (E)
Read-before-write triggering. This function is used to detect accesses to uninitialized variables or memory areas. To preset the flags in order to the linker information use the FLAG.SetSec command.
See also
■ TrMain ■ TrMain.state
▲ ’Trigger System’ in ’ICE User’s Guide’▲ ’Release Information’ in ’Release History’
; Trigger to bus time-out
sys.to 10.ustm.s timeout ongwait trigger.state()>=2print "No READY signal generated on address " trigger.address()…
; set time-out value; activate time-out trigger; start real-time emulation; wait for time-out
; Read-before-write trigger
flag.setsec
tm.s rbw ongwait trigger.state()>=2print "Uninitialized variable on address " trigger.address()…
; set write flag in program and; initialized data areas; activate read-before-write trigger; start real-time emulation; wait for trigger
General Commands Reference Guide T 541 ©1989-2019 Lauterbach GmbH
TrMain.state Trigger state display
See also
■ TrMain ■ TrMain.ALways ■ TrMain.Arm ■ TrMain.AutoInit ■ TrMain.AutoStart ■ TrMain.Break ■ TrMain.Count ■ TrMain.Delay ■ TrMain.Init ■ TrMain.Mode ■ TrMain.OFF ■ TrMain.Out ■ TrMain.RESet ■ TrMain.Set ■ TrMain.Trigger ❏ TRIGGER.ACCESS() ❏ TRIGGER.ADDRESS() ❏ TRIGGER.BYTES() ❏ TRIGGER.CYCLE() ❏ TRIGGER.OFFSET() ❏ TRIGGER.SOURCE() ❏ TRIGGER.STATE()
▲ ’Trigger System’ in ’ICE User’s Guide’
TrMain.Trigger Trigger
Execute trigger manually or by script.
See also
■ TrMain ■ TrMain.state
▲ ’Trigger System’ in ’ICE User’s Guide’
Format: TrMain.state
Format: TrMain.Trigger
General Commands Reference Guide T 542 ©1989-2019 Lauterbach GmbH
TrOnchip
The TrOnchip command group provides low-level access to the on-chip debug register.
TrOnchip Onchip triggers
See also
■ TrOnchip.Address ■ TrOnchip.CONVert ■ TrOnchip.CYcle ■ TrOnchip.Data ■ TrOnchip.RESet ■ TrOnchip.Set ■ TrOnchip.state ■ TrOnchip.TaskID ■ TrOnchip.TEnable
▲ ’CPU specific TrOnchip Commands’ in ’CPU32/ColdFire Debugger and Trace’▲ ’ARM Specific TrOnchip Commands’ in ’ARM Debugger’▲ ’ARM specific TrOnchip Commands’ in ’ARMv8-A/-R Debugger’▲ ’Command Reference: TrOnchip’ in ’Qorivva MPC5xxx/SPC5xx Debugger and NEXUS Trace’▲ ’CPU specific TrOnchip Commands’ in ’PQIII Debugger’▲ ’CPU specific TrOnchip Commands’ in ’QorIQ Debugger and NEXUS Trace’▲ ’CPU specific TrOnchip Commands’ in ’RH850 Debugger and Trace’▲ ’Nexus specific TrOnchip Commands’ in ’RH850 Debugger and Trace’▲ ’TrOnchip’ in ’StarCore Debugger and Trace’▲ ’CPU specific TrOnchip Commands’ in ’TriCore Debugger and Trace’▲ ’CPU specific TrOnchip Commands - Onchip Triggers’ in ’Intel® x86/x64 Debugger’▲ ’Specific TrOnchip Commands’ in ’FIRE Emulator for C166 Cell-Based-Core’▲ ’On-chip Trigger System’ in ’FIRE Emulator for C166 Family’▲ ’Release Information’ in ’Release History’
TrOnchip.Address tbd.
See also
■ TrOnchip ■ TrOnchip.state
▲ ’TrOnchip Commands’ in ’DSP56K Debugger’▲ ’Trigger On-chip Commands’ in ’M-Core Debugger’▲ ’Nexus specific TrOnchip Commands’ in ’Qorivva MPC5xxx/SPC5xx Debugger and NEXUS Trace’▲ ’Nexus specific TrOnchip Commands’ in ’RH850 Debugger and Trace’▲ ’Specific TrOnchip Commands’ in ’FIRE Emulator for C166 Cell-Based-Core’▲ ’ARM specific TrOnchip Commands’ in ’MAC71xx/72xx NEXUS Debugger and Trace’
Format: TrOnchip.Address
General Commands Reference Guide T 543 ©1989-2019 Lauterbach GmbH
TrOnchip.CONVert Adjust range breakpoint in onchip registers
See also
■ TrOnchip ■ TrOnchip.state
▲ ’TrOnchip Commands’ in ’XC2000/XC16x/C166CBC Debugger’▲ ’TrOnchip Commands’ in ’DSP56K Debugger’▲ ’CPU specific TrOnchip Commands’ in ’CPU32/ColdFire Debugger and Trace’▲ ’AndesCore Specific TrOnchip Commands’ in ’Andes Debugger’▲ ’On-chip Breakpoints/Actionpoints’ in ’ARC Debugger’▲ ’ARM Specific TrOnchip Commands’ in ’ARM Debugger’▲ ’ARM specific TrOnchip Commands’ in ’ARMv8-A/-R Debugger’▲ ’CPU specific TrOnchip Commands’ in ’AVR32 Debugger and NEXUS Trace’▲ ’CPU specific TrOnchip Commands’ in ’AVR8 Debugger’▲ ’Beyond Specific TrOnchip Commands’ in ’Beyond Debugger and Trace’▲ ’TrOnchip Commands’ in ’TMS320C5X Debugger’▲ ’TrOnchip Commands’ in ’TMS320C6X Debugger’▲ ’TrOnchip Commands’ in ’CEVA-X Debugger’▲ ’ARM specific TrOnchip Commands’ in ’Cortex-M Debugger’▲ ’CPU specific TrOnchip Commands’ in ’eTPU Debugger and Trace’▲ ’General TrOnchip Commands’ in ’GTM Debugger and Trace’▲ ’TrOnchip Commands’ in ’H8S/23x9 Debugger’▲ ’TrOnchip Commands’ in ’MCS08 Debugger’▲ ’TrOnchip Commands’ in ’MCS12 Debugger’▲ ’TrOnchip’ in ’M32R Debugger and Trace’▲ ’TrOnchip Commands’ in ’M8051EW Debugger’▲ ’Trigger On-chip Commands’ in ’M-Core Debugger’▲ ’TrOnchip Commands’ in ’MicroBlaze Debugger and Trace’▲ ’On-chip Breakpoints’ in ’MIPS Debugger and Trace’▲ ’CPU specific TrOnchip Commands’ in ’MMDSP Debugger’▲ ’Command Reference: TrOnchip’ in ’Qorivva MPC5xxx/SPC5xx Debugger and NEXUS Trace’▲ ’MSP430 Specific TrOnchip Commands’ in ’MSP430 Debugger’▲ ’TrOnchip Commands’ in ’NIOS II Debugger and Trace’▲ ’CPU specific TriggerOnchip Commands’ in ’PCP Debugger Reference’▲ ’CPU specific TrOnchip Commands’ in ’PPC400/PPC440 Debugger and Trace’▲ ’CPU specific TrOnchip Commands’ in ’PPC600 Family Debugger’▲ ’CPU specific TrOnchip Commands’ in ’MPC5xx/8xx Debugger and Trace’▲ ’CPU specific TrOnchip Commands’ in ’PQIII Debugger’▲ ’CPU specific TrOnchip Commands’ in ’QorIQ Debugger and NEXUS Trace’▲ ’TrOnchip Commands’ in ’R8051XC Debugger’▲ ’CPU specific TrOnchip Commands’ in ’RH850 Debugger and Trace’▲ ’TrOnchip Commands’ in ’RX Debugger’▲ ’CPU specific TrOnchip Commands’ in ’SH2, SH3 and SH4 Debugger’▲ ’TrOnchip’ in ’StarCore Debugger and Trace’▲ ’CPU specific TrOnchip Commands’ in ’TriCore Debugger and Trace’▲ ’TrOnchip Commands’ in ’V850 Debugger and Trace’▲ ’TrOnchip Commands’ in ’XC800 Debugger’▲ ’CPU specific TrOnchip Commands’ in ’ZSP Debugger’▲ ’Specific TrOnchip Commands’ in ’FIRE Emulator for C166 Cell-Based-Core’▲ ’CPU specific TrOnchip Commands’ in ’FIRE Emulator for HC12/MCS12’▲ ’Specific TrOnchip Commands’ in ’FIRE Emulator for SH2’▲ ’CPU specific TrOnchip Commands’ in ’ARM and XSCALE Monitor’▲ ’TrOnchip’ in ’C166 Monitor’▲ ’TrOnchip’ in ’TriCore Monitor’▲ ’TrOnchip Commands’ in ’x186 Monitor’▲ ’ARM specific TrOnchip Commands’ in ’MAC71xx/72xx NEXUS Debugger and Trace’
Format: TrOnchip.CONVert
General Commands Reference Guide T 544 ©1989-2019 Lauterbach GmbH
▲ ’CPU specific TrOnchip Commands’ in ’MMDSP NEXUS Debugger and Trace’▲ ’Release Information’ in ’Release History’▲ ’On-chip Breakpoints/Actionpoints’ in ’Simulator for ARC’
TrOnchip.CYcle tbd.
See also
■ TrOnchip ■ TrOnchip.state
▲ ’Trigger On-chip Commands’ in ’M-Core Debugger’▲ ’CPU specific TrOnchip Commands’ in ’TriCore Debugger and Trace’▲ ’Specific TrOnchip Commands’ in ’FIRE Emulator for C166 Cell-Based-Core’▲ ’Specific TrOnchip Commands’ in ’FIRE Emulator for SH2’
TrOnchip.Data tbd.
See also
■ TrOnchip ■ TrOnchip.state
▲ ’Nexus specific TrOnchip Commands’ in ’Qorivva MPC5xxx/SPC5xx Debugger and NEXUS Trace’▲ ’Nexus specific TrOnchip Commands’ in ’RH850 Debugger and Trace’▲ ’Specific TrOnchip Commands’ in ’FIRE Emulator for C166 Cell-Based-Core’
TrOnchip.RESet Reset settings to defaults
Set on-chip trigger system to initial state.
See also
■ TrOnchip ■ TrOnchip.state
▲ ’TrOnchip Commands’ in ’XC2000/XC16x/C166CBC Debugger’▲ ’TrOnchip Commands’ in ’DSP56K Debugger’▲ ’CPU specific TrOnchip Commands’ in ’CPU32/ColdFire Debugger and Trace’▲ ’AndesCore Specific TrOnchip Commands’ in ’Andes Debugger’▲ ’APEX Specific TrOnchip Commands’ in ’APEX Debugger’
Format: TrOnchip.CYcle
Format: TrOnchip.Data
Format: TrOnchip.RESet
General Commands Reference Guide T 545 ©1989-2019 Lauterbach GmbH
▲ ’On-chip Breakpoints/Actionpoints’ in ’ARC Debugger’▲ ’ARM Specific TrOnchip Commands’ in ’ARM Debugger’▲ ’ARM specific TrOnchip Commands’ in ’ARMv8-A/-R Debugger’▲ ’CPU specific TrOnchip Commands’ in ’AVR32 Debugger and NEXUS Trace’▲ ’Beyond Specific TrOnchip Commands’ in ’Beyond Debugger and Trace’▲ ’TrOnchip Commands’ in ’TMS320C2X Debugger’▲ ’C55X specific TrOnchip Commands’ in ’TMS320C5X Debugger’▲ ’TrOnchip Commands’ in ’TMS320C6X Debugger’▲ ’TrOnchip Commands’ in ’CEVA-X Debugger’▲ ’ARM specific TrOnchip Commands’ in ’Cortex-M Debugger’▲ ’CPU specific TrOnchip Commands’ in ’eTPU Debugger and Trace’▲ ’General TrOnchip Commands’ in ’GTM Debugger and Trace’▲ ’TrOnchip Commands’ in ’H8S/23x9 Debugger’▲ ’TrOnchip Commands’ in ’MCS12 Debugger’▲ ’IPU Specific TrOnchip Commands’ in ’IPU Debugger’▲ ’TrOnchip’ in ’M32R Debugger and Trace’▲ ’TrOnchip Commands’ in ’M8051EW Debugger’▲ ’Trigger On-chip Commands’ in ’M-Core Debugger’▲ ’Mico32 specific TrOnchip Commands’ in ’Mico32 Debugger’▲ ’TrOnchip Commands’ in ’MicroBlaze Debugger and Trace’▲ ’On-chip Breakpoints’ in ’MIPS Debugger and Trace’▲ ’CPU specific TrOnchip Commands’ in ’MMDSP Debugger’▲ ’Command Reference: TrOnchip’ in ’Qorivva MPC5xxx/SPC5xx Debugger and NEXUS Trace’▲ ’MSP430 Specific TrOnchip Commands’ in ’MSP430 Debugger’▲ ’TrOnchip Commands’ in ’NIOS II Debugger and Trace’▲ ’TrOnchip Commands’ in ’CEVA-Oak/Teak/TeakLite Debugger’▲ ’CPU specific TriggerOnchip Commands’ in ’PCP Debugger Reference’▲ ’CPU specific TrOnchip Commands’ in ’PPC400/PPC440 Debugger and Trace’▲ ’CPU specific TrOnchip Commands’ in ’PPC600 Family Debugger’▲ ’CPU specific TrOnchip Commands’ in ’MPC5xx/8xx Debugger and Trace’▲ ’CPU specific TrOnchip Commands’ in ’PQIII Debugger’▲ ’CPU specific TrOnchip Commands’ in ’QorIQ Debugger and NEXUS Trace’▲ ’TrOnchip Commands’ in ’R8051XC Debugger’▲ ’CPU specific TrOnchip Commands’ in ’RH850 Debugger and Trace’▲ ’TrOnchip Commands’ in ’RX Debugger’▲ ’CPU specific TrOnchip Commands’ in ’SH2, SH3 and SH4 Debugger’▲ ’TrOnchip’ in ’StarCore Debugger and Trace’▲ ’CPU specific TrOnchip Commands’ in ’STRED Debugger and Trace’▲ ’CPU specific TrOnchip Commands’ in ’TriCore Debugger and Trace’▲ ’TrOnchip Commands’ in ’V850 Debugger and Trace’▲ ’TrOnchip Commands’ in ’XC800 Debugger’▲ ’CPU specific TrOnchip Commands’ in ’XTENSA Debugger’▲ ’CPU specific TrOnchip Commands’ in ’ZSP Debugger’▲ ’Specific TrOnchip Commands’ in ’FIRE Emulator for C166 Cell-Based-Core’▲ ’CPU specific TrOnchip Commands’ in ’FIRE Emulator for HC12/MCS12’▲ ’Specific TrOnchip Commands’ in ’FIRE Emulator for SH2’▲ ’CPU specific TrOnchip Commands’ in ’ARM and XSCALE Monitor’▲ ’TrOnchip’ in ’C166 Monitor’▲ ’TrOnchip Commands’ in ’SH2 Monitor’▲ ’TrOnchip’ in ’TriCore Monitor’▲ ’TrOnchip Commands’ in ’x186 Monitor’▲ ’ARM specific TrOnchip Commands’ in ’MAC71xx/72xx NEXUS Debugger and Trace’▲ ’On-chip Breakpoints/Actionpoints’ in ’Simulator for ARC’
TrOnchip.Set Break on event
See also
■ TrOnchip ■ TrOnchip.state
▲ ’ARM Specific TrOnchip Commands’ in ’ARM Debugger’
General Commands Reference Guide T 546 ©1989-2019 Lauterbach GmbH
▲ ’ARM specific TrOnchip Commands’ in ’ARMv8-A/-R Debugger’▲ ’ARM specific TrOnchip Commands’ in ’Cortex-M Debugger’▲ ’CPU specific TrOnchip Commands’ in ’eTPU Debugger and Trace’▲ ’Command Reference: TrOnchip’ in ’Qorivva MPC5xxx/SPC5xx Debugger and NEXUS Trace’▲ ’CPU specific TrOnchip Commands’ in ’PPC400/PPC440 Debugger and Trace’▲ ’CPU specific TrOnchip Commands’ in ’MPC5xx/8xx Debugger and Trace’▲ ’CPU specific TrOnchip Commands’ in ’PQIII Debugger’▲ ’CPU specific TrOnchip Commands’ in ’QorIQ Debugger and NEXUS Trace’▲ ’Specific TrOnchip Commands’ in ’FIRE Emulator for SH2’▲ ’ARM specific TrOnchip Commands’ in ’MAC71xx/72xx NEXUS Debugger and Trace’▲ ’Release Information’ in ’Release History’
TrOnchip.state Display onchip trigger window
Displays a window with the state of the on-chip trigger setting.
See also
■ TrOnchip ■ TrOnchip.Address ■ TrOnchip.CONVert ■ TrOnchip.CYcle ■ TrOnchip.Data ■ TrOnchip.RESet ■ TrOnchip.Set ■ TrOnchip.TaskID ■ TrOnchip.TEnable
▲ ’TrOnchip Commands’ in ’XC2000/XC16x/C166CBC Debugger’▲ ’CPU specific TrOnchip Commands’ in ’CPU32/ColdFire Debugger and Trace’▲ ’AndesCore Specific TrOnchip Commands’ in ’Andes Debugger’▲ ’APEX Specific TrOnchip Commands’ in ’APEX Debugger’▲ ’On-chip Breakpoints/Actionpoints’ in ’ARC Debugger’▲ ’ARM Specific TrOnchip Commands’ in ’ARM Debugger’▲ ’ARM specific TrOnchip Commands’ in ’ARMv8-A/-R Debugger’▲ ’CPU specific TrOnchip Commands’ in ’AVR32 Debugger and NEXUS Trace’▲ ’CPU specific TrOnchip Commands’ in ’AVR8 Debugger’▲ ’Beyond Specific TrOnchip Commands’ in ’Beyond Debugger and Trace’▲ ’TrOnchip Commands’ in ’TMS320C2X Debugger’▲ ’TrOnchip Commands’ in ’TMS320C5X Debugger’▲ ’TrOnchip Commands’ in ’TMS320C6X Debugger’▲ ’TrOnchip Commands’ in ’CEVA-X Debugger’▲ ’ARM specific TrOnchip Commands’ in ’Cortex-M Debugger’▲ ’CPU specific TrOnchip Commands’ in ’eTPU Debugger and Trace’▲ ’TrOnchip Commands’ in ’H8S/23x9 Debugger’▲ ’TrOnchip Commands’ in ’MCS12 Debugger’▲ ’TrOnchip Commands’ in ’Hexagon Debugger’▲ ’IPU Specific TrOnchip Commands’ in ’IPU Debugger’▲ ’TrOnchip’ in ’M32R Debugger and Trace’▲ ’TrOnchip Commands’ in ’M8051EW Debugger’▲ ’Trigger On-chip Commands’ in ’M-Core Debugger’▲ ’Mico32 specific TrOnchip Commands’ in ’Mico32 Debugger’▲ ’TrOnchip Commands’ in ’MicroBlaze Debugger and Trace’▲ ’On-chip Breakpoints’ in ’MIPS Debugger and Trace’▲ ’CPU specific TrOnchip Commands’ in ’MMDSP Debugger’▲ ’MSP430 Specific TrOnchip Commands’ in ’MSP430 Debugger’▲ ’TrOnchip Commands’ in ’NIOS II Debugger and Trace’▲ ’TrOnchip Commands’ in ’CEVA-Oak/Teak/TeakLite Debugger’▲ ’CPU specific TrOnchip Commands’ in ’PPC400/PPC440 Debugger and Trace’▲ ’CPU specific TrOnchip Commands’ in ’PPC600 Family Debugger’▲ ’CPU specific TrOnchip Commands’ in ’MPC5xx/8xx Debugger and Trace’
Format: TrOnchip.state
General Commands Reference Guide T 547 ©1989-2019 Lauterbach GmbH
▲ ’TrOnchip Commands’ in ’R8051XC Debugger’▲ ’CPU specific TrOnchip Commands’ in ’RH850 Debugger and Trace’▲ ’TrOnchip Commands’ in ’RX Debugger’▲ ’CPU specific TrOnchip Commands’ in ’SH2, SH3 and SH4 Debugger’▲ ’TrOnchip’ in ’StarCore Debugger and Trace’▲ ’CPU specific TrOnchip Commands’ in ’STRED Debugger and Trace’▲ ’CPU specific TrOnchip Commands’ in ’TriCore Debugger and Trace’▲ ’TrOnchip Commands’ in ’V850 Debugger and Trace’▲ ’TrOnchip Commands’ in ’XC800 Debugger’▲ ’CPU specific TrOnchip Commands’ in ’XTENSA Debugger’▲ ’CPU specific TrOnchip Commands’ in ’ZSP Debugger’▲ ’CPU specific TrOnchip Commands’ in ’FIRE Emulator for HC12/MCS12’▲ ’Specific TrOnchip Commands’ in ’FIRE Emulator for SH2’▲ ’CPU specific TrOnchip Commands’ in ’ARM and XSCALE Monitor’▲ ’TrOnchip’ in ’C166 Monitor’▲ ’TrOnchip Commands’ in ’SH2 Monitor’▲ ’TrOnchip Commands’ in ’x186 Monitor’▲ ’ARM specific TrOnchip Commands’ in ’MAC71xx/72xx NEXUS Debugger and Trace’▲ ’CPU specific TrOnchip Commands’ in ’MMDSP NEXUS Debugger and Trace’▲ ’Release Information’ in ’Release History’▲ ’On-chip Breakpoints/Actionpoints’ in ’Simulator for ARC’
TrOnchip.TaskID tbd.
See also
■ TrOnchip ■ TrOnchip.state
▲ ’Specific TrOnchip Commands’ in ’FIRE Emulator for C166 Cell-Based-Core’
TrOnchip.TEnable tbd.
See also
■ TrOnchip ■ TrOnchip.state
▲ ’TrOnchip Commands’ in ’XC2000/XC16x/C166CBC Debugger’▲ ’CPU specific TrOnchip Commands’ in ’CPU32/ColdFire Debugger and Trace’▲ ’ARM Specific TrOnchip Commands’ in ’ARM Debugger’▲ ’CPU specific TrOnchip Commands’ in ’eTPU Debugger and Trace’▲ ’CPU specific TrOnchip Commands’ in ’PPC400/PPC440 Debugger and Trace’▲ ’CPU specific TrOnchip Commands’ in ’PPC600 Family Debugger’▲ ’CPU specific TrOnchip Commands’ in ’MPC5xx/8xx Debugger and Trace’▲ ’TrOnchip’ in ’C166 Monitor’▲ ’TrOnchip’ in ’TriCore Monitor’▲ ’ARM specific TrOnchip Commands’ in ’MAC71xx/72xx NEXUS Debugger and Trace’
Format: TrOnchip.TaskID
General Commands Reference Guide T 548 ©1989-2019 Lauterbach GmbH
TrPOD
TrPOD Trigger probe
See also
■ TrPOD.Clock ■ TrPOD.ClockPOL ■ TrPOD.Data ■ TrPOD.DataPOL ■ TrPOD.Mode ■ TrPOD.OFF ■ TrPOD.ON ■ TrPOD.RESet ■ TrPOD.state ■ TrPOD.Time
TrPOD.Clock Defines data mask
The clock mask is defined. Every input line can be high or low or don’t care.
See also
■ TrPOD ■ TrPOD.state
TrPOD.ClockPOL Defines data polarity
The clock polarity can be set to true or false.
See also
■ TrPOD ■ TrPOD.state
Format: TrPOD.Clock [<mask>]
Format: TrPOD.ClockPOL [<polarity>]
<polarity>: + | -
General Commands Reference Guide T 549 ©1989-2019 Lauterbach GmbH
TrPOD.Data Defines data mask
The data mask is defined. Every input line can be high or low or don’t care.
See also
■ TrPOD ■ TrPOD.state
TrPOD.DataPOL Defines data polarity
The data polarity can be set to true or false.
See also
■ TrPOD ■ TrPOD.state
Format: TrPOD.Data [<mask>]
Format: TrPOD.DataPOL [<polarity>]
<polarity>: + | -
General Commands Reference Guide T 550 ©1989-2019 Lauterbach GmbH
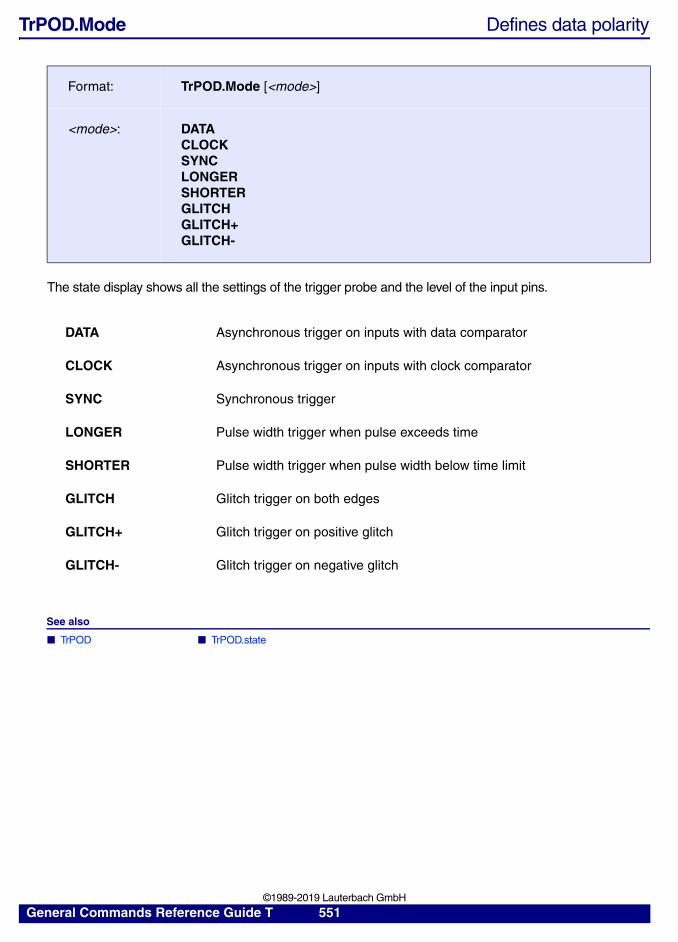
TrPOD.Mode Defines data polarity
The state display shows all the settings of the trigger probe and the level of the input pins.
See also
■ TrPOD ■ TrPOD.state
Format: TrPOD.Mode [<mode>]
<mode>: DATACLOCKSYNCLONGERSHORTERGLITCHGLITCH+GLITCH-
DATA Asynchronous trigger on inputs with data comparator
CLOCK Asynchronous trigger on inputs with clock comparator
SYNC Synchronous trigger
LONGER Pulse width trigger when pulse exceeds time
SHORTER Pulse width trigger when pulse width below time limit
GLITCH Glitch trigger on both edges
GLITCH+ Glitch trigger on positive glitch
GLITCH- Glitch trigger on negative glitch
General Commands Reference Guide T 551 ©1989-2019 Lauterbach GmbH
TrPOD.OFF Switch off
The trigger probe is disabled.
See also
■ TrPOD ■ TrPOD.state
TrPOD.ON Switch on
The trigger probe is enabled.
See also
■ TrPOD ■ TrPOD.state
TrPOD.RESet Reset command
The trigger probe is initialized to the default setup condition
See also
■ TrPOD ■ TrPOD.state
Format: TrPOD.OFF
Format: TrPOD.ON
Format: TrPOD.RESet
General Commands Reference Guide T 552 ©1989-2019 Lauterbach GmbH
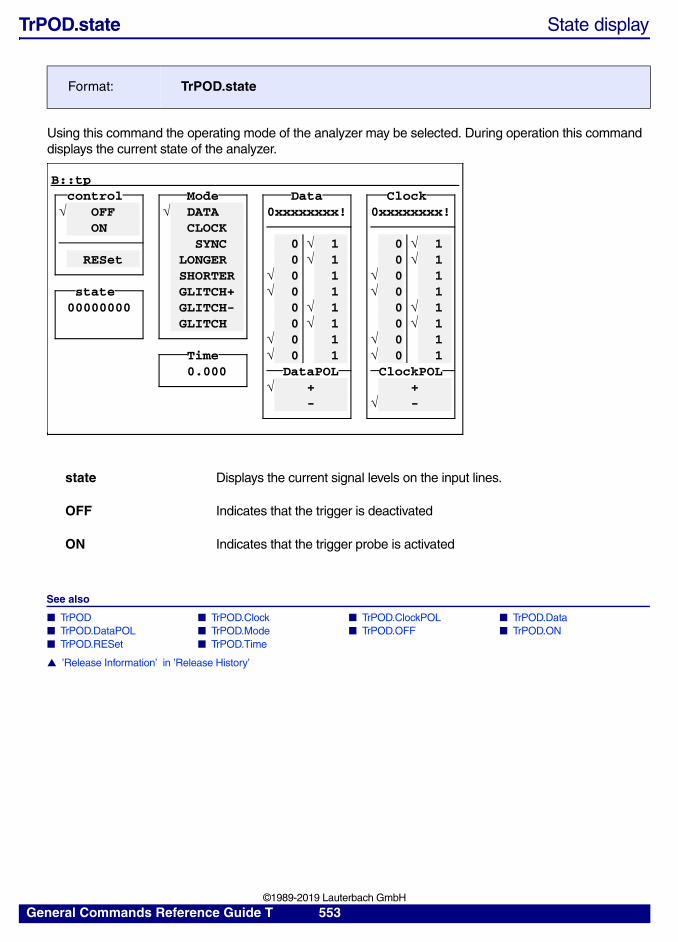
TrPOD.state State display
Using this command the operating mode of the analyzer may be selected. During operation this command displays the current state of the analyzer.
See also
■ TrPOD ■ TrPOD.Clock ■ TrPOD.ClockPOL ■ TrPOD.Data ■ TrPOD.DataPOL ■ TrPOD.Mode ■ TrPOD.OFF ■ TrPOD.ON ■ TrPOD.RESet ■ TrPOD.Time
▲ ’Release Information’ in ’Release History’
Format: TrPOD.state
state Displays the current signal levels on the input lines.
OFF Indicates that the trigger is deactivated
ON Indicates that the trigger probe is activated
B::tpcontrol Mode Data Clock
OFF DATA 0xxxxxxxx! 0xxxxxxxx!ON CLOCK
SYNC 0 1 0 1RESet LONGER 0 1 0 1
SHORTER 0 1 0 1state GLITCH+ 0 1 0 1
00000000 GLITCH- 0 1 0 1GLITCH 0 1 0 1
0 1 0 1Time 0 1 0 10.000 DataPOL ClockPOL
+ +- -
General Commands Reference Guide T 553 ©1989-2019 Lauterbach GmbH
TrPOD.Time Defines the time for the pulse width trigger
The time limit for the pulse width detection can be set between 20 ns and 6 ms.
See also
■ TrPOD ■ TrPOD.state
Format: TrPOD.Time [<time>]
General Commands Reference Guide T 554 ©1989-2019 Lauterbach GmbH


![AT Reference Guide - Multi-Tech Systems, Inc.€¦ · DE910- Series AT commands reference guide – AT commands [...]](https://img.pdfslide.us/doc/110x75/6062516d02f817666972114c/at-reference-guide-multi-tech-systems-inc-de910-series-at-commands-reference.jpg)