Embed Size (px)
Citation preview
General Aviation Accident Analysis
Darryl TrckaPresident
Greater Houston Association of Flight Instructors
Presented at the Flight Instructor Recertification Clinic
January, 2000
Based on:
1996, 1998 Nall Report Air Safety Foundation
AOPAFrederick, Md
Accident FactsNational Safety Council
Itasca, Il
Traffic Safety FactsUS Department of Transportation
National Highway Safety AdministrationNational Center for Statistics and Analysis
Washington, D.C.
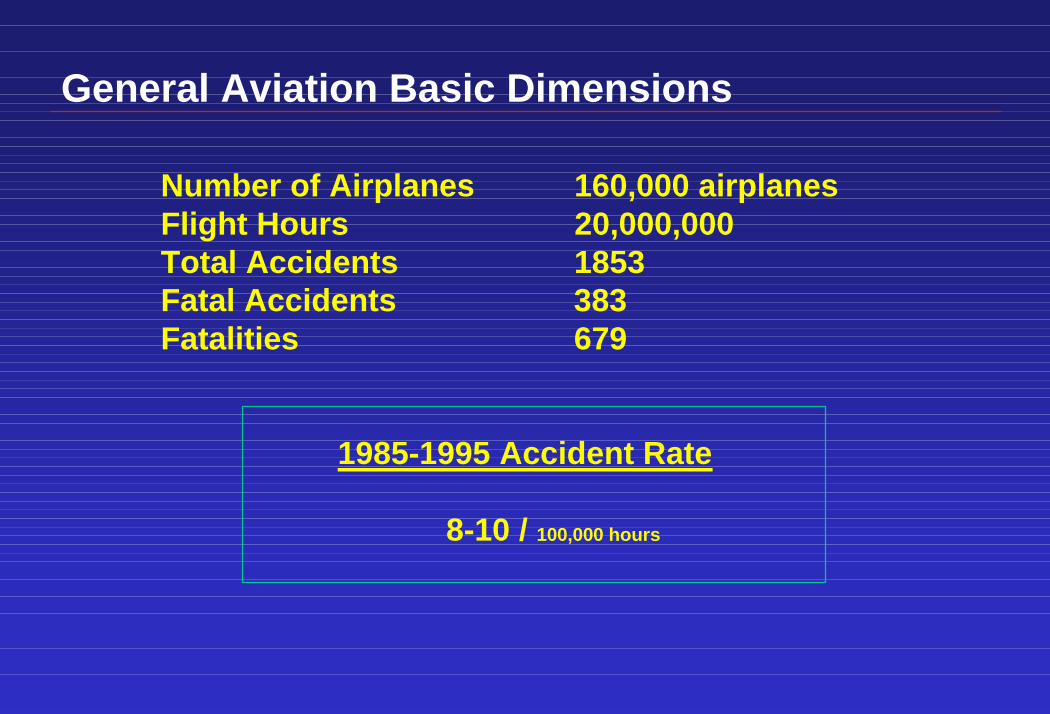
General Aviation Basic Dimensions
Number of Airplanes 160,000 airplanesFlight Hours 20,000,000 Total Accidents 1853Fatal Accidents 383Fatalities 679
1985-1995 Accident Rate
8-10 / 100,000 hours
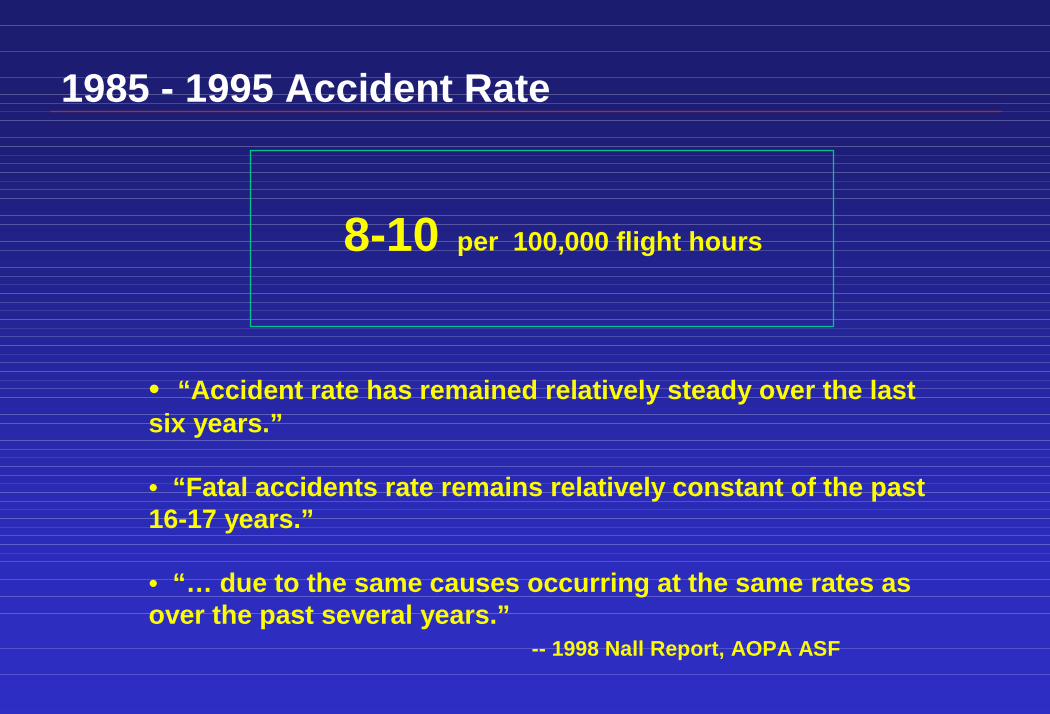
1985 - 1995 Accident Rate
8-10 per 100,000 flight hours
• “Accident rate has remained relatively steady over the last six years.”
• “Fatal accidents rate remains relatively constant of the past 16-17 years.”
• “… due to the same causes occurring at the same rates as over the past several years.”
-- 1998 Nall Report, AOPA ASF
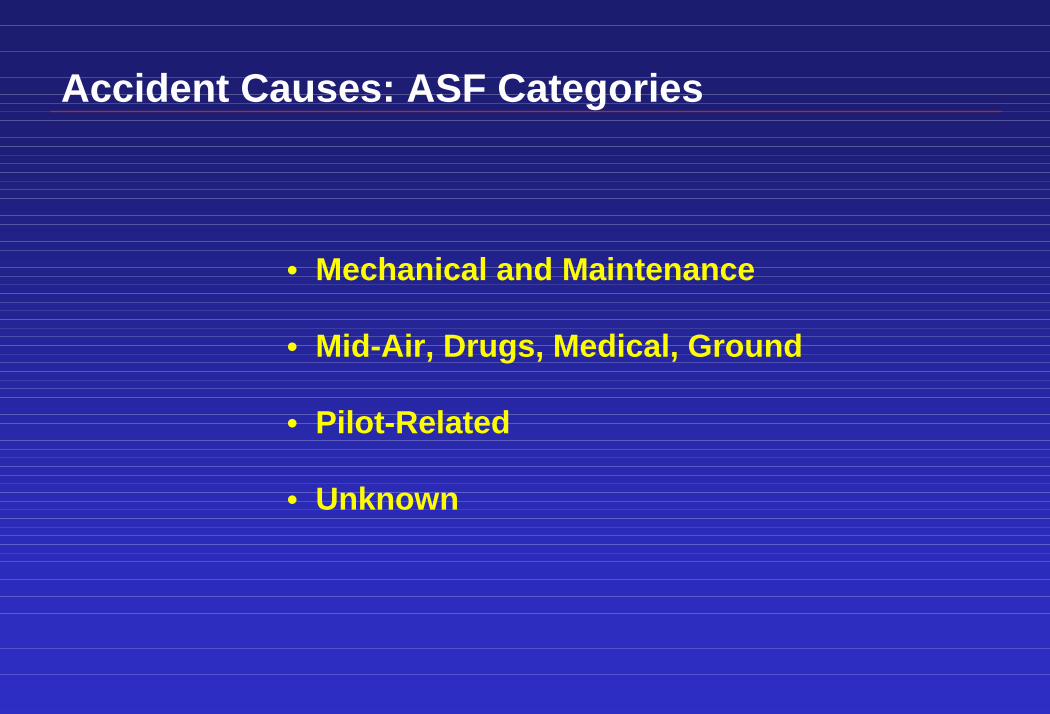
Accident Causes: ASF Categories
• Mechanical and Maintenance
• Mid-Air, Drugs, Medical, Ground
• Pilot-Related
• Unknown
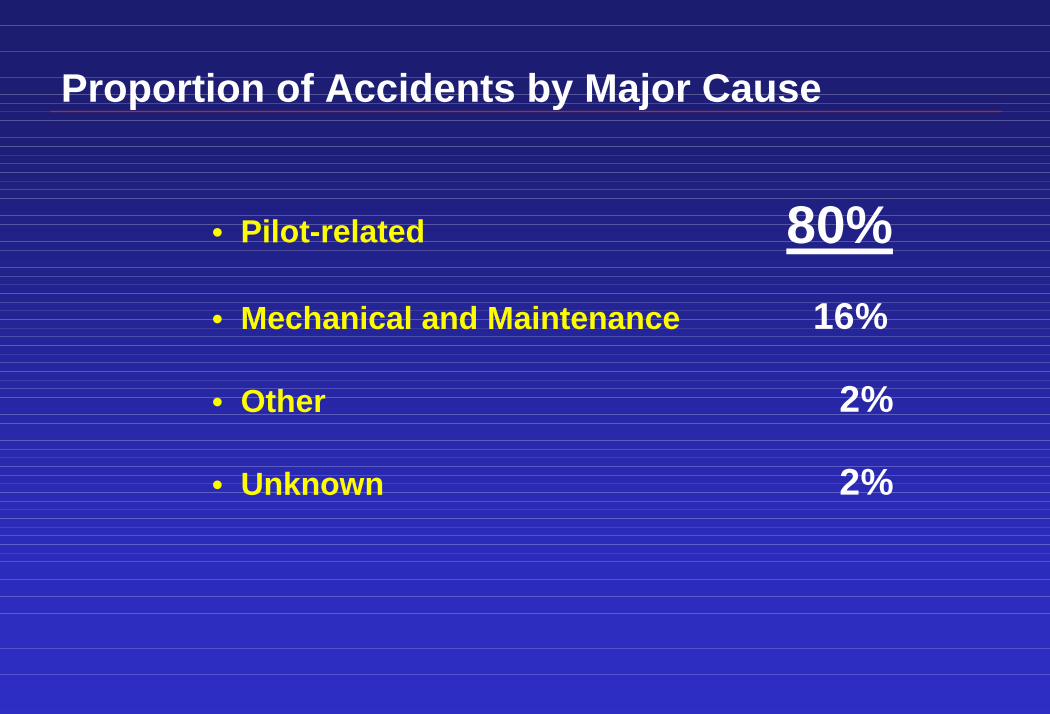
Proportion of Accidents by Major Cause
• Pilot-related 80%• Mechanical and Maintenance 16%
• Other 2%
• Unknown 2%
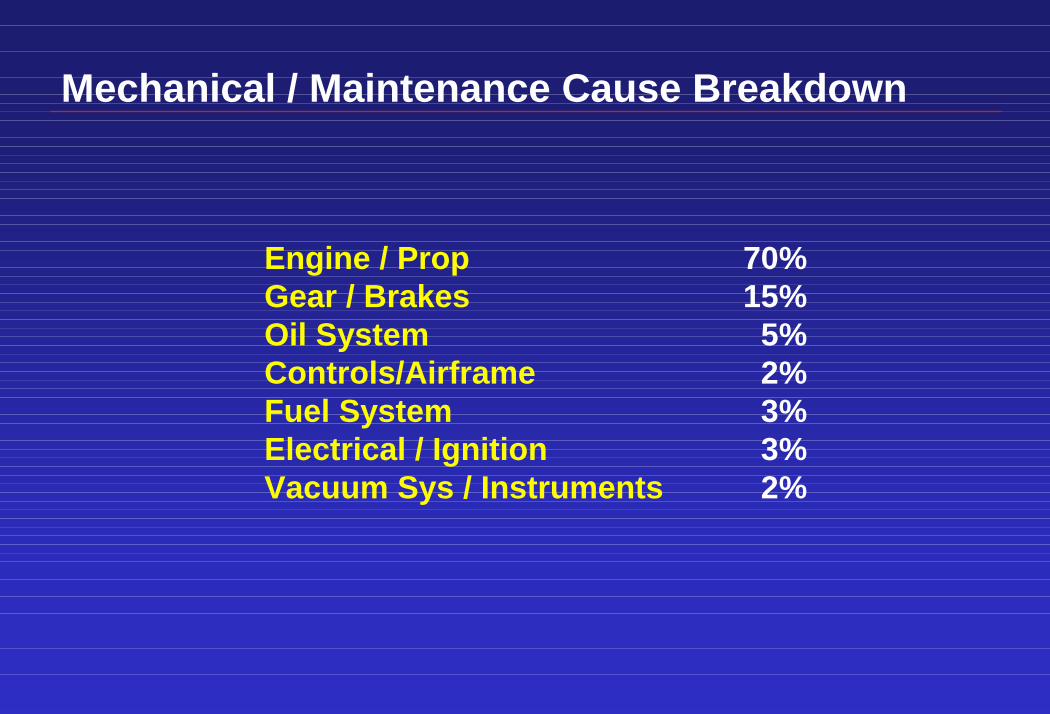
Mechanical / Maintenance Cause Breakdown
Engine / Prop 70%Gear / Brakes 15%Oil System 5%Controls/Airframe 2%Fuel System 3%Electrical / Ignition 3%Vacuum Sys / Instruments 2%
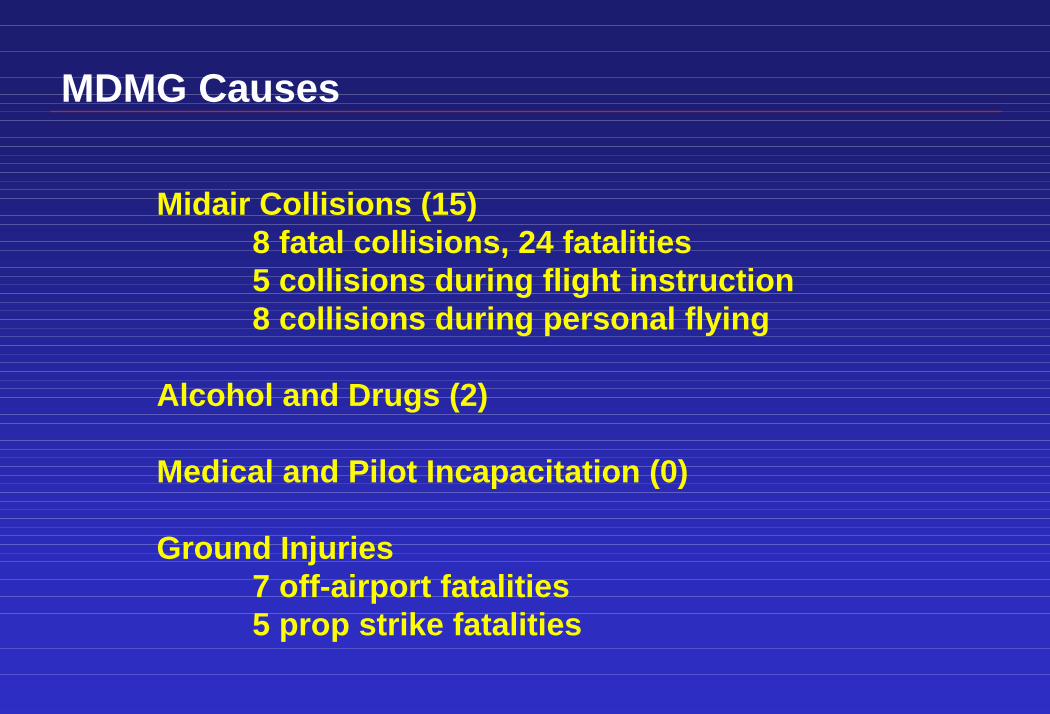
MDMG Causes
Midair Collisions (15)8 fatal collisions, 24 fatalities5 collisions during flight instruction8 collisions during personal flying
Alcohol and Drugs (2)
Medical and Pilot Incapacitation (0)
Ground Injuries 7 off-airport fatalities 5 prop strike fatalities
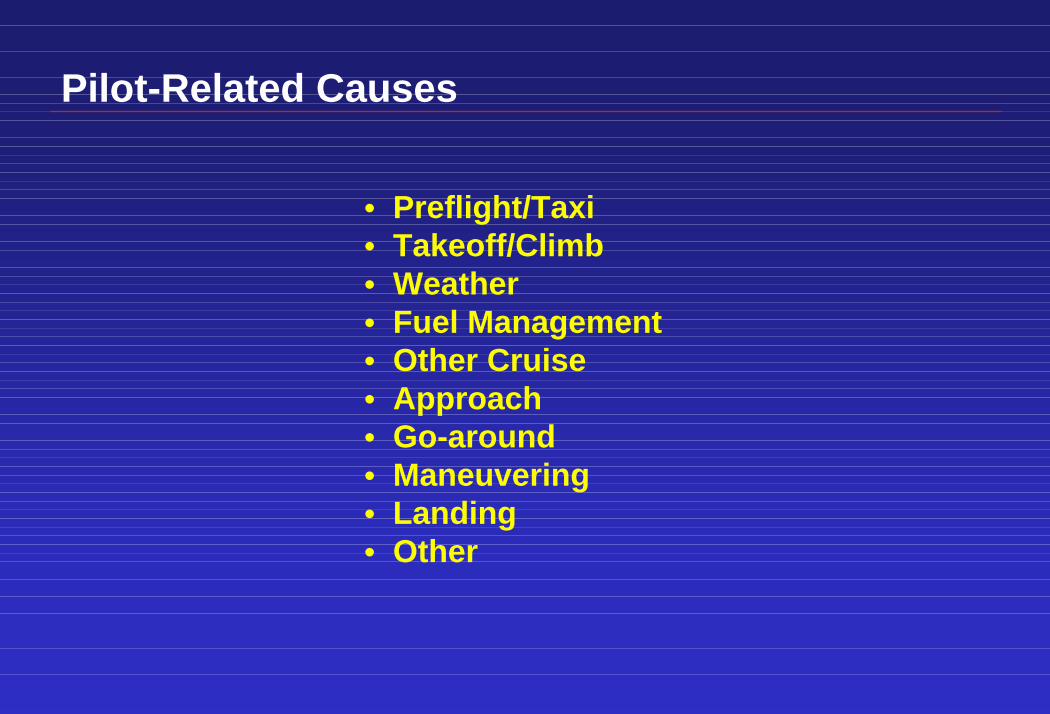
Pilot-Related Causes
• Preflight/Taxi• Takeoff/Climb• Weather• Fuel Management• Other Cruise• Approach• Go-around• Maneuvering• Landing• Other
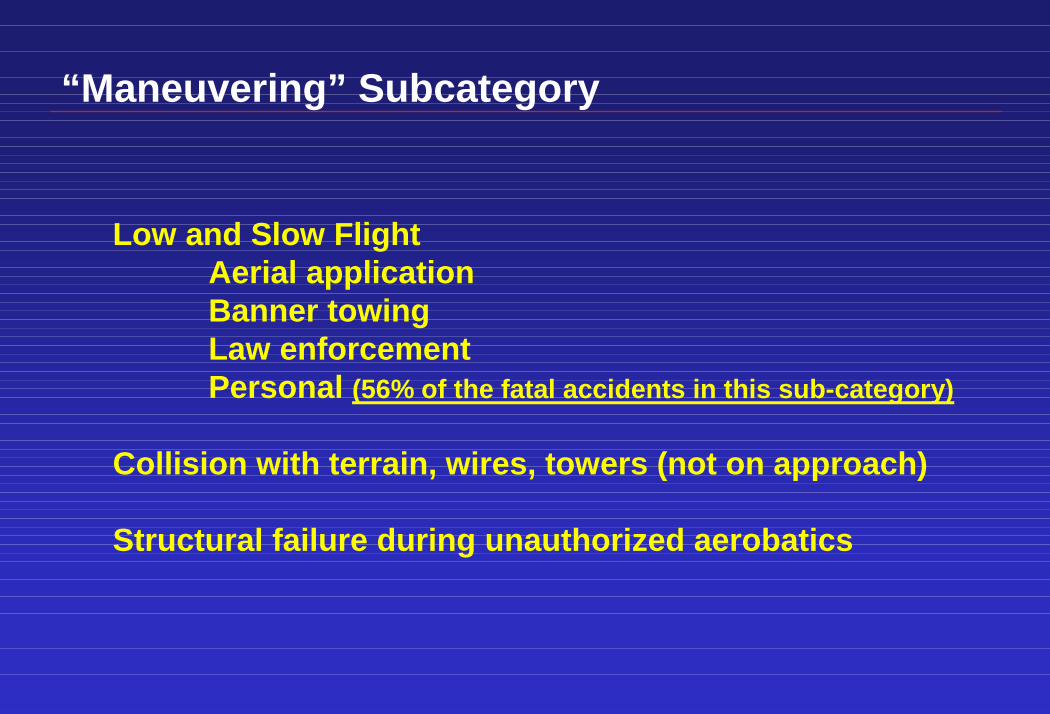
“Maneuvering” Subcategory
Low and Slow Flight Aerial applicationBanner towingLaw enforcementPersonal (56% of the fatal accidents in this sub-category)
Collision with terrain, wires, towers (not on approach)
Structural failure during unauthorized aerobatics
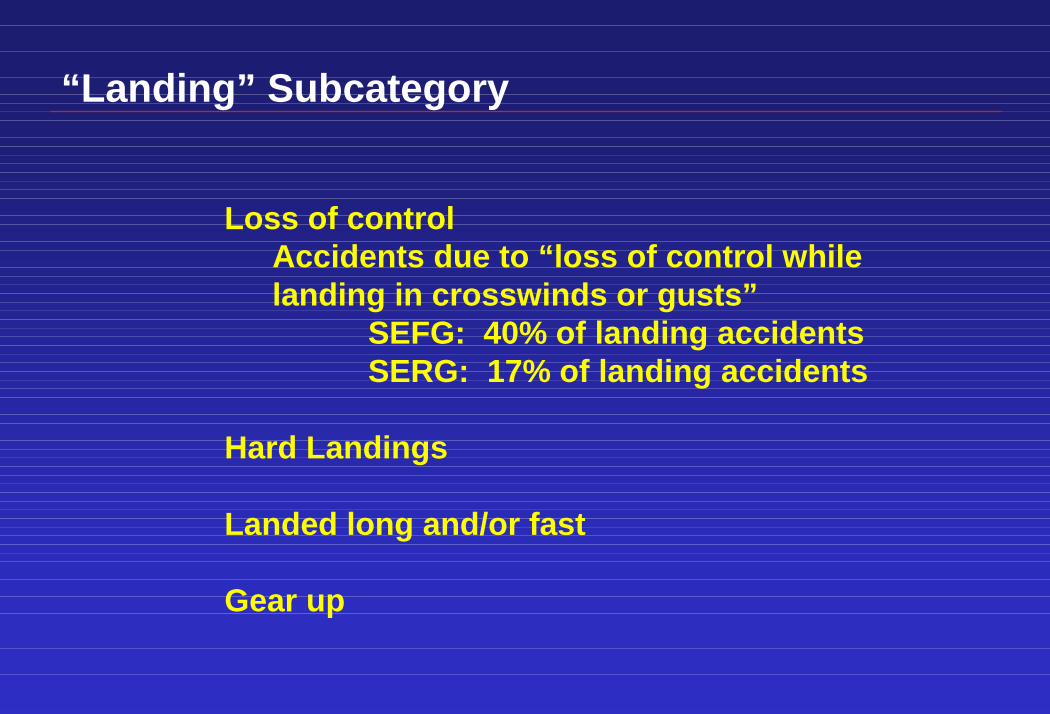
“Landing” Subcategory
Loss of control Accidents due to “loss of control while landing in crosswinds or gusts”
SEFG: 40% of landing accidentsSERG: 17% of landing accidents
Hard Landings
Landed long and/or fast
Gear up
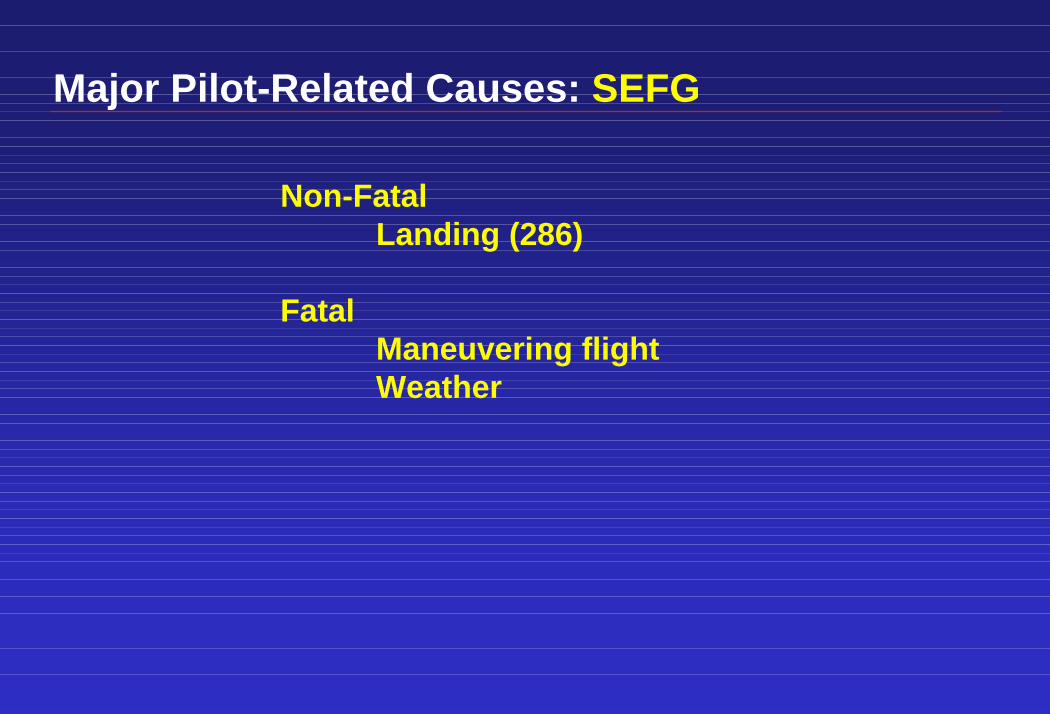
Major Pilot-Related Causes: SEFG
Non-FatalLanding (286)
FatalManeuvering flightWeather
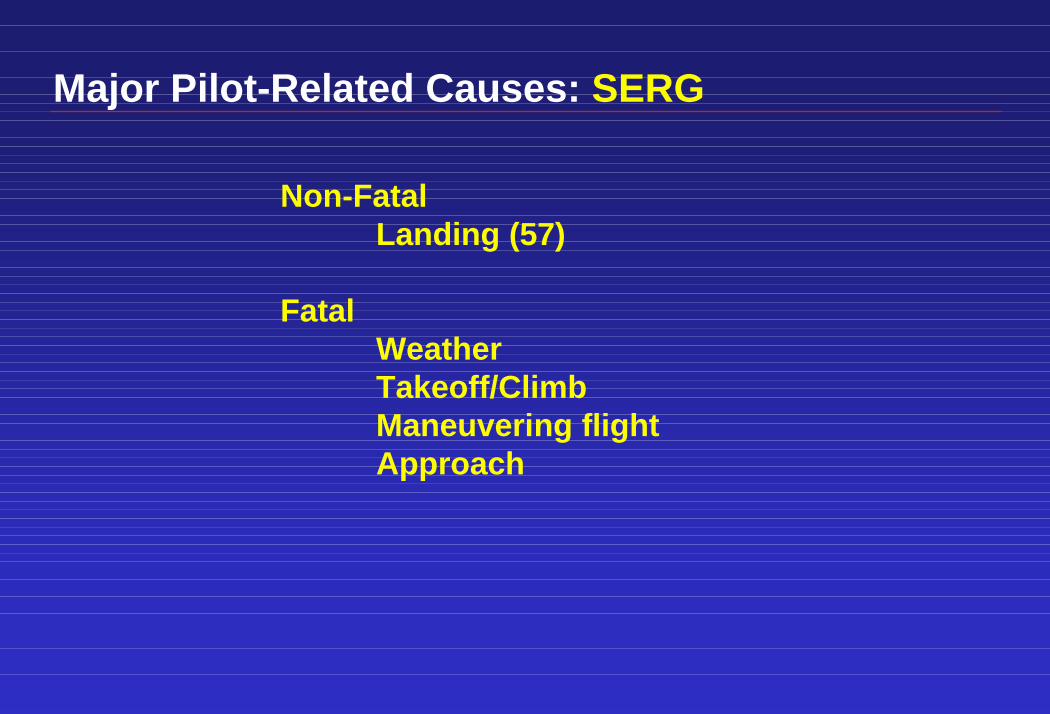
Major Pilot-Related Causes: SERG
Non-FatalLanding (57)
FatalWeatherTakeoff/ClimbManeuvering flightApproach
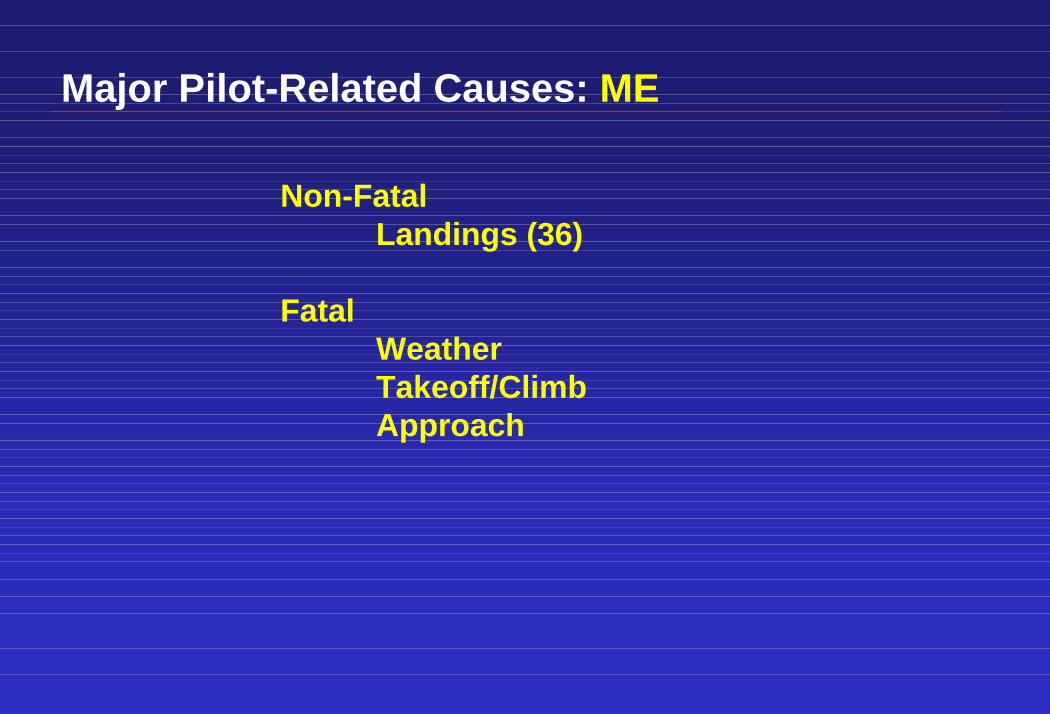
Major Pilot-Related Causes: ME
Non-FatalLandings (36)
FatalWeatherTakeoff/ClimbApproach
Of All Accident Causes
80% Pilot-Related Causes
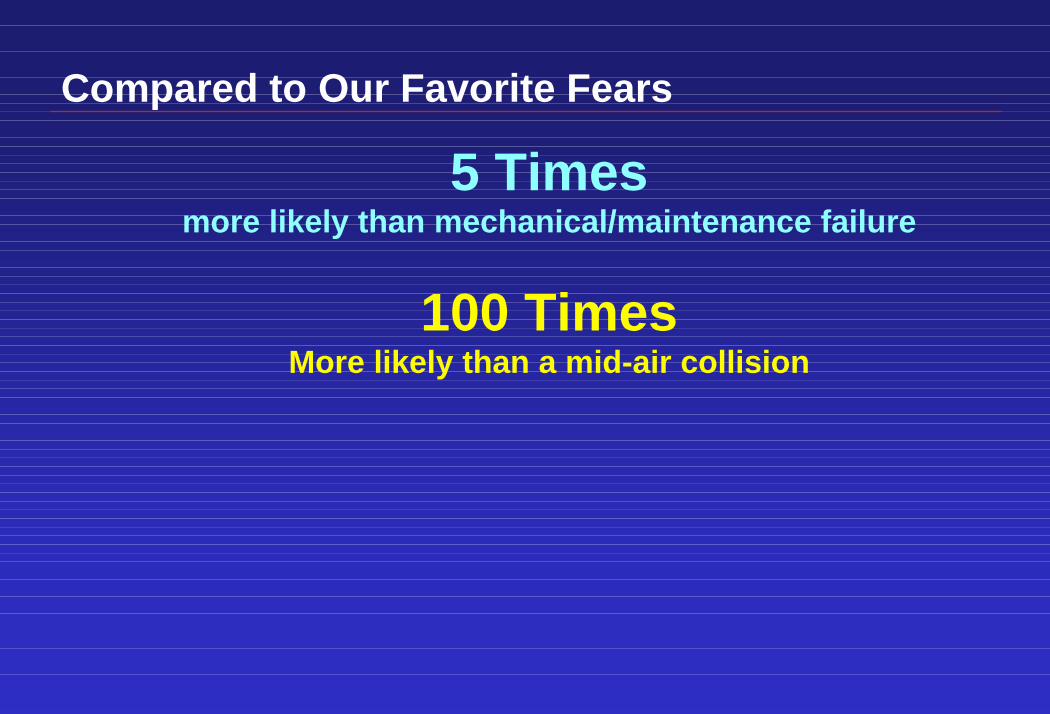
Compared to Our Favorite Fears
5 Timesmore likely than mechanical/maintenance failure
Compared to Our Favorite Fears
5 Timesmore likely than mechanical/maintenance failure
100 TimesMore likely than a mid-air collision
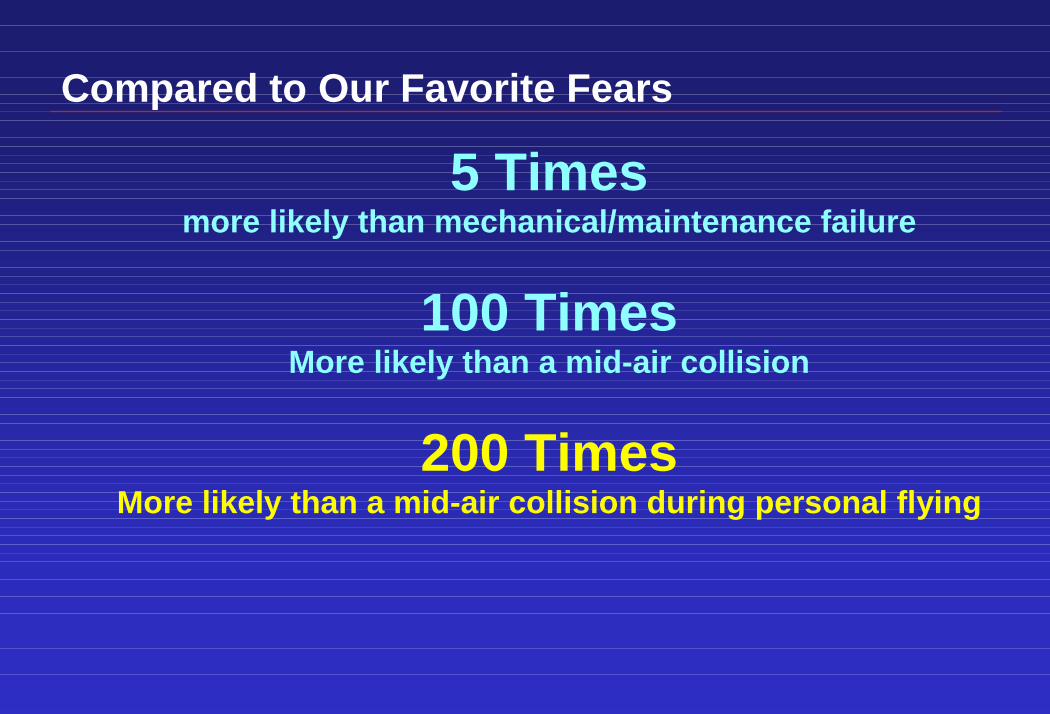
Compared to Our Favorite Fears
5 Timesmore likely than mechanical/maintenance failure
100 TimesMore likely than a mid-air collision
200 TimesMore likely than a mid-air collision during personal flying
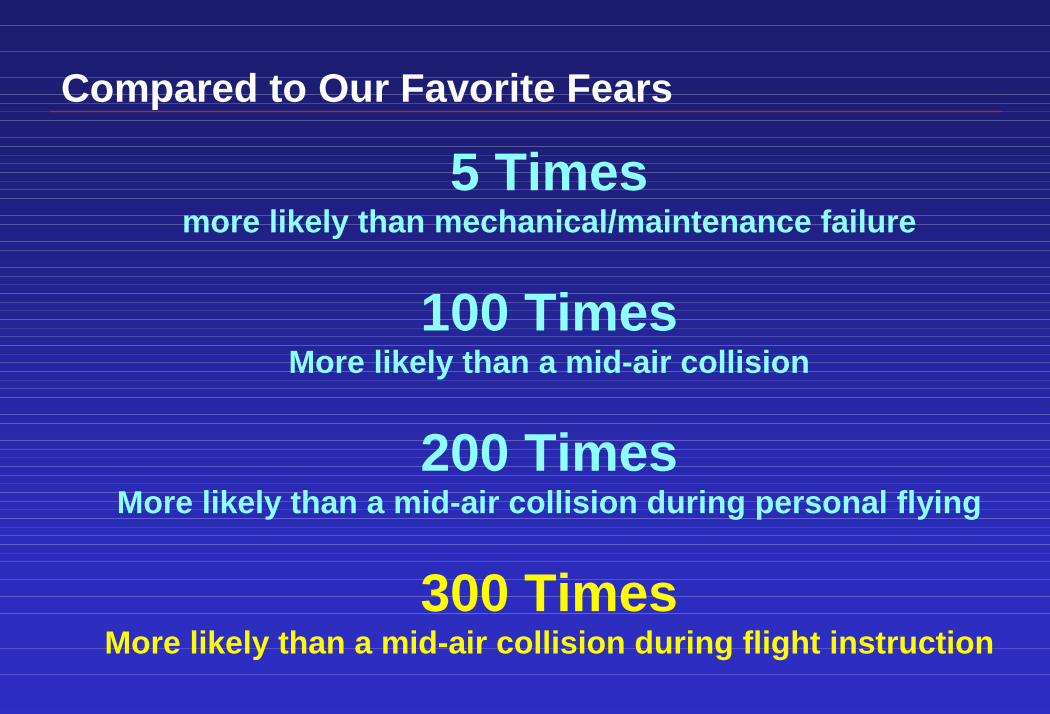
Compared to Our Favorite Fears
5 Timesmore likely than mechanical/maintenance failure
100 TimesMore likely than a mid-air collision
200 TimesMore likely than a mid-air collision during personal flying
300 TimesMore likely than a mid-air collision during flight instruction
A Closer Look at Pilot-Related Causes
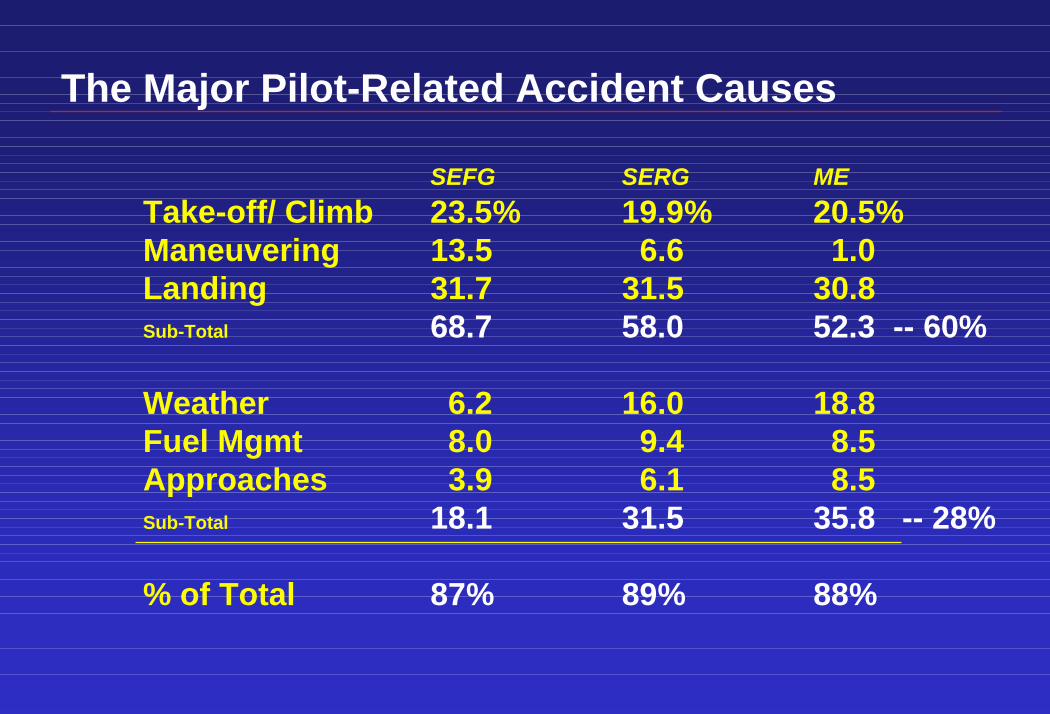
The Major Pilot-Related Accident Causes
SEFG SERG METake-off/ Climb 23.5% 19.9% 20.5%Maneuvering 13.5 6.6 1.0Landing 31.7 31.5 30.8Sub-Total 68.7 58.0 52.3 -- 60%
Weather 6.2 16.0 18.8Fuel Mgmt 8.0 9.4 8.5Approaches 3.9 6.1 8.5Sub-Total 18.1 31.5 35.8 -- 28%
% of Total 87% 89% 88%
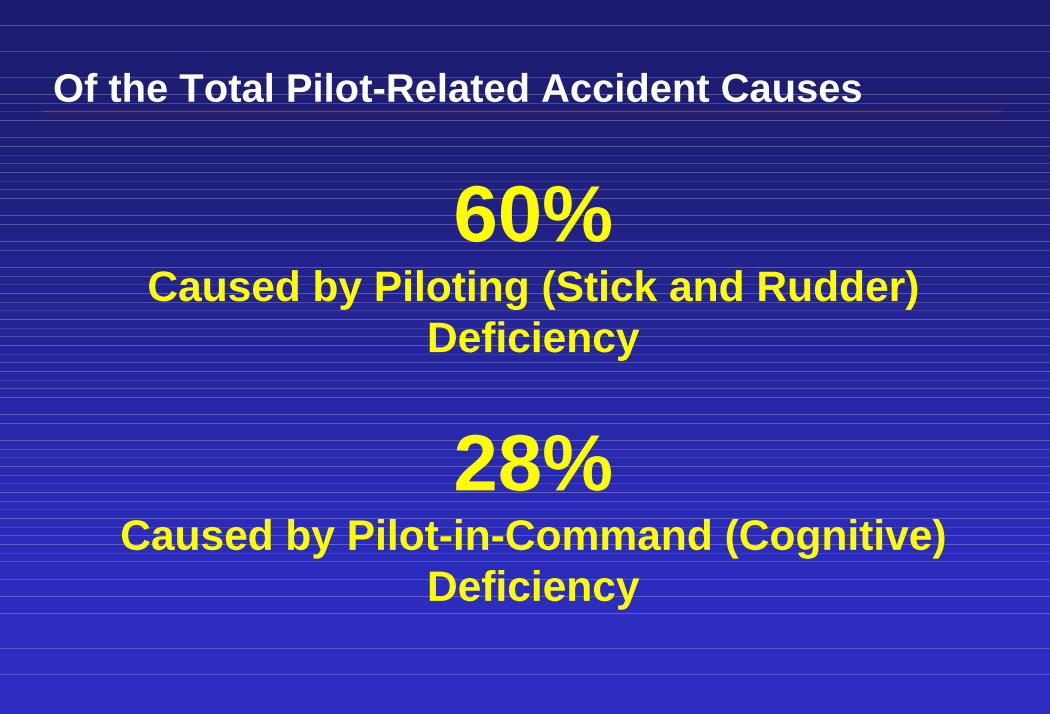
Of the Total Pilot-Related Accident Causes
60%Caused by Piloting (Stick and Rudder)
Deficiency
28%Caused by Pilot-in-Command (Cognitive)
Deficiency
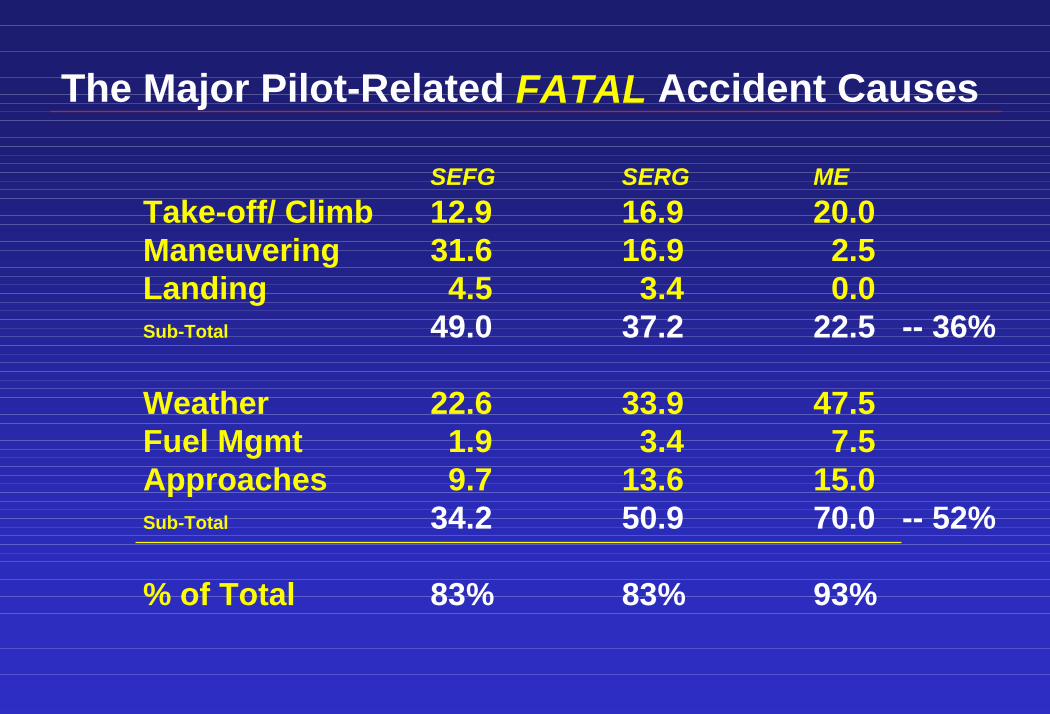
The Major Pilot-Related FATAL Accident Causes
SEFG SERG METake-off/ Climb 12.9 16.9 20.0Maneuvering 31.6 16.9 2.5Landing 4.5 3.4 0.0Sub-Total 49.0 37.2 22.5 -- 36%
Weather 22.6 33.9 47.5Fuel Mgmt 1.9 3.4 7.5Approaches 9.7 13.6 15.0Sub-Total 34.2 50.9 70.0 -- 52%
% of Total 83% 83% 93%
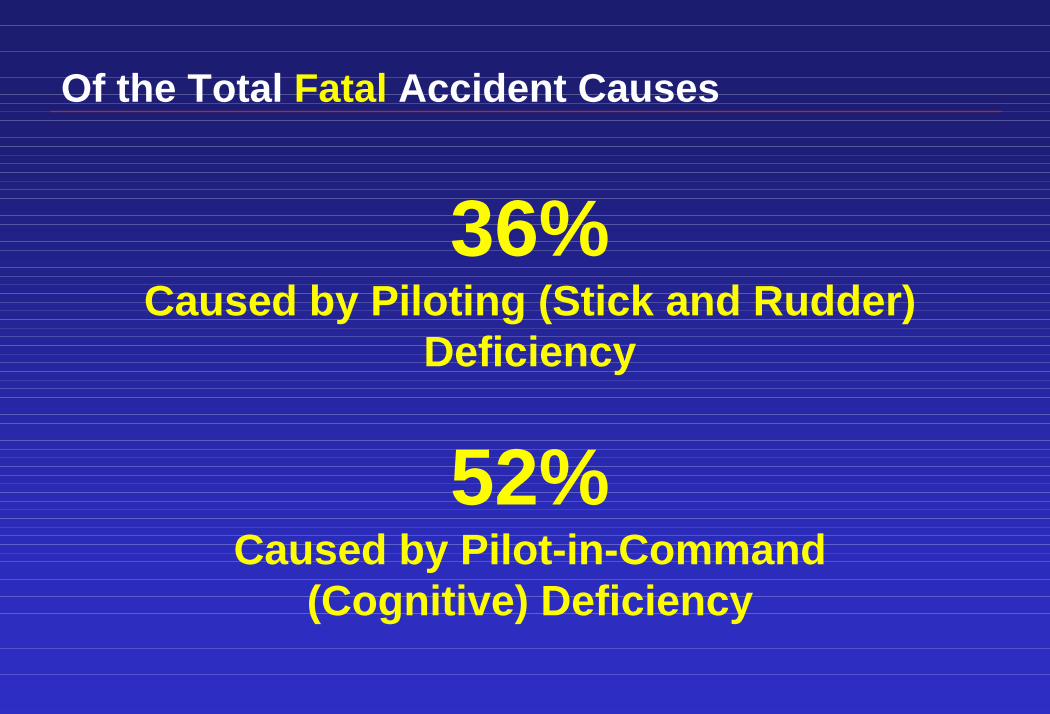
Of the Total Fatal Accident Causes
36%Caused by Piloting (Stick and Rudder)
Deficiency
52%Caused by Pilot-in-Command
(Cognitive) Deficiency
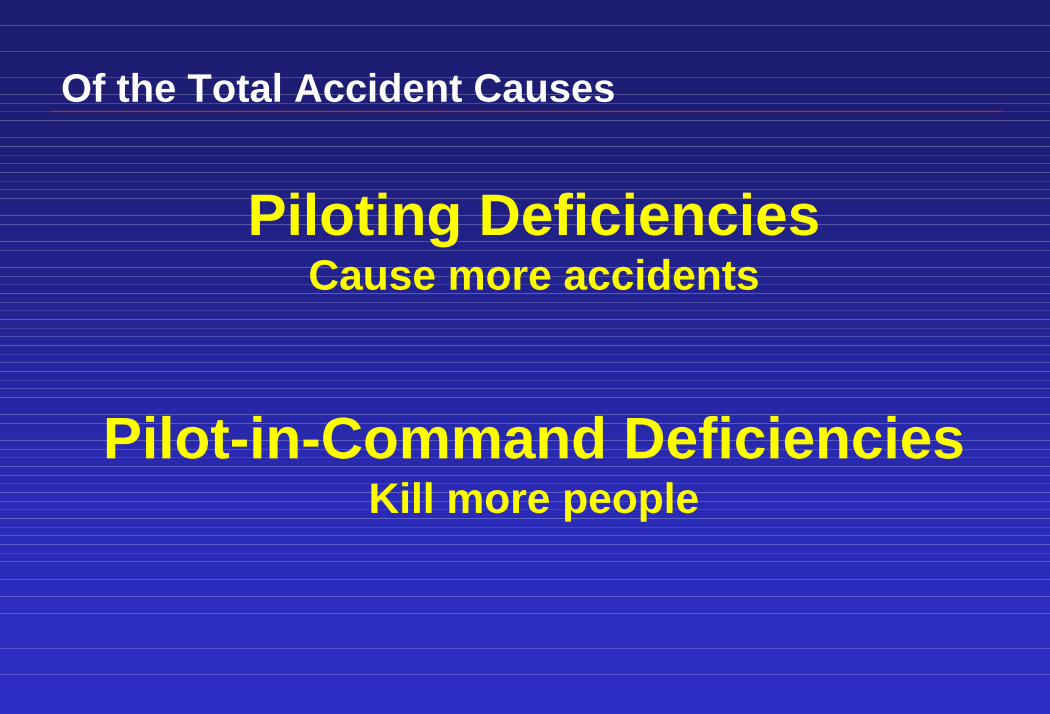
Of the Total Accident Causes
Piloting DeficienciesCause more accidents
Pilot-in-Command DeficienciesKill more people

Review
Of All Accident Causes
80% Pilot-Related Causes
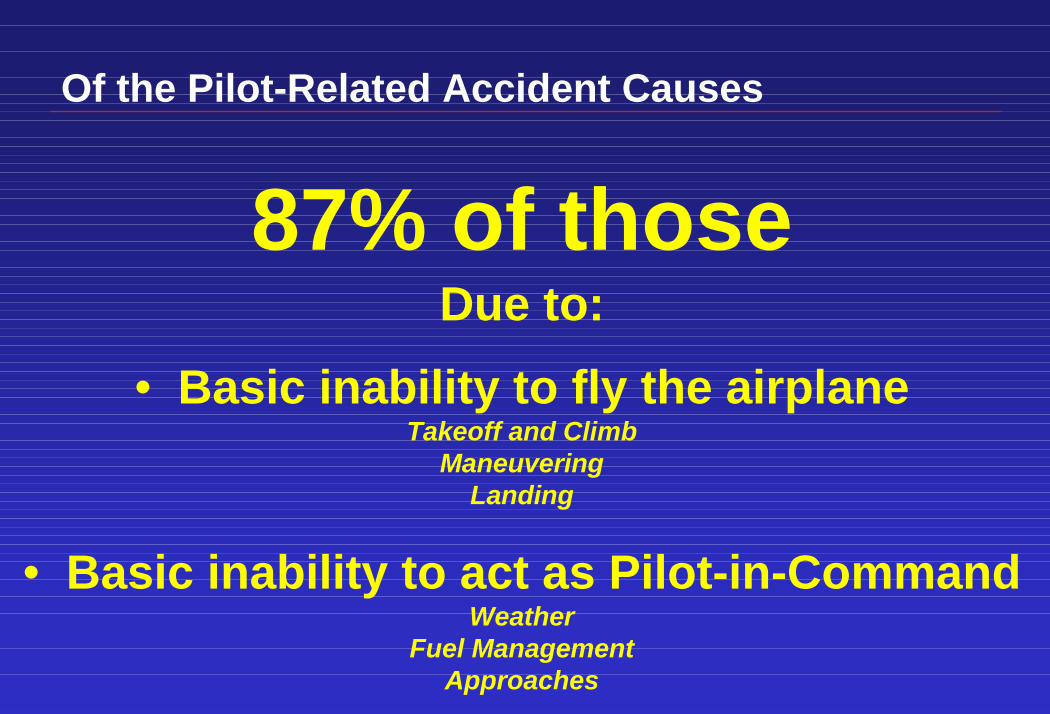
Of the Pilot-Related Accident Causes
87% of thoseDue to:
• Basic inability to fly the airplaneTakeoff and Climb
ManeuveringLanding
• Basic inability to act as Pilot-in-Command Weather
Fuel ManagementApproaches
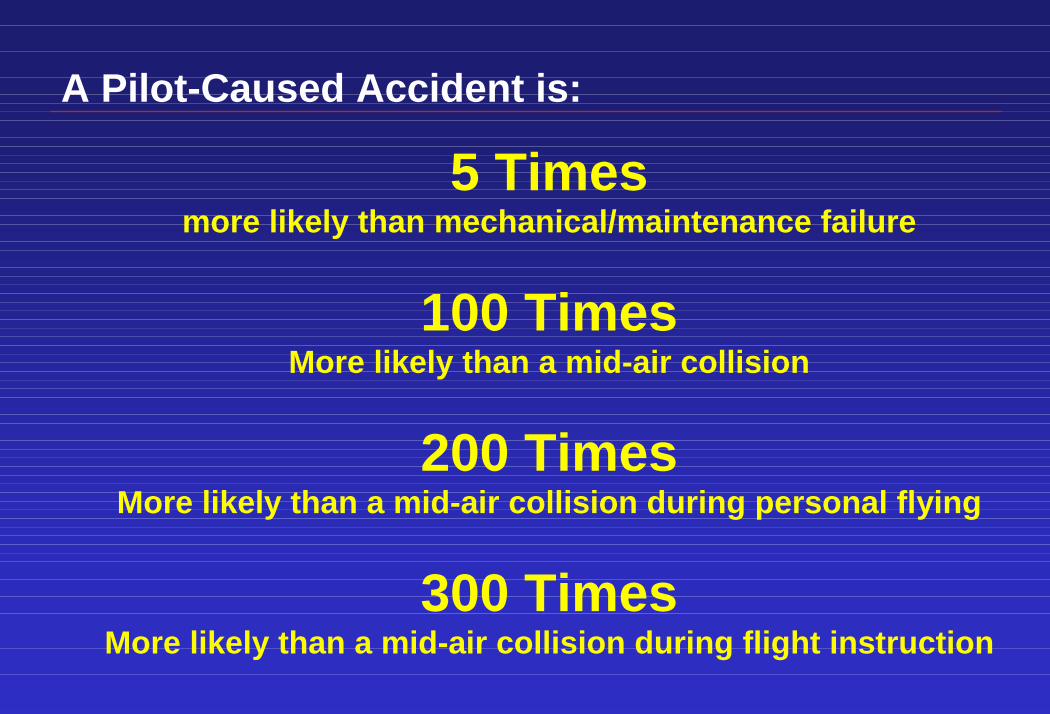
A Pilot-Caused Accident is:
5 Timesmore likely than mechanical/maintenance failure
100 TimesMore likely than a mid-air collision
200 TimesMore likely than a mid-air collision during personal flying
300 TimesMore likely than a mid-air collision during flight instruction

Of the Total Accident Causes
Piloting DeficienciesCause more accidents
Pilot-in-Command DeficienciesKill more people

Comparison with Air Carrier Operations
Comparison to Air Carrier
How does General Aviation compare to Air Carriers?
(A good yardstick - probably the best)
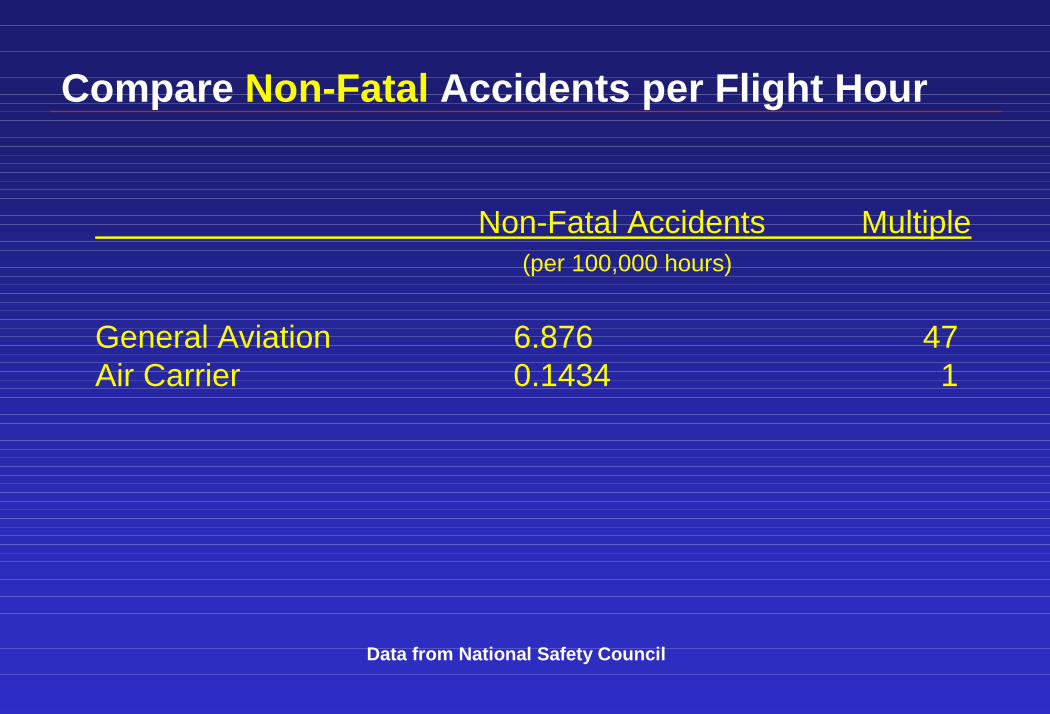
Compare Non-Fatal Accidents per Flight Hour
Non-Fatal Accidents Multiple(per 100,000 hours)
General Aviation 6.876 47Air Carrier 0.1434 1
Data from National Safety Council
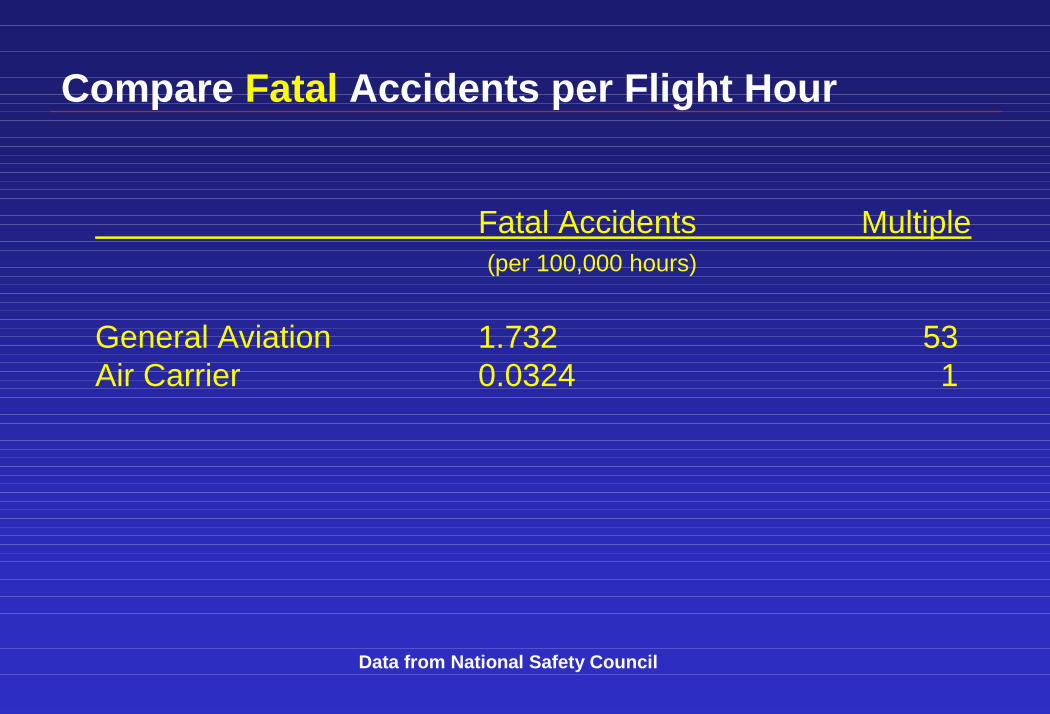
Compare Fatal Accidents per Flight Hour
Fatal Accidents Multiple(per 100,000 hours)
General Aviation 1.732 53Air Carrier 0.0324 1
Data from National Safety Council
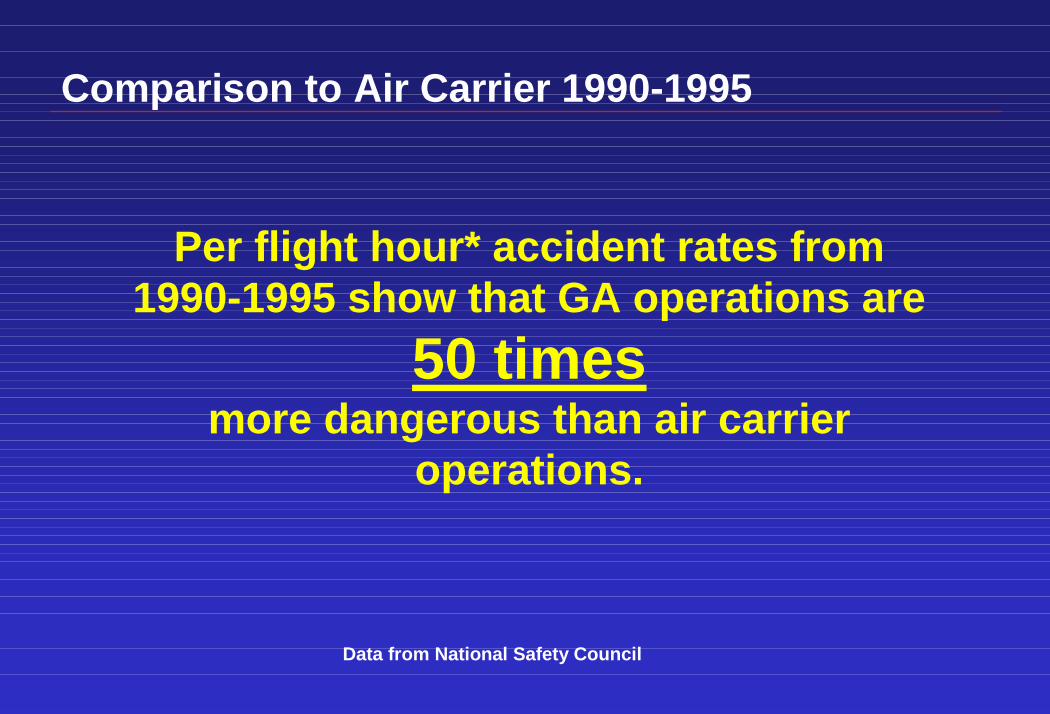
Comparison to Air Carrier 1990-1995
Per flight hour* accident rates from 1990-1995 show that GA operations are
50 timesmore dangerous than air carrier
operations.
Data from National Safety Council
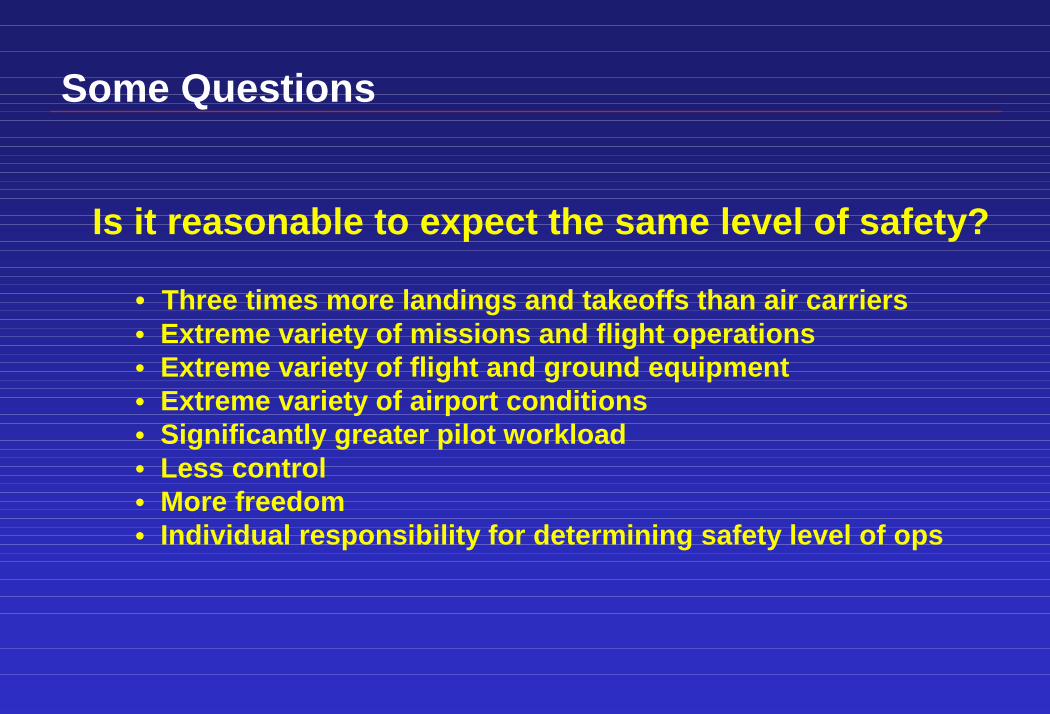
Some Questions
Is it reasonable to expect the same level of safety?
• Three times more landings and takeoffs than air carriers• Extreme variety of missions and flight operations• Extreme variety of flight and ground equipment • Extreme variety of airport conditions• Significantly greater pilot workload• Less control • More freedom• Individual responsibility for determining safety level of ops

Some Questions
Oh?What if you put the question to your passengers?
Question
Just how careful do GA pilots have to be to reduce the GA accident rate to
air carrier levels?
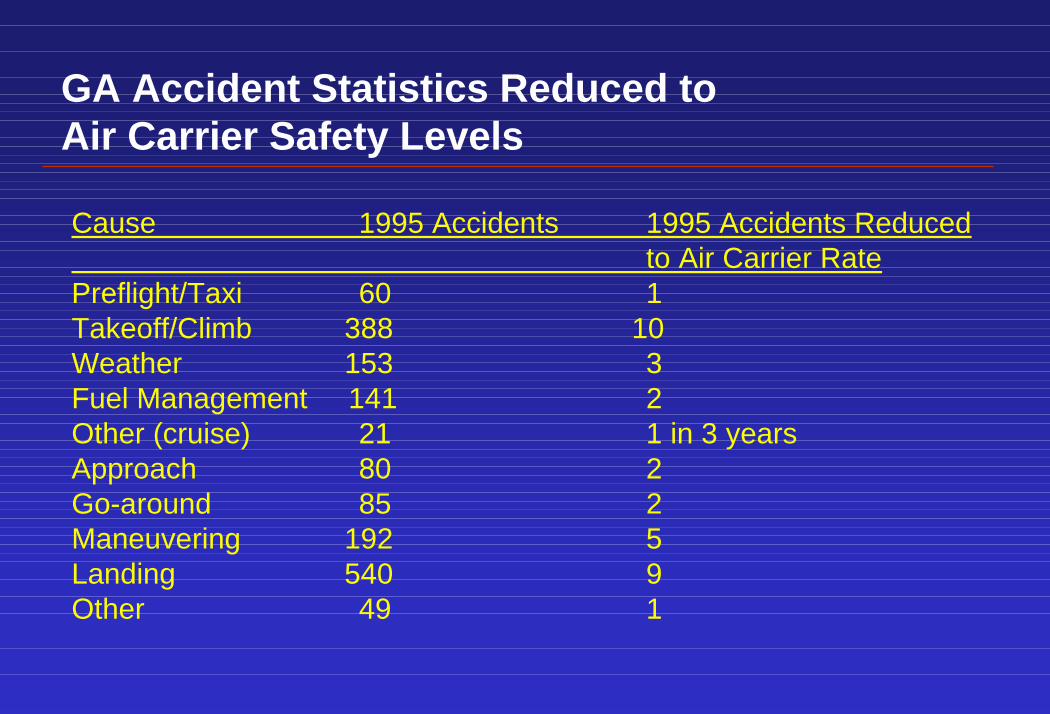
GA Accident Statistics Reduced to Air Carrier Safety Levels
Cause 1995 Accidents 1995 Accidents Reducedto Air Carrier Rate
Preflight/Taxi 60 1Takeoff/Climb 388 10Weather 153 3Fuel Management 141 2Other (cruise) 21 1 in 3 yearsApproach 80 2Go-around 85 2Maneuvering 192 5Landing 540 9Other 49 1
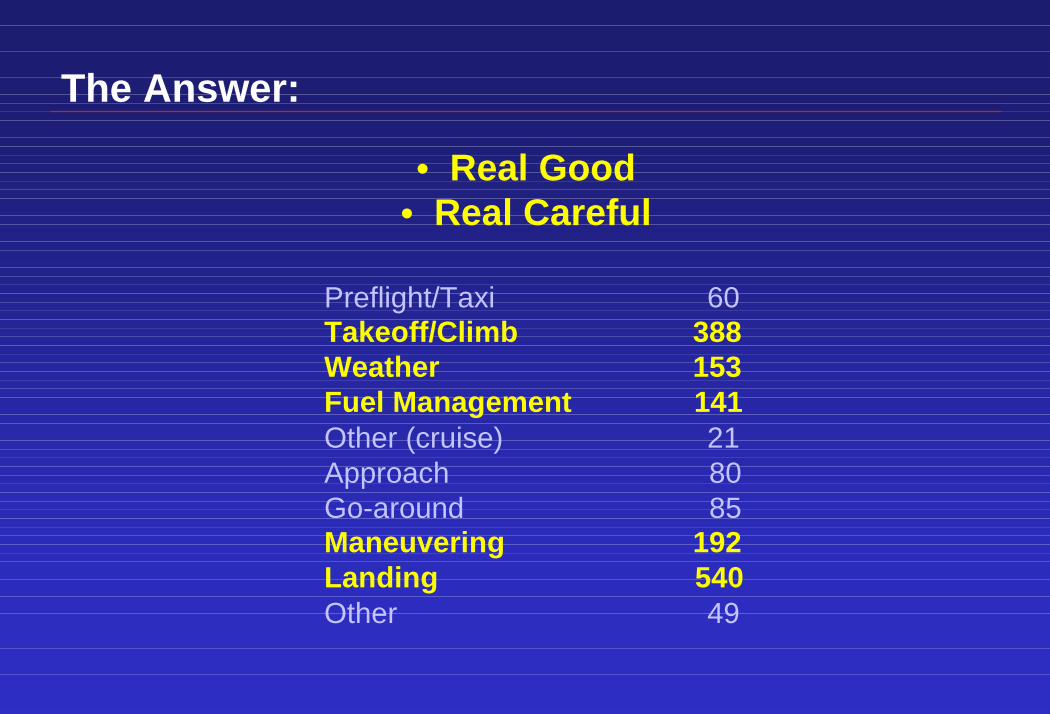
The Answer:
• Real Good• Real Careful
Preflight/Taxi 60Takeoff/Climb 388Weather 153Fuel Management 141Other (cruise) 21Approach 80Go-around 85Maneuvering 192Landing 540Other 49

Comparison with Motor Vehicle Operations
Data from National Safety Council
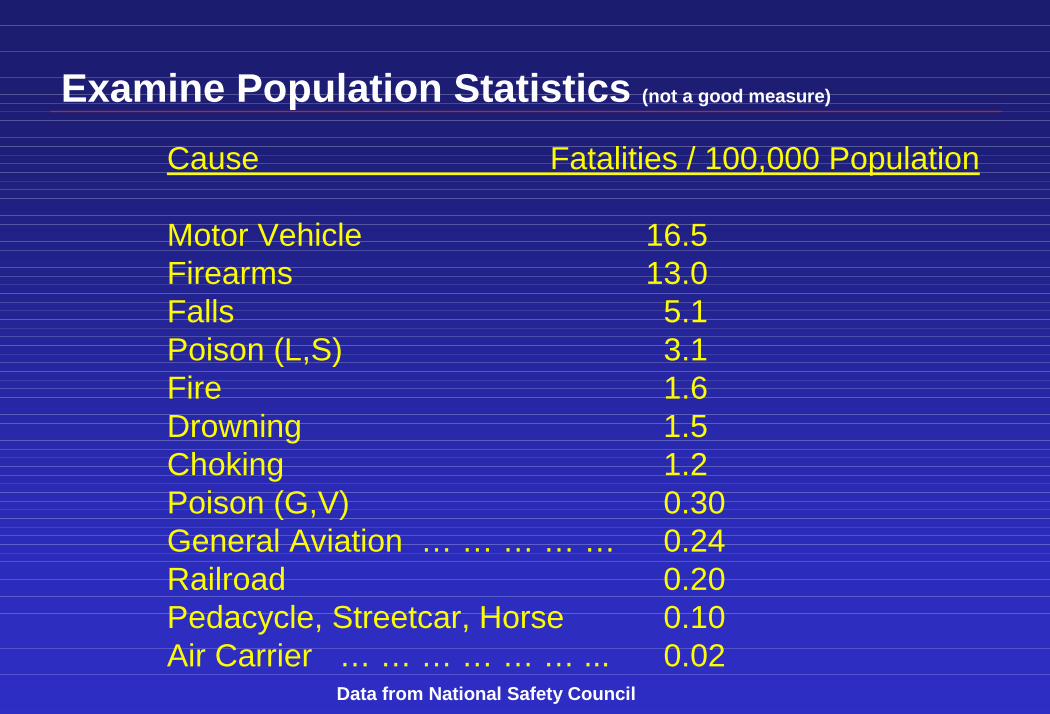
Examine Population Statistics (not a good measure)
Cause Fatalities / 100,000 Population
Motor Vehicle 16.5Firearms 13.0Falls 5.1Poison (L,S) 3.1Fire 1.6Drowning 1.5Choking 1.2Poison (G,V) 0.30General Aviation … … … … … 0.24Railroad 0.20Pedacycle, Streetcar, Horse 0.10Air Carrier … … … … … … ... 0.02
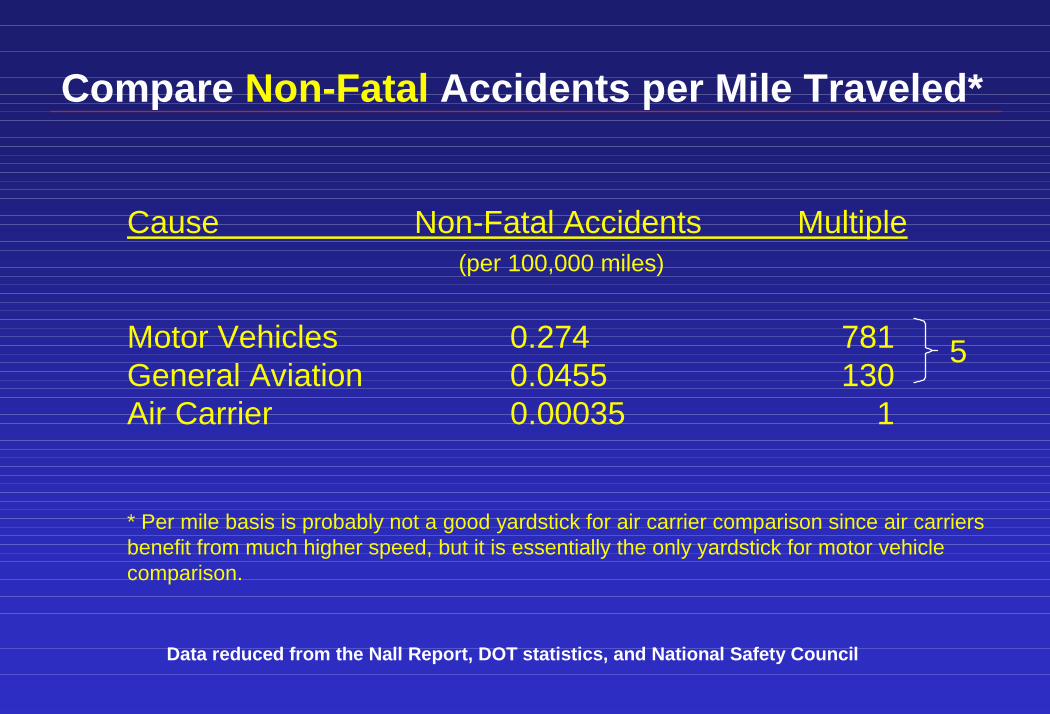
Compare Non-Fatal Accidents per Mile Traveled*
Cause Non-Fatal Accidents Multiple(per 100,000 miles)
Motor Vehicles 0.274 781General Aviation 0.0455 130Air Carrier 0.00035 1
* Per mile basis is probably not a good yardstick for air carrier comparison since air carriers benefit from much higher speed, but it is essentially the only yardstick for motor vehicle comparison.
Data reduced from the Nall Report, DOT statistics, and National Safety Council
5
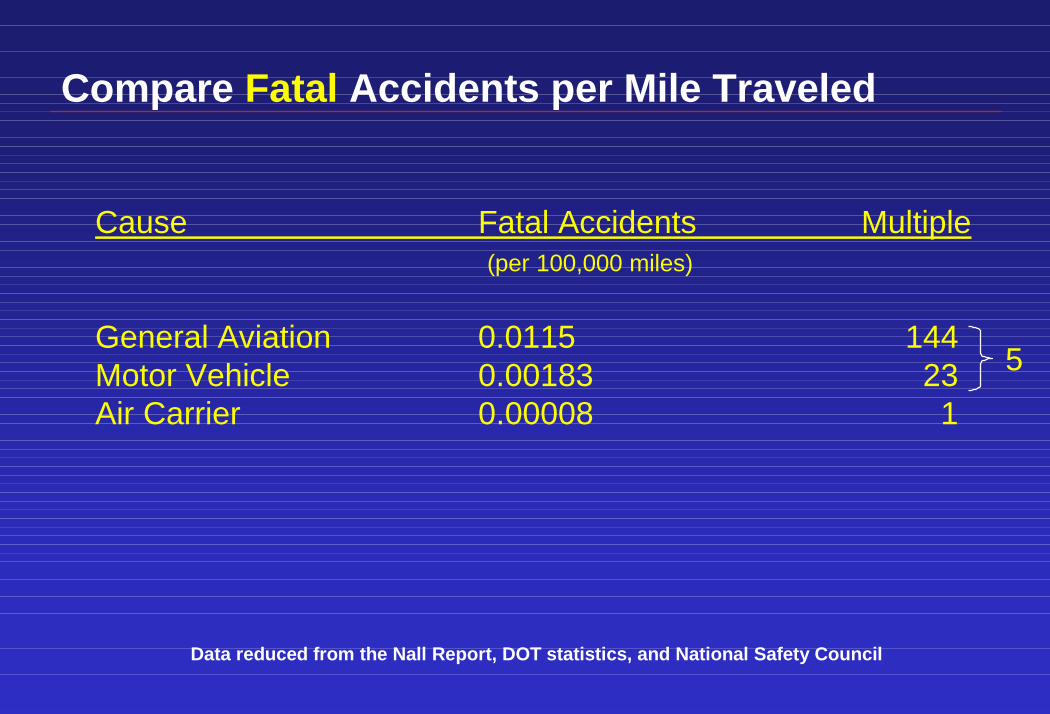
Compare Fatal Accidents per Mile Traveled
Cause Fatal Accidents Multiple(per 100,000 miles)
General Aviation 0.0115 144Motor Vehicle 0.00183 23Air Carrier 0.00008 1
Data reduced from the Nall Report, DOT statistics, and National Safety Council
5
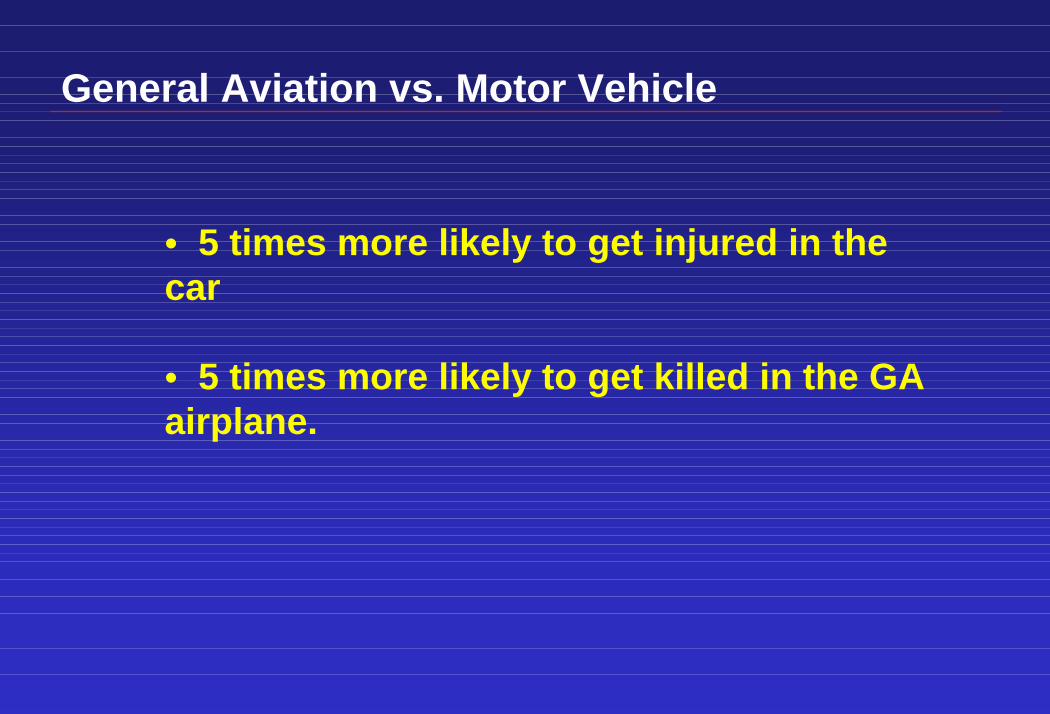
General Aviation vs. Motor Vehicle
• 5 times more likely to get injured in the car
• 5 times more likely to get killed in the GA airplane.
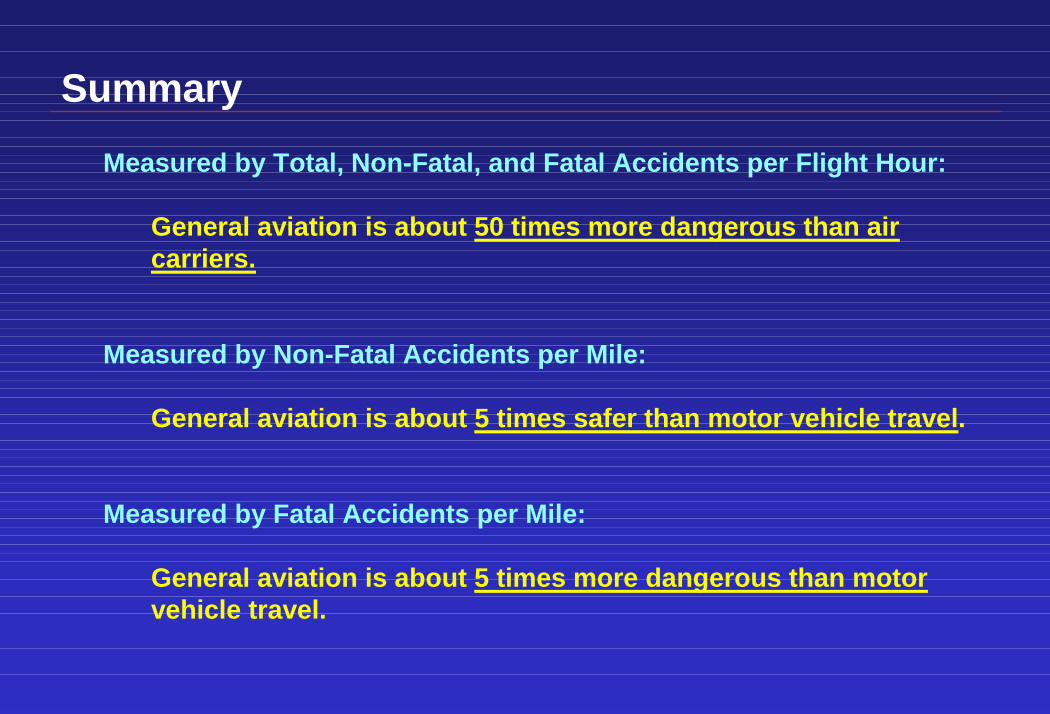
SummaryMeasured by Total, Non-Fatal, and Fatal Accidents per Flight Hour:
General aviation is about 50 times more dangerous than air carriers.
Measured by Non-Fatal Accidents per Mile:
General aviation is about 5 times safer than motor vehicle travel.
Measured by Fatal Accidents per Mile:
General aviation is about 5 times more dangerous than motorvehicle travel.
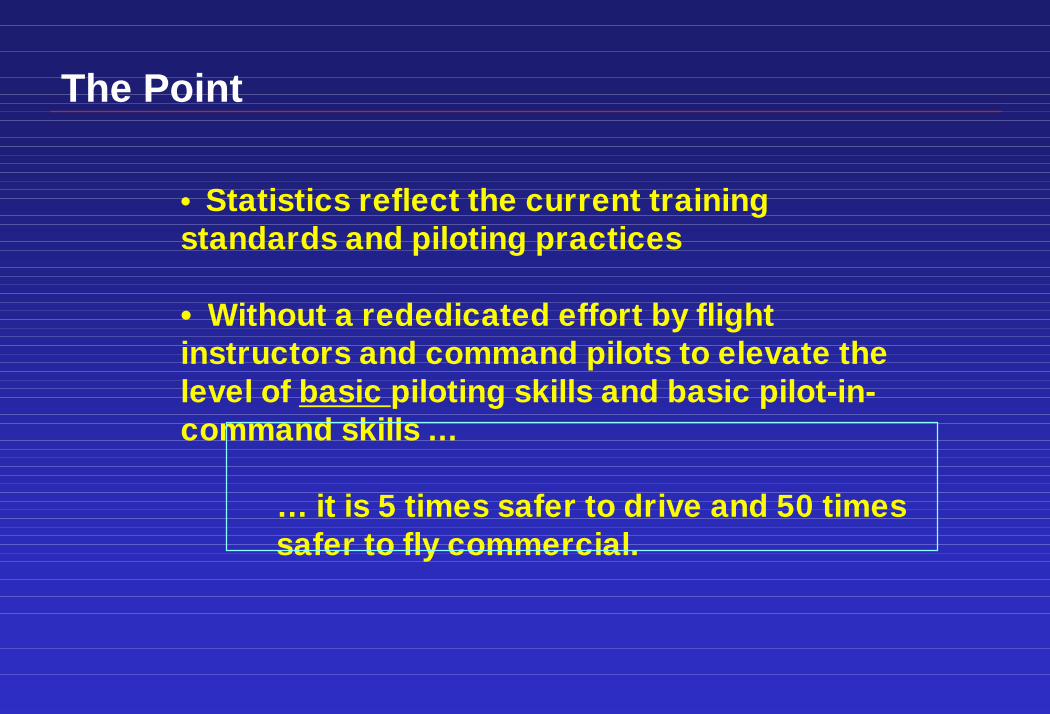
The Point
• Statistics reflect the current training standards and piloting practices
• Without a rededicated effort by flight instructors and command pilots to elevate the level of basic piloting skills and basic pilot-in-command skills ...
… it is 5 times safer to drive and 50 times safer to fly commercial.
Implications forGeneral Aviation Flight Instructors
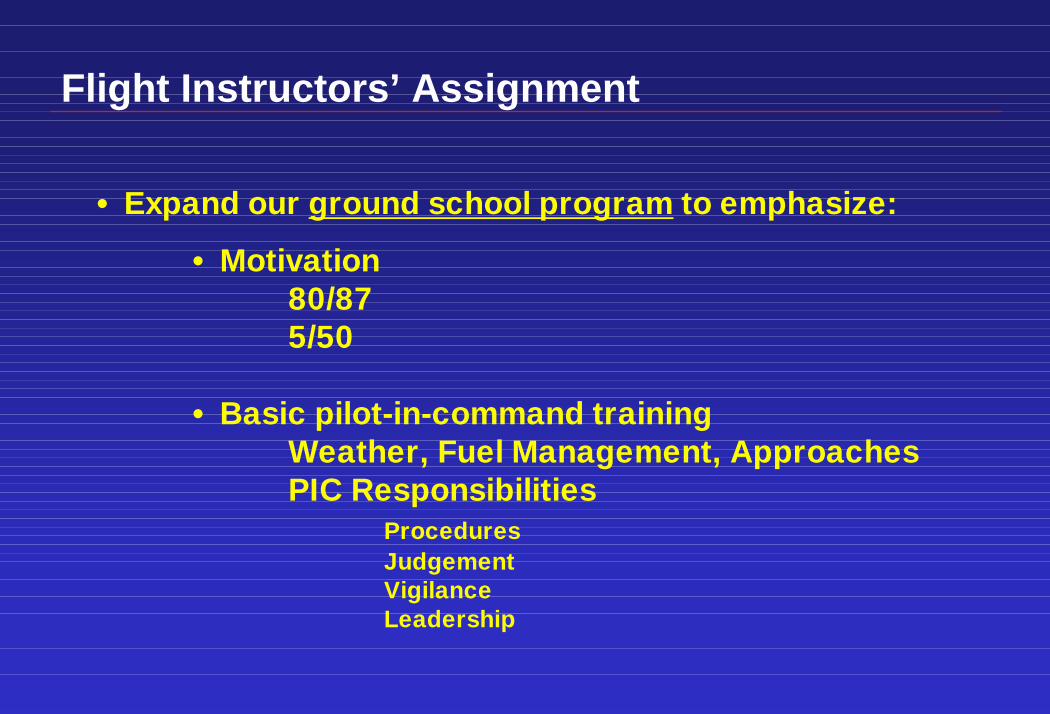
Flight Instructors’ Assignment
• Expand our ground school program to emphasize:
• Motivation80/875/50
• Basic pilot-in-command training Weather, Fuel Management, ApproachesPIC Responsibilities
ProceduresJudgementVigilanceLeadership
Flight Instructors’ Assignment
• Re-energize our flight training program to elevate our standards for:
• PerformanceHigher performance expectations for both
instructor and student
• Basic Airplane Handling Techniques Takeoff and climbManeuveringLanding
Basic Safety Statistics
We must teach “80/87”.
Basic Safety Statistics
That 80% of all accidents have pilot-related causes. That 87% of those are due to:
BASIC piloting deficiencies:Takeoff and ClimbManeuveringLanding
BASIC pilot-in-command deficiencies:WeatherFuel managementApproaches

Basic Safety Statistics
We must teach “5/50”.
Basic Safety Statistics
That without continuing effort by the command pilot to elevate his piloting skills and pilot-in-command procedures, it is 5 times safer to drive and 50 times safer to fly commercial.
That if they cannot generate the discipline to be the command pilot of a passenger carrying airplane, they are better off on the ground or with a recreational pilot’s license.