Embed Size (px)
Citation preview
Gene Regulatory Networks and
Neurodegenerative Diseases
Anne Chiaramello, Ph.D
Associate Professor
George Washington University Medical Center
Department of Anatomy and Cell Biology
Tel: 202-994-2173
NIH/NINDS R01NS041391
McCormick Pilot Grant
January 24, 2007

Long-Term Medical Applications of our Research Programs
• Correlation between Altered Gene Expression and Susceptibility for Specific Neurodegenerative Diseases
• Genetic Manipulation of Neural Stem/Progenitor Cells to Promote Specific Neuronal Identity and Survival upon Transplantation
Overall Strategy
• To dissect NeuroD6-Mediated gene regulatory networks responsible for Initiation/ Maintenance of differentiation, and neuronal survival.
• To Identify Dysregulation of Neuronal-Specific Genes Associated with Neurodegenerative Disorders.
Transcription-DependentNeuronal Differentiation
Undifferentiated Neural Progenitor Cells Differentiated
Neurons

Flowchart to Analyze NeuroD6-Mediated Neuronal Differentiation/Survival
GeneChip Affymetrix Microarray
Functional Analysis ofNeuroD6 Target Genes
Promoter Analysisof NeuroD6 Target Genes
Identification ofRegulatory Elementsand Associated SNPs
Silencing of Target
Genes(siRNA)
Flow Cytometry/Cell Death Assays
Constructing NeuroD6-mediated
Transcriptional RegulatoryNetwork
Ab Initio and Experimental Approaches
Correlation between Altered Gene Expressionand Susceptibility for
Neurodegenerative Diseases
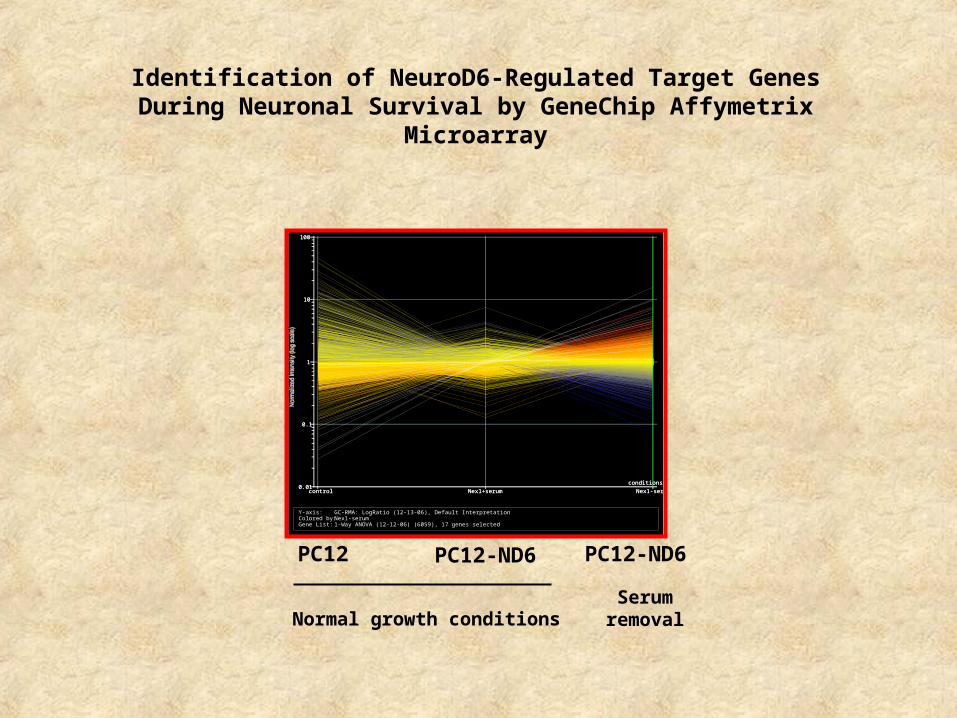
Identification of NeuroD6-Regulated Target Genes During Neuronal Survival by GeneChip Affymetrix
Microarray
Y-axis: GC-RMA: LogRatio (12-13-06), Default InterpretationColored by: Nex1-serumGene List: 1-Way ANOVA (12-12-06) (6059), 17 genes selected
control Nex1+serum Nex1-serum
conditions0.01
0.1
1
10
100
control Nex1+serum Nex1-serum
conditions0.01
0.1
1
10
100
PC12 PC12-ND6
SerumremovalNormal growth conditions
PC12-ND6

1-Microarray analysis does not directly reveal the regulatory networks that underliethe observed transcriptional module mediated by NeuroD6. Combining promoter analysis with microarray results can shed light on NeuroD6-regulated networks2-A promoter is defined as a functional region immediately upstream and downstream of a Transcriptional start site (TSS) that is ultimately involved in the regulation of transcription.
3-The putative TSS for 17,702 transcripts corresponding to 13,300 genes have been annotated. Given a correct estimate of ~25,000 human genes, promoters for a majority of genes in the human genome remain to be fully defined.4-Furthermore, transcriptional regulation of most genes originates from at least two distinct promoters,located in different non-coding exons, with the upstream promoter most of the time unknown.
Computational Approaches to Identify the Underlying Transcriptional Network
of Gene Expression from Microarray Analysis.
Core Promoter (-250/+150 bp)
Enhancers Proximal Promoter (5’UTR)TSS
DPEInr+1
TATA
-2000 bp +28-32 bp-35-25 bp

Ab Initio Methods to Predict Promoter Structure
•Database of Transcription Start site (db TSS)
•Cold Spring Harbor Laboratories Mammalian promoter
Database
•Genome Browser: UCSC, ENSEMBL, NCBI
•Cap Analysis of Gene Expression (Riken, CAGE Data)
•Promoter Predictions Algorithms
•GRAIL Exp v3.3 (Gene Recognition and Analysis Internet
work)•Promo H Algorithm•Promoter Inspector•Dragon Promoter Finder•De novo FIRST EF ( First Exon-Finding)
•CpG Island (NCBI Map Viewer)
•Phylogenic Footprinting Analysis: multi-species sequenced
conservation
(ClustalW and Genome Browsers UCSC, ENSEMBL, NCBI)Experimental Approaches for Promoter Identification
•5’RACE•Primer Extension•Luciferase Reporter-Promoter Assay

Phylogenetic Analysis of the NeuroD6 Promoter
UCSC Genome Browser
P2P1
SNPs

Prediction of Transcription Factor Binding Sites (TFBS)
•To reduce false positives, focus on:• binding sites conserved among conserved species identified by several algorithms.•Position Weight Matrix comparison•Module Searcher
Experimental Verification of TFBS
•DNaseI Footprinting Analysis/EMSA•ChIp•Site-direct mutagenesis/reporter-promoter assay.
•TRANSFAC•JASPAR•rVista
•Huge numbers of false positive
6 Sp1 sites
-1800 +1
E5Hes1Ets2Ets1Hes1MEF2E6E7 C/EBPCdx1 Cdx1
AP1
Sp1E4 E3 E2 E1Hes1Ets2
MEF2
Ets1
HoxD NFB
* * * * ** * * ***
-1453 -750


![Gene suppression approaches to neurodegeneration · therapy that is currently in progress [1]. Huntington’s disease is an autosomal dominant, neurodegenerative condition caused](https://img.pdfslide.us/doc/110x75/60fbca7cf0dc585acd09e5a5/gene-suppression-approaches-to-neurodegeneration-therapy-that-is-currently-in-progress.jpg)