Embed Size (px)
Citation preview
RESEARCH ARTICLE SUMMARY◥
GENE REGULATION
Lineage-specific enhancers activateself-renewal genes in macrophagesand embryonic stem cellsErinn L. Soucie,*† ZimingWeng,† Laufey Geirsdóttir,† Kaaweh Molawi,† Julien Maurizio,Romain Fenouil, Noushine Mossadegh-Keller, Gregory Gimenez, Laurent VanHille,Meryam Beniazza, Jeremy Favret, Carole Berruyer, Pierre Perrin, Nir Hacohen,J.-C. Andrau, Pierre Ferrier, Patrice Dubreuil, Arend Sidow,*Michael H. Sieweke*
INTRODUCTION: Inmany organs of the body,differentiated cells are frequently lost and needto be replaced as part of normal homeostatictissue maintenance or in response to injury. Inmost cases, this regeneration is assured by dif-ferentiation from tissue-specific stem cells.Together with a few other cell types, tissuemacrophages represent a rare exception tothis pathway, as they can be maintained in-dependently of blood stem cells by local pro-liferation. Under certain conditions, maturemacrophages can also be expanded and main-tained long term in culture without transforma-tion or loss of differentiation status. The generegulatory mechanisms that allow such dif-ferentiated cells to self-renewwhilemaintaining
cell type–specific identity have so far remainedunknown. Self-renewingmacrophages provide arare opportunity to study this question.
RATIONALE:Molecularly, cell identity can bedefined by the genomic positions of gene regu-latory enhancer elements. The cell type–specificsignatures and activity status of such elementshave been characterized by the analysis of spe-cific histone modifications and the binding ofregulatory proteins. To identify the regulatorymechanisms that enablemacrophage self-renewalcapacity to be integrated into the overall programof epigeneticmacrophage identity, we have com-pared the enhancer repertoires of quiescent andself-renewing macrophages. Based on our previ-
ous observations that deletion of MafB andc-Maf transcription factors results in an ex-tended self-renewal capacity of macrophages,we further investigated how the absence of Maftranscription factors affects the enhancers of spe-cific self-renewal genes and how these mecha-nisms activate macrophage self-renewal underhomeostatic and challenge conditions in vivo.
RESULTS: Compared toquiescentmacrophages,self-renewing macrophages showed no apprecia-ble difference with respect to genome-wideenhancer positions but displayed an increasein the activation status of many enhancersthat were also bound by the lineage-specifyingtranscription factor PU.1 in both cell types.This finding suggests that these poised macro-phage-specific enhancers became active in self-renewing macrophages. We found activated
enhancers to be associatedwith a network of genes,centered onMyc and Klf2,thatwereup-regulatedandfunctionally important forself-renewal in these cells.The same genes were also
required for embryonic stem (ES) cell self-renewal but were associated with a distinct,ES cell–specific set of enhancers. We observedthat activated self-renewal–associated macro-phage enhancers were directly repressed byMafB binding. The loss of MafB and c-Mafexpression relieved this repression and led toactivation of the self-renewal gene network inMafB and cMaf knockout macrophages, as wellas in alveolar macrophages that express consti-tutively low levels of these transcription factors.In vivo single-cell analysis further revealed that,both in the steady state and in response to im-mune stimulation, proliferating resident macro-phages could access this network by transientdown-regulation of Maf transcription factors.
CONCLUSION: Our results demonstrate thatself-renewal in macrophages involves down-regulation of MafB and cMaf, as well as con-comitant activation of a self-renewal genenetwork shared with ES cells but controlledfrom cell type–specific enhancers. Macrophageenhancers associated with self-renewal genesare already present in quiescent cells and canbecome activated when direct repression byMaf transcription factors is relieved. Our find-ings provide a general molecular rationale forthe compatibility of self-renewal and differ-entiated cell functions and may also be moregenerally relevant for the direct activation ofself-renewal activity in other differentiated celltypes with therapeutic potential.▪
RESEARCH
680 12 FEBRUARY 2016 • VOL 351 ISSUE 6274 sciencemag.org SCIENCE
The list of author affiliations is available in the full article online.*Corresponding author. E-mail: [email protected] (M.H.S.);[email protected] (E.L.S.); [email protected] (A.S.)†These authors contributed equally to this work.Cite this article as E. L. Soucie et al., Science 351, aad5510(2016). DOI: 10.1126/science.aad5510
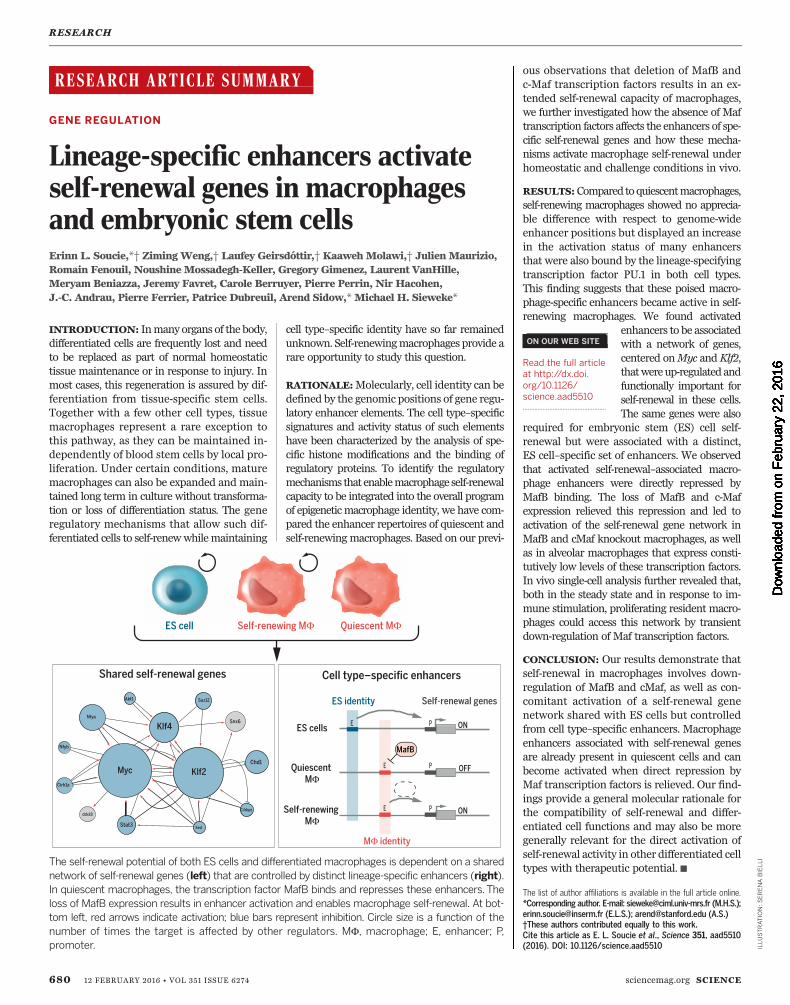
The self-renewal potential of both ES cells and differentiated macrophages is dependent on a sharednetwork of self-renewal genes (left) that are controlled by distinct lineage-specific enhancers (right).In quiescent macrophages, the transcription factor MafB binds and represses these enhancers. Theloss of MafB expression results in enhancer activation and enables macrophage self-renewal. At bot-tom left, red arrows indicate activation; blue bars represent inhibition. Circle size is a function of thenumber of times the target is affected by other regulators. MF, macrophage; E, enhancer; P,promoter.
ON OUR WEB SITE◥
Read the full articleat http://dx.doi.org/10.1126/science.aad5510..................................................
ILLU
STRATIO
N:SERENA
BIELLI
on F
ebru
ary
22, 2
016
Dow
nloa
ded
from
on
Feb
ruar
y 22
, 201
6D
ownl
oade
d fr
om o
n F
ebru
ary
22, 2
016
Dow
nloa
ded
from
on
Feb
ruar
y 22
, 201
6D
ownl
oade
d fr
om o
n F
ebru
ary
22, 2
016
Dow
nloa
ded
from
on
Feb
ruar
y 22
, 201
6D
ownl
oade
d fr
om o
n F
ebru
ary
22, 2
016
Dow
nloa
ded
from
on
Feb
ruar
y 22
, 201
6D
ownl
oade
d fr
om o
n F
ebru
ary
22, 2
016
Dow
nloa
ded
from
on
Feb
ruar
y 22
, 201
6D
ownl
oade
d fr
om o
n F
ebru
ary
22, 2
016
Dow
nloa
ded
from
on
Feb
ruar
y 22
, 201
6D
ownl
oade
d fr
om o
n F
ebru
ary
22, 2
016
Dow
nloa
ded
from
on
Feb
ruar
y 22
, 201
6D
ownl
oade
d fr
om
RESEARCH ARTICLE◥
GENE REGULATION
Lineage-specific enhancers activateself-renewal genes in macrophagesand embryonic stem cellsErinn L. Soucie,1,2,3,4*† ZimingWeng,5† Laufey Geirsdóttir,1,2,3†KaawehMolawi,1,2,3,6†JulienMaurizio,1,2,3 Romain Fenouil,1,2,3 NoushineMossadegh-Keller,1,2,3 Gregory Gimenez,1,2,3
Laurent VanHille,1,2,3 Meryam Beniazza,1,2,3 Jeremy Favret,1,2,3 Carole Berruyer,1,2,3
Pierre Perrin,1,2,3 Nir Hacohen,7 J.-C. Andrau,1,2,3,8 Pierre Ferrier,1,2,3 Patrice Dubreuil,4
Arend Sidow,5,9*Michael H. Sieweke1,2,3,6*
Differentiated macrophages can self-renew in tissues and expand long term in culture, but thegene regulatory mechanisms that accomplish self-renewal in the differentiated state haveremainedunknown.Hereweshow that inmice, the transcription factorsMafBandc-Maf repress amacrophage-specific enhancer repertoire associated with a gene network that controls self-renewal. Single-cell analysis revealed that, in vivo, proliferating resident macrophages can accessthis network by transient down-regulation of Maf transcription factors.The network also controlsembryonic stem cell self-renewal but is associated with distinct embryonic stem cell–specificenhancers.This indicates that distinct lineage-specific enhancer platforms regulate a sharednetwork of genes that control self-renewal potential in both stem and mature cells.
In many tissues of the body, differentiatedcells are frequently replaced as part of homeo-static maintenance or in response to injury.Whereas inmost cases this depends on tissue-specific stem cells, tissue macrophages can be
maintained by local proliferation independentlyof hematopoietic stem cells (1–4), possibly by self-renewal mechanisms activated in mature macro-phages (5).Unlike the fewexamplesofdifferentiatednormal cells that can transiently reenter the cellcycle, such as hepatocytes, macrophages can alsobe expanded andmaintained in long-term culturewithout transformation or loss of differentiation.This has been observed in macrophages with de-letions of two core macrophage transcription fac-tors (6)—MafB and c-Maf [Maf double-knockout(Maf-DKO)macrophages] (7)—or in cultures derivedfrom fetal progenitors (8).Understanding how regulatory programs are
rewired to allow differentiated cells to self-renewis of considerable interest, and self-renewingmac-
rophages present a rare opportunity to study thisprocess. Genome-wide distribution of enhancer-associated histone modifications provides a reli-able signature of cell identity (9–14) that hasrevealed macrophage-specific enhancer reper-toires (11, 12) and tissue- or activation-state–dependent modifications (15–17). To identify theregulatory mechanism that enables macrophageself-renewal capacity to be integrated into theoverall program of epigenetic macrophage iden-tity, we therefore compared the enhancer reper-toires of quiescent and self-renewingmacrophages.
Absence of lineage-independentself-renewal enhancers
Todeterminewhether self-renewal inmacrophagesinvolves acquisition of dedicated, self-renewal–specific enhancers,we first compared themolecularenhancer signature defined by monomethylatedhistoneH3 at lysine 4 (H3K4m1) (9, 13, 14) of self-renewingMaf-DKO and quiescent wild-type (WT)bone marrow macrophages (BMMs) to severalother cell types with limited proliferation or ex-tended self-renewal capacity (fig. S1). Surprisingly,our analysis revealed no common, lineage-independent repertoire of shared enhancer posi-tions for the control of proliferation or self-renewalgenes (fig. S1, A andB).We also compared genome-wide binding of the transcription factor PU.1, akey regulator of both macrophage and B cell line-age identity that defines distinct enhancer posi-tions in the genome of these two cell types (10–12).This revealed fewer differences in the positionof H3K4m1+/PU.1+ enhancer peaks betweenMaf-DKOandWTBMMs thanbetweenWTBMMsandperitoneal macrophages (PMs), as well as an
equal distance of all macrophage populations topro-B cells (fig. S1C). This indicates that Maf-DKOmacrophages can activate self-renewal butretain a macrophage-specific enhancer signaturesimilar to that of WT BMMs. Thus, macrophageself-renewal does not appear to involve the ac-quisition of dedicated, lineage-independentself-renewal enhancers or the loss of maturemacrophage epigenetic identity.
Activation of a lineage-specific subset ofenhancers in self-renewing macrophages
Because self-renewing Maf-DKO macrophagesshowed no appreciable difference compared toquiescent macrophages with respect to genome-wide enhancer positions, we performed chroma-tin immunoprecipitation sequencing (ChIP-seq)analyses for activated enhancer marks; histoneacetyl transferase p300; and the histone modifi-cation mediated by this enzyme, acetylation ofH3K27 (H3K27ac) (13, 17–19), to determinewheth-er the activation status of these enhancers dif-fered.We found that a large number of enhancerswere activated specifically in Maf-DKO macro-phages only (Maf-DKO-only) (Fig. 1A, red high-light), whereas a small number of enhancers wereactivated specifically in WT BMMs. Specifically,we calculated 7323 enhancer regions to be en-riched for p300 binding and 7489 enriched forH3K27ac inMaf-DKOmacrophages compared toWT BMMs, whereas only 305 regions were en-riched for p300 and 1923 for H3K27ac in WTBMMs compared with Maf-DKO macrophages(Fig. 1B and fig. S2). Further characterizationof Maf-DKO-only regions revealed a typicalH3K4m1+/H3K4m3low enhancer signature atthese loci (Fig. 1, A and C), and motif searchanalysis of the p300- and H3K27ac-enrichedMaf-DKO-only enhancer regions revealed thehighest score for PU.1 binding motifs (log P =6444) (fig. S3A). Aggregate analysis of all PU.1-bound sites in Maf-DKO and WT macrophagesconfirmed that the large majority of DKO-onlyenhancers was bound by PU.1 (Fig. 1, B and C,and fig. S3B) and that more than 60% of thesepositions were also bound by PU.1 in WT mac-rophages (Fig. 1, B and C, and fig. S3B). ThisPU.1 binding pattern is reminiscent of “poised”and “latent” enhancers previously described innonstimulated and stimulated macrophages,respectively (17). Taken together, macrophagesappear to possess a specific subset of largelypoised macrophage-specific enhancers that isselectively activated in self-renewing Maf-DKOmacrophages.
Self-renewing macrophages activate agene set also required for embryonicstem cell self-renewal
Under steady-state conditions, self-renewingMaf-DKO and WT BM macrophages have highly sim-ilar global gene expression profiles (7). However, itis possible that the global analysis hides relevantspecific mechanisms, so we specifically selectedthe genes associatedwithMaf-DKO-only–activatedenhancers for further study, using the GenomicRegions Enrichment of Annotations Tool (GREAT)
RESEARCH
SCIENCE sciencemag.org 12 FEBRUARY 2016 • VOL 351 ISSUE 6274 aad5510-1
1Centre d’Immunologie de Marseille-Luminy, UniversitéAix-Marseille, UM2, Campus de Luminy, Case 906, 13288Marseille Cedex 09, France. 2INSERM, U1104, Marseille, France.3CNRS, UMR 7280, Marseille, France. 4Centre de Recherche enCancerologie de Marseille, INSERM (U1068), CNRS (U7258),Université Aix-Marseille (UM105), Marseille, France. 5Departmentof Pathology, Stanford University, Stanford, CA 94305-5324,USA. 6Max-Delbrück-Centrum für Molekulare Medizin in derHelmholtz-Gemeinschaft, 10 Robert-Rössle-Strasse, 13125Berlin, Germany. 7Broad Institute of Harvard University and MIT,Cambridge, MA 02142, USA. 8Institut de Génétique Moléculairede Montpellier, CNRS UMR 5535, 1919 Route de Mende, 34293Montpellier, France. 9Department of Genetics, StanfordUniversity, Stanford, CA 94305, USA.*Corresponding author. E-mail: [email protected](M.H.S.); [email protected] (E.L.S.); [email protected](A.S.) †These authors contributed equally to this work.
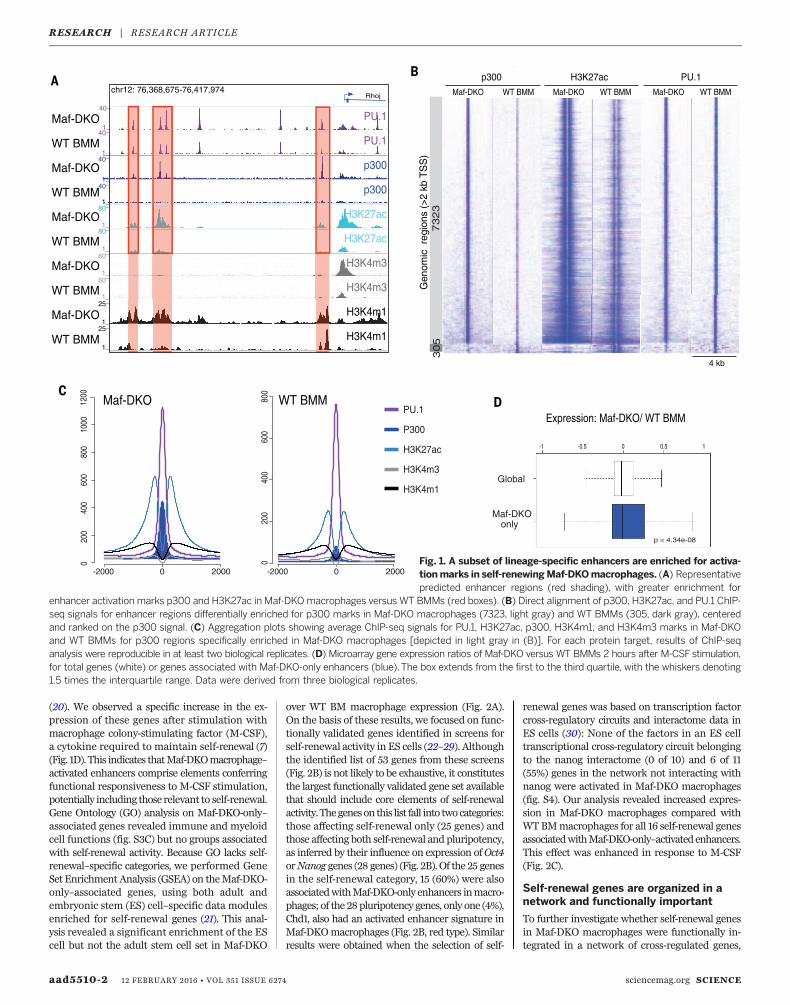
(20). We observed a specific increase in the ex-pression of these genes after stimulation withmacrophage colony-stimulating factor (M-CSF),a cytokine required to maintain self-renewal (7)(Fig. 1D). This indicates thatMaf-DKOmacrophage–activated enhancers comprise elements conferringfunctional responsiveness to M-CSF stimulation,potentially including those relevant to self-renewal.Gene Ontology (GO) analysis on Maf-DKO-only–associated genes revealed immune and myeloidcell functions (fig. S3C) but no groups associatedwith self-renewal activity. Because GO lacks self-renewal–specific categories, we performed GeneSet Enrichment Analysis (GSEA) on theMaf-DKO-only–associated genes, using both adult andembryonic stem (ES) cell–specific data modulesenriched for self-renewal genes (21). This anal-ysis revealed a significant enrichment of the EScell but not the adult stem cell set in Maf-DKO
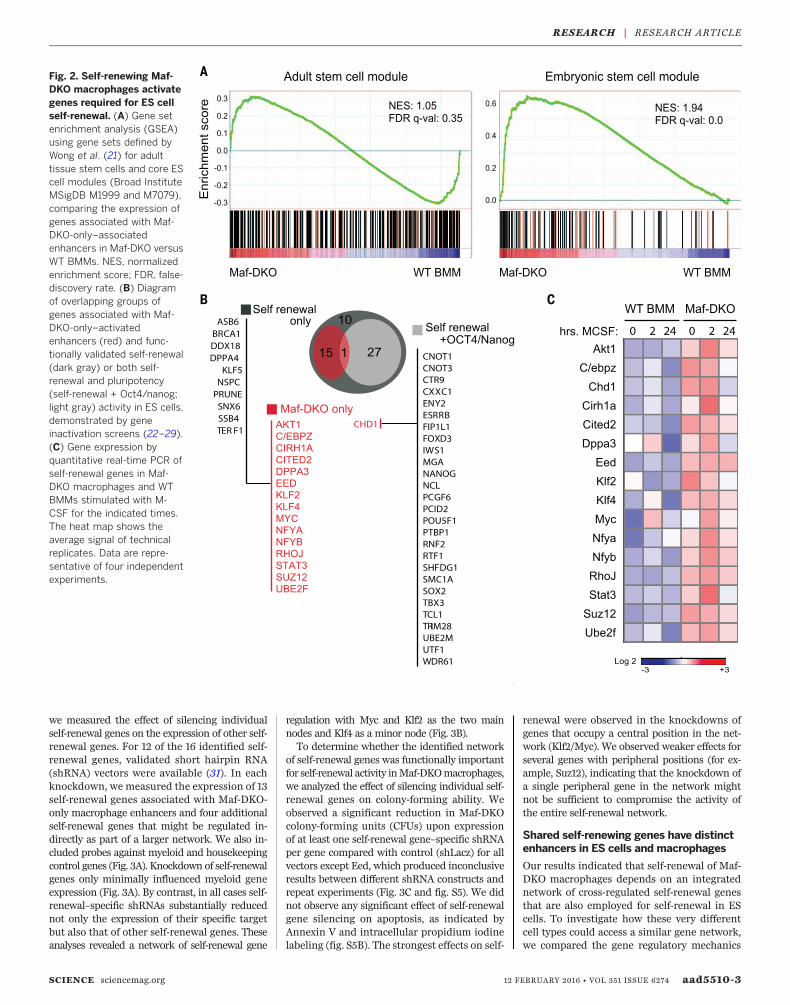
over WT BM macrophage expression (Fig. 2A).On the basis of these results, we focused on func-tionally validated genes identified in screens forself-renewal activity in ES cells (22–29). Althoughthe identified list of 53 genes from these screens(Fig. 2B) is not likely to be exhaustive, it constitutesthe largest functionally validated gene set availablethat should include core elements of self-renewalactivity.Thegeneson this list fall into twocategories:those affecting self-renewal only (25 genes) andthose affecting both self-renewal and pluripotency,as inferred by their influence on expression ofOct4orNanog genes (28 genes) (Fig. 2B). Of the 25 genesin the self-renewal category, 15 (60%) were alsoassociatedwithMaf-DKO-only enhancers inmacro-phages; of the 28pluripotency genes, only one (4%),Chd1, also had an activated enhancer signature inMaf-DKOmacrophages (Fig. 2B, red type). Similarresults were obtained when the selection of self-
renewal genes was based on transcription factorcross-regulatory circuits and interactome data inES cells (30): None of the factors in an ES celltranscriptional cross-regulatory circuit belongingto the nanog interactome (0 of 10) and 6 of 11(55%) genes in the network not interacting withnanog were activated in Maf-DKO macrophages(fig. S4). Our analysis revealed increased expres-sion in Maf-DKO macrophages compared withWTBMmacrophages for all 16 self-renewal genesassociatedwithMaf-DKO-only–activatedenhancers.This effect was enhanced in response to M-CSF(Fig. 2C).
Self-renewal genes are organized in anetwork and functionally important
To further investigate whether self-renewal genesin Maf-DKO macrophages were functionally in-tegrated in a network of cross-regulated genes,
aad5510-2 12 FEBRUARY 2016 • VOL 351 ISSUE 6274 sciencemag.org SCIENCE
Maf-DKO
Maf-DKO
Maf-DKO
Maf-DKO
Rhoj
PU.1
P300
H3K27ac
H3K4m3
H3K4m1
10.50-0.5-1
Expression: Maf-DKO/ WT BMM
Global
Maf-DKOonly
p = 4.34e-08
D
40
140
180
180
160
160
125
125
1
H3K27ac
p300
H3K4m1
H3K4m3
H3K27ac
p300
H3K4m1
H3K4m3 Gen
omic
reg
ions
(>2
kb
TS
S)
73
23
3
05
Maf-DKO
p300
Maf-DKO WT BMM
H3K27ac
Maf-DKO WT BMM
PU.1
4 kb
WT BMM
-2000 0 2000
020
040
060
080
010
0012
00
020
040
060
080
0
-2000 0 2000
Maf-DKO WT BMM
PU.1
PU.1
Maf-DKO
WT BMM
40
140
1
chr12: 76,368,675-76,417,974
WT BMM
WT BMM
WT BMM
WT BMM
Fig. 1. A subset of lineage-specific enhancers are enriched for activa-tionmarks in self-renewingMaf-DKOmacrophages. (A) Representativepredicted enhancer regions (red shading), with greater enrichment for
enhancer activation marks p300 and H3K27ac in Maf-DKOmacrophages versus WT BMMs (red boxes). (B) Direct alignment of p300, H3K27ac, and PU.1 ChIP-seq signals for enhancer regions differentially enriched for p300 marks in Maf-DKO macrophages (7323, light gray) and WT BMMs (305, dark gray), centeredand ranked on the p300 signal. (C) Aggregation plots showing average ChIP-seq signals for PU.1, H3K27ac, p300, H3K4m1, and H3K4m3 marks in Maf-DKOand WT BMMs for p300 regions specifically enriched in Maf-DKO macrophages [depicted in light gray in (B)]. For each protein target, results of ChIP-seqanalysis were reproducible in at least two biological replicates. (D) Microarray gene expression ratios of Maf-DKO versus WT BMMs 2 hours after M-CSF stimulation,for total genes (white) or genes associated with Maf-DKO-only enhancers (blue).The box extends from the first to the third quartile, with the whiskers denoting1.5 times the interquartile range. Data were derived from three biological replicates.
RESEARCH | RESEARCH ARTICLE
we measured the effect of silencing individualself-renewal genes on the expression of other self-renewal genes. For 12 of the 16 identified self-renewal genes, validated short hairpin RNA(shRNA) vectors were available (31). In eachknockdown, we measured the expression of 13self-renewal genes associated with Maf-DKO-only macrophage enhancers and four additionalself-renewal genes that might be regulated in-directly as part of a larger network. We also in-cluded probes against myeloid and housekeepingcontrol genes (Fig. 3A). Knockdown of self-renewalgenes only minimally influenced myeloid geneexpression (Fig. 3A). By contrast, in all cases self-renewal–specific shRNAs substantially reducednot only the expression of their specific targetbut also that of other self-renewal genes. Theseanalyses revealed a network of self-renewal gene
regulation with Myc and Klf2 as the two mainnodes and Klf4 as a minor node (Fig. 3B).To determine whether the identified network
of self-renewal genes was functionally importantfor self-renewal activity inMaf-DKOmacrophages,we analyzed the effect of silencing individual self-renewal genes on colony-forming ability. Weobserved a significant reduction in Maf-DKOcolony-forming units (CFUs) upon expressionof at least one self-renewal gene–specific shRNAper gene compared with control (shLacz) for allvectors except Eed, which produced inconclusiveresults between different shRNA constructs andrepeat experiments (Fig. 3C and fig. S5). We didnot observe any significant effect of self-renewalgene silencing on apoptosis, as indicated byAnnexin V and intracellular propidium iodinelabeling (fig. S5B). The strongest effects on self-
renewal were observed in the knockdowns ofgenes that occupy a central position in the net-work (Klf2/Myc). We observed weaker effects forseveral genes with peripheral positions (for ex-ample, Suz12), indicating that the knockdown ofa single peripheral gene in the network mightnot be sufficient to compromise the activity ofthe entire self-renewal network.
Shared self-renewing genes have distinctenhancers in ES cells and macrophages
Our results indicated that self-renewal of Maf-DKO macrophages depends on an integratednetwork of cross-regulated self-renewal genesthat are also employed for self-renewal in EScells. To investigate how these very differentcell types could access a similar gene network,we compared the gene regulatory mechanics
SCIENCE sciencemag.org 12 FEBRUARY 2016 • VOL 351 ISSUE 6274 aad5510-3
Fig. 2. Self-renewing Maf-DKO macrophages activategenes required for ES cellself-renewal. (A) Gene setenrichment analysis (GSEA)using gene sets defined byWong et al. (21) for adulttissue stem cells and core EScell modules (Broad InstituteMSigDB M1999 and M7079),comparing the expression ofgenes associated with Maf-DKO-only–associatedenhancers in Maf-DKO versusWT BMMs. NES, normalizedenrichment score; FDR, false-discovery rate. (B) Diagramof overlapping groups ofgenes associated with Maf-DKO-only–activatedenhancers (red) and func-tionally validated self-renewal(dark gray) or both self-renewal and pluripotency(self-renewal + Oct4/nanog;light gray) activity in ES cells,demonstrated by geneinactivation screens (22–29).(C) Gene expression byquantitative real-time PCR ofself-renewal genes in Maf-DKO macrophages and WTBMMs stimulated with M-CSF for the indicated times.The heat map shows theaverage signal of technicalreplicates. Data are repre-sentative of four independentexperiments.
RESEARCH | RESEARCH ARTICLE
underlying activation of self-renewal genes inMaf-DKO macrophages and ES cells. As expectedfrom the previous data and the differentiatedphenotype of macrophages, genes affecting bothself-renewal and pluripotency in ES cells, suchas Oct4/POU5F1, showed activated enhancers inES cells but not in macrophages (fig. S6A). Bycontrast, active enhancer elements were foundto be associated with the genes of the identifiedself-renewal network both in ES cells and Maf-DKO macrophages (Fig. 4). However, the two celltypes use entirely distinct sets of enhancers toactivate these genes. The examples for the central
factors Myc, Klf2, and Klf4 (Fig. 4A) and fur-ther network elements (fig. S6B) illustrate thatES cell–specific H3K27ac+/p300+ enhancers (bluein Fig. 4A and fig. S6B) and macrophage-specificH3K27ac+/ p300+ enhancers (red in Fig. 4A andfig. S6B) exist for each gene. To address theseobservations quantitatively, we identified the reg-ulatory regions marked by H3K27ac in the threecell types (ES cells, Maf-DKO macrophages, andWT BMMs) for each of the known 16 self-renewalgenes (Fig. 2B). To do this, we used a multisample-calling strategy to capture all shared regions andstrong cell type–specific regions (Fig. 4B). There
were 152 such regions, ranging from one regionper gene (four genes) to 34 (Cited2), with anaverage of 9.5 and a median of 5. Genome browserinspection revealed almost completely nonover-lapping sets of active enhancer regions in macro-phages and ES cells (Fig. 4A and fig. S6B). Consistentwith these observations, we could identify twodistinct enhancer clusters by k-means clustering(k = 2 clusters), where the most important charac-teristic separating the clusters is whether an en-hancer is active in ES cells or in macrophages(Fig. 4B). The median normalized signal for en-hancers in cluster one is 62 times higher in ES
aad5510-4 12 FEBRUARY 2016 • VOL 351 ISSUE 6274 sciencemag.org SCIENCE
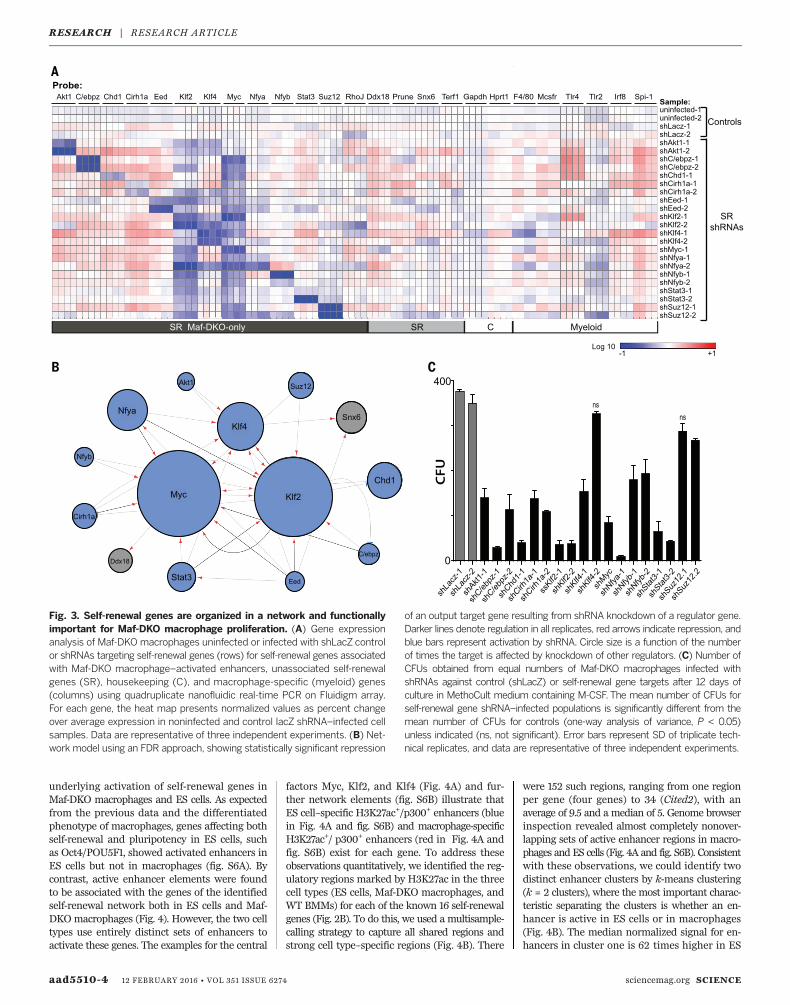
Fig. 3. Self-renewal genes are organized in a network and functionallyimportant for Maf-DKO macrophage proliferation. (A) Gene expressionanalysis of Maf-DKO macrophages uninfected or infected with shLacZ controlor shRNAs targeting self-renewal genes (rows) for self-renewal genes associatedwith Maf-DKO macrophage–activated enhancers, unassociated self-renewalgenes (SR), housekeeping (C), and macrophage-specific (myeloid) genes(columns) using quadruplicate nanofluidic real-time PCR on Fluidigm array.For each gene, the heat map presents normalized values as percent changeover average expression in noninfected and control lacZ shRNA–infected cellsamples. Data are representative of three independent experiments. (B) Net-work model using an FDR approach, showing statistically significant repression
of an output target gene resulting from shRNA knockdown of a regulator gene.Darker lines denote regulation in all replicates, red arrows indicate repression, andblue bars represent activation by shRNA. Circle size is a function of the numberof times the target is affected by knockdown of other regulators. (C) Number ofCFUs obtained from equal numbers of Maf-DKO macrophages infected withshRNAs against control (shLacZ) or self-renewal gene targets after 12 days ofculture in MethoCult medium containing M-CSF. The mean number of CFUs forself-renewal gene shRNA–infected populations is significantly different from themean number of CFUs for controls (one-way analysis of variance, P < 0.05)unless indicated (ns, not significant). Error bars represent SD of triplicate tech-nical replicates, and data are representative of three independent experiments.
RESEARCH | RESEARCH ARTICLE
cells than in Maf-DKO macrophages; conversely,in cluster two the median normalized signal is16 times higher in Maf-DKO macrophages thanin ES cells. These patterns are mirrored at highstatistical significance (P values ranging from1.4 × 10–9 to 9.6 × 10⁻¹⁶) in the ChIP-seq datafrom p300 and H3K4me1 (Mann-Whitney test),which had not been used in the clustering (Fig.4B). Furthermore, enhancers associated withmacrophage-specific self-renewal genes were 85and 73% PU.1-positive in Maf-DKO and WT BMmacrophages (Fig. 4B), indicating that macrophageself-renewal activates largely poised macrophage-specific enhancers. These results attest to the strongcontrast among the clusters and their constituentregions and support the model that the sameself-renewal genes can be accessed by distinct
lineage-specific enhancer elements in two differ-ent cell types with self-renewal capacity (Fig. 4C).
MAFB directly represses self-renewalenhancers in macrophages
To better understand the mechanism leading tothe activation of self-renewal enhancers inmacro-phages, we reexpressed MafB in Maf-DKO macro-phages.MafB expression resulted in the reductionof both colony size and number in CFU assays(Fig. 5A), strongly inhibited expression of self-renewal genes (Fig. 5B), and reestablished lowlevels of p300 binding and H3K27ac modifica-tion, similar to WT BMMs at both Maf-DKO-only (fig. S7A) and self-renewal gene–associatedenhancers (Fig. 5C).We further analyzedwhetherthis rescue effectwas due to a direct effect ofMAFB
on self-renewal gene–associated enhancers. Tran-scription factor binding sites enriched at Maf-DKO-only and, more specifically, self-renewalenhancers included Maf (MARE) and related AP-1family binding sites (figs. S3A and S8). Further-more, MAFB can also bind directly to PU.1 (32)andmight thus target PU.1-positive enhancers byprotein-protein interactions in the absence of con-sensus MARE. ChIP-seq analysis for MAFB in re-constitutedMaf-DKOmacrophages showed directbinding of MAFB (Fig. 5D) to 65% of PU.1-positiveDKO-only enhancers and 73%of self-renewal gene–associated enhancers (Fig. 5E), as exemplified forthe core factors of the network: Myc, Klf2, andKlf4 (Fig. 5F and fig. S7B). Similar binding pro-files were observed for ChIP-seq analysis of en-dogenous MAFB inWT BMMs (fig. S9). Together,these results indicate that the activation of self-renewal is reversible and that the large majorityof poised self-renewal–associatedmacrophage en-hancers are directly repressed by MAFB binding.
Naturally low Maf levels inalveolar macrophages activateself-renewal enhancers
To further investigate whether our observationsin Maf-DKO macrophages were directly relevantto the self-renewal capacity of genetically un-modified macrophages, we investigated alveolarmacrophages (AMs). AMs are a population of adultresident macrophages that have the ability toautonomously self-renew (4) and that naturallyexpress low levels of MafB and cMaf (6). Con-sistent with the constitutively low Maf levelscompared with those of other macrophage pop-ulations (Fig. 6A and fig. S10), we could expandAMs in long-term liquid culture (Fig. 6B) andserially replate AMs, but not peritoneal macro-phages (PMs), in colony-forming assays withoutlosing replicative ability (Fig. 6C). Cultured AMsalso expressed generally increased levels of self-renewal network genes (Fig. 6D). Furthermore,ChIP-seq analysis of epigenetic enhancer marksat the self-renewal gene–associated enhancer re-gions showed comparable binding of PU.1 be-tween AMs, Maf-DKO macrophages, and WTBM macrophages but an enrichment of the ac-tivationmark p300 in AMs, as inMaf-DKOmac-rophages (Fig. 6, E and F). Statistical analysisconfirmed a high correlation for PU.1 bindingacross all three populations and a high corre-lation for p300 binding between AMs and Maf-DKO macrophages but not BMMs (Fig. 6G).Thus, both experimental and natural reductionof MafB and c-Maf levels activates a set of poisedmacrophage-specific enhancers of the self-renewalgene network.
Low MafB levels activate self-renewalgenes in resident macrophages in vivo
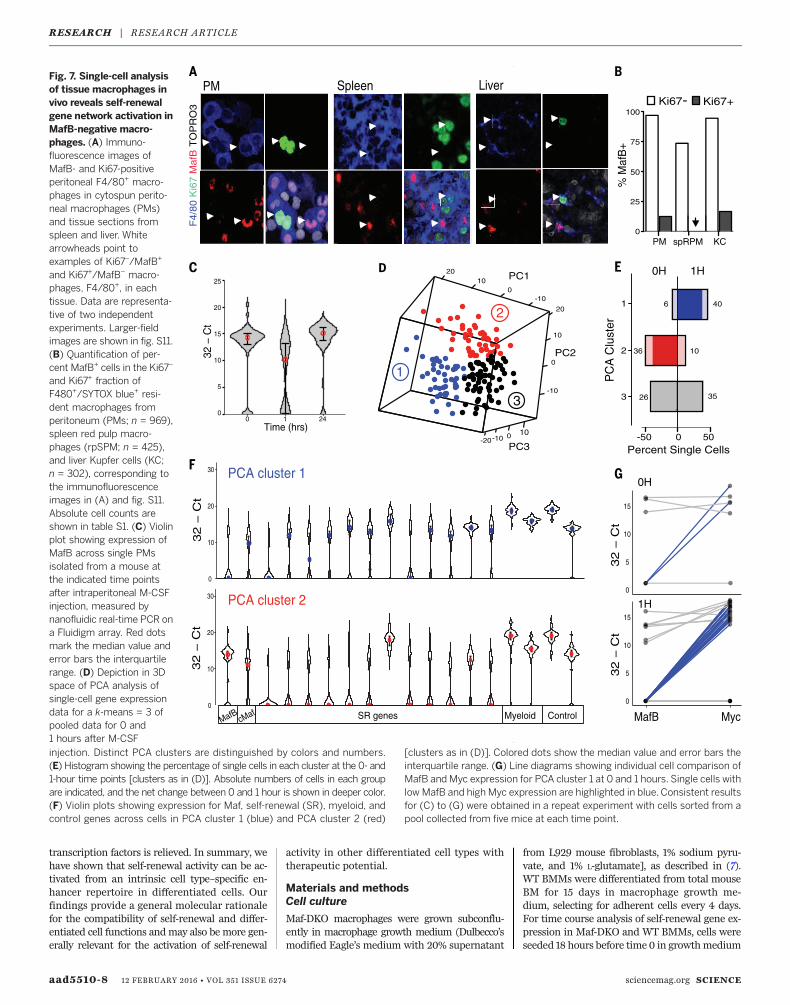
Many resident macrophage populations showa low level of local proliferation in vivo. Usingimmunofluorescence, we observed that the largemajority of cycling, Ki67-positivemacrophages inthe peritoneum, liver, and spleen red pulp did notexpress MafB, whereas quiescent, Ki67-negativemacrophageswere nearly allMafB-positive (Fig. 7,
SCIENCE sciencemag.org 12 FEBRUARY 2016 • VOL 351 ISSUE 6274 aad5510-5
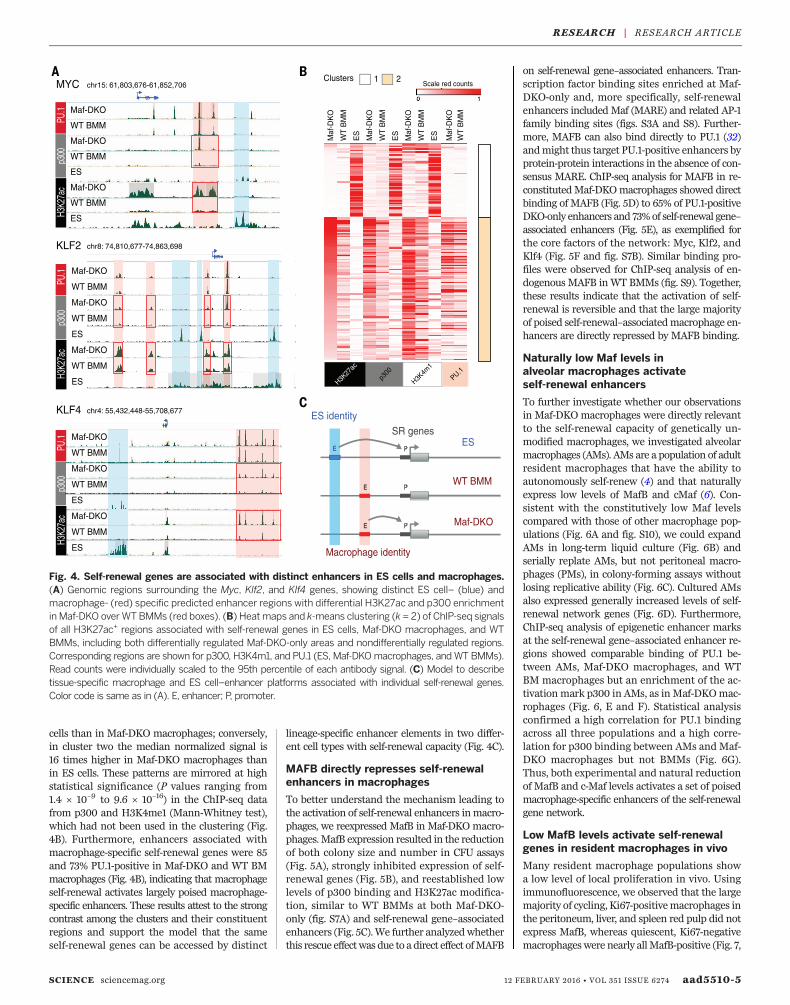
Fig. 4. Self-renewal genes are associated with distinct enhancers in ES cells and macrophages.(A) Genomic regions surrounding the Myc, Klf2, and Klf4 genes, showing distinct ES cell– (blue) andmacrophage- (red) specific predicted enhancer regions with differential H3K27ac and p300 enrichmentin Maf-DKO overWTBMMs (red boxes). (B) Heatmaps and k-means clustering (k = 2) of ChIP-seq signalsof all H3K27ac+ regions associated with self-renewal genes in ES cells, Maf-DKO macrophages, and WTBMMs, including both differentially regulated Maf-DKO-only areas and nondifferentially regulated regions.Corresponding regions are shown for p300, H3K4m1, and PU.1 (ES, Maf-DKOmacrophages, andWT BMMs).Read counts were individually scaled to the 95th percentile of each antibody signal. (C) Model to describetissue-specific macrophage and ES cell–enhancer platforms associated with individual self-renewal genes.Color code is same as in (A). E, enhancer; P, promoter.
RESEARCH | RESEARCH ARTICLE
A and B; fig. S11; and table S1), indicating thatmacrophage proliferation in vivo also involvedreduced MafB levels. Resident macrophages canfurther expand massively by transient local pro-liferation in response to specific stimuli (5, 33)—for example, to M-CSF during infection of the
peritoneum (34, 35), which can be mimicked bydirect intraperitoneal injection of the cytokine(34, 35) (fig. S12). To address whether under suchconditions macrophages could access the self-renewal gene network by transient repressionof MafB and/or cMaf, we measured both self-
renewal gene expression and MafB and cMafexpression before and at various time pointsafter M-CSF stimulation by single-cell analysisof sorted resident peritoneal macrophages. Onehour after stimulation, we observed a transientreduction of MafB (Fig. 7C) and, to a much lesser
aad5510-6 12 FEBRUARY 2016 • VOL 351 ISSUE 6274 sciencemag.org SCIENCE
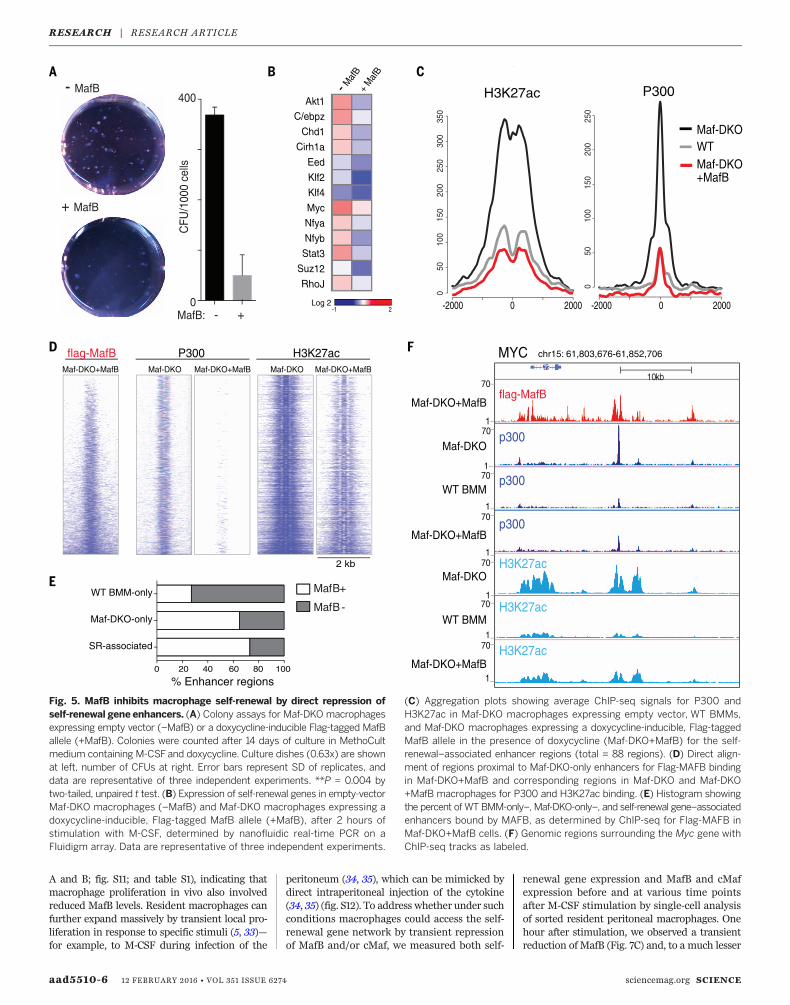
Fig. 5. MafB inhibits macrophage self-renewal by direct repression ofself-renewal gene enhancers. (A) Colony assays for Maf-DKO macrophagesexpressing empty vector (–MafB) or a doxycycline-inducible Flag-tagged MafBallele (+MafB). Colonies were counted after 14 days of culture in MethoCultmedium containing M-CSFand doxycycline. Culture dishes (0.63x) are shownat left, number of CFUs at right. Error bars represent SD of replicates, anddata are representative of three independent experiments. **P = 0.004 bytwo-tailed, unpaired t test. (B) Expression of self-renewal genes in empty-vectorMaf-DKO macrophages (–MafB) and Maf-DKO macrophages expressing adoxycycline-inducible, Flag-tagged MafB allele (+MafB), after 2 hours ofstimulation with M-CSF, determined by nanofluidic real-time PCR on aFluidigm array. Data are representative of three independent experiments.
(C) Aggregation plots showing average ChIP-seq signals for P300 andH3K27ac in Maf-DKO macrophages expressing empty vector, WT BMMs,and Maf-DKO macrophages expressing a doxycycline-inducible, Flag-taggedMafB allele in the presence of doxycycline (Maf-DKO+MafB) for the self-renewal–associated enhancer regions (total = 88 regions). (D) Direct align-ment of regions proximal to Maf-DKO-only enhancers for Flag-MAFB bindingin Maf-DKO+MafB and corresponding regions in Maf-DKO and Maf-DKO+MafB macrophages for P300 and H3K27ac binding. (E) Histogram showingthe percent of WT BMM-only–, Maf-DKO-only–, and self-renewal gene–associatedenhancers bound by MAFB, as determined by ChIP-seq for Flag-MAFB inMaf-DKO+MafB cells. (F) Genomic regions surrounding the Myc gene withChIP-seq tracks as labeled.
RESEARCH | RESEARCH ARTICLE
extent, of c-Maf but not of control myeloid genes(fig. S13A). Reasoning that the behavior of res-ident peritoneal macrophages might be hetero-geneous, we could identify three distinct groupsof cells by principal component analysis (PCA)and k-means clustering (Fig. 7D). Whereas cellsin cluster three were equally present before andafter stimulation, cluster-two cells were stronglyreduced and cluster-one cells strongly increasedafter M-CSF stimulation (Fig. 7E). Cells in clustertwo expressed high levels of MafB and c-Maf butwere negative for nearly all self-renewal genes.By contrast, cells in cluster one showed lowMafBlevels and up-regulation of the large majority ofself-renewal genes (Fig. 7F). Cluster-three cellsalso showed high MafB levels (fig. S13B). Directcomparison of the expression of MafB and Mycin individual cells revealed a large number of
cells with high MafB and low Myc levels inclusters two and three (fig. S13C). By contrast, amajority of cells in cluster one showed low orabsentMafB levels and high levels ofMyc (Fig. 7G).This analysis also demonstrated that a few cellswith a MafB-low/Myc-high profile already ex-isted in the steady state but their number strong-ly increased after M-CSF stimulation (Fig. 7G).Overall, our results demonstrate that down-
regulation of MafB and cMaf and concomitantactivation of a self-renewal gene network is ahallmark of proliferating resident macrophagesin culture and in vivo. Natural or experimentallyinduced constitutively low levels of MafB andc-Maf also enable long-term continuous self-renewal of adult macrophages in culture, asobserved for AMs or Maf-DKO macrophages,respectively. Although inactivation of type I in-
terferon signaling has also been associated withincreased macrophage proliferation (36), wecould not identify a direct link between Maf ac-tivity and this pathway. Furthermore, repressionof interferon-b by MafB has been reported (37),which is the opposite of what would be expectedif Maf transcription factors acted through inter-ferons to limit macrophage proliferation.We show that a network of genes that governs
macrophage self-renewal overlaps substantiallywith that controlling self-renewal in ES cells. Theregulatory mechanism by which activation ofthese genes is accomplished involves almost en-tirely separate sets of enhancers in the two celltypes. The identified enhancer architecture as-sociated with self-renewal genes in macrophagesis already present in quiescent cells and can be-come activated when direct repression by Maf
SCIENCE sciencemag.org 12 FEBRUARY 2016 • VOL 351 ISSUE 6274 aad5510-7
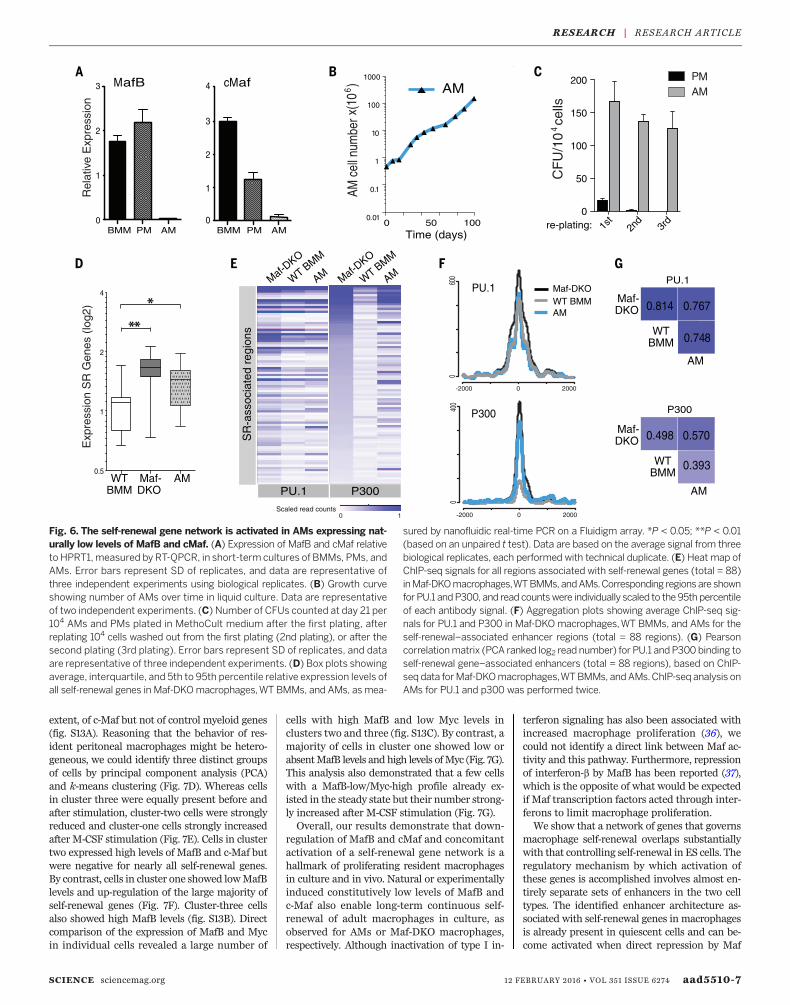
Fig. 6. The self-renewal gene network is activated in AMs expressing nat-urally low levels of MafB and cMaf. (A) Expression of MafB and cMaf relativeto HPRT1,measured by RT-QPCR, in short-term cultures of BMMs, PMs, andAMs. Error bars represent SD of replicates, and data are representative ofthree independent experiments using biological replicates. (B) Growth curveshowing number of AMs over time in liquid culture. Data are representativeof two independent experiments. (C) Number of CFUs counted at day 21 per104 AMs and PMs plated in MethoCult medium after the first plating, afterreplating 104 cells washed out from the first plating (2nd plating), or after thesecond plating (3rd plating). Error bars represent SD of replicates, and dataare representative of three independent experiments. (D) Box plots showingaverage, interquartile, and 5th to 95th percentile relative expression levels ofall self-renewal genes in Maf-DKOmacrophages,WT BMMs, and AMs, as mea-
sured by nanofluidic real-time PCR on a Fluidigm array. *P < 0.05; **P < 0.01(based on an unpaired t test). Data are based on the average signal from threebiological replicates, each performed with technical duplicate. (E) Heat map ofChIP-seq signals for all regions associated with self-renewal genes (total = 88)inMaf-DKOmacrophages,WTBMMs, andAMs.Corresponding regions are shownfor PU.1 andP300, and read countswere individually scaled to the95thpercentileof each antibody signal. (F) Aggregation plots showing average ChIP-seq sig-nals for PU.1 and P300 in Maf-DKOmacrophages,WT BMMs, and AMs for theself-renewal–associated enhancer regions (total = 88 regions). (G) Pearsoncorrelationmatrix (PCA ranked log2 read number) for PU.1 andP300binding toself-renewal gene–associated enhancers (total = 88 regions), based on ChIP-seq data forMaf-DKOmacrophages,WTBMMs, andAMs.ChIP-seq analysis onAMs for PU.1 and p300 was performed twice.
RESEARCH | RESEARCH ARTICLE
transcription factors is relieved. In summary, wehave shown that self-renewal activity can be ac-tivated from an intrinsic cell type–specific en-hancer repertoire in differentiated cells. Ourfindings provide a general molecular rationalefor the compatibility of self-renewal and differ-entiated cell functions andmay also be more gen-erally relevant for the activation of self-renewal
activity in other differentiated cell types withtherapeutic potential.
Materials and methodsCell culture
Maf-DKO macrophages were grown subconflu-ently in macrophage growth medium (Dulbecco’smodified Eagle’s medium with 20% supernatant
from L929 mouse fibroblasts, 1% sodium pyru-vate, and 1% L-glutamate], as described in (7).WT BMMs were differentiated from total mouseBM for 15 days in macrophage growth me-dium, selecting for adherent cells every 4 days.For time course analysis of self-renewal gene ex-pression in Maf-DKO and WT BMMs, cells wereseeded 18 hours before time 0 in growthmedium
aad5510-8 12 FEBRUARY 2016 • VOL 351 ISSUE 6274 sciencemag.org SCIENCE
Fig. 7. Single-cell analysisof tissue macrophages invivo reveals self-renewalgene network activation inMafB-negative macro-phages. (A) Immuno-fluorescence images ofMafB- and Ki67-positiveperitoneal F4/80+ macro-phages in cytospun perito-neal macrophages (PMs)and tissue sections fromspleen and liver. Whitearrowheads point toexamples of Ki67–/MafB+
and Ki67+/MafB– macro-phages, F4/80+, in eachtissue. Data are representa-tive of two independentexperiments. Larger-fieldimages are shown in fig. S11.(B) Quantification of per-cent MafB+ cells in the Ki67–
and Ki67+ fraction ofF480+/SYTOX blue+ resi-dent macrophages fromperitoneum (PMs; n = 969),spleen red pulp macro-phages (rpSPM; n = 425),and liver Kupfer cells (KC;n = 302), corresponding tothe immunofluorescenceimages in (A) and fig. S11.Absolute cell counts areshown in table S1. (C) Violinplot showing expression ofMafB across single PMsisolated from a mouse atthe indicated time pointsafter intraperitoneal M-CSFinjection, measured bynanofluidic real-time PCR ona Fluidigm array. Red dotsmark the median value anderror bars the interquartilerange. (D) Depiction in 3Dspace of PCA analysis ofsingle-cell gene expressiondata for a k-means = 3 ofpooled data for 0 and1 hours after M-CSFinjection. Distinct PCA clusters are distinguished by colors and numbers.(E) Histogram showing the percentage of single cells in each cluster at the 0- and1-hour time points [clusters as in (D)]. Absolute numbers of cells in each groupare indicated, and the net change between 0 and 1 hour is shown in deeper color.(F) Violin plots showing expression for Maf, self-renewal (SR), myeloid, andcontrol genes across cells in PCA cluster 1 (blue) and PCA cluster 2 (red)
[clusters as in (D)]. Colored dots show the median value and error bars theinterquartile range. (G) Line diagrams showing individual cell comparison ofMafB and Myc expression for PCA cluster 1 at 0 and 1 hours. Single cells withlow MafB and high Myc expression are highlighted in blue. Consistent resultsfor (C) to (G) were obtained in a repeat experiment with cells sorted from apool collected from five mice at each time point.
RESEARCH | RESEARCH ARTICLE
without supernatant fromL929mouse fibroblasts;at time 0, 100 ng/ml of recombinant murine stemcell factor (Peprotech) was added to the culturemedium; and cells were harvested for RNA iso-lation and analysis at 0, 1, 2, and 24 hours.For culture of AMs, alveolar lavages were
pooled from 10 1-ml 37°C bronchoalveolar lavagewashes [phosphate-buffered saline (PBS) with-out Mg++/Ca++, 2 mM EDTA, 2% fetal bovineserum (GE Healthcare) per mouse] and storedon ice. Red blood cell (RBC) lysis was then per-formed at room temperature (RT) for 3min (RBCLysis Buffer, Invitrogen). Cells were plated at adensity of 1.1 million cells per 10-cm bacterialpetri dish in completemedium [RPMI, 10% fetalcalf serum (FCS), 1% Pen/Strep, 1% pyruvate, 1%glutamate] supplemented with 1% granulocyte-macrophage CSF (GM-CSF) supernatant fromJ558L cells transfected with murine GM-CSFcDNA.
MafB expression inMaf-DKO macrophages
The pRetroX-Tet-On Advanced (Clontech, cata-log no. 632104) and pRetroX-Tight-Pur (catalogno. 632104) retroviral backbones were used forgenerating the Flag-tagged MafB-inducible Maf-DKOmacrophages. Neor was replaced by Hygror
and Puror by green fluorescent protein (GFP) inthe pRetroX-Tet-On Advanced and pRetroX-Tight-Pur retroviruses, respectively. Maf-DKOmacrophages were first infected with the pRetroX-Tet-On-hygror retrovirus and selected for 2 weeksinmedium containing 200 mg/ml ofHygromycin B(Life Technologies, catalog no. 10687-010). Selec-ted Maf-DKO macrophages were next infectedwith the empty pRetroX-Tight-GFP or pRetroX-Tight-GFP containing the Flag-taggedMafB genecloneddownstreamof themodifiedTet-responsivepromoter. GFP-positive Maf-DKO macrophageswere then subjected to fluorescence-activatedcell sorting (FACS) and cultured in the absenceof doxycycline.
Stimulation and isolation ofperitoneal macrophages
Either 200 ml of PBS (control) or 20 mg of recom-binant M-CSF (Novartis) was injected into theperitoneums of WT C57/B6J 8- to 10-week-oldmice at the indicated times before analysis. Forcell cycle analysis, mice were also injected in-traperitoneally with 2 mg of bromodeoxyuridine(BrdU) (BD Pharmingen) dissolved in PBS, permanufacturer’s instructions, 4 hours before anal-ysis. To harvest peritoneal cells, mice weresacrificed and subsequently injected with 10 mlof ice-cold PBS containing 2 mM EDTA (Sigma).Intraperitoneal washouts were collected in 50-mlFalcon tubes. Red cell lysis was performed ontotal washouts (RBC Lysis Buffer, Invitrogen)before staining for cell surface markers and cellcycle analysis or FACS. The remaining mono-nuclear cells were then stained using the follow-ing antibody cocktail in the presence of FcBlock(BD Biosciences)—CD11b-PE-Cy7 (BD Biosciences);MHC-II-FITC, B220-APC-Cy7, and F4/80-PE (allfrom eBioscience); and Fixable Aqua Dead-V500
(Life Technologies)—and either sorted for single-cell analysis or further processed for cell cycleanalysis.
Cell cycle analysis
Bromodeoxyuridine analysis was performed usinga BrdU Flo Kit (BD Pharmingen) according tomanufacturer’s instructions and with the follow-ing modifications: DNaseI digestion was per-formed for 90 min and intracellular stainingfor 60 min, and anti-BrdU-AlexaFluor 647 Ab(Invitrogen, clone MoBU-1) was substituted foranti-BrdU provided in the kit. For Ki67 staining,cells were harvested and treated as for BrdUstaining but with substitution of an anti-Ki67-V450 antibody (eBiosciences, clone SolA15) forthe final incubation step. Cells were analyzedusing an LSRII and FlowJo software (Tree Star).
shRNA infections
Lentiviral vector particles were produced at theCentre International de Recherche en Infectiolo-gie (INSERM, UMR 5308 Lyon, France) by tri-transfection of plasmids harboring the packagingconstruct, the transfer vector (31), and the envelope-expressing construct into producer cells using cal-cium chloride methodology. Virus was concen-trated after transfection, and viral supernatantswere harvested and used directly for infectionsor stored at –80°C.Maf-DKO macrophages were seeded sub-
confluently in 12-well dishes, 24 hours beforeinfection. The next day, 8 mg/ml of polybrenewas incubated for 1.5 hours at 37°C and 5%CO2 with viral supernatants, and 2 ml per wellper infection was used to replace media on Maf-DKO macrophages. Spin infections were carriedout at 25°C for 2 hours, with 2500 revolutions perminute (rpm). Viral supernatants were removedimmediately after spin infection and replacedwith macrophage growth medium. Cells werethen further incubated at 37°C and 5% CO2 for72 hours before harvesting and divided intofractions for apoptosis, colony assay, and RNAand DNA isolation.Apoptosis was measured using the Annexin V
Apoptosis Detection Kit (eBioscience) accordingto themanufacturer’s instructions. To control forinfection, genomic DNA was isolated [using theDNeasy Blood and Tissue Kit (Qiagen)] from in-fected Maf-DKO cells at 72 hours postinfection.Quantitative polymerase chain reaction (QPCR)was performed to detect the quantity of puro-mycin cassette contained in the lentiviral vector,relative to a control genomic amplicon [actin tran-scription start site (TSS)], and to ensure similar in-fection efficiencies across all populations (fig. S5).Reactions were carried out in a 7500 Real-TimePCR System (Applied Biosystems) including disso-ciation curves to validate distinct amplicons. RNAwas extracted from infected cells and processedfor gene expression profiling.
Colony assays
For shRNA-infected cells, 5000 cells were countedfrom each population of infected cells and mixedwith 1 ml of MethoCult medium (M3231, Stem
Cell Technologies), with the addition of 100 ng/mlof recombinant M-CSF (Peprotech), plated induplicate and grown at 37°C, 5% CO2. For ex-periments using MafB-inducible Maf-DKO cells,1000 cells were plated, and 1 mg/ml of doxycy-cline (Sigma) was added, in addition to M-CSF,where indicated. Thenumber ofCFUswas countedon day 12 after plating. Maf-DKO macrophagesexpressing empty vector (–MafB) or a doxycycline-inducible, Flag-tagged MafB allele (+MafB) wereplated at 1000 cells per milliliter of MethoCultmedium, as above,with the addition of 1 mg/ml ofdoxycycline (Sigma). AMs were plated at 10,000cells per 1 ml of MethoCult M3231 medium(StemCell Technologies) containing 100 ng/ml ofrecombinant GM-CSF (Peprotech), and colonieswere counted after 3 weeks. All experiments wereperformed with n = 2 replicates, and results werereproduced at least three times independently.
In situ immunofluorescent cell staining
PMs were harvested with refrigerated PBS, and10,000 cells were loaded onto Shandon cytocen-trifuge chambers and centrifuged at 1000 rpmfor 3 min. Slides were air-dried, fixed with re-frigerated 4% paraformaldehyde (PFA) for 10minat RT, and washed once with PBS. Spleen andliver were harvested after perfusion with PBS andfreshly embedded in TissueTeck (OCT Com-pound) before freezing. Serial frozen sections(8 mm) were fixed with refrigerated 4% PFA for10 min and washed three times for 5 min withPBS at RT.Slides were then permeabilized with Triton-X
0.05% (Sigma, catalog no. 9002-93-1) for 10 minand washed three times for 5 min with PBS.Unspecific antigens were blocked for 1 hour withPBS containing 1% FCS, 2% bovine serum al-bumin (BSA), and 1% goat serum before staining.After blocking, slides were incubated for 1 hour atRT with rabbit anti-mouse MafB (Bethyl, catalogno. IHC-101) diluted at 1:50 and rat anti-mouseKi67 (eBioscience, catalog no. 14-5698-82) dilutedat 1:50 in blocking solution. Slides were subse-quently washed three times for 10 min with PBSat RT and incubated with the secondary anti-bodies donkey anti-rat A488 (Invitrogen, catalogno. A31572) diluted at 1:500 and donkey anti-rabbit A555 (Invitrogen, catalog no. A21208) di-luted at 1:500 in PBS. Slides were again washedthree times for 10 min with PBS at RT and, fi-nally, incubated for 1 hour with F4/80 A647(Serotec, catalog no. MCA497A647) diluted at1:50. A final wash series of three times for 10minwith PBS at RT was performed before mountingwith Prolong Gold (Thermo Fischer, catalog no.P36930) with SYTOX Blue diluted at 1:1000(Thermo Fischer, catalog no. S11348) for nuclearstaining. Images were analyzed on a Zeiss LSM510confocal microscope.
ChIP-seq
Cells cultured in plates were fixed by the directaddition of 1/10 volume of freshly made cross-linking solution (11% formaldehyde, 100mMNaCl,1 mM EDTA, 0.5 mM EGTA, 50 mM Hepes atpH 7.8) to cell medium and incubation at RT
SCIENCE sciencemag.org 12 FEBRUARY 2016 • VOL 351 ISSUE 6274 aad5510-9
RESEARCH | RESEARCH ARTICLE
for 10min. Formaldehydewas then quenched for5 min at RT by the addition of 2.5 M glycine so-lution to a final concentration of 125 mM. Fixedcells were washed twice with cold PBS, scrapedoff the plate, counted, and transferred in 50-mlFalcon tubes. Cells were then pelleted by centrif-ugation at 700g for 5 min at 4°C, snap-frozen inliquid nitrogen, and stored at –80°C for storageor shipment on dry ice.Each batch of 100 million cells was lysed by
adding 10 ml of ChIP Lysis Buffer (Santa CruzBiotechnology, catalog no. sc-45000) or radio-immunoprecipitation assay (RIPA) buffer (1xPBS, 1% NP-40, 0.5% sodium deoxycholate, 0.1%SDS) containing Protease Inhibitor Cocktail (PIC).One complete PIC tablet (Roche, catalog no.11873580001) for 50 ml of buffer or one miniPIC tablet (Roche, catalog no. 11836153001) for10 ml of buffer was used. After rotating the celltube for 10 to 15 min at 4°C, nuclei were pel-leted by centrifugation at 700g for 5min at 4°C.Nuclei pellets were resuspended in 5 ml of SantaCruz Biotechnology ChIP Lysis Buffer High Salt(catalog no. sc-45001) or RIPA buffer containingPIC. Aliquots of 1 ml containing 20 millionnuclei were transferred into 1.5-ml low-bindmic-rofuge tubes. The nuclei suspension was eithersonicated immediately or snap-frozen in liquidnitrogen and stored at –80°C.The nuclei-chromatin suspension in each mil-
liliter was sonicated (Sonics Vibra Cell, ModelCV188, with Stepped Tip 1/8”-630-0422) on ice ina cold room (4°C). Sonicationwas performedwithnine cycles of 30 s ON at 60% intensity and 30 sOFF for chromosome modifications (H3k4me1and H3K27ac) or with eight cycles for transcrip-tion factors (P300 and PU.1). The sheared chro-matinwas centrifuged at 14 thousand rpm (krpm)for 10 to 15 min and then transferred (as for thesupernatant) into a new 1.5-ml tube and kept onice for ChIP.For ChIP, 50-ml Invitrogen Dynabeads (7 × 10⁸
beads/ml) were used for 20 million cells, eitheranti-rabbit immunoglobulin G (IgG) (catalog no.112.03D) or anti-mouse IgG (catalog no. 112.01D),depending on the source of the first antibody.The beads were first washed with PBS/BSA/PICbuffer [1x PBS, 5 mg/ml of BSA (Sigma, A3059-10G, Fraction V), Roche PIC (one mini tablet for10 ml or one complete tablet for 50 ml, addedbefore use)], and then the washed beads werethoroughly resuspended in 1 ml of PBS/BSA/PICbuffer in a 1.5-ml microfuge tube. The tube wasplaced on a magnetic rack for 1 min, after whichthe supernatant was removed. This wash wasrepeated twice by resuspending beads in 1 ml ofPBS/BSA/PIC buffer, rotating for 5 min, and re-moving the supernatant, as described above. Thebeads were then coated with antibody by resus-pending in 250 ml of PBS/BSA/PIC buffer in eachtube, adding 5 mg of antibody, and rotating over-night at 4°C. The following antibodieswere used:H3K4me1 (Abcam, catalog no. ab8895), H3K4m3(Abcam, catalog no. ab8580), H3K27ac (Abcam,catalog no. ab4729), P300 (Santa Cruz Biotech-nology, catalog no. sc-585), PU.1 (Santa Cruz Bio-technology, catalog no. sc-352), MafB (Bethyl,
catalogno. IHC-101), andFlagM2antibody (Sigma).After overnight incubationwith antibody, the beadswere pelleted by placing the tube on a magneticrack for 1 min, followed by removing the super-natant. The beads were then washed three timeswith PBS/BSA/PIC buffer.ChIP was carried out by adding the sheared
chromatin suspension to the antibody-coatedbeads and rotating overnight at 4°C, followedby a series of washes. The beads were firstwashed once with 1 ml of a low-salt wash buffer(20 mM Tris-HCl at pH 8.0, 150 mMNaCl, 2 mMEDTA, 0.1% SDS, 1% Triton X-100), then twicewith a high-salt wash buffer (20 mM Tris-HCl atpH 8.0, 500 mM NaCl, 2 mM EDTA, 0.1% SDS,1% Triton X-100), three times with an LiCl washbuffer (10 mM Tris-HCl at pH 8.0, 250 mM LiCl,1mMEDTA, 1%GEPALCA630, 1%Na-deoxyholate),and twice with TE buffer. ChIP DNA was elutedby adding 200 ml of ChIP Elution Buffer (SantaCruz Biotechnology, catalog no. sc-45003, or 1%SDS/0.1MNaHCO3) to each bead tube, vortexingto resuspend beads, and incubating at 65°C for1 hour with vortexing every 15 min. After beadswere centrifuged for 3min at RT and placed on amagnetic rack for 1 min, ChIP DNA in the super-natant was transferred to a new tube.Reversal of cross-links was carried out by incu-
bation at 65°C overnight, and DNA was extractedwith an equal volume of phenol:chloroform:iso-amyl alcohol (24:24:1). After centrifugation at14 krpm for 3 min, ChIP DNA in the supernatantwas transferred to a 2.0-ml low-bind tube. MoreDNA was extracted by adding 100 ml of water tothe phenol:chloroform phase and repeating theextraction. The DNA extract was combined andmixed with five volumes of PBI buffer (5 M Gu-HCl, 30% isopropanol) Qiagen MinElute PCRPurification Kit, catalog no. 28004). With theuse of 3 M NaAc (at pH 5.2), the pH of themixture was adjusted to <7.5 before the mixturewas applied to the column. The mixture turnedback to a yellow color, which is important forDNA to bind to the Qiagen column. DNA waspurified according to the manufacturer’s in-structions and eluted in 30 ml of buffer EB. DNAconcentration was measured with Qubit (Ther-mo Fischer). DNA amounts ranging from 30 ng(P300, PU.1, MafB, and Flag-MafB) to 100 ng(H3K4me1 and H3K27ac) were used to makeeach library.ChIP-seq libraries were generated using adap-
tors from Illumina (catalog no. FC102-1001) andother enzymes and reagents from New EnglandBioLabs, following the Illumina ChIP-seq pro-tocol with some minor modifications. ChIP DNAwas end-repaired by T4 DNA polymerase (cata-log no. M0203S/L), Klenow DNA polymerase(catalog no. M0210S/L), and T4 PNK (catalog no.M0201S/L) andpurifiedwith theQiagenMinElutePCRPurificationKit. A-basewas then added to the3′ end by Klenow Fragment, 3′ to 5′ exo- (NewEngland BioLabs, catalog no. M0212S/L), anddeoxyadenosine triphosphate. The Illumina adap-tors (1 ml of 1:10 dilution) were subsequentlyadded to both ends by DNA ligase (catalog no.M2200S/L). The adaptor-ligated DNAwas size-
selected for 200– to 400–base pair (bp) fragmentsby 2% low-melting agarose gel (Lonza, catalogno. 50080) and was subsequently purified usinga Qiagen MinElute Gel Extraction Kit (catalogno. 28604). LibraryDNAwas amplified in a 100-mlreaction by Phusion PCR Master Mix (New En-gland BioLabs, catalog no. F-531S), with primersSolexaPCR_F (5′- AAT GAT ACG GCG ACC ACCGAGATC TAC ACT CTT TCC CTA CACGACGCTCTT CCG ATC T -3′) and SolexaPCR_R (5′- CAAGCA GAA GAC GGC ATA CGA GCT CTT CCGATC T -3′). Libraries of H3K4me1 and H3K27acwere amplified by predenaturing at 98°C for 30 s;followed by 10 cycles of (i) 98°C for 10 s, (ii) 65°Cfor 30 s, and (iii) 72°C for 30 s; and then an extra5 min at 72°C at the end. For the P300 and PU.1libraries, 12 cycles of PCRwere used. After libraryDNAwas purified, library concentrationwasmea-sured by Qubit, and size distribution was deter-mined by Bioanalyzer (Agilent Technologies). EachChIP-seq library was sequenced on one lane ofIllumina GAIIx or Illumina HiSeq 2000 with1 × 36–bases of read length. Biological replicatesfrom two independently derived Maf-DKO mac-rophage lines (from two different mice) were se-quenced, one of which was determined to betetraploid. Comparison of ChIP-seq and gene ex-pression data revealed no substantive differencesbetween the two lines.
ChIP-seq analysis
Although a DNAnexus pipeline was used forpeak detection algorithms (38) and alignmentsof raw data (uploaded fastq files), the aligneddata (BAM files) were subsequently downloadedand processed with a custom R pipeline for bio-informatics analyses. A threshold based on thenumber of sequenced tags (Nseq) has been set upas Nseq/7,000,000. All regions with a numberof repeated tags (with identical sequences/coordinates) above this threshold were filteredout to remove possible sequencing and/or align-ment artifacts. To accurately represent and fur-ther process the ChIP-seq and input controlsignals, the Watson and Crick strand tags needto bemerged after elongation or size extension tothe gel-purified fragment size. The optimal elon-gation size of each ChIP-seq experiment wasestimated in silico by employing a stepwise 10-bpchromosomal sequence tag shifting and scoremultiplication. Tag coordinates were subsequentlyelongatedaccording to this estimatedDNAfragmentsize, corresponding to the tag shift maximizingthe score. Then, a nucleotide score representingthe genome-wide overlap of elongated tags wascomputed across both strands.Wiggle (WIG) filesfor genome-wide scores were generated after a bin-ning step, and the average enrichment score wascalculated every 50 bp.When input experiments were available, en-
richment scores from WIG files were scaledand used as follows: Owing to the size of thegenome and the relatively low frequencies ofbinding events, we assumed that most (>90%)of the obtained scores from the ChIP-seq ex-periments represent a background (BG) level.We therefore used the genome-wide average
aad5510-10 12 FEBRUARY 2016 • VOL 351 ISSUE 6274 sciencemag.org SCIENCE
RESEARCH | RESEARCH ARTICLE
score in each experiment to estimate the BGlevel. Using these average scores, it is possibleto rescale the scores accordingly, acting as nor-malization and reducing the interexperimentdifferences due to effects of different sequenc-ing depths and/or fragment sizes.We employed an input subtraction step for
each experiment, using the normalized file forthe input control. This step not only allows forcorrection of overrepresentations of certain ge-nomic regions due to possible (un)favorable eventsduring sonication and/orDNAsequencing but alsoserves to reduce the signal-to-noise ratio, especiallyfor experiments with low enrichment values.H3K4me1-enriched regions were extracted
fromall samples (Maf-DKO,BMMs, PMs, pro-B, ES,liver, and mouse embryonic fibroblasts; annota-tion files available) (12, 13). All regions close toannotated TSSs (<2 kb) were omitted, and theunion of the resulting regions was used as a ref-erence to extract enrichment scores of H3K4me1derived from all samples. R scripts were devel-oped and used for retrieving bin scores aroundthe center of these annotations (±2 kb). Thesescores and their original genomic coordinateswere utilized to recenter values around theH3K4me1-enriched regions, by means of linearinterpolation. In total, 1000 points were inter-polated for each selected region, which resultedin a 1000-column matrix. These matrices wereloaded, viewed, and color-scaled according tosample read depth using Java TreeView (39).Finally, thesematriceswere assembled by sample.A large selection of regions enriched for
H3K27ac and H3K4me1 was applied to WT andDKO samples. All regions in close proximity toany annotated TSSs (<2 kb) were ignored, andthe union of all regions has been defined as pu-tative active enhancers (annotation file availa-ble). The binned enrichments of PU.1 samples inthese regions were merged and compared amongtissues using a nonparametric Spearman corre-lation method.Heat maps were created with the same strat-
egy as for fig. S1A (but focused on regions iso-lated with previously described isolated peaks).For each reference experiment (H3K27ac or P300),the regions were sorted by increasing averageenrichment score, and the other heat maps werearranged with respect to this initial sorting forcorresponding experiments.For the heat map in Fig. 4B, SRA files for ES
cell ChIP-seqdata (13)were converted into FASTQformat before being uploaded and processed onthe DNAnexus platform. Two replicate H3K27acES cell ChIP-seq BAM files were merged, andBAM files were then processed by DNAnexus, asdescribed above. All reads from BAM files with aMAPQ (MAPping Quality) value <10 were fil-tered out so that only confidently mapped readswere retained. The numbers of reads in each re-levant region were counted according to theirstart position. Each read with a start positionoutside the region was not taken into account,regardless of the strand considered.The read-counts matrix was normalized by
considering each mark independently of the
others. For each antibody, the number of readsfor each region was normalized relative to thetotal number of confidently mapped reads of theleast-sequenced sample. Because these regionsare not homogeneous in length, counts werenormalized to the size of the region in kilo–basepairs. Next, considering each antibody indepen-dently, counts exceeding the 95th percentilewere set to this value to avoid bias due to out-liers. Values were then set to the range 0 to 1 andsorted according to theMaf-DKOregion’sH3K27aclevel. Finally a 2-means clustering (k = 2) wasperformed on H3K27ac marks for the three celltypes (Maf-DKO macrophages, WT BMMs, andES cells). The analysis depicted in Fig. 6E usedthe same approach for PU.1 and p300 marks inMaf-DKO macrophages, WT BMMs, and AMs.All analyses were performed using Samtools, R(version 2.14), and gene-e (version 3.0.202).
Motif search at enhancer loci
Motifs analysis was performed using HOMER2(http://homer.salk.edu/homer/) on 10,232 DKO-only peaks (the union of H3K27ac and P300selection based on enrichment inMaf-DKOmac-rophages versus WT BMMs) and 88 self-renewalgene–associated peaks from within the DKO-only selection. Among other things, HOMER2screens for enrichment of known motifs. TheHOMER perl script findMotifsGenome.pl wasused with the mm9 mouse genome as a back-ground (random genomic sequences sampledaccording to GC content of input sequences).
GSEA analysis
Maf-DKO versus WT log2 ratios were computedfor each probe set from normalized data by RMAmethod (robust multiarray average). H3K27acDKO-only regions and P300 DKO-only peakswere associated with nearby genes via GREAT(http://bejerano.stanford.edu/great/public/html/index.php) (20).Next, the union of DKO-only enhancer–
associated genes was considered. For the pur-poses of GSEA (www.broad.mit.edu/gsea), 7499Maf-DKO–versus–WT ratios of these non-uniqueDKO-only enhancer–associated genes (a genecan have multiple associated probe sets) wereselected. Two stem cellmoduleswere used as genesets: (i) an adult tissue stem module regroupinggenes coordinately up-regulated in a compen-dium of mouse adult tissue stem cells and (ii) asecond module composed of genes coordinatelyup-regulated inmouse ES cells, as defined in (21).These two sets were extracted from the publicMolecular Signatures Database (MSigDB) (www.broadinstitute.org/gsea/msigdb/index.jsp).
Single-cell– and bulk cell–populationgene expression profiling and analysis
Single cells were sorted, using the autoclonemodule on an AriaIII sorter (Becton Dickinson),directly into 96-well plates in the CellsDirectReaction Mix (Invitrogen). Individual cell lysis,cDNA synthesis, and amplification were carriedout via single-cell microfluidic real-time PCRusing Dynamic Array integrated fluidic circuits
(IFCs) (Biomark Fluidigm), according to theFluidigm Advanced Development Protocol. Pre-amplified products (20 cycles) were diluted by afactor of 5 before analysis with Universal PCRMaster Mix and inventoried TaqMan gene ex-pression assays (Applied Biosystems) in 96.96Dynamic Arrays on a BioMark System (Fluidigm).For single-cell analysis, cycle threshold (Ct) valueswere calculated from the system’s software (Bio-Mark Real-time PCR Analysis, Fluidigm) and fil-tered according to a set of quality control rules(outlined below).For single-cell gene expression level analysis,
the raw data were preprocessed as follows: Foreach gene, including controls, those with a dif-ference of duplicate Ct values ≥2.0 were con-sidered inconsistent and removed. If the controlgene (GAPDH) was not expressed or filtered out,the whole sample was removed. If CtCall = FAILEDbut the sample showed expression of at least oneother gene, it was considered as “not expressed,”and the Ct value was set to 31.9. The relative ex-pression values were calculated according to thefollowing formula: relative expression = 32 –mean(technical replicates).R scripts with the ggplot2 package were used
to construct violin plots and line plots on relativeexpression values. Results shown in the figuresare representative of two independent experiments.The RGL package was used for PCA to cluster
relative expression values on a three-dimensional(3D) principal component space. PCA coordinateswere clustered by the k-means method (40) usingR script.For bulk cell populations, total RNA was iso-
lated from cells using the Quiagen RNAeasy kitand treated with RNAse-free DNAseI (Qiagen)before elution from columns. For gene expressionprofiling, RNA from Maf-DKO macrophages wasextracted using the RNeasyMini Kit (Qiagen) andQIAshredder columns (Qiagen) according to themanufacturer’s instructions. On-column DNA di-gestion was performed. Total RNA (50 ng) wasused for reverse transcription to cDNA usingSuperScriptTM II RT (Invitrogen), Oligo(dT)primers (Invitrogen), andRNaseOUT (Invitrogen).Specific gene target amplification was performedaccording to Fluidigm protocols. Selected TaqManGene Expression assays (20x) were pooled anddiluted with water by a factor of 100, so that eachassay is at a final concentration of 0.2x in thepooled assay mix. For preamplification of eachcDNA sample, 1.25 ml of the respective cDNA,1.25 ml of pooled assay mix, and 2.5 ml of TaqManPreAmp Master Mix (Applied Biosystems, cata-log no. 4391128) were combined to a final volumeof 5 ml in 1 well of a 96-well QPCR plate. cDNAsamples were amplified using the following pro-gram: (i) 95°C for 10 min, (ii) 95°C for 15 s, and(iii) 60°C for 4 min; then repeat steps (ii) and(iii) 14 times.Amplified cDNAsamplesweredilutedat 1:5 using 20 ml of water. For Fluidigm 96.96Dynamic Array IFC analysis, 5 ml of each cDNAsample and 5 ml of each TaqMan probe (20x)were loaded on the chip.Microfluidic real-time PCR using Dynamic
Array IFCs (Biomark Fluidigm) was performed
SCIENCE sciencemag.org 12 FEBRUARY 2016 • VOL 351 ISSUE 6274 aad5510-11
RESEARCH | RESEARCH ARTICLE
with Universal PCR Master Mix and inventoriedTaqMan gene expression assays (Applied Bio-systems) in 96.96 Dynamic Arrays on a BioMarkSystem (Fluidigm). Ct valueswere calculated fromthe system’s software (BioMark Real-time PCRAnalysis, Fluidigm) and filtered according to aset of quality control rules (outlined below).Gene filter: (i) For each gene, including con-
trols, data with CtCall = FAILED and CtQuality <threshold were removed. (ii) For each gene, in-cluding controls, only Ct values that met the fol-lowing criterion were considered: at least 2.0below the lowest Ct value of no-RT or no-RNAcontrols. The purpose of this was to filter out in-efficient probes and genes with very low expres-sion. (iii) For each gene, including controls, valueswith a difference ≥2.0 between Ctmax and Ctmin ofreplicates were considered to be inconsistent andwere removed. (iv) If a genewas removed [accord-ing to filters (i) to (iii)] from uninfected or controlshRNA samples, it was removed from all samples.Sample filter: (i) If the control gene (GAPDH) wasnot expressed or was removed according to genefilters (i) to (iii), the whole sample was removed.(ii) If a control gene (GAPDH) had a Ct valuewitha ≥2.0 difference from the average Ct value ofcontrol genes in all samples, the whole samplewas removed to eliminate nonspecific shRNA andnormalization artifacts. For the heat map, eachCt value was normalized against GAPDH usingthe following formula: relative expressionSample ¼2½meanðCtGAPDH Þ−CtSample � � 100. For each gene, heatmaps in Fig. 2C present normalized values aspercent change over average expression in non-infected and control lacZ shRNA–infected cellsamples.Furthermore, z scores were calculated for each
gene of shRNA-infected cell samples based onuninfected and lacZ control shRNA–infected sam-ples, as described in (31). Briefly, a statistic z wasdefined for each observation oij of transcript i ineach shRNA experiment j
zij ¼ oij − mi
si
wheremi and si are, respectively, the mean andvariance of the expression of transcript i inthe control experiments (uninfected and lacZshRNAs).Two false discovery rate (FDR)–based ap-
proaches were used to obtain confidence esti-mates of the observed z scores. First, a per-geneconfidence score was defined by using the var-iation of that gene’s expression in the controlshRNA experiments. Permuted scores zijk (wherek is the number of permutations) as a null dis-tribution and the FDR for a given z score zij forgene i in experiment j are given as
FDRiðzÞ ¼ Ekð#fzijk jzijk iz; j∈PgÞ#fzij > z; j ¼ 1; :::;ng
where n is the number of shRNA experiments, E isthe expectation, the confidence for z is conf(z) =1 – FDR(z), and P ¼ fcjziciz; c ¼ 1; :::; ng.In the second approach, we defined a per-
shRNA confidence score for each measurementof a self-renewal gene by calculating an FDR
based on the variation of expression in GAPDHand myeloid genes. Formally, we let zij,…,znj bethe scores for the jth experiment (shRNA) andassumed the first l transcripts were controltranscripts whose expression did not changein response to any component. We definedz̃ij ¼ zij−m̃j
s̃jwhere now m̃j and s̃j are, respectively,
the mean and variance of the z scores of thecontrol transcripts 1,…,l in the jth shRNA ex-periment. We performed l permutations, as de-scribed above, by swapping each observed z scorewith a control transcript score and computing z,then computing an FDR as above. For the con-struction of the network model, we consideredonly values with an FDR <0.05 and where atleast half of the replicates fulfilled these criteria.Circle sizes reflect the number of times the ex-pression of a gene is affected by the pertur-bation of another gene, scoring each gene andshRNA replicate separately.For time-course analysis of self-renewal gene
expression in Maf-DKO macrophages and WTBMMs, values were obtained by subtracting theconsidered gene mean across all samples froman individual raw score and then dividing thedifference by the considered gene SD across allsamples. Statistical analysis was performed usingR (version 2.14), heat maps were created usingthe software gene-e (Broad Institute), and net-work diagrams were generated with Cytoscape(version 3.0.2).
Construction of self-renewal gene network
To investigate the potential for cross-regulationbetween self-renewal genes, data from a quadru-plicate nanofluidic real-time PCR on Fluidigmarray, presented in Fig. 2C, were reanalyzed, andz score computations were used to decide wheth-er a given shRNA regulated its specific targetmRNA and whether this regulation affected theexpression of other genes (control or self-renewalgenes). Computations were performed accordingto per-gene and per-shRNA computation meth-ods, as described above and with the followingadditional considerations: (i) With the exceptionof Myc and Chd1, for which only one shRNA wasfound to effectively knock down the expressionof said target, all self-renewal genes were effec-tively targeted by two shRNAs. Therefore, tobalance the number of replicates per sample soas not to undercount the number of regulationsrelative to other shRNAs, all of the regulationswhere shMyc and shChd1 were involved werecounted twice for subsequent computations. (ii)The regulation of a gene upon expression of agiven shRNA was not taken into account unlessmore than two replicates for gene expressionwere significantly regulated, regardless of thecomputation method considered. This concernedonly 13 of 86 regulations that were subsequentlyfiltered out for the per-gene computation andnone for the per-shRNA computation. (iii) Allautoregulations (shGene-x regulating Gene-x) wereconsidered trivial and were thus removed. (iv)Baseline expression of all genes was determinedaccording to average expression levels in controlsamples.
Together, these data were used to construct agene regulation network (depicted in Fig. 3B).The size of the bubble for each gene in thenetwork was drawn relative to the number oftimes the gene was regulated by an shRNA forwhich it was not the direct target. A line wasdrawn to connect genes when the shRNA reg-ulated the expression of a nontarget RNA at leasttwo of the four times tested for at least one of twoshRNAs in both computations. Given that thereare two shRNAs per gene, four gene expressionreplicates, and two computation methods, 16regulations could be evaluated for a given shRNA.When all 16 regulations were significant and thesame, the lines in Fig. 3B were drawn in black;otherwise, they were drawn in gray. The red endof the arrows indicates a repression of the gene bythe shRNA, whereas the blue end indicates ac-tivation. Genes targeted only by shRNA with sta-tistical significance in only one computation (singlenodes) were not represented.
REFERENCES AND NOTES
1. S. J. Jenkins et al., Local macrophage proliferation, rather thanrecruitment from the blood, is a signature of TH2 inflammation.Science 332, 1284–1288 (2011). pmid: 21566158
2. C. Schulz et al., A lineage of myeloid cells independent ofMyb and hematopoietic stem cells. Science 336, 86–90(2012). doi: 10.1126/science.1219179; pmid: 22442384
3. S. Yona et al., Fate mapping reveals origins and dynamics ofmonocytes and tissue macrophages under homeostasis.Immunity 38, 79–91 (2013). pmid: 23273845
4. D. Hashimoto et al., Tissue-resident macrophages self-maintainlocally throughout adult life with minimal contribution fromcirculating monocytes. Immunity 38, 792–804 (2013).doi: 10.1016/j.immuni.2013.04.004; pmid: 23601688
5. M. H. Sieweke, J. E. Allen, Beyond stem cells: Self-renewal ofdifferentiated macrophages. Science 342, 1242974 (2013).doi: 10.1126/science.1242974; pmid: 24264994
6. E. L. Gautier et al., Gene-expression profiles and transcriptionalregulatory pathways that underlie the identity and diversityof mouse tissue macrophages. Nat. Immunol. 13, 1118–1128(2012).pmid: 23023392
7. A. Aziz, E. Soucie, S. Sarrazin, M. H. Sieweke, MafB/c-Mafdeficiency enables self-renewal of differentiated functionalmacrophages. Science 326, 867–871 (2009). doi: 10.1126/science.1176056; pmid: 19892988
8. G. Fejer et al., Nontransformed, GM-CSF-dependentmacrophage lines are a unique model to study tissuemacrophage functions. Proc. Natl. Acad. Sci. U.S.A. 110,E2191–E2198 (2013). doi: 10.1073/pnas.1302877110;pmid: 23708119
9. N. D. Heintzman et al., Histone modifications at humanenhancers reflect global cell-type-specific gene expression.Nature 459, 108–112 (2009). doi: 10.1038/nature07829;pmid: 19295514
10. G. Natoli, Maintaining cell identity through global control ofgenomic organization. Immunity 33, 12–24 (2010).doi: 10.1016/j.immuni.2010.07.006; pmid: 20643336
11. S. Ghisletti et al., Identification and characterization ofenhancers controlling the inflammatory gene expressionprogram in macrophages. Immunity 32, 317–328 (2010).doi: 10.1016/j.immuni.2010.02.008; pmid: 20206554
12. S. Heinz et al., Simple combinations of lineage-determiningtranscription factors prime cis-regulatory elementsrequired for macrophage and B cell identities. Mol. Cell 38,576–589 (2010). doi: 10.1016/j.molcel.2010.05.004;pmid: 20513432
13. M. P. Creyghton et al., Histone H3K27ac separates active frompoised enhancers and predicts developmental state. Proc. Natl.Acad. Sci. U.S.A. 107, 21931–21936 (2010). doi: 10.1073/pnas.1016071107; pmid: 21106759
14. G. Natoli, J. C. Andrau, Noncoding transcription at enhancers:General principles and functional models. Annu. Rev. Genet.46, 1–19 (2012). doi: 10.1146/annurev-genet-110711-155459;pmid: 22905871
aad5510-12 12 FEBRUARY 2016 • VOL 351 ISSUE 6274 sciencemag.org SCIENCE
RESEARCH | RESEARCH ARTICLE
15. D. Gosselin et al., Environment drives selection and function ofenhancers controlling tissue-specific macrophage identities.Cell 159, 1327–1340 (2014). doi: 10.1016/j.cell.2014.11.023;pmid: 25480297
16. Y. Lavin et al., Tissue-resident macrophage enhancerlandscapes are shaped by the local microenvironment. Cell159, 1312–1326 (2014). pmid: 25480296
17. R. Ostuni et al., Latent enhancers activated by stimulation indifferentiated cells. Cell 152, 157–171 (2013). doi: 10.1016/j.cell.2012.12.018; pmid: 23332752
18. A. Visel et al., ChIP-seq accurately predicts tissue-specificactivity of enhancers. Nature 457, 854–858 (2009).doi: 10.1038/nature07730; pmid: 19212405
19. A. Rada-Iglesias et al., A unique chromatin signature uncoversearly developmental enhancers in humans. Nature 470,279–283 (2011). doi: 10.1038/nature09692; pmid: 21160473
20. C. Y. McLean et al., GREAT improves functional interpretationof cis-regulatory regions. Nat. Biotechnol. 28, 495–501 (2010).doi: 10.1038/nbt.1630; pmid: 20436461
21. D. J. Wong et al., Module map of stem cell genes guides creation ofepithelial cancer stem cells. Cell Stem Cell 2, 333–344 (2008).doi: 10.1016/j.stem.2008.02.009; pmid: 18397753
22. N. Ivanova et al., Dissecting self-renewal in stem cells with RNAinterference. Nature 442, 533–538 (2006). doi: 10.1038/nature04915; pmid: 16767105
23. J. Z. Zhang et al., Screening for genes essential for mouseembryonic stem cell self-renewal using a subtractive RNAinterference library. Stem Cells 24, 2661–2668 (2006).doi: 10.1634/stemcells.2006-0017; pmid: 16960129
24. M. Pritsker, N. R. Ford, H. T. Jenq, I. R. Lemischka,Genomewide gain-of-function genetic screen identifiesfunctionally active genes in mouse embryonic stem cells.Proc. Natl. Acad. Sci. U.S.A. 103, 6946–6951 (2006).doi: 10.1073/pnas.0509861103; pmid: 16621925
25. J. Hall et al., Oct4 and LIF/Stat3 additively induce Krüppelfactors to sustain embryonic stem cell self-renewal. Cell StemCell 5, 597–609 (2009). doi: 10.1016/j.stem.2009.11.003;pmid: 19951688
26. J. Jiang et al., A core Klf circuitry regulates self-renewal ofembryonic stem cells. Nat. Cell Biol. 10, 353–360 (2008).doi: 10.1038/ncb1698; pmid: 18264089
27. A. Gaspar-Maia et al., Chd1 regulates open chromatin andpluripotency of embryonic stem cells. Nature 460, 863–868(2009).pmid: 19587682
28. G. Hu et al., A genome-wide RNAi screen identifies a newtranscriptional module required for self-renewal. Genes Dev.23, 837–848 (2009). doi: 10.1101/gad.1769609;pmid: 19339689
29. L. Ding et al., A genome-scale RNAi screen for Oct4modulators defines a role of the Paf1 complex for embryonicstem cell identity. Cell Stem Cell 4, 403–415 (2009).doi: 10.1016/j.stem.2009.03.009; pmid: 19345177
30. B. D. Macarthur, A. Ma’ayan, I. R. Lemischka, Systems biologyof stem cell fate and cellular reprogramming. Nat. Rev. Mol.Cell Biol. 10, 672–681 (2009). pmid: 19738627
31. I. Amit et al., Unbiased reconstruction of a mammaliantranscriptional network mediating pathogen responses.Science 326, 257–263 (2009). doi: 10.1126/science.1179050;pmid: 19729616
32. Y. Bakri et al., Balance of MafB and PU.1 specifiesalternative macrophage or dendritic cell fate. Blood 105,2707–2716 (2005). doi: 10.1182/blood-2004-04-1448;pmid: 15598817
33. R. Gentek, K. Molawi, M. H. Sieweke, Tissue macrophageidentity and self-renewal. Immunol. Rev. 262, 56–73 (2014).doi: 10.1111/imr.12224; pmid: 25319327
34. L. C. Davies et al., Distinct bone marrow-derived andtissue-resident macrophage lineages proliferate at key stagesduring inflammation. Nat. Commun. 4, 1886 (2013).doi: 10.1038/ncomms2877; pmid: 23695680
35. S. J. Jenkins et al., IL-4 directly signals tissue-residentmacrophages to proliferate beyond homeostatic levelscontrolled by CSF-1. J. Exp. Med. 210, 2477–2491 (2013).doi: 10.1084/jem.20121999; pmid: 24101381
36. J. A. Hamilton, G. A. Whitty, I. Kola, P. J. Hertzog, EndogenousIFN-alpha beta suppresses colony-stimulating factor (CSF)-1-stimulated macrophage DNA synthesis and mediatesinhibitory effects of lipopolysaccharide and TNF-alpha.J. Immunol. 156, 2553–2557 (1996). pmid: 8786318
37. H. Motohashi, K. Igarashi, MafB as a type I interferon rheostat.Nat. Immunol. 11, 695–696 (2010). doi: 10.1038/ni0810-695;pmid: 20644578
38. A. Valouev et al., Genome-wide analysis of transcriptionfactor binding sites based on ChIP-Seq data. Nat. Methods5, 829–834 (2008). doi: 10.1038/nmeth.1246;pmid: 19160518
39. A. J. Saldanha, Java Treeview—Extensible visualizationof microarray data. Bioinformatics 20, 3246–3248(2004). doi: 10.1093/bioinformatics/bth349;pmid: 15180930
40. J. A. Hartigan, M. A. Wong, A K-means clustering algorithm.J. R. Stat. Soc. C Appl. Stat. 28, 100–108 (1979).
ACKNOWLEDGMENTS
We thank N. Spies for advice on statistical analysis, L. Chasson forimmunofluorescence processing, and S. Vargas-Aguilar forreagents. The data presented in this manuscript are tabulated in themain paper and in the supplementary materials. Sequencing datacan be accessed in Gene Expression Omnibus under accessionnumber GSE75722. E.L.S. received fellowships from the EuropeanUnion Marie Curie program and La Fondation de France. E.L.S. andP.D. were supported by La Ligue Nationale Contre le Cancer(Equipe Labelisée), K.M. by a Human Frontier Science Programlong-term fellowship and Stiftung Charité, L.G. by the FondationARC pour la Recherche sur le Cancer, J.-C.A. by the Fondationpour la Recherche Médicale (grant AJE20130728183), A.S. bythe NIH National Institute on Aging (grant P01AG036695), andM.H.S. by the Agence Nationale de la Recherche (grantANR-11-BSV3-026-01) and Institut National du Cancer (grant13-10/405/AB-LC-HS). M.H.S. is an Einstein-BIH fellow andFondation pour la Recherche Médicale (grant DEQ20110421320)and INSERM-Helmholtz group leader.
SUPPLEMENTARY MATERIALS
www.sciencemag.org/content/351/6274/aad5510/suppl/DC1Figs. S1 to S13Tables S1 to S4References
29 September 2015; accepted 22 December 2015Published online 21 January 2016;10.1126/science.aad5510
SCIENCE sciencemag.org 12 FEBRUARY 2016 • VOL 351 ISSUE 6274 aad5510-13
RESEARCH | RESEARCH ARTICLE
DOI: 10.1126/science.aad5510, (2016);351 Science
et al.Erinn L. Souciemacrophages and embryonic stem cellsLineage-specific enhancers activate self-renewal genes in
This copy is for your personal, non-commercial use only.
clicking here.colleagues, clients, or customers by , you can order high-quality copies for yourIf you wish to distribute this article to others
here.following the guidelines
can be obtained byPermission to republish or repurpose articles or portions of articles
): February 22, 2016 www.sciencemag.org (this information is current as of
The following resources related to this article are available online at
/content/351/6274/aad5510.full.htmlversion of this article at:
including high-resolution figures, can be found in the onlineUpdated information and services,
/content/suppl/2016/01/20/science.aad5510.DC1.html can be found at: Supporting Online Material
/content/351/6274/aad5510.full.html#ref-list-1, 13 of which can be accessed free:cites 40 articlesThis article
/cgi/collection/immunologyImmunology
/cgi/collection/geneticsGenetics
subject collections:This article appears in the following
registered trademark of AAAS. is aScience2016 by the American Association for the Advancement of Science; all rights reserved. The title
CopyrightAmerican Association for the Advancement of Science, 1200 New York Avenue NW, Washington, DC 20005. (print ISSN 0036-8075; online ISSN 1095-9203) is published weekly, except the last week in December, by theScience
on F
ebru
ary
22, 2
016
Dow
nloa
ded
from