Embed Size (px)
Citation preview
Gene Ontology and
Functional Enrichment
Genome 559: Introduction to Statistical and
Computational Genomics
Elhanan Borenstein
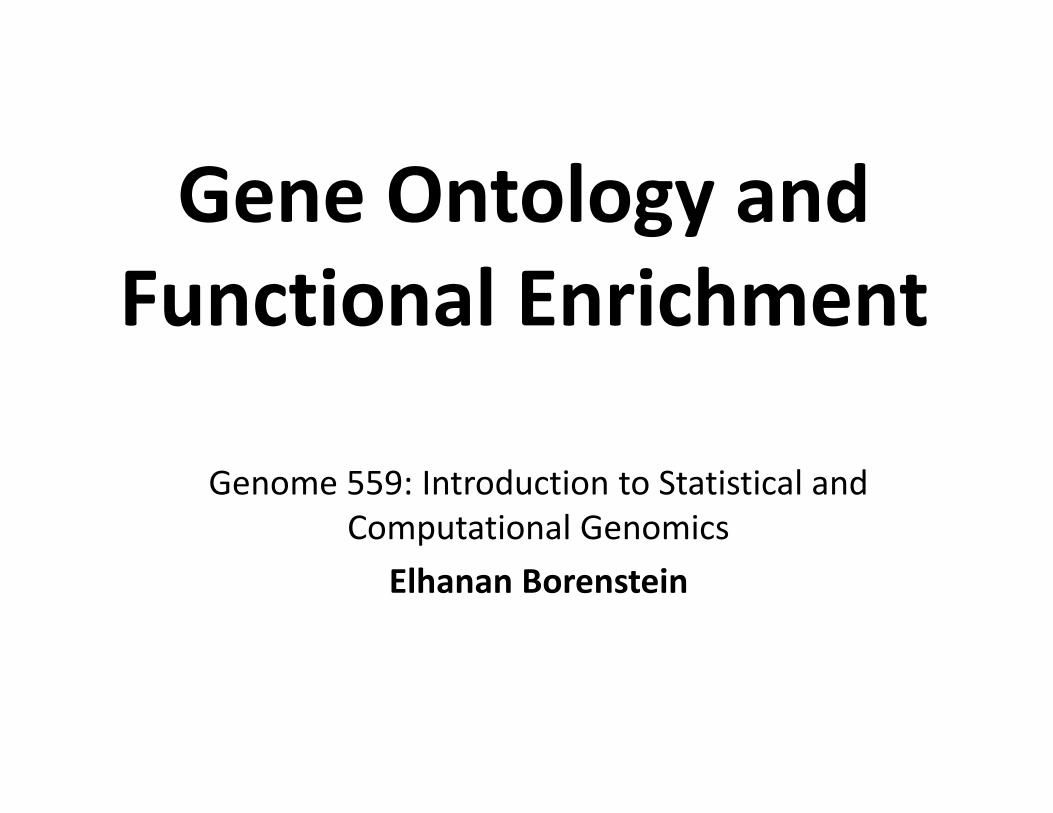
� The parsimony principle:
� Find the tree that requires the
fewest evolutionary changes!
� A fundamentally different method:
� Search rather than reconstruct
� Parsimony algorithm
1. Construct all possible trees
2. For each site in the alignment and for each tree count the
minimal number of changes required
3. Add sites to obtain the total number of changes required
for each tree
4. Pick the tree with the lowest score
A quick review
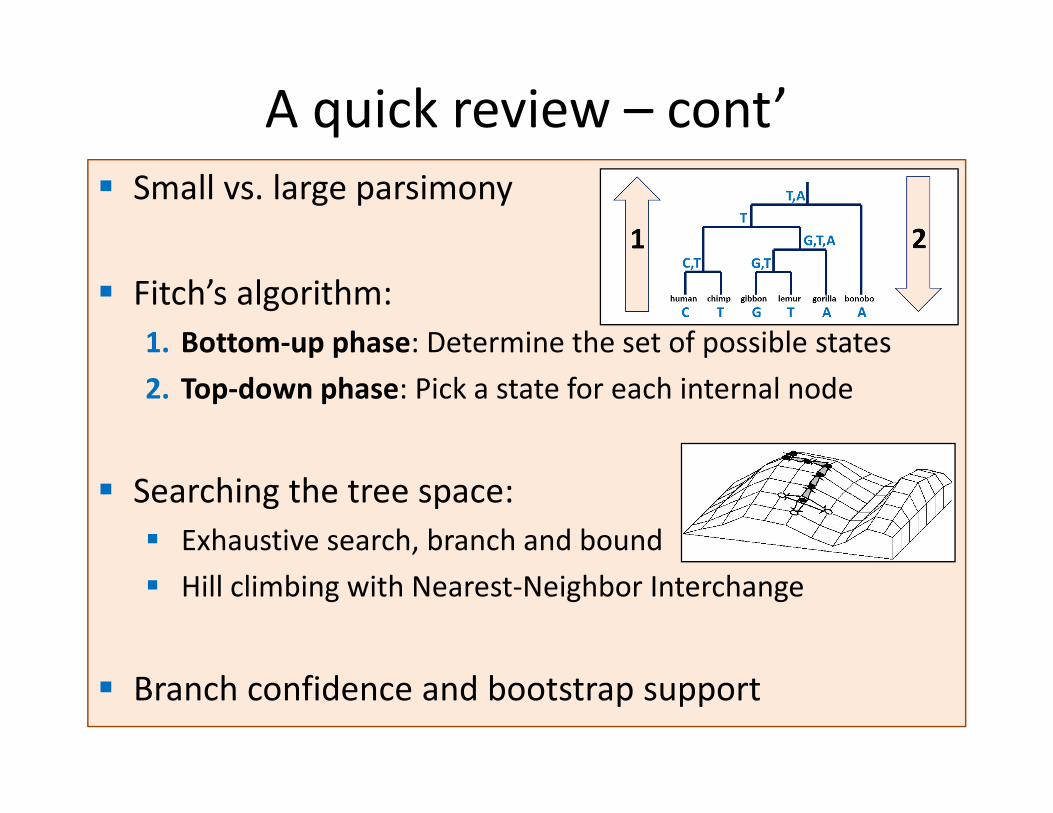
� Small vs. large parsimony
� Fitch’s algorithm:
1. Bottom-up phase: Determine the set of possible states
2. Top-down phase: Pick a state for each internal node
� Searching the tree space:
� Exhaustive search, branch and bound
� Hill climbing with Nearest-Neighbor Interchange
� Branch confidence and bootstrap support
A quick review – cont’
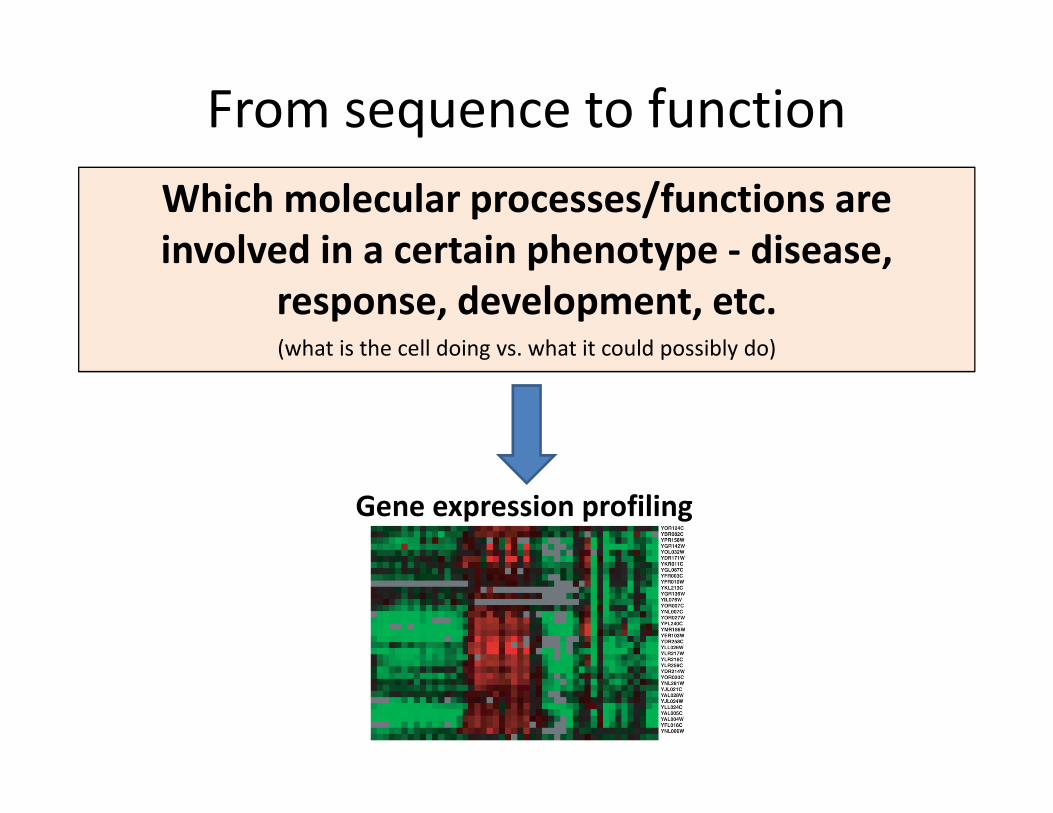
From sequence to function
Which molecular processes/functions are
involved in a certain phenotype - disease,
response, development, etc. (what is the cell doing vs. what it could possibly do)
Gene expression profiling
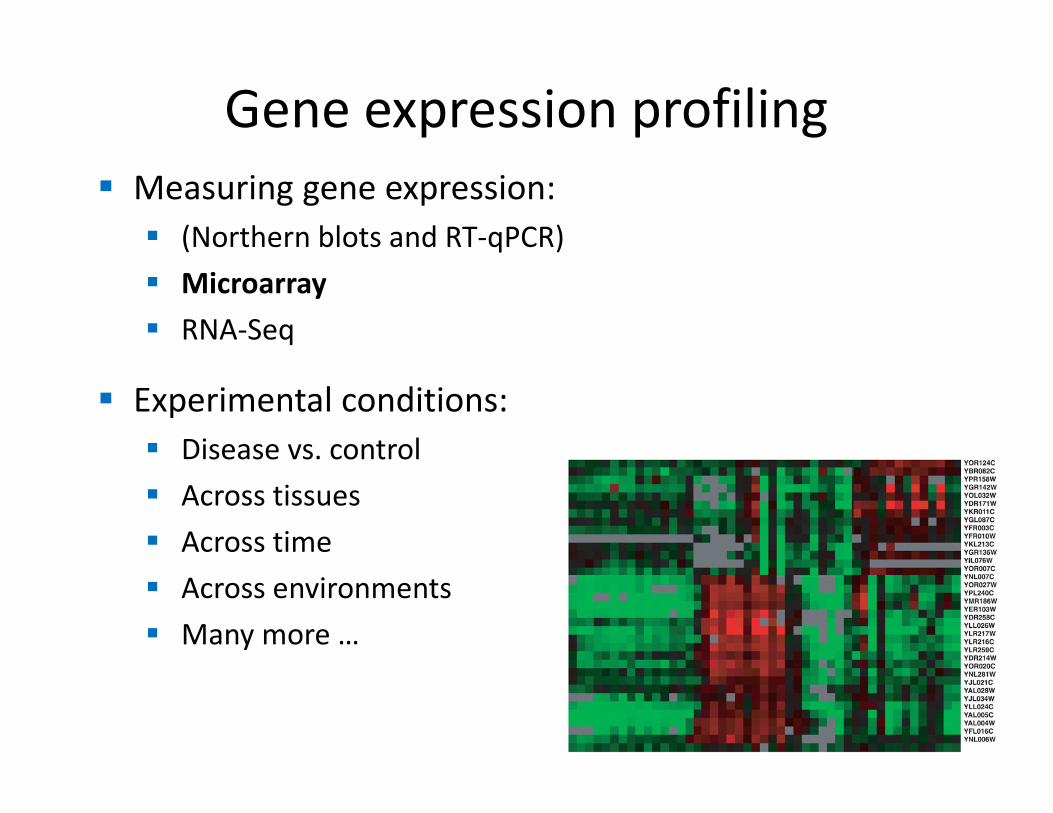
� Measuring gene expression:
� (Northern blots and RT-qPCR)
� Microarray
� RNA-Seq
� Experimental conditions:
� Disease vs. control
� Across tissues
� Across time
� Across environments
� Many more …
Gene expression profiling
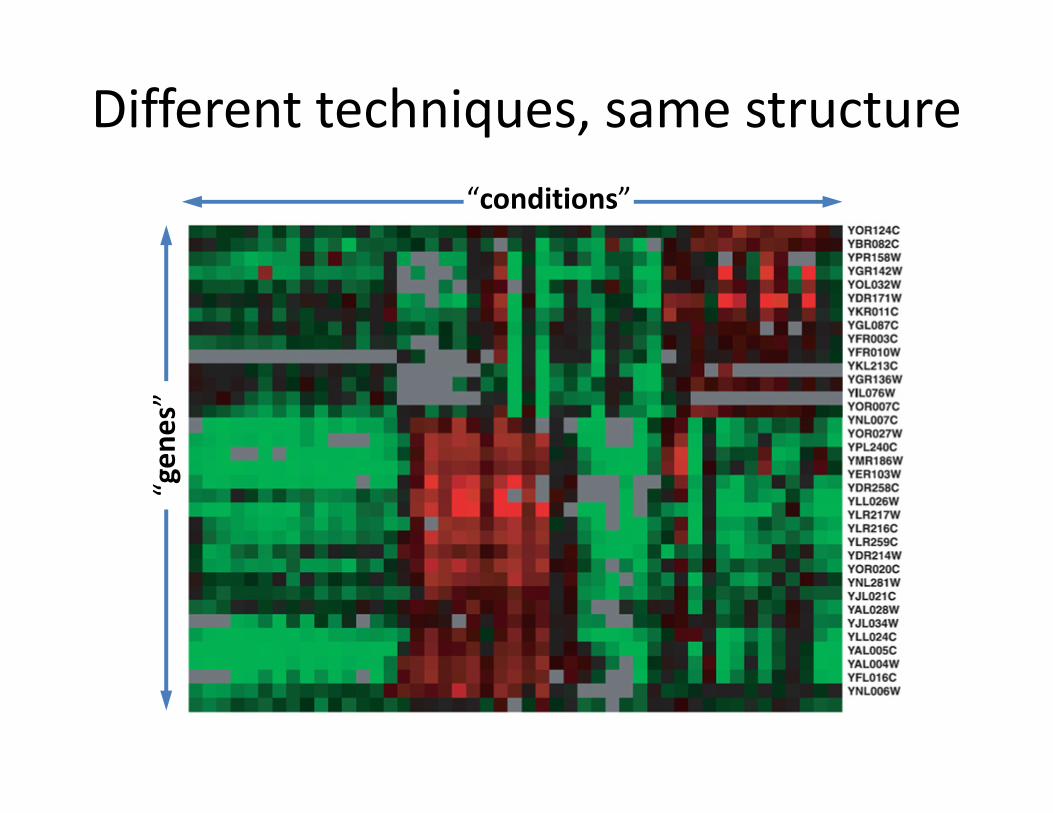
Different techniques, same structure
“conditions”“g
en
es”
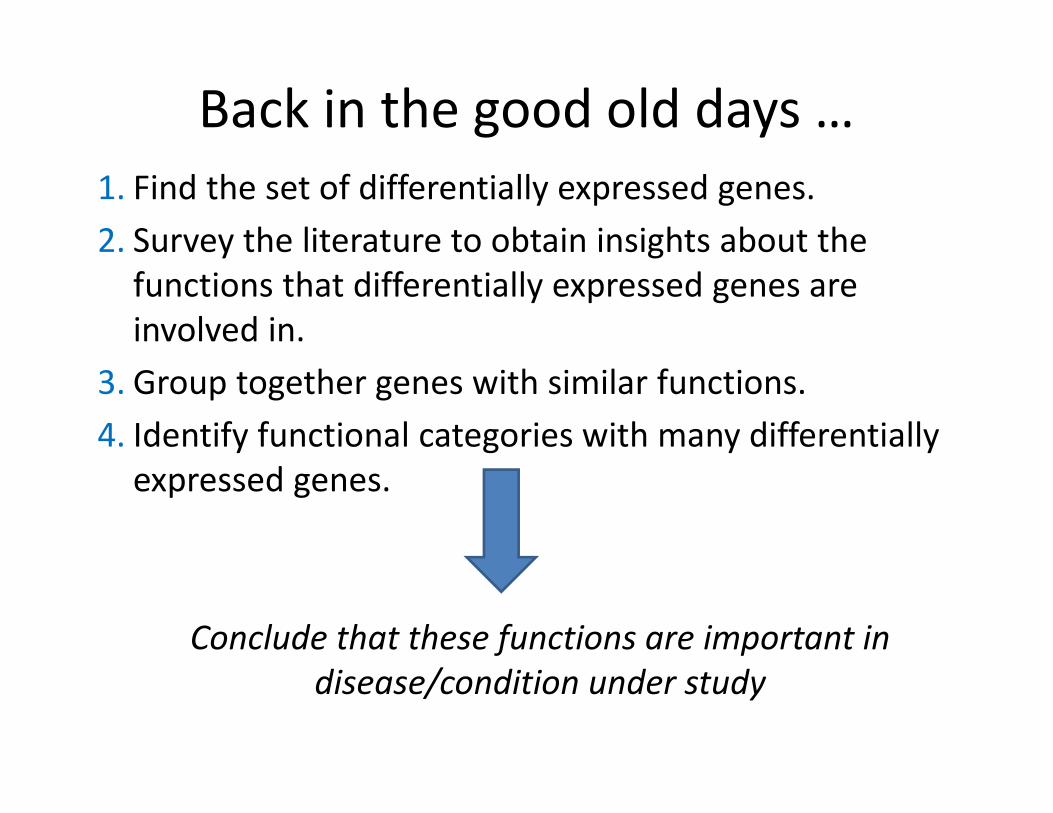
1. Find the set of differentially expressed genes.
2. Survey the literature to obtain insights about the
functions that differentially expressed genes are
involved in.
3. Group together genes with similar functions.
4. Identify functional categories with many differentially
expressed genes.
Conclude that these functions are important in
disease/condition under study
Back in the good old days …
Time-consuming
Not systematic
Extremely subjective
No statistical validation
The good old days were not so good!
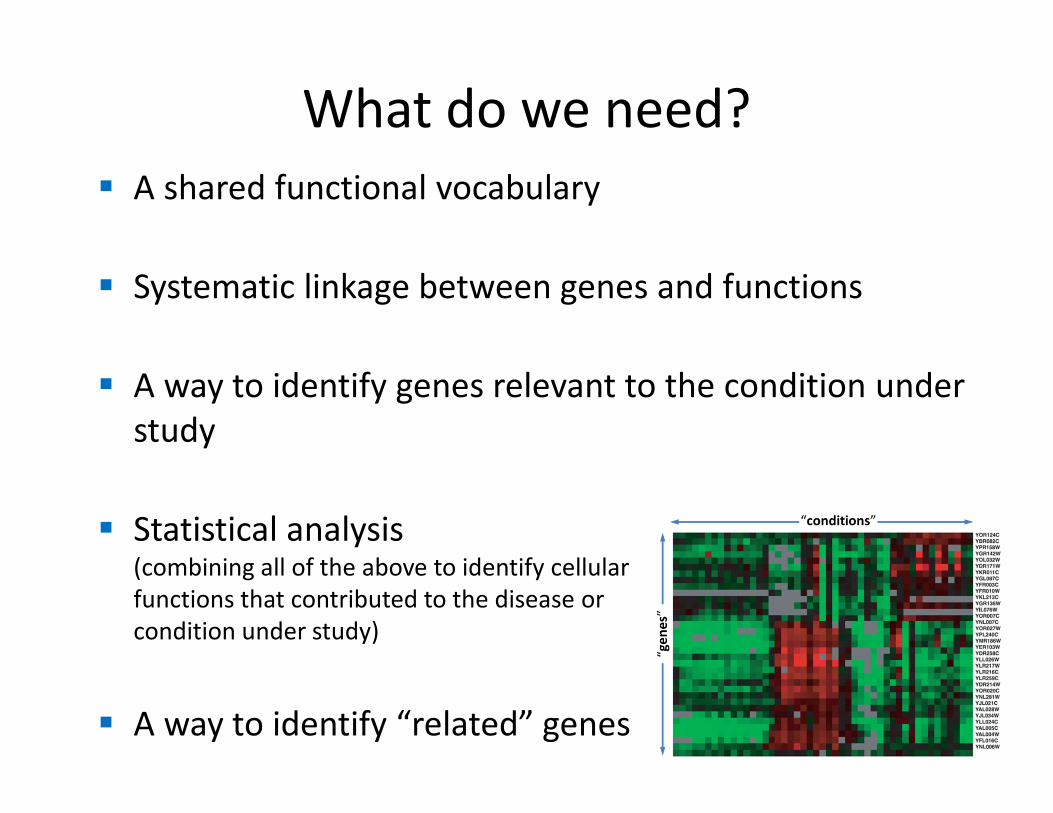
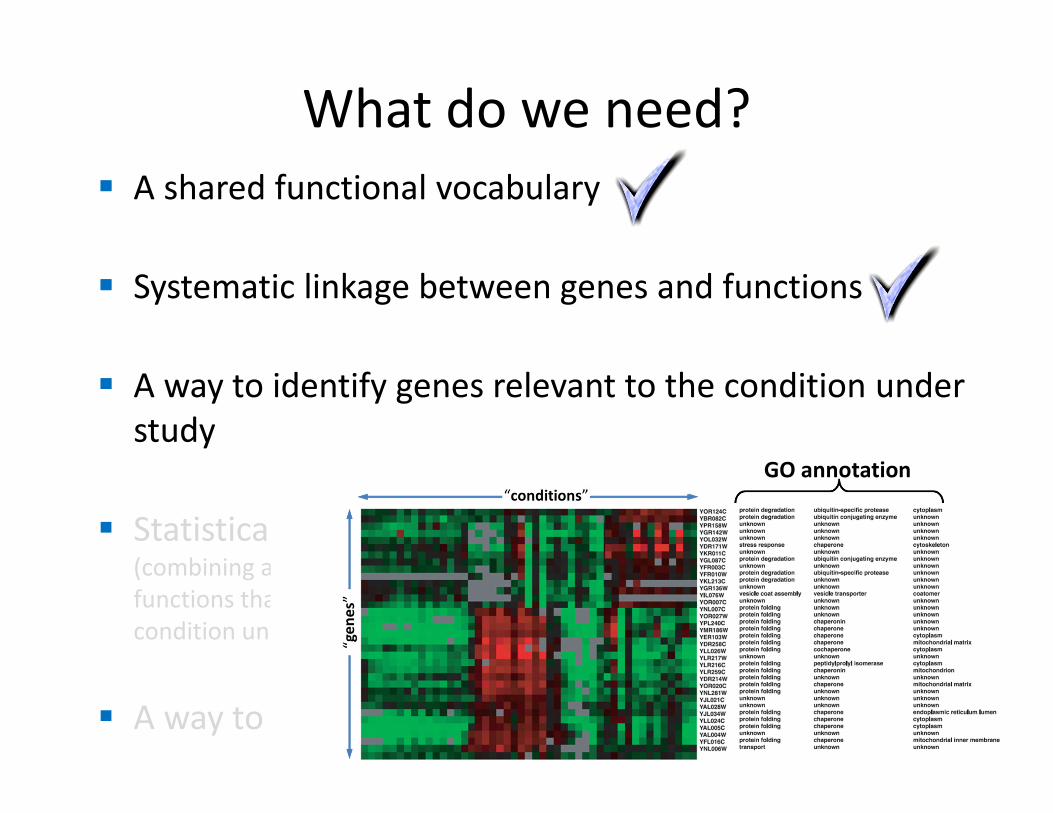
What do we need?
� A shared functional vocabulary
� Systematic linkage between genes and functions
� A way to identify genes relevant to the condition under
study
� Statistical analysis(combining all of the above to identify cellular
functions that contributed to the disease or
condition under study)
� A way to identify “related” genes
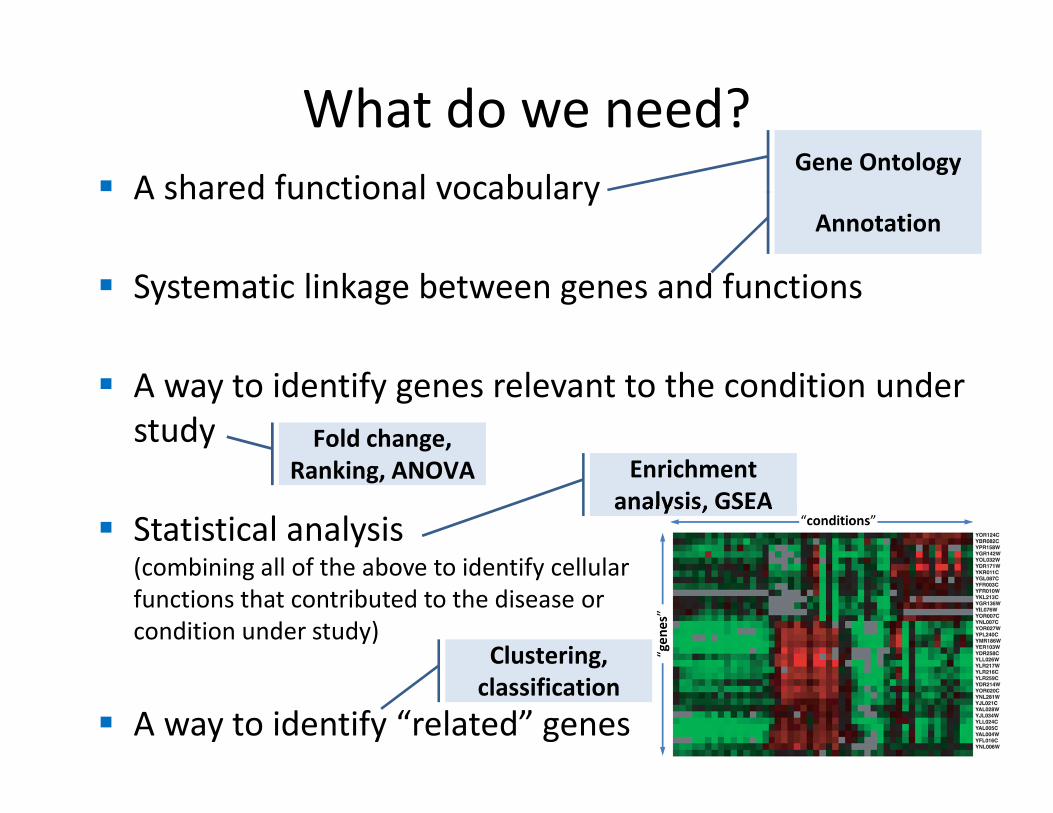
Gene Ontology
Annotation
Fold change,
Ranking, ANOVA
Clustering,
classification
Enrichment
analysis, GSEA
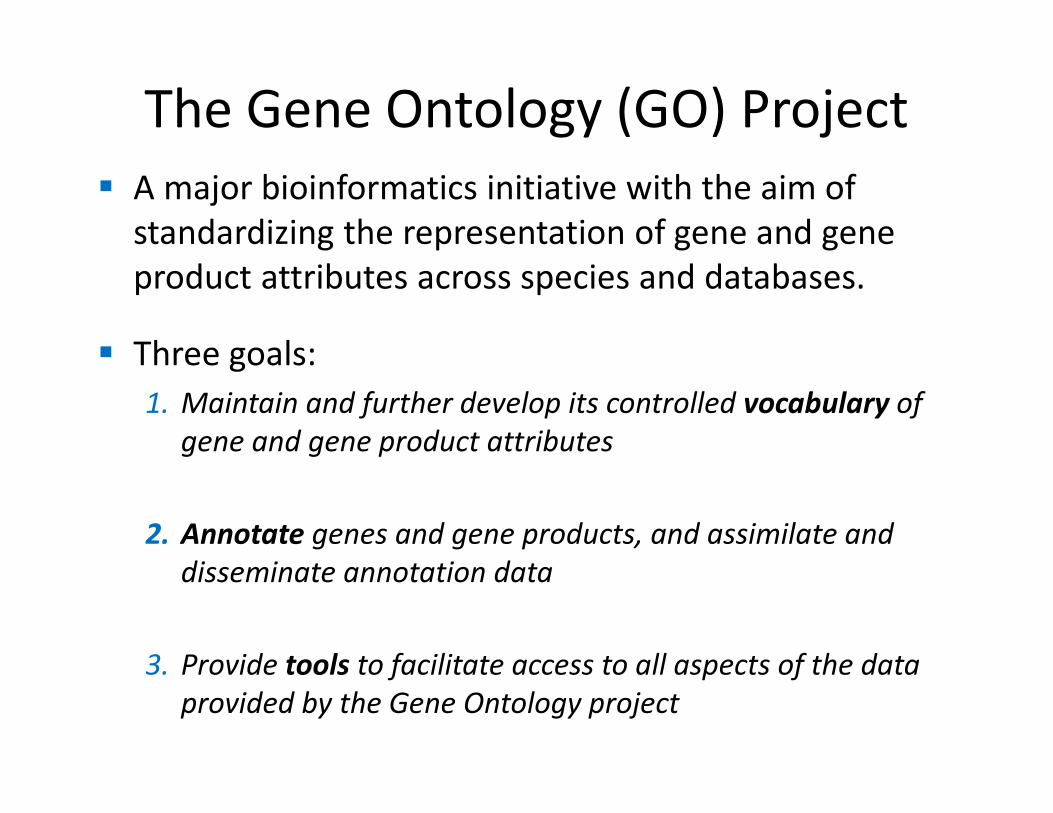
� A major bioinformatics initiative with the aim of
standardizing the representation of gene and gene
product attributes across species and databases.
� Three goals:
1. Maintain and further develop its controlled vocabulary of
gene and gene product attributes
2. Annotate genes and gene products, and assimilate and
disseminate annotation data
3. Provide tools to facilitate access to all aspects of the data
provided by the Gene Ontology project
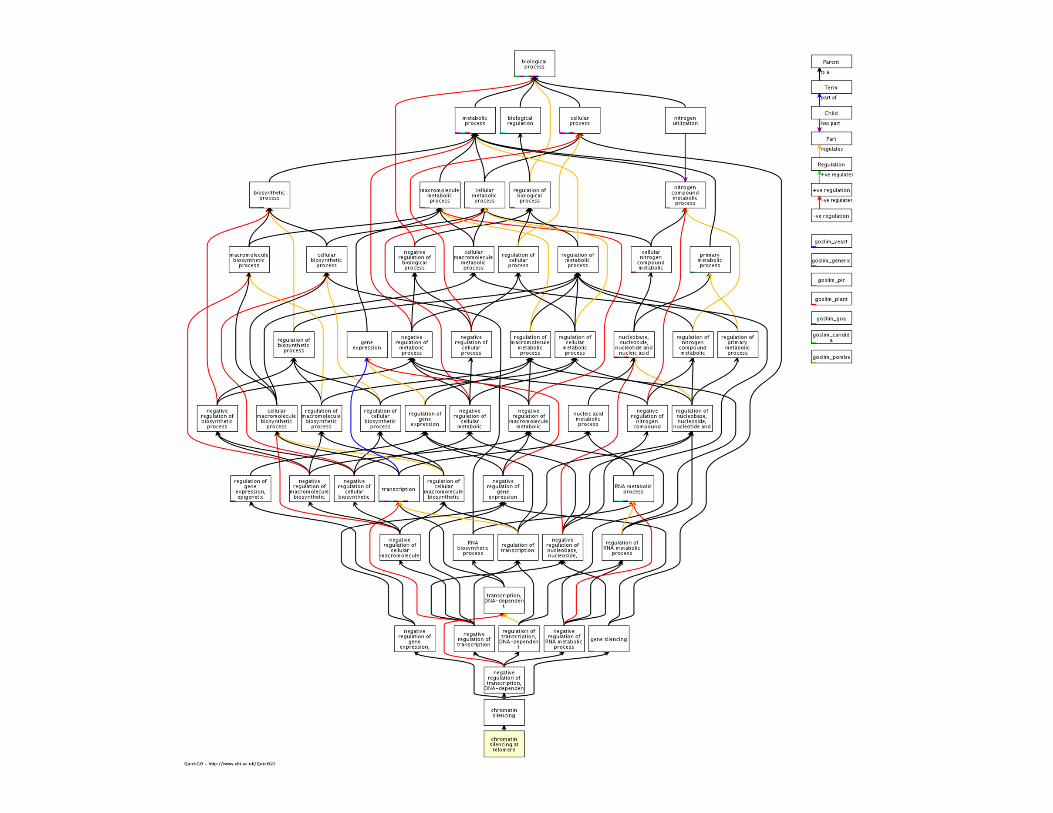
The Gene Ontology (GO) Project
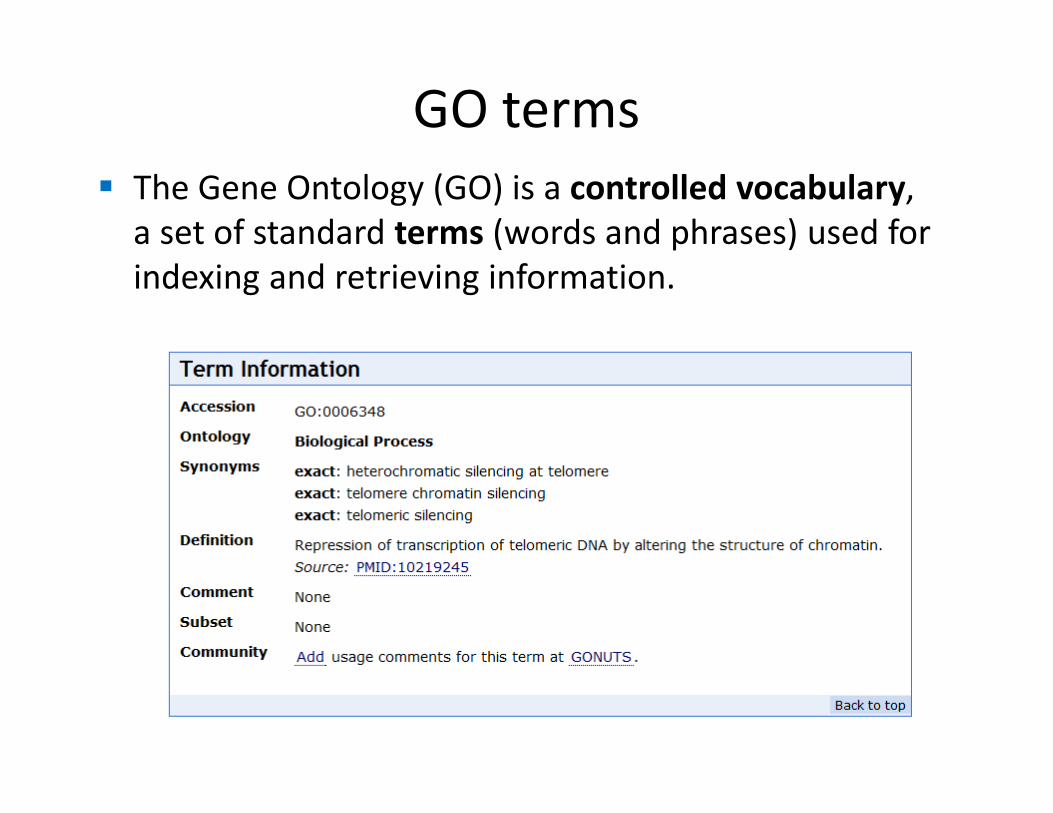
� The Gene Ontology (GO) is a controlled vocabulary,
a set of standard terms (words and phrases) used for
indexing and retrieving information.
GO terms
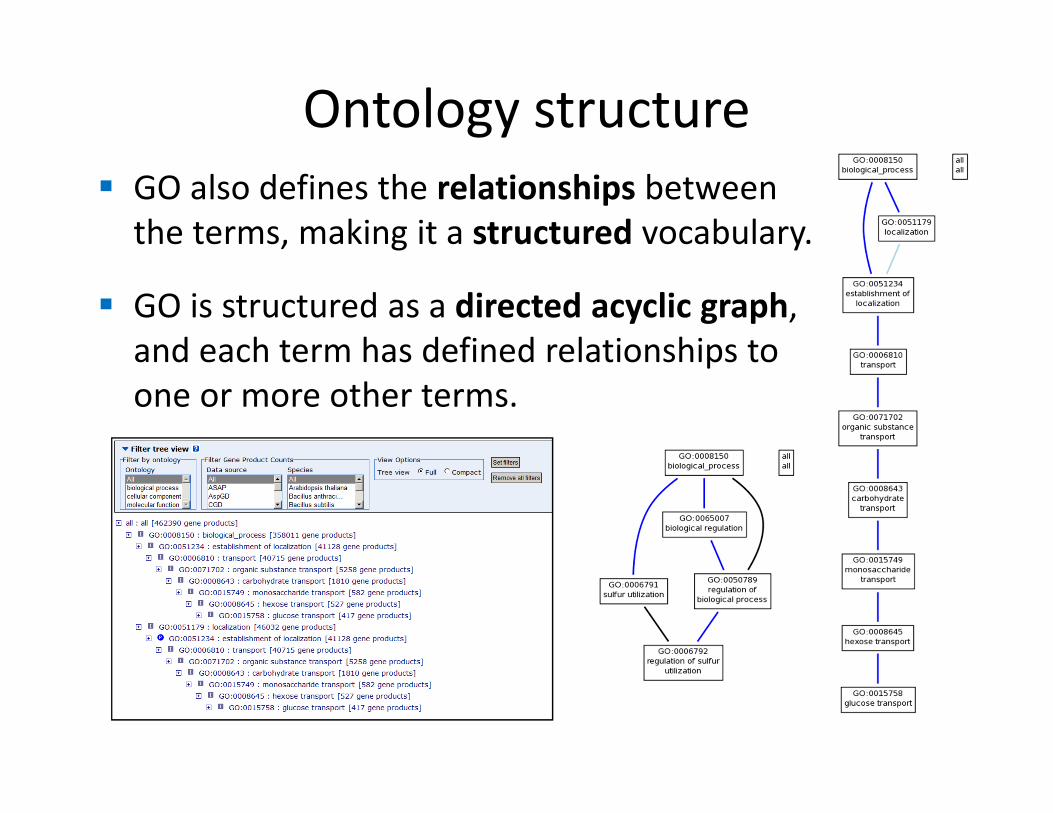
� GO also defines the relationships between
the terms, making it a structured vocabulary.
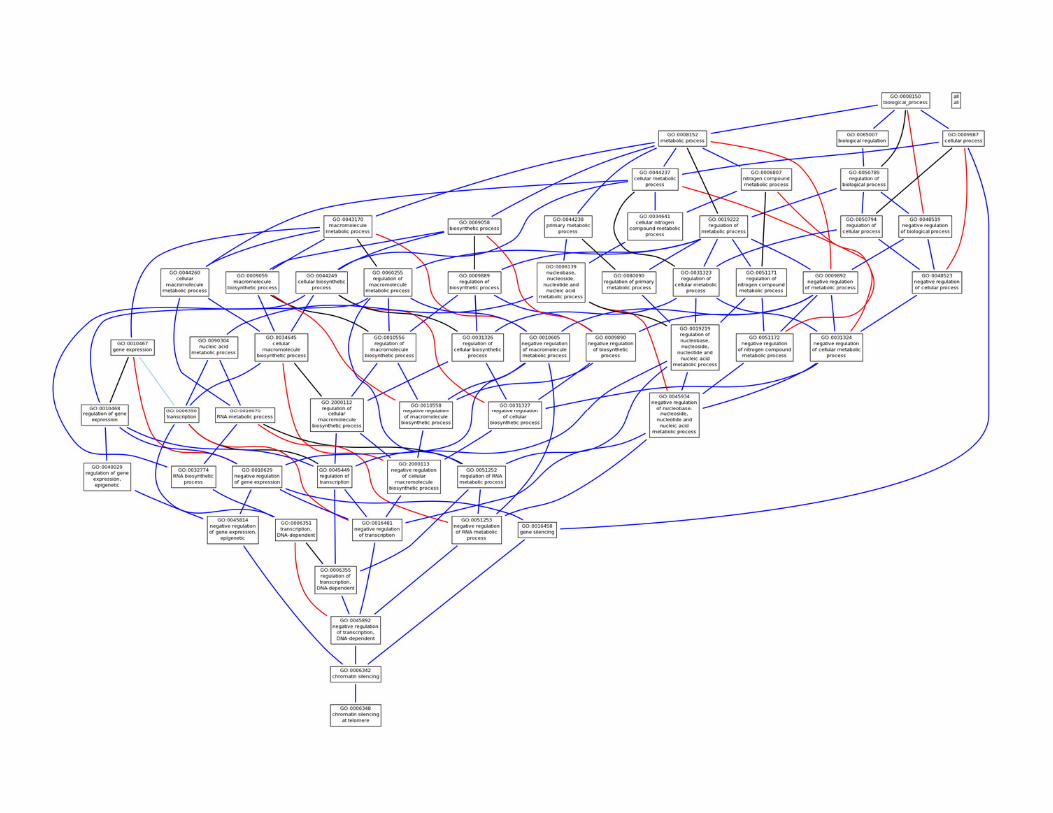
� GO is structured as a directed acyclic graph,
and each term has defined relationships to
one or more other terms.
Ontology structure
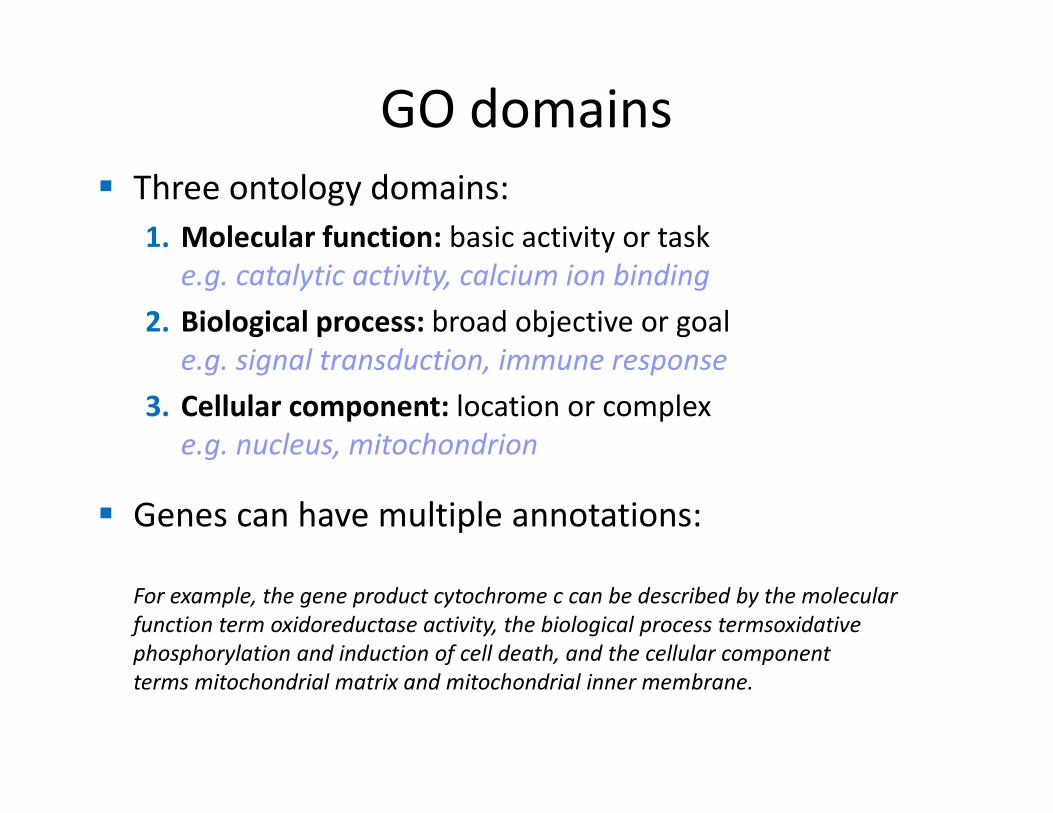
� Three ontology domains:
1. Molecular function: basic activity or task
e.g. catalytic activity, calcium ion binding
2. Biological process: broad objective or goal
e.g. signal transduction, immune response
3. Cellular component: location or complex
e.g. nucleus, mitochondrion
� Genes can have multiple annotations:
For example, the gene product cytochrome c can be described by the molecular
function term oxidoreductase activity, the biological process termsoxidative
phosphorylation and induction of cell death, and the cellular component
terms mitochondrial matrix and mitochondrial inner membrane.
GO domains
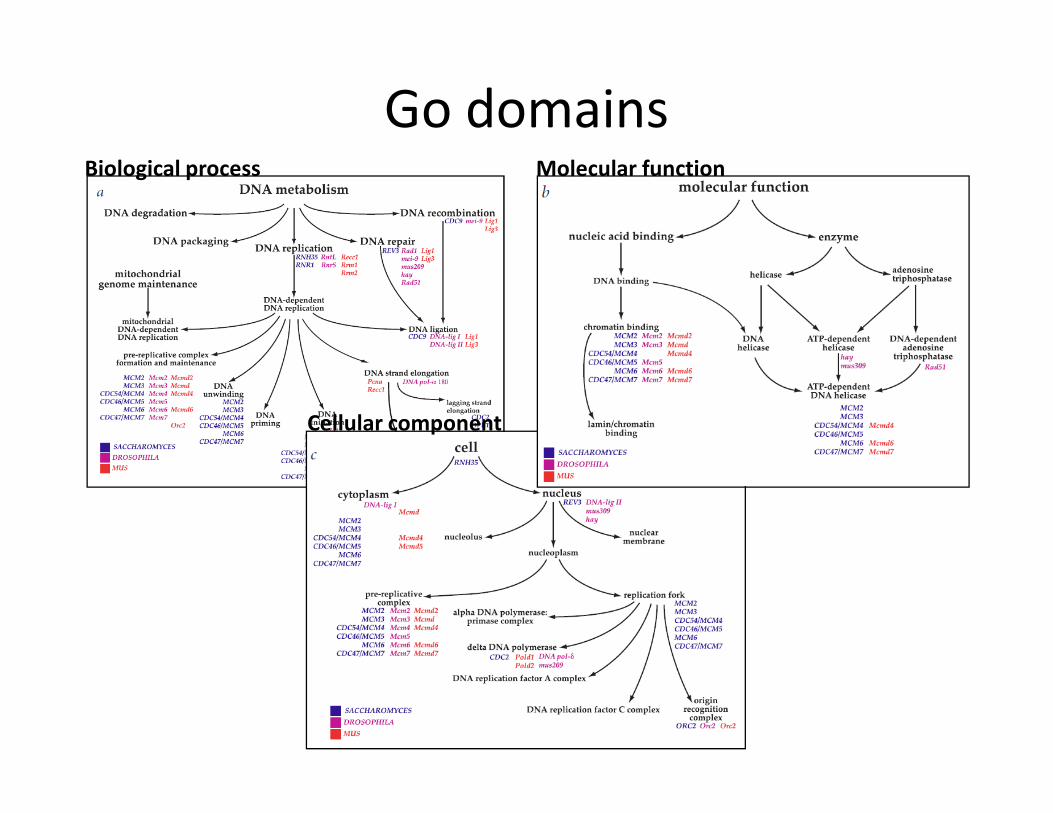
Go domainsMolecular functionBiological process
Cellular component
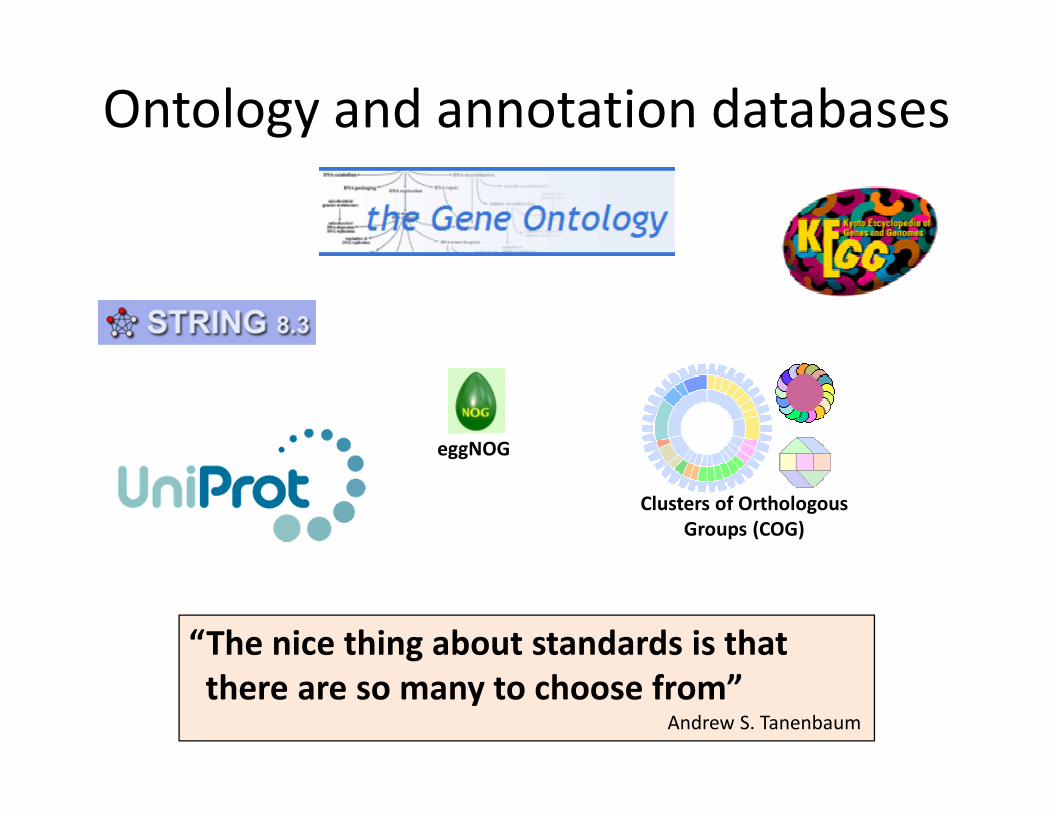
Ontology and annotation databases
Clusters of Orthologous
Groups (COG)
eggNOG
“The nice thing about standards is that
there are so many to choose from”Andrew S. Tanenbaum
� A shared functional vocabulary
� Systematic linkage between genes and functions
� A way to identify genes relevant to the condition under
study
� Statistical analysis(combining all of the above to identify cellular
functions that contributed to the disease or
condition under study)
� A way to identify “related” genes
What do we need?
� A shared functional vocabulary
� Systematic linkage between genes and functions
� A way to identify genes relevant to the condition under
studyGO annotation
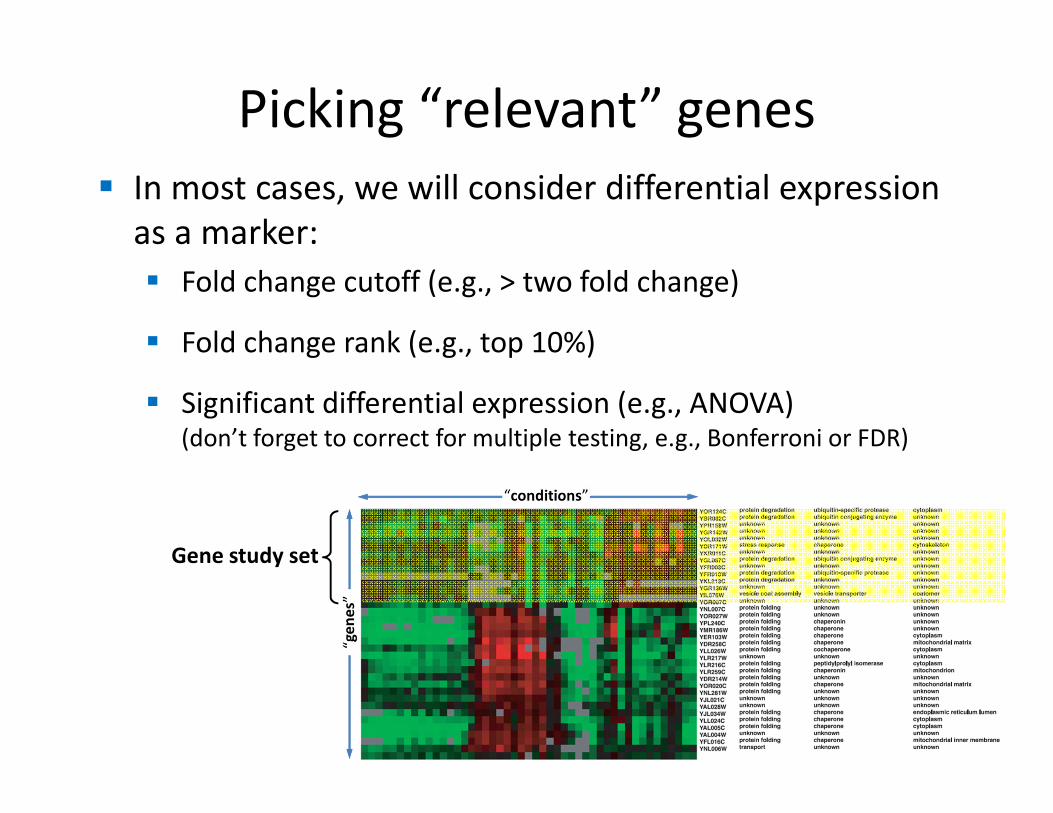
Picking “relevant” genes
� In most cases, we will consider differential expression
as a marker:
� Fold change cutoff (e.g., > two fold change)
� Fold change rank (e.g., top 10%)
� Significant differential expression (e.g., ANOVA)(don’t forget to correct for multiple testing, e.g., Bonferroni or FDR)
Gene study set
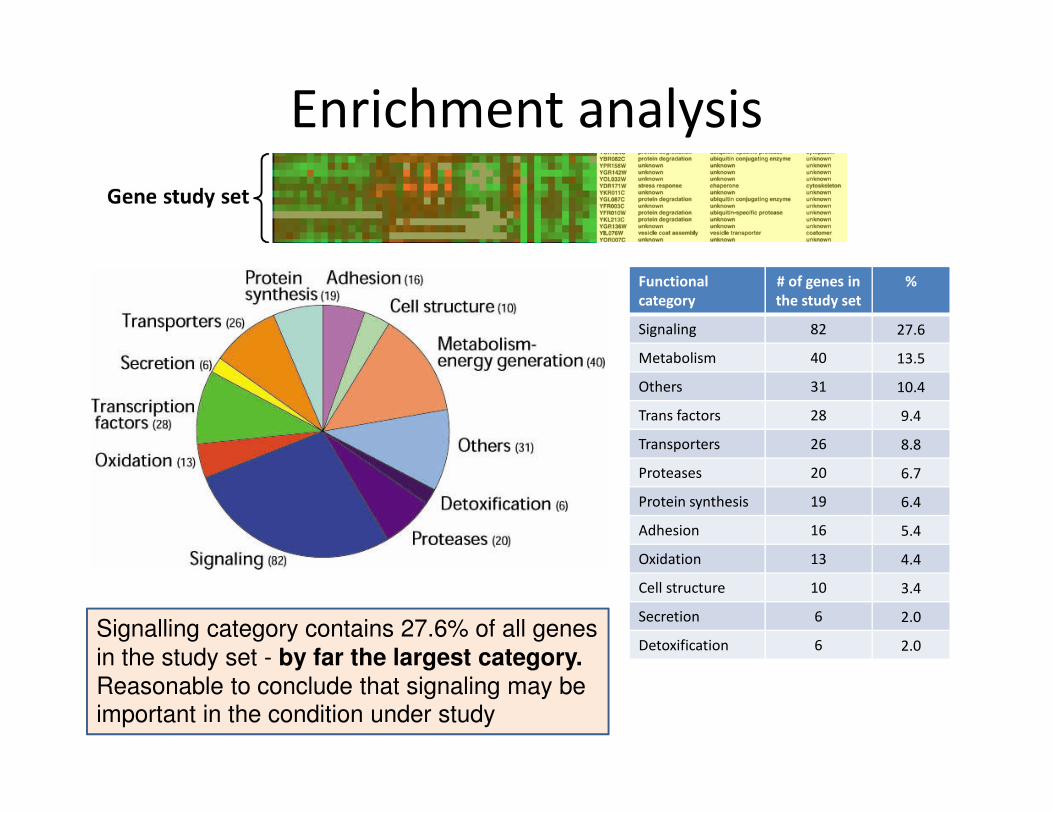
Enrichment analysis
Functional
category
# of genes in
the study set
%
Signaling 82 27.6
Metabolism 40 13.5
Others 31 10.4
Trans factors 28 9.4
Transporters 26 8.8
Proteases 20 6.7
Protein synthesis 19 6.4
Adhesion 16 5.4
Oxidation 13 4.4
Cell structure 10 3.4
Secretion 6 2.0
Detoxification 6 2.0Signalling category contains 27.6% of all genes
in the study set - by far the largest category.
Reasonable to conclude that signaling may be important in the condition under study
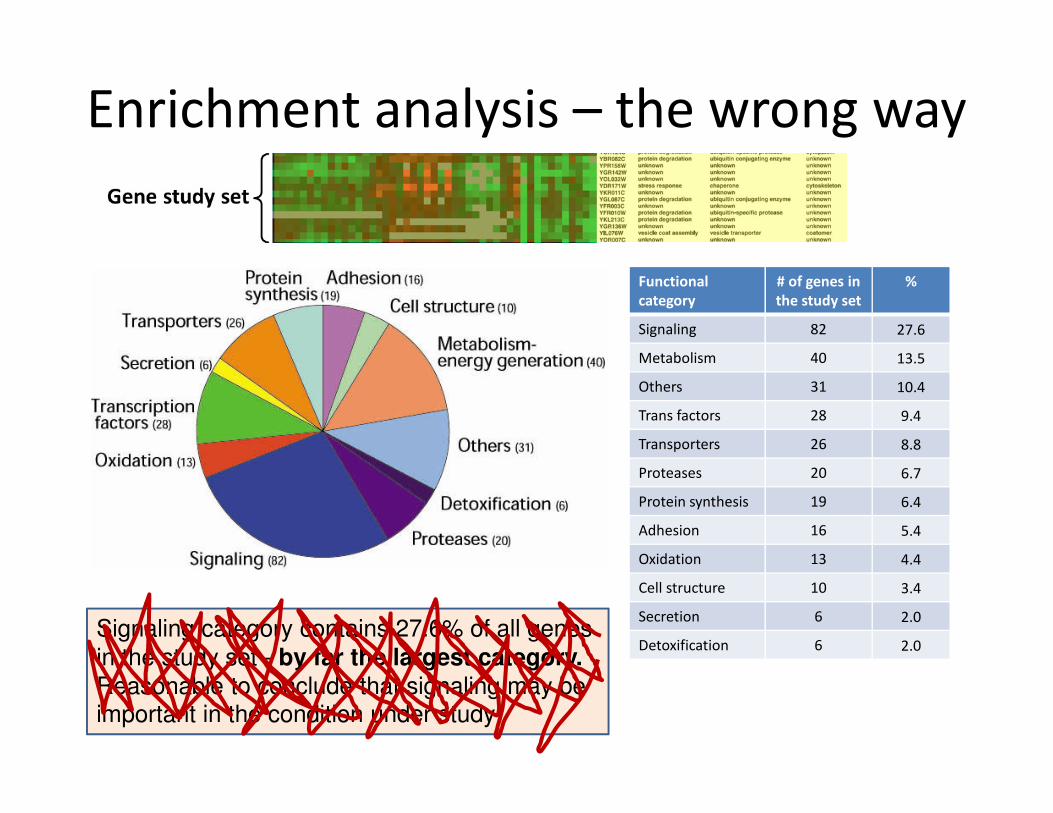
Enrichment analysis – the wrong way
Functional
category
# of genes in
the study set
%
Signaling 82 27.6
Metabolism 40 13.5
Others 31 10.4
Trans factors 28 9.4
Transporters 26 8.8
Proteases 20 6.7
Protein synthesis 19 6.4
Adhesion 16 5.4
Oxidation 13 4.4
Cell structure 10 3.4
Secretion 6 2.0
Detoxification 6 2.0Signaling category contains 27.6% of all genes
in the study set - by far the largest category.
Reasonable to conclude that signaling may be important in the condition under study
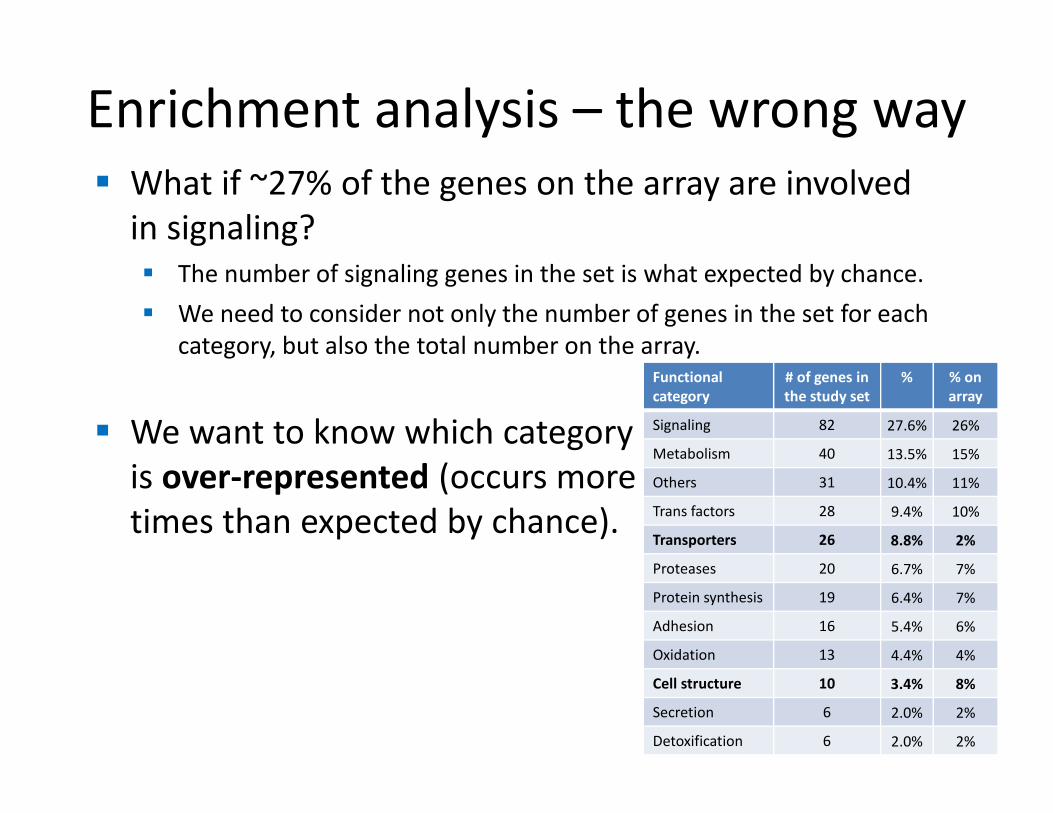
� What if ~27% of the genes on the array are involved
in signaling?
� The number of signaling genes in the set is what expected by chance.
� We need to consider not only the number of genes in the set for each
category, but also the total number on the array.
� We want to know which category
is over-represented (occurs more
times than expected by chance).
Enrichment analysis – the wrong way
Functional
category
# of genes in
the study set
% % on
array
Signaling 82 27.6% 26%
Metabolism 40 13.5% 15%
Others 31 10.4% 11%
Trans factors 28 9.4% 10%
Transporters 26 8.8% 2%
Proteases 20 6.7% 7%
Protein synthesis 19 6.4% 7%
Adhesion 16 5.4% 6%
Oxidation 13 4.4% 4%
Cell structure 10 3.4% 8%
Secretion 6 2.0% 2%
Detoxification 6 2.0% 2%
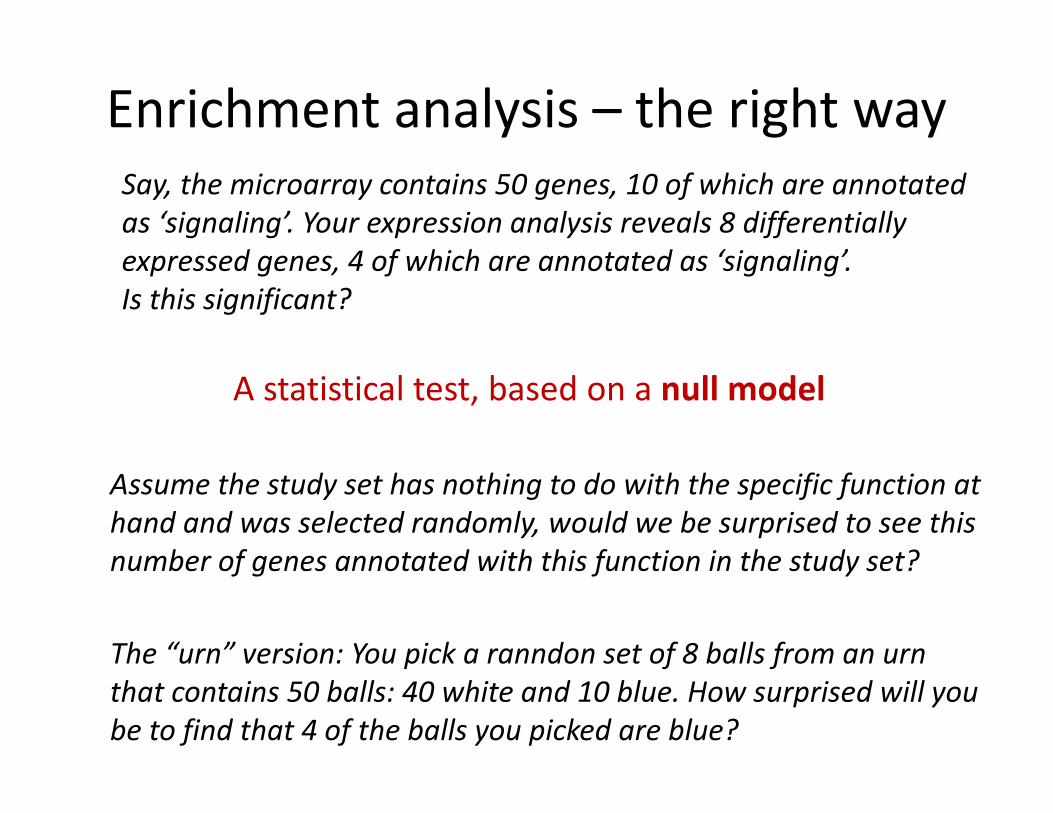
Enrichment analysis – the right way
Say, the microarray contains 50 genes, 10 of which are annotated
as ‘signaling’. Your expression analysis reveals 8 differentially
expressed genes, 4 of which are annotated as ‘signaling’.
Is this significant?
A statistical test, based on a null model
Assume the study set has nothing to do with the specific function at
hand and was selected randomly, would we be surprised to see this
number of genes annotated with this function in the study set?
The “urn” version: You pick a ranndon set of 8 balls from an urn
that contains 50 balls: 40 white and 10 blue. How surprised will you
be to find that 4 of the balls you picked are blue?
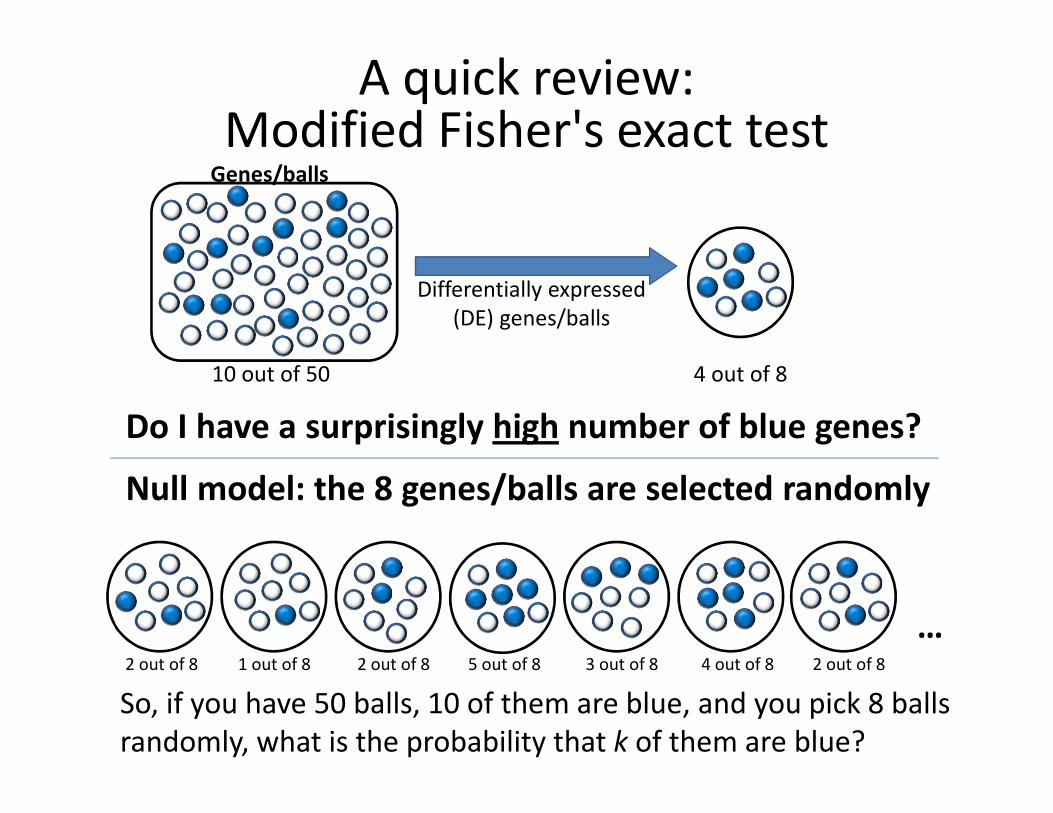
A quick review:Modified Fisher's exact test
Differentially expressed
(DE) genes/balls
4 out of 810 out of 50
2 out of 8 2 out of 84 out of 81 out of 8 2 out of 8 5 out of 8 3 out of 8
Null model: the 8 genes/balls are selected randomly
…
So, if you have 50 balls, 10 of them are blue, and you pick 8 balls
randomly, what is the probability that k of them are blue?
Do I have a surprisingly high number of blue genes?
Genes/balls
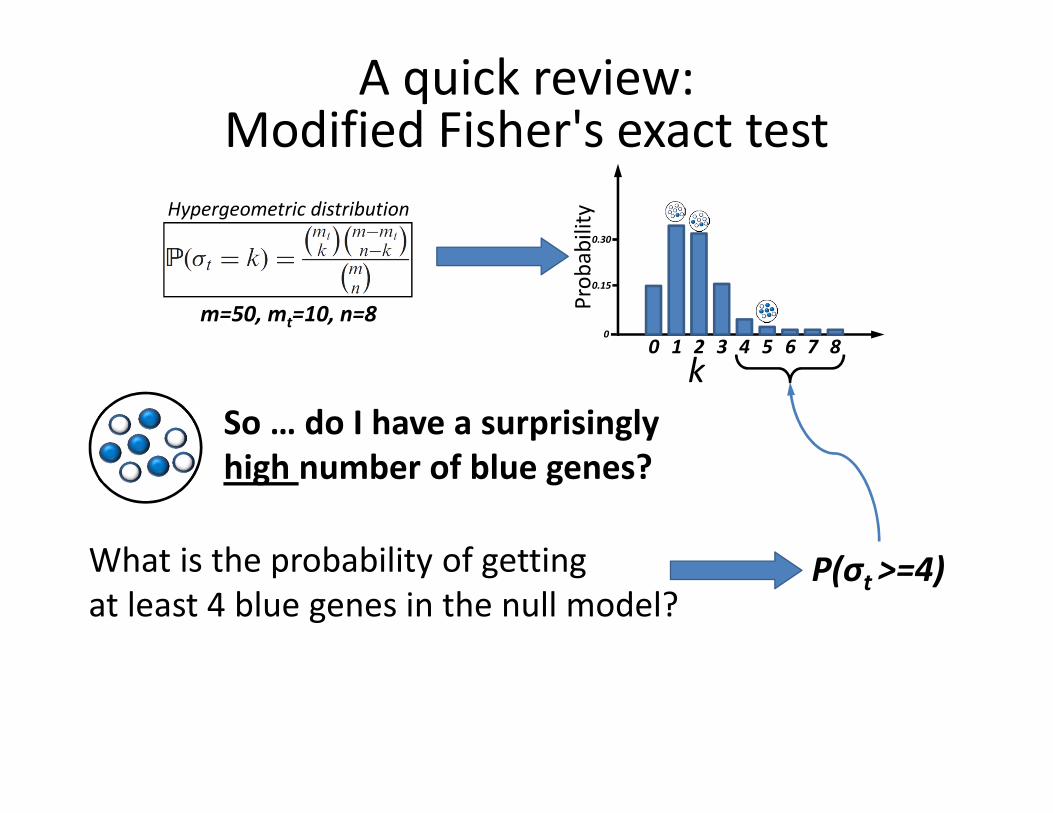
A quick review:Modified Fisher's exact test
m=50, mt=10, n=8
Hypergeometric distribution
So … do I have a surprisingly
high number of blue genes?
What is the probability of getting
at least 4 blue genes in the null model?P(σt >=4)
Pro
ba
bil
ity
k0 1 2 3 4 5 6 7 8
0.15
0.30
0
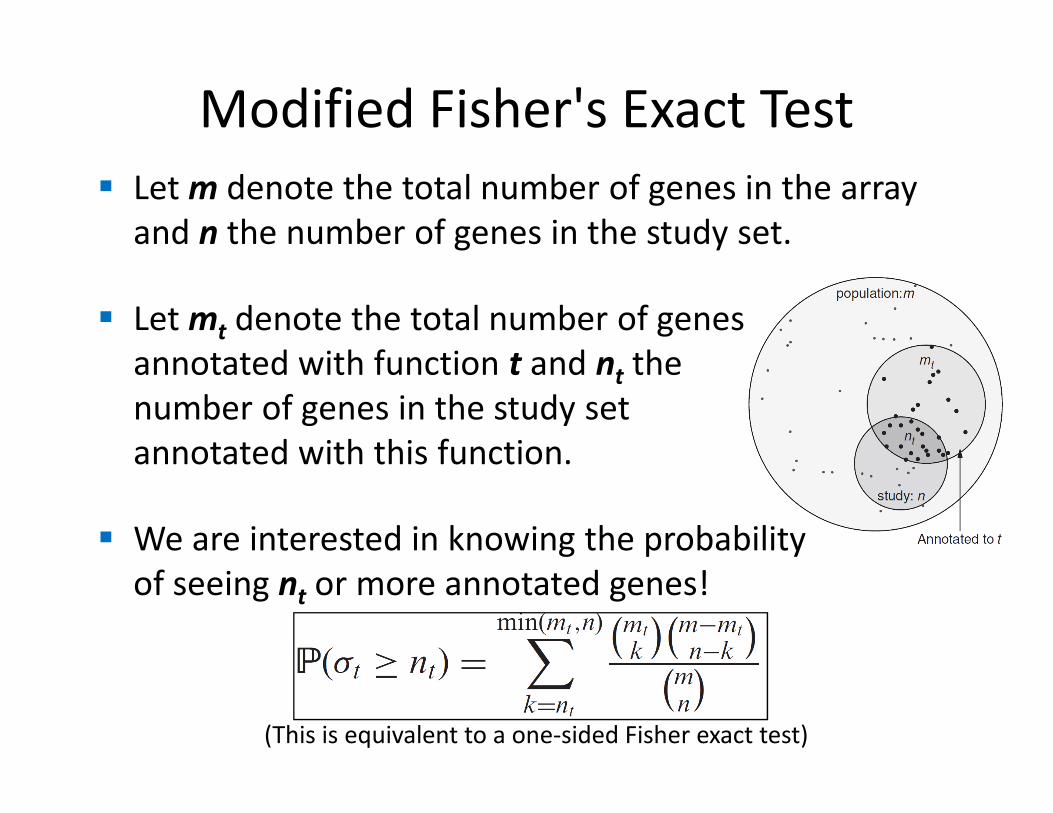
Modified Fisher's Exact Test
� Let m denote the total number of genes in the array
and n the number of genes in the study set.
� Let mt denote the total number of genes
annotated with function t and nt the
number of genes in the study set
annotated with this function.
� We are interested in knowing the probability
of seeing nt or more annotated genes!
(This is equivalent to a one-sided Fisher exact test)
� A shared functional vocabulary
� Systematic linkage between genes and functions
� A way to identify genes relevant to the condition under
study
� Statistical analysis(combining all of the above to identify cellular
functions that contributed to the disease or
condition under study)
� A way to identify “related” genes
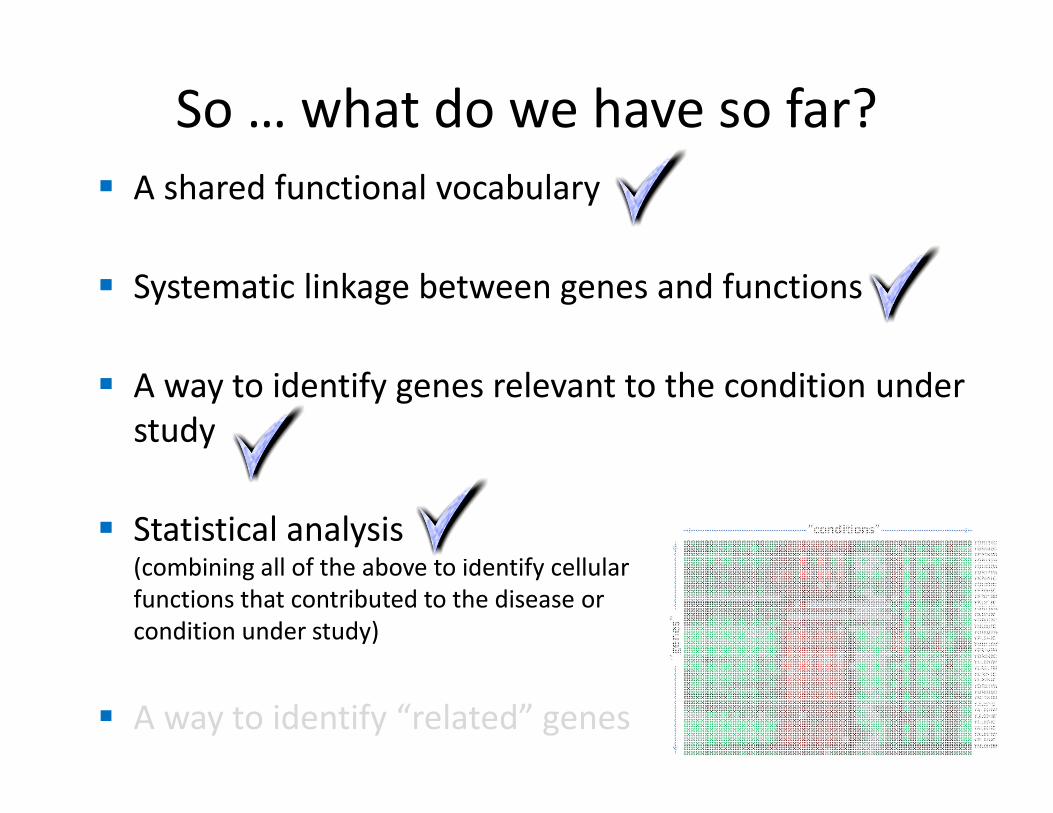
So … what do we have so far?
� A shared functional vocabulary
� Systematic linkage between genes and functions
� A way to identify genes relevant to the condition under
study
� Statistical analysis(combining all of the above to identify cellular
functions that contributed to the disease or
condition under study)
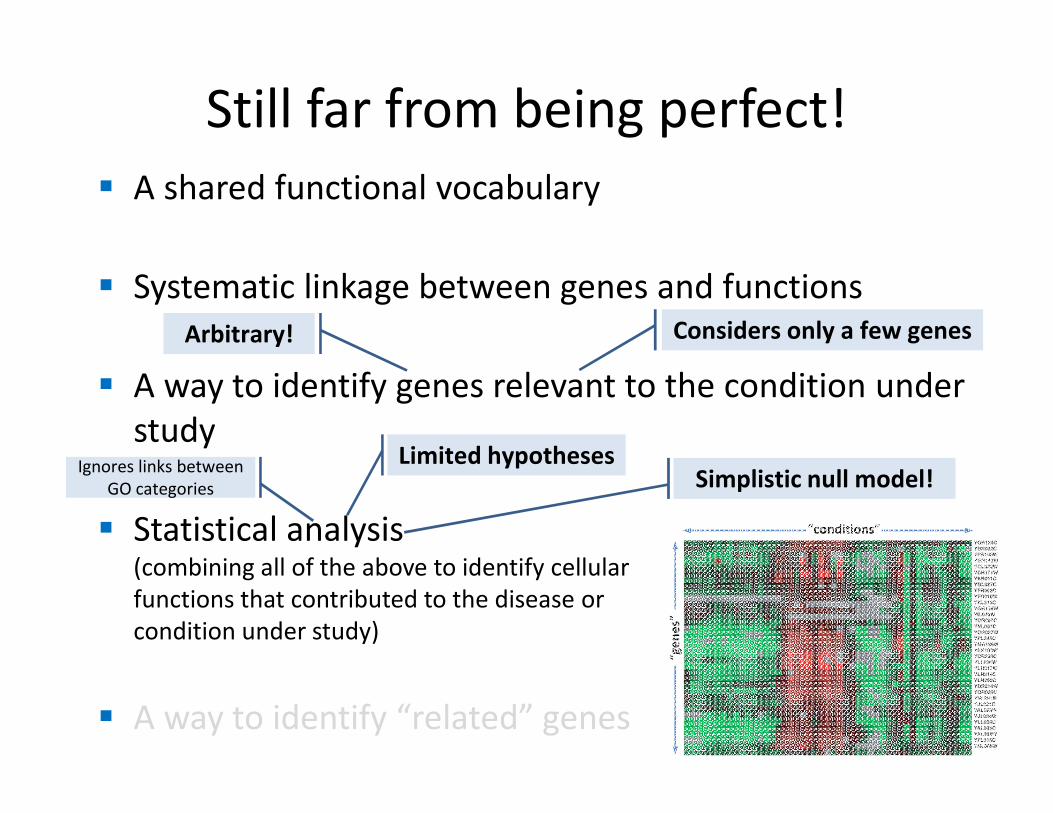
Still far from being perfect!
� A shared functional vocabulary
� Systematic linkage between genes and functions
� A way to identify genes relevant to the condition under
study
� Statistical analysis(combining all of the above to identify cellular
functions that contributed to the disease or
condition under study)
� A way to identify “related” genes
Arbitrary! Considers only a few genes
Simplistic null model!Ignores links between
GO categories
Limited hypotheses