Embed Size (px)
Citation preview
Gene Networks of Fully ConnectedTriads with Complete Auto-
Activation Enable Multistability andStepwise Stochastic Transitions
The Harvard community has made thisarticle openly available. Please share howthis access benefits you. Your story matters
Citation Faucon, Philippe C., Keith Pardee, Roshan M. Kumar, Hu Li, Yuin-Han Loh, and Xiao Wang. 2014. “Gene Networks of Fully ConnectedTriads with Complete Auto-Activation Enable Multistability andStepwise Stochastic Transitions.” PLoS ONE 9 (7): e102873.doi:10.1371/journal.pone.0102873. http://dx.doi.org/10.1371/journal.pone.0102873.
Published Version doi:10.1371/journal.pone.0102873
Citable link http://nrs.harvard.edu/urn-3:HUL.InstRepos:12717558
Terms of Use This article was downloaded from Harvard University’s DASHrepository, and is made available under the terms and conditionsapplicable to Other Posted Material, as set forth at http://nrs.harvard.edu/urn-3:HUL.InstRepos:dash.current.terms-of-use#LAA
Gene Networks of Fully Connected Triads with CompleteAuto-Activation Enable Multistability and StepwiseStochastic TransitionsPhilippe C. Faucon1, Keith Pardee2,3, Roshan M. Kumar2,3, Hu Li4, Yuin-Han Loh5, Xiao Wang6*
1 School of Computing, Informatics, Decision Systems Engineering, Arizona State University, Tempe, Arizona, United States of America, 2 Wyss Institute for Biological
Inspired Engineering, Harvard University, Boston, Massachusetts, United States of America, 3 Center for BioDynamics and Center for Advanced Biotechnology, Boston
University, Boston, Massachusetts, United States of America, 4 Department of Molecular Pharmacology and Experimental Therapeutics, Center for Individualized Medicine,
Mayo Clinic, Rochester, Minnesota, United States of America, 5 Epigenetics and Cell Fates Laboratory, A*STAR Institute of Molecular and Cell Biology, Department of
Biological Sciences, National University of Singapore, Singapore, Singapore, 6 School of Biological and Health Systems Engineering, Arizona State University, Tempe,
Arizona, United States of America
Abstract
Fully-connected triads (FCTs), such as the Oct4-Sox2-Nanog triad, have been implicated as recurring transcriptional motifsembedded within the regulatory networks that specify and maintain cellular states. To explore the possible connectionsbetween FCT topologies and cell fate determinations, we employed computational network screening to search all possibleFCT topologies for multistability, a dynamic property that allows the rise of alternate regulatory states from the sametranscriptional network. The search yielded a hierarchy of FCTs with various potentials for multistability, including severaltopologies capable of reaching eight distinct stable states. Our analyses suggested that complete auto-activation is aneffective indicator for multistability, and, when gene expression noise was incorporated into the model, the networks wereable to transit multiple states spontaneously. Different levels of stochasticity were found to either induce or disrupt randomstate transitioning with some transitions requiring layovers at one or more intermediate states. Using this framework wesimulated a simplified model of induced pluripotency by including constitutive overexpression terms. The correspondingFCT showed random state transitioning from a terminal state to the pluripotent state, with the temporal distribution of thistransition matching published experimental data. This work establishes a potential theoretical framework for understandingcell fate determinations by connecting conserved regulatory modules with network dynamics. Our results could also beemployed experimentally, using established developmental transcription factors as seeds, to locate cell lineage specificationnetworks by using auto-activation as a cipher.
Citation: Faucon PC, Pardee K, Kumar RM, Li H, Loh Y-H, et al. (2014) Gene Networks of Fully Connected Triads with Complete Auto-Activation EnableMultistability and Stepwise Stochastic Transitions. PLoS ONE 9(7): e102873. doi:10.1371/journal.pone.0102873
Editor: Ben D. MacArthur, University of Southampton, United Kingdom
Received December 11, 2013; Accepted June 24, 2014; Published July 24, 2014
Copyright: � 2014 Faucon et al. This is an open-access article distributed under the terms of the Creative Commons Attribution License, which permitsunrestricted use, distribution, and reproduction in any medium, provided the original author and source are credited.
Funding: K.P. is supported by a Canadian Institutes of Health Research Postdoctoral Fellowship (http://www.cihr-irsc.gc.ca). This work was supported by theNational Science Foundation (NSF) Grants DMS-1100309 (X.W.) (http://www.nsf.gov/) and by American Heart Association Grant 11BGIA7440101 (X.W.) (http://www.heart.org). The funders had no role in study design, data collection and analysis, decision to publish, or preparation of the manuscript.
Competing Interests: The authors have declared that no competing interests exist.
* Email: [email protected]
Introduction
Embryonic stem cells have the capacity to differentiate into
more than 200 isogenic progenitor and terminal cell types [1],
each of which represents a stable cellular state. The potential for a
system to realize multiple states is termed multistability, which has
been proposed as the mechanism underlying cell differentiation for
over half a century, with stable states represented as either valleys
in the developmental landscape [2,3] or as dynamic attractors in
high-dimensional gene expression space [4–6]. Bistability is the
simplest form of multistability, which has been studied extensively
both in natural contexts [7] and in synthetic systems [8–13]. It has
been shown to be responsible for both normal cell fate
determination in Xenopus oocyte maturation [14] and oncogenesis
[15]. Additionally, recent work in hematopoietic stem cells (HSC)
implies that more complicated cases of multistability help in
canalizing HSC lineage determination [16]. The discovery of
induced pluripotent stem cells (iPSC) [17–20] further demon-
strates that cellular state transitioning within a multistable system is
a reversible process that can potentially be engineered for
therapeutic purposes.
Despite evidence for the existence of multiple substates of
pluripotent and hematopoietic stem cells [21–25], the molecular
mechanisms responsible for generating complex multistability are
poorly understood. Transitions between stable states may underlie
widely observed stem cell population heterogeneity [23,25–34],
random latency in induced pluripotency [34,35], and even the
progression of diseases such as cancer [36,37]. According to this
view, regulatory networks capable of adopting multiple stable
states may enable cells to explore adjacent fate possibilities through
state transitions, thereby enabling differentiation in the case of
stem cells, or generating phenotypic diversity for selection to act
upon in the case of tumor evolution. Recent studies have
implicated the fully-connected triad (FCT) [38–40] as a recurring
network motif among the transcriptional regulatory circuits that
control the development and maintenance of cellular states. Most
PLOS ONE | www.plosone.org 1 July 2014 | Volume 9 | Issue 7 | e102873
notably, the Oct4-Sox2-Nanog triad is believed to be the key
functional module in the maintenance of stem cell pluripotency
[41–43]. The success of induced pluripotency through the
overexpression of transcription factors alone further indicates the
dominant role of transcription factor networks in maintaining
pluripotency and directing cellular reprogramming. All this
suggests a strong relationship between biological multistability
and the conserved FCT network of transcription factors (Figure 1),
and motivates a need for understanding the relationship between
FCT regulatory relationships and multistability.
Here we developed a high-throughput computational approach
to search the network dynamics of all fully-connected transcription
triads for their potential to realize multistability. Our computa-
tional searches identified complete auto-activation, (i.e.: all three
nodes activate themselves), as a topological feature of triads
capable of multiple stable steady states (SSS). Detailed analyses
were performed on network topologies selected for a high
likelihood of multistability. These analyses show that the relative
stability of SSS can be tuned by adjusting the network regulatory
strengths between nodes. After incorporation of gene expression
noise in stochastic simulations, the system was able to spontane-
ously transit from metastable (SSS with relatively lower stabilities)
to differentiated states (SSS with at least one gene OFF and high
stabilities), behaving like a three-dimensional Markovian jump
system with bias. This is also consistent with experimentally
demonstrated stochastic cancer cell state transitions [44], which
result in a phenotypic equilibrium in populations of cancer cells.
Different levels of noise, designed to mimic degrees of ‘‘noisy’’
transcriptional activity in cellular systems, were found to either
promote or disrupt state transitions, with some transitions
requiring layovers at one or more intermediate states. Such
connections between gene expression noise and cell state
transitions have also been demonstrated in many biological
processes [45]. Finally, in our simplified theoretical simulation of
reprogramming to generate induced pluripotent stem cells, the
distribution of random temporal latency could be described by an
Inverse Gaussian distribution, a finding consistent with experi-
mental observations [34]. Taken together, our work illustrates that
computational screening, analysis, and simulation of network
dynamics can serve as valuable tools for connecting conserved
regulatory modules with complex biological processes, such as
development, disease and stem cell reprogramming.
Results
Network Enumeration and Parameter Scanning forMultistability
To define the set of FCT networks with a high likelihood for
multistability, we first enumerated all possible fully-connected
three-node topologies (Figure 2A). Here, nodes represent tran-
scription factors and edges represent possible transcriptional
regulations. After taking into account topological equivalencies,
we were left with 104 unique FCTs as candidate topologies, which
fully represent all 29 = 512 possible FCT topologies (see Support-
ing Information (SI), Figure S1 and MATERIALS AND
METHODS for details).
Each FCT candidate was generally modeled by a set of three-
variable ordinary differential equations (ODEs), with each variable
representing the abundance of a single transcription factor and
each of the nine tunable parameters representing a single
regulation strength (Figure 2A). The activation and repression of
each gene by other factors are modeled additively to account for
reported mechanistic independence of transcription regulations
[16,40,46] (MATERIALS AND METHODS). This simplification
can be expanded to include more mechanistic details of specific
networks without altering the general conclusion of this screening.
A state of the network is then defined as an equilibrium or SSS if
all transcription factor abundances do not change over time. An
algorithm was developed to automate the search process to
identify all possible states.
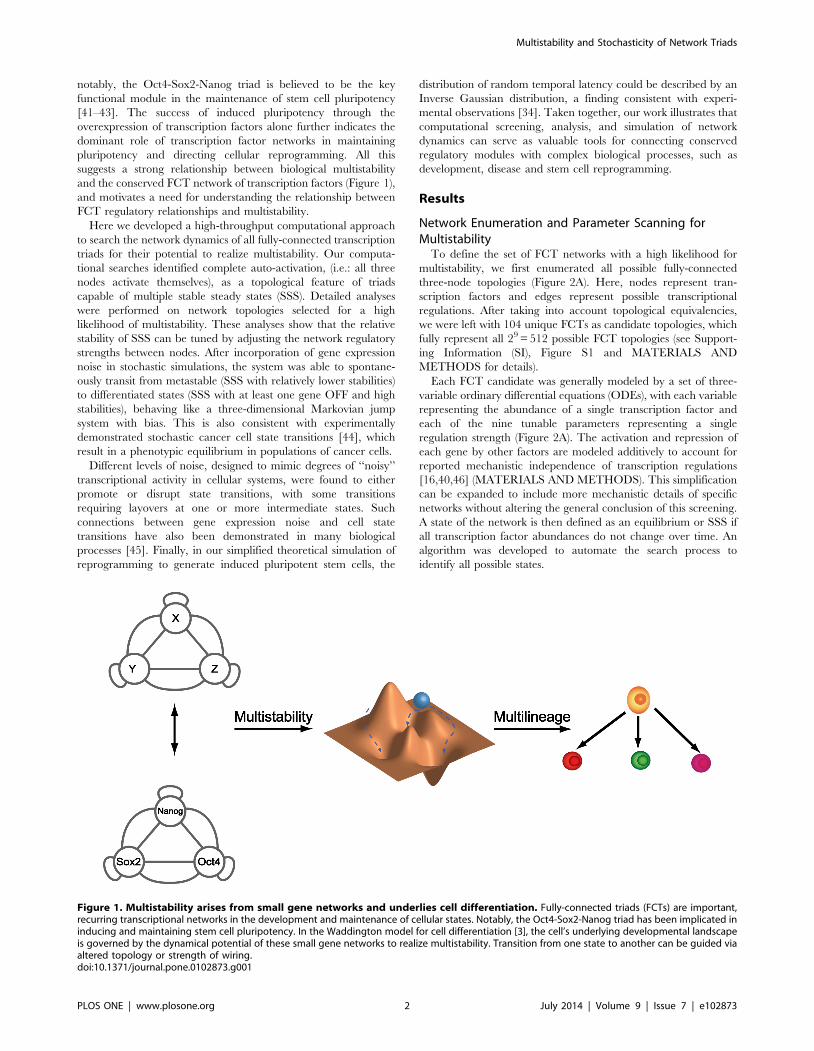
Figure 1. Multistability arises from small gene networks and underlies cell differentiation. Fully-connected triads (FCTs) are important,recurring transcriptional networks in the development and maintenance of cellular states. Notably, the Oct4-Sox2-Nanog triad has been implicated ininducing and maintaining stem cell pluripotency. In the Waddington model for cell differentiation [3], the cell’s underlying developmental landscapeis governed by the dynamical potential of these small gene networks to realize multistability. Transition from one state to another can be guided viaaltered topology or strength of wiring.doi:10.1371/journal.pone.0102873.g001
Multistability and Stochasticity of Network Triads
PLOS ONE | www.plosone.org 2 July 2014 | Volume 9 | Issue 7 | e102873
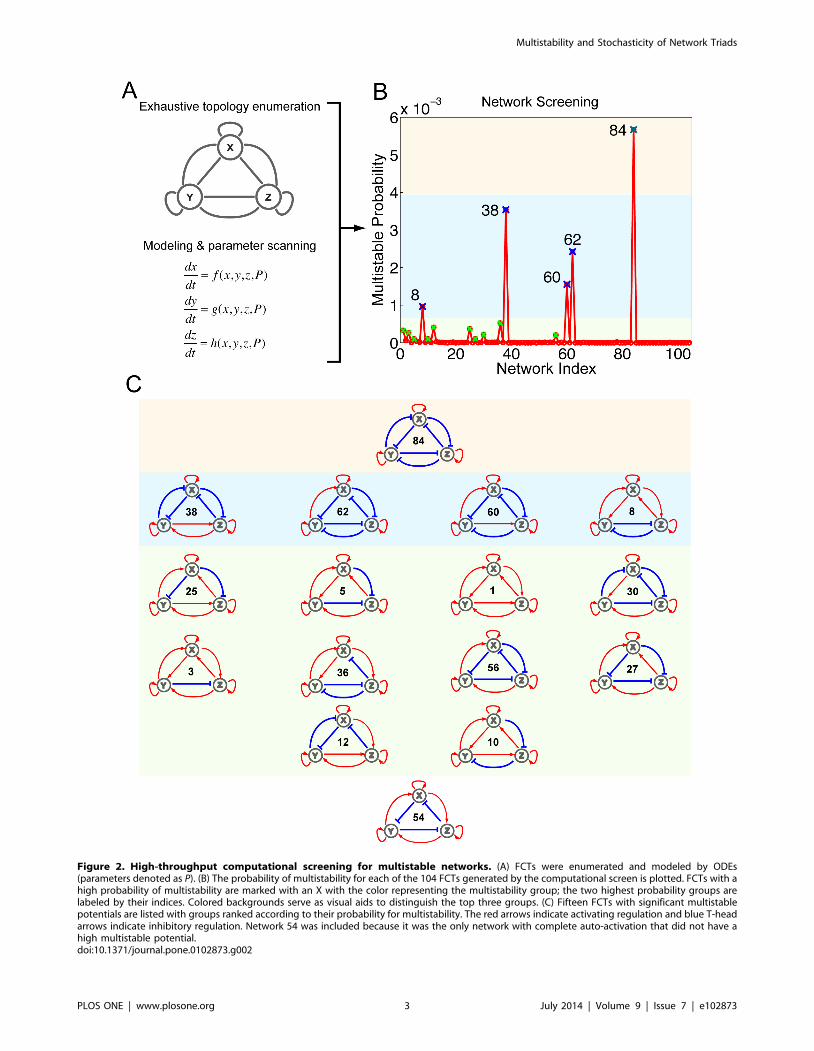
Figure 2. High-throughput computational screening for multistable networks. (A) FCTs were enumerated and modeled by ODEs(parameters denoted as P). (B) The probability of multistability for each of the 104 FCTs generated by the computational screen is plotted. FCTs with ahigh probability of multistability are marked with an X with the color representing the multistability group; the two highest probability groups arelabeled by their indices. Colored backgrounds serve as visual aids to distinguish the top three groups. (C) Fifteen FCTs with significant multistablepotentials are listed with groups ranked according to their probability for multistability. The red arrows indicate activating regulation and blue T-headarrows indicate inhibitory regulation. Network 54 was included because it was the only network with complete auto-activation that did not have ahigh multistable potential.doi:10.1371/journal.pone.0102873.g002
Multistability and Stochasticity of Network Triads
PLOS ONE | www.plosone.org 3 July 2014 | Volume 9 | Issue 7 | e102873
Specifically, to measure the probability of multistability, we
scanned N = 421,875 parameter sets for each of the 104 networks
to identify all possible states. The values of these parameters are
generic but cover a wide range to serve as a proof of principle for
diverse biological scenarios. The probability of multistability was
then defined as the number of parameter sets giving rise to at least
5 stable steady states divided by N. This probability reflects the
robustness of certain FCT’s multistability, and hence quantifies its
possible natural presence frequency. The entire FCT multistability
screen is an ensemble of many independent computations and, as
a result, was run in parallel and performed in high-throughput
computer clusters (see MATERIALS AND METHODS). Such
large-scale screening is computationally intensive and is only
possible with simplified model equations. Therefore the chosen
forms of our ODE models omit many biochemical details such as
epigenetics and transcriptional factor co-binding. The models
serve as a general abstraction and system specific details could be
incorporated later in light of specific experimental evidence.
Complete Auto-Activation Contributes to MultistabilityUsing our network screening approach, we quantified and
ranked the potential for multistability of all 104 possible FCTs
(Figure 2A). Of the 104, 15 showed significant probability for
multistability (marked in Figure 2B and topologies drawn in
Figure 2C).
The multistable FCTs were empirically categorized into three
groups according to their probability of multistability (color shaded
in Figure 2B,C). The first group, which had the highest probability
of realizing multistability and with the potential for eight states,
consisted of a single network (Network 84) with all positive auto-
regulation and all mutual inhibition. The second group of
multistable FCTs, consisting of Networks 8, 38, 60, and 62, was
also exclusively positive auto-regulating but displayed a mixture of
positive and negative mutual regulation. Specifically, these
networks were either enriched for mutual inhibition (Networks
60 and 62) or displayed symmetrical topologies (Network 8 and
38). The third group, which was comprised of 10 FCTs that
exhibited lower but still significant potential for multistability, once
again featured similar positive auto-regulation as a common
attribute. The networks of the third group had either asymmetric
topologies (Networks 3, 10, 12, 27, 36 and 56) or competing
mutual regulation of target genes (Network 5, 25, and 30), except
for Network 1, which was entirely void of inhibitory regulation.
These results suggest that an appropriate combination of mutual
inhibitory and activating regulation helps to increase the potential
for a network to realize multistability, a finding that is consistent
with previous theoretical studies [47].
From our screen, we were able to identify a set of important,
minimum topological features capable of multistability. In
particular, of the possible 16 FCTs with complete positive auto-
regulation, our screen selected 15 as having a high likelihood for
multistability. Network 54 was the only FCT displaying complete
auto-activation with insignificant potential for multistability, likely
because of competing mutual activation and repression of all the
nodes (bottom of Figure 2C).
Indeed, positive auto-regulation has been shown to be an
important feature of bistable systems [7,9,10,14,48,49], and recent
experimental work also suggests it could be necessary for
maintaining multipotency in stem cells [50]. The role of positive
feedback in multistability has been well studied [9,14,51], and the
interconnected autoregulatory loop formed by Oct4, Sox2, and
Nanog is thought to underlie the bistable switch between ESC self-
renewal and differentiation, and the ability of core ESC regulators
to ‘boot up’ the pluripotency transcriptional program by forced
expression during reprogramming [52]. Our computational results
similarly suggest that, within the limits of the study, complete
positive auto-regulation is an important contributor to the
generation of high-dimensional multistability across diverse FCT
topologies. It is striking to note that one or two instances of auto-
activation, no matter how strong, are not sufficient to generate
multistability in our simulations. Therefore, it is possible that
complete auto-activation of FCTs could be used as an important
hallmark in the identification of new multistable gene networks.
Sensitivity and bifurcation of multistabilityNetwork 84 (Figure 3A, all positive auto-regulation and all
mutual inhibition) yielded the highest potential for multistability in
our screen (Figure 2C). To gain a deeper understanding of this
FCT, we performed a bifurcation analysis [53,54] to investigate
how the change of one regulation strength affects the number,
stability, and location of all states, while other parameters are kept
constant (Figures 3B and S2). Bifurcation analysis is a useful
analytical tool that can reveal when and where one state can
bifurcate into two or more states in response to a changing
parameter. This is analogous to a progenitor cell transitioning
from a self-renewing phase to a multi-lineage differentiating phase
in response to a stimulus [16].
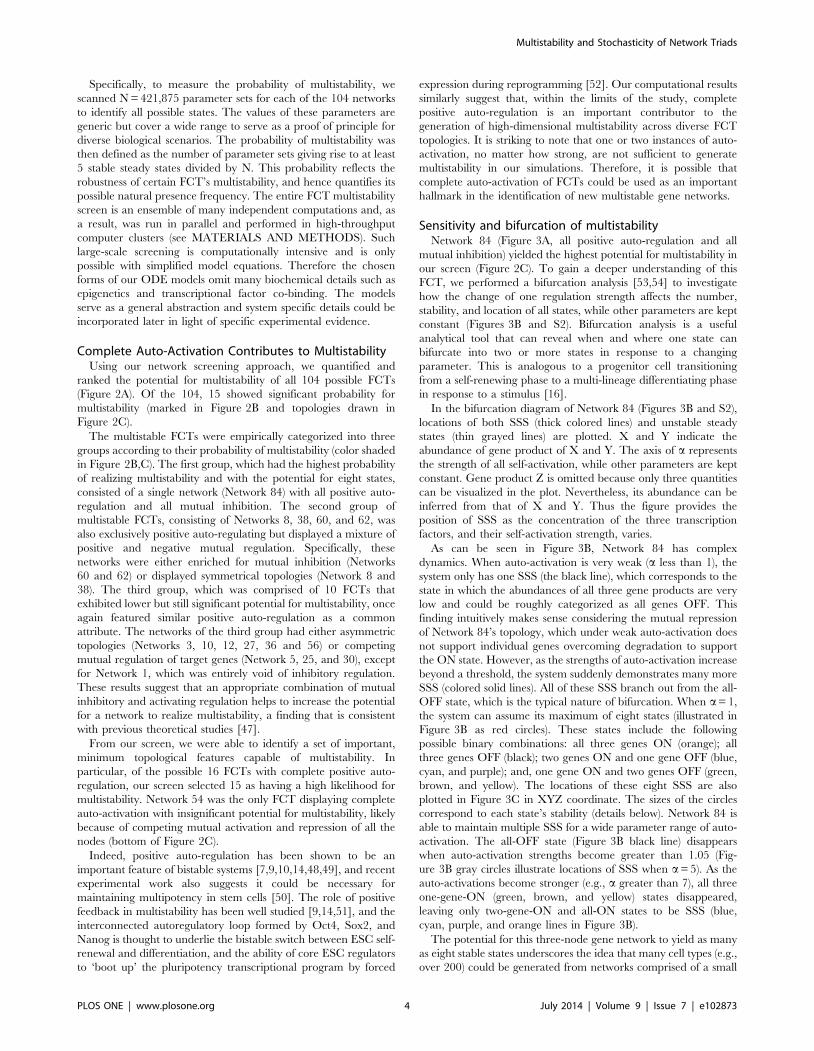
In the bifurcation diagram of Network 84 (Figures 3B and S2),
locations of both SSS (thick colored lines) and unstable steady
states (thin grayed lines) are plotted. X and Y indicate the
abundance of gene product of X and Y. The axis of a represents
the strength of all self-activation, while other parameters are kept
constant. Gene product Z is omitted because only three quantities
can be visualized in the plot. Nevertheless, its abundance can be
inferred from that of X and Y. Thus the figure provides the
position of SSS as the concentration of the three transcription
factors, and their self-activation strength, varies.
As can be seen in Figure 3B, Network 84 has complex
dynamics. When auto-activation is very weak (a less than 1), the
system only has one SSS (the black line), which corresponds to the
state in which the abundances of all three gene products are very
low and could be roughly categorized as all genes OFF. This
finding intuitively makes sense considering the mutual repression
of Network 84’s topology, which under weak auto-activation does
not support individual genes overcoming degradation to support
the ON state. However, as the strengths of auto-activation increase
beyond a threshold, the system suddenly demonstrates many more
SSS (colored solid lines). All of these SSS branch out from the all-
OFF state, which is the typical nature of bifurcation. When a= 1,
the system can assume its maximum of eight states (illustrated in
Figure 3B as red circles). These states include the following
possible binary combinations: all three genes ON (orange); all
three genes OFF (black); two genes ON and one gene OFF (blue,
cyan, and purple); and, one gene ON and two genes OFF (green,
brown, and yellow). The locations of these eight SSS are also
plotted in Figure 3C in XYZ coordinate. The sizes of the circles
correspond to each state’s stability (details below). Network 84 is
able to maintain multiple SSS for a wide parameter range of auto-
activation. The all-OFF state (Figure 3B black line) disappears
when auto-activation strengths become greater than 1.05 (Fig-
ure 3B gray circles illustrate locations of SSS when a= 5). As the
auto-activations become stronger (e.g., a greater than 7), all three
one-gene-ON (green, brown, and yellow) states disappeared,
leaving only two-gene-ON and all-ON states to be SSS (blue,
cyan, purple, and orange lines in Figure 3B).
The potential for this three-node gene network to yield as many
as eight stable states underscores the idea that many cell types (e.g.,
over 200) could be generated from networks comprised of a small
Multistability and Stochasticity of Network Triads
PLOS ONE | www.plosone.org 4 July 2014 | Volume 9 | Issue 7 | e102873
number of nodes. Taken further, a fully-connected network with
only eight nodes could produce 256 states [47]. While only
theoretical, it is an example of the potential for such combinatorial
complexity and provides a plausible mechanism for cell lineage
determination, where different gene product abundances and ON-
OFF combinations could drive the system towards a spectrum of
cell fates. Coupled with our bifurcation analysis, where we
modeled the abrupt appearance or collapse of SSS in this
topology, FCTs could also lead to discrete jumps between states
in response to a changing cellular environment or signaling. The
phenomenon of hysteresis, when such jumps cannot be reversed
by returning to the previous environmental conditions, has been
established as the mechanism for many irreversible cell fate
determinations[55].
Stochastic State TransitioningNext, we investigated the effects of gene expression fluctuations
on the multistability potential of Network 84. Fluctuations in gene
expression under constant environmental conditions may arise
from inherent stochastic fluctuations in gene expression, or from
regulatory architecture, chromatin structure, or transcriptional
bursting. Here, we use the broad term ‘gene expression noise’ to
encompass all these possibilities. Gene expression noise has been
shown to affect cellular physiology in single-cell organisms [56–
62], and has also been linked to random developmental patterns
and cell fate decisions in multicellular organisms [63–67]. The
mechanisms underlying the utilization and regulation of gene
expression noise in higher organisms, however, are not well
understood. We introduced such noise into our model by
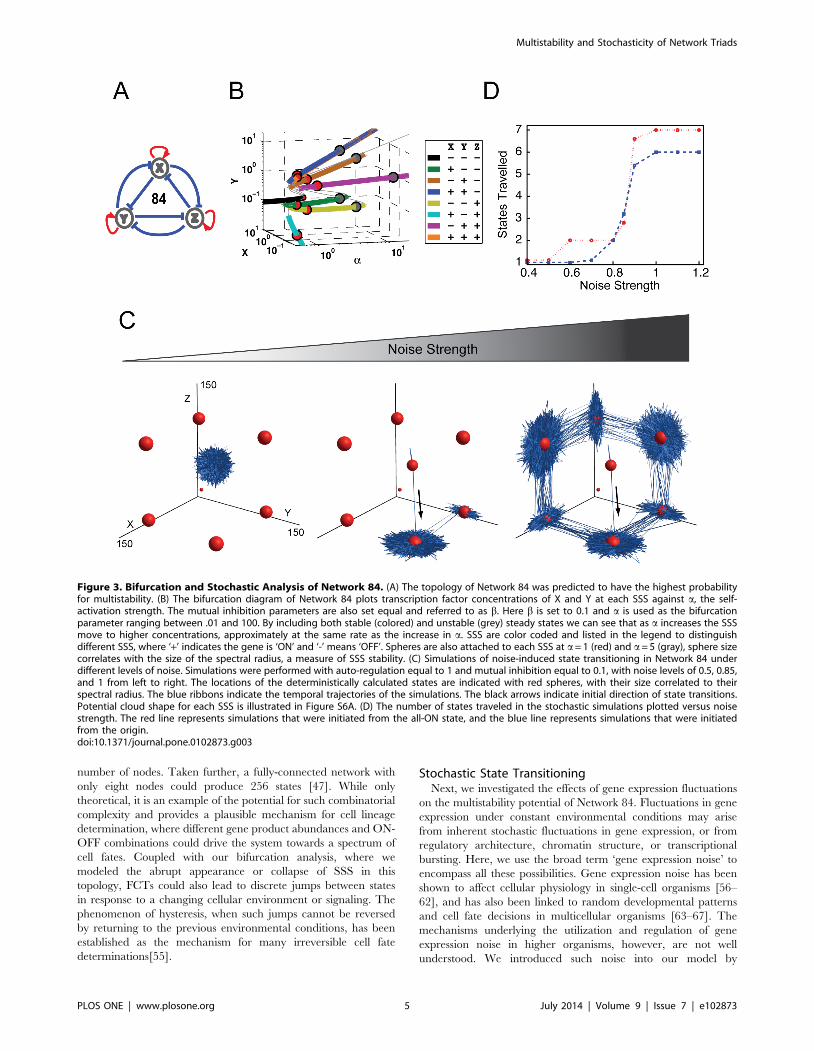
Figure 3. Bifurcation and Stochastic Analysis of Network 84. (A) The topology of Network 84 was predicted to have the highest probabilityfor multistability. (B) The bifurcation diagram of Network 84 plots transcription factor concentrations of X and Y at each SSS against a, the self-activation strength. The mutual inhibition parameters are also set equal and referred to as b. Here b is set to 0.1 and a is used as the bifurcationparameter ranging between .01 and 100. By including both stable (colored) and unstable (grey) steady states we can see that as a increases the SSSmove to higher concentrations, approximately at the same rate as the increase in a. SSS are color coded and listed in the legend to distinguishdifferent SSS, where ‘+’ indicates the gene is ‘ON’ and ‘-’ means ‘OFF’. Spheres are also attached to each SSS at a= 1 (red) and a= 5 (gray), sphere sizecorrelates with the size of the spectral radius, a measure of SSS stability. (C) Simulations of noise-induced state transitioning in Network 84 underdifferent levels of noise. Simulations were performed with auto-regulation equal to 1 and mutual inhibition equal to 0.1, with noise levels of 0.5, 0.85,and 1 from left to right. The locations of the deterministically calculated states are indicated with red spheres, with their size correlated to theirspectral radius. The blue ribbons indicate the temporal trajectories of the simulations. The black arrows indicate initial direction of state transitions.Potential cloud shape for each SSS is illustrated in Figure S6A. (D) The number of states traveled in the stochastic simulations plotted versus noisestrength. The red line represents simulations that were initiated from the all-ON state, and the blue line represents simulations that were initiatedfrom the origin.doi:10.1371/journal.pone.0102873.g003
Multistability and Stochasticity of Network Triads
PLOS ONE | www.plosone.org 5 July 2014 | Volume 9 | Issue 7 | e102873
modifying the algorithm from Adalsteinsson et al. [68] to help
understand how inherent stochasticity affects cell differentiation
(see MATERIALS AND METHODS).
Using our modified algorithm, we simulated the temporal
evolution of all three gene product abundances under the
influence of different levels of gene expression noise. The sum of
these calculated measures can be visualized as the time-lapse
movie of a FCT’s fate over time (Movie S1). The system was
initialized at the all-ON state to mimic the promiscuous gene
expression state that is often observed when various progenitor
cells start to differentiate [69–73]. The locations of eight SSS when
a= 1 are indicated by the red spheres in Figure 3C, where the size
of the spheres represents the stability of each state as measured by
its spectral radius [74,75]. As shown in Figure 3C, at small noise
levels (Figure 3C, left panel), expression of all three genes
displayed fluctuations, yet the trajectory remained focused around
the initial all-ON state, indicating that small levels of gene
expression noise were not sufficient to induce spontaneous state
transitioning in Network 84. This also indicates the stability of the
network under well-buffered conditions. As the level of noise was
increased to an intermediate level (Figure 3C, middle panel), the
system began to transition from the initial all-ON state to a two-
ON-one-OFF state and later to a two-OFF-one-ON state. Within
the time frame simulated, the system transitioned back and forth
between these two latter states and spent most of the time in the
vicinity of these two states. When the noise level was increased
further, the system was able to visit all six states with at least one
gene ON and one gene OFF (Figure 3C, right panel; Movie S1).
The results of the stochastic state-transition simulations have
several interesting biological implications. First, the system
transitioned exclusively between states with at least one gene
ON and one gene OFF. After jumping out of the initial state, it
never returned to the all-ON state within the simulation time
frame; moreover, it never reached the all-OFF state. For this
topology, the all-ON and all-OFF states are significantly less stable
than the other six states, and thus serve as weaker attractors.
Specifically, it is the fine balance in the abundance of all gene
products that determines the stability of the all-ON and all-OFF
states, and this balance is easily disrupted by random perturbations
such as gene expression noise. These results provide a simplified
and yet concrete demonstration of the recently proposed concept
of ‘‘dynamic equilibrium’’ [76], in which individual cells can jump
between states randomly, while the proportion of cells in a
population at one specific state remains constant. Here we can see
the proportion (probability) of cells in one state is determined by
the stability of each state, which in turn is determined by network
topology and system parameters. Therefore when one single
fluorescence reporter tagged to one gene is experimentally used to
track single cell dynamics, the cell population will exhibit a broad
distribution because this multi-dimensional system is projected
onto a single measured dimension.
Second, state transitions were only observed between two
adjacent states and not between non-neighboring states. In other
words, the transition from one state to another non-neighboring
state required layovers at one or more intermediate states. This
phenomenon resembles the experimental observation that pro-
genitor cells pass through multiple intermediate states as they
differentiate [5]. Moreover, these simulations also highlight that
the transition of a triad from one state to another can take multiple
possible routes. Similar results have been observed at the cellular
level, where recent progress in de-differentiation [17,19,20] and
trans-differentiation [77] has shown that natural developmental
cellular state transitions may be only one of many possible routes
between cell types [78].
Third, trajectories of the stochastic simulation showed a
directional bias in gene expression state space, presumably due
to mutual repression. For instance, when the system was in the X-
ON/Y-ON/Z-OFF state, its trajectory was virtually limited to the
X-Y plane, with little fluctuation in the Z direction (Figure 3C,
middle and right panels). The result is that each state in these
simulations was functionally ‘‘flat’’ and comprised of the expres-
sion from only two genes. Similarly, the one-ON states had a polar
or single dimensional expression distribution.
Next, we subjected the system to a range of noise levels to gain a
deeper understanding of the system’s response and pattern of state
transitioning. Noise strengths ranging from 0.4 to 1.2 were selected
for analysis. Plotted in Figure 3D (red line) is the number of states
traveled by the system, from the all ON state, within the simulated
time versus the noise strength. The result shows a step function-
like increase in the number of states with increasing noise strength.
A similar pattern was observed when the simulation was initiated
at the origin (blue line) rather than the all-ON state. One
exception is that from this alternative starting point the system
could not travel to the all-ON state and therefore had only six
accessible states.
In both simulations, the sharp increase in the number of states
traveled occurred between noise strengths of 0.8 and 1
(Figure 3D). This appears to be the critical threshold for
overcoming the stability barrier between states and for complete
noise-induced state transitioning. The existence of such a critical
noise threshold suggests that natural systems may have the ability
to operate in different regimes that either utilize or repress gene
expression stochasticity to achieve distinct physiological goals.
SSS AnalysisTo further explore Network 84’s response to two or more
simultaneously changing parameters, we conducted more thor-
ough parameter scanning (see MATERIALS AND METHODS
for details). First, two parameter combination regimes shown in
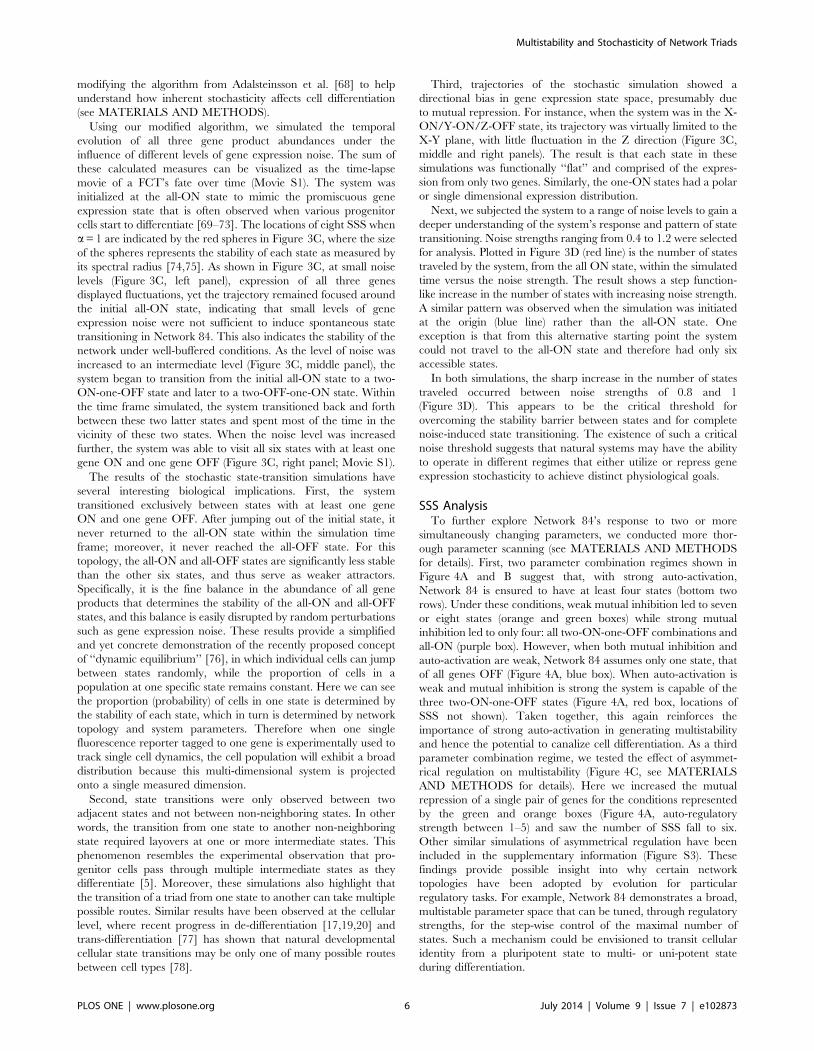
Figure 4A and B suggest that, with strong auto-activation,
Network 84 is ensured to have at least four states (bottom two
rows). Under these conditions, weak mutual inhibition led to seven
or eight states (orange and green boxes) while strong mutual
inhibition led to only four: all two-ON-one-OFF combinations and
all-ON (purple box). However, when both mutual inhibition and
auto-activation are weak, Network 84 assumes only one state, that
of all genes OFF (Figure 4A, blue box). When auto-activation is
weak and mutual inhibition is strong the system is capable of the
three two-ON-one-OFF states (Figure 4A, red box, locations of
SSS not shown). Taken together, this again reinforces the
importance of strong auto-activation in generating multistability
and hence the potential to canalize cell differentiation. As a third
parameter combination regime, we tested the effect of asymmet-
rical regulation on multistability (Figure 4C, see MATERIALS
AND METHODS for details). Here we increased the mutual
repression of a single pair of genes for the conditions represented
by the green and orange boxes (Figure 4A, auto-regulatory
strength between 1–5) and saw the number of SSS fall to six.
Other similar simulations of asymmetrical regulation have been
included in the supplementary information (Figure S3). These
findings provide possible insight into why certain network
topologies have been adopted by evolution for particular
regulatory tasks. For example, Network 84 demonstrates a broad,
multistable parameter space that can be tuned, through regulatory
strengths, for the step-wise control of the maximal number of
states. Such a mechanism could be envisioned to transit cellular
identity from a pluripotent state to multi- or uni-potent state
during differentiation.
Multistability and Stochasticity of Network Triads
PLOS ONE | www.plosone.org 6 July 2014 | Volume 9 | Issue 7 | e102873
A Regulatory Network for PluripotencyExperiments probing the structure and function of the
regulatory network governing pluripotency suggest that the core
pluripotency regulators Oct4, Sox2, and Nanog are organized into
a regulatory topology of mutual activation that is shared with
Network 1 selected by our screen, [21,79]. This fully intercon-
nected autoregulatory loop is believed to stabilize self-renewal,
govern the bistable switch between ES cell self-renewal and
differentiation, and underlie the ability of selected pluripotency
regulators to ‘boot up’ the pluripotency transcriptional program-
ming upon forced expression in somatic cells, thereby reprogram-
ming them to a stem cell-like state [52]. Additional layers of
regulatory complexity have been described in this network,
including autorepression by Nanog [80,81] and differential cell
phenotypes in response to varying levels of these factors [82–84].
Moreover, Nanog acts as a homodimer [85], while Sox2 and Oct4
heterodimerize to regulate transcription [86], and attempts have
been made to model the regulatory dynamics of these transcrip-
tional complexes and their interaction with signaling factors [87].
Further adding to the complexity, Oct4 may also partner with
other Sox factors to form alternative regulatory complexes that
bind a distinct set of enhancers [88].
Notably, protein levels of the core pluripotency regulator Nanog
have been observed to fluctuate in cultured pluripotent stem cell
populations [23,24,89–92], suggesting that this regulatory network
is capable of adopting multiple states. To further explore possible
roles of multistability in stem cell transcriptional regulation, we
carried out detailed analysis on this network topology (Figure 5A).
Our goal in doing so is not to capture every regulatory complexity
present in the endogenous biological network, but rather to
provide a theoretical framework for how this simplified network
topology and fluctuations in network components might affect
multistability. As with Network 84, we first carried out the
bifurcation analysis for Network 1 (Figures 5B and S4). Consid-
ering the topology of Network 1 consists solely of positive
regulation, one might expect that the network would primarily
assume the all OFF ‘‘resting’’ or all ON ‘‘activated’’ states. This
intuition is largely correct but not complete. While network 1 does
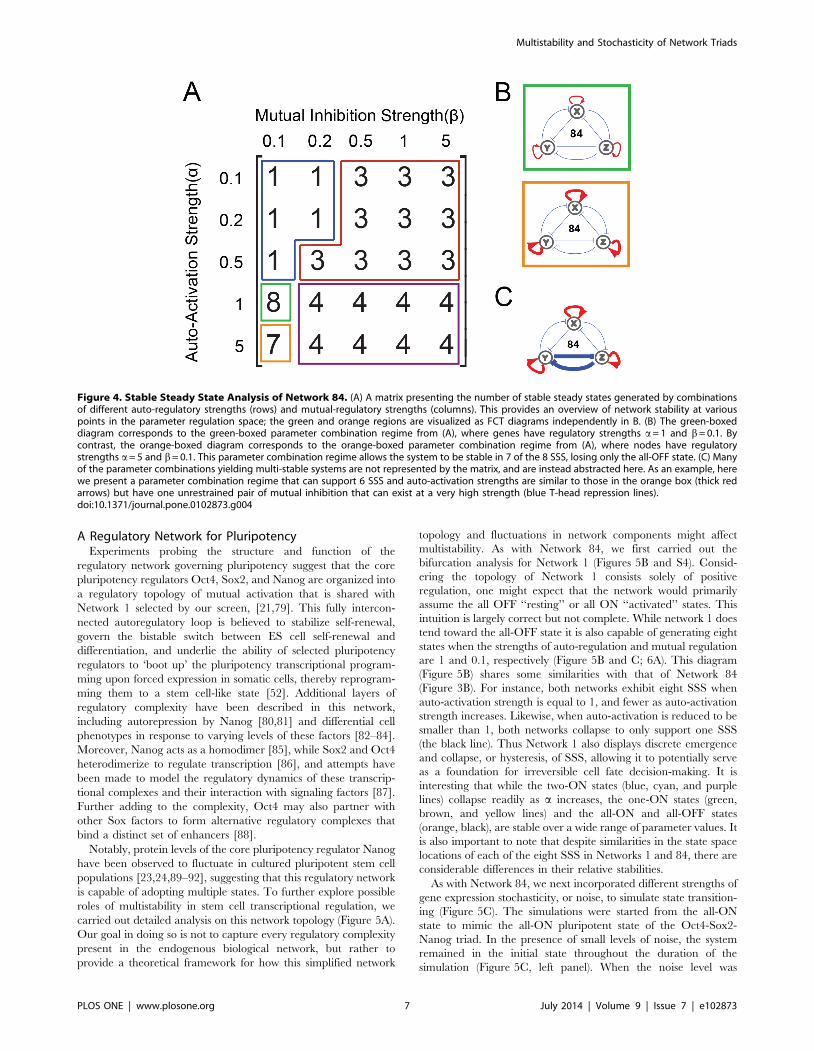
tend toward the all-OFF state it is also capable of generating eight
states when the strengths of auto-regulation and mutual regulation
are 1 and 0.1, respectively (Figure 5B and C; 6A). This diagram
(Figure 5B) shares some similarities with that of Network 84
(Figure 3B). For instance, both networks exhibit eight SSS when
auto-activation strength is equal to 1, and fewer as auto-activation
strength increases. Likewise, when auto-activation is reduced to be
smaller than 1, both networks collapse to only support one SSS
(the black line). Thus Network 1 also displays discrete emergence
and collapse, or hysteresis, of SSS, allowing it to potentially serve
as a foundation for irreversible cell fate decision-making. It is
interesting that while the two-ON states (blue, cyan, and purple
lines) collapse readily as a increases, the one-ON states (green,
brown, and yellow lines) and the all-ON and all-OFF states
(orange, black), are stable over a wide range of parameter values. It
is also important to note that despite similarities in the state space
locations of each of the eight SSS in Networks 1 and 84, there are
considerable differences in their relative stabilities.
As with Network 84, we next incorporated different strengths of
gene expression stochasticity, or noise, to simulate state transition-
ing (Figure 5C). The simulations were started from the all-ON
state to mimic the all-ON pluripotent state of the Oct4-Sox2-
Nanog triad. In the presence of small levels of noise, the system
remained in the initial state throughout the duration of the
simulation (Figure 5C, left panel). When the noise level was
Figure 4. Stable Steady State Analysis of Network 84. (A) A matrix presenting the number of stable steady states generated by combinationsof different auto-regulatory strengths (rows) and mutual-regulatory strengths (columns). This provides an overview of network stability at variouspoints in the parameter regulation space; the green and orange regions are visualized as FCT diagrams independently in B. (B) The green-boxeddiagram corresponds to the green-boxed parameter combination regime from (A), where genes have regulatory strengths a= 1 and b= 0.1. Bycontrast, the orange-boxed diagram corresponds to the orange-boxed parameter combination regime from (A), where nodes have regulatorystrengths a= 5 and b= 0.1. This parameter combination regime allows the system to be stable in 7 of the 8 SSS, losing only the all-OFF state. (C) Manyof the parameter combinations yielding multi-stable systems are not represented by the matrix, and are instead abstracted here. As an example, herewe present a parameter combination regime that can support 6 SSS and auto-activation strengths are similar to those in the orange box (thick redarrows) but have one unrestrained pair of mutual inhibition that can exist at a very high strength (blue T-head repression lines).doi:10.1371/journal.pone.0102873.g004
Multistability and Stochasticity of Network Triads
PLOS ONE | www.plosone.org 7 July 2014 | Volume 9 | Issue 7 | e102873
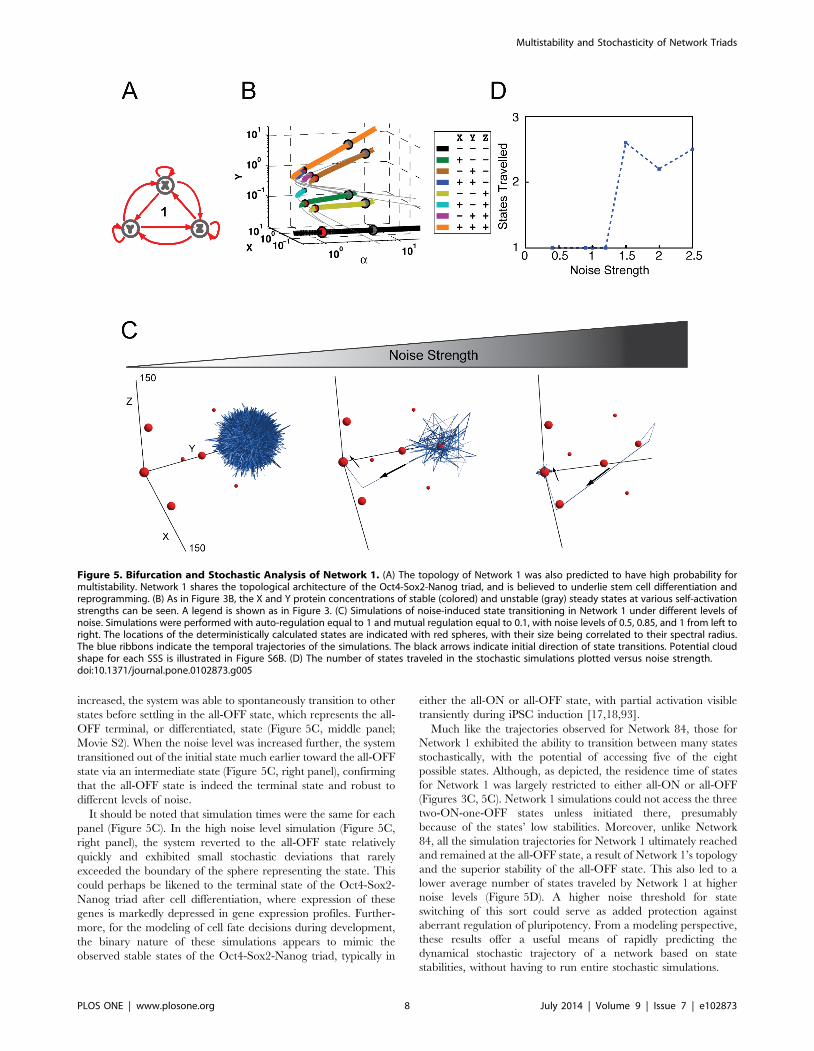
increased, the system was able to spontaneously transition to other
states before settling in the all-OFF state, which represents the all-
OFF terminal, or differentiated, state (Figure 5C, middle panel;
Movie S2). When the noise level was increased further, the system
transitioned out of the initial state much earlier toward the all-OFF
state via an intermediate state (Figure 5C, right panel), confirming
that the all-OFF state is indeed the terminal state and robust to
different levels of noise.
It should be noted that simulation times were the same for each
panel (Figure 5C). In the high noise level simulation (Figure 5C,
right panel), the system reverted to the all-OFF state relatively
quickly and exhibited small stochastic deviations that rarely
exceeded the boundary of the sphere representing the state. This
could perhaps be likened to the terminal state of the Oct4-Sox2-
Nanog triad after cell differentiation, where expression of these
genes is markedly depressed in gene expression profiles. Further-
more, for the modeling of cell fate decisions during development,
the binary nature of these simulations appears to mimic the
observed stable states of the Oct4-Sox2-Nanog triad, typically in
either the all-ON or all-OFF state, with partial activation visible
transiently during iPSC induction [17,18,93].
Much like the trajectories observed for Network 84, those for
Network 1 exhibited the ability to transition between many states
stochastically, with the potential of accessing five of the eight
possible states. Although, as depicted, the residence time of states
for Network 1 was largely restricted to either all-ON or all-OFF
(Figures 3C, 5C). Network 1 simulations could not access the three
two-ON-one-OFF states unless initiated there, presumably
because of the states’ low stabilities. Moreover, unlike Network
84, all the simulation trajectories for Network 1 ultimately reached
and remained at the all-OFF state, a result of Network 1’s topology
and the superior stability of the all-OFF state. This also led to a
lower average number of states traveled by Network 1 at higher
noise levels (Figure 5D). A higher noise threshold for state
switching of this sort could serve as added protection against
aberrant regulation of pluripotency. From a modeling perspective,
these results offer a useful means of rapidly predicting the
dynamical stochastic trajectory of a network based on state
stabilities, without having to run entire stochastic simulations.
Figure 5. Bifurcation and Stochastic Analysis of Network 1. (A) The topology of Network 1 was also predicted to have high probability formultistability. Network 1 shares the topological architecture of the Oct4-Sox2-Nanog triad, and is believed to underlie stem cell differentiation andreprogramming. (B) As in Figure 3B, the X and Y protein concentrations of stable (colored) and unstable (gray) steady states at various self-activationstrengths can be seen. A legend is shown as in Figure 3. (C) Simulations of noise-induced state transitioning in Network 1 under different levels ofnoise. Simulations were performed with auto-regulation equal to 1 and mutual regulation equal to 0.1, with noise levels of 0.5, 0.85, and 1 from left toright. The locations of the deterministically calculated states are indicated with red spheres, with their size being correlated to their spectral radius.The blue ribbons indicate the temporal trajectories of the simulations. The black arrows indicate initial direction of state transitions. Potential cloudshape for each SSS is illustrated in Figure S6B. (D) The number of states traveled in the stochastic simulations plotted versus noise strength.doi:10.1371/journal.pone.0102873.g005
Multistability and Stochasticity of Network Triads
PLOS ONE | www.plosone.org 8 July 2014 | Volume 9 | Issue 7 | e102873
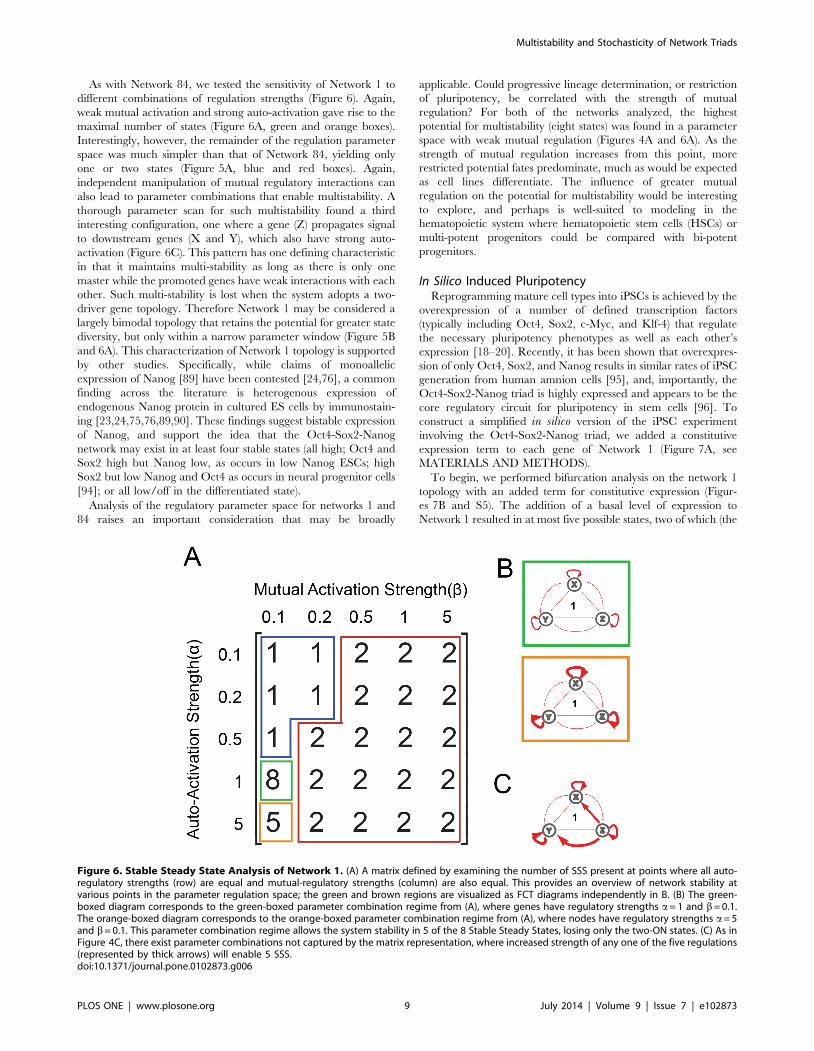
As with Network 84, we tested the sensitivity of Network 1 to
different combinations of regulation strengths (Figure 6). Again,
weak mutual activation and strong auto-activation gave rise to the
maximal number of states (Figure 6A, green and orange boxes).
Interestingly, however, the remainder of the regulation parameter
space was much simpler than that of Network 84, yielding only
one or two states (Figure 5A, blue and red boxes). Again,
independent manipulation of mutual regulatory interactions can
also lead to parameter combinations that enable multistability. A
thorough parameter scan for such multistability found a third
interesting configuration, one where a gene (Z) propagates signal
to downstream genes (X and Y), which also have strong auto-
activation (Figure 6C). This pattern has one defining characteristic
in that it maintains multi-stability as long as there is only one
master while the promoted genes have weak interactions with each
other. Such multi-stability is lost when the system adopts a two-
driver gene topology. Therefore Network 1 may be considered a
largely bimodal topology that retains the potential for greater state
diversity, but only within a narrow parameter window (Figure 5B
and 6A). This characterization of Network 1 topology is supported
by other studies. Specifically, while claims of monoallelic
expression of Nanog [89] have been contested [24,76], a common
finding across the literature is heterogenous expression of
endogenous Nanog protein in cultured ES cells by immunostain-
ing [23,24,75,76,89,90]. These findings suggest bistable expression
of Nanog, and support the idea that the Oct4-Sox2-Nanog
network may exist in at least four stable states (all high; Oct4 and
Sox2 high but Nanog low, as occurs in low Nanog ESCs; high
Sox2 but low Nanog and Oct4 as occurs in neural progenitor cells
[94]; or all low/off in the differentiated state).
Analysis of the regulatory parameter space for networks 1 and
84 raises an important consideration that may be broadly
applicable. Could progressive lineage determination, or restriction
of pluripotency, be correlated with the strength of mutual
regulation? For both of the networks analyzed, the highest
potential for multistability (eight states) was found in a parameter
space with weak mutual regulation (Figures 4A and 6A). As the
strength of mutual regulation increases from this point, more
restricted potential fates predominate, much as would be expected
as cell lines differentiate. The influence of greater mutual
regulation on the potential for multistability would be interesting
to explore, and perhaps is well-suited to modeling in the
hematopoietic system where hematopoietic stem cells (HSCs) or
multi-potent progenitors could be compared with bi-potent
progenitors.
In Silico Induced PluripotencyReprogramming mature cell types into iPSCs is achieved by the
overexpression of a number of defined transcription factors
(typically including Oct4, Sox2, c-Myc, and Klf-4) that regulate
the necessary pluripotency phenotypes as well as each other’s
expression [18–20]. Recently, it has been shown that overexpres-
sion of only Oct4, Sox2, and Nanog results in similar rates of iPSC
generation from human amnion cells [95], and, importantly, the
Oct4-Sox2-Nanog triad is highly expressed and appears to be the
core regulatory circuit for pluripotency in stem cells [96]. To
construct a simplified in silico version of the iPSC experiment
involving the Oct4-Sox2-Nanog triad, we added a constitutive
expression term to each gene of Network 1 (Figure 7A, see
MATERIALS AND METHODS).
To begin, we performed bifurcation analysis on the network 1
topology with an added term for constitutive expression (Figur-
es 7B and S5). The addition of a basal level of expression to
Network 1 resulted in at most five possible states, two of which (the
Figure 6. Stable Steady State Analysis of Network 1. (A) A matrix defined by examining the number of SSS present at points where all auto-regulatory strengths (row) are equal and mutual-regulatory strengths (column) are also equal. This provides an overview of network stability atvarious points in the parameter regulation space; the green and brown regions are visualized as FCT diagrams independently in B. (B) The green-boxed diagram corresponds to the green-boxed parameter combination regime from (A), where genes have regulatory strengths a= 1 and b= 0.1.The orange-boxed diagram corresponds to the orange-boxed parameter combination regime from (A), where nodes have regulatory strengths a= 5and b= 0.1. This parameter combination regime allows the system stability in 5 of the 8 Stable Steady States, losing only the two-ON states. (C) As inFigure 4C, there exist parameter combinations not captured by the matrix representation, where increased strength of any one of the five regulations(represented by thick arrows) will enable 5 SSS.doi:10.1371/journal.pone.0102873.g006
Multistability and Stochasticity of Network Triads
PLOS ONE | www.plosone.org 9 July 2014 | Volume 9 | Issue 7 | e102873
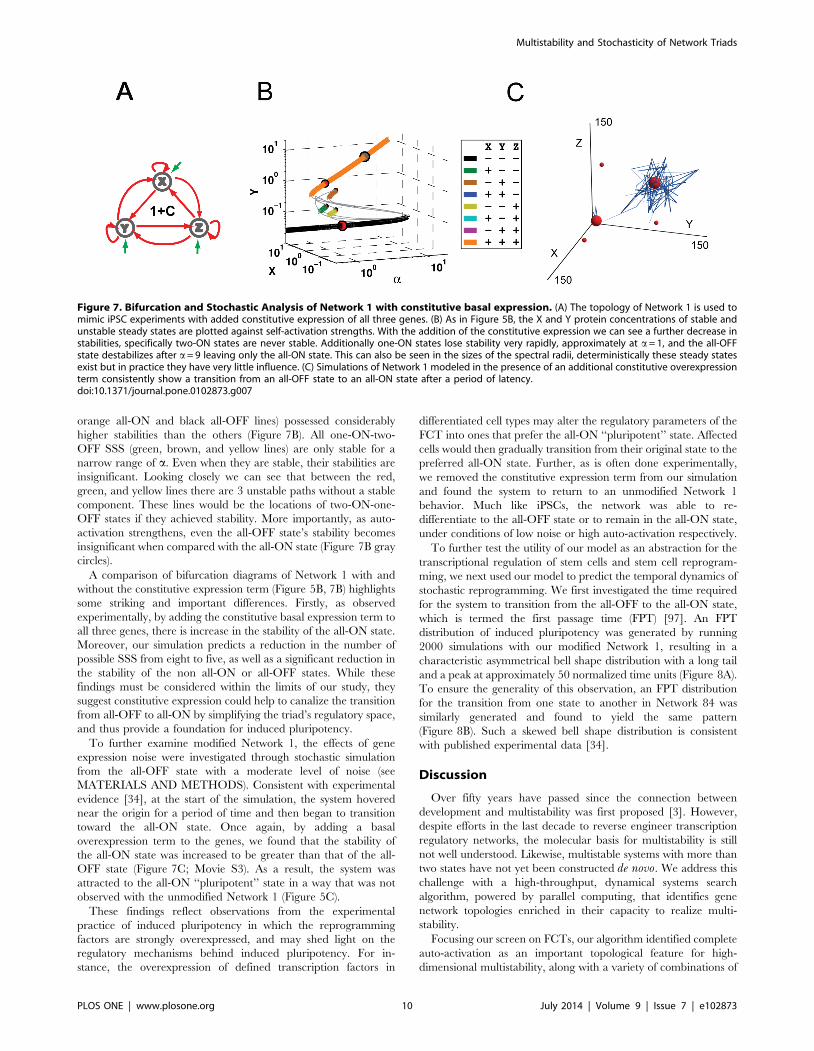
orange all-ON and black all-OFF lines) possessed considerably
higher stabilities than the others (Figure 7B). All one-ON-two-
OFF SSS (green, brown, and yellow lines) are only stable for a
narrow range of a. Even when they are stable, their stabilities are
insignificant. Looking closely we can see that between the red,
green, and yellow lines there are 3 unstable paths without a stable
component. These lines would be the locations of two-ON-one-
OFF states if they achieved stability. More importantly, as auto-
activation strengthens, even the all-OFF state’s stability becomes
insignificant when compared with the all-ON state (Figure 7B gray
circles).
A comparison of bifurcation diagrams of Network 1 with and
without the constitutive expression term (Figure 5B, 7B) highlights
some striking and important differences. Firstly, as observed
experimentally, by adding the constitutive basal expression term to
all three genes, there is increase in the stability of the all-ON state.
Moreover, our simulation predicts a reduction in the number of
possible SSS from eight to five, as well as a significant reduction in
the stability of the non all-ON or all-OFF states. While these
findings must be considered within the limits of our study, they
suggest constitutive expression could help to canalize the transition
from all-OFF to all-ON by simplifying the triad’s regulatory space,
and thus provide a foundation for induced pluripotency.
To further examine modified Network 1, the effects of gene
expression noise were investigated through stochastic simulation
from the all-OFF state with a moderate level of noise (see
MATERIALS AND METHODS). Consistent with experimental
evidence [34], at the start of the simulation, the system hovered
near the origin for a period of time and then began to transition
toward the all-ON state. Once again, by adding a basal
overexpression term to the genes, we found that the stability of
the all-ON state was increased to be greater than that of the all-
OFF state (Figure 7C; Movie S3). As a result, the system was
attracted to the all-ON ‘‘pluripotent’’ state in a way that was not
observed with the unmodified Network 1 (Figure 5C).
These findings reflect observations from the experimental
practice of induced pluripotency in which the reprogramming
factors are strongly overexpressed, and may shed light on the
regulatory mechanisms behind induced pluripotency. For in-
stance, the overexpression of defined transcription factors in
differentiated cell types may alter the regulatory parameters of the
FCT into ones that prefer the all-ON ‘‘pluripotent’’ state. Affected
cells would then gradually transition from their original state to the
preferred all-ON state. Further, as is often done experimentally,
we removed the constitutive expression term from our simulation
and found the system to return to an unmodified Network 1
behavior. Much like iPSCs, the network was able to re-
differentiate to the all-OFF state or to remain in the all-ON state,
under conditions of low noise or high auto-activation respectively.
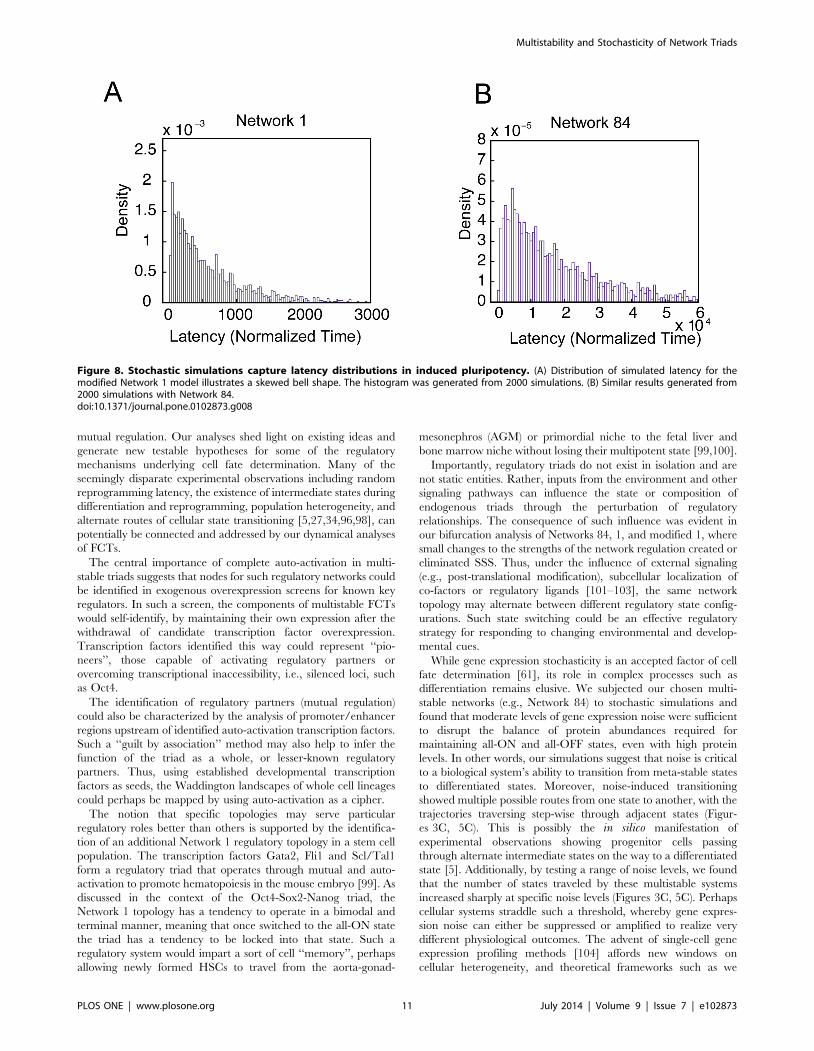
To further test the utility of our model as an abstraction for the
transcriptional regulation of stem cells and stem cell reprogram-
ming, we next used our model to predict the temporal dynamics of
stochastic reprogramming. We first investigated the time required
for the system to transition from the all-OFF to the all-ON state,
which is termed the first passage time (FPT) [97]. An FPT
distribution of induced pluripotency was generated by running
2000 simulations with our modified Network 1, resulting in a
characteristic asymmetrical bell shape distribution with a long tail
and a peak at approximately 50 normalized time units (Figure 8A).
To ensure the generality of this observation, an FPT distribution
for the transition from one state to another in Network 84 was
similarly generated and found to yield the same pattern
(Figure 8B). Such a skewed bell shape distribution is consistent
with published experimental data [34].
Discussion
Over fifty years have passed since the connection between
development and multistability was first proposed [3]. However,
despite efforts in the last decade to reverse engineer transcription
regulatory networks, the molecular basis for multistability is still
not well understood. Likewise, multistable systems with more than
two states have not yet been constructed de novo. We address this
challenge with a high-throughput, dynamical systems search
algorithm, powered by parallel computing, that identifies gene
network topologies enriched in their capacity to realize multi-
stability.
Focusing our screen on FCTs, our algorithm identified complete
auto-activation as an important topological feature for high-
dimensional multistability, along with a variety of combinations of
Figure 7. Bifurcation and Stochastic Analysis of Network 1 with constitutive basal expression. (A) The topology of Network 1 is used tomimic iPSC experiments with added constitutive expression of all three genes. (B) As in Figure 5B, the X and Y protein concentrations of stable andunstable steady states are plotted against self-activation strengths. With the addition of the constitutive expression we can see a further decrease instabilities, specifically two-ON states are never stable. Additionally one-ON states lose stability very rapidly, approximately at a= 1, and the all-OFFstate destabilizes after a= 9 leaving only the all-ON state. This can also be seen in the sizes of the spectral radii, deterministically these steady statesexist but in practice they have very little influence. (C) Simulations of Network 1 modeled in the presence of an additional constitutive overexpressionterm consistently show a transition from an all-OFF state to an all-ON state after a period of latency.doi:10.1371/journal.pone.0102873.g007
Multistability and Stochasticity of Network Triads
PLOS ONE | www.plosone.org 10 July 2014 | Volume 9 | Issue 7 | e102873
mutual regulation. Our analyses shed light on existing ideas and
generate new testable hypotheses for some of the regulatory
mechanisms underlying cell fate determination. Many of the
seemingly disparate experimental observations including random
reprogramming latency, the existence of intermediate states during
differentiation and reprogramming, population heterogeneity, and
alternate routes of cellular state transitioning [5,27,34,96,98], can
potentially be connected and addressed by our dynamical analyses
of FCTs.
The central importance of complete auto-activation in multi-
stable triads suggests that nodes for such regulatory networks could
be identified in exogenous overexpression screens for known key
regulators. In such a screen, the components of multistable FCTs
would self-identify, by maintaining their own expression after the
withdrawal of candidate transcription factor overexpression.
Transcription factors identified this way could represent ‘‘pio-
neers’’, those capable of activating regulatory partners or
overcoming transcriptional inaccessibility, i.e., silenced loci, such
as Oct4.
The identification of regulatory partners (mutual regulation)
could also be characterized by the analysis of promoter/enhancer
regions upstream of identified auto-activation transcription factors.
Such a ‘‘guilt by association’’ method may also help to infer the
function of the triad as a whole, or lesser-known regulatory
partners. Thus, using established developmental transcription
factors as seeds, the Waddington landscapes of whole cell lineages
could perhaps be mapped by using auto-activation as a cipher.
The notion that specific topologies may serve particular
regulatory roles better than others is supported by the identifica-
tion of an additional Network 1 regulatory topology in a stem cell
population. The transcription factors Gata2, Fli1 and Scl/Tal1
form a regulatory triad that operates through mutual and auto-
activation to promote hematopoiesis in the mouse embryo [99]. As
discussed in the context of the Oct4-Sox2-Nanog triad, the
Network 1 topology has a tendency to operate in a bimodal and
terminal manner, meaning that once switched to the all-ON state
the triad has a tendency to be locked into that state. Such a
regulatory system would impart a sort of cell ‘‘memory’’, perhaps
allowing newly formed HSCs to travel from the aorta-gonad-
mesonephros (AGM) or primordial niche to the fetal liver and
bone marrow niche without losing their multipotent state [99,100].
Importantly, regulatory triads do not exist in isolation and are
not static entities. Rather, inputs from the environment and other
signaling pathways can influence the state or composition of
endogenous triads through the perturbation of regulatory
relationships. The consequence of such influence was evident in
our bifurcation analysis of Networks 84, 1, and modified 1, where
small changes to the strengths of the network regulation created or
eliminated SSS. Thus, under the influence of external signaling
(e.g., post-translational modification), subcellular localization of
co-factors or regulatory ligands [101–103], the same network
topology may alternate between different regulatory state config-
urations. Such state switching could be an effective regulatory
strategy for responding to changing environmental and develop-
mental cues.
While gene expression stochasticity is an accepted factor of cell
fate determination [61], its role in complex processes such as
differentiation remains elusive. We subjected our chosen multi-
stable networks (e.g., Network 84) to stochastic simulations and
found that moderate levels of gene expression noise were sufficient
to disrupt the balance of protein abundances required for
maintaining all-ON and all-OFF states, even with high protein
levels. In other words, our simulations suggest that noise is critical
to a biological system’s ability to transition from meta-stable states
to differentiated states. Moreover, noise-induced transitioning
showed multiple possible routes from one state to another, with the
trajectories traversing step-wise through adjacent states (Figur-
es 3C, 5C). This is possibly the in silico manifestation of
experimental observations showing progenitor cells passing
through alternate intermediate states on the way to a differentiated
state [5]. Additionally, by testing a range of noise levels, we found
that the number of states traveled by these multistable systems
increased sharply at specific noise levels (Figures 3C, 5C). Perhaps
cellular systems straddle such a threshold, whereby gene expres-
sion noise can either be suppressed or amplified to realize very
different physiological outcomes. The advent of single-cell gene
expression profiling methods [104] affords new windows on
cellular heterogeneity, and theoretical frameworks such as we
Figure 8. Stochastic simulations capture latency distributions in induced pluripotency. (A) Distribution of simulated latency for themodified Network 1 model illustrates a skewed bell shape. The histogram was generated from 2000 simulations. (B) Similar results generated from2000 simulations with Network 84.doi:10.1371/journal.pone.0102873.g008
Multistability and Stochasticity of Network Triads
PLOS ONE | www.plosone.org 11 July 2014 | Volume 9 | Issue 7 | e102873
present here may provide valuable insights when informed by the
experimental data these technologies will provide.
Like signaling cascades in their simplest form, the regulatory
relationships between the genes of FCTs define their meta-
properties. In a manner reminiscent of the low-pass filtering
capacity of cascades, our stochastic simulations detected network-
specific variation in tolerance for noise. Specifically, in the analyses
of Networks 1 and 84, significantly different noise thresholds for
multistability were measured—0.8 and 1.4, respectively (Figures 3
and 5). This observation suggests that, along with other measures,
networks may be tuned for unique noise-switching thresholds. For
example, the Gata2-Fli1-Sci/Tal1 triad (Network 1) would be
predicted to remain in the all-ON state as long as noise levels are
maintained low, but to transition quickly to an all-OFF state under
high noise. This could be tested experimentally using tunable
synthetic noise controllers [94] or generators [105] upstream of
these HSC regulators to apply large fluctuations to the system.
As such, differentiation or pluripotency may provide readily
accessible experimental models. One possible method to induce
noise could be the expression of splice isoforms [106,107].
Focusing on the endogenous triads discussed, state change
dynamics could be evaluated under the perturbations of either
single or multiple splice isoforms. Thus, while controlling for total
protein expression within a particular triad, one could evaluate
whether ‘‘noise’’, derived from the concurrent expression of
multiple isoforms, influences the product or rate of the induced
state transition. If so, an interesting outcome may be that
individual differentiation pathways could be primed for state
change by expressing tailored suites of splice-isoforms or in the
case of iPSC reprogramming, perhaps accelerate the rate of state
switching.
Finally, our work offers new directions for synthetic biology
[11,12,108–112]. As a tool, the application of synthetic biology to
disease-related or developmental triads may allow for true reverse
engineering of in vivo processes. For example, the regulatory
dynamics of Network 1 (Gata2-Fli1-Scl/Tal1 and Oct4-Sox2-
Nanog) or Network 84 (RUNX2, SOX9 and PPAR-c) topologies
could be systematically examined for response to perturbation or
noise by constructing such FCTs in an orthogonal environment
(e.g., bacteria). Similarly, the effects of stochasticity on the
regulation of pluripotency could be studied directly in mammalian
systems using tunable synthetic noise generators. Such a system
could vary the gene expression of triad components, while keeping
their mean expression level constant, to evaluate the influence of
noise on network state change [57,113]. Our work here provides a
starting point for the design of next-generation synthetic circuits
that could exploit multistability and its physiological consequences.
Materials and Methods
Enumerating and Eliminating Redundant NetworksThree-node networks can have 39 = 19683 configurations, each
with nine edges that consist of positive, negative or null regulations
between the nodes. Our focus on FCTs resulted in a total of
29 = 512 possible configurations because each edge can only
represent positive or negative regulation. Through permutation
analysis many of these 512 networks were found to be identical to
each other. Identical networks were eliminated, leaving us with
104 unique networks (see SI).
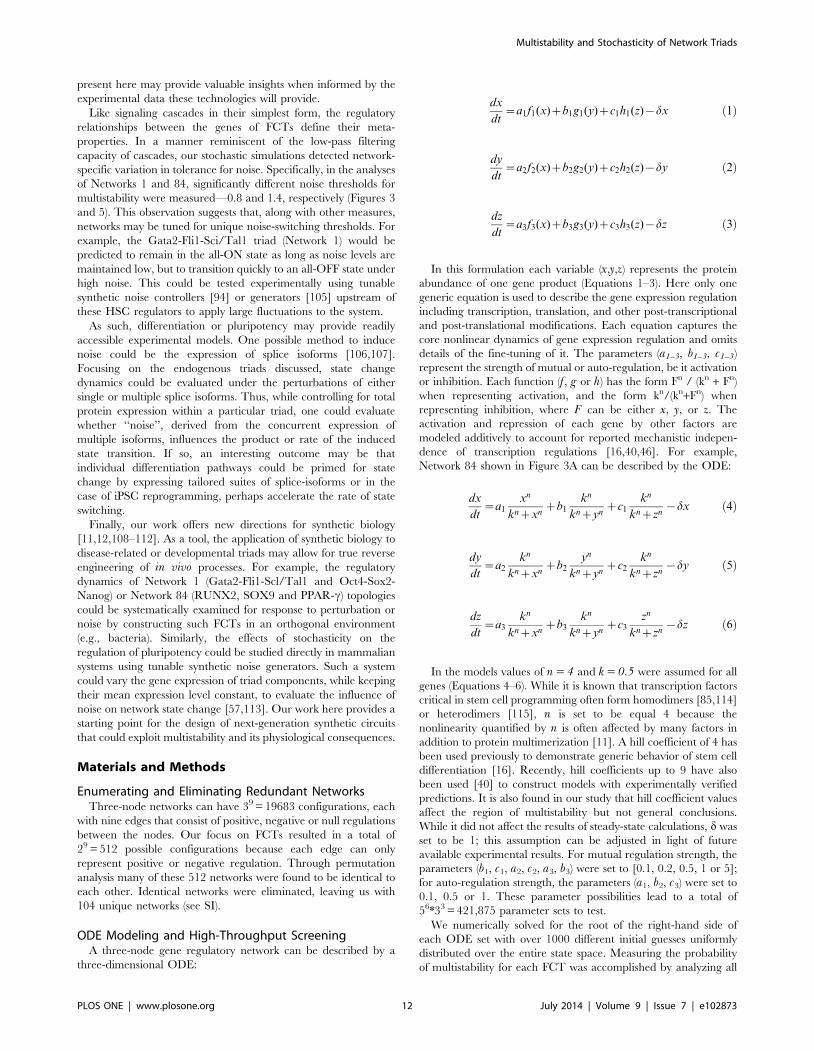
ODE Modeling and High-Throughput ScreeningA three-node gene regulatory network can be described by a
three-dimensional ODE:
dx
dt~a1f1(x)zb1g1(y)zc1h1(z){dx ð1Þ
dy
dt~a2f2(x)zb2g2(y)zc2h2(z){dy ð2Þ
dz
dt~a3f3(x)zb3g3(y)zc3h3(z){dz ð3Þ
In this formulation each variable (x,y,z) represents the protein
abundance of one gene product (Equations 1–3). Here only one
generic equation is used to describe the gene expression regulation
including transcription, translation, and other post-transcriptional
and post-translational modifications. Each equation captures the
core nonlinear dynamics of gene expression regulation and omits
details of the fine-tuning of it. The parameters (a1–3, b1–3, c1–3)
represent the strength of mutual or auto-regulation, be it activation
or inhibition. Each function (f, g or h) has the form Fn / (kn + Fn)
when representing activation, and the form kn/(kn+Fn) when
representing inhibition, where F can be either x, y, or z. The
activation and repression of each gene by other factors are
modeled additively to account for reported mechanistic indepen-
dence of transcription regulations [16,40,46]. For example,
Network 84 shown in Figure 3A can be described by the ODE:
dx
dt~a1
xn
knzxnzb1
kn
knzynzc1
kn
knzzn{dx ð4Þ
dy
dt~a2
kn
knzxnzb2
yn
knzynzc2
kn
knzzn{dy ð5Þ
dz
dt~a3
kn
knzxnzb3
kn
knzynzc3
zn
knzzn{dz ð6Þ
In the models values of n = 4 and k = 0.5 were assumed for all
genes (Equations 4–6). While it is known that transcription factors
critical in stem cell programming often form homodimers [85,114]
or heterodimers [115], n is set to be equal 4 because the
nonlinearity quantified by n is often affected by many factors in
addition to protein multimerization [11]. A hill coefficient of 4 has
been used previously to demonstrate generic behavior of stem cell
differentiation [16]. Recently, hill coefficients up to 9 have also
been used [40] to construct models with experimentally verified
predictions. It is also found in our study that hill coefficient values
affect the region of multistability but not general conclusions.
While it did not affect the results of steady-state calculations, d was
set to be 1; this assumption can be adjusted in light of future
available experimental results. For mutual regulation strength, the
parameters (b1, c1, a2, c2, a3, b3) were set to [0.1, 0.2, 0.5, 1 or 5];
for auto-regulation strength, the parameters (a1, b2, c3) were set to
0.1, 0.5 or 1. These parameter possibilities lead to a total of
56*33 = 421,875 parameter sets to test.
We numerically solved for the root of the right-hand side of
each ODE set with over 1000 different initial guesses uniformly
distributed over the entire state space. Measuring the probability
of multistability for each FCT was accomplished by analyzing all
Multistability and Stochasticity of Network Triads
PLOS ONE | www.plosone.org 12 July 2014 | Volume 9 | Issue 7 | e102873
421,875 parameter sets. A parallel algorithm was developed to
distribute this task as an ensemble of independent computations
(See the SI).
Analysis of the Parameter SpaceIn addition to the tabular data (Figure 4A and 6A) that is useful
for quick visualizations and analysis of stabilities, it is desirable to
recognize key patterns of parameter combinations (PCs) yielding
multistability. Therefore networks chosen (Network 84 and 1) for
in-depth analysis had their results recomputed with a wider sample
of parameter spaces. Specifically the PCs were expanded to five
levels for each edge, [0.1 0.5 1 2 6], yielding 5‘9 = 1,953,125
possible PCs. The found clusters can then be generalized to create
the FCT diagrams in Figures 4C and 6C.
Bifurcation AnalysisBifurcation diagrams were generated using MatCont [116], a
continuation toolbox for MATLAB. Bifurcation analysis was
performed on the auto-activation strength; mutual-regulation
strengths were set at .1. Spectral radii were gathered at specific
intervals to compare the stability of the stable steady states. Stable
and unstable steady state information was graphed to generate
Figures 3B, 5B, and 7B, for more information please see SI.
Stochastic SimulationsThe ODE model can be converted to chemical Langevin
equations to introduce stochasticity while approximating the
Gillespie algorithm [68,117]. All parameters were scaled up so
that copy numbers of gene products are in biologically reasonable
quantities and can reach over one hundred. This was done by
multiplying the coefficients in a, b, c and k by 100 with other
parameters unchanged. This linear shift does not alter the
bifurcation dynamics or the relative locations of SSS. At each
iteration, all chemical species are updated using the equation:
N(tzDt)~N(t)zDtA(N(t))zSffiffiffiffiffiffiffiffiffiffiffiffiffiffiffiffiffiffiffiffiffiffiffiffiffiffiffiffiffiffiffiffiffiffiffiffiffiffiffiffiffiffiffiffiDt(F(N(t))zB(N(t)))
pz(t) ð7Þ
In this equation, N(t) represents the abundance of chemical
species, A(t) is the right-hand side the ODE, and F and B are the
forward and backward reaction terms in each equation, respec-
tively, which were extracted from corresponding ODEs. z(t) are
the standard Normal variables, S is the stoichiometric matrix of
the biochemical reactions (refer to [68] for additional details). In
our modified algorithm, we added one parameter, a, to Equation
(13) to represent the tunable noise strength:
N(tzDt)~
N(t)zDtA(N(t))za � SffiffiffiffiffiffiffiffiffiffiffiffiffiffiffiffiffiffiffiffiffiffiffiffiffiffiffiffiffiffiffiffiffiffiffiffiffiffiffiffiffiffiffiffiDt(F(N(t))zB(N(t)))
pz(t)
ð8Þ
Here a was the noise strength used in Figures 3C and 5C.
Therefore, the results were comparable to pure discrete simula-
tions when a equals 1. Modulation of the noise strength(a) was
used to facilitate investigations of the system’s dynamics in
response to different noise levels. The multiplicative noise term
is chosen for simplicity without loss of generality.
Statistical TestsAll statistical tests were performed using Matlab. The param-
eters for each distribution were estimated using the Matlab
command mle. Chi-square (X2) statistics for each distribution were
computed with the chi2gof command.
Supporting Information
Figure S1 An example of the connection matrices and
topological permutations used to identify unique FCTs. In the
two FCT connection matrices illustrated, each row represents the
source of regulation and each column the recipient of regulation,
with symbols representing the activation or repression. As
indicated by the arrows, these two matrices are permutations of
each other after switching the Y and Z labels. Complete
permutation analysis involved both row and column switching.
(PDF)
Figure S2 Bifurcation diagram in Figure 3B shown with
different viewing angles and visual assistance. (A) The bifurcation
diagram of Figure3B is illustrated again to provide a frame of
reference; the figure legend is consistent among all subfigures. (B)
Bifurcation diagram is shown from the same angle as in A with
planes drawn at a= 1 and a= 5 where the red and gray points lie
precisely on the plane. (C) Bifurcation diagram drawn with a
different angle to emphasize differences in y-locations of each SSS.
Three planes drawn at y = 0.1, 1, and 5. Two gray points and two
red points lie on the bottom plane, four red points lie on the
middle plane, the SSS from the orange and blue lines overlap due
to our projection, and four gray points lie on the top plane, again
two points are overlapping, and one is out of the bounds of the
graph. (D) Bifurcation diagram drawn with another different angle
to emphasize differences in x-locations of each SSS. Three planes
drawn at x = 0.1, 1, and 5. Four gray points lie on the left plane,
with two overlapping, and one out of the bounds, four red points
lie on the middle plane, with two overlapping, and two gray and
two red points lie on the right plane.
(PDF)
Figure S3 Perturbations to network regulatory strengths affect
the probability distribution of network states. Regulatory strengths
for Network 84 were perturbed and the corresponding state
probability distributions were generated using results of stochastic
simulation. (A)–(C) Parameter strengths are identical to the green
box in Figure 4, with simulation state plotted as point collections
in B, and presented as a pie chart in C. (D)–(F) Random small
perturbations to the regulatory strengths and corresponding state
probability distributions. (G)–(I) Doubling in the strength of Y’s
inhibition of Z and corresponding state probability distributions.
The magnitudes of perturbations are labeled on each network
edge and are also represented by edge thickness. Axis labels of E
and H are the same as those of B. Simulations for these
distributions were calculated in the presence of a noise strength
equal to 1, and each perturbation was simulated ten times. The
point collections are color-coded based on their closest stable
steady state, and their probabilities are summarized in panels C, F
and I, respectively.
(PDF)
Figure S4 Bifurcation diagram in Figure 5B shown with
different viewing angles and visual assistance. (A) The bifurcation
diagram of Figure5B is illustrated again to provide a frame of
reference; the figure legend is consistent among all subfigures. The
position of the all-OFF states have been shifted due to the
logarithmic graphing, and that the all-OFF state remains at 0
concentration of x,y, and z regardless of alpha. (B) Bifurcation
diagram is shown from the same angle as in A with planes drawn
at a= 1 and a= 5 where the red and gray points lie precisely on
the plane. (C) Bifurcation diagram drawn with a different angle to
Multistability and Stochasticity of Network Triads
PLOS ONE | www.plosone.org 13 July 2014 | Volume 9 | Issue 7 | e102873
emphasize differences in y-locations of each SSS. Three planes
drawn at y = 0.1, 1, and 5. Two gray points and three red points lie
on the bottom plane, four red points lie on the middle plane, the
SSS from the orange and blue lines overlap due to our projection,
and two gray points lie on the top plane. (D) Bifurcation diagram
drawn with another different angle to emphasize differences in x-
locations of each SSS. Three planes drawn at x = 0.1, 1, and 5.
Two gray points lie on the left plane, four red points lie on the
middle plane, with two overlapping, and two gray and two red
points lie on the right plane.
(PDF)
Figure S5 Bifurcation diagram in Figure 7B shown with
different viewing angles and visual assistance. (A) The bifurcation
diagram of Figure7B is illustrated again to provide a frame of
reference; the figure legend is consistent among all subfigures. (B)
Bifurcation diagram is shown from the same angle as in A with
planes drawn at a= 1 and a= 5 where the red and gray points lie
precisely on the plane. (C) Bifurcation diagram drawn with a
different angle to emphasize differences in y-locations of each SSS.
Three planes drawn at y = 0.1, 1, and 5. One gray point and one
red point lie on the bottom plane, two red points exist between the
lower and middle planes (approximately 0.3), two red points lie on
the middle plane, and one gray point lies on the top plane. (D)
Bifurcation diagram drawn with another different angle to
emphasize differences in x-locations of each SSS. Three planes
drawn at x = 0.1, 1, and 5. One gray point lies on the left plane,
two red points lie on the middle plane, two red points exist
between the middle and right planes and one gray point and one
red point lie on the right plane.
(PDF)
Figure S6 Visual representation of constrained steady state sub-
space under noise perturbations. (A) Trajectory clouds displayed in
Figures 3C are approximated by 3D ellipsoids. The radius in each
dimension is correlated with the inverse of the strength of the
eigenvalue corresponding to a particular eigenvector. i.e. if the
eigenvalue for an eigenvector is only weakly negative, then the
cloud will be large in the direction of that eigenvector. Here the
all-OFF cloud is scaled down in size manually so that it fits on the
graph. The all-OFF and all-ON states are both disk-shaped, with
their primary eigenvalue being significantly stronger and facing
[1,1,1]. (B) Similarly, 3D ellipsoids were used to visualize possible
cloud shape shown in Figure 5C. Different scaling parameters are
used due to 1-ON and 2-ON states having a large difference in
eigenvalue strength. Even with the modified parameters the 2-ON
states are barely visible in the graph. This is consistent with
stochastic simulation results shown in Figure 5C, where the
trajectories barely spend any time in any of the 2-ON states.
(PDF)
Movie S1 A movie showing the simulated temporal evolution of
chemical species in Figure 3. The temporal evolution of
transcription factors is shown as an elongating blue ribbon. All
conditions are the same as in the right panel of Figure 3C. Only
the first 5000 time points were animated.
(MOV)
Movie S2 A movie showing the simulated temporal evolution of
chemical species in Figure 5. The temporal evolution of
transcription factors is shown as an elongating blue ribbon. All
conditions are the same as in right panel of Figure 5C. Only the
first 5000 time points are animated.
(MOV)
Movie S3 A movie showing the simulated temporal evolution of
chemical species in Figure 7. The temporal evolution of
transcription factors is shown as an elongating blue ribbon. All
conditions are the same as in Figure 6A. Noise strength is 1.5.
Only the first 200 time points are animated because the simulation
equilibrated rapidly.
(MOV)
Text S1 Supplementary texts of Materials and Methods.
(DOCX)
Acknowledgments
We thank D. Adalsteinsson for providing DataTank. We also thank Jim
Collins and George Daley for suggestions and comments.
Author Contributions
Conceived and designed the experiments: XW. Performed the experi-
ments: PF XW. Analyzed the data: PF KP RK HL YL XW. Contributed
reagents/materials/analysis tools: PF XW. Wrote the paper: PF KP RK
HL YL XW.
References
1. Junqueira LCU, Kelley RO (1998) Basic histology. Stamford, Conn.: Appleton
& Lange.
2. Macarthur BD, Ma’ayan A, Lemischka IR (2009) Systems biology of stem cell
fate and cellular reprogramming. Nat Rev Mol Cell Biol 10: 672–681.doi:10.1038/nrm2766.
3. Waddington CH (1957) The strategy of the genes; a discussion of some aspects
of theoretical biology. London: Allen & Unwin. ix, 262 p. p.
4. Kauffman SA (1969) Metabolic stability and epigenesis in randomly
constructed genetic nets. J Theor Biol 22: 437–467.
5. Huang S, Eichler G, Bar-Yam Y, Ingber DE (2005) Cell fates as high-dimensional attractor states of a complex gene regulatory network. Phys Rev
Lett 94: 128701.
6. Manu, Surkova S, Spirov AV, Gursky VV, Janssens H, et al. (2009)Canalization of gene expression and domain shifts in the Drosophila
blastoderm by dynamical attractors. PLoS Comput Biol 5: e1000303.doi:10.1371/journal.pcbi.1000303.
7. Acar M, Becskei A, van Oudenaarden A (2005) Enhancement of cellular
memory by reducing stochastic transitions. Nature 435: 228–232.
8. Gardner TS, Cantor CR, Collins JJ (2000) Construction of a genetic toggle
switch in Escherichia coli. Nature 403: 339–342.
9. Becskei A, Seraphin B, Serrano L (2001) Positive feedback in eukaryotic genenetworks: cell differentiation by graded to binary response conversion.
EMBO J 20: 2528–2535. doi:10.1093/emboj/20.10.2528.
10. Isaacs FJ, Hasty J, Cantor CR, Collins JJ (2003) Prediction and measurement of
an autoregulatory genetic module. Proc Natl Acad Sci U A 100: 7714–7719.
doi:10.1073/pnas.1332628100.
11. Ellis T, Wang X, Collins JJ (2009) Diversity-based, model-guided construction
of synthetic gene networks with predicted functions. Nat Biotechnol 27: 465–
471. doi:10.1038/nbt.1536.
12. Wu M, Su R-Q, Li X, Ellis T, Lai Y-C, et al. (2013) Engineering of regulated
stochastic cell fate determination. Proc Natl Acad Sci 110: 10610–10615.
doi:10.1073/pnas.1305423110.
13. Huang D, Holtz WJ, Maharbiz MM (2012) A genetic bistable switch utilizing
nonlinear protein degradation. J Biol Eng 6: 9. doi:10.1186/1754-1611-6-9.
14. Xiong W, Ferrell JE (2003) A positive-feedback-based bistable ‘‘memory
module’’ that governs a cell fate decision. Nature 426: 460–465.
15. Shiraishi T, Matsuyama S, Kitano H (2010) Large-Scale Analysis of Network
Bistability for Human Cancers. PLoS Comput Biol 6: e1000851. doi:10.1371/
journal.pcbi.1000851.
16. Huang S, Guo YP, May G, Enver T (2007) Bifurcation dynamics in lineage-
commitment in bipotent progenitor cells. Dev Biol 305: 695–713.
17. Park IH, Zhao R, West JA, Yabuuchi A, Huo H, et al. (2008) Reprogramming
of human somatic cells to pluripotency with defined factors. Nature 451: 141–
146. doi:10.1038/nature06534.
18. Takahashi K, Yamanaka S (2006) Induction of pluripotent stem cells from
mouse embryonic and adult fibroblast cultures by defined factors. Cell 126:
663–676. doi:10.1016/j.cell.2006.07.024.
19. Takahashi K, Tanabe K, Ohnuki M, Narita M, Ichisaka T, et al. (2007)
Induction of pluripotent stem cells from adult human fibroblasts by defined
factors. Cell 131: 861–872. doi:10.1016/j.cell.2007.11.019.
Multistability and Stochasticity of Network Triads
PLOS ONE | www.plosone.org 14 July 2014 | Volume 9 | Issue 7 | e102873
20. Yu J, Vodyanik MA, Smuga-Otto K, Antosiewicz-Bourget J, Frane JL, et al.
(2007) Induced pluripotent stem cell lines derived from human somatic cells.
Science 318: 1917–1920. doi:10.1126/science.1151526.
21. Boyer LA, Lee TI, Cole MF, Johnstone SE, Levine SS, et al. (2005) Core
transcriptional regulatory circuitry in human embryonic stem cells. Cell 122:
947–956. doi:10.1016/j.cell.2005.08.020.
22. Kim J, Chu J, Shen X, Wang J, Orkin SH (2008) An Extended Transcriptional
Network for Pluripotency of Embryonic Stem Cells. Cell 132: 1049–1061.
doi:10.1016/j.cell.2008.02.039.
23. Kalmar T, Lim C, Hayward P, Munoz-Descalzo S, Nichols J, et al. (2009)
Regulated fluctuations in nanog expression mediate cell fate decisions in
embryonic stem cells. PLoS Biol 7: e1000149.
24. Chambers I, Silva J, Colby D, Nichols J, Nijmeijer B, et al. (2007) Nanog
safeguards pluripotency and mediates germline development. Nature 450:
1230–1234. doi:10.1038/nature06403.
25. Graf T, Stadtfeld M (2008) Heterogeneity of embryonic and adult stem cells.
Cell Stem Cell 3: 480–483. doi:10.1016/j.stem.2008.10.007.
26. Canham MA, Sharov AA, Ko MSH, Brickman JM (2010) Functional
heterogeneity of embryonic stem cells revealed through translational amplifi-
cation of an early endodermal transcript. PLoS Biol 8: e1000379. doi:10.1371/
journal.pbio.1000379.
27. Chan EM, Ratanasirintrawoot S, Park IH, Manos PD, Loh YH, et al. (2009)
Live cell imaging distinguishes bona fide human iPS cells from partially
reprogrammed cells. Nat Biotechnol 27: 1033–1037. doi:10.1038/nbt.1580.
28. Hayashi K, Lopes SM, Tang F, Surani MA (2008) Dynamic equilibrium and
heterogeneity of mouse pluripotent stem cells with distinct functional and
epigenetic states. Cell Stem Cell 3: 391–401. doi:10.1016/j.stem.2008.07.027.
29. MacArthur BD, Sevilla A, Lenz M, Muller F-J, Schuldt BM, et al. (2012)
Nanog-dependent feedback loops regulate murine embryonic stem cell
heterogeneity. Nat Cell Biol 14: 1139–1147. doi:10.1038/ncb2603.
30. Macfarlan TS, Gifford WD, Driscoll S, Lettieri K, Rowe HM, et al. (2012)Embryonic stem cell potency fluctuates with endogenous retrovirus activity.
Nature 487: 57–63. doi:10.1038/nature11244.
31. Silva J, Smith A (2008) Capturing pluripotency. Cell 132: 532–536.
doi:10.1016/j.cell.2008.02.006.
32. Toyooka Y, Shimosato D, Murakami K, Takahashi K, Niwa H (2008)
Identification and characterization of subpopulations in undifferentiated ES cell
culture. Dev Camb Engl 135: 909–918. doi:10.1242/dev.017400.
33. Trott J, Hayashi K, Surani A, Babu MM, Martinez-Arias A (2012) Dissecting
ensemble networks in ES cell populations reveals micro-heterogeneity
underlying pluripotency. Mol Biosyst 8: 744–752. doi:10.1039/c1mb05398a.
34. Hanna J, Saha K, Pando B, van Zon J, Lengner CJ, et al. (2009) Direct cell
reprogramming is a stochastic process amenable to acceleration. Nature 462:
595–601. doi:10.1038/nature08592.
35. Yamanaka S (2009) Elite and stochastic models for induced pluripotent stem
cell generation. Nature 460: 49–52. doi:10.1038/nature08180.
36. Brock A, Chang H, Huang S (2009) Non-genetic heterogeneity—a mutation-
independent driving force for the somatic evolution of tumours. Nat Rev Genet
10: 336–342. doi:10.1038/nrg2556.
37. Huang S (2012) Tumor progression: chance and necessity in Darwinian and
Lamarckian somatic (mutationless) evolution. Prog Biophys Mol Biol 110: 69–
86. doi:10.1016/j.pbiomolbio.2012.05.001.
38. Ma W, Trusina A, El-Samad H, Lim WA, Tang C (2009) Defining Network
Topologies that Can Achieve Biochemical Adaptation. Cell 138: 760–773.
doi:10.1016/j.cell.2009.06.013.
39. Milo R, Shen-Orr S, Itzkovitz S, Kashtan N, Chklovskii D, et al. (2002)
Network motifs: simple building blocks of complex networks. Science 298: 824–
827. doi:10.1126/science.298.5594.824.
40. Shu J, Wu C, Wu Y, Li Z, Shao S, et al. (2013) Induction of pluripotency in
mouse somatic cells with lineage specifiers. Cell 153: 963–975. doi:10.1016/
j.cell.2013.05.001.
41. Chambers I, Smith A (2004) Self-renewal of teratocarcinoma and embryonic
stem cells. Oncogene 23: 7150–7160. doi:10.1038/sj.onc.1207930.
42. Graf T, Enver T (2009) Forcing cells to change lineages. Nature 462: 587–594.
doi:10.1038/nature08533.
43. Niwa H (2007) How is pluripotency determined and maintained? Development
134: 635–646. doi:10.1242/dev.02787.
44. Gupta PB, Fillmore CM, Jiang G, Shapira SD, Tao K, et al. (2011) Stochastic
State Transitions Give Rise to Phenotypic Equilibrium in Populations of
Cancer Cells. Cell 146: 633–644. doi:10.1016/j.cell.2011.07.026.
45. Eldar A, Elowitz MB (2010) Functional roles for noise in genetic circuits.
Nature 467: 167–173. doi:10.1038/nature09326.
46. Laslo P, Spooner CJ, Warmflash A, Lancki DW, Lee H-J, et al. (2006)
Multilineage Transcriptional Priming and Determination of Alternate
Hematopoietic Cell Fates. Cell 126: 755–766. doi:10.1016/j.cell.2006.06.052.
47. Kaufman M, Soule C, Thomas R (2007) A new necessary condition on
interaction graphs for multistationarity. J Theor Biol 248: 675–685.
doi:10.1016/j.jtbi.2007.06.016.
48. Hasty J, Pradines J, Dolnik M, Collins JJ (2000) Noise-based switches and
amplifiers for gene expression. Proc Natl Acad Sci U A 97: 2075–2080.
49. Palani S, Sarkar CA (2012) Transient noise amplification and gene expression
synchronization in a bistable mammalian cell-fate switch. Cell Rep 1: 215–224.
doi:10.1016/j.celrep.2012.01.007.
50. Suzuki H, Forrest ARR, van Nimwegen E, Daub CO, Balwierz PJ, et al. (2009)
The transcriptional network that controls growth arrest and differentiation in a
human myeloid leukemia cell line. Nat Genet 41: 553–562. doi:10.1038/
ng.375.
51. Kueh HY, Champhekhar A, Nutt SL, Elowitz MB, Rothenberg EV (2013)
Positive Feedback Between PU.1 and the Cell Cycle Controls Myeloid
Differentiation. Science 341: 670–673. doi:10.1126/science.1240831.
52. Young RA (2011) Control of the Embryonic Stem Cell State. Cell 144: 940–
954. doi:10.1016/j.cell.2011.01.032.
53. Ermentrout B (2002) Simulating, analyzing, and animating dynamical systems:
a guide to XPPAUT for researchers and students. Philadelphia: Society for
Industrial and Applied Mathematics. xiv, 290 p. p. .
54. Strogatz SH (1994) Nonlinear Dynamics and Chaos: With Applications to
Physics, Biology, Chemistry, and Engineering. .Reading, Mass: Addison-
Wesley Pub. xi, 498 p.
55. Chen KC, Calzone L, Csikasz-Nagy A, Cross FR, Novak B, et al. (2004)
Integrative analysis of cell cycle control in budding yeast. Mol Biol Cell 15:
3841–3862.
56. Blake WJ, KÆrn M, Cantor CR, Collins JJ (2003) Noise in eukaryotic gene
expression. Nature 422: 633–637.
57. Blake WJ, Balazsi G, Kohanski MA, Isaacs FJ, Murphy KF, et al. (2006)
Phenotypic consequences of promoter-mediated transcriptional noise. Mol Cell
24: 853–865.
58. Elowitz MB, Levine AJ, Siggia ED, Swain PS (2002) Stochastic gene expression
in a single cell. Science 297: 1183–1186.
59. Guido NJ, Wang X, Adalsteinsson D, McMillen D, Hasty J, et al. (2006) A
bottom-up approach to gene regulation. Nature 439: 856–860. doi:10.1038/
nature04473.
60. Raser JM, O’Shea EK (2004) Control of stochasticity in eukaryotic gene
expression. Science 304: 1811–1814.
61. Suel GM, Garcia-Ojalvo J, Liberman LM, Elowitz MB (2006) An excitable
gene regulatory circuit induces transient cellular differentiation. Nature 440:
545–550.
62. Thattai M, van Oudenaarden A (2001) Intrinsic noise in gene regulatory
networks. Proc Natl Acad Sci U A 98: 8614–8619.
63. Bell ML, Earl JB, Britt SG (2007) Two types of Drosophila R7 photoreceptor
cells are arranged randomly: a model for stochastic cell-fate determination.
J Comp Neurol 502: 75–85.
64. Chickarmane V, Enver T, Peterson C (2009) Computational modeling of the
hematopoietic erythroid-myeloid switch reveals insights into cooperativity,
priming, and irreversibility. PLoS Comput Biol 5: e1000268.
65. Chuang CF, Vanhoven MK, Fetter RD, Verselis VK, Bargmann CI (2007) An
innexin-dependent cell network establishes left-right neuronal asymmetry in C.
elegans. Cell 129: 787–799. doi:10.1016/j.cell.2007.02.052.
66. Raj A, Rifkin SA, Andersen E, van Oudenaarden A (2010) Variability in gene
expression underlies incomplete penetrance. Nature 463: 913–918.
doi:10.1038/nature08781.
67. Yao G, Lee TJ, Mori S, Nevins JR, You L (2008) A bistable Rb-E2F switch
underlies the restriction point. Nat Cell Biol 10: 476–482.
68. Adalsteinsson D, McMillen D, Elston TC (2004) Biochemical Network
Stochastic Simulator (BioNetS): software for stochastic modeling of biochemical
networks. BMC Bioinformatics 5: 24.
69. Akashi K, He X, Chen J, Iwasaki H, Niu C, et al. (2003) Transcriptional
accessibility for genes of multiple tissues and hematopoietic lineages is
hierarchically controlled during early hematopoiesis. Blood 101: 383–389.
doi:10.1182/blood-2002-06-1780.
70. Cross MA, Enver T (1997) The lineage commitment of haemopoietic
progenitor cells. Curr Opin Genet Dev 7: 609–613.
71. Hu M, Krause D, Greaves M, Sharkis S, Dexter M, et al. (1997) Multilineage
gene expression precedes commitment in the hemopoietic system. Genes Dev
11: 774–785.
72. Kim CFB, Jackson EL, Woolfenden AE, Lawrence S, Babar I, et al. (2005)
Identification of bronchioalveolar stem cells in normal lung and lung cancer.
Cell 121: 823–835. doi:10.1016/j.cell.2005.03.032.
73. Miyamoto T, Iwasaki H, Reizis B, Ye M, Graf T, et al. (2002) Myeloid or
lymphoid promiscuity as a critical step in hematopoietic lineage commitment.
Dev Cell 3: 137–147.
74. Gradshteyn IS, Ryzhik IM, Jeffrey A (2000) Table of integrals, series, and
products. 6th ed.San Diego: Academic Press. xlvii, 1163 p. p. Available: http://
www.loc.gov/catdir/description/els031/00104373.html http://www.loc.gov/
catdir/toc/els031/00104373.html.
75. Zhou JX, Aliyu MDS, Aurell E, Huang S (2012) Quasi-potential landscape in
complex multi-stable systems. J R Soc Interface: rsif20120434. doi:10.1098/
rsif.2012.0434.
76. MacArthur BD, Lemischka IR (2013) Statistical Mechanics of Pluripotency.
Cell 154: 484–489. doi:10.1016/j.cell.2013.07.024.
77. Vierbuchen T, Ostermeier A, Pang ZP, Kokubu Y, Sudhof TC, et al. (2010)
Direct conversion of fibroblasts to functional neurons by defined factors.
Nature 463: 1035–1041. doi:10.1038/nature08797.
78. Nakagawa T, Sharma M, Nabeshima Y, Braun RE, Yoshida S (2010)
Functional hierarchy and reversibility within the murine spermatogenic stem
cell compartment. Science 328: 62–67. doi:10.1126/science.1182868.
Multistability and Stochasticity of Network Triads
PLOS ONE | www.plosone.org 15 July 2014 | Volume 9 | Issue 7 | e102873
79. Loh YH, Wu Q, Chew JL, Vega VB, Zhang W, et al. (2006) The Oct4 and
Nanog transcription network regulates pluripotency in mouse embryonic stemcells. Nat Genet 38: 431–440. doi:10.1038/ng1760.
80. Fidalgo M, Faiola F, Pereira C-F, Ding J, Saunders A, et al. (2012) Zfp281
mediates Nanog autorepression through recruitment of the NuRD complexand inhibits somatic cell reprogramming. Proc Natl Acad Sci U S A 109:
16202–16207. doi:10.1073/pnas.1208533109.81. Navarro P, Festuccia N, Colby D, Gagliardi A, Mullin NP, et al. (2012)
OCT4/SOX2-independent Nanog autorepression modulates heterogeneous
Nanog gene expression in mouse ES cells. EMBO J 31: 4547–4562.doi:10.1038/emboj.2012.321.
82. Niwa H, Miyazaki J, Smith AG (2000) Quantitative expression of Oct-3/4defines differentiation, dedifferentiation or self-renewal of ES cells. Nat Genet
24: 372–376. doi:10.1038/74199.83. Radzisheuskaya A, Chia GLB, dos Santos RL, Theunissen TW, Castro LFC, et
al. (2013) A defined Oct4 level governs cell state transitions of pluripotency
entry and differentiation into all embryonic lineages. Nat Cell Biol 15: 579–590. doi:10.1038/ncb2742.
84. Karwacki-Neisius V, Goke J, Osorno R, Halbritter F, Ng JH, et al. (2013)Reduced Oct4 Expression Directs a Robust Pluripotent State with Distinct
Signaling Activity and Increased Enhancer Occupancy by Oct4 and Nanog.
Cell Stem Cell 12: 531–545. doi:10.1016/j.stem.2013.04.023.85. Wang J, Levasseur DN, Orkin SH (2008) Requirement of Nanog dimerization
for stem cell self-renewal and pluripotency. Proc Natl Acad Sci U A 105:6326–6331. doi:10.1073/pnas.0802288105.
86. Chew J-L, Loh Y-H, Zhang W, Chen X, Tam W-L, et al. (2005) Reciprocaltranscriptional regulation of Pou5f1 and Sox2 via the Oct4/Sox2 complex in
embryonic stem cells. Mol Cell Biol 25: 6031–6046. doi:10.1128/
MCB.25.14.6031-6046.2005.87. Chickarmane V, Troein C, Nuber UA, Sauro HM, Peterson C (2006)
Transcriptional Dynamics of the Embryonic Stem Cell Switch. PLoS ComputBiol 2: e123. doi:10.1371/journal.pcbi.0020123.
88. Aksoy I, Jauch R, Chen J, Dyla M, Divakar U, et al. (2013) Oct4 switches
partnering from Sox2 to Sox17 to reinterpret the enhancer code and specifyendoderm. EMBO J 32: 938–953. doi:10.1038/emboj.2013.31.
89. Faddah DA, Wang H, Cheng AW, Katz Y, Buganim Y, et al. (2013) Single-Cell Analysis Reveals that Expression of Nanog Is Biallelic and Equally
Variable as that of Other Pluripotency Factors in Mouse ESCs. Cell Stem Cell13: 23–29. doi:10.1016/j.stem.2013.04.019.
90. Filipczyk A, Gkatzis K, Fu J, Hoppe PS, Lickert H, et al. (2013) Biallelic
Expression of Nanog Protein in Mouse Embryonic Stem Cells. Cell Stem Cell13: 12–13. doi:10.1016/j.stem.2013.04.025.
91. Miyanari Y, Torres-Padilla M-E (2012) Control of ground-state pluripotencyby allelic regulation of Nanog. Nature 483: 470–473. doi:10.1038/
nature10807.
92. Smith A (2013) Nanog Heterogeneity: Tilting at Windmills? Cell Stem Cell 13:6–7. doi:10.1016/j.stem.2013.06.016.
93. Adewumi O, Aflatoonian B, Ahrlund-Richter L, Amit M, Andrews PW, et al.(2007) Characterization of human embryonic stem cell lines by the
International Stem Cell Initiative. Nat Biotechnol 25: 803–816. doi:10.1038/nbt1318.
94. Murphy KF, Adams RM, Wang X, Balazsi G, Collins JJ (2010) Tuning and
controlling gene expression noise in synthetic gene networks. Nucleic Acids Res38: 2712–2726. doi:10.1093/nar/gkq091.
95. Zhao H, Li Y, Jin H, Xie L, Liu C, et al. (2010) Rapid and efficientreprogramming of human amnion-derived cells into pluripotency by three
factors OCT4/SOX2/NANOG. Differ Res Biol Divers 80: 123–129.
doi:10.1016/j.diff.2010.03.002.96. Jaenisch R, Young R (2008) Stem cells, the molecular circuitry of pluripotency
and nuclear reprogramming. Cell 132: 567–582. doi:10.1016/j.cell.2008.01.015.
97. Kulkarni VG (1995) Modeling and analysis of stochastic systems. New York:Chapman & Hall. Available: http://www.loc.gov/catdir/enhancements/
fy0744/95015182-d.html.
98. Gracio F, Cabral J, Tidor B (2013) Modeling Stem Cell Induction Processes.
PLoS ONE 8: e60240. doi:10.1371/journal.pone.0060240.
99. Pimanda JE, Ottersbach K, Knezevic K, Kinston S, Chan WYI, et al. (2007)
Gata2, Fli1, and Scl form a recursively wired gene-regulatory circuit duringearly hematopoietic development. Proc Natl Acad Sci U S A 104: 17692–
17697. doi:10.1073/pnas.0707045104.
100. Kyba M, Daley GQ (2003) Hematopoiesis from embryonic stem cells: lessons
from and for ontogeny. Exp Hematol 31: 994–1006.
101. Kim S, Kim Y, Lee J, Chung J (2010) Regulation of FOXO1 by TAK1-Nemo-like kinase pathway. J Biol Chem 285: 8122–8129. doi:10.1074/
jbc.M110.101824.
102. Pourcet B, Pineda-Torra I, Derudas B, Staels B, Glineur C (2010)
SUMOylation of human peroxisome proliferator-activated receptor alphainhibits its trans-activity through the recruitment of the nuclear corepressor
NCoR. J Biol Chem 285: 5983–5992. doi:10.1074/jbc.M109.078311.
103. Wei F, Scholer HR, Atchison ML (2007) Sumoylation of Oct4 enhances its
stability, DNA binding, and transactivation. J Biol Chem 282: 21551–21560.doi:10.1074/jbc.M611041200.
104. Shalek AK, Satija R, Adiconis X, Gertner RS, Gaublomme JT, et al. (2013)Single-cell transcriptomics reveals bimodality in expression and splicing in
immune cells. Nature 498: 236–240. doi:10.1038/nature12172.
105. Lu T, Ferry M, Weiss R, Hasty J (2008) A molecular noise generator. Phys Biol5: 036006. doi:10.1088/1478-3975/5/3/036006.
106. Gabut M, Samavarchi-Tehrani P, Wang X, Slobodeniuc V, O’Hanlon D, et al.(2011) An Alternative Splicing Switch Regulates Embryonic Stem Cell
Pluripotency and Reprogramming. Cell 147: 132–146. doi:10.1016/j.cell.2011.08.023.
107. Lu Y, Loh Y-H, Li H, Cesana M, Ficarro SB, et al. (2014) Alternative Splicingof MBD2 Supports Self-Renewal in Human Pluripotent Stem Cells. Cell Stem
Cell. doi:10.1016/j.stem.2014.04.002.
108. Deans TL, Cantor CR, Collins JJ (2007) A tunable genetic switch based on
RNAi and repressor proteins for regulating gene expression in mammaliancells. Cell 130: 363–372.
109. Khalil AS, Collins JJ (2010) Synthetic biology: applications come of age. Nat
Rev Genet 11: 367–379. doi:10.1038/nrg2775.
110. Lu TK, Khalil AS, Collins JJ (2009) Next-generation synthetic gene networks.
Nat Biotechnol 27: 1139–1150. doi:10.1038/nbt.1591.
111. Stricker J, Cookson S, Bennett MR, Mather WH, Tsimring LS, et al. (2008) A
fast, robust and tunable synthetic gene oscillator. Nature 456: 516–519.doi:10.1038/nature07389.
112. Tigges M, Marquez-Lago TT, Stelling J, Fussenegger M (2009) A tunablesynthetic mammalian oscillator. Nature 457: 309–312.
113. Lu R, Markowetz F, Unwin RD, Leek JT, Airoldi EM, et al. (2009) Systems-level dynamic analyses of fate change in murine embryonic stem cells. Nature
462: 358–362. doi:10.1038/nature08575.
114. Glauche I, Herberg M, Roeder I (2010) Nanog Variability and Pluripotency
Regulation of Embryonic Stem Cells - Insights from a Mathematical ModelAnalysis. PLoS ONE 5: e11238. doi:10.1371/journal.pone.0011238.
115. Remenyi A, Lins K, Nissen LJ, Reinbold R, Scholer HR, et al. (2003) Crystalstructure of a POU/HMG/DNA ternary complex suggests differential
assembly of Oct4 and Sox2 on two enhancers. Genes Dev 17: 2048–2059.
doi:10.1101/gad.269303.
116. Dhooge A, Govaerts W, Kuznetsov YA (2003) MATCONT: A MATLAB
Package for Numerical Bifurcation Analysis of ODEs. ACM Trans Math Softw29: 141–164. doi:10.1145/779359.779362.
117. Gillespie D (1977) Exact stochastic simulation of coupled chemical reactions.J Phys Chem 81: 2340–2361.
Multistability and Stochasticity of Network Triads
PLOS ONE | www.plosone.org 16 July 2014 | Volume 9 | Issue 7 | e102873