Embed Size (px)
Citation preview

Gene length as a regulator for ribosome recruitmentand protein synthesis: theoretical insightsLucas D. Fernandes1,2, Alessandro P.S. de Moura2, and Luca Ciandrini3,4,*
1Departamento de Entomologia e Acarologia, Escola Superior de Agricultura ”Luiz de Queiroz” - Universidade deSao Paulo, ESALQ - USP, 13418-900, Piracicaba/SP, Brazil2Institute for Complex Systems and Mathematical Biology, University of Aberdeen, Aberdeen, AB24 3UE, UK3DIMNP UMR 5235, Universite de Montpellier and CNRS, F-34095, Montpellier, France4Laboratoire Charles Coulomb UMR5221, Universite de Montpellier and CNRS, F-34095, Montpellier, France*[email protected]
ABSTRACT
Protein synthesis rates are determined, at the translational level, by properties of the transcript’s sequence. The efficiencyof an mRNA can be tuned by varying the ribosome binding sites controlling the recruitment of the ribosomes, or the codonusage establishing the speed of protein elongation. In this work we propose transcript length as a further key determinantof translation efficiency. Based on a physical model that considers the kinetics of ribosomes advancing on the mRNA anddiffusing in its surrounding, as well as mRNA circularisation and ribosome drop-off, we explain how the transcript length mayplay a central role in establishing ribosome recruitment and the overall translation rate of an mRNA. According to our results,the proximity of the 3’ end to the ribosomal recruitment site of the mRNA could induce a feedback in the translation process thatwould favour the recycling of ribosomes.We also demonstrate how this process may be involved in shaping the experimentalribosome density-gene length dependence. Finally, we argue that cells could exploit this mechanism to adjust and balance theusage of its ribosomal resources.
IntroductionmRNA translation is, together with transcription, the pillar of the central dogma of molecular biology. In spite of its key role inprotein synthesis, the accurate understanding of its dynamical details still remains elusive at the present time, and the sequencedeterminants of mRNA translation efficiency are not fully understood1, 2. Initiation of translation regulates the recruitment ofribosomes and it is believed to be modulated by mRNA secondary structures3, 4, while protein elongation is mainly consideredto be regulated by tRNA abundances determining the pace of the ribosome5–7. The individual steps of translation are thought tobe well understood, yet there is no reliable approach quantitatively predicting the overall protein synthesis rates for a giventranscript.
A better understanding of the molecular mechanisms of mRNA translation will unravel the physiological determinants oftranslation efficiency. Besides, this knowledge will be extremely useful in developing applications in synthetic biology and willallow tight control on the average production of a protein and on its expression noise.
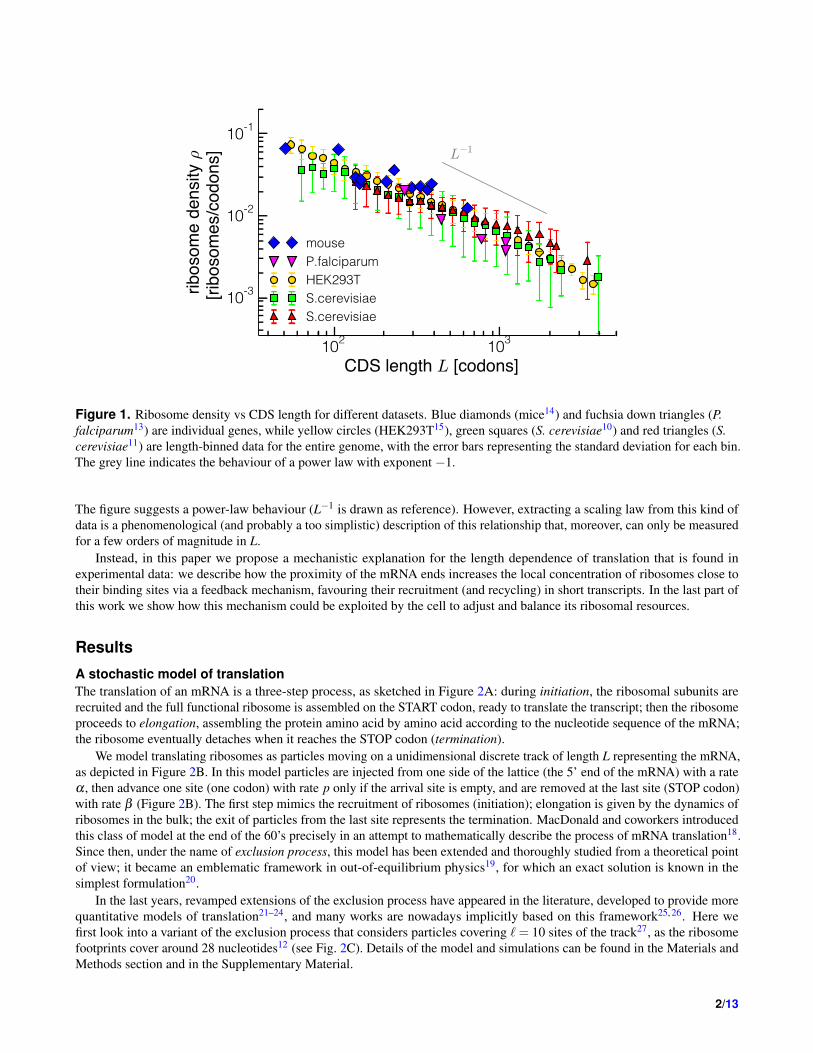
The translation efficiency of a transcript is often identified with its experimentally observed polysome state (a transcriptwith two or more ribosomes; monosome when there is only one ribosome residing on it), meaning that transcripts with highribosome density are more efficiently translated8. Remarkably, many experimental observations show that the ribosome densityis related to the length L of the coding sequence (CDS): the longer the mRNA, the smaller the ribosomal density. This indicatesthe presence of a length-dependent control of translation. As we show in Figure 1, the observation that average ribosomaldensities ρ strongly anti-correlate to CDS lengths L appears to be a conserved feature across many organisms, ranging fromunicellular systems such as L. lactis9, S. cerevisiae10–12 or P. falciparum13, to more complex organisms such as mouse andhuman cells14, 15. The common traits in the density-length dependence suggest that this relationship is dictated by universalmechanisms underlying the translation process.
However, this remark has been strangely overlooked in the literature (with the exception of Guo et al.16), particularly inthe theoretical literature trying to provide models of mRNA translation. A few hypotheses have been proposed to justify theemergence of the length dependence of the ribosome density, which requires a regulation apparatus acting at the initiation17 or atthe elongation stage12. These hypotheses have not been examined with the support of a mechanistic model and a mathematicalapproach. In contrast with previous studies, here we explain qualitatively and quantitatively the relationship between ribosomedensity and CDS length, making the point that transcript length is a critical determinant of protein synthesis rates.
In Figure 1 we show a log-log plot of measured ribosomal densities as a function of the CDS length for different organisms.
arX
iv:1
702.
0063
2v3
[q-
bio.
SC]
12
Dec
201
7
102 103
CDS length L [codons]
10-3
10-2
10-1
ribos
ome
dens
ity ρ
[ribo
som
es/co
dons
] L−1
mouseP.falciparumHEK293TS.cerevisiaeS.cerevisiae
Figure 1. Ribosome density vs CDS length for different datasets. Blue diamonds (mice14) and fuchsia down triangles (P.falciparum13) are individual genes, while yellow circles (HEK293T15), green squares (S. cerevisiae10) and red triangles (S.cerevisiae11) are length-binned data for the entire genome, with the error bars representing the standard deviation for each bin.The grey line indicates the behaviour of a power law with exponent −1.
The figure suggests a power-law behaviour (L−1 is drawn as reference). However, extracting a scaling law from this kind ofdata is a phenomenological (and probably a too simplistic) description of this relationship that, moreover, can only be measuredfor a few orders of magnitude in L.
Instead, in this paper we propose a mechanistic explanation for the length dependence of translation that is found inexperimental data: we describe how the proximity of the mRNA ends increases the local concentration of ribosomes close totheir binding sites via a feedback mechanism, favouring their recruitment (and recycling) in short transcripts. In the last part ofthis work we show how this mechanism could be exploited by the cell to adjust and balance its ribosomal resources.
Results
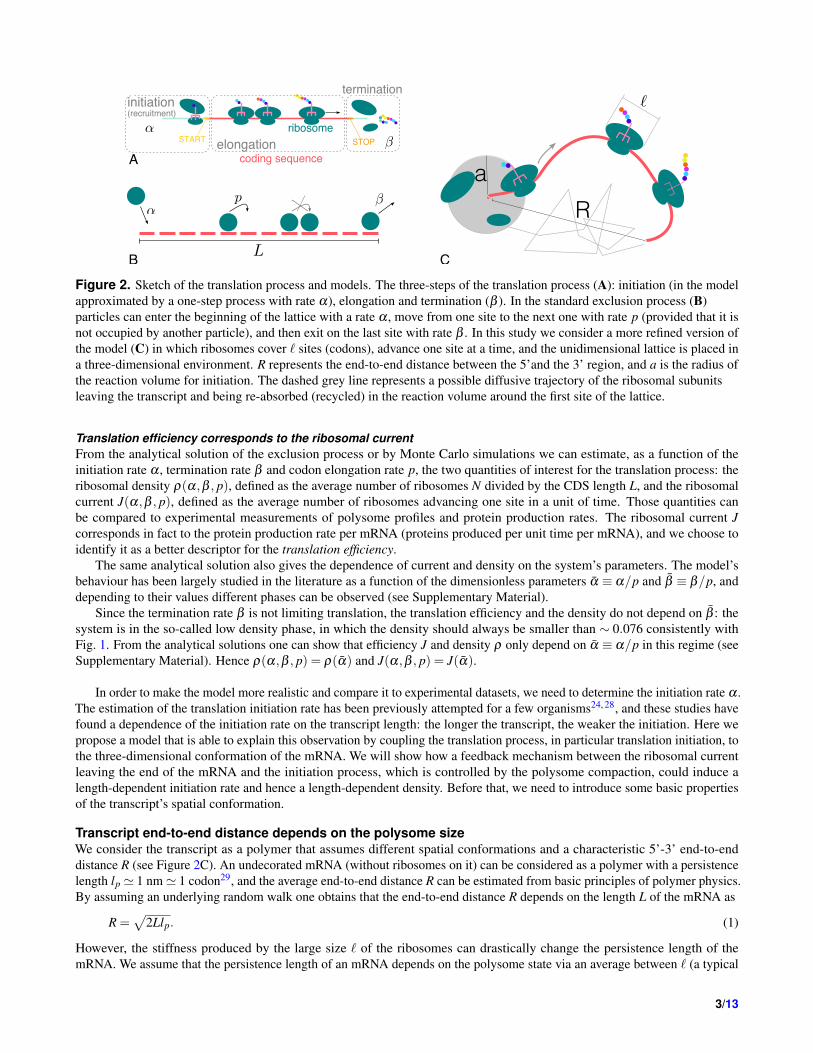
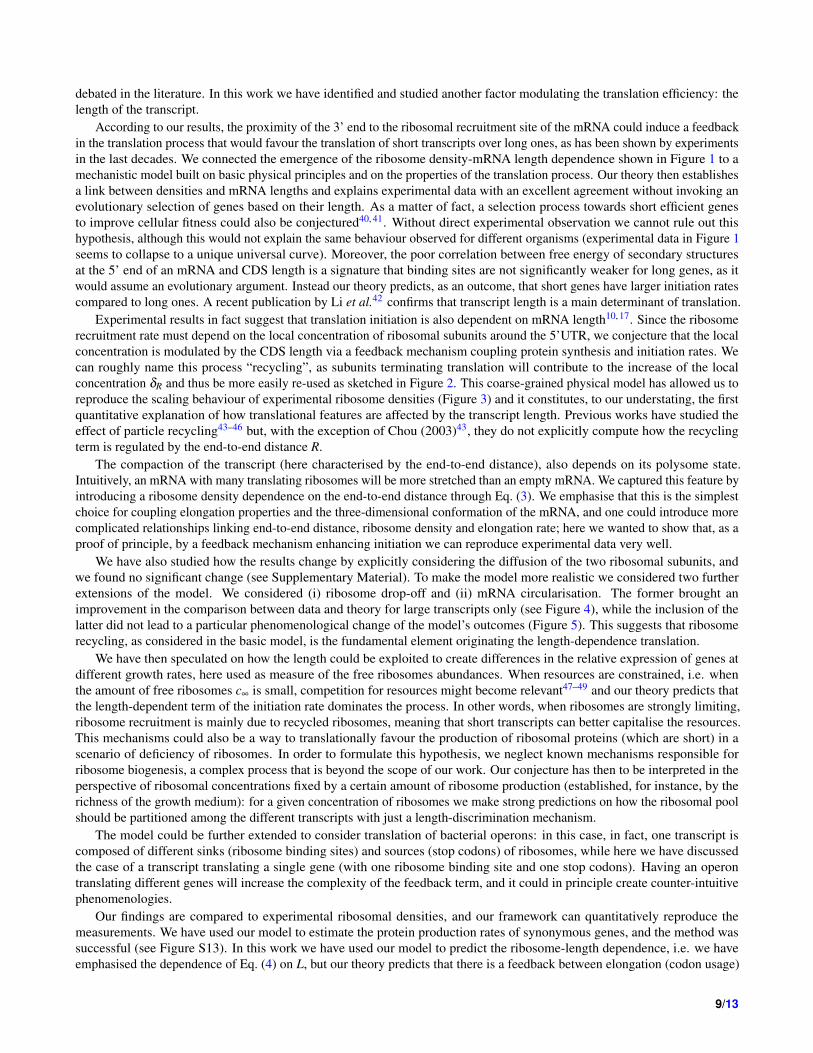
A stochastic model of translationThe translation of an mRNA is a three-step process, as sketched in Figure 2A: during initiation, the ribosomal subunits arerecruited and the full functional ribosome is assembled on the START codon, ready to translate the transcript; then the ribosomeproceeds to elongation, assembling the protein amino acid by amino acid according to the nucleotide sequence of the mRNA;the ribosome eventually detaches when it reaches the STOP codon (termination).
We model translating ribosomes as particles moving on a unidimensional discrete track of length L representing the mRNA,as depicted in Figure 2B. In this model particles are injected from one side of the lattice (the 5’ end of the mRNA) with a rateα , then advance one site (one codon) with rate p only if the arrival site is empty, and are removed at the last site (STOP codon)with rate β (Figure 2B). The first step mimics the recruitment of ribosomes (initiation); elongation is given by the dynamics ofribosomes in the bulk; the exit of particles from the last site represents the termination. MacDonald and coworkers introducedthis class of model at the end of the 60’s precisely in an attempt to mathematically describe the process of mRNA translation18.Since then, under the name of exclusion process, this model has been extended and thoroughly studied from a theoretical pointof view; it became an emblematic framework in out-of-equilibrium physics19, for which an exact solution is known in thesimplest formulation20.
In the last years, revamped extensions of the exclusion process have appeared in the literature, developed to provide morequantitative models of translation21–24, and many works are nowadays implicitly based on this framework25, 26. Here wefirst look into a variant of the exclusion process that considers particles covering `= 10 sites of the track27, as the ribosomefootprints cover around 28 nucleotides12 (see Fig. 2C). Details of the model and simulations can be found in the Materials andMethods section and in the Supplementary Material.
2/13
R
acoding sequence
ribosomeSTART
initiation(recruitment)
elongation
termination
STOP
B
A
C
Figure 2. Sketch of the translation process and models. The three-steps of the translation process (A): initiation (in the modelapproximated by a one-step process with rate α), elongation and termination (β ). In the standard exclusion process (B)particles can enter the beginning of the lattice with a rate α , move from one site to the next one with rate p (provided that it isnot occupied by another particle), and then exit on the last site with rate β . In this study we consider a more refined version ofthe model (C) in which ribosomes cover ` sites (codons), advance one site at a time, and the unidimensional lattice is placed ina three-dimensional environment. R represents the end-to-end distance between the 5’and the 3’ region, and a is the radius ofthe reaction volume for initiation. The dashed grey line represents a possible diffusive trajectory of the ribosomal subunitsleaving the transcript and being re-absorbed (recycled) in the reaction volume around the first site of the lattice.
Translation efficiency corresponds to the ribosomal currentFrom the analytical solution of the exclusion process or by Monte Carlo simulations we can estimate, as a function of theinitiation rate α , termination rate β and codon elongation rate p, the two quantities of interest for the translation process: theribosomal density ρ(α,β , p), defined as the average number of ribosomes N divided by the CDS length L, and the ribosomalcurrent J(α,β , p), defined as the average number of ribosomes advancing one site in a unit of time. Those quantities canbe compared to experimental measurements of polysome profiles and protein production rates. The ribosomal current Jcorresponds in fact to the protein production rate per mRNA (proteins produced per unit time per mRNA), and we choose toidentify it as a better descriptor for the translation efficiency.
The same analytical solution also gives the dependence of current and density on the system’s parameters. The model’sbehaviour has been largely studied in the literature as a function of the dimensionless parameters α ≡ α/p and β ≡ β/p, anddepending to their values different phases can be observed (see Supplementary Material).
Since the termination rate β is not limiting translation, the translation efficiency and the density do not depend on β : thesystem is in the so-called low density phase, in which the density should always be smaller than ∼ 0.076 consistently withFig. 1. From the analytical solutions one can show that efficiency J and density ρ only depend on α ≡ α/p in this regime (seeSupplementary Material). Hence ρ(α,β , p) = ρ(α) and J(α,β , p) = J(α).
In order to make the model more realistic and compare it to experimental datasets, we need to determine the initiation rate α .The estimation of the translation initiation rate has been previously attempted for a few organisms24, 28, and these studies havefound a dependence of the initiation rate on the transcript length: the longer the transcript, the weaker the initiation. Here wepropose a model that is able to explain this observation by coupling the translation process, in particular translation initiation, tothe three-dimensional conformation of the mRNA. We will show how a feedback mechanism between the ribosomal currentleaving the end of the mRNA and the initiation process, which is controlled by the polysome compaction, could induce alength-dependent initiation rate and hence a length-dependent density. Before that, we need to introduce some basic propertiesof the transcript’s spatial conformation.
Transcript end-to-end distance depends on the polysome sizeWe consider the transcript as a polymer that assumes different spatial conformations and a characteristic 5’-3’ end-to-enddistance R (see Figure 2C). An undecorated mRNA (without ribosomes on it) can be considered as a polymer with a persistencelength lp ' 1 nm' 1 codon29, and the average end-to-end distance R can be estimated from basic principles of polymer physics.By assuming an underlying random walk one obtains that the end-to-end distance R depends on the length L of the mRNA as
R =√
2Llp. (1)
However, the stiffness produced by the large size ` of the ribosomes can drastically change the persistence length of themRNA. We assume that the persistence length of an mRNA depends on the polysome state via an average between ` (a typical
3/13

ribosome footprint) and lp (persistence length of an empty mRNA), weighted by the fraction f = ρ` of the transcript coveredby ribosomes (at the steady state). After these considerations we write the effective persistence length of the mRNA as
leff = f `+(1− f )lp
=`2ρ +(1−ρ`)lp, (2)
which is equal to lp when the mRNA is empty and reaches ` when the ribosomal density attains its maximal value ρ = 1/`.Substituting this value of the effective persistence length into Eq.(1) we obtain the average end-to-end distance of a polysomeas a function of the density ρ and the length L:
R =√
2L[`2
ρ +(1−ρ`)lp]1/2
. (3)
This way, we have used a coarse-grained model to couple the state of the polysome to its spatial conformation. Intuitively,Eq.(3) means that a translated transcript with many ribosomes on it will be more stretched (so the distance R between 5’ and 3’ends will be larger) compared to a situation with a small ribosomal density or an empty mRNA. We have neglected potentialformation of secondary structures inside the coding region. Such structures would only slightly decrease the effective lengthof the sequence (a few codons) and we treat only translationally active transcripts, meaning that moving ribosomes (10-20codons/s) continuously unfold those structures.
When initiation is limiting, the density ρ of ribosomes is fixed by α , and via Eq. (3) we are hence able to determine thedependence of the end-to-end distance as a function of the initiation rate and the length of the transcript, R(α,L).
Initiation can be enhanced by a length-dependent feedback mechanismWe will consider that the magnitude of the initiation rate α is determined by the concentration c of free ribosomal subunitsvia a first-order rate equation: α = α0 c, with α0 being the initiation rate constant depending, for instance, on the affinitybetween the ribosome and the 5’ UTR binding site on the mRNA. The concentration c is the local concentration of subunitsin the reaction volume of radius a around the ribosome binding site at the 5’ end of the transcript; we introduce c∞ as thehomogeneous concentration of free subunits far from the transcript. The local concentration c in the reaction volume is affectedby the ribosomes terminating translation at the 3’ end of a transcript, then diffusing into the reaction volume and contributing tothe abundance of free ribosomal subunits in this volume. The contribution δR to the local concentration c due to this feedbackmechanism depends on the end-to-end distance R previously calculated in Eq. (3). It can be shown for different organisms,considering typical values of transcript numbers and cytoplasm volume, that the average end-to-end distance is smaller than theaverage separation between transcripts. This corroborates the intrinsic assumption that the translating processes of distinctmRNAs do not interfere with each other. Thus each individual mRNA can be thought of as a sink-source system for ribosomes(the ribosome binding site representing the sink and the ribosome termination site representing the source) immersed in anenvironment with a constant background ribosomal concentration c∞. Hence, the local ribosome concentration around theribosome binding site can be written as c(R) = c∞ +δR.
By considering ribosomes as particles performing free diffusion when they are not bound to the mRNA (see the Supplemen-tary Material) we can obtain a mathematical expression of the initiation rate as a function of the system’s parameters. It can beshown (see Supplementary Material) that the increase δR due to the source at the end of transcript is δR ∼ J/DR, where D is thediffusion coefficient of ribosomes (∼ 0.04µm2/s30). Considering that the protein production rate per transcript is J ∼ 0.1−10proteins/s24, 31, and that in E.coli c∞ ∼ 0.5−1 ·103 free ribosomes/µm332, for a typical mRNA of length ∼ 300 codons thisback-of-the envelope calculation leads to δR/c∞ ∼ 0.1−10, meaning that the concentration increase is at least comparable withthe bulk ribosomal concentration and the mechanism proposed is relevant in the biological regime.
Regarding translation as a steady state process with ribosomal density and current values given by ρ and J respectively, wefind the initiation parameter α (see Supplementary Material for a complete derivation):
α = α0(c∞ +δR) = α∞ +λJ(α)
R(α,L), (4)
where we have emphasised the dependence of the ribosomal current J on α . Similarly, the end-to-end distance R also dependson α and L as shown in Eq. (3). We highlight that the parameter α0 and thus α∞ and λ depend on the binding between theribosome and the mRNA, which is supposed to be mainly regulated by mRNA secondary structures. We will consider theparameters of the model to be independent on the transcript length. This is justified by a weak correlation (Pearson r =−0.01,p-value 0.5)33 between free energies of secondary structures in the 5’UTRs and the transcript length L (see also Figure S6 in theSupplementary Material). The parameter α∞ is adimensional and α∞ = pα∞ represents the initiation rate without the feedbackmechanism between the current and the initiation, or equivalently when the end-to-end distance R is large enough to make this
4/13

mechanism negligible. The parameter λ characterises the strength of the feedback. It has the dimensions of a length and itcorresponds to the typical separation between 5’ and 3’ below which the feedback mechanism becomes relevant. We measurethis parameter in units of codon length, which roughly corresponds to 1 nm.
Consequently, the current of ribosomes leaving the end of a transcript increases the concentration of ribosomal subunitsaround their binding region; through modulation of the mRNA stiffness due to the ribosome load, this feedback leads toinitiation rates that are strongly length-dependent. Equation (4) is an implicit equation that can be numerically solved toobtain the initiation rate, and thus the density ρ(α) and the current as a function of L. To check the validity of our analyticalcalculations, we also developed a simulation scheme that allows us to fix the initiation rate via a self-consistent method (seeMethods section).
Although Eq. (4) considers the ribosome as a single diffusing particle, we can explicitly consider the diffusion of the tworibosomal subunits. This would generate a dependence on R2 instead of R in Eq. (4). However, the qualitative behaviour of ourresults does not significantly change and for the sake of simplicity we decided to present the outcomes of the theory describedby Eq. (4). We include the analysis of this more refined model in the Supplementary Material (see also Figure S9 and S12).
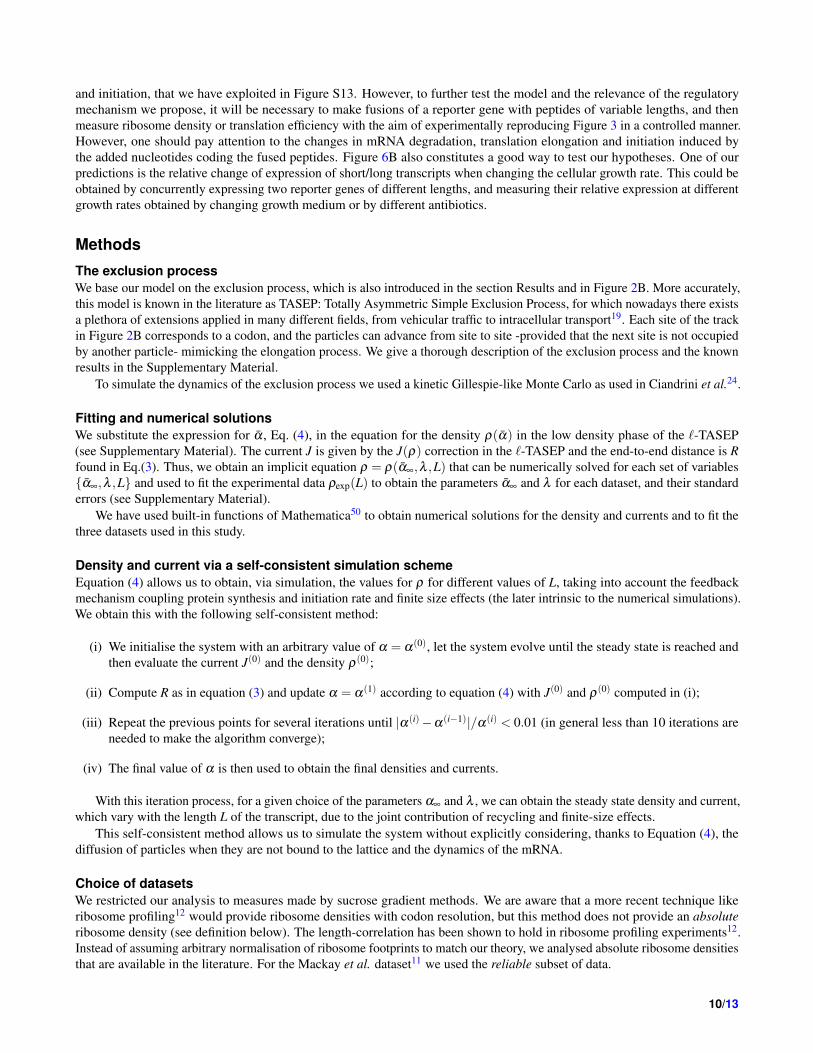
Experimental density-length dependence emerges from initiation enhanced effectsWe then compare the outcome of the model to experimental measurements of ribosome densities. The result of this analysis isshown in Figure 3: the predicted ribosome density is quantitatively comparable to the experimental quantification, and ourmechanistic model based on basic physical principles is able to capture the length dependence of the ribosome load. Our theory
102 103
10-3
10-2
10-1
fitsimulationsS.cerevisiae
102 103
10-3
10-2
10-1
ribos
ome
dens
ity ρ
fitsimulationsS.cerevisiae
102 103
CDS length L [codons]
10-3
10-2
10-1
α∞ =0.00347, λ=35.78 nm
α∞ =0.00189, λ=40.01 nm
α∞ =0.00036, λ=55.11 nm
A
B
C
fitsimulationsHEK293T
Figure 3. Comparison between theory and experimental ribosome densities in yeast (A-B)10, 11 and human embryonic kidneycells (C)15. The symbols and datasets correspond to the ones of Figure (1). The grey lines represent the best fit of the model(the parameter values are written in each panel), while the shadow areas correspond to the regions spanned within the margin oferror of the estimated α∞. Orange circles are the outcome of stochastic simulations used to test the numerical solution of theequation using the parameters obtained from the best fit.
5/13

can therefore explain the observed length dependence of the translational properties.We fit the expression of ρ(α) (continuous lines in Figure 3) and obtain the two parameters α∞ and λ for three available
datasets (two yeast datasets10, 11 and a human embryonic kidney cells dataset15), then check the accuracy of the solution withthe stochastic simulation scheme developed as explained in the Material and Methods section. Taking the standard errorsof the parameter estimation there is no significant deviation between the data and the fitted model(details can be found inthe Materials and Methods). However, for the last set, there is a stronger dependence of the solution on the parameter α∞:shaded regions in Figure 3 represent the solution considering the standard error of this parameter. This could explain the slightdeviation between theory and experimental data for large mRNAs. We also emphasise that the parameter α∞, depending on theglobal availability of ribosomes, is supposed to be the most affected by experimental variations (for instance by growth ratedependence or cell cycle stage). The estimation of α∞ is more accurate when we take into account the diffusion of the twosubunits (see Supplementary Material).
Our simulations also allow us to extract the amount of ribosomes bound to a transcript, from which we can extract themonosome:polysome ratio, which is also subject to length-effects (see Supplementary Material). By increasing the CDSlength we observe a reduction of the monosome:polysome ratio following a power-law like behaviour. A recent work34 hasidentified, by merging polysome and ribosome profiling techniques, the amount of active monosomes, i.e. mRNAs with onlyone ribosome elongating the protein. Consistent with our findings, the monosome:polysome ratio also shows signs of a markedanti-correlation with the mRNA length.
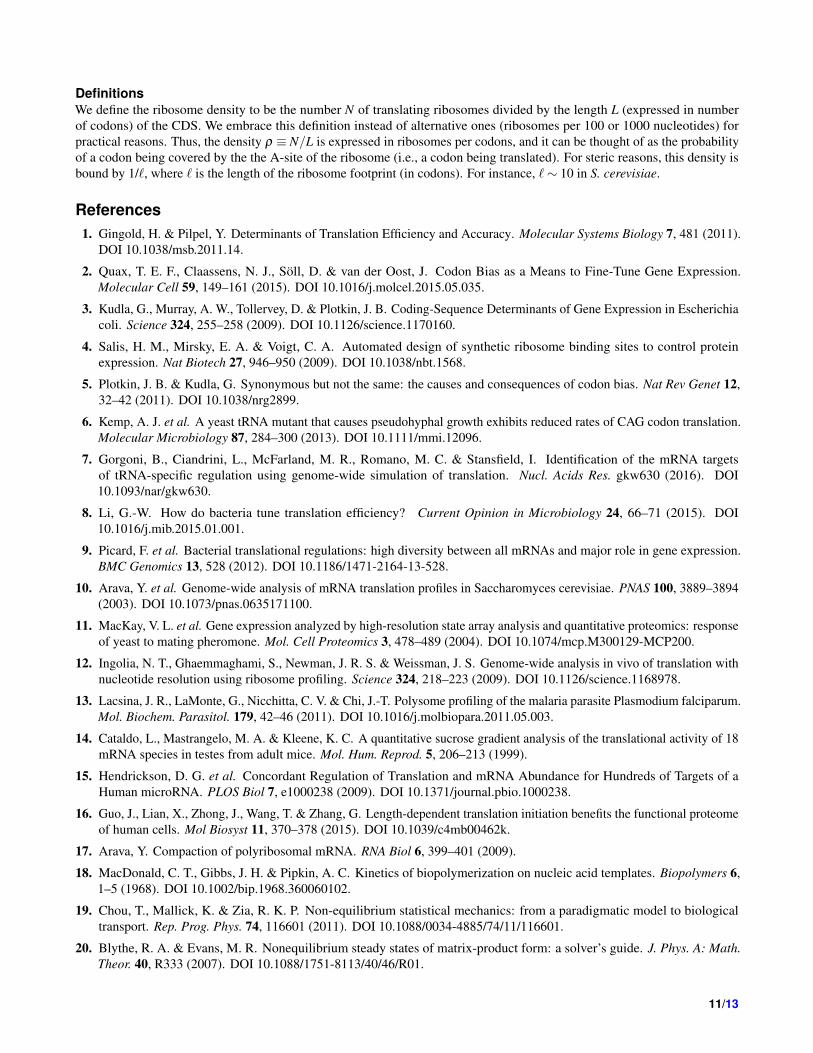
Ribosome drop-off cannot alone be responsible for the density-length dependenceIn this section we study the consequences of ribosome drop-off35, 36, thus far neglected in our model, on the observed density-length dependence. In order to do that, we performed simulations including ribosome drop-off at a rate δ = 10−3 s−1. This isjustified by the estimated drop-off rates of the order of 10−4/codon35, 36, and by the codon elongation rates we considered inthis paper of the order of 10 codons s−1. Figure 4 shows that the simulations of the process with drop-off (full lines) do notlargely differ from the model without drop-off (dashed lines), and the deviations starts to become relevant for large sequences(order 104 codons). For such lengths the extended model is actually reproducing the experimental behaviour even better thanthe model without drop-off.
only
Figure 4. Model with ribosome drop-off. Green lines correspond to the Arava dataset10, while red ones correspond to theMackay dataset11 Symbols of experimental points in yeast correspond to the ones of Figure 1, while dashed lines represent thesolutions of the model described in the previous section with the same parameters used in panels A and B of Figure 3. Thecontinuous lines are the outcome of simulations of our model including ribosome drop-off at a rate of 10−3 s−1, and the greyline shows the outcome of the simulations with drop-off only.
To further exclude the possibility that the length dependence rises from ribosome prematurely leaving the transcript,we simulated ribosome drop-off occurring during the translation process without the feedback mechanism that we propose(basically, we simulated a standard TASEP with particle detachment rate δ ). This is represented by the grey line in Figure 4. Wewere not able to obtain any length dependence for biologically relevant values of the drop-off rate (see Supplementary FigureS10), and we can therefore conclude that the behaviour observed in Figure 1 cannot originate by ribosomal drop-off alone.
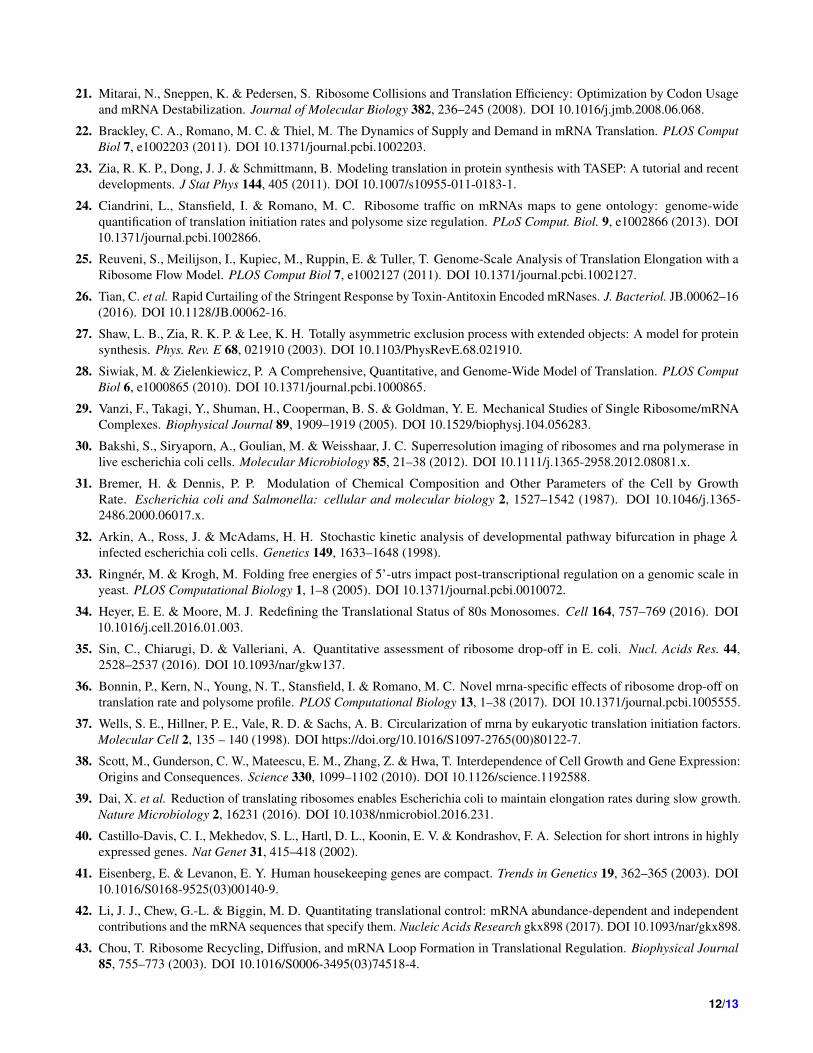
mRNA circularisation does not change the phenomenology of the modelThe 5’ and 3’ end of eukaryotic mRNAs interact with each other via protein-protein interaction, for instance between thePoly(A)-binding protein PAPB and the initiation factor eIF4F bound at the 5’ cap; this coupling is believed to induce the
6/13
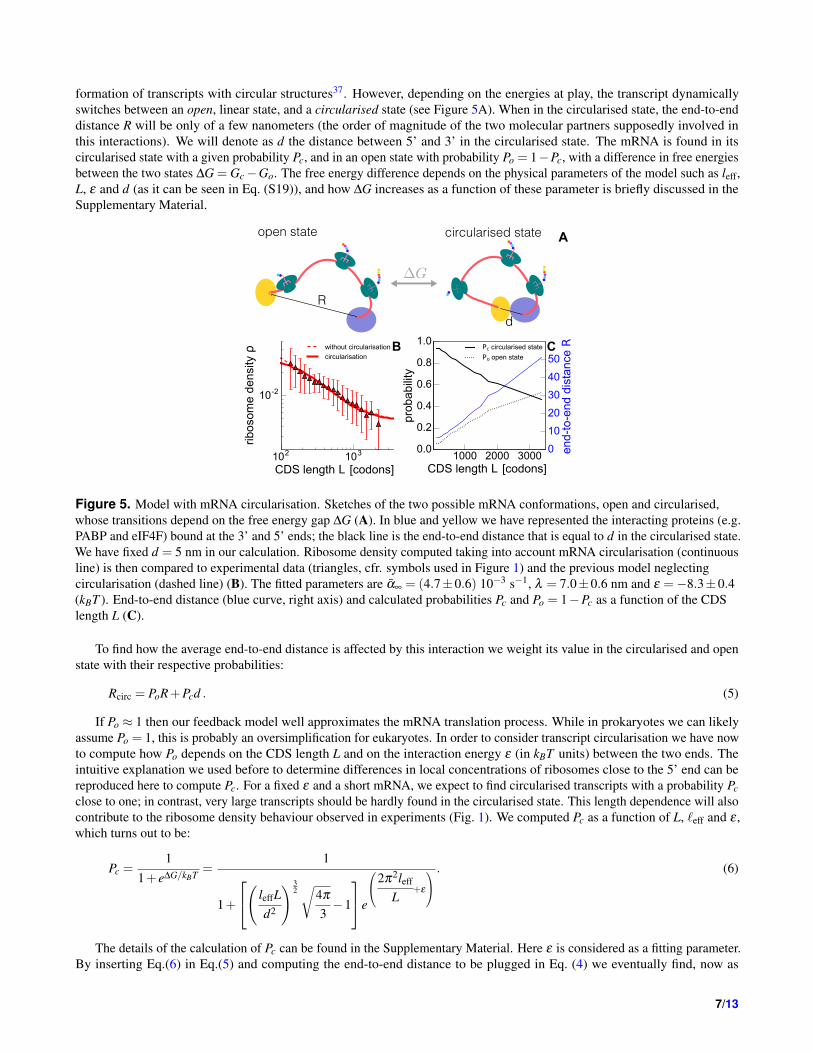
formation of transcripts with circular structures37. However, depending on the energies at play, the transcript dynamicallyswitches between an open, linear state, and a circularised state (see Figure 5A). When in the circularised state, the end-to-enddistance R will be only of a few nanometers (the order of magnitude of the two molecular partners supposedly involved inthis interactions). We will denote as d the distance between 5’ and 3’ in the circularised state. The mRNA is found in itscircularised state with a given probability Pc, and in an open state with probability Po = 1−Pc, with a difference in free energiesbetween the two states ∆G = Gc−Go. The free energy difference depends on the physical parameters of the model such as leff,L, ε and d (as it can be seen in Eq. (S19)), and how ∆G increases as a function of these parameter is briefly discussed in theSupplementary Material.
R
d
open state circularised state A
102 103
CDS length L [codons]
10-2
ribos
ome
dens
ity ρ without circularisation
circularisation
1000 2000 3000CDS length L [codons]
0.0
0.2
0.4
0.6
0.8
1.0
prob
abili
ty
Pc circularised state
Po open state
0
10
20
30
40
50
end-
to-e
nd d
ista
nce RB C
Figure 5. Model with mRNA circularisation. Sketches of the two possible mRNA conformations, open and circularised,whose transitions depend on the free energy gap ∆G (A). In blue and yellow we have represented the interacting proteins (e.g.PABP and eIF4F) bound at the 3’ and 5’ ends; the black line is the end-to-end distance that is equal to d in the circularised state.We have fixed d = 5 nm in our calculation. Ribosome density computed taking into account mRNA circularisation (continuousline) is then compared to experimental data (triangles, cfr. symbols used in Figure 1) and the previous model neglectingcircularisation (dashed line) (B). The fitted parameters are α∞ = (4.7±0.6) 10−3 s−1, λ = 7.0±0.6 nm and ε =−8.3±0.4(kBT ). End-to-end distance (blue curve, right axis) and calculated probabilities Pc and Po = 1−Pc as a function of the CDSlength L (C).
To find how the average end-to-end distance is affected by this interaction we weight its value in the circularised and openstate with their respective probabilities:
Rcirc = PoR+Pcd . (5)
If Po ≈ 1 then our feedback model well approximates the mRNA translation process. While in prokaryotes we can likelyassume Po = 1, this is probably an oversimplification for eukaryotes. In order to consider transcript circularisation we have nowto compute how Po depends on the CDS length L and on the interaction energy ε (in kBT units) between the two ends. Theintuitive explanation we used before to determine differences in local concentrations of ribosomes close to the 5’ end can bereproduced here to compute Pc. For a fixed ε and a short mRNA, we expect to find circularised transcripts with a probability Pcclose to one; in contrast, very large transcripts should be hardly found in the circularised state. This length dependence will alsocontribute to the ribosome density behaviour observed in experiments (Fig. 1). We computed Pc as a function of L, `eff and ε ,which turns out to be:
Pc =1
1+ e∆G/kBT =1
1+
( leffLd2
) 32√
4π
3−1
e
2π2leff
L+ε
. (6)
The details of the calculation of Pc can be found in the Supplementary Material. Here ε is considered as a fitting parameter.By inserting Eq.(6) in Eq.(5) and computing the end-to-end distance to be plugged in Eq. (4) we eventually find, now as
7/13
a function of α∞, λ and ε , how the initiation rate is affected by the concentration increase of ribosomes in the 5’ reactionvolume with also considering transcript circularisation. We have then fitted ρ(α) to the dataset we have previously used, andthe outcome is shown in Figure 5B (fitting values and other datasets can be found in the Supplementary Material). We didnot find a significative difference from the best fit of the simpler model previously introduced (dashed line in Figure 5B). InFigure 5C we show how the probabilities of finding a circularised or open mRNA depend on the transcript length, together withthe end-to-end distance R. The results agree with our intuitive explanation.
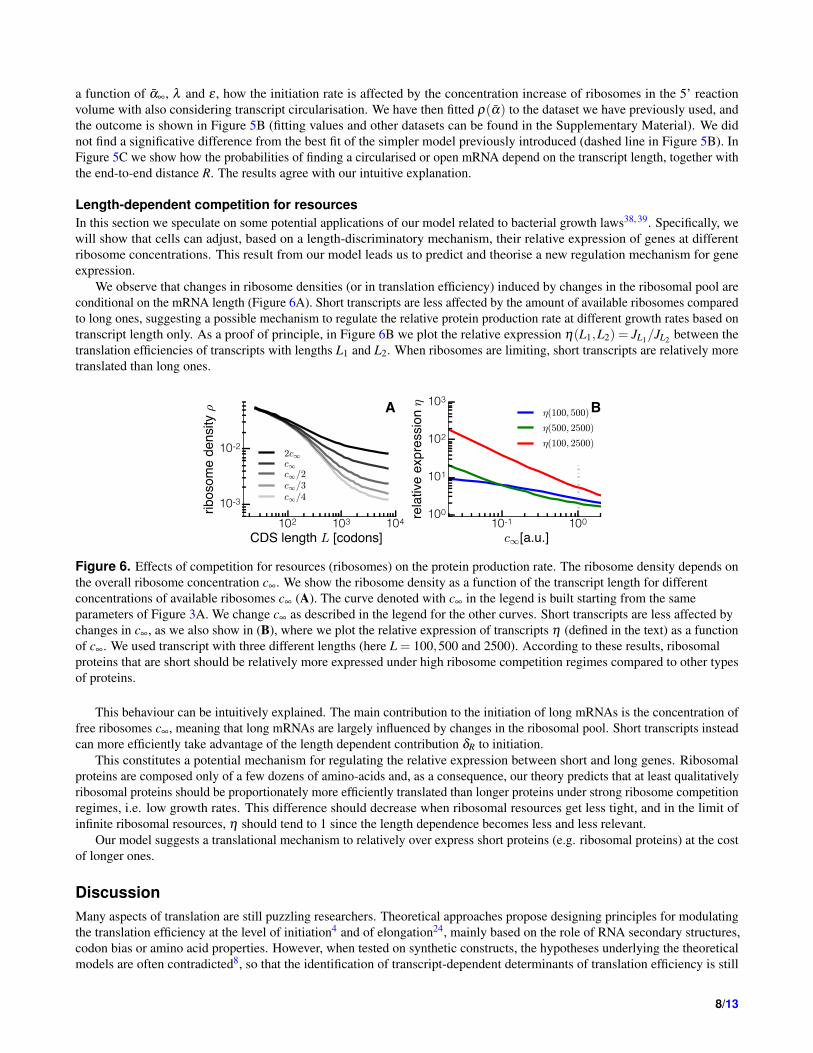
Length-dependent competition for resourcesIn this section we speculate on some potential applications of our model related to bacterial growth laws38, 39. Specifically, wewill show that cells can adjust, based on a length-discriminatory mechanism, their relative expression of genes at differentribosome concentrations. This result from our model leads us to predict and theorise a new regulation mechanism for geneexpression.
We observe that changes in ribosome densities (or in translation efficiency) induced by changes in the ribosomal pool areconditional on the mRNA length (Figure 6A). Short transcripts are less affected by the amount of available ribosomes comparedto long ones, suggesting a possible mechanism to regulate the relative protein production rate at different growth rates based ontranscript length only. As a proof of principle, in Figure 6B we plot the relative expression η(L1,L2) = JL1/JL2 between thetranslation efficiencies of transcripts with lengths L1 and L2. When ribosomes are limiting, short transcripts are relatively moretranslated than long ones.
102 103 104
CDS length L [codons]
10-3
10-2
ribos
ome
dens
ity ρ A
2c∞c∞c∞/2c∞/3c∞/4
10-1 100
c∞[a.u.]100
101
102
103
relat
ive e
xpre
ssion
η Bη(100, 500)
η(500, 2500)
η(100, 2500)
Figure 6. Effects of competition for resources (ribosomes) on the protein production rate. The ribosome density depends onthe overall ribosome concentration c∞. We show the ribosome density as a function of the transcript length for differentconcentrations of available ribosomes c∞ (A). The curve denoted with c∞ in the legend is built starting from the sameparameters of Figure 3A. We change c∞ as described in the legend for the other curves. Short transcripts are less affected bychanges in c∞, as we also show in (B), where we plot the relative expression of transcripts η (defined in the text) as a functionof c∞. We used transcript with three different lengths (here L = 100,500 and 2500). According to these results, ribosomalproteins that are short should be relatively more expressed under high ribosome competition regimes compared to other typesof proteins.
This behaviour can be intuitively explained. The main contribution to the initiation of long mRNAs is the concentration offree ribosomes c∞, meaning that long mRNAs are largely influenced by changes in the ribosomal pool. Short transcripts insteadcan more efficiently take advantage of the length dependent contribution δR to initiation.
This constitutes a potential mechanism for regulating the relative expression between short and long genes. Ribosomalproteins are composed only of a few dozens of amino-acids and, as a consequence, our theory predicts that at least qualitativelyribosomal proteins should be proportionately more efficiently translated than longer proteins under strong ribosome competitionregimes, i.e. low growth rates. This difference should decrease when ribosomal resources get less tight, and in the limit ofinfinite ribosomal resources, η should tend to 1 since the length dependence becomes less and less relevant.
Our model suggests a translational mechanism to relatively over express short proteins (e.g. ribosomal proteins) at the costof longer ones.
DiscussionMany aspects of translation are still puzzling researchers. Theoretical approaches propose designing principles for modulatingthe translation efficiency at the level of initiation4 and of elongation24, mainly based on the role of RNA secondary structures,codon bias or amino acid properties. However, when tested on synthetic constructs, the hypotheses underlying the theoreticalmodels are often contradicted8, so that the identification of transcript-dependent determinants of translation efficiency is still
8/13
debated in the literature. In this work we have identified and studied another factor modulating the translation efficiency: thelength of the transcript.
According to our results, the proximity of the 3’ end to the ribosomal recruitment site of the mRNA could induce a feedbackin the translation process that would favour the translation of short transcripts over long ones, as has been shown by experimentsin the last decades. We connected the emergence of the ribosome density-mRNA length dependence shown in Figure 1 to amechanistic model built on basic physical principles and on the properties of the translation process. Our theory then establishesa link between densities and mRNA lengths and explains experimental data with an excellent agreement without invoking anevolutionary selection of genes based on their length. As a matter of fact, a selection process towards short efficient genesto improve cellular fitness could also be conjectured40, 41. Without direct experimental observation we cannot rule out thishypothesis, although this would not explain the same behaviour observed for different organisms (experimental data in Figure 1seems to collapse to a unique universal curve). Moreover, the poor correlation between free energy of secondary structuresat the 5’ end of an mRNA and CDS length is a signature that binding sites are not significantly weaker for long genes, as itwould assume an evolutionary argument. Instead our theory predicts, as an outcome, that short genes have larger initiation ratescompared to long ones. A recent publication by Li et al.42 confirms that transcript length is a main determinant of translation.
Experimental results in fact suggest that translation initiation is also dependent on mRNA length10, 17. Since the ribosomerecruitment rate must depend on the local concentration of ribosomal subunits around the 5’UTR, we conjecture that the localconcentration is modulated by the CDS length via a feedback mechanism coupling protein synthesis and initiation rates. Wecan roughly name this process “recycling”, as subunits terminating translation will contribute to the increase of the localconcentration δR and thus be more easily re-used as sketched in Figure 2. This coarse-grained physical model has allowed us toreproduce the scaling behaviour of experimental ribosome densities (Figure 3) and it constitutes, to our understating, the firstquantitative explanation of how translational features are affected by the transcript length. Previous works have studied theeffect of particle recycling43–46 but, with the exception of Chou (2003)43, they do not explicitly compute how the recyclingterm is regulated by the end-to-end distance R.
The compaction of the transcript (here characterised by the end-to-end distance), also depends on its polysome state.Intuitively, an mRNA with many translating ribosomes will be more stretched than an empty mRNA. We captured this feature byintroducing a ribosome density dependence on the end-to-end distance through Eq. (3). We emphasise that this is the simplestchoice for coupling elongation properties and the three-dimensional conformation of the mRNA, and one could introduce morecomplicated relationships linking end-to-end distance, ribosome density and elongation rate; here we wanted to show that, as aproof of principle, by a feedback mechanism enhancing initiation we can reproduce experimental data very well.
We have also studied how the results change by explicitly considering the diffusion of the two ribosomal subunits, andwe found no significant change (see Supplementary Material). To make the model more realistic we considered two furtherextensions of the model. We considered (i) ribosome drop-off and (ii) mRNA circularisation. The former brought animprovement in the comparison between data and theory for large transcripts only (see Figure 4), while the inclusion of thelatter did not lead to a particular phenomenological change of the model’s outcomes (Figure 5). This suggests that ribosomerecycling, as considered in the basic model, is the fundamental element originating the length-dependence translation.
We have then speculated on how the length could be exploited to create differences in the relative expression of genes atdifferent growth rates, here used as measure of the free ribosomes abundances. When resources are constrained, i.e. whenthe amount of free ribosomes c∞ is small, competition for resources might become relevant47–49 and our theory predicts thatthe length-dependent term of the initiation rate dominates the process. In other words, when ribosomes are strongly limiting,ribosome recruitment is mainly due to recycled ribosomes, meaning that short transcripts can better capitalise the resources.This mechanisms could also be a way to translationally favour the production of ribosomal proteins (which are short) in ascenario of deficiency of ribosomes. In order to formulate this hypothesis, we neglect known mechanisms responsible forribosome biogenesis, a complex process that is beyond the scope of our work. Our conjecture has then to be interpreted in theperspective of ribosomal concentrations fixed by a certain amount of ribosome production (established, for instance, by therichness of the growth medium): for a given concentration of ribosomes we make strong predictions on how the ribosomal poolshould be partitioned among the different transcripts with just a length-discrimination mechanism.
The model could be further extended to consider translation of bacterial operons: in this case, in fact, one transcript iscomposed of different sinks (ribosome binding sites) and sources (stop codons) of ribosomes, while here we have discussedthe case of a transcript translating a single gene (with one ribosome binding site and one stop codons). Having an operontranslating different genes will increase the complexity of the feedback term, and it could in principle create counter-intuitivephenomenologies.
Our findings are compared to experimental ribosomal densities, and our framework can quantitatively reproduce themeasurements. We have used our model to estimate the protein production rates of synonymous genes, and the method wassuccessful (see Figure S13). In this work we have used our model to predict the ribosome-length dependence, i.e. we haveemphasised the dependence of Eq. (4) on L, but our theory predicts that there is a feedback between elongation (codon usage)
9/13
and initiation, that we have exploited in Figure S13. However, to further test the model and the relevance of the regulatorymechanism we propose, it will be necessary to make fusions of a reporter gene with peptides of variable lengths, and thenmeasure ribosome density or translation efficiency with the aim of experimentally reproducing Figure 3 in a controlled manner.However, one should pay attention to the changes in mRNA degradation, translation elongation and initiation induced bythe added nucleotides coding the fused peptides. Figure 6B also constitutes a good way to test our hypotheses. One of ourpredictions is the relative change of expression of short/long transcripts when changing the cellular growth rate. This could beobtained by concurrently expressing two reporter genes of different lengths, and measuring their relative expression at differentgrowth rates obtained by changing growth medium or by different antibiotics.
Methods
The exclusion processWe base our model on the exclusion process, which is also introduced in the section Results and in Figure 2B. More accurately,this model is known in the literature as TASEP: Totally Asymmetric Simple Exclusion Process, for which nowadays there existsa plethora of extensions applied in many different fields, from vehicular traffic to intracellular transport19. Each site of the trackin Figure 2B corresponds to a codon, and the particles can advance from site to site -provided that the next site is not occupiedby another particle- mimicking the elongation process. We give a thorough description of the exclusion process and the knownresults in the Supplementary Material.
To simulate the dynamics of the exclusion process we used a kinetic Gillespie-like Monte Carlo as used in Ciandrini et al.24.
Fitting and numerical solutionsWe substitute the expression for α , Eq. (4), in the equation for the density ρ(α) in the low density phase of the `-TASEP(see Supplementary Material). The current J is given by the J(ρ) correction in the `-TASEP and the end-to-end distance is Rfound in Eq.(3). Thus, we obtain an implicit equation ρ = ρ(α∞,λ ,L) that can be numerically solved for each set of variables{α∞,λ ,L} and used to fit the experimental data ρexp(L) to obtain the parameters α∞ and λ for each dataset, and their standarderrors (see Supplementary Material).
We have used built-in functions of Mathematica50 to obtain numerical solutions for the density and currents and to fit thethree datasets used in this study.
Density and current via a self-consistent simulation schemeEquation (4) allows us to obtain, via simulation, the values for ρ for different values of L, taking into account the feedbackmechanism coupling protein synthesis and initiation rate and finite size effects (the later intrinsic to the numerical simulations).We obtain this with the following self-consistent method:
(i) We initialise the system with an arbitrary value of α = α(0), let the system evolve until the steady state is reached andthen evaluate the current J(0) and the density ρ(0);
(ii) Compute R as in equation (3) and update α = α(1) according to equation (4) with J(0) and ρ(0) computed in (i);
(iii) Repeat the previous points for several iterations until |α(i)−α(i−1)|/α(i) < 0.01 (in general less than 10 iterations areneeded to make the algorithm converge);
(iv) The final value of α is then used to obtain the final densities and currents.
With this iteration process, for a given choice of the parameters α∞ and λ , we can obtain the steady state density and current,which vary with the length L of the transcript, due to the joint contribution of recycling and finite-size effects.
This self-consistent method allows us to simulate the system without explicitly considering, thanks to Equation (4), thediffusion of particles when they are not bound to the lattice and the dynamics of the mRNA.
Choice of datasetsWe restricted our analysis to measures made by sucrose gradient methods. We are aware that a more recent technique likeribosome profiling12 would provide ribosome densities with codon resolution, but this method does not provide an absoluteribosome density (see definition below). The length-correlation has been shown to hold in ribosome profiling experiments12.Instead of assuming arbitrary normalisation of ribosome footprints to match our theory, we analysed absolute ribosome densitiesthat are available in the literature. For the Mackay et al. dataset11 we used the reliable subset of data.
10/13
DefinitionsWe define the ribosome density to be the number N of translating ribosomes divided by the length L (expressed in numberof codons) of the CDS. We embrace this definition instead of alternative ones (ribosomes per 100 or 1000 nucleotides) forpractical reasons. Thus, the density ρ ≡ N/L is expressed in ribosomes per codons, and it can be thought of as the probabilityof a codon being covered by the the A-site of the ribosome (i.e., a codon being translated). For steric reasons, this density isbound by 1/`, where ` is the length of the ribosome footprint (in codons). For instance, `∼ 10 in S. cerevisiae.
References1. Gingold, H. & Pilpel, Y. Determinants of Translation Efficiency and Accuracy. Molecular Systems Biology 7, 481 (2011).
DOI 10.1038/msb.2011.14.
2. Quax, T. E. F., Claassens, N. J., Soll, D. & van der Oost, J. Codon Bias as a Means to Fine-Tune Gene Expression.Molecular Cell 59, 149–161 (2015). DOI 10.1016/j.molcel.2015.05.035.
3. Kudla, G., Murray, A. W., Tollervey, D. & Plotkin, J. B. Coding-Sequence Determinants of Gene Expression in Escherichiacoli. Science 324, 255–258 (2009). DOI 10.1126/science.1170160.
4. Salis, H. M., Mirsky, E. A. & Voigt, C. A. Automated design of synthetic ribosome binding sites to control proteinexpression. Nat Biotech 27, 946–950 (2009). DOI 10.1038/nbt.1568.
5. Plotkin, J. B. & Kudla, G. Synonymous but not the same: the causes and consequences of codon bias. Nat Rev Genet 12,32–42 (2011). DOI 10.1038/nrg2899.
6. Kemp, A. J. et al. A yeast tRNA mutant that causes pseudohyphal growth exhibits reduced rates of CAG codon translation.Molecular Microbiology 87, 284–300 (2013). DOI 10.1111/mmi.12096.
7. Gorgoni, B., Ciandrini, L., McFarland, M. R., Romano, M. C. & Stansfield, I. Identification of the mRNA targetsof tRNA-specific regulation using genome-wide simulation of translation. Nucl. Acids Res. gkw630 (2016). DOI10.1093/nar/gkw630.
8. Li, G.-W. How do bacteria tune translation efficiency? Current Opinion in Microbiology 24, 66–71 (2015). DOI10.1016/j.mib.2015.01.001.
9. Picard, F. et al. Bacterial translational regulations: high diversity between all mRNAs and major role in gene expression.BMC Genomics 13, 528 (2012). DOI 10.1186/1471-2164-13-528.
10. Arava, Y. et al. Genome-wide analysis of mRNA translation profiles in Saccharomyces cerevisiae. PNAS 100, 3889–3894(2003). DOI 10.1073/pnas.0635171100.
11. MacKay, V. L. et al. Gene expression analyzed by high-resolution state array analysis and quantitative proteomics: responseof yeast to mating pheromone. Mol. Cell Proteomics 3, 478–489 (2004). DOI 10.1074/mcp.M300129-MCP200.
12. Ingolia, N. T., Ghaemmaghami, S., Newman, J. R. S. & Weissman, J. S. Genome-wide analysis in vivo of translation withnucleotide resolution using ribosome profiling. Science 324, 218–223 (2009). DOI 10.1126/science.1168978.
13. Lacsina, J. R., LaMonte, G., Nicchitta, C. V. & Chi, J.-T. Polysome profiling of the malaria parasite Plasmodium falciparum.Mol. Biochem. Parasitol. 179, 42–46 (2011). DOI 10.1016/j.molbiopara.2011.05.003.
14. Cataldo, L., Mastrangelo, M. A. & Kleene, K. C. A quantitative sucrose gradient analysis of the translational activity of 18mRNA species in testes from adult mice. Mol. Hum. Reprod. 5, 206–213 (1999).
15. Hendrickson, D. G. et al. Concordant Regulation of Translation and mRNA Abundance for Hundreds of Targets of aHuman microRNA. PLOS Biol 7, e1000238 (2009). DOI 10.1371/journal.pbio.1000238.
16. Guo, J., Lian, X., Zhong, J., Wang, T. & Zhang, G. Length-dependent translation initiation benefits the functional proteomeof human cells. Mol Biosyst 11, 370–378 (2015). DOI 10.1039/c4mb00462k.
17. Arava, Y. Compaction of polyribosomal mRNA. RNA Biol 6, 399–401 (2009).
18. MacDonald, C. T., Gibbs, J. H. & Pipkin, A. C. Kinetics of biopolymerization on nucleic acid templates. Biopolymers 6,1–5 (1968). DOI 10.1002/bip.1968.360060102.
19. Chou, T., Mallick, K. & Zia, R. K. P. Non-equilibrium statistical mechanics: from a paradigmatic model to biologicaltransport. Rep. Prog. Phys. 74, 116601 (2011). DOI 10.1088/0034-4885/74/11/116601.
20. Blythe, R. A. & Evans, M. R. Nonequilibrium steady states of matrix-product form: a solver’s guide. J. Phys. A: Math.Theor. 40, R333 (2007). DOI 10.1088/1751-8113/40/46/R01.
11/13
21. Mitarai, N., Sneppen, K. & Pedersen, S. Ribosome Collisions and Translation Efficiency: Optimization by Codon Usageand mRNA Destabilization. Journal of Molecular Biology 382, 236–245 (2008). DOI 10.1016/j.jmb.2008.06.068.
22. Brackley, C. A., Romano, M. C. & Thiel, M. The Dynamics of Supply and Demand in mRNA Translation. PLOS ComputBiol 7, e1002203 (2011). DOI 10.1371/journal.pcbi.1002203.
23. Zia, R. K. P., Dong, J. J. & Schmittmann, B. Modeling translation in protein synthesis with TASEP: A tutorial and recentdevelopments. J Stat Phys 144, 405 (2011). DOI 10.1007/s10955-011-0183-1.
24. Ciandrini, L., Stansfield, I. & Romano, M. C. Ribosome traffic on mRNAs maps to gene ontology: genome-widequantification of translation initiation rates and polysome size regulation. PLoS Comput. Biol. 9, e1002866 (2013). DOI10.1371/journal.pcbi.1002866.
25. Reuveni, S., Meilijson, I., Kupiec, M., Ruppin, E. & Tuller, T. Genome-Scale Analysis of Translation Elongation with aRibosome Flow Model. PLOS Comput Biol 7, e1002127 (2011). DOI 10.1371/journal.pcbi.1002127.
26. Tian, C. et al. Rapid Curtailing of the Stringent Response by Toxin-Antitoxin Encoded mRNases. J. Bacteriol. JB.00062–16(2016). DOI 10.1128/JB.00062-16.
27. Shaw, L. B., Zia, R. K. P. & Lee, K. H. Totally asymmetric exclusion process with extended objects: A model for proteinsynthesis. Phys. Rev. E 68, 021910 (2003). DOI 10.1103/PhysRevE.68.021910.
28. Siwiak, M. & Zielenkiewicz, P. A Comprehensive, Quantitative, and Genome-Wide Model of Translation. PLOS ComputBiol 6, e1000865 (2010). DOI 10.1371/journal.pcbi.1000865.
29. Vanzi, F., Takagi, Y., Shuman, H., Cooperman, B. S. & Goldman, Y. E. Mechanical Studies of Single Ribosome/mRNAComplexes. Biophysical Journal 89, 1909–1919 (2005). DOI 10.1529/biophysj.104.056283.
30. Bakshi, S., Siryaporn, A., Goulian, M. & Weisshaar, J. C. Superresolution imaging of ribosomes and rna polymerase inlive escherichia coli cells. Molecular Microbiology 85, 21–38 (2012). DOI 10.1111/j.1365-2958.2012.08081.x.
31. Bremer, H. & Dennis, P. P. Modulation of Chemical Composition and Other Parameters of the Cell by GrowthRate. Escherichia coli and Salmonella: cellular and molecular biology 2, 1527–1542 (1987). DOI 10.1046/j.1365-2486.2000.06017.x.
32. Arkin, A., Ross, J. & McAdams, H. H. Stochastic kinetic analysis of developmental pathway bifurcation in phage λ
infected escherichia coli cells. Genetics 149, 1633–1648 (1998).
33. Ringner, M. & Krogh, M. Folding free energies of 5’-utrs impact post-transcriptional regulation on a genomic scale inyeast. PLOS Computational Biology 1, 1–8 (2005). DOI 10.1371/journal.pcbi.0010072.
34. Heyer, E. E. & Moore, M. J. Redefining the Translational Status of 80s Monosomes. Cell 164, 757–769 (2016). DOI10.1016/j.cell.2016.01.003.
35. Sin, C., Chiarugi, D. & Valleriani, A. Quantitative assessment of ribosome drop-off in E. coli. Nucl. Acids Res. 44,2528–2537 (2016). DOI 10.1093/nar/gkw137.
36. Bonnin, P., Kern, N., Young, N. T., Stansfield, I. & Romano, M. C. Novel mrna-specific effects of ribosome drop-off ontranslation rate and polysome profile. PLOS Computational Biology 13, 1–38 (2017). DOI 10.1371/journal.pcbi.1005555.
37. Wells, S. E., Hillner, P. E., Vale, R. D. & Sachs, A. B. Circularization of mrna by eukaryotic translation initiation factors.Molecular Cell 2, 135 – 140 (1998). DOI https://doi.org/10.1016/S1097-2765(00)80122-7.
38. Scott, M., Gunderson, C. W., Mateescu, E. M., Zhang, Z. & Hwa, T. Interdependence of Cell Growth and Gene Expression:Origins and Consequences. Science 330, 1099–1102 (2010). DOI 10.1126/science.1192588.
39. Dai, X. et al. Reduction of translating ribosomes enables Escherichia coli to maintain elongation rates during slow growth.Nature Microbiology 2, 16231 (2016). DOI 10.1038/nmicrobiol.2016.231.
40. Castillo-Davis, C. I., Mekhedov, S. L., Hartl, D. L., Koonin, E. V. & Kondrashov, F. A. Selection for short introns in highlyexpressed genes. Nat Genet 31, 415–418 (2002).
41. Eisenberg, E. & Levanon, E. Y. Human housekeeping genes are compact. Trends in Genetics 19, 362–365 (2003). DOI10.1016/S0168-9525(03)00140-9.
42. Li, J. J., Chew, G.-L. & Biggin, M. D. Quantitating translational control: mRNA abundance-dependent and independentcontributions and the mRNA sequences that specify them. Nucleic Acids Research gkx898 (2017). DOI 10.1093/nar/gkx898.
43. Chou, T. Ribosome Recycling, Diffusion, and mRNA Loop Formation in Translational Regulation. Biophysical Journal85, 755–773 (2003). DOI 10.1016/S0006-3495(03)74518-4.
12/13
44. Sharma, A. K. & Chowdhury, D. Stochastic theory of protein synthesis and polysome: Ribosome profile on a single mRNAtranscript. Journal of Theoretical Biology 289, 36–46 (2011). DOI 10.1016/j.jtbi.2011.08.023.
45. Margaliot, M. & Tuller, T. Ribosome flow model with positive feedback. Journal of the Royal Society Interface 10,20130267 (2013). DOI 10.1098/rsif.2013.0267.
46. Marshall, E., Stansfield, I. & Romano, M. C. Ribosome recycling induces optimal translation rate at low ribosomalavailability. J R Soc Interface 11, 20140589 (2014). DOI 10.1098/rsif.2014.0589.
47. Greulich, P., Ciandrini, L., Allen, R. J. & Romano, M. C. Mixed population of competing totally asymmetric simple exclu-sion processes with a shared reservoir of particles. Phys. Rev. E 85, 011142 (2012). DOI 10.1103/PhysRevE.85.011142.
48. Shah, P., Ding, Y., Niemczyk, M., Kudla, G. & Plotkin, J. B. Rate-limiting steps in yeast protein translation. Cell 153,1589–1601 (2013). DOI 10.1016/j.cell.2013.05.049.
49. Raveh, A., Margaliot, M., Sontag, E. D. & Tuller, T. A model for competition for ribosomes in the cell. Journal of theRoyal Society Interface 13, 20151062 (2016). DOI 10.1098/rsif.2015.1062.
50. Mathematica. Wolfram research, inc. Version 10.2 (2015).
AcknowledgementsThe authors would like to acknowledge the funding provided by the European Union Seventh Framework Programme [FP7/2007-2013] (NICHE; grant agreement 289384) (LDF). LDF also acknowledges the funding provided by the Sao Paulo ResearchFoundation (FAPESP - grant #2015/26989-4). AM was partially funded by the UK Biotechnology and Biological ResearchCouncil (BBSRC), through grant BB/N015711/1. LC would like to acknowledge Maria Carmen Romano, Jean Hausser, MarcoCosentino Lagomarsino, Jean-Charles Walter and Norbert Kern for early discussions on this work, and the CNRS for havinggranted him a “demi-delegation” (2017-18). We would like to dedicate this work in memory of Maxime Clusel and VladimirLorman.
Author contributions statementL.C. and A.M. conceived and discussed the theory, L.C. and L.D.F. performed the simulations and analysed the data, L.C.,L.D.F. and A.M. wrote the manuscript text and supplementary information. All authors reviewed the manuscript.
Additional informationCompeting financial interests. None declared.
13/13