Embed Size (px)
Citation preview

Gene Expression Based Gene Expression Based Tumor Classification Tumor Classification Using Biologically Using Biologically Informed ModelsInformed Models
ISI 2003 Berlin
Claudio Lottaz und Rainer Spang
Computational Diagnostics Group
Max Planck Institute for Molecular Genetics, Berlin
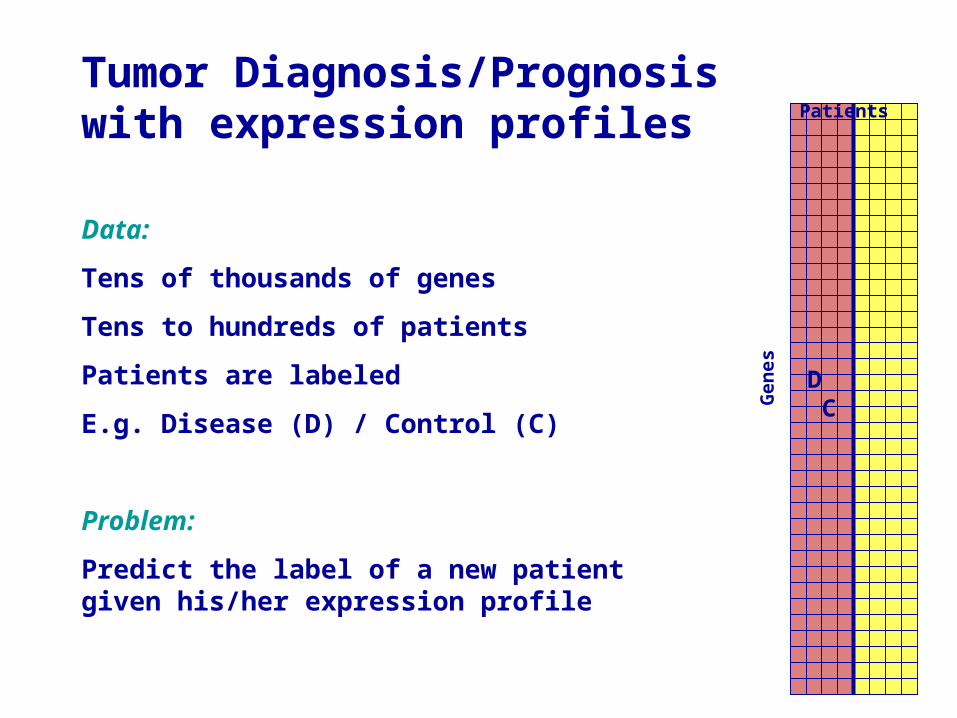
Tumor Diagnosis/Prognosis with expression profiles
Data:
Tens of thousands of genes
Tens to hundreds of patients
Patients are labeled
E.g. Disease (D) / Control (C)
Problem:
Predict the label of a new patient given his/her expression profile
Patients
Gen
es
D C

Statistical Context: Learning TheoryHigh dimensional models overfitting problems
Additional constraints Regularized Multivariate Models
What are these constraints?
-A small maximal number of genes allowed in the model
(Variable Selection, Sparse Models)
- Likelihood penalties,
- Informative priors,
- Large Margins,
Frustrations
• Falsely predicted patients
• Questionable Labels
• Genes that make no sense in the context
• Secondary and tertiary effects are more prominent then causal molecular mechanisms
The patient groups are seen as molecular homogenous groups
Genes are anonymous variables:
x1,…,xn
Implicit assumptions of standard approaches

Our approach:
1. Sub-class finding instead of global class prediction
2. Use of functional annotations of genes
Molecular Symptoms
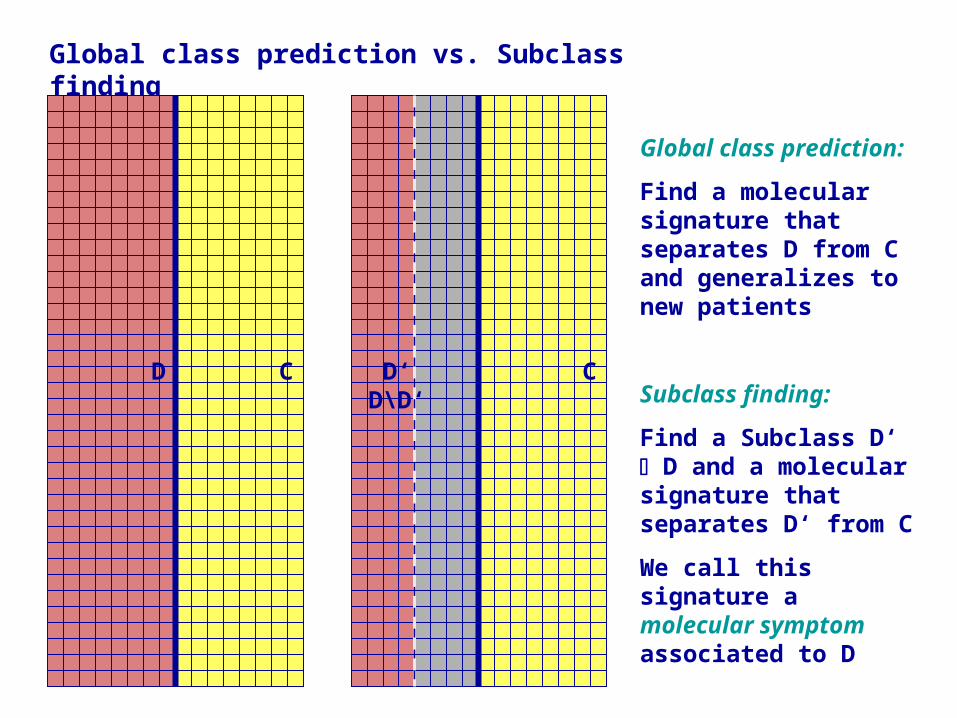
Global class prediction vs. Subclass finding
D
C D‘ D\D‘
C
Global class prediction:
Find a molecular signature that separates D from C and generalizes to new patients
Subclass finding:
Find a Subclass D‘ D and a molecular signature that separates D‘ from C
We call this signature a molecular symptom associated to D

Molecular symptoms
• High specificity and sub-optimal sensitivity
• partially supervised
• Molecular properties that are (almost) unique to the disease group, but do not need to be present in all patients having the disease
• Novel stratification of patients
• Hidden molecular sub-entities
• There are in general many molecular symptoms associated to a disease
• One patient can have several molecular symptoms

Exploiting functional annotations of genes
A posteriori use of functional annotations
A priori use of functional annotations
( suggested here )
Data Functional Annotations
StatisticalAnalysis
Data
Functional Annotations
StatisticalAnalysis

What are we looking for?
C
D‘1
D‘2
D‘3
D‘4 D‘4
DNA Repair
Apoptosis
Cell Proliferation
HOX Genes
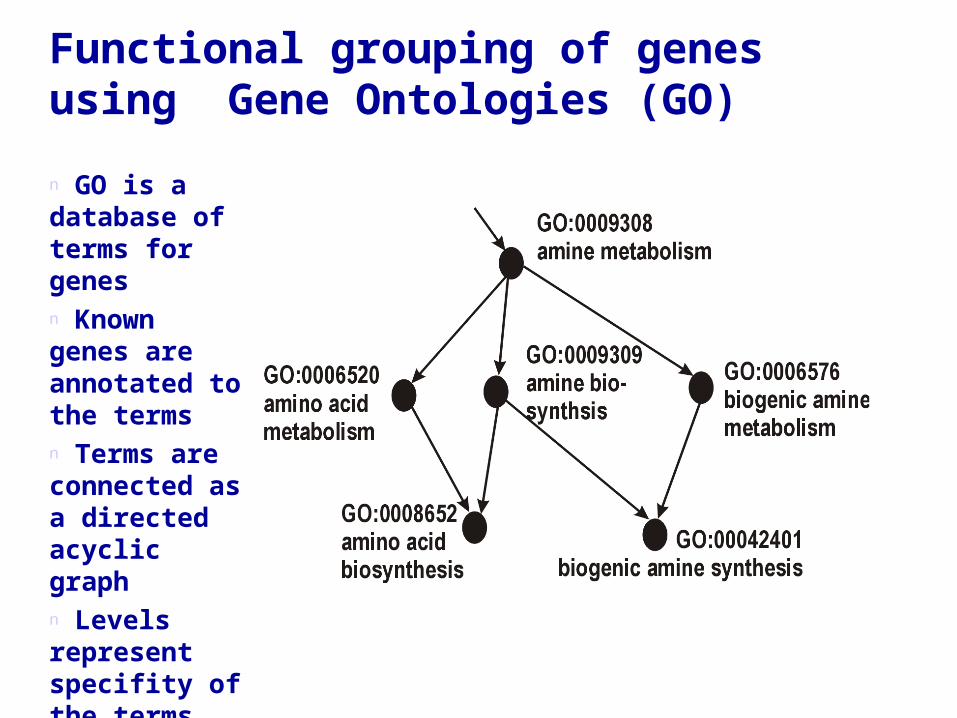
Functional grouping of genes using Gene Ontologies (GO)
n GO is a database of terms for genesn Known genes are annotated to the termsn Terms are connected as a directed acyclic graphn Levels represent specifity of the terms

The whole thing at a glance
GO contains three different sub-ontologies:
–Molecular function–Biological process–Cellular component

The Annotation
Gene 1023
Gene 12975
Gene 22666
Gene 13
Gene 17945
Gene 19999
Gene 311
Gene 314
Gene 22666
Gene 6702
Gene 12744
Gene 22669
Genes are annotated to both leave and inner nodes
Genes can have multiple annotations

Gene 1023
Gene 12975
Gene 22666
Gene 1023
Gene 12975
Gene 22666
Augmented Ontology

Structured Analysis of Microarrays (StAM)
- Claudio Lottaz -
Modular Grid of three components
1. Classification in Leave Nodes
2. Diagnosis Propagation
3. Regularization:
Gene 1023
Gene 12975
Gene 22666
Gene 311
Gene 314
Gene 22666

1. Classification in the leave nodes by Shrunken centroid classification: PAM (Tibshirani et al 2002)
DLDA-like Discrimination
Discriminant function via the distance to the shrunken class centroids d(C), d(D)
Regularization:
Variable selection via centroid shrinkage
Class Probabilities:

2. Propagation of Diagnosis by weighted averages
w1
w2
w3
C1 C3C2
Pa
Weights are proportional to CV-Performance measured by a weighted deviance
The weight is used to enforce high specificity and relaxed sensitivity. Typically: =0.95
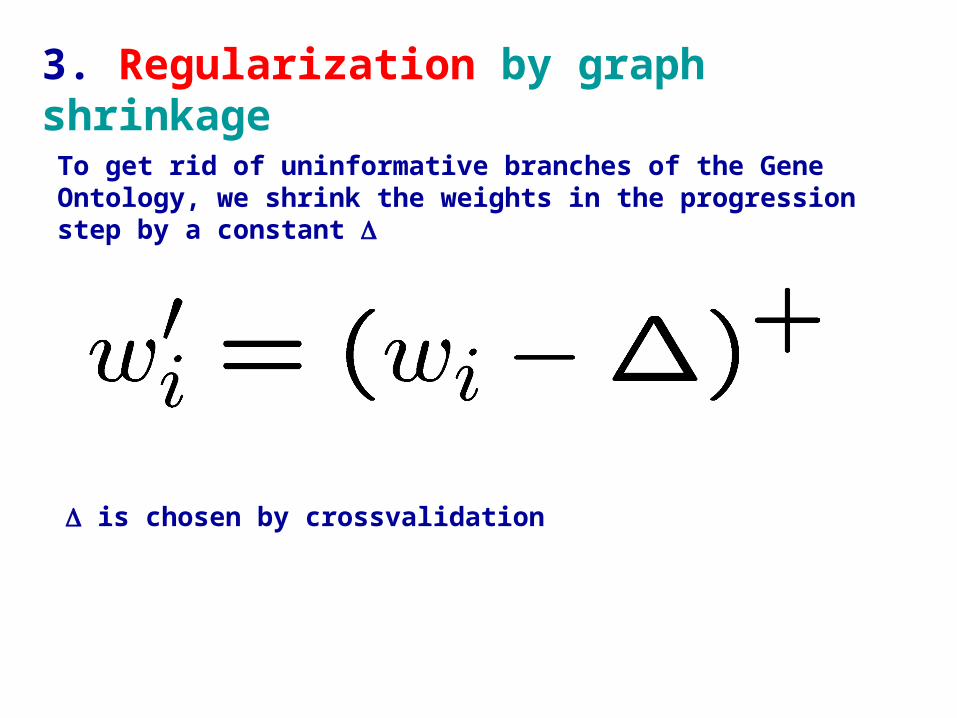
3. Regularization by graph shrinkageTo get rid of uninformative branches of the Gene Ontology, we shrink the weights in the progression step by a constant
is chosen by crossvalidation

Redundancy of a shrunken graph
For two nodes we define the distance:
... which reflects the probability of an inconsistent diagnosisFor a single node we define its redundancy after shrinkage:
... where K is the set of all remaining nodes in the graph after shrinkage
For a shrunken GO graph, we define its redundancy:
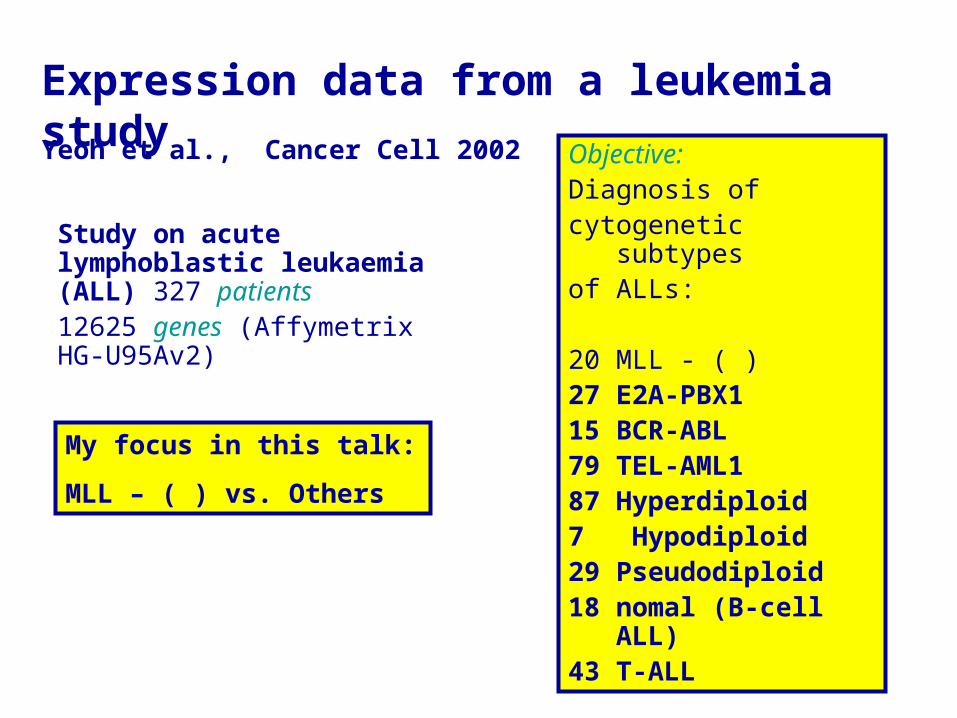
Expression data from a leukemia study
Study on acute lymphoblastic leukaemia (ALL) 327 patients12625 genes (Affymetrix HG-U95Av2)
Yeoh et al., Cancer Cell 2002
My focus in this talk:
MLL – ( ) vs. Others
Objective: Diagnosis ofcytogenetic subtypesof ALLs:
20 MLL - ( )27 E2A-PBX115 BCR-ABL79 TEL-AML187 Hyperdiploid7 Hypodiploid29 Pseudodiploid18 nomal (B-cell
ALL)43 T-ALL
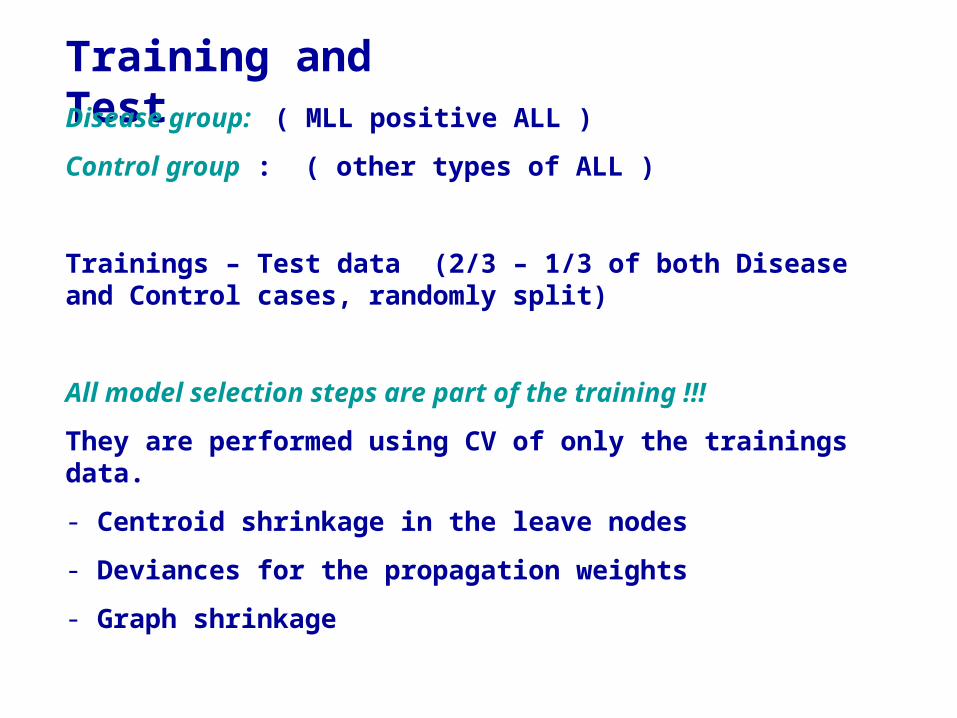
Training and TestDisease group: ( MLL positive ALL )
Control group : ( other types of ALL )
Trainings – Test data (2/3 – 1/3 of both Disease and Control cases, randomly split)
All model selection steps are part of the training !!!
They are performed using CV of only the trainings data.
- Centroid shrinkage in the leave nodes
- Deviances for the propagation weights
- Graph shrinkage

Error Rate
Redundancy

The GO graph before and after shrinkage
AfterBefore
The results on the next slides show the performance of the fully shrinked model on the test data
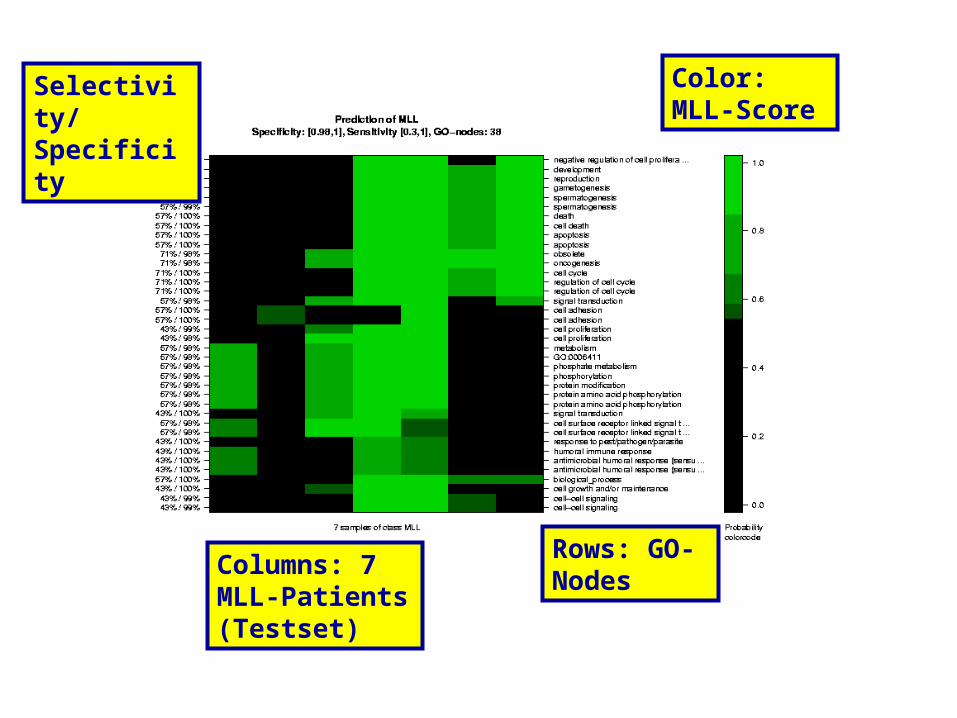
Rows: GO-Nodes
Columns: 7 MLL-Patients (Testset)
Color: MLL-Score
Selectivity/Specificity
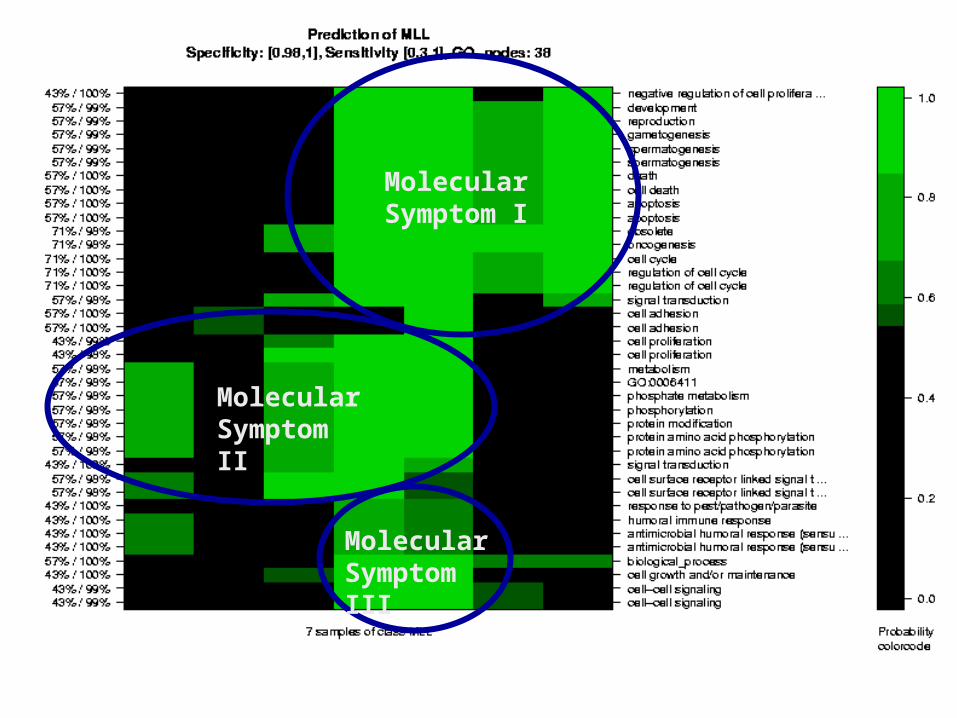
Molecular Symptom III
Molecular Symptom I
Molecular Symptom II
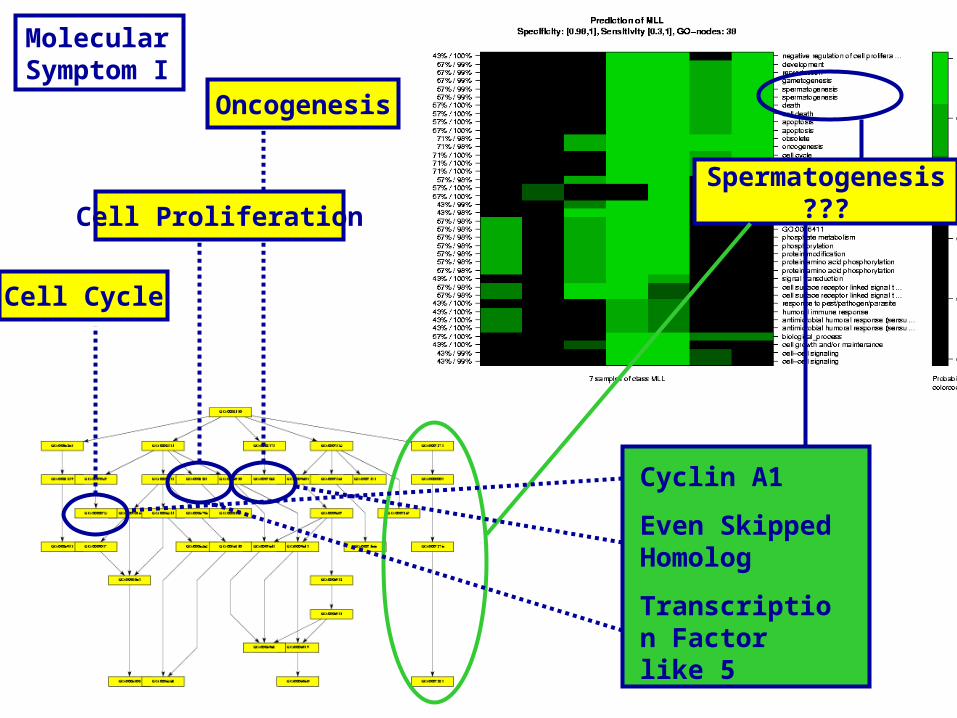
Spermatogenesis???
Cyclin A1
Even Skipped Homolog
Transcription Factor like 5
Cell Cycle
Oncogenesis
Cell Proliferation
Molecular Symptom I

Apoptosis
Lectin
Protein Tyrosin Phosphotase
Molecular Symptom I
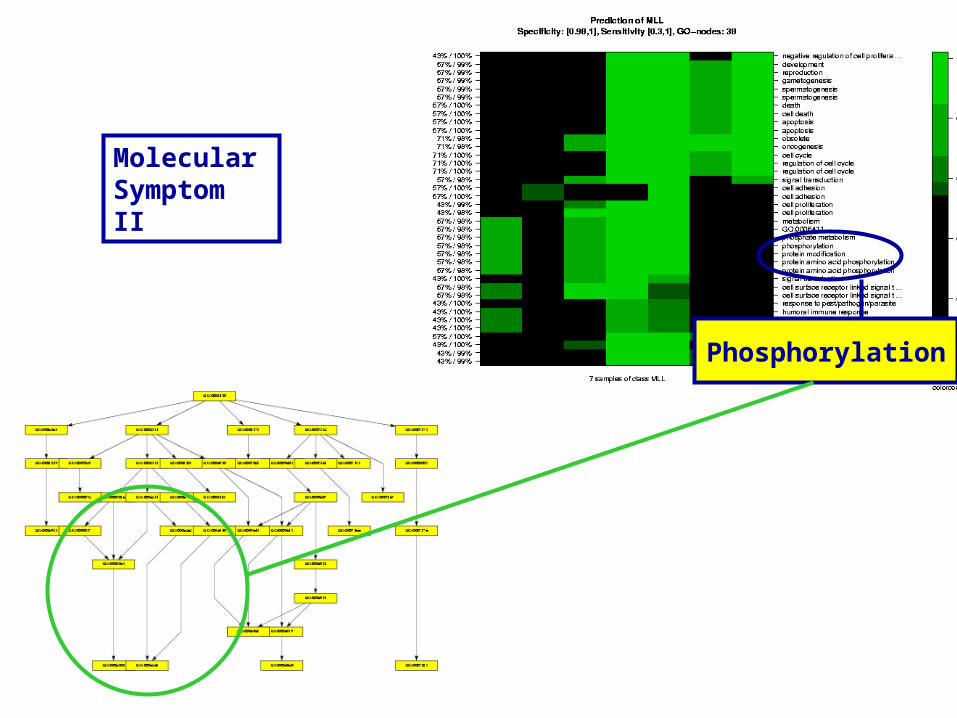
Phosphorylation
Molecular Symptom II
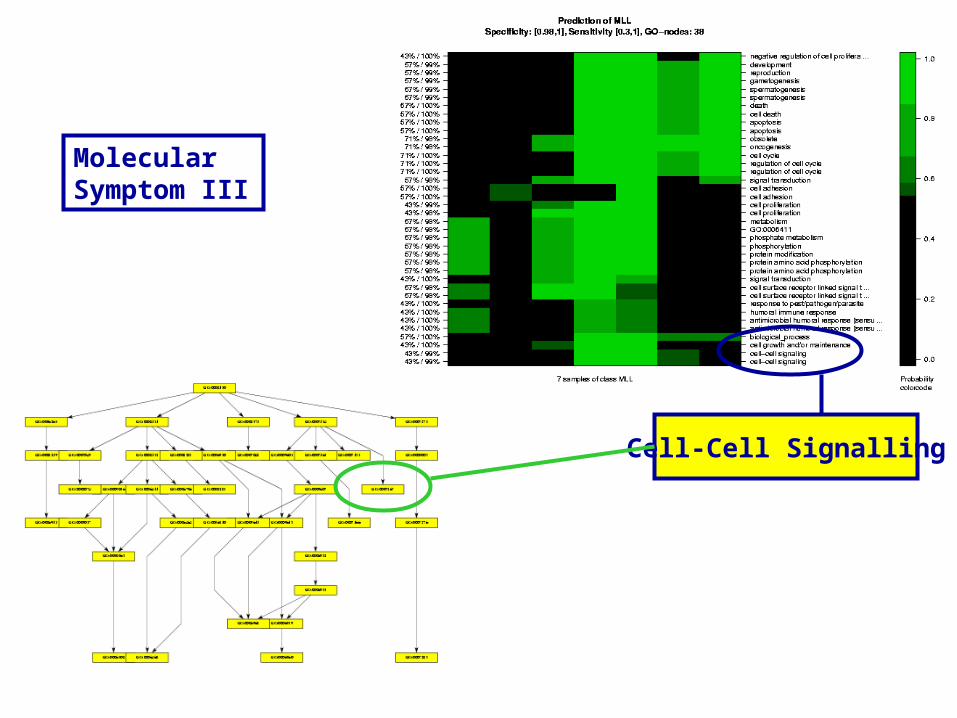
Cell-Cell Signalling
Molecular Symptom III

Almost Global Nodes
Signal Transduction
The Root
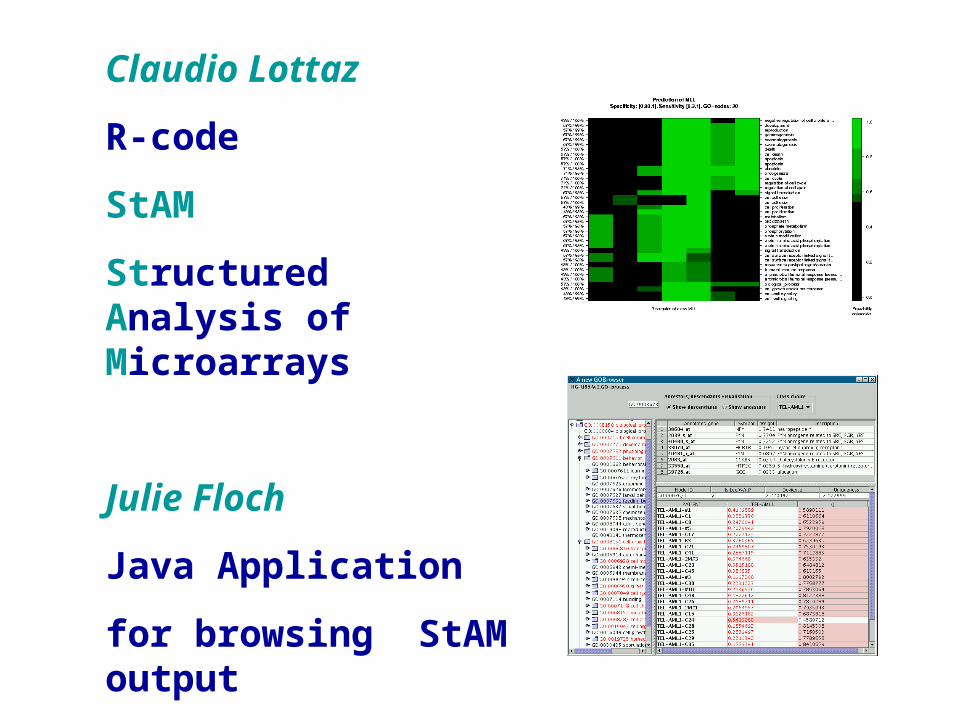
Claudio Lottaz
R-code
StAM
Structured Analysis of Microarrays
Julie Floch
Java Application
for browsing StAM output
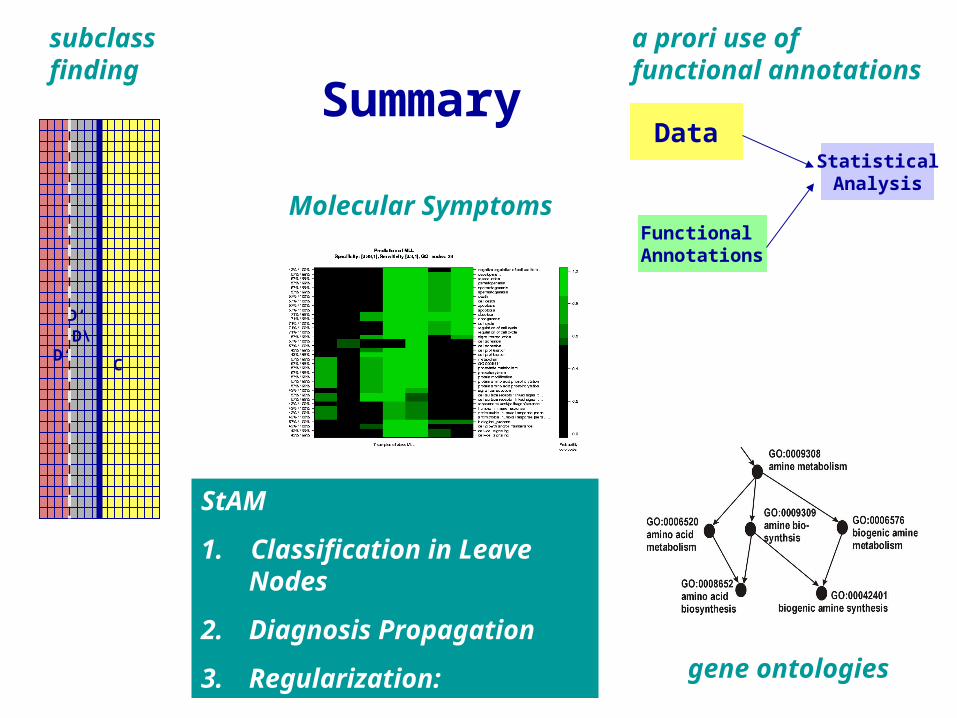
Summary
Data
Functional Annotations
StatisticalAnalysis
D‘ D\D‘
C
a prori use of functional annotations
gene ontologies
StAM
1. Classification in Leave Nodes
2. Diagnosis Propagation
3. Regularization:
subclass finding
Molecular Symptoms