Embed Size (px)
Citation preview
ORIGINAL ARTICLE
Gene expression and plasticity in the rat auditory cortex after bilateralcochlear ablation
SEUNG-HA OH1, CHONG-SUN KIM1 & JAE-JUN SONG2
1Department of Otolaryngology-Head and Neck Surgery, College of Medicine, Seoul National University, Seoul and2Department of Otorhinolaryngology � Head and Neck Surgery, Dongguk University International Hospital, Kyeonggi,
Korea
AbstractConclusion. The plastic changes in the auditory cortex after bilateral cochlear ablation are related to the immediate earlygenes as well as the neural plasticity-related genes. In addition, cross-modal plasticity may play an important role in the earlychanges in the auditory cortex after bilateral cochlear ablation. Objectives. The purpose of this study was to identifycandidate genes involved in the normal development of primary auditory cortex during the critical period as well as thosegenes specifically modulated under conditions of sensory deafferentation by bilateral cochlear ablation. Materials andmethods. We produced a bilaterally deaf rat model and used DNA microarray technology to analyze differential geneexpression in the primary auditory cortex of bilateral cochlear ablated and sham-operated age-matched control rats. Geneexpression in the auditory cortex was compared at 2, 4, and 12 weeks after surgery. For selected genes, the changes ingene expression were confirmed by real-time polymerase chain reaction (PCR). Results. In the cochlear ablation groups, theexpression of immediate early genes (Egr1 , 2 , 3 , 4 , c-fos , etc.) and neural plasticity-related genes (Arc , Syngr1 , Bdnf , etc.)was decreased at 2 weeks and increased at 4 weeks. The expression of neurotransmission-related genes (Gabra5 , Chrnb3,Chrne , etc.) was decreased at 12 weeks.
Keywords: Central auditory system, damage protection, genes, auditory cortex, critical period, microarray analysis, deafness
Introduction
Plasticity in the central nervous system is often
induced by changes in peripheral neuronal activity,
this response is called ‘activity-dependent plasticity’.
As the level of sensory stimulation can be easily
manipulated, the central auditory system provides an
excellent model for study of activity-dependent
plasticity. Hearing loss and noise over-stimulation
have been shown to lead to plastic changes in the
central auditory pathways [1]. These plastic changes
might rely on such mechanisms as the differences in
timing of expression of receptors that are important
for synaptic plasticity, differences in the molecular
factors that control the development of different
neural pathways, and differences in the degree of
early connectivity and activity-dependent shaping of
this connectivity [2]. The susceptibility of the central
sensory system to the change of the peripheral
activity opens for only a very short time in postnatal
development of the mammalian brain and we call it
the ‘critical period’.
In a previous study, we found hypometabolism in
the auditory cortex of prelingually deaf subjects, but
the area of hypometabolism decreased afterwards
without a new sensory input, which suggests the
existence of neural plasticity in the auditory cortex.
The presence of recovered metabolism may contri-
bute to the auditory-to-visual cross-modal plasticity
in prelingually deaf patients [3]. We found the same
phenomenon in animal studies. Four weeks after
cochlear ablation, rat auditory cortex demonstrated
the most severe hypometabolism and the metabolic
status recovered afterwards [4].
There have been a number of studies on the
plasticity of the auditory cortex [5,6]. However,
changes in the gene expression of auditory cortex
Correspondence: Jae-Jun Song, MD, Department of Otorhinolaryngology � Head and Neck Surgery, Dongguk University International Hospital, 814 Siksa-
dong, Ilsandong-gu, Goyang-si, Gyeonggi-do 410-773, Republic of Korea. Tel: �82 31 961 7436. Fax: �82 31 961 7427. E-mail: [email protected]
Acta Oto-Laryngologica, 2007; 127: 341�350
(Received 26 December 2006; accepted 12 February 2007)
ISSN 0001-6489 print/ISSN 1651-2551 online # 2007 Taylor & Francis
DOI: 10.1080/00016480701275246
Act
a O
tola
ryng
ol D
ownl
oade
d fr
om in
form
ahea
lthca
re.c
om b
y U
nive
rsity
of
Cal
gary
on
03/1
4/13
For
pers
onal
use
onl
y.
after bilateral cochlear ablation have never been
assessed.
By characterizing the mechanisms of plastic
change in the auditory cortex after loss of hearing,
we might be able to determine the relationship
between intrinsic constraints and environmental
factors. Microarray technology now allows for a
holistic and high-throughput profiling of gene ex-
pression patterns. Our study is the first holistic gene
profiling investigation of the rat auditory cortex to be
undertaken. Our goal was to identify candidate
genes that are involved in the normal developmental
maturation of primary auditory cortex during the
critical period, as well as those genes that may be
specifically modulated under conditions of sensory
deafferentation by bilateral cochlear ablation.
Materials and methods
Experimental design
Forty-two Sprague�Dawley rats housed in cages in a
specific pathogen-free area were used for this study.
Institutional guidelines regarding animal experi-
ments were followed throughout. Rats were ran-
domly assigned to the groups that received bilateral
cochlear ablation (groups 1, 2, and 3) or to the
groups that received sham operation (groups 4, 5,
and 6). Rats aged 10�14 days were allocated to
group 0. Rats that underwent bilateral cochlear
ablation (groups 1, 2, and 3) or sham operation
(groups 4, 5, and 6) were sacrificed at 2, 4, and 12
weeks after the procedure.
The gene expression profile of the each group
(groups 1�6) was compared with group 0. There-
after, we compared gene expression of the cochlear
ablation groups with that of the sham-operated age-
matched control groups. Using this experimental
design, we could analyze differential gene expression
of the auditory cortex in the cochlear ablation group
and the sham-operated age-matched control group
at three different points in time, and determine the
change of the gene expression profiles over time in
each group.
Surgery for bilateral cochlear ablation
For the purpose of this study, the most appropriate
model was a prelingually deaf rat. As major devel-
opmental changes in the auditory pathway are
known to occur over about 2 weeks in rats, beginning
at around the 10th postnatal day, we ablated the
cochlea surgically at 10�14 days after birth [7]. The
surgical technique was reported previously [4].
Under anesthesia with ketamine, a posterior auricu-
lar incision was made and the bulla was identified.
The cochlea was found after sucking out the
mesodermal tissue in the middle ear. It was un-
capped using a pick and the fluid within the cochlea
was sucked out with a needle suction tip. The skin
was sutured after irrigating the middle ear cavity
with gentamicin. In the sham-operated age-matched
control group, the skin incision and the identification
of the bulla surface was performed and the skin was
then closed. The bulla was not opened, so as to
prevent unwanted conductive hearing loss.
Sample collection from auditory cortex
For the bilateral cochlear ablation group, the deaf
model was confirmed using auditory brainstem
evoked responses and the destruction of cochlea
was confirmed under otomicroscopic examination of
temporal bone. Normal hearing was confirmed by
auditory brainstem evoked responses in the sham-
operated age-matched control groups. The animals
in both the sham-operated age-matched control and
cochlear ablation groups were decapitated and their
brains were removed, slowly frozen on dry ice, and
stored at �208C. Serial coronal sections of brain of
100 m thick containing auditory cortex were col-
lected [8]. These slides were compared with the rat
brain atlas and the location of the auditory cortex
was confirmed. Auditory cortex tissue was collected
by punching the area of interest under the micro-
scope.
Preparation of fluorescent DNA probe and hybridization
Microarray experiments were performed by the
service provider (GenoCheck Co., Gyunggi, Korea).
Total RNA was extracted from the auditory cortex
tissues using the TRI Reagent† (Molecular Re-
search Center, Inc., OH, USA) according to the
manufacturer’s instructions. Fluorescence-labeled
cDNA probes were prepared from 5 ml of total
RNA by RT primer (Genisphere Inc. CA, USA)
primed polymerization using SuperScript reverse
transcriptase (Invitrogen, NY, USA) in a total
reaction volume of 10.5 ml. The reverse transcrip-
tion mixture included 100 U Superscript RNase
H-reverse transcriptase (Invitrogen), each 15 mM
dNTP. After reverse transcription, the sample RNA
was degraded by adding 1 ml of stop solution (0.5 M
NaOH/50 M EDTA) and incubating at 658C for 10
min. After two labeled cDNAs were mixed, the
mixture was denatured 958C for 2 min and then
incubated in a water chamber at 458C for 20 min.
The cDNA mixture was then placed on an Agilent
Rat Whole Genome 44K chip (G4131A, Agilent
Technologies, Inc., CA, USA) and covered by a
hybridization chamber. The slides were hybridized
for 12 h at 628C in a hybridization oven. The
342 S.-H. Oh et al.
Act
a O
tola
ryng
ol D
ownl
oade
d fr
om in
form
ahea
lthca
re.c
om b
y U
nive
rsity
of
Cal
gary
on
03/1
4/13
For
pers
onal
use
onl
y.
hybridized slides were washed in 2�SSC, 0.1%
SDS for 5 min, 1�SSC for 10 min, and then 0.2�SSC for 5 min at room temperature. The slides were
centrifuged at 3000 rpm for 20 s to dry.
Microarray data analysis
Hybridized slides were scanned with the GenePix†
4000B scanner (Molecular Devices, Co., CA, USA)
and the scanned images were analyzed with the
software program GenePix Pro 5.1 (Molecular
Devices), GeneSpring 7.2 (Sillicongenetics, CA,
USA), and R package. To allow the algorithm to
eliminate all bad spots, points with no data were
eliminated by visual inspection from the initial
images. To determine the background signal inten-
sity, the negative control was spotted on each slide.
To filter out the unreliable data, spots with signal-
to-noise ratio below zero were not included in the
data. Data were normalized by global, lowness, and
scaled normalization for data reliability.
Gene expression of group 0 was used as the
control. The signal intensity of each of groups 1�6
was compared with that of group 0 and the ratio of
signal intensity was calculated. Thereafter, the ratio
of signal intensity for each gene was compared
between the bilateral cochlear ablation groups and
the sham-operated age-matched control groups at 2,
4, and 12 weeks after surgery. Genes of interest were
sorted by a difference of twofold change of signal
intensity in the cochlear ablation group compared to
the sham-operated age-matched control group at
each point in time. To understand the functions of
differentially expressed genes, we used the gene
ontology classification of genes, which assigns differ-
entially expressed genes to groups based on mole-
cular function and biological processes.
Real-time polymerase chain reaction (PCR)
The accuracy of microarray analysis in this study was
confirmed by real-time PCR analysis.
Templates for real-time PCR were oligo(dT)-
primed first-strand cDNA prepared from total
RNA isolated from auditory cortex tissue. Real-
time PCR was monitored by quantification of
SYBR Green I fluorescence using the ABI Prism†
7900 Sequence Detection System (Applied Biosys-
tems, CA, USA). Primers were designed using
Primer Express† (version 2.0, Applied Biosystems)
to have annealing temperatures of 59�608C and to
generate amplicons of 50�150 base pairs in length.
The specificity of all amplicons was further assessed
by using the dissociation curve protocol on the ABI
Prism† 7000 Sequence Detection System Software
(version 1.0, Applied Biosystems) and by agarose gel
electrophoresis of a reaction sample taken for each
primer pair. Relative quantification of transcript
expression was performed using the comparative
cycle threshold (CT) method. Briefly, real-time
PCR assays were carried out using parallel amplifi-
cation of the housekeeping gene glyceraldehyde-3-
dehydrogenase (GADPH) as a control and standard
curves were constructed to monitor the efficacy of
each assay. Measurements of the CT values were
obtained in the exponential phase of the PCR
reaction using the ABI Prism† 7000 Sequence
Detection System Software (version 1.0, Applied
Biosystems). The CT of a target gene was then
calibrated against that of GADPH amplified in
parallel from the same sample (CTtarget�CT
GAPDH�DCT). Relative amounts of the target gene in the
ablated group compared to the sham-operated age-
matched control group were then normalized
(CTdeaf�CT
normal�DDCT). The fold change of gene
expression was calculated using the formula (fold
change�2�DDCT).
The genes and primers used for real-time PCR
were as follows: egr (early growth response)-1 , c-fos
(FBJ murine osteosarcoma viral oncogene), arc
(activity-regulated cytoskeletal associated protein),
syt (synaptotagmin)12 , nt5 (5-nucleotidase), slc2a1
(solute carrier family 2 member1, GLUT1), slc2a3
(solute carrier family 2 member 3, GLUT3), slc2a4
(solute carrier family 2 member 4, GLUT4), syn-
gap1 (synaptic Ras GTPase activating protein 1)
(Table I).
Results
Identification of differentially expressed genes following
cochlear ablation
From the 41 372 probe sets used on the Agilent Rat
Whole Genome 44K chip, we found over 219 probe
sets that showed differential expression by more than
twofold at 2, 4, or 12 weeks after the bilateral
cochlear ablation. Of these, 32 genes showed in-
creased expression and 35 genes had decreased
expression at 2 weeks after the ablation (Table II).
By 4 weeks following ablation, 37 genes had
increased expression and 15 genes had decreased
expression (Table III). By 12 weeks following abla-
tion, 12 genes showed increased expression and 88
genes showed decreased expression (Table IV).
The expression pattern of the genes of interest was
verified by real-time PCR and was compared with
the results of the microarray experiments (Table V).
Immediate early genes
Characteristic gene expression patterns were ob-
served in many immediate early genes (IEGs).
Plasticity in auditory cortex after bilateral cochlear ablation 343
Act
a O
tola
ryng
ol D
ownl
oade
d fr
om in
form
ahea
lthca
re.c
om b
y U
nive
rsity
of
Cal
gary
on
03/1
4/13
For
pers
onal
use
onl
y.
Egr1 and c-fos expression was further validated
by real-time PCR. The expression of Egr1 was
0.30-fold decreased at 2 weeks, 2.54-fold increased
at 4 weeks, and 0.67-fold decreased at 12 weeks
(Figure 1A, B). The expression of c-fos was 0.19-fold
decreased at 2 weeks, 3.71-fold increased at 4 weeks,
and 0.60-fold decreased at 12 weeks (Figure 1C, D).
Other IEGs showed a similar expression pattern
(Table V).
Neural plasticity- and synaptogenesis-related genes
Microarray analysis identified many neural plasti-
city- and synaptogenesis-related genes. Of these
genes, four were further assessed with real-time
PCR. The expression of Arc was 0.16-fold decreased
at 2 weeks, 4.47-fold increased at 4 weeks, and 0.72-
fold decreased at 12 weeks. The expression of Nt5
was 0.69-fold decreased at 2 weeks, and 1.21-fold
and 1.15-fold increased at 4 weeks and 12 weeks,
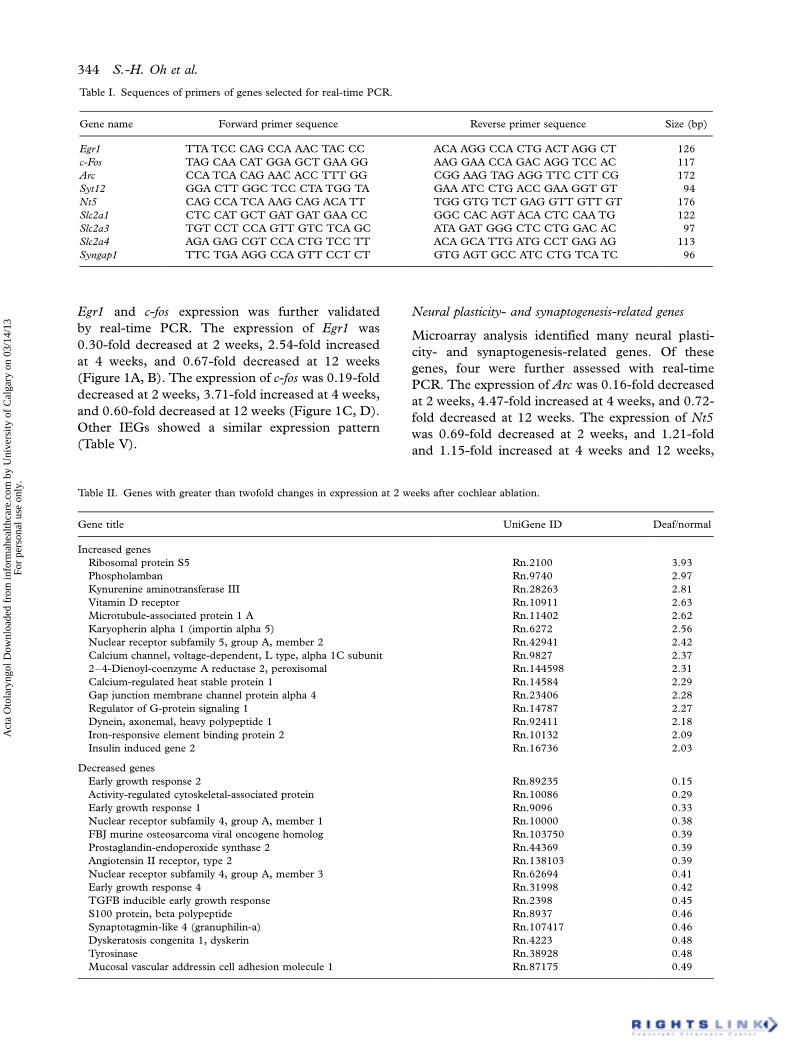
Table I. Sequences of primers of genes selected for real-time PCR.
Gene name Forward primer sequence Reverse primer sequence Size (bp)
Egr1 TTA TCC CAG CCA AAC TAC CC ACA AGG CCA CTG ACT AGG CT 126
c-Fos TAG CAA CAT GGA GCT GAA GG AAG GAA CCA GAC AGG TCC AC 117
Arc CCA TCA CAG AAC ACC TTT GG CGG AAG TAG AGG TTC CTT CG 172
Syt12 GGA CTT GGC TCC CTA TGG TA GAA ATC CTG ACC GAA GGT GT 94
Nt5 CAG CCA TCA AAG CAG ACA TT TGG GTG TCT GAG GTT GTT GT 176
Slc2a1 CTC CAT GCT GAT GAT GAA CC GGC CAC AGT ACA CTC CAA TG 122
Slc2a3 TGT CCT CCA GTT GTC TCA GC ATA GAT GGG CTC CTG GAC AC 97
Slc2a4 AGA GAG CGT CCA CTG TCC TT ACA GCA TTG ATG CCT GAG AG 113
Syngap1 TTC TGA AGG CCA GTT CCT CT GTG AGT GCC ATC CTG TCA TC 96
Table II. Genes with greater than twofold changes in expression at 2 weeks after cochlear ablation.
Gene title UniGene ID Deaf/normal
Increased genes
Ribosomal protein S5 Rn.2100 3.93
Phospholamban Rn.9740 2.97
Kynurenine aminotransferase III Rn.28263 2.81
Vitamin D receptor Rn.10911 2.63
Microtubule-associated protein 1 A Rn.11402 2.62
Karyopherin alpha 1 (importin alpha 5) Rn.6272 2.56
Nuclear receptor subfamily 5, group A, member 2 Rn.42941 2.42
Calcium channel, voltage-dependent, L type, alpha 1C subunit Rn.9827 2.37
2�4-Dienoyl-coenzyme A reductase 2, peroxisomal Rn.144598 2.31
Calcium-regulated heat stable protein 1 Rn.14584 2.29
Gap junction membrane channel protein alpha 4 Rn.23406 2.28
Regulator of G-protein signaling 1 Rn.14787 2.27
Dynein, axonemal, heavy polypeptide 1 Rn.92411 2.18
Iron-responsive element binding protein 2 Rn.10132 2.09
Insulin induced gene 2 Rn.16736 2.03
Decreased genes
Early growth response 2 Rn.89235 0.15
Activity-regulated cytoskeletal-associated protein Rn.10086 0.29
Early growth response 1 Rn.9096 0.33
Nuclear receptor subfamily 4, group A, member 1 Rn.10000 0.38
FBJ murine osteosarcoma viral oncogene homolog Rn.103750 0.39
Prostaglandin-endoperoxide synthase 2 Rn.44369 0.39
Angiotensin II receptor, type 2 Rn.138103 0.39
Nuclear receptor subfamily 4, group A, member 3 Rn.62694 0.41
Early growth response 4 Rn.31998 0.42
TGFB inducible early growth response Rn.2398 0.45
S100 protein, beta polypeptide Rn.8937 0.46
Synaptotagmin-like 4 (granuphilin-a) Rn.107417 0.46
Dyskeratosis congenita 1, dyskerin Rn.4223 0.48
Tyrosinase Rn.38928 0.48
Mucosal vascular addressin cell adhesion molecule 1 Rn.87175 0.49
344 S.-H. Oh et al.
Act
a O
tola
ryng
ol D
ownl
oade
d fr
om in
form
ahea
lthca
re.c
om b
y U
nive
rsity
of
Cal
gary
on
03/1
4/13
For
pers
onal
use
onl
y.
respectively. Microarray analysis of brain-derived
neurotrophic factor (Bdnf) showed 0.54-fold de-
crease of expression at 2 weeks, 1.48-fold increase
at 4 weeks, and 0.56-fold decreased at 12 weeks.
The real-time PCR results for Syt12 and Syngap1
showed little change at each of the three points in
time (Table V).
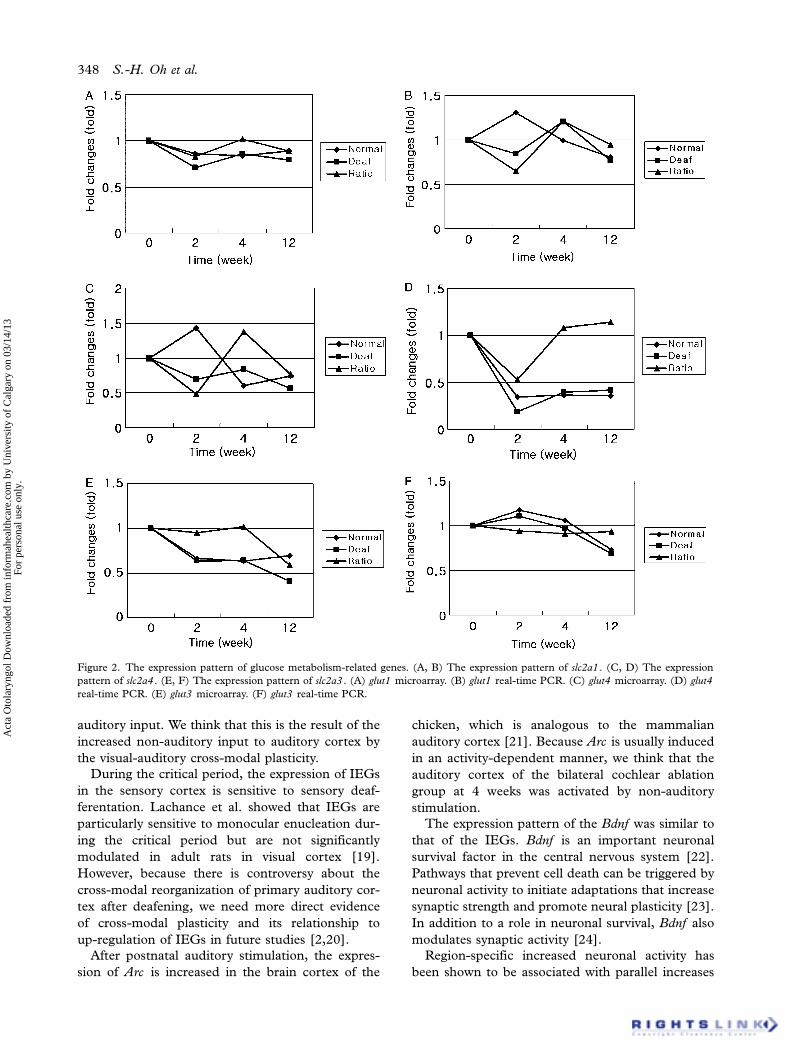
Glucose metabolism-related genes
Real-time PCR results for solute carrier family 2
member1 (Slc2a1 , GLUT1) showed 0.65-fold
decrease in expression at 2 weeks, 1.21-fold increase
at 4 weeks, and 0.95-fold decrease at 12 weeks
(Figure 2A, B). Solute carrier family 2 member 4
(Slc2a4 , GLUT4) expression decreased 0.53-fold at
2 weeks and normalized at 4 weeks and 12 weeks
(Figure 2C, D). However, solute carrier family 2
member 3 (Slc2a3 , GLUT3) showed no change of
expression after bilateral cochlear ablation (Figure
2E, F) (Table V).
Neurotransmission-related genes
Microarray analysis identified that neurotransmis-
sion-related genes showed decreased expression at
12 weeks (Table V). The changes in expression of
these genes at 2 and 4 weeks were insignificant.
These are gamma aminobutyric acid A receptor
alpha 5 (Gabra5), nicotinic cholinergic receptor
beta 3 (Chrnb3), solute carrier family 1 member 2
(Slc1a2), nicotinic cholinergic receptor epsilon
(Chrne), and solute carrier family 6 member 9
(Slc6a9) (Table V).
Discussion
This is the first study to examine both normal
developmental and sensory-driven cortical changes
in gene expression of the auditory cortex using
microarray technology.
In the rat, thalamocortical axons arrive at their
target cortical layer four 3 days after birth and areas
of the cortex can be detected [9]. However, the
functional maturation of the auditory cortex occurs
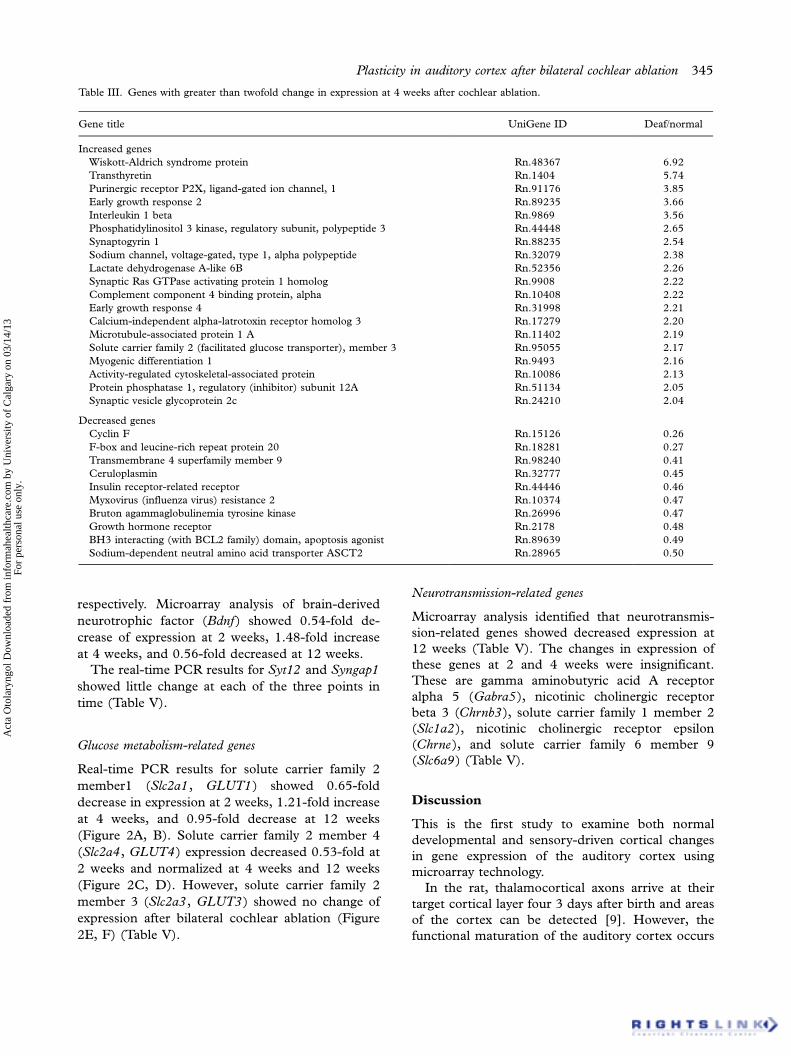
Table III. Genes with greater than twofold change in expression at 4 weeks after cochlear ablation.
Gene title UniGene ID Deaf/normal
Increased genes
Wiskott-Aldrich syndrome protein Rn.48367 6.92
Transthyretin Rn.1404 5.74
Purinergic receptor P2X, ligand-gated ion channel, 1 Rn.91176 3.85
Early growth response 2 Rn.89235 3.66
Interleukin 1 beta Rn.9869 3.56
Phosphatidylinositol 3 kinase, regulatory subunit, polypeptide 3 Rn.44448 2.65
Synaptogyrin 1 Rn.88235 2.54
Sodium channel, voltage-gated, type 1, alpha polypeptide Rn.32079 2.38
Lactate dehydrogenase A-like 6B Rn.52356 2.26
Synaptic Ras GTPase activating protein 1 homolog Rn.9908 2.22
Complement component 4 binding protein, alpha Rn.10408 2.22
Early growth response 4 Rn.31998 2.21
Calcium-independent alpha-latrotoxin receptor homolog 3 Rn.17279 2.20
Microtubule-associated protein 1 A Rn.11402 2.19
Solute carrier family 2 (facilitated glucose transporter), member 3 Rn.95055 2.17
Myogenic differentiation 1 Rn.9493 2.16
Activity-regulated cytoskeletal-associated protein Rn.10086 2.13
Protein phosphatase 1, regulatory (inhibitor) subunit 12A Rn.51134 2.05
Synaptic vesicle glycoprotein 2c Rn.24210 2.04
Decreased genes
Cyclin F Rn.15126 0.26
F-box and leucine-rich repeat protein 20 Rn.18281 0.27
Transmembrane 4 superfamily member 9 Rn.98240 0.41
Ceruloplasmin Rn.32777 0.45
Insulin receptor-related receptor Rn.44446 0.46
Myxovirus (influenza virus) resistance 2 Rn.10374 0.47
Bruton agammaglobulinemia tyrosine kinase Rn.26996 0.47
Growth hormone receptor Rn.2178 0.48
BH3 interacting (with BCL2 family) domain, apoptosis agonist Rn.89639 0.49
Sodium-dependent neutral amino acid transporter ASCT2 Rn.28965 0.50
Plasticity in auditory cortex after bilateral cochlear ablation 345
Act
a O
tola
ryng
ol D
ownl
oade
d fr
om in
form
ahea
lthca
re.c
om b
y U
nive
rsity
of
Cal
gary
on
03/1
4/13
For
pers
onal
use
onl
y.
during the second and third postnatal weeks [10].
Because the time of operation in this study was the
time when rats just begin to experience sound, the
animal model developed for this study is similar to
prelingual deafness in the human. As rats undergo
normal developmental processes during this period,
we designed our experiments to analyze the effect of
auditory deprivation and normal development as
well. Using this experimental design, we could
analyze the effect of bilateral cochlear ablation on
auditory cortex while excluding the effect of normal
development.
IEGs are activated by the diverse intracellular
messenger systems linking membrane events and the
nucleus. They are characterized by rapid activation
in response to external stimulation in the absence of
de novo protein synthesis [11].
Our data showed that many IEGs are significantly
affected by cochlear ablation (Table V).
c-fos represents the effects of exogenous factors on
gene transcription. In the auditory brainstem, the
expression of c-fos is induced by acoustic stimula-
tion, and is reduced by deprivation of acoustic
stimulation [12]. In the auditory cortex, frequency-
specific expression patterns of c-fos are induced by
band noise stimulation [13].
Egr1 codes for a transcription factor protein and
controls expression of other genes in the central
nervous system [14,15]. Egr1 plays an important
role in neural plasticity. Expression of Egr1 is
essential for the formation of the late phase of
long-term potentiation [16]. In the auditory brain-
stem, the expression of Egr1 is increased in a
stimulation-dependent manner [17].
In the visual cortex, increased expression of IEGs
is associated with onset of visual stimulation and
reaches peak values by postnatal third weeks [18]. In
sham-operated age-matched control groups, the
expression of the IEGs was increased at 2 weeks
after sham operation and gradually decreased after-
wards. This might be the result of the normal
development of auditory cortex. In the bilateral
cochlear ablation groups, peak expression of the
IEGs was at 4 weeks after ablation surgery and it is
postnatal 6th weeks. It is very interesting that IEGs
were increased in the auditory cortex with no
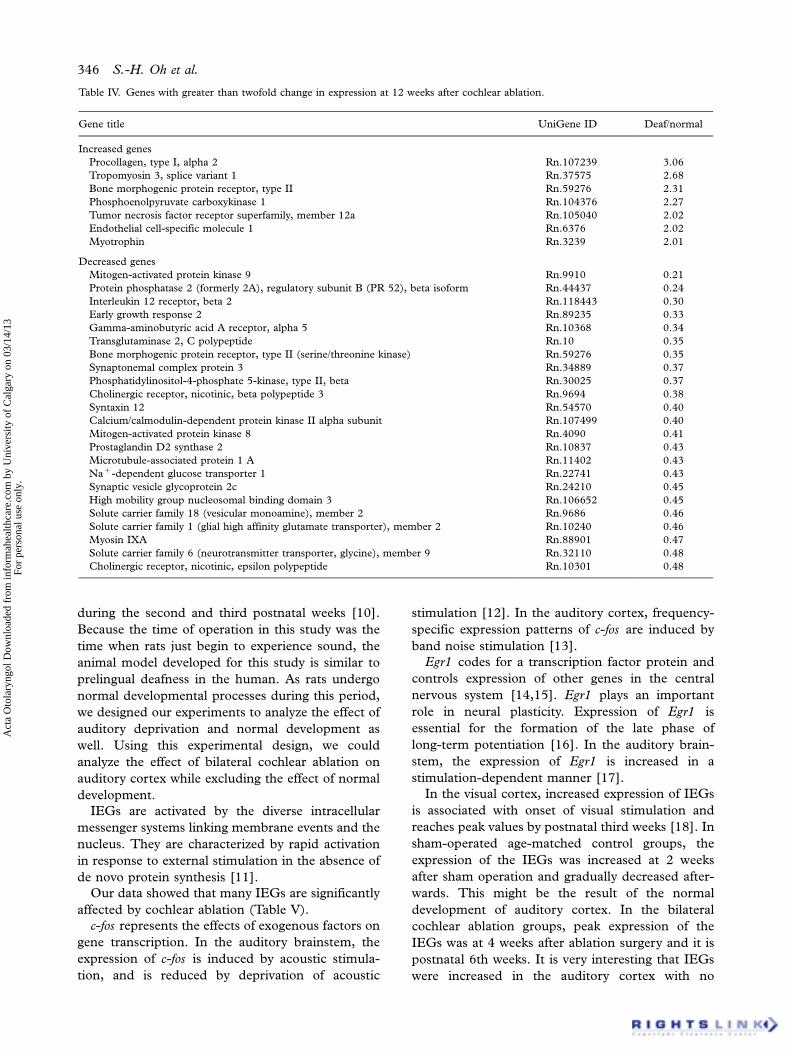
Table IV. Genes with greater than twofold change in expression at 12 weeks after cochlear ablation.
Gene title UniGene ID Deaf/normal
Increased genes
Procollagen, type I, alpha 2 Rn.107239 3.06
Tropomyosin 3, splice variant 1 Rn.37575 2.68
Bone morphogenic protein receptor, type II Rn.59276 2.31
Phosphoenolpyruvate carboxykinase 1 Rn.104376 2.27
Tumor necrosis factor receptor superfamily, member 12a Rn.105040 2.02
Endothelial cell-specific molecule 1 Rn.6376 2.02
Myotrophin Rn.3239 2.01
Decreased genes
Mitogen-activated protein kinase 9 Rn.9910 0.21
Protein phosphatase 2 (formerly 2A), regulatory subunit B (PR 52), beta isoform Rn.44437 0.24
Interleukin 12 receptor, beta 2 Rn.118443 0.30
Early growth response 2 Rn.89235 0.33
Gamma-aminobutyric acid A receptor, alpha 5 Rn.10368 0.34
Transglutaminase 2, C polypeptide Rn.10 0.35
Bone morphogenic protein receptor, type II (serine/threonine kinase) Rn.59276 0.35
Synaptonemal complex protein 3 Rn.34889 0.37
Phosphatidylinositol-4-phosphate 5-kinase, type II, beta Rn.30025 0.37
Cholinergic receptor, nicotinic, beta polypeptide 3 Rn.9694 0.38
Syntaxin 12 Rn.54570 0.40
Calcium/calmodulin-dependent protein kinase II alpha subunit Rn.107499 0.40
Mitogen-activated protein kinase 8 Rn.4090 0.41
Prostaglandin D2 synthase 2 Rn.10837 0.43
Microtubule-associated protein 1 A Rn.11402 0.43
Na�-dependent glucose transporter 1 Rn.22741 0.43
Synaptic vesicle glycoprotein 2c Rn.24210 0.45
High mobility group nucleosomal binding domain 3 Rn.106652 0.45
Solute carrier family 18 (vesicular monoamine), member 2 Rn.9686 0.46
Solute carrier family 1 (glial high affinity glutamate transporter), member 2 Rn.10240 0.46
Myosin IXA Rn.88901 0.47
Solute carrier family 6 (neurotransmitter transporter, glycine), member 9 Rn.32110 0.48
Cholinergic receptor, nicotinic, epsilon polypeptide Rn.10301 0.48
346 S.-H. Oh et al.
Act
a O
tola
ryng
ol D
ownl
oade
d fr
om in
form
ahea
lthca
re.c
om b
y U
nive
rsity
of
Cal
gary
on
03/1
4/13
For
pers
onal
use
onl
y.
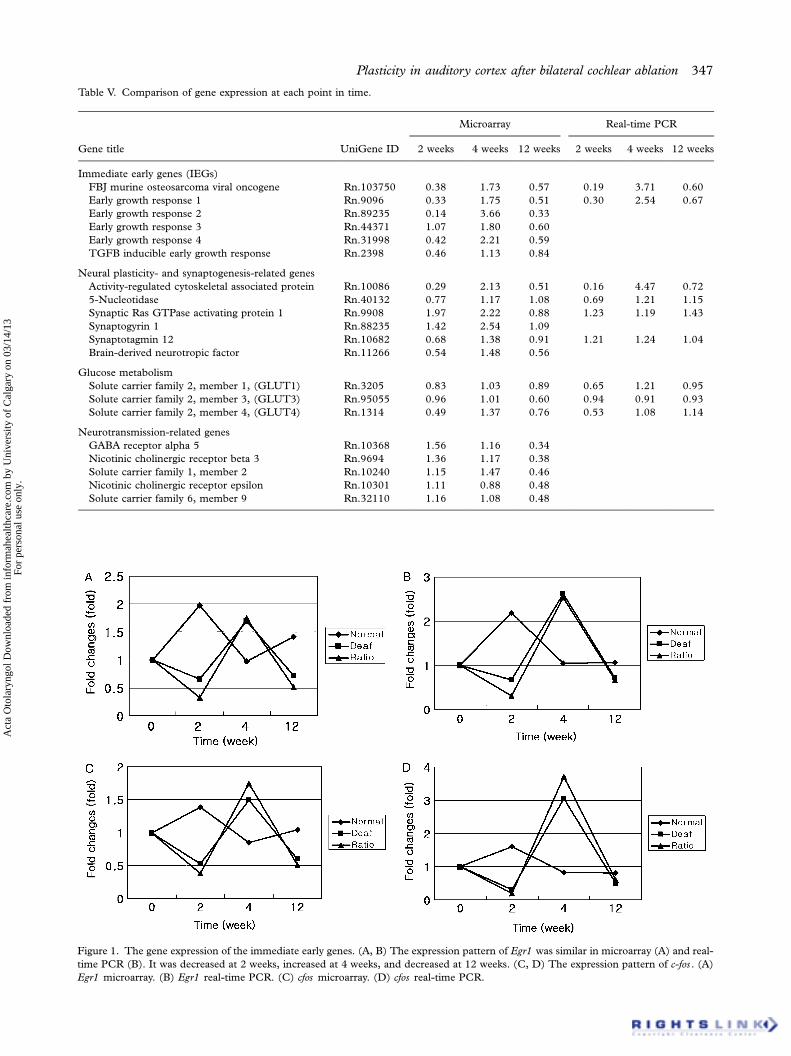
Table V. Comparison of gene expression at each point in time.
Microarray Real-time PCR
Gene title UniGene ID 2 weeks 4 weeks 12 weeks 2 weeks 4 weeks 12 weeks
Immediate early genes (IEGs)
FBJ murine osteosarcoma viral oncogene Rn.103750 0.38 1.73 0.57 0.19 3.71 0.60
Early growth response 1 Rn.9096 0.33 1.75 0.51 0.30 2.54 0.67
Early growth response 2 Rn.89235 0.14 3.66 0.33
Early growth response 3 Rn.44371 1.07 1.80 0.60
Early growth response 4 Rn.31998 0.42 2.21 0.59
TGFB inducible early growth response Rn.2398 0.46 1.13 0.84
Neural plasticity- and synaptogenesis-related genes
Activity-regulated cytoskeletal associated protein Rn.10086 0.29 2.13 0.51 0.16 4.47 0.72
5-Nucleotidase Rn.40132 0.77 1.17 1.08 0.69 1.21 1.15
Synaptic Ras GTPase activating protein 1 Rn.9908 1.97 2.22 0.88 1.23 1.19 1.43
Synaptogyrin 1 Rn.88235 1.42 2.54 1.09
Synaptotagmin 12 Rn.10682 0.68 1.38 0.91 1.21 1.24 1.04
Brain-derived neurotropic factor Rn.11266 0.54 1.48 0.56
Glucose metabolism
Solute carrier family 2, member 1, (GLUT1) Rn.3205 0.83 1.03 0.89 0.65 1.21 0.95
Solute carrier family 2, member 3, (GLUT3) Rn.95055 0.96 1.01 0.60 0.94 0.91 0.93
Solute carrier family 2, member 4, (GLUT4) Rn.1314 0.49 1.37 0.76 0.53 1.08 1.14
Neurotransmission-related genes
GABA receptor alpha 5 Rn.10368 1.56 1.16 0.34
Nicotinic cholinergic receptor beta 3 Rn.9694 1.36 1.17 0.38
Solute carrier family 1, member 2 Rn.10240 1.15 1.47 0.46
Nicotinic cholinergic receptor epsilon Rn.10301 1.11 0.88 0.48
Solute carrier family 6, member 9 Rn.32110 1.16 1.08 0.48
Figure 1. The gene expression of the immediate early genes. (A, B) The expression pattern of Egr1 was similar in microarray (A) and real-
time PCR (B). It was decreased at 2 weeks, increased at 4 weeks, and decreased at 12 weeks. (C, D) The expression pattern of c-fos . (A)
Egr1 microarray. (B) Egr1 real-time PCR. (C) cfos microarray. (D) cfos real-time PCR.
Plasticity in auditory cortex after bilateral cochlear ablation 347
Act
a O
tola
ryng
ol D
ownl
oade
d fr
om in
form
ahea
lthca
re.c
om b
y U
nive
rsity
of
Cal
gary
on
03/1
4/13
For
pers
onal
use
onl
y.
auditory input. We think that this is the result of the
increased non-auditory input to auditory cortex by
the visual-auditory cross-modal plasticity.
During the critical period, the expression of IEGs
in the sensory cortex is sensitive to sensory deaf-
ferentation. Lachance et al. showed that IEGs are
particularly sensitive to monocular enucleation dur-
ing the critical period but are not significantly
modulated in adult rats in visual cortex [19].
However, because there is controversy about the
cross-modal reorganization of primary auditory cor-
tex after deafening, we need more direct evidence
of cross-modal plasticity and its relationship to
up-regulation of IEGs in future studies [2,20].
After postnatal auditory stimulation, the expres-
sion of Arc is increased in the brain cortex of the
chicken, which is analogous to the mammalian
auditory cortex [21]. Because Arc is usually induced
in an activity-dependent manner, we think that the
auditory cortex of the bilateral cochlear ablation
group at 4 weeks was activated by non-auditory
stimulation.
The expression pattern of the Bdnf was similar to
that of the IEGs. Bdnf is an important neuronal
survival factor in the central nervous system [22].
Pathways that prevent cell death can be triggered by
neuronal activity to initiate adaptations that increase
synaptic strength and promote neural plasticity [23].
In addition to a role in neuronal survival, Bdnf also
modulates synaptic activity [24].
Region-specific increased neuronal activity has
been shown to be associated with parallel increases
Figure 2. The expression pattern of glucose metabolism-related genes. (A, B) The expression pattern of slc2a1 . (C, D) The expression
pattern of slc2a4 . (E, F) The expression pattern of slc2a3 . (A) glut1 microarray. (B) glut1 real-time PCR. (C) glut4 microarray. (D) glut4
real-time PCR. (E) glut3 microarray. (F) glut3 real-time PCR.
348 S.-H. Oh et al.
Act
a O
tola
ryng
ol D
ownl
oade
d fr
om in
form
ahea
lthca
re.c
om b
y U
nive
rsity
of
Cal
gary
on
03/1
4/13
For
pers
onal
use
onl
y.
in brain glucose uptake [25]. Increase of glucose
metabolism is associated with learning and memory
processing in the hippocampus and cortical brain
regions [26].
In the previous study, we reported that the
decreased glucose metabolism of auditory cortex
becomes prominent after a critical period after
bilateral cochlear ablation of the rat and decreases
as the duration of deafness increases [4]. However,
in this study, the changes in expression of the glucose
metabolism-related genes were not significant.
In this study, some neurotransmission-related
genes showed significantly decreased expression in
bilateral cochlear ablation group at 12 weeks. Many
neurotransmission-related genes showed significant
changes of expression in the inferior colliculus of
adult rat after bilateral cochlear ablation. Those
changes began early after the bilateral cochlear
ablation [27]. However, in this study, decreased
expression of the neurotransmission-related genes
occurred only at 12 weeks after bilateral cochlear
ablation. We think that during the critical period, the
IEGs and neural plasticity-related genes may play a
more important role than neurotransmission-related
genes.
Conclusion
In this study, we found that many genes play an
important role in early changes of the auditory
cortex after bilateral cochlear ablation during the
critical period. Our results provide insights into the
global changes in the gene expression of the auditory
cortex focusing on two primary conditions, such as
cortical development and disruption of sensory
input.
The peak expression of the IEGs in the sham-
operated age-matched control group was at 2 weeks
and the peak expression of IEGs was at 4 weeks in
the bilateral cochlear ablation groups. This time
delay seems to be related to the slow development of
the auditory cortex. However, this is the result in the
absence of auditory input and we think that this is
the result of the cross-modal plasticity after bilateral
cochlear ablation. This result implies that the devel-
opment of the auditory cortex can be modulated by
the peripheral activity.
We need more information about the age depen-
dency of this plastic change, auditory cortex speci-
ficity of the genes which showed change of
expression in this study, and visual-auditory cross-
modal plasticity after bilateral cochlear ablation.
Further studies are needed on these issues and
they will elucidate the roles of the molecules isolated
in this study in the context of cortical development
and plasticity.
References
[1] Syka J. Plastic changes in the central auditory system after
hearing loss, restoration of function, and during learning.
Physiol Rev 2002;/82:/601�36.
[2] Bavelier D, Neville HJ. Cross-modal plasticity: where and
how? Nat Rev Neurosci 2002;/3:/443�52.
[3] Lee DS, Lee JS, Oh SH, Kim SK, Kim JW, Chung JK, et al.
Cross-modal plasticity and cochlear implants. Nature 2001;/
409:/149�50.
[4] Ahn SH, Oh SH, Lee JS, Jeong JM, Lim D, Lee DS, et al.
Changes of 2-deoxyglucose uptake in the rat auditory path-
way after bilateral ablation of the cochlea. Hear Res 2004;/
196:/33�8.
[5] King AJ. Auditory plasticity: vocal output shapes auditory
cortex. Curr Biol 2005;/15:/R503�5.
[6] King AJ, Moore DR. Plasticity of auditory maps in the brain.
Trends Neurosci 1991;/14:/31�7.
[7] Clerici WJ, Coleman JR. Resting and high-frequency evoked
2-deoxyglucose uptake in the rat inferior colliculus: devel-
opmental changes and effects of short-term conduction
blockade. Brain Res 1986;/392:/127�37.
[8] Paxinos G, Watson C. The rat brain in stereotaxic coordi-
nates. New York: Academic Press; 1986.
[9] Pallas SL. Intrinsic and extrinsic factors that shape neocor-
tical specification. Trends Neurosci 2001;/24:/417�23.
[10] Metherate R, Cruikshank SJ. Thalamocortical inputs trigger
a propagating envelope of gamma-band activity in auditory
cortex in vitro. Exp Brain Res 1999;/126:/160�74.
[11] Herdegen T, Leah JD. Inducible and constitutive transcrip-
tion factors in the mammalian nervous system: control of
gene expression by jun, fos and krox, and creb/atf proteins.
Brain Res Brain Res Rev 1998;/28:/370�490.
[12] Keilmann A, Herdegen T. The c-fos transcription factor in
the auditory pathway of the juvenile rat: effects of acoustic
deprivation and repetitive stimulation. Brain Res 1997;/753:/
291�8.
[13] Friauf E. Tonotopic order in the adult and developing
auditory system of the rat as shown by c-fos immunocyto-
chemistry. Eur J Neurosci 1992;/4:/798�812.
[14] Cao XM, Koski RA, Gashler A, McKiernan M, Morris CF,
Gaffney R, et al. Identification and characterization of the
egr-1 gene product, a DNA-binding zinc finger protein
induced by differentiation and growth signals. Mol Cell
Biol 1990;/10:/1931�9.
[15] Knapska E, Kaczmarek L. A gene for neuronal plasticity in
the mammalian brain: Zif268/egr-1/ngfi-a/krox-24/tis8/zenk?
Prog Neurobiol 2004;/74:/183�211.
[16] Wei F, Xu ZC, Qu Z, Milbrandt J, Zhuo M. Role of egr1 in
hippocampal synaptic enhancement induced by tetanic
stimulation and amputation. J Cell Biol 2000;/149:/1325�34.
[17] Illing RB. Activity-dependent plasticity in the adult auditory
brainstem. Audiol Neurootol 2001;/6:/319�45.
[18] Kaminska B, Mosieniak G, Gierdalski M, Kossut M,
Kaczmarck L. Elevated ap-1 transcription factor DNA
binding activity at the onset of functional plasticity during
development of rat sensory cortical areas. Brain Res Mol
Brain Res 1995;/33:/295�304.
[19] Lachance PE, Chaudhuri A. Microarray analysis of devel-
opmental plasticity in monkey primary visual cortex. J
Neurochem 2004;/88:/1455�69.
[20] Kral A, Schroder JH, Klinke R, Engel AK. Absence of cross-
modal reorganization in the primary auditory cortex of
congenitally deaf cats. Exp Brain Res 2003;/153:/605�13.
[21] Bock J, Thode C, Hannemann O, Braun K, Darlison MG.
Early socio-emotional experience induces expression of the
immediate-early gene arc/arg3.1 (activity-regulated cytoske-
Plasticity in auditory cortex after bilateral cochlear ablation 349
Act
a O
tola
ryng
ol D
ownl
oade
d fr
om in
form
ahea
lthca
re.c
om b
y U
nive
rsity
of
Cal
gary
on
03/1
4/13
For
pers
onal
use
onl
y.

leton-associated protein/activity-regulated gene) in learning-
relevant brain regions of the newborn chick. Neuroscience
2005;/133:/625�33.
[22] Jones KR, Farinas I, Backus C, Reichardt LF. Targeted
disruption of the bdnf gene perturbs brain and sensory
neuron development but not motor neuron development.
Cell 1994;/76:/989�99.
[23] Girault JA, Costa A, Derkinderen P, Studler JM, Toutant M.
Fak and pyk2/cakbeta in the nervous system: a link between
neuronal activity, plasticity and survival? Trends Neurosci
1999;/22:/257�63.
[24] Poo MM. Neurotrophins as synaptic modulators. Nat Rev
Neurosci 2001;/2:/24�32.
[25] Barrett D, Shumake J, Jones D, Gonzalez-Lima F. Metabolic
mapping of mouse brain activity after extinction of a
conditioned emotional response. J Neurosci 2003;/23:/
5740�9.
[26] Friedman HR, Goldman-Rakic PS. Coactivation of pre-
frontal cortex and inferior parietal cortex in working memory
tasks revealed by 2dg functional mapping in the rhesus
monkey. J Neurosci 1994;/14:/2775�88.
[27] Holt AG, Asako M, Lomax CA, MacDonald JW, Tong L,
Lomax MI, et al. Deafness-related plasticity in the inferior
colliculus: gene expression profiling following removal of
peripheral activity. J Neurochem 2005;/93:/1069�86.
350 S.-H. Oh et al.
Act
a O
tola
ryng
ol D
ownl
oade
d fr
om in
form
ahea
lthca
re.c
om b
y U
nive
rsity
of
Cal
gary
on
03/1
4/13
For
pers
onal
use
onl
y.