Embed Size (px)
Citation preview
Copyright � 2007 by the Genetics Society of AmericaDOI: 10.1534/genetics.107.081323
Gene-Based Sequence Diversity Analysis of Field Pea (Pisum)
Runchun Jing,*,1 Richard Johnson,* Andrea Seres,† Gyorgy Kiss,† Mike J. Ambrose,‡
Maggie R. Knox,‡ T. H. Noel Ellis‡ and Andrew J. Flavell*,2
*Plant Research Unit, University of Dundee at Scottish Crop Research Institute, Invergowrie, Dundee DD2 5DA, United Kingdom,†Institute of Genetics–Agricultural Biotechnology Center, Szent-Gyorgyi u. 4, 2100 Godoll}o, Hungary and
‡John Innes Centre, Colney, Norwich NR4 7UH, United Kingdom
Manuscript received August 30, 2007Accepted for publication October 11, 2007
ABSTRACT
Sequence diversity of 39 dispersed gene loci was analyzed in 48 diverse individuals representative of thegenus Pisum. The different genes show large variation in diversity parameters, suggesting widely differinglevels of selection and a high overall diversity level for the species. The data set yields a genetic diversity treewhose deep branches, involving wild samples, are preserved in a tree derived from a polymorphicretrotransposon insertions in an identical sample set. Thus, gene regions and intergenic ‘‘junk DNA’’ sharea consistent picture for the genomic diversity of Pisum, despite low linkage disequilibrium in wild andlandrace germplasm, which might be expected to allow independent evolution of these very different DNAclasses. Additional lines of evidence indicate that recombination has shuffled gene haplotypes efficientlywithin Pisum, despite its high level of inbreeding and widespread geographic distribution. Trees derivedfrom individual gene loci show marked differences from each other, and genetic distance values betweensample pairs show high standard deviations. Sequence mosaic analysis of aligned sequences identifies nineloci showing evidence for intragenic recombination. Lastly, phylogenetic network analysis confirms thenon-treelike structure of Pisum diversity and indicates the major germplasm classes involved. Overall, thesedata emphasize the artificiality of simple tree structures for representing genomic sequence variation withinPisum and emphasize the need for fine structure haplotype analysis to accurately define the geneticstructure of the species.
THE genetic diversity of a species is the sum of its totalDNA sequence variation, resulting from millions of
years of cumulative mutation, recombination, andselection. Understanding the pattern of the diversitywithin cultivated plant species and their wild relativesis both interesting and practically important from theviewpoint of conservation and use. Therefore, the waysby which genetic diversity in populations are estimatedand represented are important. A popular approach formeasuring the genetic diversity of accessions of a speciesis to analyze samples from gene banks (germplasm col-lections) by one or more of the many available molecularmarker methods. The effectiveness of this strategy de-pends upon the suitability of the marker method foranalyzing the diversity of the sample collection underinvestigation. Different marker methods can give differ-ent views of diversity, depending upon the evolutionaryparameters of the underlying DNA sequence variation.Rapidly evolving DNAs, such as simple sequence repeats
(SSRs), give high resolution views of relatedness; singlenucleotide polymorphism (SNP)-based variation ismore suited to deeper relationships, reflecting the slowmutation rate for this type of sequence variation; andtransposon insertion-based marker methods should liebetween these two, reflecting their intermediate muta-tion rate, although few studies have been carried out totest this. Furthermore, the genomic compartment inwhich the markers reside might affect the diversitypattern seen, and it is possible that markers residingmainly in junk DNA might produce different resultsfrom markers based upon genes, which are predomi-nantly euchromatic. For these reasons there is a need tocompare the diversity patterns obtained using differentmolecular approaches for diversity assessment.
The data sets that result from marker analysis ofgermplasm samples are often represented by trees, withthe summed branch lengths separating any two samplestaken as a measure of their relatedness. Trees are visuallyappealing but can be misleading. One of several seriouslimitations to this approach is the fact that it ignoresintrogression and recombination. Modeling has shownthat recombination leads to long terminal branches,resulting in trees showing a ‘‘star phylogeny’’ (Schierup
and Hein 2000). Recombination results in multiplica-tion of the number of trees, with every inheritedcrossover producing a corresponding extra tree, which
Sequence data from this article have been deposited with the EMBL/GenBank Data Libraries under accession nos. EU269859–EU271646.
1Present Address: School of Biological Sciences, University of East Anglia,Norwich NR4 7TJ, United Kingdom.
2Corresponding author: Division of Plant Sciences, University of Dundeeat SCRI, Invergowrie, Dundee DD2 5DA, United Kingdom.E-mail: [email protected]
Genetics 177: 2263–2275 (December 2007)
Dow
nloaded from https://academ
ic.oup.com/genetics/article/177/4/2263/6064433 by guest on 12 M
arch 2022
differs by a single branch translocation from its ante-cedent (Hudson 1983; Maddison 1995). One way ofrepresenting such ambiguity is to replace tree structureby a reticulated network (Bryant and Moulton 2004;Huson and Bryant 2006). In summary, the usefulnessof trees derived from unlinked sites in a genome thathas undergone significant recombination is question-able, and trees derived from linked sites must be con-sidered in the context of the ratio of recombination tomutation in that region in the corresponding lineage.
We have previously studied the genetic diversity of thefield pea (P. sativum) and its wild relatives, using severalmarker-based approaches. P. sativum is an Old Worldlegume crop first cultivated 10,000 years ago (Blixt
1972; Zohary 1996; Mithen 2003). Like all major cropspecies, cultivated Pisum has a condensed gene poolrelative to its wild relatives (in this case P. fulvum andP. elatius), and the relationships within the genus Pisumhave generated substantial debate. Studies by ourselvesand others have indicated that P. fulvum can reason-ably be considered as a distinct species, with P. sativumforming a subset of P. elatius (Vershinin et al. 2003;Baranger et al. 2004; Tar’anet al. 2005). Other claimedspecies such as P. humile and P. abyssinicum have littlesupport from molecular studies. Furthermore, there isextensive sharing of SSAP retrotransposon markersbetween all Pisum species, suggesting that there hasbeen significant outcrossing between them (Vershinin
et al. 2003), despite the predominantly inbreedingnature of the genus, which should restrict introgressionof haplotypes. Most, but not all wide crosses betweenPisum genotypes are fertile, the exceptions involvingP. fulvum and P. abyssinicum. P. abyssinicum and P. sativumare interfertile although success rates can be variable,and between some accessions reciprocal crosses maynot be interfertile. P. fulvum and P. sativum have a morerestricted interfertility, although crosses can be success-ful (Clement et al. 2002) and for practical purposesP. abyssinicum has been used in a bridging cross (e.g.,Forster et al. 1999). There are sporadic reports ofinfertility in wide crosses (e.g., Ochatt et al. 2004), butsuch reports should be considered against the back-ground of demonstrable success in these wide crosses.For these reasons Pisum is perhaps best considered as aspecies complex with multiple subspecies that inter-breed to a different degree.
The SSAP markers that have given rise to the aboveconclusion are based upon insertions of the PDR1 Ty1-copia group retrotransposon (Vershinin et al. 2003). Inlarge plant genomes such as maize and Pisum, retro-transposons are mainly located in intergenic nuclearDNA, and the antiquity of individual insertion eventstypically lies in the 0.1–5 MYA range (Sanmiguel et al.1998; Jing et al. 2005). One aim of the present study wasto compare SSAP-based diversity analysis with gene-based sequence diversity analysis, to see whether thesevery different genomic fractions produce similar or
different pictures of Pisum diversity. Such informationwould also provide pointers to an optimal way ofassessing diversity within Pisum and perhaps the othermajor inbreeding crop species with large, transposon-rich genomes such as wheat, barley, and rice. The othermain goal was to explore the variation in genic sequen-ces for Pisum and compare the contributions of re-combination and mutation to the evolution of itsgenetic diversity.
MATERIALS AND METHODS
Plant materials and DNA extraction: Forty-eight Pisumaccessions from the John Innes Pisum Collection (http://www.jic.ac.uk/germplas/pisum/) were selected (see supple-mental Table 1 at http://www.genetics.org/supplemental/).Forty-five of these are in a core set of 52 Pisum accessionschosen for our previous study of SSAP marker-based gene-tic diversity analysis (Vershinin et al. 2003). The three newP. sativum accessions ( JI15, JI281, and JI399) are the parentsof genetic mapping populations, providing polymorphismsthat would hopefully allow us to map the genes in this study,and the four samples missing from this study are P. abyssinicumaccessions that have been shown by extensive marker analysisto be almost identical to the single chosen P. abyssinicumaccession JI2385 (Vershinin et al. 2003). Each sample was theprogeny of a single selfed plant, to ensure homogeneity andderived from an inbred accession to ensure homozygosity.DNAs were extracted by the QIAGEN (Valencia, CA) DNeasy96 method.
PCR primers for amplification of gene loci: Primers usedfor gene segment amplification are shown in supplementalTable 2 at http://www.genetics.org/supplemental/. All pri-mers are derived from Pisum gene exon sequences, and allPCR amplicons contain at least one intron. Forty-two primerpairs were originally selected, 3 of which were discarded (datanot shown) because they produced mixed PCR products.
PCR amplification of pea gene-derived sequences: All PCRamplifications were carried out using a MJ Research PTC-225Tetrad Thermal Cycler. Twenty-five-microliter reactions con-tained the following: 30 ng of pea genomic DNA template,0.2 mm each of forward and reverse primer, 2.5 ml QIAGENHotStar 103 PCR buffer containing 15 mm MgCl2, 4 ml ofdNTPs (Roche 1250 mm), and 0.125 ml (0.625 units) Hot StarTaq DNA Polymerase (QIAGEN). Cycling conditions involvedan initial enzyme activation step for 15 min at 95�, followed by40 cycles of 94� for 1 min, 55� for 1 min and 72� for 1 min, witha final extension cycle of 72� for 7 min. Amplification productswere visualized by electrophoresis of 5 ml of PCR product on a1.5% agarose gel containing ethidium bromide. PCR productswere purified using NucleoFast 96 PCR plates (Macherey-Nagel). The PCR product yield was estimated by comparisonwith standard concentrations of l bacteriophage DNA usingagarose gel electrophoresis. Thirty-eight amplifications failedto produce a PCR product (2% of the complete set).
DNA sequencing: Sequencing PCR reactions used 0.33 mlBig Dye Terminator v3.1 Cycle Sequencing RR-100 (Perkin-Elmer, Norwalk, CT), 3.33 ml BetterBuffer (Web Scientific),0.44 mm primer, 6 ng template PCR DNA fragment in a finalvolume of 10 ml. Cycle conditions: Cycling conditions involved25 cycles of 96� for 30 sec, 50� for 15 sec, and 60� for 4 min withtemperature ramp rate of 1�/sec. Products were purifiedeither using genCLEAN plates (Genetix) or by ethanolprecipitation, as follows: 31 ml of a 0.1 m sodium acetate pH4.6 in 95% ethanol solution was added. This was allowed to
2264 R. Jing et al.D
ownloaded from
https://academic.oup.com
/genetics/article/177/4/2263/6064433 by guest on 12 March 2022
incubate for 15 min at room temperature, followed by a 4000rpm spin for 30 min in an Eppendorf 5810R plate centrifuge.Plates were inverted and spun at 700 rpm for 1 min. A total of150 ml 70% ethanol was added, and the plates were vortexedand incubated for 15 min before another spin at 4000 rpm for10 min. The ethanol wash step was then repeated to ensureefficient removal of unincorporated sequencing dye, andsamples were left to air dry for 20 min. Electrophoresis ofproducts from the sequencing reactions was carried out usingan ABI 3730 capillary sequencer.
DNA sequence analysis: The output sequence traces fromthe sequencer were pretrimmed using PHRED with a qualityscore of 13 or higher (Ewing et al. 1998; Ewing and Green
1998; http://www.phrap.com/phred/). Pretrimmed sequenceswere imported into Bioedit Sequence Alignment Editor(version 7.0.4.1; http://www.mbio.ncsu.edu/BioEdit/bioedit.html), and the sequences for each gene were aligned withClustalW (Thompsonet al. 1994). At this point all the sequencetraces were visually checked against the corresponding align-ment to identify regions of poor sequence quality leading toerrors in polymorphism assignment. This resulted in thediscarding of 3 complete alignments and 49 individual se-quences (2.6% of the remaining data set) due to unacceptablylow sequence quality. The alignments were then trimmed tothe lengths of the shortest members, and presumptive poly-morphisms were identified. To test the accuracy of polymorphismidentification a second, independent round of polymorphismsearching was performed. The sequence traces were importedinto Mutation Surveyor V3.01 (SoftGenetics LLC http://www.softgenetics.com/mutationSurveyor.html). This softwaredisplays polymorphisms in both graphical and tabular forms,linked to the sequence traces and with associated qualityscores. The Mutation Surveyor environment was used to crosscheck visually the sequence traces for all presumptive poly-morphisms identified in both searches in the completesequence set. For the remaining 39 alignments, 14 discrep-ancies between the two methods were identified out of 1021presumptive polymorphic sites in 13,503 bp (�0.1%). These14 discrepancies were all resolved after close inspection of thetraces.
DNA marker analysis and genetic linkage analysis: Singlenucleotide or insertion-deletion polymorphisms segregatingbetween sample JI399 and either or both of JI15 and JI281were identified in CLUSTALW sequence alignments. Allele-specific PCR marker primers are shown in supplemental Table3 at http://www.genetics.org/supplemental/. PCRs usingQIAGEN Hotstar Taq DNA polymerase contained 0.1 mm eachprimer, 20 ng template genomic DNA, and the followingprogram: 95� for 15 min, 40 cycles of 94� for 30 sec, 55� for30 sec, 72� for 30 sec followed by 72� for 7 min. For lociPis_GEN_27, Pis_GEN_28, and psat_EST_00176 the anneal-ing temperature was reduced to 51�. The resulting markerswere resolved by size difference on agarose gel electrophoresisby the MS-PCR method (Rust et al. 1993), the CEL Iendonuclease approach (Kulinski et al. 2000), and/or bythe tagged microarray (TAM) approach (Flavell et al. 2003;Jing et al. 2007). In the latter case e and g tags were appendedto X and Y tags (supplemental Table 3), respectively, byinclusion of TAM tag primers e-X (ACCGCATCCGAACATTTGTC½spacer C-18�CGTGCCGCAAGGACGGGC) and g-Y(GCCGATAATCACCTTGTCAC½spacer C-18�TATATTATGGGCCGCACTGACGGAC), and the e and g tags were detected bythe TAM approach. Markers were scored in either or bothrecombinant inbred line (RIL) mapping populations JI15 3JI399 and JI281 3 JI399 (Ellis et al. 1992). Loci Psat_EST_172,Psat_EST_185, Psat_EST_189, Psat_EST_191, Pis_GEN_15,and Pis_GEN_27 were scored by the CEL 1 approach (Kulinski
et al. 2000) in an attenuated RIL population of 16 and
positioned by matching scores to existing data in an Excelspread sheet.
Phylogenetic and diversity analysis: Combined trees for allgene introns were created using DNAdist ½neighbor joining(NJ)� and DNAml (maximum likelihood) in the Phylip pack-age (http://evolution.genetics.washington.edu/phylip.html)after concatenation of DNA sequence alignments createdusing ClustalW within the Bioedit package (http://www.mbio.ncsu.edu/BioEdit/bioedit.html). Individual gene trees wereconstructed in the same way using DNAdist. The SSAP tree wasa reanalysis of the data from Vershinin et al. (2003) based onDice coefficients, using the DARwin5 package (http://mendel.ethz.ch:8080/Darwin/) (Perrier et al. 2003). Where a se-quence was missing, a corresponding gap was inserted. Treeswere modified with TreeView v1.6.6 (http://taxonomy.zoology.gla.ac.uk/rod/treeview.html). Diversity data analysis (Table 1)was carried out using DnaSP v4.10 (http://www.ub.es/dnasp/).Distance matrices were obtained using DNAdist, and datamanipulations (Figures 4 and 5) were carried out in MicrosoftExcel spread sheets. Linkage disequilibrium analysis used theTASSEL (http://www.maizegenetics.net/tassel) (Bradbury
et al. 2007) and DNAsp packages.Putative recombination breakpoints within gene segments
were calculated from aligned single gene segment sequencesusing the TOPALi software (http://www.bioss.ac.uk/knowledge/topali/) (Milne et al. 2004) with the difference of squares(DSS) option. The statistical significance of DSS peaks, deter-mined by the f test (Bruen et al. 2006) within the TOPALipackage, was estimated with parametric bootstrapping. Net-work analysis of the combined aligned sequence set used thesplit decomposition approach in the software package SplitsTree4 (http://www-ab.informatik.uni-tuebingen.de/software/splitstree4/welcome.html) (Bandelt and Dress 1992; Bryant
and Moulton 2004; Huson and Bryant 2006). The statisticalf test (Bruen et al. 2006) was carried out within SplitsTree4.
RESULTS
To investigate gene-based diversity in pea we adopteda strategy of sequencing multiple gene regions in a set ofsamples that were selected to represent the full diversityof the genus Pisum (Table 1; supplemental Tables 1 and2). The Pisum sample set comprises 45 accessionsincluding 10 P. fulvum, 10 P. elatius, 2 P. humile, and 22P. sativum landraces and cultivars. This is a subset of acore set of 52 Pisum accessions used in a previous SSAPmarker-based genetic diversity study (Vershinin et al.2003), allowing us to compare the diversity patterns de-duced from the two experimental approaches. Addi-tionally, three cultivars ( JI15, JI281, and JI399) were alsoanalyzed because these are the parents of geneticmapping populations, to allow genetic mapping of theanalyzed genes.
Thirty-nine genes were analyzed, to both ensure againstbias associated with individual genes and to investigatethe partitioning of diversity in a variety of genomic sites.Five of these genes were selected because of theirsignificance in seed development and composition orplant architecture, and the rest were selected at randomfrom Pisum sequence databases. The PCR ampliconswere chosen to contain intron sequence, because of thehigher variation in such regions, and exon-derived PCR
Gene-Based Diversity Analysis of Pea 2265D
ownloaded from
https://academic.oup.com
/genetics/article/177/4/2263/6064433 by guest on 12 March 2022
TA
BL
E1
Div
ersi
typ
aram
eter
sfo
r3
9ge
ne
regi
on
sin
Pis
um
Gen
en
o.a
Pri
mer
pai
rn
ame
Gen
ean
no
tati
on
Seq
uen
cele
ngt
hN
o.
of
seq
uen
ces
No
.o
fp
oly
mo
rph
icsi
tes
Ind
els
Hap
loty
pes
Hap
loty
pe
div
ersi
tyD
iver
sity
pSD
pQ
w
1A
J418
375
Nor
kn
od
ula
tio
nfa
cto
rre
cep
tor
140
472
03
0.08
40.
0009
0.00
060.
0032
32
Psa
t_E
ST_1
90F
ibri
llin
325
434
05
0.44
50.
0029
0.00
060.
0056
43
Pis
_Gen
9F
ruct
ose
-1,6
-bis
ph
osp
hat
ase
gen
e27
547
122
100.
415
0.00
320.
0011
0.01
034
Psm
t_E
ST_2
01A
nio
nex
chan
gep
rote
infa
mil
y27
548
141
120.
499
0.00
370.
0001
0.01
151
5P
sat_
EST
_178
Acy
l-co
Ad
ehyd
roge
nas
e37
347
85
90.
775
0.00
420.
0005
0.00
652
6P
smt_
EST
_202
Un
nam
edp
rote
in(A
.th
alia
na)
218
476
27
0.49
40.
0044
0.00
10.
0064
77
Pis
_Gen
10sy
m29
gen
efo
rse
rin
e-th
reo
nin
ep
rote
inki
nas
e18
042
54
70.
623
0.00
520.
001
0.00
646
8P
smt_
EST
_200
Po
ly(A
)-b
ind
ing
pro
tein
314
478
47
0.51
00.
0053
0.00
120.
0129
79
X88
790
Gra
nu
le-b
ou
nd
star
chsy
nth
ase
406
4712
012
0.85
50.
0057
0.00
050.
0066
910
AF
0101
90P
isu
mU
nif
oli
ata
tran
scri
pti
on
fact
or
(Un
i)45
948
227
180.
866
0.00
610.
0007
0.01
109
11P
is_G
en14
Hsp
70ge
ne
for
hea
t-sh
ock
pro
tein
278
4713
114
0.64
10.
0061
0.00
130.
0107
12P
sat_
EST
_189
Pu
tati
veP
I/p
ho
sph
atid
ylch
oli
ne
tran
sfer
pro
tein
253
4411
411
0.80
90.
0062
0.00
080.
0101
13P
smt_
EST
_197
110
kDa
4SN
c-T
ud
or
do
mai
np
rote
in42
147
85
100.
803
0.00
630.
0006
0.00
642
14P
is_G
en28
Th
iore
do
xin
fge
ne,
com
ple
tecd
s.45
245
138
140.
838
0.00
690.
0006
0.00
859
15P
sat_
EST
_163
GT
Pas
eac
tiva
tin
gp
rote
in-li
ke45
446
246
190.
861
0.00
720.
0008
0.01
2516
Psa
t_E
ST_1
88P
uta
tive
pro
tein
115
4617
210
0.54
10.
0082
0.00
250.
0299
417
Psa
t_E
ST_1
71g-
Am
ino
bu
tyra
tetr
ansa
min
ase
sub
un
itp
recu
rso
ris
ozy
me
152
545
214
130.
778
0.00
830.
0011
0.00
951
18P
is_G
en15
1-am
ino
cycl
op
rop
ane-
1-ca
rbo
xyla
tesy
nth
ase
(AC
S1)
307
4524
616
0.71
40.
0086
0.00
154
0.01
823
19C
D85
9399
Cat
ion
icam
ino
acid
tran
spo
rter
-like
pro
tein
342
4821
317
0.85
40.
0089
0.00
070.
0145
620
Psa
t_E
ST_1
61P
uta
tive
dip
epti
dyl
pep
tid
ase
IV54
145
4010
150.
841
0.00
920.
0011
0.01
756
21P
is_G
en5
No
np
ho
sph
ory
lati
ng
GA
PD
Hge
ne
515
4640
725
0.90
20.
0095
0.00
10.
0179
22P
sat_
EST
_175
Un
nam
edp
rote
inp
rod
uct
(A.
thal
ian
a)14
146
82
100.
775
0.00
990.
001
0.01
291
23P
is_G
en7
Lh
cb3
gen
efo
rch
loro
ph
yll
a/b
-bin
din
gp
rote
in48
547
315
270.
918
0.01
010.
001
0.01
624
Psa
t_E
ST_1
72P
uta
tive
Tco
mp
lex
pro
tein
282
4525
1319
0.87
00.
0105
0.00
120.
0214
125
Psa
t_E
ST_1
79P
uta
tive
PST
Vd
RN
A-b
idin
gp
rote
in45
245
243
190.
884
0.01
090.
001
0.01
2226
Psm
t_E
ST_1
99A
t2g4
4950
(A.
thal
ian
a)38
342
338
160.
779
0.01
140.
0019
0.02
119
27P
is_G
en16
Gib
ber
elli
nc2
0-o
xid
ase
gen
e,co
mp
lete
cds
413
4833
1221
0.78
90.
0131
0.00
120.
0184
528
Psa
t_E
ST_1
62P
uta
tive
asp
arta
team
ino
tran
sfer
ase
185
4817
29
0.62
20.
0132
0.00
395
0.02
394
29P
sat_
EST
_165
Pu
tati
veam
idas
e22
148
181
130.
895
0.01
380.
0012
40.
0190
430
Psa
t_E
ST_1
76P
uta
tive
leu
kotr
ien
e-A
4h
ydro
lase
351
4638
322
0.90
80.
0138
0.00
160.
0255
131
Psa
t_E
ST_1
85P
uta
tive
pro
tein
294
4632
622
0.89
30.
0141
0.00
120.
0252
832
Pis
_Gen
27kd
sAge
ne
for
Kd
o-8
-ph
osp
hat
esy
nth
ase
319
3932
914
0.74
80.
0151
0.00
20.
0246
533
Psm
t_E
ST_2
03Si
mil
arto
absc
isic
acid
ind
uce
dp
rote
inh
om
olo
gue
283
4820
314
0.82
00.
0153
0.00
131
0.01
604
34P
smt_
EST
_198
Pu
tati
vean
ion
exch
ange
pro
tein
117
4610
210
0.66
90.
0165
0.00
110.
0203
235
Psa
t_E
ST_1
91tR
NA
pse
ud
ou
rid
ine
syn
thas
efa
mil
y53
847
382
200.
924
0.01
730.
0008
0.01
661
36A
J291
298
Pim
(Pea
m)
565
4754
1125
0.93
70.
0220
0.00
240.
0257
937
Pis
_Gen
12P
uta
tive
hem
eo
xyge
nas
e1
pre
curs
or
(HO
1)53
442
4611
130.
814
0.02
410.
001
0.02
44
38P
smt_
EST
_196
Cys
tath
ion
ine
gam
ma
syn
thas
e41
047
275
170.
891
0.02
600.
0012
0.02
5839
Pis
_Gen
8P
S-IA
A4/
5ge
ne
auxi
n-r
egu
late
dge
ne
295
4762
927
0.94
40.
0366
0.00
30.
0546
To
tal
13,4
361,
791
873
188
572
——
——
Mea
n34
546
225
150.
7494
0.01
080.
0012
0.01
64
aG
ene
ord
er,
by
incr
easi
ng
pva
lue,
asu
sed
inF
igu
re3.
2266 R. Jing et al.D
ownloaded from
https://academic.oup.com
/genetics/article/177/4/2263/6064433 by guest on 12 March 2022
primers were used because the primer sites are betterconserved, minimizing PCR failure and associated datalosses.
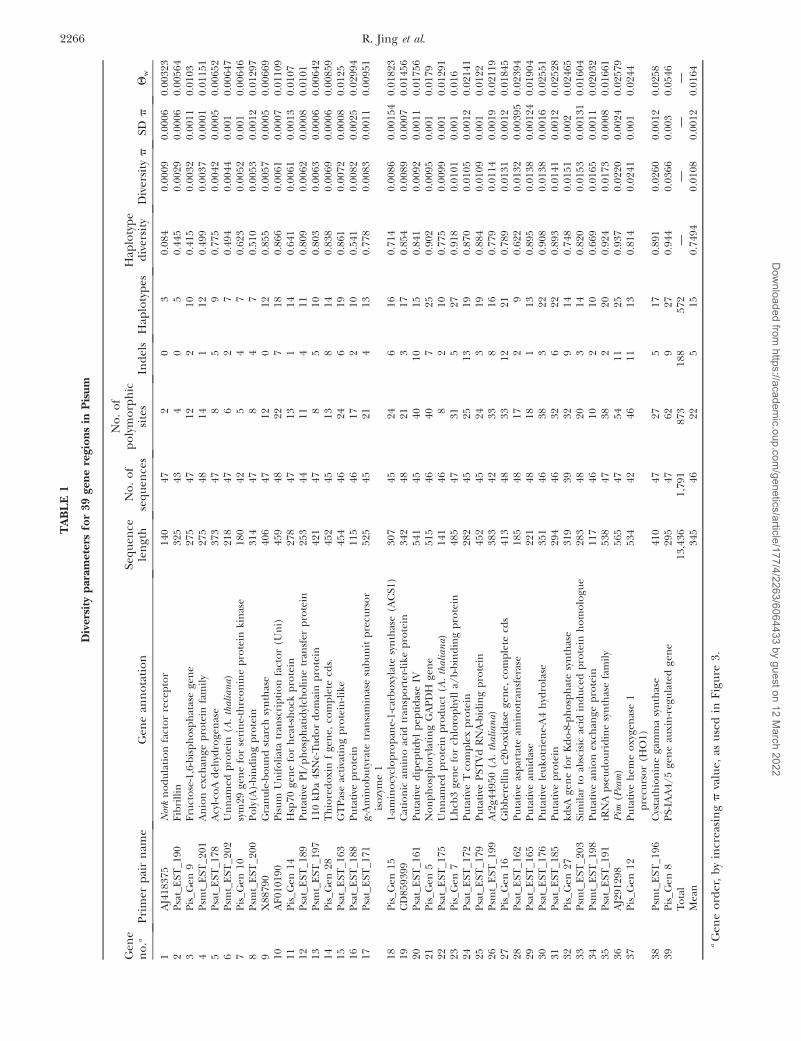
Gene sequence-based diversity in Pisum: Alignmentswere generated for each of the 39 gene segment se-quence sets. Nucleotide sequence diversity parameterswere then determined for each sequence set, aftertrimming to remove missing data (Table 1). The regionssequenced are in the range 115–565 bp, with an averageof 345 bp and a total aligned sequence set of 13,436 bpper sample. Haplotype diversity is high for most of theloci, averaging 0.749 (SD 0.184), with a notable excep-tion, AJ418375, encoding the Nork receptor-like kinaseinvolved in the early steps of nodulation signal trans-duction (Endre et al. 2002), with 0.084. The mean nu-cleotide diversity p varies over 40-fold, from 0.0009 forNork to 0.0366 for PS-1AA4/5 auxin-regulated gene,with a mean of 0.0108 (SD 0.0071), and Watterson’s Qw
(Watterson 1975), on the basis of the number of seg-regating sites in the sample, varies between 0.0032 forNork and 0.0546 for PS-1AA4/5. Overall, these data
reveal a high gene-based diversity of Pisum germplasmand show that this diversity is partitioned unevenlybetween genes. Tajima’s D values on all 39 sequencedloci (Tajima 1989) showed four with evidence for non-neutral evolution ½Pis_Gen 9, Pis_Gen 15, Psat_EST_188, and Psat_EST_201, with D values of �2.1714(P . 0.05), �1.8259 (P . 0.05), �2.258 (P . 0.01), and�2.088 (P . 0.05), respectively�.
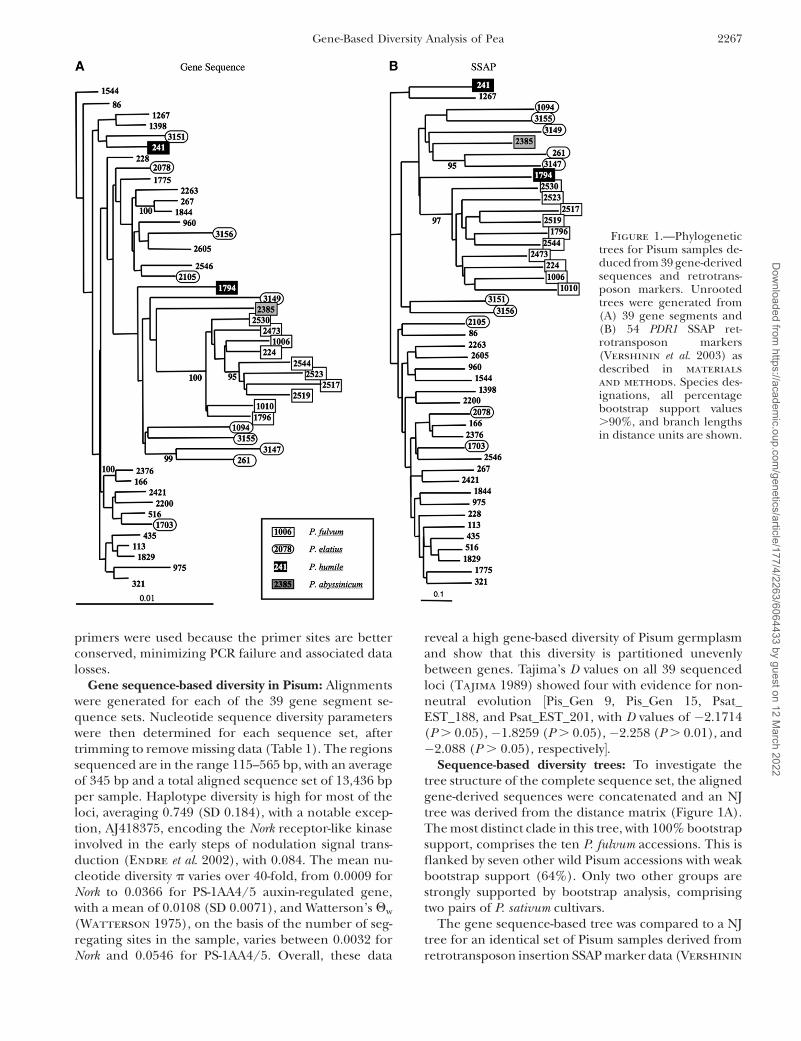
Sequence-based diversity trees: To investigate thetree structure of the complete sequence set, the alignedgene-derived sequences were concatenated and an NJtree was derived from the distance matrix (Figure 1A).The most distinct clade in this tree, with 100% bootstrapsupport, comprises the ten P. fulvum accessions. This isflanked by seven other wild Pisum accessions with weakbootstrap support (64%). Only two other groups arestrongly supported by bootstrap analysis, comprisingtwo pairs of P. sativum cultivars.
The gene sequence-based tree was compared to a NJtree for an identical set of Pisum samples derived fromretrotransposon insertion SSAP marker data (Vershinin
Figure 1.—Phylogenetictrees for Pisum samples de-duced from 39 gene-derivedsequences and retrotrans-poson markers. Unrootedtrees were generated from(A) 39 gene segments and(B) 54 PDR1 SSAP ret-rotransposon markers(Vershinin et al. 2003) asdescribed in materials
and methods. Species des-ignations, all percentagebootstrap support values.90%, and branch lengthsin distance units are shown.
Gene-Based Diversity Analysis of Pea 2267D
ownloaded from
https://academic.oup.com
/genetics/article/177/4/2263/6064433 by guest on 12 March 2022
et al. 2003; Figure 1B). The SSAP tree shares the deeperfeatures described above for the gene sequence tree,such as a well-supported P. fulvum clade, with the sameflanking set of seven wild Pisums. This broad agreementfor the deeper structure of the genetic diversity forPisum, involving most of the wild samples in this analysis,between two approaches that utilize very different frac-tions of the genome, suggests that both are giving anaccurate picture at this level.
Single locus diversity trees: Despite the similarities intree structure mentioned above, there is little detailedsimilarity between the two trees. Furthermore, the treesin Figure 1 tend toward a ‘‘star’’ phylogeny (i.e., the pres-
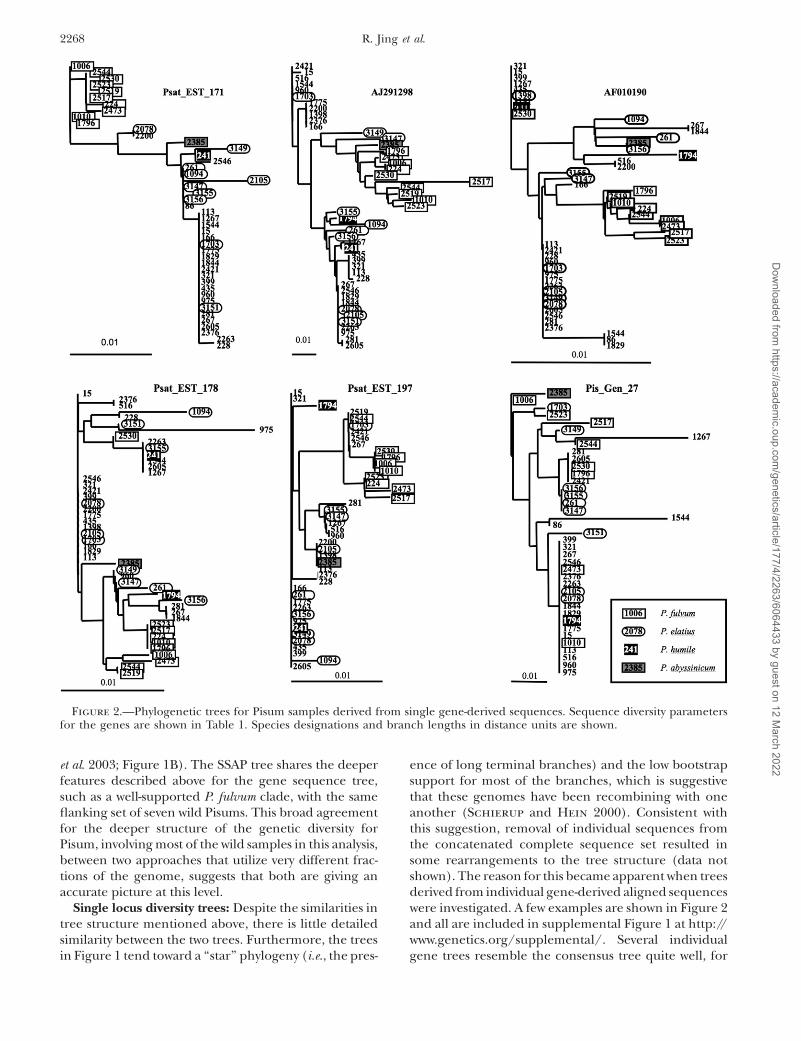
ence of long terminal branches) and the low bootstrapsupport for most of the branches, which is suggestivethat these genomes have been recombining with oneanother (Schierup and Hein 2000). Consistent withthis suggestion, removal of individual sequences fromthe concatenated complete sequence set resulted insome rearrangements to the tree structure (data notshown). The reason for this became apparent when treesderived from individual gene-derived aligned sequenceswere investigated. A few examples are shown in Figure 2and all are included in supplemental Figure 1 at http://www.genetics.org/supplemental/. Several individualgene trees resemble the consensus tree quite well, for
Figure 2.—Phylogenetic trees for Pisum samples derived from single gene-derived sequences. Sequence diversity parametersfor the genes are shown in Table 1. Species designations and branch lengths in distance units are shown.
2268 R. Jing et al.D
ownloaded from
https://academic.oup.com
/genetics/article/177/4/2263/6064433 by guest on 12 March 2022
example both Psat_EST 171 and AJ291298 show closegrouping for all P. fulvum samples, with some membersof the intermediate group of seven wild Pisum, men-tioned above, nearby. However, many trees show struc-tures that depart from this. For example, the AF010190and Psat_EST_178 sequence trees split one of the P.fulvum samples, JI2530, from the other nine, and for PisGen 27 P. fulvum is widely distributed across the tree.Thus, the phylogeny inferred from these data dependsvery much on which gene is used.
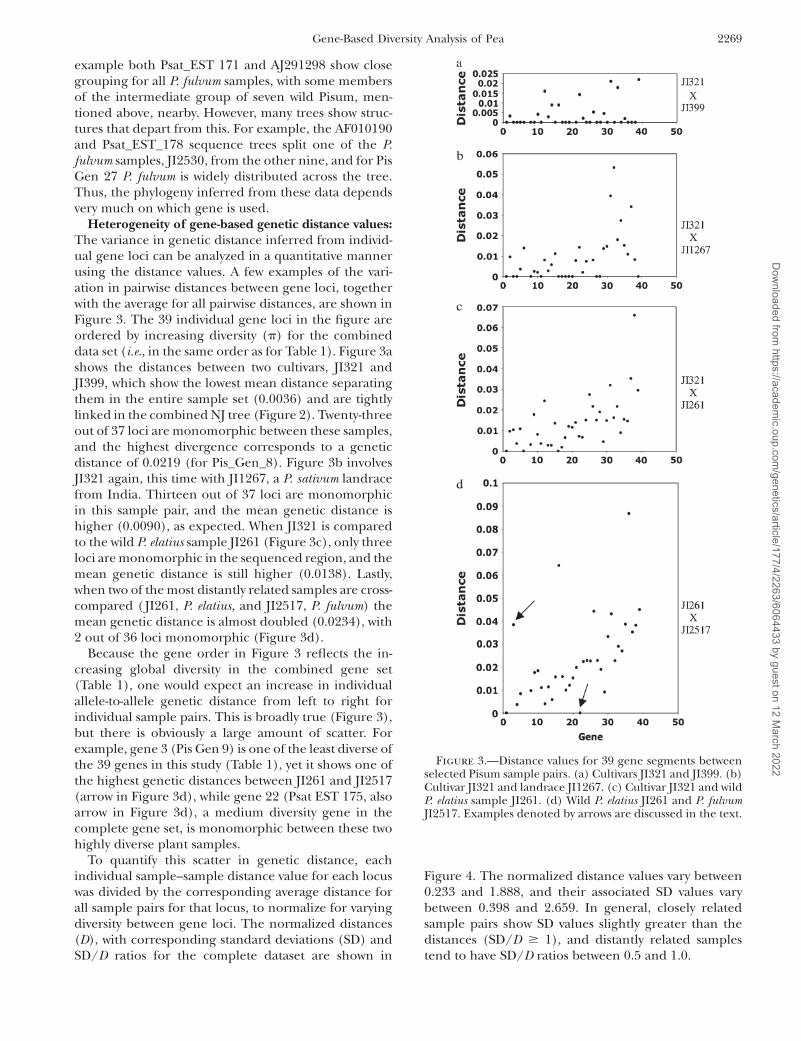
Heterogeneity of gene-based genetic distance values:The variance in genetic distance inferred from individ-ual gene loci can be analyzed in a quantitative mannerusing the distance values. A few examples of the vari-ation in pairwise distances between gene loci, togetherwith the average for all pairwise distances, are shown inFigure 3. The 39 individual gene loci in the figure areordered by increasing diversity (p) for the combineddata set (i.e., in the same order as for Table 1). Figure 3ashows the distances between two cultivars, JI321 andJI399, which show the lowest mean distance separatingthem in the entire sample set (0.0036) and are tightlylinked in the combined NJ tree (Figure 2). Twenty-threeout of 37 loci are monomorphic between these samples,and the highest divergence corresponds to a geneticdistance of 0.0219 (for Pis_Gen_8). Figure 3b involvesJI321 again, this time with JI1267, a P. sativum landracefrom India. Thirteen out of 37 loci are monomorphicin this sample pair, and the mean genetic distance ishigher (0.0090), as expected. When JI321 is comparedto the wild P. elatius sample JI261 (Figure 3c), only threeloci are monomorphic in the sequenced region, and themean genetic distance is still higher (0.0138). Lastly,when two of the most distantly related samples are cross-compared ( JI261, P. elatius, and JI2517, P. fulvum) themean genetic distance is almost doubled (0.0234), with2 out of 36 loci monomorphic (Figure 3d).
Because the gene order in Figure 3 reflects the in-creasing global diversity in the combined gene set(Table 1), one would expect an increase in individualallele-to-allele genetic distance from left to right forindividual sample pairs. This is broadly true (Figure 3),but there is obviously a large amount of scatter. Forexample, gene 3 (Pis Gen 9) is one of the least diverse ofthe 39 genes in this study (Table 1), yet it shows one ofthe highest genetic distances between JI261 and JI2517(arrow in Figure 3d), while gene 22 (Psat EST 175, alsoarrow in Figure 3d), a medium diversity gene in thecomplete gene set, is monomorphic between these twohighly diverse plant samples.
To quantify this scatter in genetic distance, eachindividual sample–sample distance value for each locuswas divided by the corresponding average distance forall sample pairs for that locus, to normalize for varyingdiversity between gene loci. The normalized distances(D), with corresponding standard deviations (SD) andSD/D ratios for the complete dataset are shown in
Figure 4. The normalized distance values vary between0.233 and 1.888, and their associated SD values varybetween 0.398 and 2.659. In general, closely relatedsample pairs show SD values slightly greater than thedistances (SD/D $ 1), and distantly related samplestend to have SD/D ratios between 0.5 and 1.0.
Figure 3.—Distance values for 39 gene segments betweenselected Pisum sample pairs. (a) Cultivars JI321 and JI399. (b)Cultivar JI321 and landrace JI1267. (c) Cultivar JI321 and wildP. elatius sample JI261. (d) Wild P. elatius JI261 and P. fulvumJI2517. Examples denoted by arrows are discussed in the text.
Gene-Based Diversity Analysis of Pea 2269D
ownloaded from
https://academic.oup.com
/genetics/article/177/4/2263/6064433 by guest on 12 March 2022
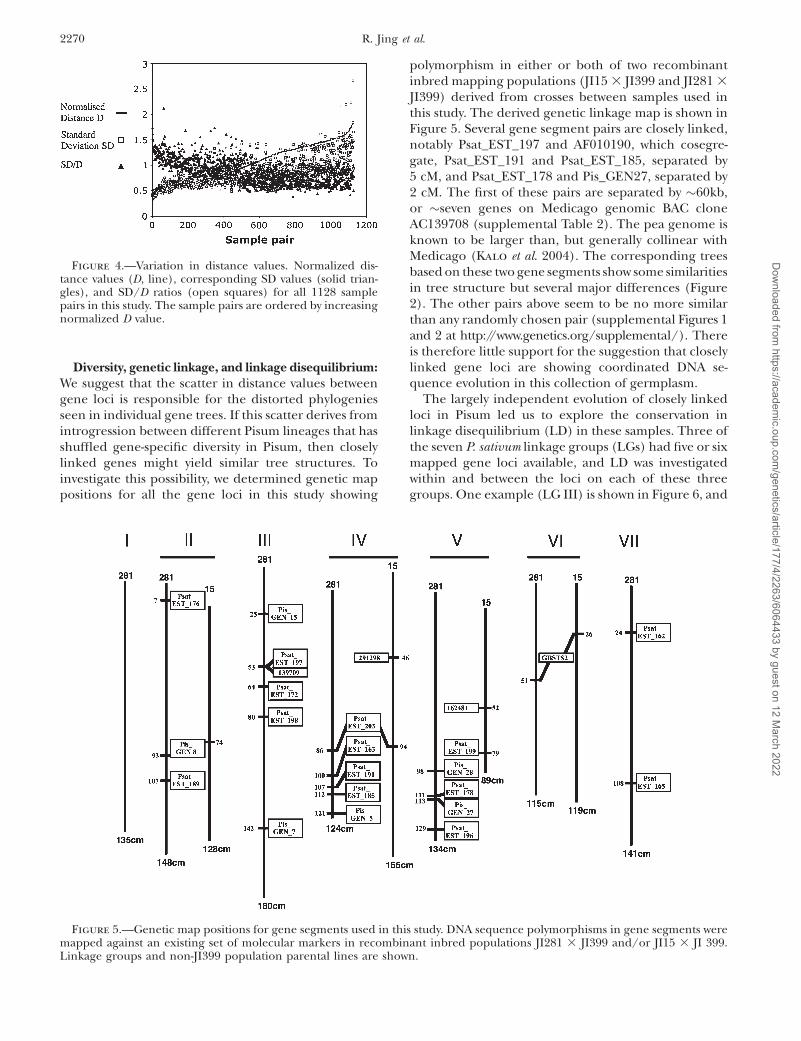
Diversity, genetic linkage, and linkage disequilibrium:We suggest that the scatter in distance values betweengene loci is responsible for the distorted phylogeniesseen in individual gene trees. If this scatter derives fromintrogression between different Pisum lineages that hasshuffled gene-specific diversity in Pisum, then closelylinked genes might yield similar tree structures. Toinvestigate this possibility, we determined genetic mappositions for all the gene loci in this study showing
polymorphism in either or both of two recombinantinbred mapping populations (JI15 3 JI399 and JI281 3
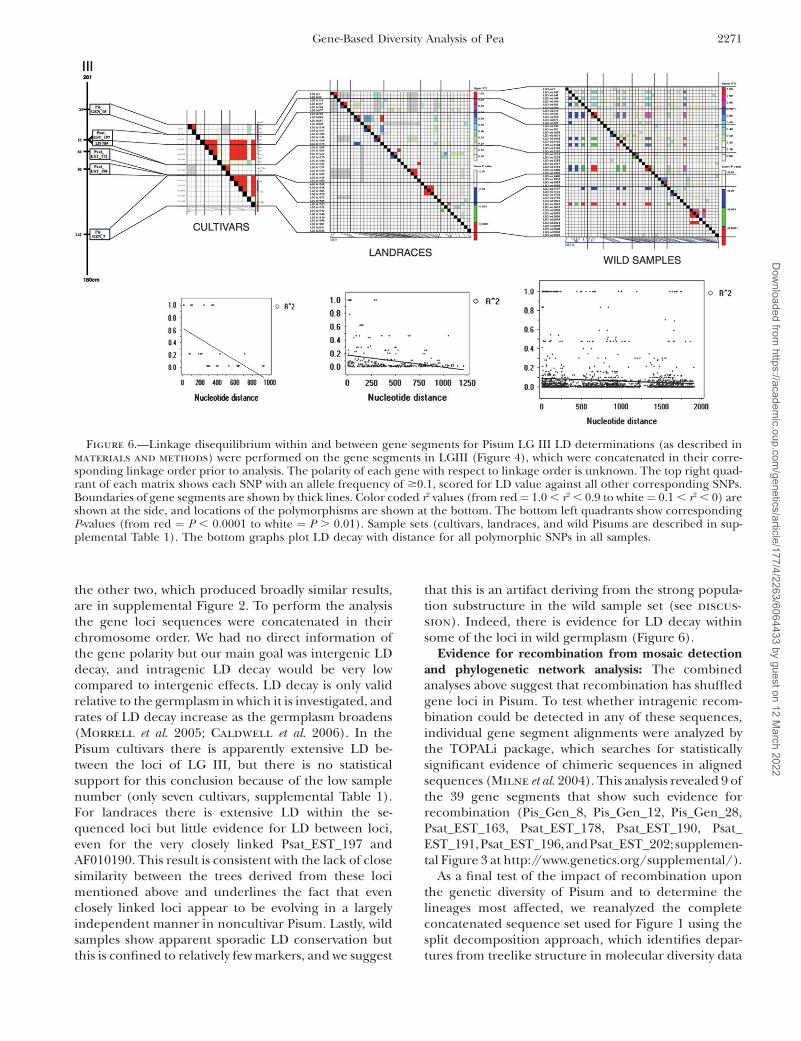
JI399) derived from crosses between samples used inthis study. The derived genetic linkage map is shown inFigure 5. Several gene segment pairs are closely linked,notably Psat_EST_197 and AF010190, which cosegre-gate, Psat_EST_191 and Psat_EST_185, separated by5 cM, and Psat_EST_178 and Pis_GEN27, separated by2 cM. The first of these pairs are separated by �60kb,or �seven genes on Medicago genomic BAC cloneAC139708 (supplemental Table 2). The pea genome isknown to be larger than, but generally collinear withMedicago (Kalo et al. 2004). The corresponding treesbased on these two gene segments show some similaritiesin tree structure but several major differences (Figure2). The other pairs above seem to be no more similarthan any randomly chosen pair (supplemental Figures 1and 2 at http://www.genetics.org/supplemental/). Thereis therefore little support for the suggestion that closelylinked gene loci are showing coordinated DNA se-quence evolution in this collection of germplasm.
The largely independent evolution of closely linkedloci in Pisum led us to explore the conservation inlinkage disequilibrium (LD) in these samples. Three ofthe seven P. sativum linkage groups (LGs) had five or sixmapped gene loci available, and LD was investigatedwithin and between the loci on each of these threegroups. One example (LG III) is shown in Figure 6, and
Figure 4.—Variation in distance values. Normalized dis-tance values (D, line), corresponding SD values (solid trian-gles), and SD/D ratios (open squares) for all 1128 samplepairs in this study. The sample pairs are ordered by increasingnormalized D value.
Figure 5.—Genetic map positions for gene segments used in this study. DNA sequence polymorphisms in gene segments weremapped against an existing set of molecular markers in recombinant inbred populations JI281 3 JI399 and/or JI15 3 JI 399.Linkage groups and non-JI399 population parental lines are shown.
2270 R. Jing et al.D
ownloaded from
https://academic.oup.com
/genetics/article/177/4/2263/6064433 by guest on 12 March 2022
the other two, which produced broadly similar results,are in supplemental Figure 2. To perform the analysisthe gene loci sequences were concatenated in theirchromosome order. We had no direct information ofthe gene polarity but our main goal was intergenic LDdecay, and intragenic LD decay would be very lowcompared to intergenic effects. LD decay is only validrelative to the germplasm in which it is investigated, andrates of LD decay increase as the germplasm broadens(Morrell et al. 2005; Caldwell et al. 2006). In thePisum cultivars there is apparently extensive LD be-tween the loci of LG III, but there is no statisticalsupport for this conclusion because of the low samplenumber (only seven cultivars, supplemental Table 1).For landraces there is extensive LD within the se-quenced loci but little evidence for LD between loci,even for the very closely linked Psat_EST_197 andAF010190. This result is consistent with the lack of closesimilarity between the trees derived from these locimentioned above and underlines the fact that evenclosely linked loci appear to be evolving in a largelyindependent manner in noncultivar Pisum. Lastly, wildsamples show apparent sporadic LD conservation butthis is confined to relatively few markers, and we suggest
that this is an artifact deriving from the strong popula-tion substructure in the wild sample set (see discus-
sion). Indeed, there is evidence for LD decay withinsome of the loci in wild germplasm (Figure 6).
Evidence for recombination from mosaic detectionand phylogenetic network analysis: The combinedanalyses above suggest that recombination has shuffledgene loci in Pisum. To test whether intragenic recom-bination could be detected in any of these sequences,individual gene segment alignments were analyzed bythe TOPALi package, which searches for statisticallysignificant evidence of chimeric sequences in alignedsequences (Milne et al. 2004). This analysis revealed 9 ofthe 39 gene segments that show such evidence forrecombination (Pis_Gen_8, Pis_Gen_12, Pis_Gen_28,Psat_EST_163, Psat_EST_178, Psat_EST_190, Psat_EST_191,Psat_EST_196,andPsat_EST_202; supplemen-tal Figure 3 at http://www.genetics.org/supplemental/).
As a final test of the impact of recombination uponthe genetic diversity of Pisum and to determine thelineages most affected, we reanalyzed the completeconcatenated sequence set used for Figure 1 using thesplit decomposition approach, which identifies depar-tures from treelike structure in molecular diversity data
Figure 6.—Linkage disequilibrium within and between gene segments for Pisum LG III LD determinations (as described inmaterials and methods) were performed on the gene segments in LGIII (Figure 4), which were concatenated in their corre-sponding linkage order prior to analysis. The polarity of each gene with respect to linkage order is unknown. The top right quad-rant of each matrix shows each SNP with an allele frequency of $0.1, scored for LD value against all other corresponding SNPs.Boundaries of gene segments are shown by thick lines. Color coded r2 values (from red¼ 1.0 , r2 , 0.9 to white¼ 0.1 , r2 , 0) areshown at the side, and locations of the polymorphisms are shown at the bottom. The bottom left quadrants show correspondingP-values (from red ¼ P , 0.0001 to white ¼ P . 0.01). Sample sets (cultivars, landraces, and wild Pisums are described in sup-plemental Table 1). The bottom graphs plot LD decay with distance for all polymorphic SNPs in all samples.
Gene-Based Diversity Analysis of Pea 2271D
ownloaded from
https://academic.oup.com
/genetics/article/177/4/2263/6064433 by guest on 12 March 2022
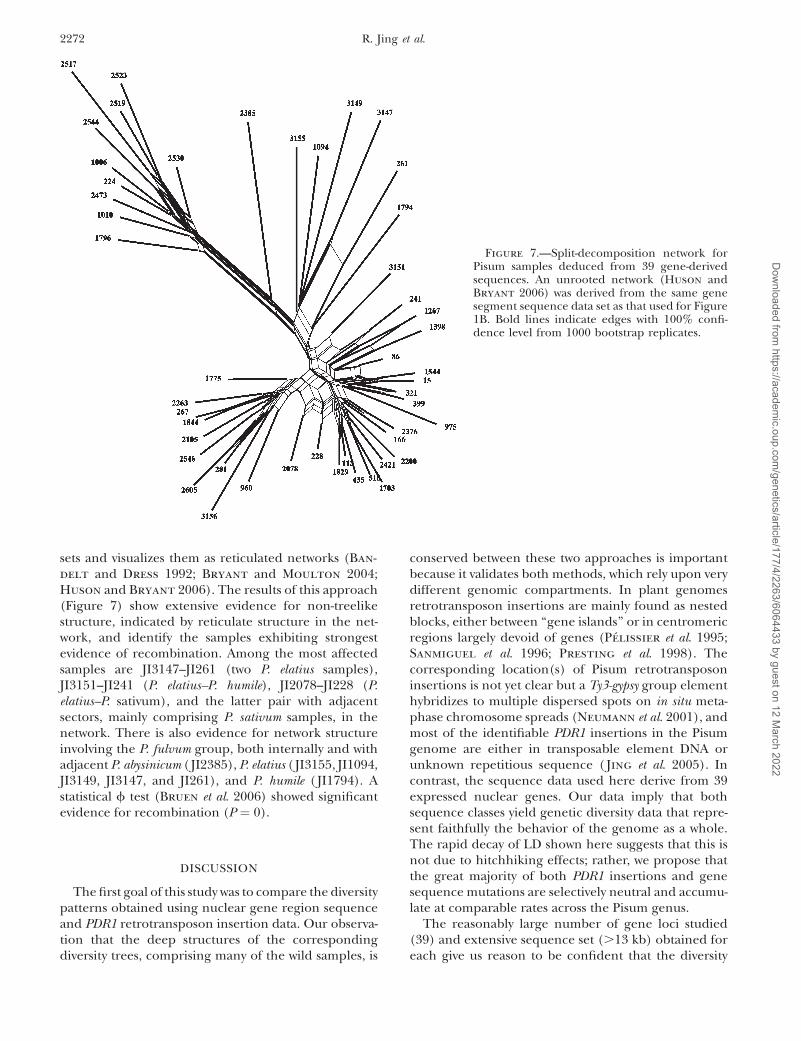
sets and visualizes them as reticulated networks (Ban-
delt and Dress 1992; Bryant and Moulton 2004;Huson and Bryant 2006). The results of this approach(Figure 7) show extensive evidence for non-treelikestructure, indicated by reticulate structure in the net-work, and identify the samples exhibiting strongestevidence of recombination. Among the most affectedsamples are JI3147–JI261 (two P. elatius samples),JI3151–JI241 (P. elatius–P. humile), JI2078–JI228 (P.elatius–P. sativum), and the latter pair with adjacentsectors, mainly comprising P. sativum samples, in thenetwork. There is also evidence for network structureinvolving the P. fulvum group, both internally and withadjacent P. abysinicum ( JI2385), P. elatius ( JI3155, JI1094,JI3149, JI3147, and JI261), and P. humile ( JI1794). Astatistical f test (Bruen et al. 2006) showed significantevidence for recombination (P ¼ 0).
DISCUSSION
The first goal of this study was to compare the diversitypatterns obtained using nuclear gene region sequenceand PDR1 retrotransposon insertion data. Our observa-tion that the deep structures of the correspondingdiversity trees, comprising many of the wild samples, is
conserved between these two approaches is importantbecause it validates both methods, which rely upon verydifferent genomic compartments. In plant genomesretrotransposon insertions are mainly found as nestedblocks, either between ‘‘gene islands’’ or in centromericregions largely devoid of genes (Pelissier et al. 1995;Sanmiguel et al. 1996; Presting et al. 1998). Thecorresponding location(s) of Pisum retrotransposoninsertions is not yet clear but a Ty3-gypsy group elementhybridizes to multiple dispersed spots on in situ meta-phase chromosome spreads (Neumann et al. 2001), andmost of the identifiable PDR1 insertions in the Pisumgenome are either in transposable element DNA orunknown repetitious sequence ( Jing et al. 2005). Incontrast, the sequence data used here derive from 39expressed nuclear genes. Our data imply that bothsequence classes yield genetic diversity data that repre-sent faithfully the behavior of the genome as a whole.The rapid decay of LD shown here suggests that this isnot due to hitchhiking effects; rather, we propose thatthe great majority of both PDR1 insertions and genesequence mutations are selectively neutral and accumu-late at comparable rates across the Pisum genus.
The reasonably large number of gene loci studied(39) and extensive sequence set (.13 kb) obtained foreach give us reason to be confident that the diversity
Figure 7.—Split-decomposition network forPisum samples deduced from 39 gene-derivedsequences. An unrooted network (Huson andBryant 2006) was derived from the same genesegment sequence data set as that used for Figure1B. Bold lines indicate edges with 100% confi-dence level from 1000 bootstrap replicates.
2272 R. Jing et al.D
ownloaded from
https://academic.oup.com
/genetics/article/177/4/2263/6064433 by guest on 12 March 2022
picture obtained for this well-studied Pisum sample setis an accurate one. DNA sequence of genes shouldreveal deeper evolutionary relationships than retro-transposon insertions, because its rate of evolution(�10�8– 10�10 mutations site�1 yr�1) is orders of magni-tude lower than the estimated transposition rate ofPDR1 of 5 3 10�7 insertions element�1 yr�1 ( Jing et al.2005).
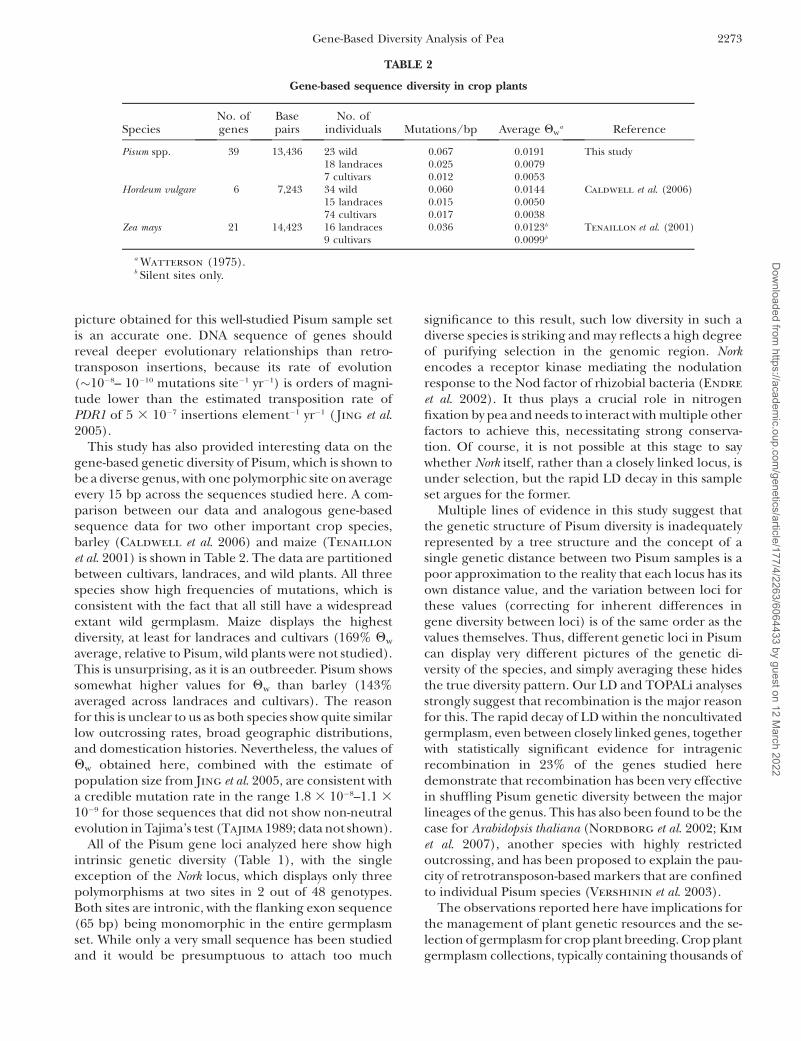
This study has also provided interesting data on thegene-based genetic diversity of Pisum, which is shown tobe a diverse genus, with one polymorphic site on averageevery 15 bp across the sequences studied here. A com-parison between our data and analogous gene-basedsequence data for two other important crop species,barley (Caldwell et al. 2006) and maize (Tenaillon
et al. 2001) is shown in Table 2. The data are partitionedbetween cultivars, landraces, and wild plants. All threespecies show high frequencies of mutations, which isconsistent with the fact that all still have a widespreadextant wild germplasm. Maize displays the highestdiversity, at least for landraces and cultivars (169% Qw
average, relative to Pisum, wild plants were not studied).This is unsurprising, as it is an outbreeder. Pisum showssomewhat higher values for Qw than barley (143%averaged across landraces and cultivars). The reasonfor this is unclear to us as both species show quite similarlow outcrossing rates, broad geographic distributions,and domestication histories. Nevertheless, the values ofQw obtained here, combined with the estimate ofpopulation size from Jing et al. 2005, are consistent witha credible mutation rate in the range 1.8 3 10�8–1.1 3
10�9 for those sequences that did not show non-neutralevolution in Tajima’s test (Tajima 1989; data not shown).
All of the Pisum gene loci analyzed here show highintrinsic genetic diversity (Table 1), with the singleexception of the Nork locus, which displays only threepolymorphisms at two sites in 2 out of 48 genotypes.Both sites are intronic, with the flanking exon sequence(65 bp) being monomorphic in the entire germplasmset. While only a very small sequence has been studiedand it would be presumptuous to attach too much
significance to this result, such low diversity in such adiverse species is striking and may reflects a high degreeof purifying selection in the genomic region. Norkencodes a receptor kinase mediating the nodulationresponse to the Nod factor of rhizobial bacteria (Endre
et al. 2002). It thus plays a crucial role in nitrogenfixation by pea and needs to interact with multiple otherfactors to achieve this, necessitating strong conserva-tion. Of course, it is not possible at this stage to saywhether Nork itself, rather than a closely linked locus, isunder selection, but the rapid LD decay in this sampleset argues for the former.
Multiple lines of evidence in this study suggest thatthe genetic structure of Pisum diversity is inadequatelyrepresented by a tree structure and the concept of asingle genetic distance between two Pisum samples is apoor approximation to the reality that each locus has itsown distance value, and the variation between loci forthese values (correcting for inherent differences ingene diversity between loci) is of the same order as thevalues themselves. Thus, different genetic loci in Pisumcan display very different pictures of the genetic di-versity of the species, and simply averaging these hidesthe true diversity pattern. Our LD and TOPALi analysesstrongly suggest that recombination is the major reasonfor this. The rapid decay of LD within the noncultivatedgermplasm, even between closely linked genes, togetherwith statistically significant evidence for intragenicrecombination in 23% of the genes studied heredemonstrate that recombination has been very effectivein shuffling Pisum genetic diversity between the majorlineages of the genus. This has also been found to be thecase for Arabidopsis thaliana (Nordborg et al. 2002; Kim
et al. 2007), another species with highly restrictedoutcrossing, and has been proposed to explain the pau-city of retrotransposon-based markers that are confinedto individual Pisum species (Vershinin et al. 2003).
The observations reported here have implications forthe management of plant genetic resources and the se-lection of germplasm for crop plant breeding. Crop plantgermplasm collections, typically containing thousands of
TABLE 2
Gene-based sequence diversity in crop plants
SpeciesNo. ofgenes
Basepairs
No. ofindividuals Mutations/bp Average Qw
a Reference
Pisum spp. 39 13,436 23 wild 0.067 0.0191 This study18 landraces 0.025 0.00797 cultivars 0.012 0.0053
Hordeum vulgare 6 7,243 34 wild 0.060 0.0144 Caldwell et al. (2006)15 landraces 0.015 0.005074 cultivars 0.017 0.0038
Zea mays 21 14,423 16 landraces 0.036 0.0123b Tenaillon et al. (2001)9 cultivars 0.0099b
a Watterson (1975).b Silent sites only.
Gene-Based Diversity Analysis of Pea 2273D
ownloaded from
https://academic.oup.com
/genetics/article/177/4/2263/6064433 by guest on 12 March 2022
wild, landrace, and cultivated samples, are seen as apowerful resource for the introduction of new geneallele combinations into cultivated germplasm. Theglobal diversity of such collections is often representedin a tree format, which is used for selecting samplesubsets (core collections) for further exploration orexploitation. This way of representing genetic diversityis shown here to be a potentially error-ridden process.Sample pairs that are very closely related by globaldiversity analysis may nevertheless carry many distantlyrelated gene alleles and distantly related samples, evenincluding samples supposedly from different species,and carry many identical gene alleles. At the momentsuch discrepancies cannot be predicted and this worksuggests that fine structure haplotype analysis of germ-plasm collections will be required to provide thesolution to this problem. Unfortunately, our LD dataindicate that this will be difficult to achieve in un-cultivated Pisum germplasm, which carries the greatestwealth of unexplored alleles needed for future cropimprovement, because the high rate of LD decay in suchgermplasm will necessitate a correspondingly detaileddefinition of the fine structure of haplotype diversitydown to the gene level.
We thank Linda Milne for substantial bioinformatics help, DavidMarshall, Jo Dicks, Robbie Waugh for many interesting discussions andcomments, and finally Deborah Charlesworth for many constructivecriticisms of this work. This work was supported by grant FP6-2002-FOOD-1-506223 (Grain Legumes Integrated Project) from the Euro-pean Commission (EC) under the EC Framework program VI.
LITERATURE CITED
Bandelt, H. J., and A. W. Dress, 1992 Split decomposition: a newand useful approach to phylogenetic analysis of distance data.Mol. Phylogenet. Evol. 1: 242–252.
Baranger, A., G. Aubert, G. Arnau, A. L. Laine, G. Deniot et al.,2004 Genetic diversity within Pisum sativum using protein-and PCR-based markers. Theor. Appl. Genet. 108: 1309–1321.
Blixt, S., 1972 Mutation genetics in Pisum. Agri. Hort. Genet. 30: 1–293.
Bradbury, P. J., Z. Zhang, D. E. Kroon, T. M. Casstevens, Y. Ram-Doss et al., 2007 TASSEL: software for association mapping ofcomplex traits in diverse samples. Bioinformatics 23: 2633–2635.
Bruen, T. C., H. Philippe and D. Bryant, 2006 A simple and robuststatistical test for detecting the presence of recombination. Ge-netics 172: 2665–2681.
Bryant, D., and V. Moulton, 2004 Neighbor-Net: an agglomerativemethod for the construction of phylogenetic networks. Mol. Biol.Evol. 21: 255–265.
Caldwell, K. S., J. Russell, P. Langridge and W. Powell,2006 Extreme population-dependent linkage disequilibriumdetected in an inbreeding plant species, Hordeum vulgare. Genetics172: 557–567.
Clement, S. L., D. C. Hardie and L. R. Elberson, 2002 Variationamong accessions of Pisum fulvum for resistance to Pea Weevil.Crop Sci. 42: 2167–2173.
Ellis, T. H. N., L. Turner, R. P. Hellens, D. Lee, C. L. Harker et al.,1992 Linkage maps in pea. Genetics 130: 649–663.
Endre, G., A. Kereszt, Z. Kevei, P. Kalo and G. B. Kiss, 2002 A re-ceptor kinase gene regulating symbiotic nodule development.Nature 417: 962–966.
Ewing, B., and P. Green, 1998 Basecalling of automated sequencertraces using phred.: II. Error probabilities. Genome Res. 8: 186–194.
Ewing, B., L. Hillier, M. Wendl and P. Green, 1998 Basecalling ofautomated sequencer traces using phred: I. Accuracy assessment.Genome Res. 8: 175–185.
Flavell, A. J., V. N. Bolshakov, A. Booth, A. R. Jing, J. Russell
et al., 2003 A microarray-based high throughput molecularmarker genotyping method—the tagged microarray marker(TAM) approach. Nucleic Acids Res. 31: e115.
Forster, C., H. North, N. Afzal, C. Domone, A. Hornostaj et al.,1999 Molecular analysis of a null mutant for pea (Pisum sativumL.) seed lipoxygenase-2. Plant Mol. Biol. 39: 1209–1220.
Hudson, R. R., 1983 Properties of a neutral allele model with intra-genic recombination. Theor. Popul. Biol. 23: 183–201.
Huson, D. H., and D. Bryant, 2006 Application of phylogeneticnetworks in evolutionary studies. Mol. Biol. Evol. 23: 254–267.
Jing, R., M. R. Knox, J. M. Lee, A. V. Vershinin, M. J. Ambrose et al.,2005 Insertional polymorphism and antiquity of PDR1 retro-transposon insertions in Pisum species. Genetics 171: 741–752.
Jing, R., V. I. Bolshakov and A. J. Flavell, 2007 The tagged micro-array marker (TAM) method for high throughput detection ofsingle nucleotide and indel polymorphisms. Nat. Protoc. 2: 168–177.
Kalo, P., A. Seres, A. Taylor, J. Jakab, Z. Kevei et al.,2004 Comparative mapping between Medicago sativa and Pisumsativum Mol. Gen. Genomics 272: 235–246.
Kim, S., V. Plagnol, T. T. Hu, C. Toomajian, C. Clark et al.,2007 Recombination and linkage disequilibrium in Arabidopsisthaliana. Nature Genet. 39: 1151–1155.
Kulinski, J., D. Besack, C. A. Oleykowski, A. K. Godwin and A. T.Yeung, 2000 The CEL I enzymatic mutation detection assay.BioTechniques 29: 44–48.
Maddison, W. P., 1995 Phylogenetic histories within and amongspecies, pp. 273–287 in Experimental and Molecular Approaches toPlant Biosystematics, edited by P. C. Hoch and A. G. Stevenson.Monographs in Systematics, Missouri Botanical Garden, St. Louis.
Milne, I, F. Wright, G. Row, D. F. Marshal, D. Husmeier et al.,2004 TOPALi: software for automatic identification of recombi-nant sequences within DNA multiple alignments. Bioinformatics20: 1806–1807.
Mithen, S., 2003 After the Ice: A Global Human History 20,000–5,000BC. Weidenfield & Nicholson, London.
Morrell, P. L., D. M. Toleno, K. E. Lundy and M. T. Clegg,2005 Low levels of linkage disequilibrium in wild barley(Hordeum vulgare ssp. spontaneum) despite high rates of self-fertilization. Proc. Natl. Acad. Sci. USA 102: 2442–2447.
Neumann, P., M. Nouzova and J. Macas, 2001 Molecular andcytogenetic analysis of repetitive DNA in pea (Pisum sativumL.). Genome 44: 716–728.
Nordborg, M., J. O. Borevitz, J. Bergelson, C. C. Berry, J. Chory
et al., 2002 The extent of linkage disequilibrium in Arabidopsisthaliana. Nature Genet. 30: 190–193.
Ochatt, S. J., A. Benabdelmouna, P. Marget, G. Aubert, F. Moussy
et al., 2004 Overcoming hybridization barriers between pea andsome of its wild relatives. Euphytica 137: 353–359.
Pelissier, T., S. Tutois, J.-M. Deragon, S. Tourmente, S. Genestier
et al., 1995 Athila, a new retroelement from Arabidopsis thaliana.Plant Mol. Biol. 29: 441–452.
Perrier, X., A. Flori and F. Bonnot, 2003 Data analysis methods,pp 43–76 in Genetic Diversity of Cultivated Tropical Plants, edited byP. Hamon, M. Seguin, X. Perrier and J. C. Glaszmann. CIRAD/Science, Montpellier, France.
Presting, G. G., L. Malysheva, J. Fuchs and I. Schubert, 1998 ATY3/GYPSY retrotransposon-like sequence localises to the cen-tromeric regions of cereal chromosomes. Plant J. 16: 721–728.
Rust, S., H. Funke and G. Assman, 1993 Mutagenically-separatedPCR (MS-PCR): a highly specific one step procedure for easy mu-tation detection. Nucleic Acids Res. 21: 3623–3629.
Sanmiguel, P., A. Tikhonov, Y-K. Jin, N. Motchoulskaia, D.Zakharov et al., 1996 Nested retrotransposons in the inter-genic regions of the maize genome. Science 274: 765–768.
Sanmiguel, P., B. S. Gaut, A. Tikhonov, Y. Nakijama and J. L.Bennetzen, 1998 The paleontology of intergene retrotranspo-sons of maize. Nat. Genet. 20: 43–45.
Schierup, M. H., and J. Hein, 2000 Consequences of recombina-tion on traditional phylogenetic analysis. Genetics 156: 879–891.
Tajima, F., 1989 Statistical methods to test for nucleotide mutationhypothesis by DNA polymorphism. Genetics 123: 585–595.
2274 R. Jing et al.D
ownloaded from
https://academic.oup.com
/genetics/article/177/4/2263/6064433 by guest on 12 March 2022
Tar’an, B., C. Zhang, T. Wankertin, A. Tullu and A. Vandenberg,2005 Genetic diversity among varieties and wild species acces-sions of pea (Pisum sativum L.) based on molecular markers,and morphological and physiological characters. Genome 48:257–272.
Tenaillon, M. I., M. C. Sawkins, A. D. Long, R. L. Gaut, J. F.Doebley et al., 2001 Patterns of DNA sequence polymorphismalong chromosome 1 of maize (Zea mays ssp. maysL.). Proc. Natl.Acad. Sci. USA 98: 9161–9166.
Thompson, J. D., D. G. Higgins and T. J. Gibson, 1994 Clustal W:improving the sensitivity of progressive multiple sequence align-ment through sequence weighting, position-specific gap penal-ties and weight matrix choice. Nucleic Acids Res. 22: 4673–4680.
Vershinin, A. V., T. R. Alnutt, M. R. Knox, M. R. Ambrose and T. H.N. Ellis, 2003 Transposable elements reveal the impact of in-trogression, rather than transposition, in Pisum diversity, evolu-tion and domestication. Mol. Biol. Evol. 20: 2067–2075.
Watterson, G. A., 1975 On the number of segregating sites in ge-netic models without recombination. Theor. Popul. Biol. 7: 256–276.
Zohary, D., 1996 The mode of domestication of the founder cropsof near east agriculture, pp. 142–158 in The Origin and Spread ofAgriculture and Pastoralism in Eurasia, edited by D. R. Harris. Uni-versity College London Press, London.
Communicating editor: D. Voytas
Gene-Based Diversity Analysis of Pea 2275D
ownloaded from
https://academic.oup.com
/genetics/article/177/4/2263/6064433 by guest on 12 March 2022