Embed Size (px)
Citation preview
1
Gender, Marital Status, and Hiring Practices
in the United States
by
Olivia Hu
An honors thesis submitted in partial fulfillment
of the requirements for the degree of
Bachelor of Science
Undergraduate College
Leonard N. Stern School of Business
New York University
May 2015
Professor Marti G. Subrahmanyam Professor Vishal Singh
Faculty Adviser Thesis Adviser
2
ABSTRACT
Our personal and professional lives do not exist in separate spheres. In the same way that
employee parenthood status has been linked to wage premiums for men and wage penalties for
women, a job candidate’s marital status may affect how he/she is perceived in the interview
process. This study examines whether marital status affects men and women differently during the
initial stages of hiring; specifically, we evaluate how 341 experiment participants rate hypothetical
candidates differently on three measures: (1) interview chances, (2) competency, and (3) job fit.
The hypothetical candidates are either male or female, married or single, and applying for either a
male-typed job or a female-typed job. We find that for measure (2) competency, respondents
preferred married candidates for the female-typed job and single candidates for the male-typed
job. We also found surprising results regarding the influence of respondent political orientation on
measures (1) and (3). Both liberal and conservative respondents preferred married male candidates
over single male candidates. For female applicants, however, we see a different pattern: liberal
participants rated single women higher than married women and conservative participants rated
married women higher than single women. These results contribute to a growing cosmos of
literature surrounding gender and work. This paper seeks to examine the results in the context of
existing research, as well as to identify ways in which this study can be improved upon to achieve
more widely applicable and actionable findings.

3
ACKNOWLEDGEMENTS
To Professor Vishal Singh –
First and foremost, thank you for being my thesis adviser. Advising a thesis project was, as I can
imagine, a lot of work for you, and I really appreciate your time and patience in answering my
questions, suggesting ways in which I can improve, and guiding me through the research process
from start to finish. I could not have completed this thesis without your constructive feedback,
professional direction, and overall support. I am very grateful to have had the opportunity to work
under your guidance.
To Jennifer Hong –
Thank you for always making time to meet with me throughout the spring semester, despite your
busy schedule as a Ph.D. student. I really appreciate your help, support, and time.
To Professor Marti Subrahmanyam –
Thank you infinitely for your dedication and commitment to the Honors Program, without which
this incredible journey could not have been possible.
To my family and friends –
I would not be who I am today without your undying support, honest feedback, and unconditional
love. I hope I can make you proud.
4
TABLE OF CONTENTS
I. INTRODUCTION .........................................................................................................5
II. LITERATURE REVIEW ..............................................................................................6
II.I GENDER THEORY ....................................................................................6
II.II HISTORICAL TRENDS IN MARRIAGE ..................................................9
II.III WOMEN’S LABOR FORCE PARTICIPATION .....................................12
II.IV HOUSEHOLD DIVISION OF LABOR ....................................................16
II.V GENDER HIRING DISCRIMINATION ..................................................18
II.VI MARRIAGE AND PARENTHOOD DISCRIMINATION ......................21
III. HYPOTHESIS .............................................................................................................24
IV. EXPERIMENT METHODOLOGY ............................................................................26
IV.I PARTICIPANTS .......................................................................................26
IV.II INDEPENDENT VARIABLES ................................................................27
IV.III DEPENDENT VARIABLES.....................................................................29
IV.IV THE HYPOTHETICAL CANDIDATES ..................................................29
IV.V SURVEY DESIGN ....................................................................................31
V. RESULTS ....................................................................................................................32
V.I JOB PERCEPTION ...................................................................................32
V.II JOB TYPE, GENDER, AND MARITAL STATUS ................................33
V.III RESPONDENT POLITICAL ORIENTATION ........................................36
VI. ANALYSIS AND INTERPRETATIONS ...................................................................38
VI.I JOB TYPE, MARITAL STATUS, AND COMPETENCY ......................38
VI.II MARITAL STATUS, GENDER, AND POLITICAL ORIENTATION...40
VII. APPLICATIONS .........................................................................................................43
VIII. LIMITATIONS AND FURTHER RESEARCH .........................................................45
VIII.I THREATS TO INTERNAL VALIDITY ..................................................45
VIII.II THREATS TO EXTERNAL VALIDITY .................................................46
IX. CONCLUSIONS..........................................................................................................47
X. APPENDIX A: SAMPLE DESCRIPTIVES ...............................................................49
XI. APPENDIX B: SURVEY QUESTIONNAIRE ...........................................................53
XII. APPENDIX C: RESULTS ...........................................................................................58
XIII. RESOURCES ..............................................................................................................65

5
I. INTRODUCTION
At the NYU Stern School of Business, a management professor shared a story with my
undergraduate class: his male colleague, Jack, had purposely decided to purchase and wear a
wedding ring to his job interview. This decision would not have warranted much suspicion from
my classmates had Jack actually been married; however, he was as single as a 30-something
bachelor could possibly be. He did not have a girlfriend, let alone a wife.
Although hiring discrimination on the basis of marital status is not forbidden by Federal
law, almost half of the states and Washington D.C. prohibit this form of discrimination (“What is
Marital Status Discrimination?”). Why, then, would Jack purposely go out of his way to appear
married instead of unmarried? Why would he not want his marital status to remain undisclosed or
ambiguous?
A quick Google search for “Should I wear a wedding ring to my job interview?” generates
approximately 8.38 million results ranging from management websites to discussion boards. Many
of these web pages provide anecdotal support to bolster arguments for either “yes” or “no”, while
some even cite recent sociological studies as evidence for their positions. From this search, two
general sentiments emerge: (1) marriage appears to hurt a woman’s hiring prospects and (2)
marriage appears to help a man’s hiring prospects. This thesis will examine whether or not the
above two statements are true.
The relationship between marital status and candidate appeal becomes particularly
complex when gender is injected into the analysis. American sociocultural norms, stereotypes, and
expectations regarding the traditional nuclear household are likely recalled by employers during
the hiring process, whether the recall is conscious or not. While some may argue that there are
legitimate concerns associated with hiring married women, as well as legitimate benefits

6
associated with hiring married men, adherence to these unsubstantiated biases is hardly ever the
most effective way to source talent. American human resource (“HR”) departments may be
running the risk of unnecessarily shrinking their applicant pools and thereby forgoing opportunities
to hire invaluable men and women for their companies.
In this paper, we will first examine gender theory, as well as historical trends in marriage
and women’s labor force participation in the United States. We will then study the economic
justifications for traditional household labor division and its implications for employer hiring
decisions. The crux of this thesis focuses on analyzing primary survey data that we have collected
in a controlled experiment testing for marriage biases in applicant screening. Finally, we will
conclude with study limitations and applications, as well as suggestions for further research.
II. LITERATURE REVIEW
II.I Gender Theory
There is an ever-growing cosmos of information about gender. Below, the American
Psychological Association defines gender and sex:
Gender encompasses “the attitudes, feelings, and behaviors that a given culture associates
with a person’s biological sex”
Sex is “a person’s biological status [indicated by] biological sex, including sex
chromosomes, gonads, internal reproductive organs, and external genitalia”
There is generally no difference between sex and gender for those who subscribe to essentialism,
whereas there is a defined separation between sex and gender for those who subscribe to social

7
constructionism (“Practice Guidelines for LGB Clients”). While scholars have developed many
gender theories, we will focus on understanding only these two for the purpose of this paper.
Gender essentialists are more likely than social constructionists to believe that women are
naturally nurturing and therefore better suited to childcare than men. Essentialists are also more
likely to champion the traditional household division of labor wherein the husband earns one-
hundred percent of the family income and the wife performs all of the homemaking duties. In
“Essentialism in Everyday Thought,” Dr. Susan A. Gelman writes, “Essentialism is the view that
certain categories (e.g., women) have an underlying reality or true nature that one cannot observe
directly…the underlying reality (or ‘essence’) is thought to give objects their identity, and to be
responsible for similarities that category members share.” Historically, womanhood has been
perceived as a natural condition tied to childbirth. When a social characteristic is attributed to
biology, it is perceived as inevitable, inflexible, and natural. Essentialists often use women’s
reproductive capacity, coupled with their historical commitment to childrearing, as an explanation
for gender differences in the labor market and by extension, a partial justification for gender
inequality.
Gelman explains that essentialism is often used as a reasoning heuristic (“Essentialism in
Everyday Thought”). It is more convenient to attribute behaviors to well-defined and mutually
exclusive categorical traits than it is to attribute behaviors to a multitude of complex social factors.
Unfortunately, however, there are many dangers associated with essentialism. If, for example, an
HR associate believes that the current gender wage gap is a result of natural differences in ability,
s/he may perceive this as evidence of a fair status quo.

8
Research suggests that gender biases can often be traced to essentialist thinking. In a 1992
study, sociologists determined that when both male and female leaders were portrayed as uncaring
autocrats, the female leaders were at a more substantial disadvantage than their male counterparts.
The researchers argue that this difference in perception can be attributed to the violation of a gender
stereotype, namely, the common belief that women are naturally more caring than men (Eagly,
Makhijani, and Klonsky 557).
Very few people would dare say that men and women are precisely the same; some experts
argue, however, that across many variables, the actual difference between the genders is quite
small compared with the perceived difference. Dr. Janet Shibley Hyde interpreted 46 meta-
analyses and 124 effect sizes comparing males and females on a number of different
characteristics. Approximately 30% of the effect sizes fell between 0 and 0.10 and 48% of the
effect sizes fell between 0.11 and 0.35, indicating trivial and small differences between males and
females on a host of measures (Hyde 375).
Cultural anthropologist Gayle Rubin explains that gender stereotypes exist despite these
findings because there is “a taboo against the sameness of men and women” (39). Social
constructionism seeks to break this taboo by separating gender from sex and focusing on the social
factors that contribute to gender performance. This framework rests on the belief that there is “no
essential, universally distinct character that is masculine or feminine.” Instead, behaviors are
shaped by factors like class and culture. Social constructionist theory can be used in part to explain
why boys living in traditional families tend to aspire to masculine occupations, while daughters of
mothers who work in male-dominated jobs tend to aspire to less sex-typical careers (Polavieja and
Platt 49). If the gender essentialist view were to hold for career aspirations, then a child’s
9
household makeup should not theoretically affect his/her propensities toward certain occupations.
If females are really biologically wired to nurture, we should expect all girls to reject gender-
atypical careers and aspire to homemaking.
Although much of the examined research supports social constructionism, this paper does
not seek to entirely dismiss the importance of biology in shaping gender. It is critical, however, to
recognize that “a biological female is not automatically a woman, nor is a male automatically a
man” (Matthaei 198). Not every human behavior may be linked directly to a genetic cause, as
genes interact with the environment in very complex ways in order to bring about a wide range of
attitudes and behaviors. Dr. Cecilia Ridgeway explains, “Whatever biology contributes… it never
acts alone, but in concert with a wide variety of social processes” (20). Both hard science and
social science must be examined in order to understand the existence, and more importantly, the
persistence, of gender in our society.
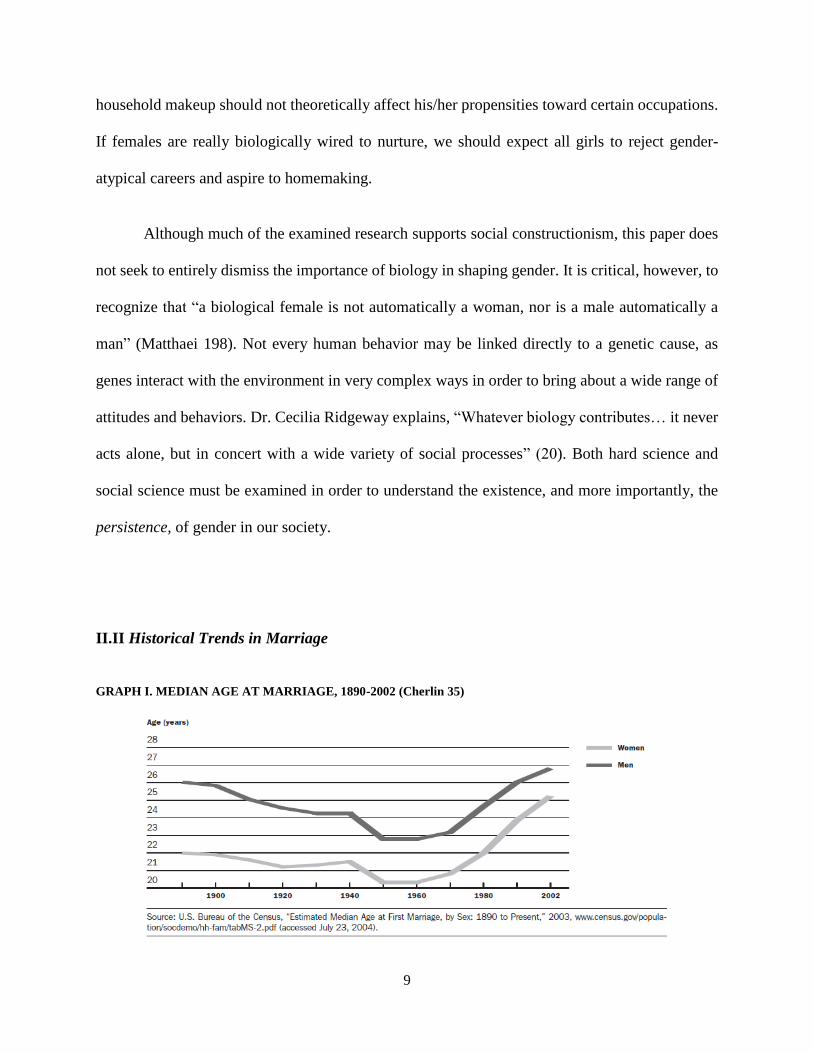
II.II Historical Trends in Marriage
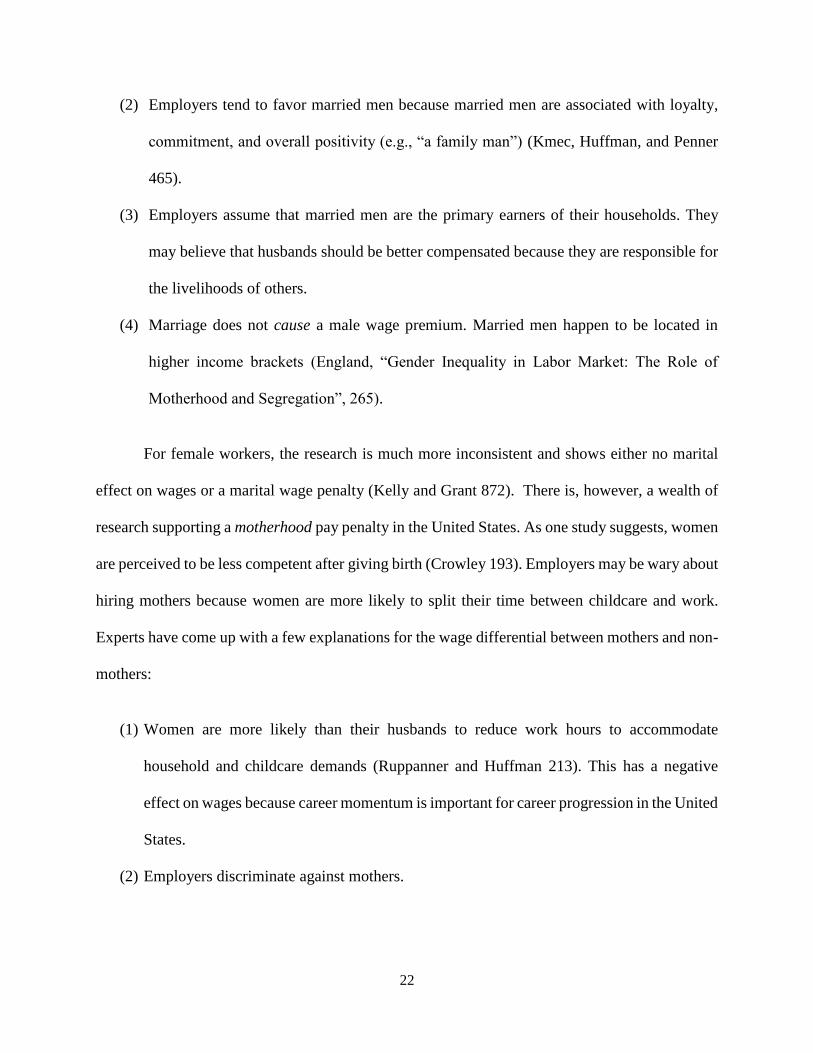
GRAPH I. MEDIAN AGE AT MARRIAGE, 1890-2002 (Cherlin 35)
10
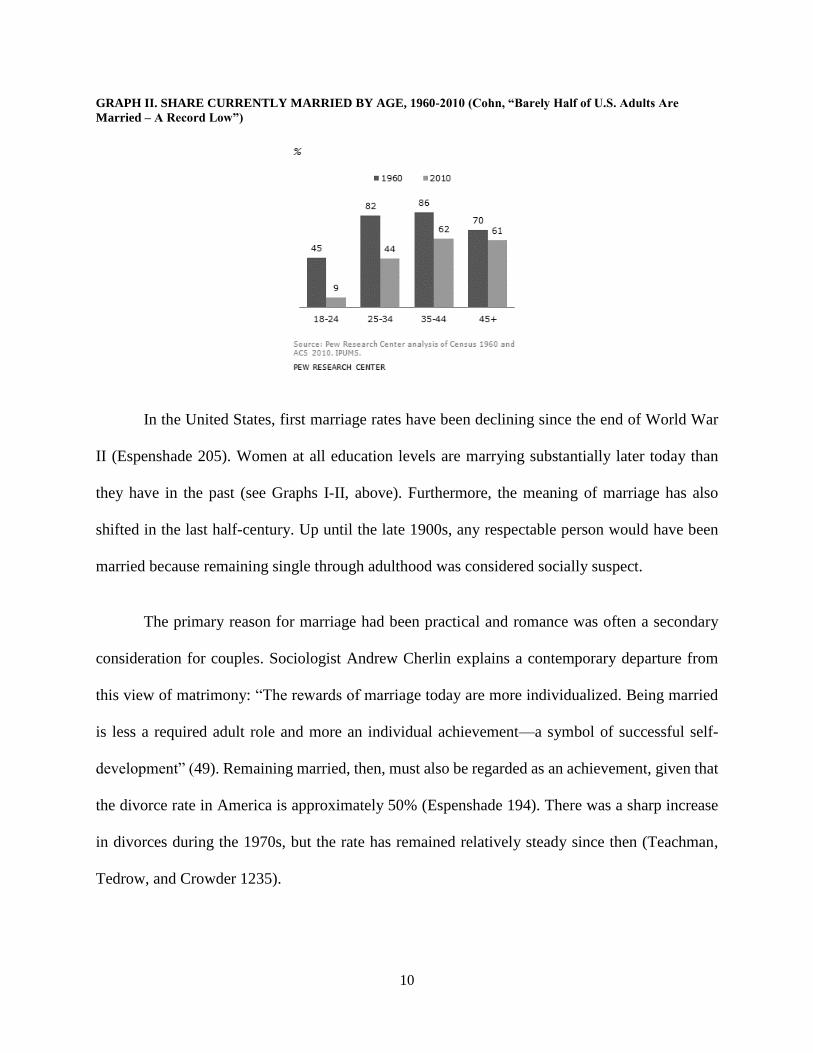
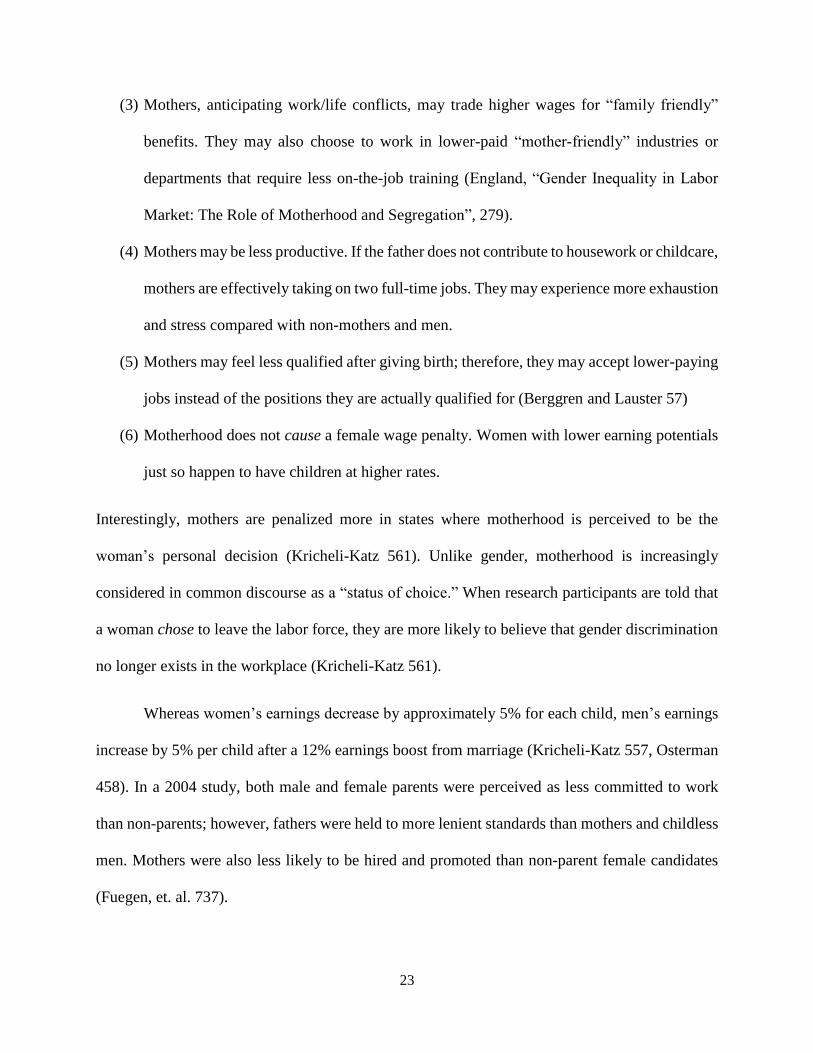
GRAPH II. SHARE CURRENTLY MARRIED BY AGE, 1960-2010 (Cohn, “Barely Half of U.S. Adults Are
Married – A Record Low”)
In the United States, first marriage rates have been declining since the end of World War
II (Espenshade 205). Women at all education levels are marrying substantially later today than
they have in the past (see Graphs I-II, above). Furthermore, the meaning of marriage has also
shifted in the last half-century. Up until the late 1900s, any respectable person would have been
married because remaining single through adulthood was considered socially suspect.
The primary reason for marriage had been practical and romance was often a secondary
consideration for couples. Sociologist Andrew Cherlin explains a contemporary departure from
this view of matrimony: “The rewards of marriage today are more individualized. Being married
is less a required adult role and more an individual achievement—a symbol of successful self-
development” (49). Remaining married, then, must also be regarded as an achievement, given that
the divorce rate in America is approximately 50% (Espenshade 194). There was a sharp increase
in divorces during the 1970s, but the rate has remained relatively steady since then (Teachman,
Tedrow, and Crowder 1235).
11
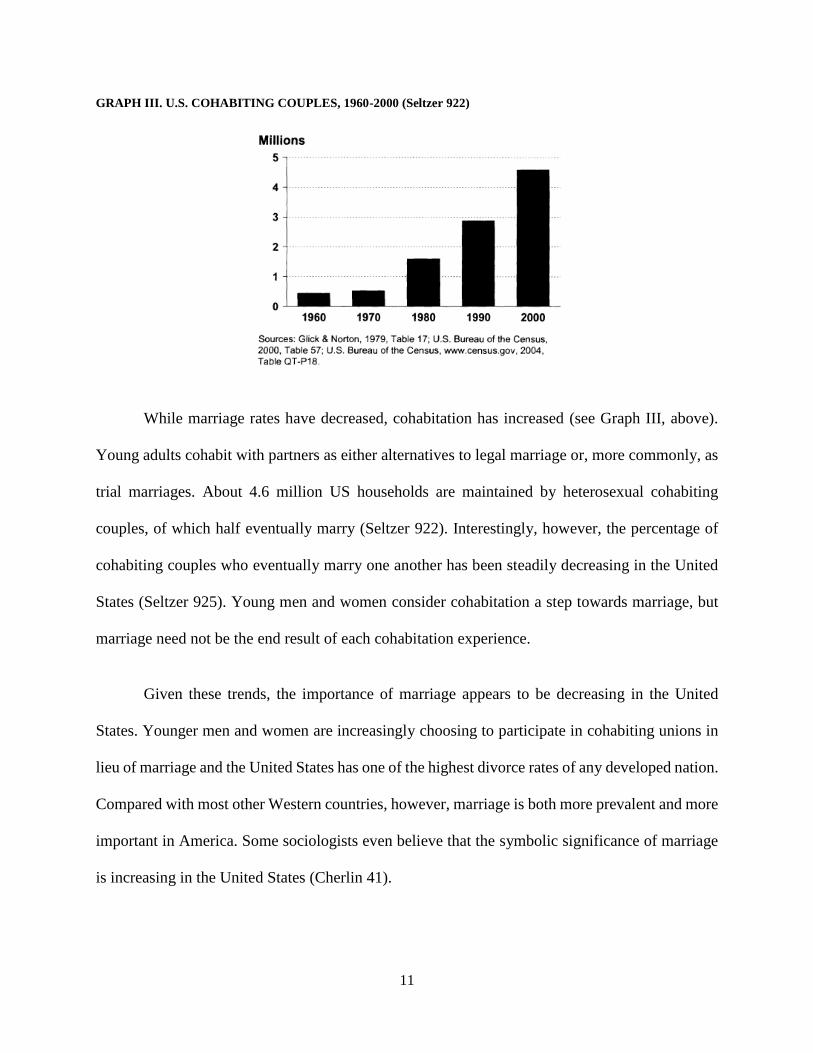
GRAPH III. U.S. COHABITING COUPLES, 1960-2000 (Seltzer 922)
While marriage rates have decreased, cohabitation has increased (see Graph III, above).
Young adults cohabit with partners as either alternatives to legal marriage or, more commonly, as
trial marriages. About 4.6 million US households are maintained by heterosexual cohabiting
couples, of which half eventually marry (Seltzer 922). Interestingly, however, the percentage of
cohabiting couples who eventually marry one another has been steadily decreasing in the United
States (Seltzer 925). Young men and women consider cohabitation a step towards marriage, but
marriage need not be the end result of each cohabitation experience.
Given these trends, the importance of marriage appears to be decreasing in the United
States. Younger men and women are increasingly choosing to participate in cohabiting unions in
lieu of marriage and the United States has one of the highest divorce rates of any developed nation.
Compared with most other Western countries, however, marriage is both more prevalent and more
important in America. Some sociologists even believe that the symbolic significance of marriage
is increasing in the United States (Cherlin 41).

12
Because the cultural importance of marriage is unlikely to disappear soon, we must
examine how our perception of marriage and married employees affect judgments in the
workplace. According to management consultant Fons Trompenaars, cultures are either more
“specific” or more “diffuse” (Babel Group). Trompenaars would consider the United States a
“specific” country in which people are encouraged by social norms to keep private lives and
professional lives separate; however, the personal and the professional hardly ever exist
independently in reality. Our cultural beliefs about the personal realm (e.g., marriage, childrearing,
gender roles) will likely influence our behaviors in the professional realm (e.g., hiring practices,
performance evaluations, promotions).
II.III Women’s Labor Force Participation
Over half of all adult women are currently employed in the United States (Desai, Chugh,
and Brief 331). Since the mid-1900s, women’s labor force participation (“LFP”) has increased
dramatically; specifically, married white women’s LFP saw a significant incline between 1950 and
1990 (Fernandez 472, see Graph IV, below). Approximately 75% of working women currently
hold full-time jobs and American families are becoming more dependent on wives’ incomes as a
result (Desai, Chugh, and Brief 331). More remarkably, mothers have been joining the workforce
in swelling numbers. In 1960, 1980, and 2009, the percentages of married women with children
under 18 occupied in paid employment were 27.6%, 54.1%, and 69.8%, respectively (Alger and
Crowley 78). Although the LFP gender gap has not noticeably narrowed since 2000, there have
been significant changes in the work landscape since World War II.

13
GRAPH IV. LABOR FORCE PARTICIPATION RATES, 1975-2013 ("Women's Bureau: Women and Families”)
Historically, there was a rigid division of labor within each household. Because men were
fully responsible for providing family income, there were very few women working for pay. Often,
marriage would be postponed until the man’s earnings were high enough to keep his wife at home.
If an adult male could not earn enough money to support his family, his wife would need to provide
supplementary household income. In these cases, the male adult was perceived to be less of a man
because he could not properly perform hegemonic masculinity (Matthaei 199).
Whereas LFP signified adulthood for men, it characterized adolescence, widowhood, or
failure for women. Economist Julie Matthaei argues that women’s LFP did not actually challenge
the ideal of domestic womanhood during the first half of the 20th century; rather, it reinforced
gender roles. A woman who worked was perceived as a failure because she could not “keep a
manly husband.” These employed women were not “rejecting homemaking and traditional
womanhood, but simply trying to extend or supplement it” because their family units could not
afford to adhere to societal gender expectations (Matthaei 201).
14
Husbands therefore remained the breadwinners of American families and women would
take on only part-time/seasonal opportunities out of necessity. Wives often accepted lower-paying
service jobs that coincided with the popular belief that women were better suited to domestic tasks.
Despite earning supplementary wages, women did not share household responsibilities with their
husbands because these were still duties exclusive to wives. The jobs that female workers occupied
eventually become known as “women’s jobs” because “all but the most oppressed men refused
such jobs, for they failed to offer the financial rewards or social recognition required for manhood”
(Matthaei 199). It is important to note, however, that women were not actively fighting for, or even
remotely interested in, taking on men’s work during this time (Matthaei 199).
Many economic, legal, and social changes have taken place since the beginning of the 20th
century. World War II created millions of jobs for women in the domestic workplace, as well as
hundreds of thousands of opportunities in the military (“Partners in Winning the War”). As the
higher education of women became less stigmatized, more female students sought college degrees.
Coupled with a markedly reduced birth rate (due in part to medical advances such as improved
female contraceptive methods), increased education qualified women for roles beyond the
household. These trends increased the opportunity cost of staying at home for female adults.
The 1950s also saw the end of “marriage bars”, which were policies that had been
implemented at the turn of the 20th century to restrict married women from working in certain jobs
(Goldin 1). Because marriage bars did not restrict lower-paid occupations, they had effectively
discouraged women from attaining higher education for several decades preceding the two world
wars. These marriage bars consisted either of (1) banning the hire of married women (“hire bar”)
or (2) terminating the employment of single women when they married (“retain bar”). Prior to the

15
Second World War, 87% of all school boards honored the hire bar and 70% honored the retain bar.
By 1951, these numbers dropped to 18% and 10%, respectively (Goldin 6). In addition to structural
changes in the economy that made it more difficult for households to survive on one income, the
United States Congress also supported increased female LFP with the passage of the 1963 Equal
Pay Act and the Civil Rights Act of 1964.
Regardless of these changes, there is still a substantial difference between men and women
in the labor market. Women have moved more into male-dominated jobs than men have into
female-dominated jobs. Because women’s work has historically been regarded as less prestigious,
male workers have had less of an incentive to enter gender-nontraditional industries (England,
“The Gender Revolution: Uneven and Stalled” 151). Dr. Paula England explains, “There was
nowhere near one man leaving the labor force to become a full-time homemaker for every woman
who entered, nor did men pick up household work to the extent women added hours of
employment” (“The Gender Revolution: Uneven and Stalled” 151). Women are still primarily
responsible for household duties, despite earning as much as—or even more than—their male
counterparts (Brines 664). As Matthaei explains, “The rise of the two-earner family does not in
itself represent the disintegration of the sexual division of labor” (201). One would expect an
increase in women’s LFP to be complemented with a decrease in hours spent on domestic duties.
This decrease should theoretically be offset by an increase in the husband’s homemaking hours.
The data show that this is far from the reality faced by most American families.
16
II.IV Household Division of Labor
According to the U.S. Bureau of Labor Statistics, approximately 20% of 2012 marriages
are traditional marriages in which only the husband provides family income (Desai 331). For most
American families—even dual-earner families—gender still decides the duties performed by
husbands and wives. Both working women and nonworking women do more housework than men
(Brines 682). When a wife is employed, the family only sees a very slight increase (1-2 hours per
week) in the time the husband spends on domestic duties (Brines 653). For some families, an
increase in the wife’s income actually leads to a decrease in the husband’s homemaking hours. In
Arlie Hochschild and Anne Machung’s ethnographic study, The Second Shift, the authors
suggested that “the more severely a man’s identity is financially threatened—by his wife’s higher
salary, for example—the less he can afford to threaten it further by doing ‘women’s work’ at
home” (221). On average, women spend 81% more time on housework. Women commit 29 hours
each week to domestic duties, whereas men give only 16 hours. While men do spend more time
on outdoor work, auto maintenance, and other “masculine” typed housework, the total time spent
on these tasks is significantly less than the hours required of “feminine” housework like cleaning,
meal preparation, and laundry (Schneider 1045).
Dr. Julie Brines believes that the benefits derived by male and female parties are unequal
in this traditional give-and-take relationship because housework does not have any exchange value.
It carries no significance beyond the specific home in which the woman performs these tasks.
Brines writes, “This difference in the fungibility of resources allows for the emergence of an
unequal exchange relation between two parties” (656). Whereas income can be exchanged for
goods and services on the market, housework is illiquid and therefore renders women dependent
upon their husbands for even the most basic necessities.

17
Despite these inequities, a division of labor should theoretically be efficient because
specialization leads to increased productivity and greater overall income for the family unit.
American women have taken on household reproduction because it was believed that they had a
natural comparative advantage in childcare. Because men have exclusively carried out household
production until recent decades, they generally receive broader technical training as well as more
social encouragement for career advancement. Some experts suggest that many women
underinvest in earnings-specific human capital because they do not receive as much social support
throughout both childhood and adulthood to pursue wage-earning careers (Badgett and Folbre 295)
Despite this difference in male and female social norms, a greater number of educated
women are opting to pursue lifelong careers in lieu of part-time work. Consistent with household
economics, a wife’s opportunity cost of staying home increases when she is qualified to earn more.
Unfortunately, however, these working women face many personal and professional dilemmas due
to the persistence of gendered household expectations. Sociologist Dr. Kathleen Gerson writes:
“Women who chose to place family and children before other life
commitments confronted the dilemmas of how to overcome the
isolation that homemaking can impose and how to defend their
choices against the growing social devaluation of domestic pursuits.
In contrast, women who established committed ties to the workplace
faced dilemmas about whether and how to integrate children into
their lives. Although each group faced a different set of obstacles
and central concerns, both confronted dilemmas that lacked
established, institutionalized solutions” (123).
The number of homemaking husbands has not increased proportionally with the number of
professional income-earning wives. Similarly, the number of hours men commit to domestic duties
has not increased in proportion with the amount of money women commit to the family income.
If wives continue to perform the majority of household duties, they are essentially taking on two
18
full-time jobs. Present household and work patterns violate the economic principle of comparative
advantage, which had been the justification for household division of labor in the first place. As
this is not the most effective way to maximize average household productivity, both men and
women’s livelihoods can be improved by a shift in attitudes and expectations.
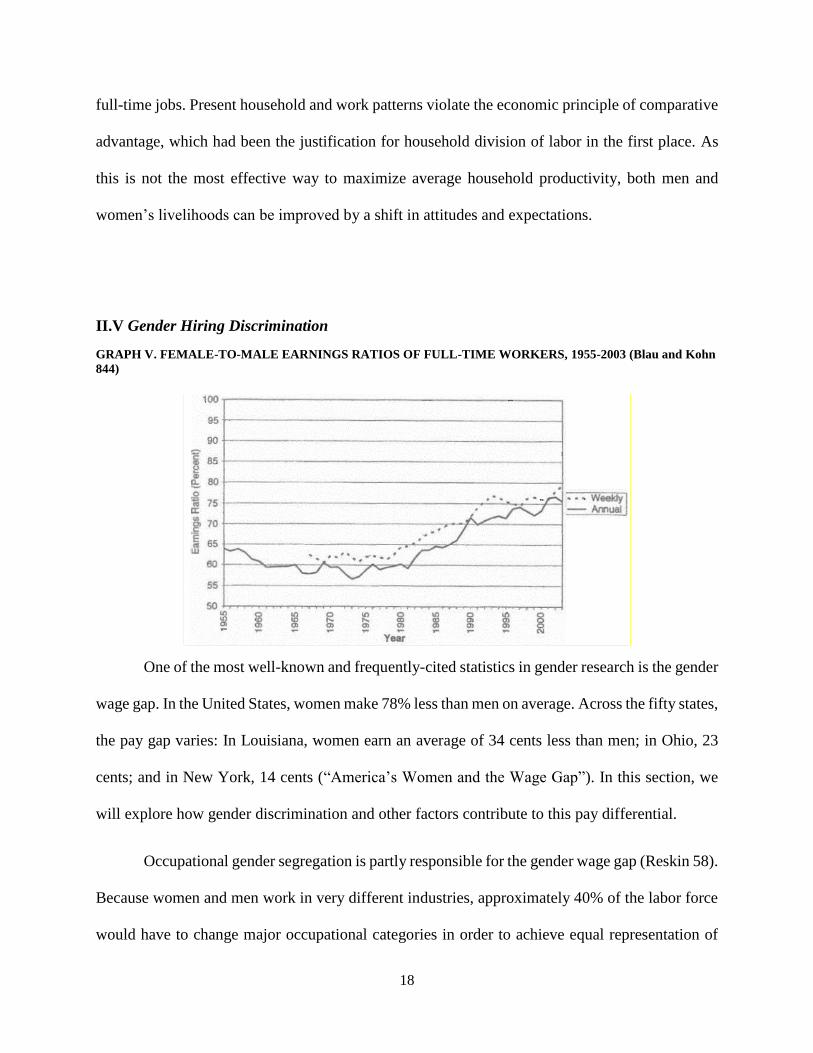
II.V Gender Hiring Discrimination
GRAPH V. FEMALE-TO-MALE EARNINGS RATIOS OF FULL-TIME WORKERS, 1955-2003 (Blau and Kohn
844)
One of the most well-known and frequently-cited statistics in gender research is the gender
wage gap. In the United States, women make 78% less than men on average. Across the fifty states,
the pay gap varies: In Louisiana, women earn an average of 34 cents less than men; in Ohio, 23
cents; and in New York, 14 cents (“America’s Women and the Wage Gap”). In this section, we
will explore how gender discrimination and other factors contribute to this pay differential.
Occupational gender segregation is partly responsible for the gender wage gap (Reskin 58).
Because women and men work in very different industries, approximately 40% of the labor force
would have to change major occupational categories in order to achieve equal representation of

19
both genders in all jobs (Williams 253). Masculine or male-typed industries tend to offer higher
incomes than feminine or female-typed industries. As Sociologist Barbara Reskin suggests,
“Although femaleness is not always devalued, its deviation from maleness in a culture that reserves
virtues for men has meant the devaluation of women” (63). This explains why the masculinity of
a job is generally a strong predictor of salary and status. In his study, Dr. Peter Glick found that
even female-dominated jobs value and require masculine traits (Glick 361). In another sociological
study conducted by Dr. Elizabeth Gorman, women constituted a smaller portion of newly hired
employees when the selection criteria included more masculine characteristics (Gorman 720).
In addition to having less representation in better-paid, masculine industries, women also
hold a smaller number of leadership jobs across most industries in the labor market (Williams
253). These managerial jobs tend to be better compensated than associate-level positions; thus,
such a large leadership gender difference is likely to also contribute to the gender wage gap. In an
experiment in which comparable hypothetical male and female candidates were both described as
“masculine”, the female applicant was less likely to be interviewed or hired to be a sales manager.
On the other hand, female applicants who were described as either masculine or feminine were
overwhelmingly preferred over male applicants for the job of dental receptionist/secretary (Glick,
Zion, and Nelson 185). In another study examining the perception of female and male engineering
students, there was greater discrimination against women in evaluations for technical-managerial
jobs compared with evaluations for purely technical jobs, even with highly competent candidates
(Gerdes, Proctor, and Garber 307). The existing research suggest that leadership is closely tied to
masculinity, which puts women at a disadvantage when it comes to acquiring managerial jobs.
Masculine-typed occupations also tend to offer more opportunities for leadership, which
further widens the managerial gender gap. Women may also hold a smaller number of senior
20
positions because they experience more discontinuous careers (England, “Gender Inequality in
Labor Market: The Role of Motherhood and Segregation”, 265). For instance, women are more
likely than men to move in and out of the labor market based on family considerations like
childbirth and childcare. When they exit the professional sphere to tend to family life, they are
effectively doing so at the cost of gaining more labor market experience. Seniority, as we know,
is partially determined by how much time one has committed to a specific line of work. It is more
difficult for women to compete with their male counterparts if they do not spend an equal amount
of time employed in the workforce to begin with.
Because women may anticipate these career disruptions, they may actually invest less in
their human capital. Some women may consciously choose careers with less intensive and less
specific job training because the skills they gain from such jobs are portable after, for example,
maternity leave. Unfortunately, however, firms are more interested in providing specific job- or
company-related training because they want to cultivate and retain talent. Employee “poaching”
discourages businesses from providing their employees with general, widely applicable
knowledge.
Even when women do apply for the same positions as men, there is evidence that gender
discrimination exists in hiring practices. In a 1998 study, researchers found that both male and
female recruiters rated male applicants and female applicants similarly for entry-level accountant
positions; unfortunately, however, female applicants received less favorable future job
performance evaluations (Snipes, Oswald, and Caudill 92). In a similar study focusing on entry-
level auditors, researchers found that female recruiters offered significantly higher salaries
(approximately $3000 higher) to male candidates than to female candidates (Hardin, Reding, and
Stocks 261).
21
Although employer discrimination is not alone responsible for the gender wage gap, many
studies suggest that it is a significant contributing factor because “competence is stereotypical of
men, but is not generally expected of women” (Gerdes and Garber 308). When marriage and
parenthood are incorporated into the analysis, our understanding of work and gender becomes even
more complex.
II.VI Marriage and Parenthood Discrimination
Work and family compete for time, one of our most precious resources. They are greedy
institutions that constantly wrestle attention away from one another. In America, the ideal worker
is associated with “continuous availability with productivity” just as the ideal spouse/parent is
associated with full-time commitment and care (Bailyn 107). Trying to become both can lead to
frustration, stress, and disappointment, as these two ideals are mutually exclusive. Interestingly,
however, women and men experience work/life interactions quite differently.
For male workers, marriage either has a neutral or beneficial impact on wages. Male marital
premiums may be responsible for approximately one-third of gender based wage discrimination in
the United States (Korenman and Neumark 303). Husbands tend to receive higher performance
reviews than single men when education, race, region, age, work experience, occupation, and
industry are controlled for. Even when detailed human capital controls are put in place, hourly
wage premiums paid to married men are large (Korenman and Neumark 303). Sociologists believe
that this male marriage premium can be attributed to a combination of factors:
(1) Wives help perform household duties, thereby lessening the homemaking burden for
husbands. Married men become more productive in the workplace as a consequence.
22
(2) Employers tend to favor married men because married men are associated with loyalty,
commitment, and overall positivity (e.g., “a family man”) (Kmec, Huffman, and Penner
465).
(3) Employers assume that married men are the primary earners of their households. They
may believe that husbands should be better compensated because they are responsible for
the livelihoods of others.
(4) Marriage does not cause a male wage premium. Married men happen to be located in
higher income brackets (England, “Gender Inequality in Labor Market: The Role of
Motherhood and Segregation”, 265).
For female workers, the research is much more inconsistent and shows either no marital
effect on wages or a marital wage penalty (Kelly and Grant 872). There is, however, a wealth of
research supporting a motherhood pay penalty in the United States. As one study suggests, women
are perceived to be less competent after giving birth (Crowley 193). Employers may be wary about
hiring mothers because women are more likely to split their time between childcare and work.
Experts have come up with a few explanations for the wage differential between mothers and non-
mothers:
(1) Women are more likely than their husbands to reduce work hours to accommodate
household and childcare demands (Ruppanner and Huffman 213). This has a negative
effect on wages because career momentum is important for career progression in the United
States.
(2) Employers discriminate against mothers.
23
(3) Mothers, anticipating work/life conflicts, may trade higher wages for “family friendly”
benefits. They may also choose to work in lower-paid “mother-friendly” industries or
departments that require less on-the-job training (England, “Gender Inequality in Labor
Market: The Role of Motherhood and Segregation”, 279).
(4) Mothers may be less productive. If the father does not contribute to housework or childcare,
mothers are effectively taking on two full-time jobs. They may experience more exhaustion
and stress compared with non-mothers and men.
(5) Mothers may feel less qualified after giving birth; therefore, they may accept lower-paying
jobs instead of the positions they are actually qualified for (Berggren and Lauster 57)
(6) Motherhood does not cause a female wage penalty. Women with lower earning potentials
just so happen to have children at higher rates.
Interestingly, mothers are penalized more in states where motherhood is perceived to be the
woman’s personal decision (Kricheli-Katz 561). Unlike gender, motherhood is increasingly
considered in common discourse as a “status of choice.” When research participants are told that
a woman chose to leave the labor force, they are more likely to believe that gender discrimination
no longer exists in the workplace (Kricheli-Katz 561).
Whereas women’s earnings decrease by approximately 5% for each child, men’s earnings
increase by 5% per child after a 12% earnings boost from marriage (Kricheli-Katz 557, Osterman
458). In a 2004 study, both male and female parents were perceived as less committed to work
than non-parents; however, fathers were held to more lenient standards than mothers and childless
men. Mothers were also less likely to be hired and promoted than non-parent female candidates
(Fuegen, et. al. 737).

24
All in all, there appears to be strong support for fatherhood premiums, male marital
premiums, and motherhood penalties. Although a significant number of women—and more
specifically, mothers—have entered the workforce in the last half century, cultural expectations of
male and female roles within a family are contributing to the gender inequality we observe in
today’s labor market.
III. HYPOTHESIS
Existing research tends to revolve around the relationships between marriage and wages,
children and wages, and gender and wages. While there is also substantial research focusing on
the influence of parenthood and gender on hiring, there does not appear to be much literature on
the relationship between marital status and hiring. Some may argue that such research is
unnecessary because marriage discrimination is explicitly illegal in certain states (“What is Marital
Status Discrimination?”). Further, an applicant’s marital status may not be as obvious to employers
as an applicant’s gender upon first glance. Whereas male and female pronouns can usually be
assigned based on names and appearances, marital status is not always immediately clear.
As mentioned previously, however, an applicant’s personal and professional lives do not
exist in completely separate spheres. An unintentional slip of the tongue can result in the unveiling
of one’s marital status. On the other hand, some candidates even go out of their way to bring up
personal topics. Just like chatting about the weather or discussing sports highlights, mentioning
certain personal aspects of one’s life can help a candidate build rapport with his interviewer before
delving into specific job-related questions. Such discussions may also add a more human
dimension to the candidate beyond his/her written credentials. Regardless of how this osmosis

25
takes place, there is a chance that such individuating information will be revealed or uncovered
during the hiring process. When it is, it may color the employer’s perception about the candidate
and affect their hiring decisions. This can be dangerous for companies because, as the age-old
adage suggests, things—and people—may not be what they seem.
This paper will examine 341 respondents’ evaluations of eight hypothetical applicants.
These applicants were either male or female, married or single, and applying for a masculine-type
job or a feminine-type job. For each type of position, the credentials were identical. My hypotheses
are as follows:
Hypothesis 1: Men will benefit from being married in the hiring
process. Employers will give married men higher ratings than single
men, all other things equal.
Hypothesis 2: Women will benefit from being single in the hiring
process. Employers will give single women higher ratings than
married women, all other things equal.
Based on the literature review, it appears that women are both expected to take on most of
the household duties and actually carry out the majority of these duties in reality (Brines 682).
Employers may believe that women are less hirable than men because the institution of marriage
still implicates a division of labor between couples. Just as husbands may be perceived as more
productive because they do not have to cook or clean, women may be perceived as less productive
because they do the cooking and cleaning. Similarly, just as husbands may be less likely to take
time off for family considerations, wives may be more likely to have discontinuous careers.

26
Although marriage is no longer a necessary social prerequisite for family formation, it is
often perceived by Americans as an ideal prelude. Wives become mothers and husbands become
fathers. Employers may anticipate the possibility of childbirth for married candidates with
ambiguous parenthood statuses. Upon learning a candidate’s marital status, it is possible that
recruiters are already thinking about the differences between motherhood and fatherhood roles,
specifically, how these different roles interact with workplace expectations regarding commitment,
dedication, and constant availability.
IV. EXPERIMENT METHODOLOGY
IV.I Participants
The factorial design of the present study included Applicant Gender (male, female) ×
Applicant Marital Status (married, single) × Job Type (feminine, masculine). A sample of 341
respondents participated in this online study, which was created on NYU Stern Qualtrics
(“Qualtrics”) and distributed via Amazon Mechanical Turk (“mTurk”). Each participant was
randomly assigned to one of eight versions of the survey and then asked to answer demographic
questions. Upon completion of the survey, respondents were given a code as proof of completion.
62.5% of the sample identified as male and 37.5% identified as female. The age breakdown
is as follows: 20 and younger (5.9%), 21-30 (59.5%), 31-40 (24.0%), 41-50 (6.7%), 51-60 (2.9%),
and 61 and older (0.9%). Over three-quarters of the sample are between 21 and 40 years old. 208
of the 341 respondents were single (61.0%), 110 were married (32.3%), 13 were divorced (3.8%),
and 10 selected “Other” for marital status (2.9%). A large majority of the sample identified racially
as White (71.6%) and approximately one-tenth identified as Asian (12.6%). There was an equal
percentage of Black/African-American respondents and Hispanic/Latino respondents (6.5%), as
27
well as an equal percentage of American Indian/Alaska Native respondents and Native
Hawaiian/Pacific Islander respondents (0.3%). 2.3% of the sample selected “Other” when asked
to specify their race (see Appendix A, Tables 1-5)
When asked about the highest level of schooling completed, 138 respondents indicated that
they hold professional degrees (40.5%). 27.3% hold bachelor degrees and 12.6% have received
trade/technical/vocational training. About half of the respondents have total household incomes
ranging from $20,000 to $59,999. The sample also tends to be more liberal than conservative. On
a scale of 0 (very conservative) to 100 (very liberal), the sample mean was 61.79 with a standard
deviation of 26.193. Lastly, only 2.9% of the total sample worked in Human Resources and only
7.3% worked in Finance, although we do not know which specific roles these individuals hold in
these two departments (see Appendix A, Tables 6-9).
IV.II Independent Variables
Male-typed job vs. Female-typed job – For the masculine job, job descriptions for the role
of Senior Finance Manager (“SFM”) were created using sections of various SFM job descriptions
from LinkedIn.com. For the feminine job, the same process took place using sections of various
Senior HR Manager (“SHRM”) job descriptions from LinkedIn.com. Whereas the SFM job
description included responsibilities like “creating financial forecasts”, “modeling and quantifying
financial risk”, and “acting as a financial lead supporting sales division VP”, the SHRM job
description focused on responsibilities like “increasing employee engagement”, “improving
employee relations and workforce planning”, and “improving organizational and individual
capabilities.” The former are male-typed because they focus on analytical and mathematical
28
competencies that are stereotypical of men but not of women. The latter are female-typed because
they more closely mirror the nurturing, communal “nature” of women, which is often regarded as
both innate and unchangeable.
Male applicant vs. Female applicant – The hypothetical male applicant’s name is Daniel
L. Hubbard and the hypothetical female applicant’s name is Sarah L. Hubbard. Respondents are
first made aware of the applicant’s gender when they read the cover letter. The cover letters
highlight realistic credentials, as they were constructed using experiences from several resumes
provided by Indeed.com. The credentials in both male and female SFM cover letters are identical,
just as the credentials in both male and female SHRM cover letters are identical.
Cover letters were used to convey competency because they are generally more ambiguous
than resumes. Resumes clearly delineate accomplishments on a line-by-line basis, making it easier
for respondents to consider only what is on the resume and not what is revealed about the
applicant’s gender and marital status. Online surveys are unlike face-to-face interviews; the
candidate’s personal characteristics (e.g. appearance, voice, personality) are completely absent
when they are reduced to just words. Providing a detailed resume may encourage participants to
scrutinize and fixate their attention on specific accomplishments instead of considering the
applicant as a multidimensional person. Because cover letters are vague, the respondents must
resort to assumptions about the applicant to determine whether or not he/she is a good fit for the
job in question. Providing only a cover letter helps us to determine whether some of these
assumptions are gender- and/or marital status-based.
Married applicant vs. Single applicant – After reading through the job description and
cover letter, respondents were given a candidate Information Sheet with some demographic
information about the applicant. In this study, there were eight different configurations (2
29
Applicant Gender × 2 Applicant Marital Status × 2 Job Type). This is where marital status (either
married or single) was revealed to the respondent, along with information about the hypothetical
candidate’s age, race, location and education.
IV.III Dependent Variables
All eight job candidates were rated on three measures on a scale of 1 to 9: (1) interview
chances, (2) competency, and (3) job fit. Asking respondents to rank how likely they would be to
interview the hypothetical candidate is directly related to the primary objective of this paper;
unfortunately, however, there is less risk involved in interviewing a candidate than there is in, for
example, hiring a candidate. Whereas the decision to hire may involve several considerations (e.g.,
qualifications, personality, location, etc.), the decision to interview may only be based upon
whether or not the candidate appears qualified at first glance. Unless the applicant is extremely
underqualified, it would not hurt the company to at least give him/her a chance to come in for an
interview. Because we expected that the low risks associated with interviewing may skew ratings
for “interview chances” toward higher numbers, measures (2) and (3) were also included in the
study.
IV.IV The Hypothetical Candidates
Age, race, location, and education were held constant across configurations. The
hypothetical candidates were all 33 years old. Generally, American students graduate with
undergraduate degrees with they are 21-23. Assuming that these students enter the workforce
shortly after graduation, they will have received approximately ten years of continuous work
30
experience by age 33. It is not unreasonable to believe that professionals at this age will be pursuing
management roles in their departments. Furthermore, the marital expectations of a 33 year old vary
more than the marital expectations of a 20 year old (e.g., should be single and never married) or a
65 year old (e.g., should be married or divorced) across respondents of different backgrounds and
political orientations; this is useful in mitigating any interactions that may exist between age and
marital status expectations.
It was also important to eliminate ambiguity regarding race. All eight hypothetical
candidates were listed as “White.” This information was provided to the respondents after the job
description and the cover letter. Traditional Anglo-American names (Sarah Hubbard and Daniel
Hubbard) were selected to lessen the possibility of varied race assumptions, as this was not the
focus of the experiment.
Additionally, “New York, NY” was listed under every applicant’s location. Location and
relocation are often issues facing many HR departments and job candidates. The location of a
career opportunity can singlehandedly affect whether or not an applicant chooses to accept or reject
a job offer. Since geographic distance may influence whether participants perceive the applicants
to be good or bad fits for the two positions, all of the hypothetical candidates live in the same city
as the experiment company (Visa).
Lastly, every hypothetical candidate graduated from the University of Pennsylvania with a
grade point average (“GPA”) of 3.7/4.0. A prestigious school and high GPA were selected to direct
participant attention away from education and towards the content of the cover letters. While the
school and GPA were held constant, candidates applying to the SHRM position held Bachelor
degrees in Communication and candidates applying to the SFM position held Bachelor degrees in
Finance.
31
IV.V Survey Design
A pretest was created on Qualtrics and administered through mTurk before the distribution
of the finalized study. 284 respondents comprised the pretest sample. Here, instead of using a 2 ×
2 × 2 factorial study with eight hypothetical candidates who varied on gender, marital status, and
job type, we created a 2 × 3 study with only six hypothetical candidates. These six candidates were
either male or female marketing professionals applying for a Senior Marketing Manager (“SMM”)
position at Visa, Inc. Their marital statuses were either married, single, or unspecified. The initial
findings from this pretest showed that respondent ratings for single applicants and applicants with
an unspecified marital status followed similar patterns, suggesting that the latter were assumed to
be single. As a result, “unspecified marital status” was removed from the survey altogether for the
finalized study, reducing the options for marital status from three to two.
An SMM position was selected for the pretest specifically because marketing tends to be a
gender-neutral branch of business ("Employed Persons by Detailed Industry, Sex, Race, and
Hispanic or Latino Ethnicity"). Since there were no significant interactions between gender and
marital status for any of the three measures (interview chances, applicant competency, and
applicant job fit) for the SMM position, a “job type” variable was added as an attempt to capture
any differences that may exist between traditionally masculine jobs and traditionally feminine jobs.
The finalized survey consisted of nine parts, shown to the respondents in the following
order:
1. Brief description of task
2. Job posting
a. Finance
b. HR
32
3. Candidate’s cover letter
a. Finance/Male
b. Finance/Female
c. HR/Male
d. HR/Female
4. Candidate information sheet (demographic information)
a. Finance/Male/Married
b. Finance/Male/Single
c. Finance/Female/Married
d. Finance/Female/Single
e. HR/Male/Married
f. HR/Male/Single
g. HR/Female/Married
h. HR/Female/Single
5. Measure of applicant’s interview chances
6. Measure of applicant’s competency
7. Measure of job fit
8. Measure of perceived job masculinity/femininity
9. Questions about respondent demographics: gender, age, marital status, race,
annual household income, political orientation, highest education received, and
job industry
After answering all of the survey questions, respondents were given a unique code as proof
of completion. A complete survey can be found in Appendix B.
V. RESULTS
V.I Job Perception
On a scale of 1 (job is best for men) to 9 (job is best for women), the SFM position received
an average rating of 5.88 (std dev=0.938) and the SHRM position received an average rating of
6.15 (std dev=0.930). After running an Independent Samples T-Test, we determined that the
difference between the two means was statistically significant (p=0.008; p<0.05). Interestingly,
33
both positions were perceived to be slightly more feminine than masculine. Even though the
Finance position was perceived to be more masculine than the HR position, the skew towards
feminine job type was not at all expected when the two jobs were initially selected for this study.
The perception of these two job types allows us to compare any differences in applicant perception
between relatively masculine and relatively feminine positions; it is important to keep in mind,
however, that on average, both positions are perceived as more female-typed than male-typed (see
Appendix C, Tables 1A-1B).
V.II Job Type, Gender, and Marital Status
After running ANOVA tests for measures (1) interview chances and (3) job fit, we
determined that there were no statistically significant interactions between job type, applicant
gender, and applicant marital status (see Appendix C, Tables 2A-2B; Tables 4A-4B). While we
cannot confidently explain why we did not find significant mean differences for these two
measures, we believe that perhaps the measures themselves are inherently flawed. As mentioned
previously, allowing a candidate to interview for a position is less risky than actually hiring the
candidate. The company does not need to commit many resources to a potential applicant during
the initial interview screening process. In contrast, when respondents rate each candidate on
measures (2) competency and (3) job fit, they are considering the hirability of the applicant, which
involves more obligation and risk. Whereas the mean ratings for all job type/gender/marital status
configurations fell between 6 and 7 for measures (2) and (3), mean ratings fell between 8 and 9 for
measure (1). On average, respondents were more likely to recommend all of the candidates for
interviews than they were to consider them highly competent or extremely good fits for the jobs.
34
Asking respondents to rate how well they believed the candidate would fit the job also
raises several issues. Many more considerations are involved in determining this rating. Whereas
measure (2) only asks respondents to consider competency and qualifications, measure (3) asks
respondents to make assumptions about the personality of the applicant, as well about the culture
of the company. As we did not provide information beyond what was necessary to determine
competency, respondents may have made very different assumptions about the candidates and the
company that consequently affected their ratings in unpredictable ways.
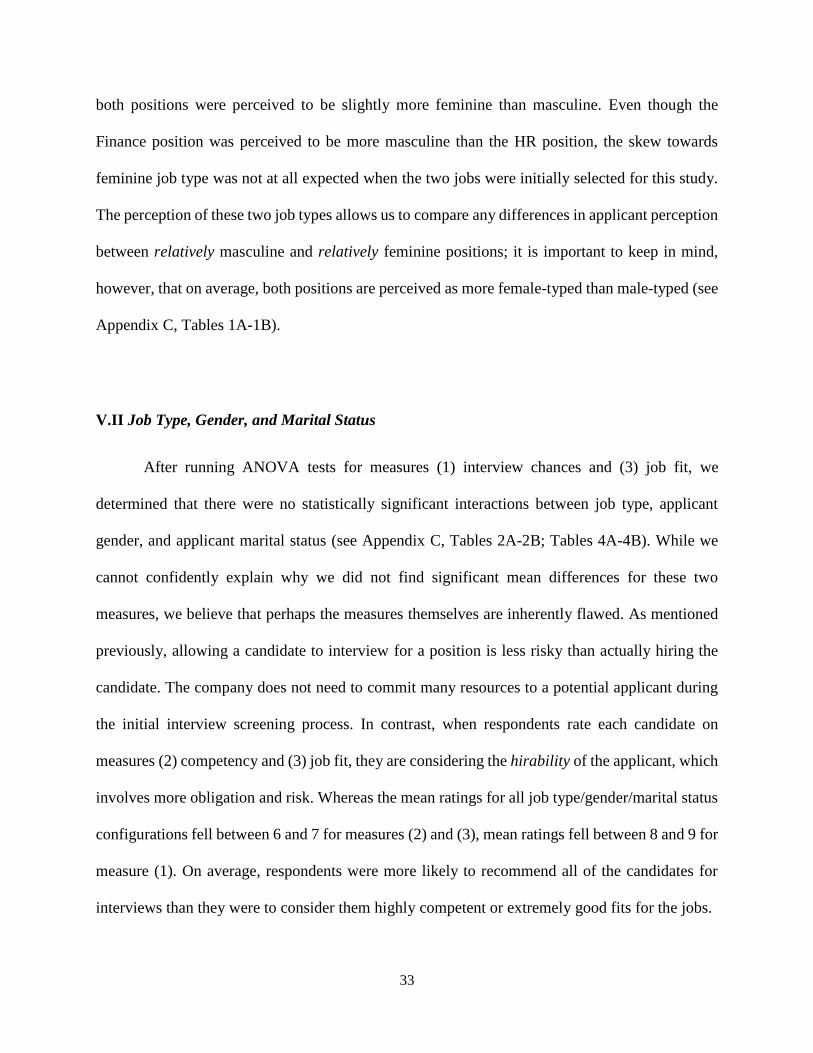
GRAPH VI(a). COMPETENCY RATINGS BY JOB TYPE AND MARITAL STATUS
GRAPH VI(b). COMPETENCY RATINGS BY MARITAL STATUS AND JOB TYPE

35
For measure (2) competency, we did find a statistically significant interaction between job
type and marital status (p=0.026; p<0.05), shown above in Graph VI(a) and VI(b). Although the
interaction between job type, marital status, and gender was not statistically significant for this
measure (p=0.685; p>0.05, see Appendix C, Tables 3A-3B), the graphs below will segment the
data by gender for increased clarity.
GRAPH VII. COMPETENCY RATINGS – GENDER AND MARITAL STATUS (DIVIDED BY JOB TYPE)
For the SFM position (“Finance”), single candidates received higher average ratings than
married candidates. For the SHRM position (“HR”), married candidates received higher average
ratings than single candidates. Whereas men applying for Finance did not appear to be rated
differently across marital statuses, women applying for Finance saw higher competency ratings
when they were single instead of married. For HR, both women and men received higher ratings
when they were married, although the effect appears to be more pronounced for men (see Graph
VII, above).
36
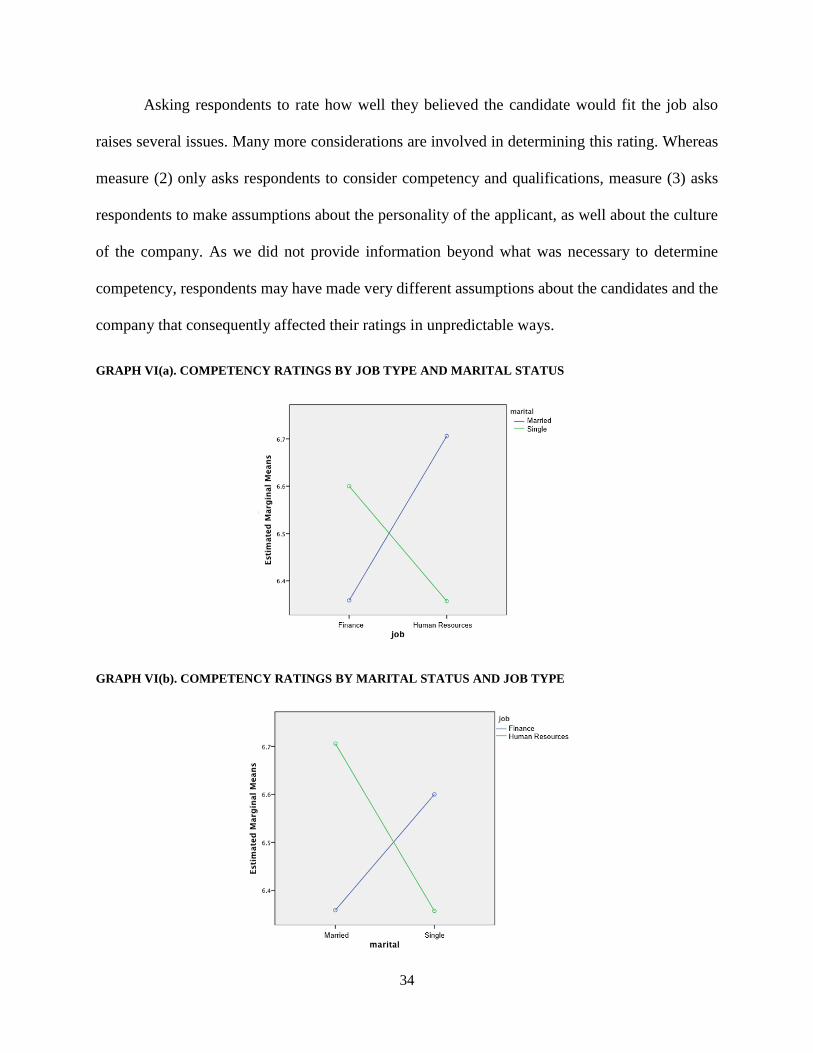
GRAPH VIII. COMPETENCY RATINGS – GENDER AND JOB TYPE (DIVIDED BY MARITAL STATUS)
Graph VIII illustrates the same competency data by dividing the information into ratings
for married candidates and ratings for single candidates. Married candidates appear to fare better
in HR than in Finance across both genders. For single candidates, women are rated more highly in
Finance than in HR. Single men, on the other hand, are rated similarly across both job types.
V.III Respondent Political Orientation
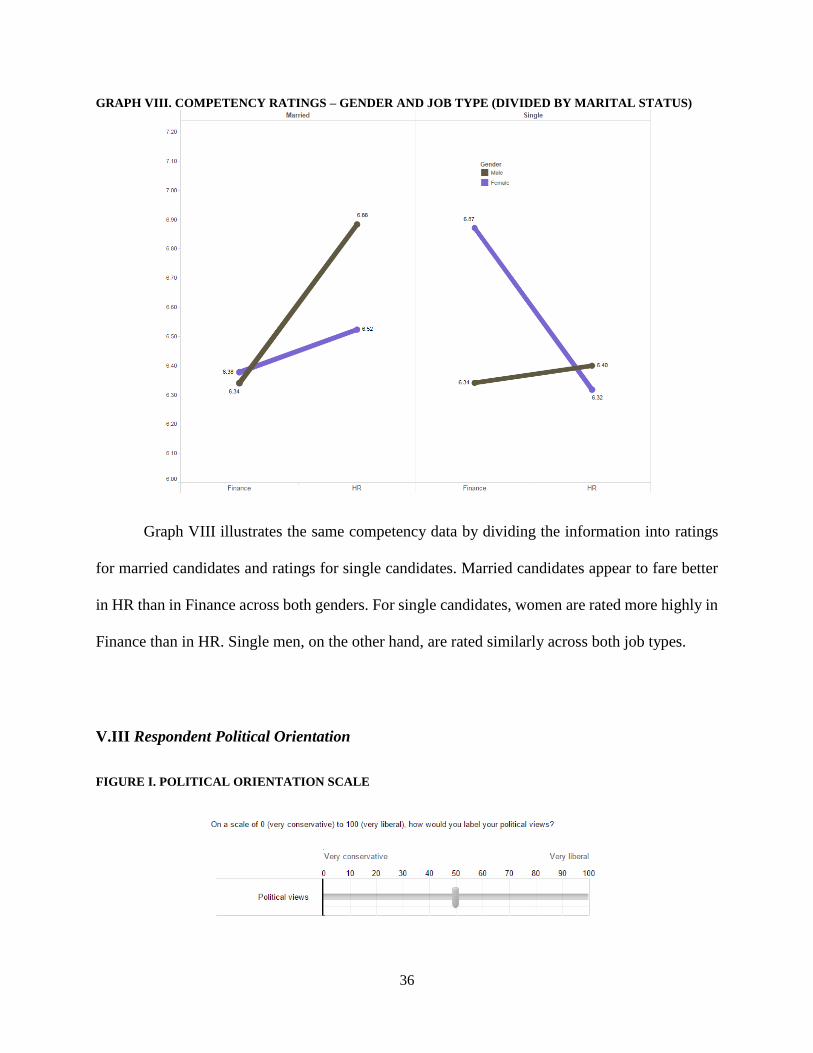
FIGURE I. POLITICAL ORIENTATION SCALE

37
After respondents completed the survey tasks, they were asked to answer a number of
demographic questions. When asked to describe their political orientation, participants were given
a 0-100 point scale in which 0 represented “very conservative” and 100 represented “very liberal”
(see Figure I, above). These scale values were then coded into two nominal categories: values from
0-50 were coded as “conservative” and values from 51-100 were coded as “liberal.” Surprisingly,
there were statistically significant interactions for two measures (interview chances and job fit)
between applicant gender, applicant marital status, and respondent political orientation (see
Appendix C, Tables 5-7).
GRAPH IX. INTERVIEW CHANCES – RESPONDENT POLITICAL ORIENTATION AND APPLICANT
MARITAL STATUS (DIVIDED BY APPLICANT GENDER)
As shown in Graph IX, both conservative and liberal respondents rated married men as
more likely to obtain interviews than single men, although the difference for liberal respondents
appears smaller in magnitude. In contrast, patterns for female interview ratings seem to have been
more influenced by the political orientation of the respondent. Whereas conservative participants
rated married women (mean=8.571) higher than single women (mean=7.520), liberal respondents
rated single women (mean=8.707) higher than married women (mean=8.308).
38
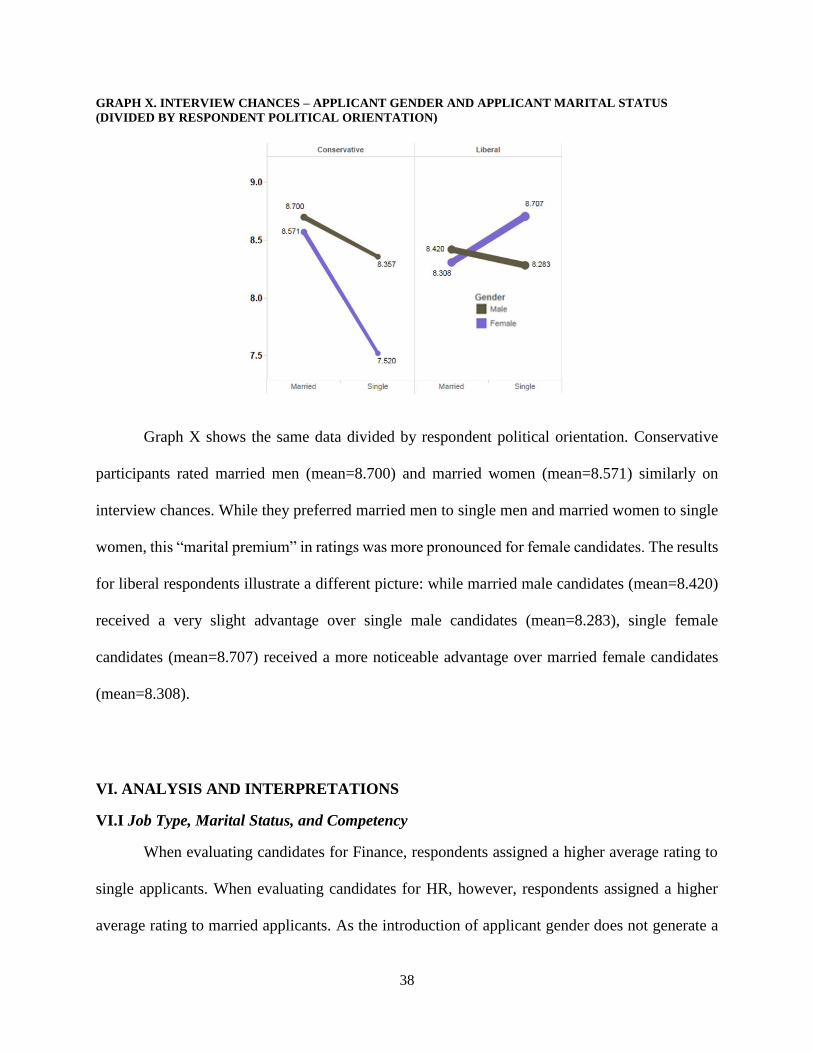
GRAPH X. INTERVIEW CHANCES – APPLICANT GENDER AND APPLICANT MARITAL STATUS
(DIVIDED BY RESPONDENT POLITICAL ORIENTATION)
Graph X shows the same data divided by respondent political orientation. Conservative
participants rated married men (mean=8.700) and married women (mean=8.571) similarly on
interview chances. While they preferred married men to single men and married women to single
women, this “marital premium” in ratings was more pronounced for female candidates. The results
for liberal respondents illustrate a different picture: while married male candidates (mean=8.420)
received a very slight advantage over single male candidates (mean=8.283), single female
candidates (mean=8.707) received a more noticeable advantage over married female candidates
(mean=8.308).
VI. ANALYSIS AND INTERPRETATIONS
VI.I Job Type, Marital Status, and Competency
When evaluating candidates for Finance, respondents assigned a higher average rating to
single applicants. When evaluating candidates for HR, however, respondents assigned a higher
average rating to married applicants. As the introduction of applicant gender does not generate a
39
statistically significant interaction, we will focus only on the influence of job type and marital
status on perceived competency for this analysis.
As mentioned previously, the two hypothetical job positions were perceived differently in
terms of masculinity and femininity; however, we do not know why respondents rated the jobs as
they did. A participant may have believed that Finance was better suited for men because the duties
listed on the job posting correspond with gender stereotypes regarding male superiority in math-
related subjects. Another participant who also believed that Finance was more male-typed may
have rated this position accordingly for a different reason: he/she could have, for example, believed
that Finance was masculine because the SFM position seemed time-consuming. Careers that
require employees to be constantly accessible may be perceived as male-typed because men are
assumed to have minimal homemaking responsibilities. Consequently, they should also have more
time to devote to work.
When we remove gender from the picture and only consider differences in marital status,
single candidates may be more readily and constantly available than married candidates simply
because they are not bound to anyone else (e.g., a spouse, children). They may also be perceived
as more geographically mobile and flexible for the same reason. Respondents may have believed
that Finance was a time-intensive, time-sensitive, and demanding industry best suited for those
with less rigid lifestyles (e.g., single applicants).
Other assumptions could have been made about the two job positions. Participants may
have relied on their understanding of what HR entails to make judgments about competency;
specifically, they may have thought of HR qualifications in terms of conflict resolution
capabilities, teamwork experience, and “people skills.” A Senior HR Manager will no doubt be in
constant communication with different employees across all branches of the organization. Perhaps
40
for HR, these particular skills are more characteristic of married men and women who, by virtue
of being married, are constantly “teammates” to their spouses.
Marriage generally involves a degree of confrontation and negotiation that bachelorship
does not. Partners may not always agree with each other at first; however, because separation (e.g.,
divorce) is often more complicated in marriage, husbands and wives are often forced to work
together to arrive at an agreed-upon solution. While we cannot confidently attribute competency
rating patterns to the above reasons, we can acknowledge that these rating differences are
significant for this particular sample of respondents.
VI.II Marital Status, Gender, and Political Orientation
There is a significant interaction between applicant marital status, applicant gender, and
respondent political orientation for measures (1) interview chances and (3) job fit (see Appendix
C, Tables 5-7). For interview chances, conservatives assigned both men and women marital
premiums; they were more likely to recommend married male candidates and married female
candidates for interviews compared with single male candidates and single female candidates,
respectively. This difference in average ratings was larger for female candidates being evaluated
by conservative respondents (see Graph X). As these trends were significant, they warrant further
investigation.
Although all eight hypothetical candidates were assigned identical attributes except for
their gender, marital status, and academic major (which corresponded with job type), perhaps
respondents from different political backgrounds assigned different meanings to these identical
attributes. Age, when taken into consideration with marital status, may generate different
41
assumptions about the applicants depending on whether the respondent identified as conservative
or liberal.
Conservative participants, for example, may be more likely to champion a traditional
division of household labor wherein the married woman does not work at all. This gender role
expectation would have led us to believe that conservative participants would give married women
lower ratings than single women. As we observe in our responses, however, the opposite is true:
conservative participants rated married women higher than single women. This gap between our
intuitive expectations and our survey results may be attributed to how conservative participants
perceive age 33. To a group of individuals who generally believe in earlier first marriage ages
(Cahn and Carbone, “Talk of the Nation: Family Values in Red States v. Blue States”), 33 may be
too old for both men and women to be single. Applicants who remain single through this age may,
through the eyes of conservative individuals, have an inherent character flaw; perhaps these
candidates are unable to find spouses because they are unlikeable, uncooperative, or unreliable.
These very same negative personality traits can be translated into negative employee
characteristics. Perceiving single 33-year-old candidates in this way may have led to lower
measure (1) ratings for conservative respondents.
In contrast, liberal participants provided responses that more closely mirrored our initial
hypotheses; namely, female candidates benefited from being single and male candidates benefited
from being married. Initially, we had expected liberal respondents to rate both genders similarly
across marital statuses, as they are more likely to champion gender equality and progressive gender
roles than their conservative counterparts. This expectation was not supported by the data and
liberal respondents did not appear to be immune to gender and marital stereotypes.
42
Age 33, for liberals, may be perceived as the beginning of marriage and family formation.
In New York, for example, the median first marriage age is 29 for women ("Median Age at First
Marriage for Women”). It is not unreasonable to assume that newlyweds may be thinking about
beginning families approximately 2-4 years after marriage. Given the existing trends in household
work division, it is also not unreasonable to assume that the married female candidates will be
taking on the majority of the housework once these couples begin settling down (Brines 682).
Unlike conservative respondents, perhaps liberal participants were less concerned with when
women should get married and more concerned with how their availability will be affected once
they are.
Although there is no conclusive proof supporting the claim that married men are more
productive than single men, there is evidence to suggest that women are more likely than men to
take time off for family considerations (England, “Gender Inequality in Labor Market: The Role
of Motherhood and Segregation”, 265). This may partly explain why both liberals and
conservatives assigned higher ratings to married men than to single men. Whereas husbands are
assumed to have wives who take care of cooking, cleaning, and childcare, bachelors are assumed
to be responsible for these tasks themselves. As such, single men may not be as readily available
and constantly accessible as married men. In addition, respondents may have also assigned positive
traits to married men (e.g., loyal, committed, hardworking), which only further widens the measure
(1) ratings gap between the two marital statuses (Kmec, Huffman, and Penner 465).
43
VII. APPLICATIONS
Hypothesis 1: Men will benefit from being married in the hiring
process. Employers will give married men higher ratings than single
men, all other things equal.
Hypothesis 2: Women will benefit from being single in the hiring
process. Employers will give single women higher ratings than
married women, all other things equal.
While we were unable to find sufficient evidence to support either hypothesis, we identified
a statistically significant relationship between marital status and job type for measure (2)
competency. For the purposes of identifying applications for this research, we will assume that
this sample interaction can be applied to the American population at large. Assuming, also, that
hiring married candidates brings forth legitimate concerns regarding accessibility and job
commitment, it is nonetheless important to remember that Americans marriage rates are declining
alongside the rise of cohabitation (Seltzer 925). If cohabitation is rising as a replacement for
institutionalized marriage, then perhaps using legal marital status to determine a candidate’s
competency is even less accurate today than it had been half a century ago. After all, the
relationships between married couples and cohabiting couples are becoming increasingly similar;
more and more cohabiting couples are having children with their partners without seeking official
marriage licenses (Seltzer 925).
A candidate who is legally single may actually be involved in a relationship that closely
mirrors legal marriage. Assigning this single candidate a competency premium or penalty based
upon marital status therefore becomes senseless and unfair to the applicant, as well as to the
44
company. Using unsubstantiated levers to determine candidate competency will likely shrink a
company’s applicant pool unnecessarily and make it more difficult for HR departments to source
the best possible talent.
When respondent political orientation was injected into the analysis, we did find
interactions between applicant marital status and applicant gender for measures (1) interview
chances and (3) job fit in support of both Hypothesis 1 and Hypothesis 2. Specifically, liberal
respondents rated single female candidates and married male candidates higher than married
female candidates and single male candidates, respectively. In order to better understand these
relationships, further research must be conducted to understand the political differences both
within a company and between companies/industries. If, for example, conservative employees tend
to be more highly concentrated in the leadership and decision-making roles of a particular
company, this political makeup may skew the demographic of new hires unfairly towards married
men and married women. In contrast, if liberal employees tend to be more highly concentrated
towards the top of an organizational pyramid, perhaps more new hires will be single women instead
of married women.
It is important to further examine the relationship between an employer’s political
orientation and an applicant’s gender/marital status, especially if future research detects a
particular political makeup across most organizations instead of just one. If conservatives tend to
hold gatekeeping managerial roles across many organizations, the effects of employer political
orientation on candidate screening will be more systematic.
45
VIII. LIMITATIONS & FURTHER RESEARCH
VIII.I Threats to Internal Validity
Maturation Effect – Maturation effects can take place during the very short term. While the
Qualtrics survey should have taken respondents no more than 15-20 minutes to complete, it is
unlikely that all 341 subjects were fully focused on the task at hand for the entire duration of the
experiment. Factors such as tiredness, boredom, and inattention can occur when participants
answer all the survey questions. Experimental fatigue can also take place if reading through the
application materials is too mentally demanding. Further, whereas real HR representatives are
invested in candidate screening decisions because their career prospects and salaries are tied to
their job performance, survey respondents may be more easily distracted or affected by boredom
because they have less at stake.
Selection-Maturation Effect – It is also possible that certain participant groups experienced
a higher rate of maturation than other participant groups. For example, most of the sample
respondents did not work in Finance (see Appendix A, Table 9). Participants who were asked to
evaluate a Finance candidate may have found it difficult to understand the industry-specific
terminology used in the job posting. This difficulty could have led to higher rates of boredom and
inattention amongst those evaluating Finance candidates compared to those evaluating HR
candidates.
Testing Effect – A pretest was created and administered via Amazon mTurk before the
finalized survey questionnaire was distributed through the same channel. While we were able to
prevent the same participants from taking the finalized study more than once, we could not,
through Qualtrics and mTurk, prevent a participant from taking the finalized survey after he/she
has already taken the pretest. Subjects who took the pretest may have anchored their later responses
46
upon what they had rated previously. Instead of carefully reading through the finalized study
materials, respondents could have simply recalled the structure and general content of the pretest.
Their familiarity with this structure and content could have influenced their applicant ratings for
the finalized survey.
VIII.II Threats to External Validity
Non-representative Sample – Only 2.9% of survey participants work in HR (see Appendix
A, Table 8). As such, the sample is not representative of the target population. Ideally, the
experiment participants would be real HR Sourcing employees working at the company being
studied. Unlike the respondents of this study, HR employees may be more cognizant of gender and
marital status biases in the interview process. They would also have a clearer understanding of the
corporate culture, as they are immersed in the organization on a daily basis. Most importantly, HR
representatives are more experienced in applicant sourcing; perhaps they rely on different
employee attributes than members of the sample population to make judgments about interview
chances, competency, and job fit. Altering this study to include only real HR employees can help
lessen the effects of non-representative sampling. We can also consider expanding this study into
a field experiment in which false applications and resumes are submitted to real HR departments.
Instead of measuring perceived competency and job fit, we could measure only interview chances
based upon employer response rate (e.g., email, telephone call, etc.)
Reactive Bias – Participants may have exhibited unusual behavior simply because they are
aware of their involvement in the experiment. The purpose of the study was not explicitly stated
before the participants began evaluating applicants. We were afraid that such information would
47
encourage respondents to assign ratings that departed from their true evaluations. As we did not
reveal the experiment objective, respondent ratings may have been influenced by what participants
believed the survey was testing. When asked to leave comments at the very end of the survey, one
respondent typed, “Pretty sure you can’t legally ask for marital status.” Another wrote, “I think all
jobs are for both sexes and it should not be a consideration in a hiring scenario.” A third participant
explained, “I feel like race should be left off of applications. Gender too (though it’s easier to tell
given a name).” These comments suggest that some participants were keenly aware of the fact that
individuating information was provided to them. In order to appear nondiscriminatory, for
example, some participants may have adjusted their ratings to what they believed were “correct.”
In addition, the hypothetical candidate’s demographic information was not presented to
study participants in an organic way. A respondent noted, “My answers were predicated upon the
lack of a resume. The only information I saw about the applicant were the cover letter, basic
demographics, and schooling. There was no resume that showed job experience and
accomplishments. Anyone applying for this position ought to have one.” Expanding this study into
a field experiment would decrease the effects of both non-representative sampling and reactive
bias. A realistic cover letter can be created to reveal marital status more discreetly than simply
listing an applicant’s marital status on an unrealistic information sheet. The field experiment
subjects would be evaluating what they believe to be real applicant credentials.
IX. CONCLUSIONS
This study contributes to an ever-growing, ever-changing school of literature on gender
and work. Hiring experiments tend to revolve around gender discrimination because a candidate’s
48
gender is often easy to identify through his/her name, as well as through his/her physical
presentation. We believe, however, that while such research is important, it does not capture all of
the biases that arise when employers evaluate candidates. According to this study, respondents
perceive single candidates and married candidates differently depending on the type of jobs they
apply for. There are also significant interactions between applicant marital status, applicant gender,
and respondent political orientation that warrant more exploration in future studies.
Marital status is not restricted to the personal sphere. A comment as innocuous as “I’m
meeting my wife after this interview” can reveal a candidate’s marital status. A quick flash of a
wedding band can do the same. Whether such information benefits or hurts the applicant in the
hiring process seems to depend on a variety of factors (e.g., stereotypes, expectations, etc.) outside
of the applicant’s own control. If we want to be able to hire the best possible talent for our
companies and organizations, we should examine these factors in further detail. If stereotypes
regarding heightened productivity of married men and decreased productivity of married women
are not legitimate, relying even partly on applicant marital status may needlessly decrease the size
of company applicant pools. Filtering out a hardworking, qualified candidate who otherwise would
have been best suited for the job will undoubtedly hurt the company just as it hurts the candidate.
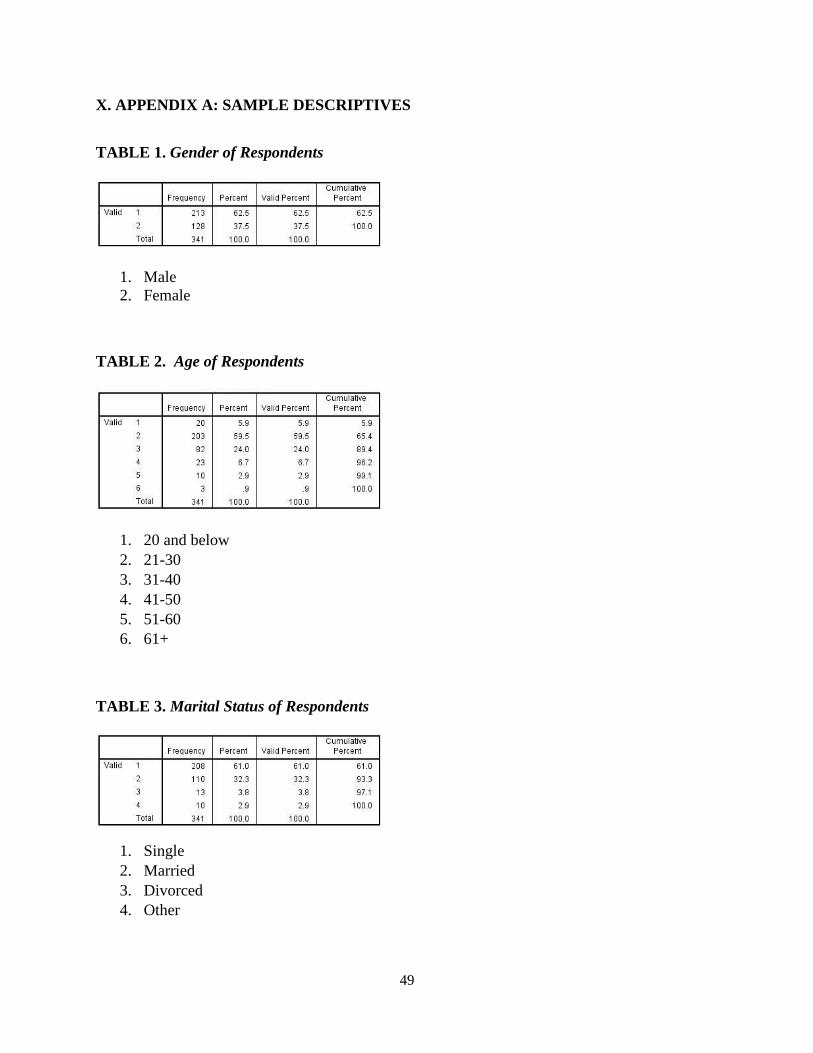
49
X. APPENDIX A: SAMPLE DESCRIPTIVES
TABLE 1. Gender of Respondents
1. Male
2. Female
TABLE 2. Age of Respondents
1. 20 and below
2. 21-30
3. 31-40
4. 41-50
5. 51-60
6. 61+
TABLE 3. Marital Status of Respondents
1. Single
2. Married
3. Divorced
4. Other
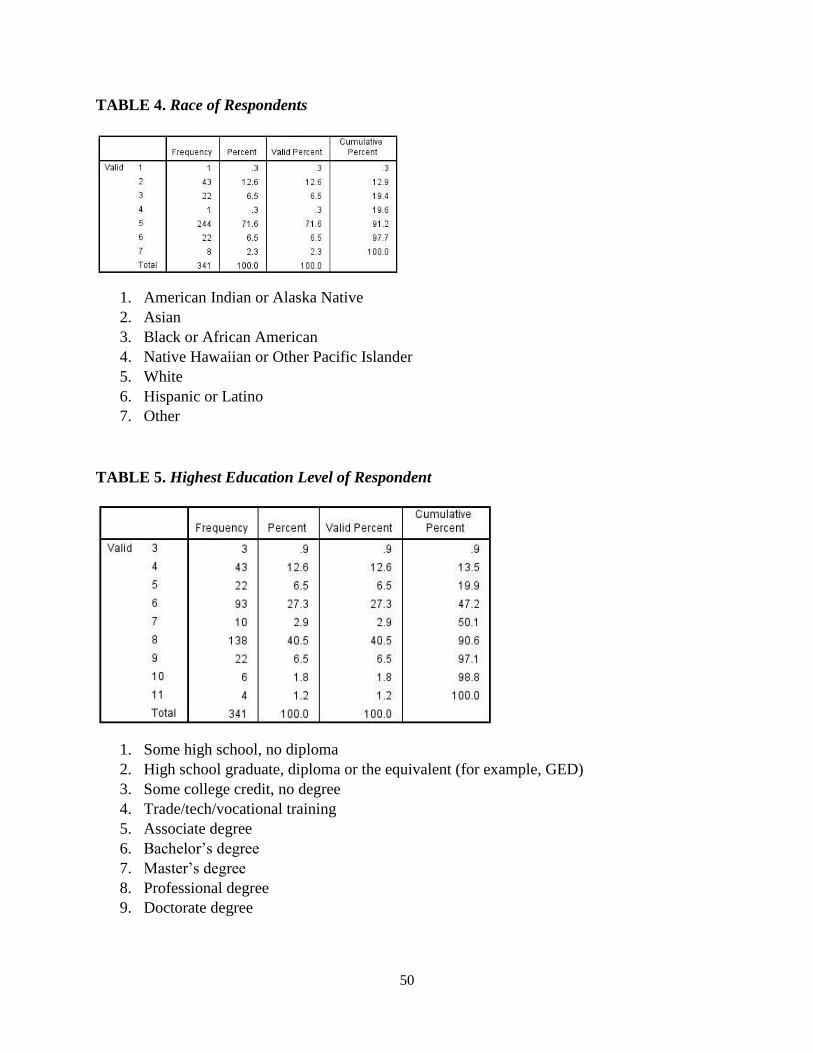
50
TABLE 4. Race of Respondents
1. American Indian or Alaska Native
2. Asian
3. Black or African American
4. Native Hawaiian or Other Pacific Islander
5. White
6. Hispanic or Latino
7. Other
TABLE 5. Highest Education Level of Respondent
1. Some high school, no diploma
2. High school graduate, diploma or the equivalent (for example, GED)
3. Some college credit, no degree
4. Trade/tech/vocational training
5. Associate degree
6. Bachelor’s degree
7. Master’s degree
8. Professional degree
9. Doctorate degree
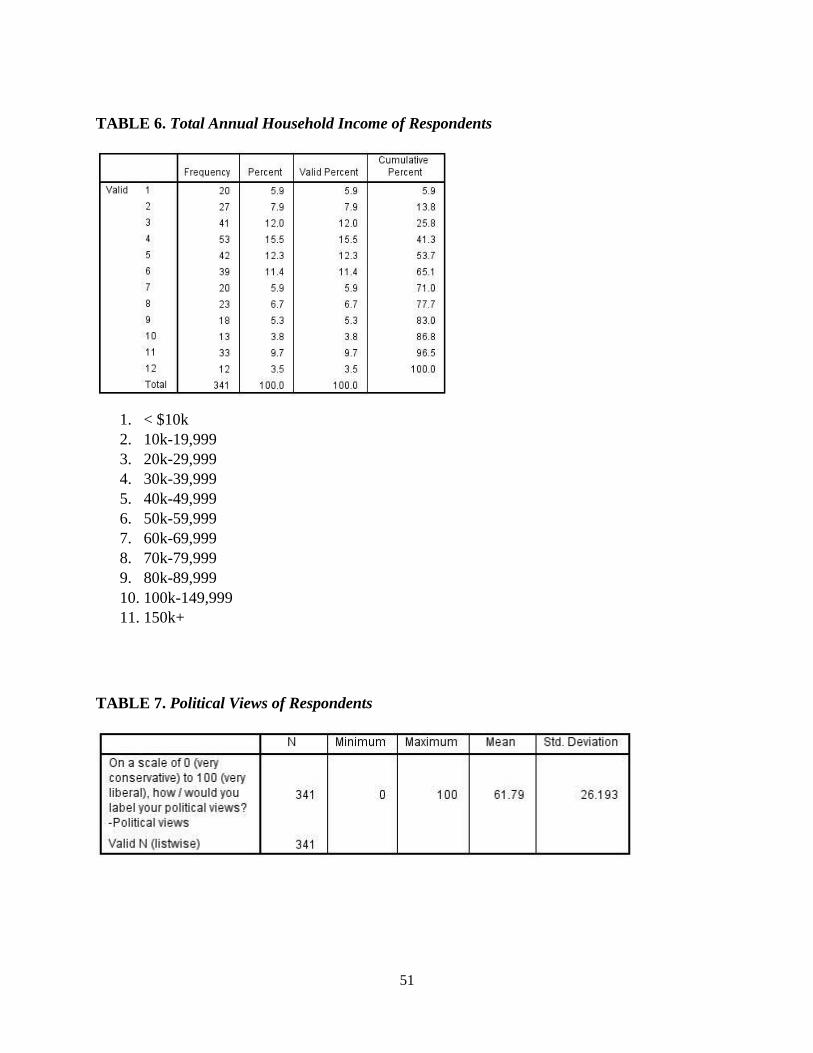
51
TABLE 6. Total Annual Household Income of Respondents
1. < $10k
2. 10k-19,999
3. 20k-29,999
4. 30k-39,999
5. 40k-49,999
6. 50k-59,999
7. 60k-69,999
8. 70k-79,999
9. 80k-89,999
10. 100k-149,999
11. 150k+
TABLE 7. Political Views of Respondents
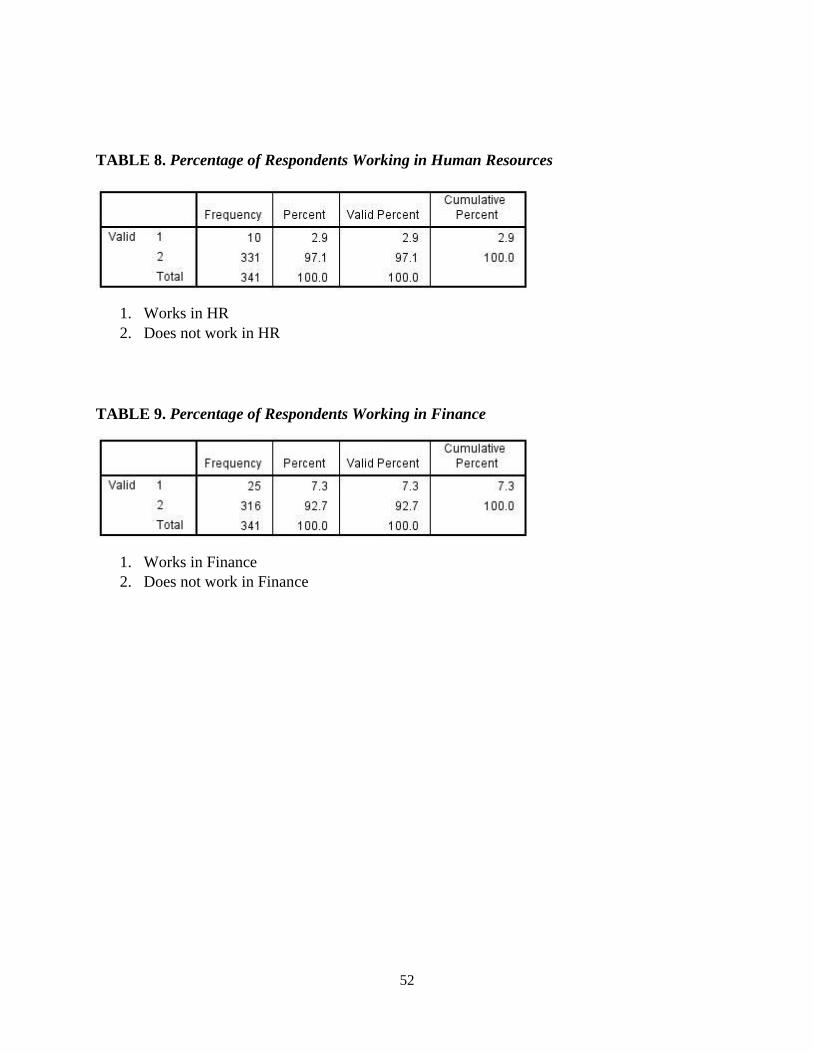
52
TABLE 8. Percentage of Respondents Working in Human Resources
1. Works in HR
2. Does not work in HR
TABLE 9. Percentage of Respondents Working in Finance
1. Works in Finance
2. Does not work in Finance
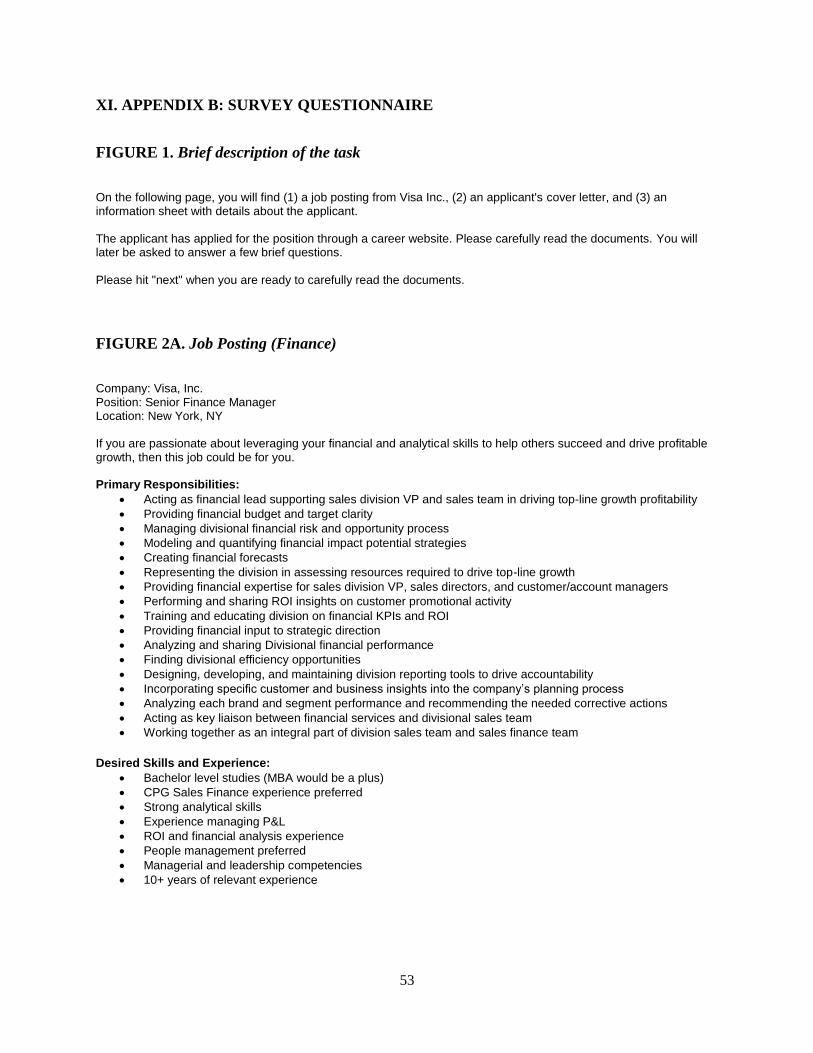
53
XI. APPENDIX B: SURVEY QUESTIONNAIRE
FIGURE 1. Brief description of the task
On the following page, you will find (1) a job posting from Visa Inc., (2) an applicant's cover letter, and (3) an information sheet with details about the applicant. The applicant has applied for the position through a career website. Please carefully read the documents. You will later be asked to answer a few brief questions. Please hit "next" when you are ready to carefully read the documents.
FIGURE 2A. Job Posting (Finance)
Company: Visa, Inc. Position: Senior Finance Manager Location: New York, NY If you are passionate about leveraging your financial and analytical skills to help others succeed and drive profitable growth, then this job could be for you. Primary Responsibilities:
Acting as financial lead supporting sales division VP and sales team in driving top-line growth profitability
Providing financial budget and target clarity
Managing divisional financial risk and opportunity process
Modeling and quantifying financial impact potential strategies
Creating financial forecasts
Representing the division in assessing resources required to drive top-line growth
Providing financial expertise for sales division VP, sales directors, and customer/account managers
Performing and sharing ROI insights on customer promotional activity
Training and educating division on financial KPIs and ROI
Providing financial input to strategic direction
Analyzing and sharing Divisional financial performance
Finding divisional efficiency opportunities
Designing, developing, and maintaining division reporting tools to drive accountability
Incorporating specific customer and business insights into the company’s planning process
Analyzing each brand and segment performance and recommending the needed corrective actions
Acting as key liaison between financial services and divisional sales team
Working together as an integral part of division sales team and sales finance team
Desired Skills and Experience:
Bachelor level studies (MBA would be a plus)
CPG Sales Finance experience preferred
Strong analytical skills
Experience managing P&L
ROI and financial analysis experience
People management preferred
Managerial and leadership competencies
10+ years of relevant experience

54
FIGURE 2B. Job Posting (Human Resources)
Company: Visa, Inc. Position: Senior Human Resources Manager Location: New York, NY The Senior Human Resources Manager is primarily responsible for the strategic and executional leadership of all aspects of the HR function and department: staffing and recruiting, talent management, diversity and inclusion, employee relations, employee engagement, workers’ compensation, leadership development/training, and community involvement. Additionally, this role is an intricate part of the Business Unit HR Leadership team. Primary Responsibilities:
Develops and executes initiatives that:
Increase employee engagement and continue to lead company towards a performance-driven, values-led culture that delivers business results
Build the leadership pipeline and improve organizational and individual capabilities
Improve employee relations and workforce planning
Continue engagement with local community initiatives
Maintain positive employee relations through effective communications and issue resolution, as well as through the administration of company policies and procedures
Ensure that short- and long-term training and development programs are developed and executed in line with business needs
Ensure talent management processes are in place to include performance management, development planning and goal setting, succession planning, etc.
Responsible for all diversity and inclusion activities
Responsible for all staffing and recruitment activities for the facility
Desired Skills and Experience:
Bachelor’s Degree in Business, Human Resources, Communications or related field
A minimum of 8-10 years of progressive Human Resources experience
A minimum of 3 years of management/supervisory experience
Experience working within a team-based environment required
Excellent communication and presentation skills and the ability to work individuals across all levels of the organization
Excellent drive for results, problem solving and conflict management abilities
Strong strategic planning and execution
Ability to deal with ambiguity
Demonstrated leadership and good organizational skills
Experience in Union and non-Union environments
Ability to travel up to 5% required
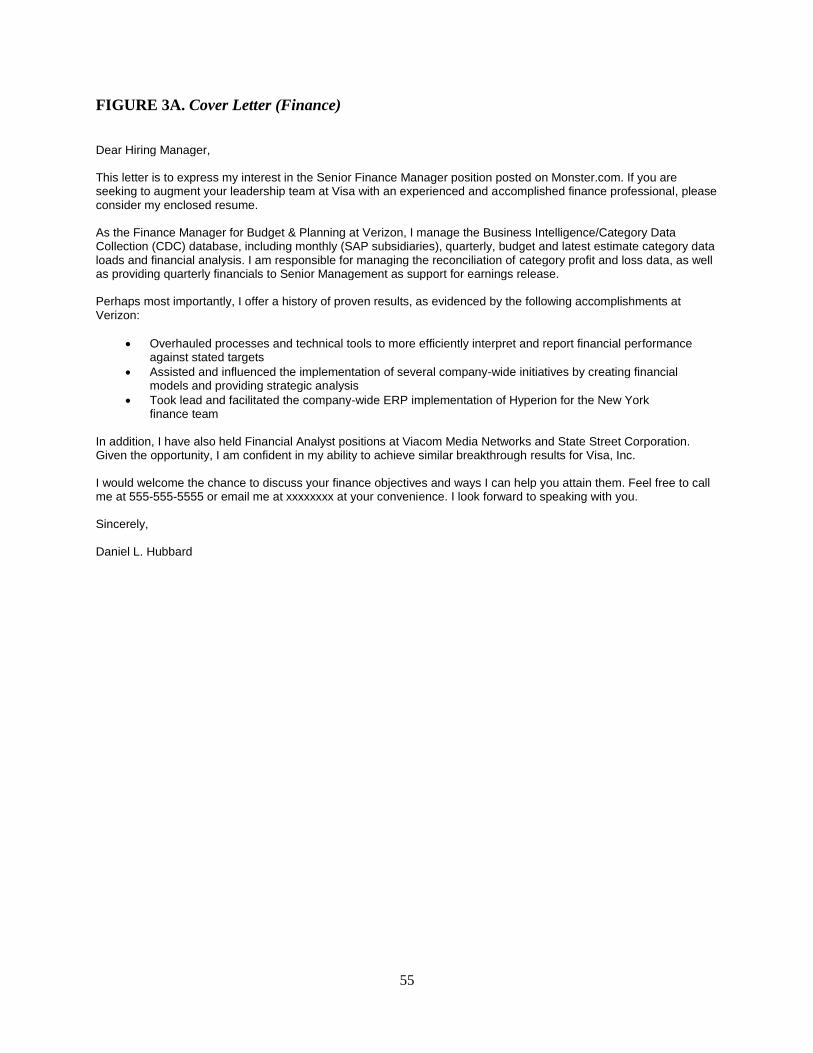
55
FIGURE 3A. Cover Letter (Finance)
Dear Hiring Manager, This letter is to express my interest in the Senior Finance Manager position posted on Monster.com. If you are seeking to augment your leadership team at Visa with an experienced and accomplished finance professional, please consider my enclosed resume. As the Finance Manager for Budget & Planning at Verizon, I manage the Business Intelligence/Category Data Collection (CDC) database, including monthly (SAP subsidiaries), quarterly, budget and latest estimate category data loads and financial analysis. I am responsible for managing the reconciliation of category profit and loss data, as well as providing quarterly financials to Senior Management as support for earnings release. Perhaps most importantly, I offer a history of proven results, as evidenced by the following accomplishments at Verizon:
Overhauled processes and technical tools to more efficiently interpret and report financial performance against stated targets
Assisted and influenced the implementation of several company-wide initiatives by creating financial models and providing strategic analysis
Took lead and facilitated the company-wide ERP implementation of Hyperion for the New York finance team
In addition, I have also held Financial Analyst positions at Viacom Media Networks and State Street Corporation. Given the opportunity, I am confident in my ability to achieve similar breakthrough results for Visa, Inc. I would welcome the chance to discuss your finance objectives and ways I can help you attain them. Feel free to call me at 555-555-5555 or email me at xxxxxxxx at your convenience. I look forward to speaking with you. Sincerely, Daniel L. Hubbard
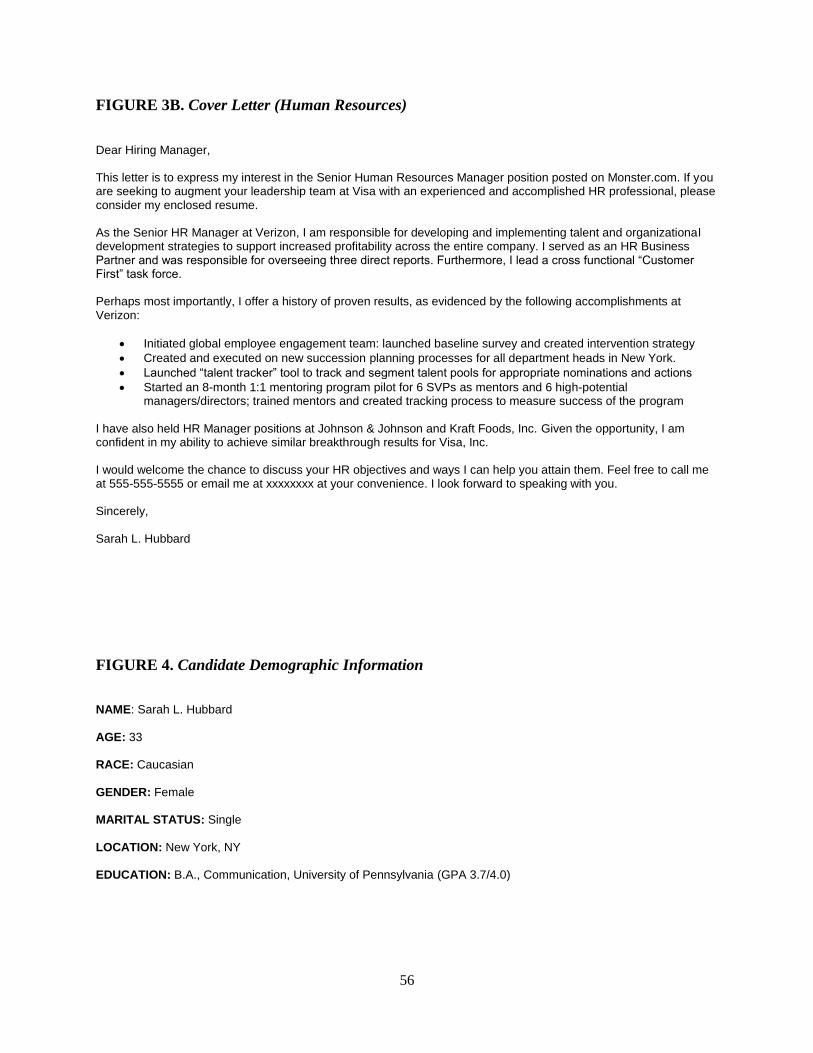
56
FIGURE 3B. Cover Letter (Human Resources)
Dear Hiring Manager, This letter is to express my interest in the Senior Human Resources Manager position posted on Monster.com. If you are seeking to augment your leadership team at Visa with an experienced and accomplished HR professional, please consider my enclosed resume. As the Senior HR Manager at Verizon, I am responsible for developing and implementing talent and organizational development strategies to support increased profitability across the entire company. I served as an HR Business Partner and was responsible for overseeing three direct reports. Furthermore, I lead a cross functional “Customer First” task force. Perhaps most importantly, I offer a history of proven results, as evidenced by the following accomplishments at Verizon:
Initiated global employee engagement team: launched baseline survey and created intervention strategy
Created and executed on new succession planning processes for all department heads in New York.
Launched “talent tracker” tool to track and segment talent pools for appropriate nominations and actions
Started an 8-month 1:1 mentoring program pilot for 6 SVPs as mentors and 6 high-potential managers/directors; trained mentors and created tracking process to measure success of the program
I have also held HR Manager positions at Johnson & Johnson and Kraft Foods, Inc. Given the opportunity, I am confident in my ability to achieve similar breakthrough results for Visa, Inc. I would welcome the chance to discuss your HR objectives and ways I can help you attain them. Feel free to call me at 555-555-5555 or email me at xxxxxxxx at your convenience. I look forward to speaking with you. Sincerely, Sarah L. Hubbard
FIGURE 4. Candidate Demographic Information
NAME: Sarah L. Hubbard
AGE: 33
RACE: Caucasian
GENDER: Female
MARITAL STATUS: Single
LOCATION: New York, NY
EDUCATION: B.A., Communication, University of Pennsylvania (GPA 3.7/4.0)
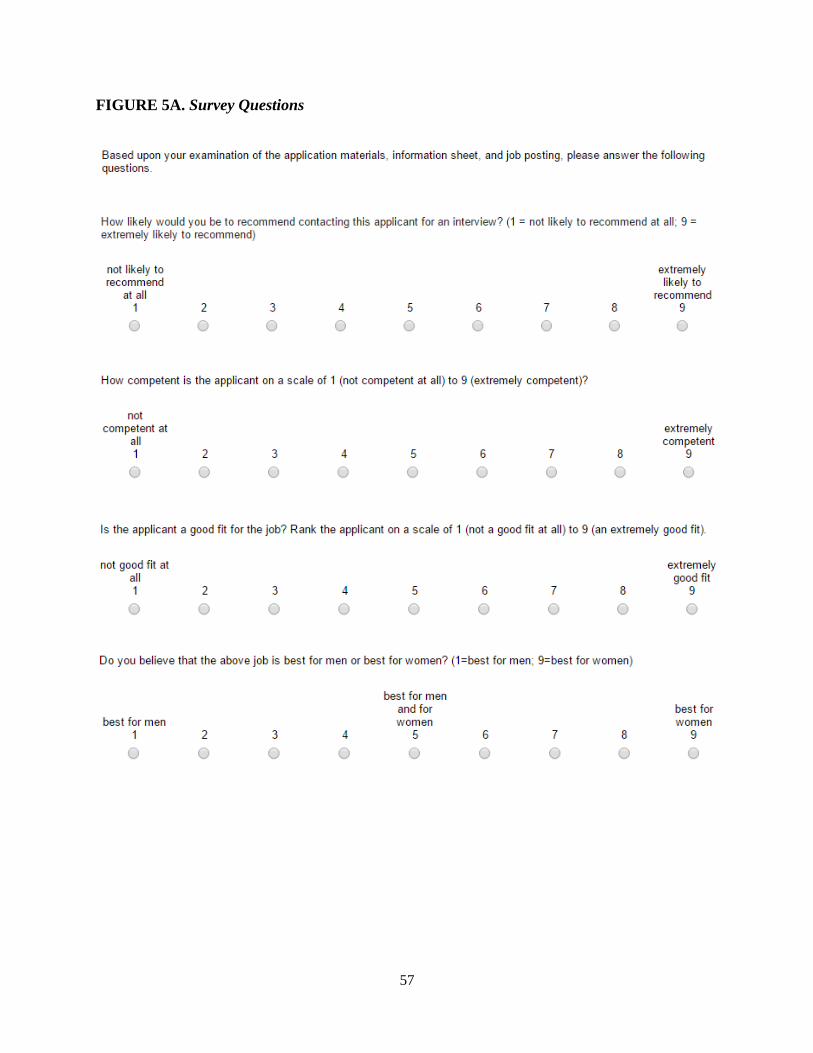
57
FIGURE 5A. Survey Questions
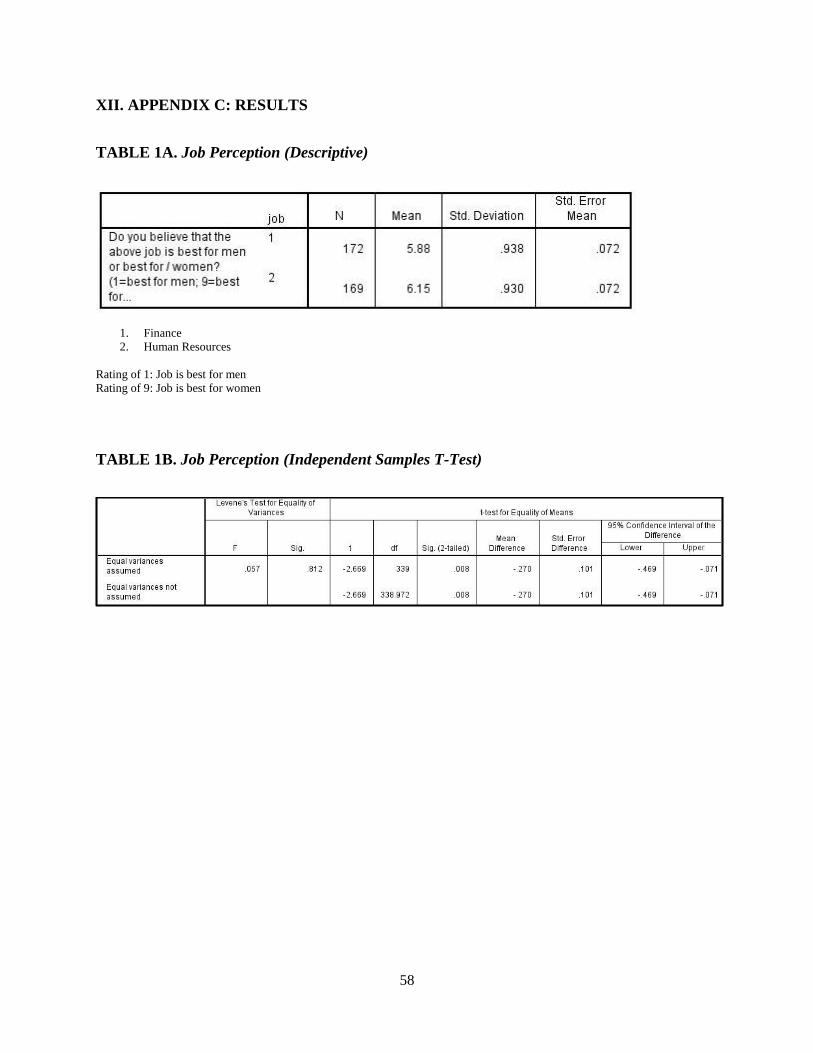
58
XII. APPENDIX C: RESULTS
TABLE 1A. Job Perception (Descriptive)
1. Finance
2. Human Resources
Rating of 1: Job is best for men
Rating of 9: Job is best for women
TABLE 1B. Job Perception (Independent Samples T-Test)

59
TABLE 2A. Interview Chances (Descriptive)
Job: (1) Finance (2) HR
Gender: (1) Male (2) Female
Marital: (1) Married (2) Single
Rating of 1: Not likely to recommend contacting the candidate for an interview at all
Rating of 9: Extremely likely to recommend contacting the candidate for an interview
TABLE 2B. Interview Chances (ANOVA)
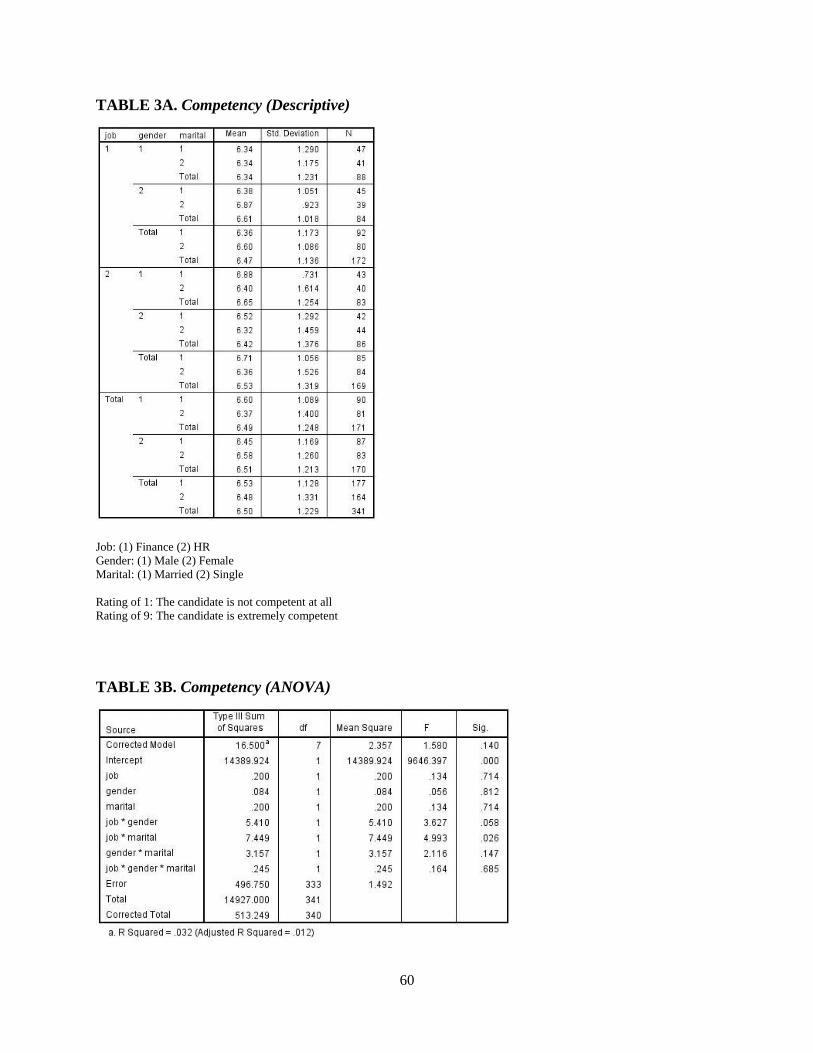
60
TABLE 3A. Competency (Descriptive)
Job: (1) Finance (2) HR
Gender: (1) Male (2) Female
Marital: (1) Married (2) Single
Rating of 1: The candidate is not competent at all
Rating of 9: The candidate is extremely competent
TABLE 3B. Competency (ANOVA)

61
TABLE 4A. Job Fit (Descriptive)
Job: (1) Finance (2) HR
Gender: (1) Male (2) Female
Marital: (1) Married (2) Single
Rating of 1: The candidate is not at all a good fit for the job
Rating of 9: The candidate is an extremely good fit for the job
TABLE 4B. Job Fit (ANOVA)

62
TABLE 5. Interview Chances and Political Orientation (ANOVA)
Dependent Variable: How likely / would you be to recommend contacting this applicant for an / interview? (1 =
not likely...
Source
Type III Sum of
Squares df Mean Square F Sig.
Corrected Model 46.385a 15 3.092 1.681 .053
Intercept 20964.209 1 20964.209 11394.450 .000
job 3.094 1 3.094 1.682 .196
marital 7.164 1 7.164 3.894 .049
gender 3.155 1 3.155 1.715 .191
political 2.249 1 2.249 1.223 .270
job * marital .366 1 .366 .199 .656
job * gender 1.700 1 1.700 .924 .337
job * political 9.381 1 9.381 5.099 .025
marital * gender .207 1 .207 .113 .738
marital * political 14.321 1 14.321 7.784 .006
gender * political 8.525 1 8.525 4.634 .032
job * marital * gender .292 1 .292 .159 .691
job * marital * political .333 1 .333 .181 .671
job * gender * political .663 1 .663 .360 .549
marital * gender *
political 8.213 1 8.213 4.464 .035
job * marital * gender *
political .040 1 .040 .022 .882
Error 597.955 325 1.840
Total 24749.000 341
Corrected Total 644.340 340
a. R Squared = .072 (Adjusted R Squared = .029)
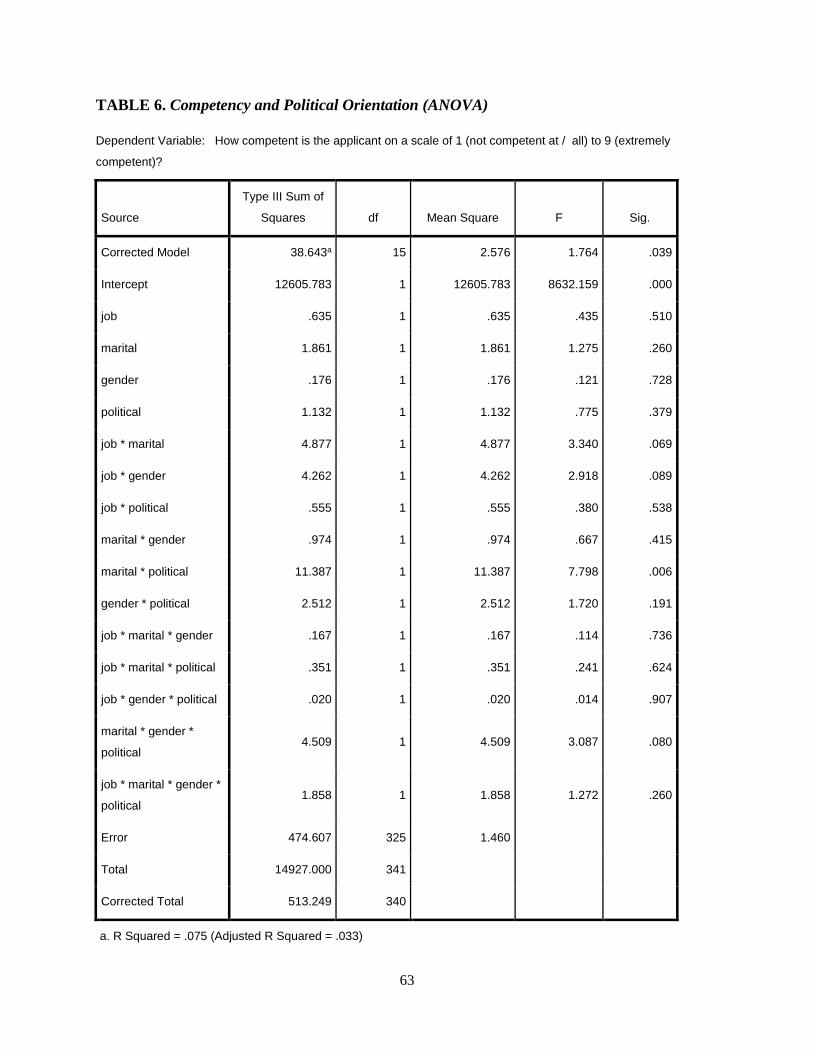
63
TABLE 6. Competency and Political Orientation (ANOVA)
Dependent Variable: How competent is the applicant on a scale of 1 (not competent at / all) to 9 (extremely
competent)?
Source
Type III Sum of
Squares df Mean Square F Sig.
Corrected Model 38.643a 15 2.576 1.764 .039
Intercept 12605.783 1 12605.783 8632.159 .000
job .635 1 .635 .435 .510
marital 1.861 1 1.861 1.275 .260
gender .176 1 .176 .121 .728
political 1.132 1 1.132 .775 .379
job * marital 4.877 1 4.877 3.340 .069
job * gender 4.262 1 4.262 2.918 .089
job * political .555 1 .555 .380 .538
marital * gender .974 1 .974 .667 .415
marital * political 11.387 1 11.387 7.798 .006
gender * political 2.512 1 2.512 1.720 .191
job * marital * gender .167 1 .167 .114 .736
job * marital * political .351 1 .351 .241 .624
job * gender * political .020 1 .020 .014 .907
marital * gender *
political 4.509 1 4.509 3.087 .080
job * marital * gender *
political 1.858 1 1.858 1.272 .260
Error 474.607 325 1.460
Total 14927.000 341
Corrected Total 513.249 340
a. R Squared = .075 (Adjusted R Squared = .033)
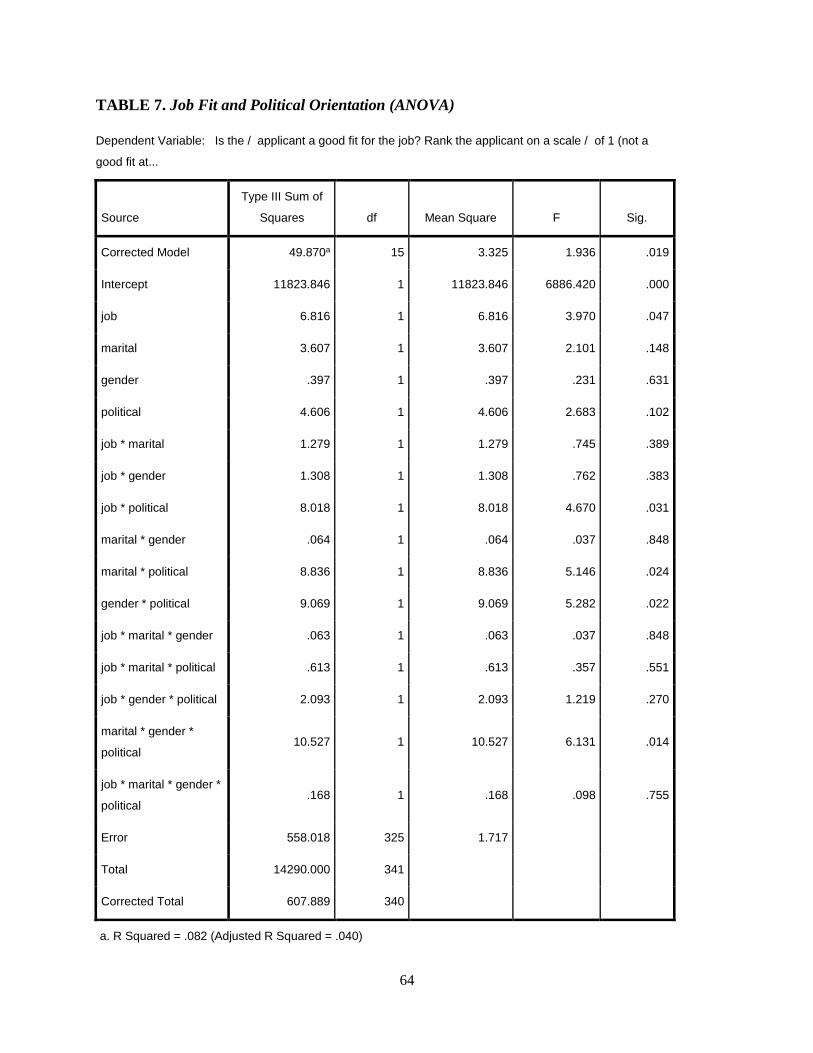
64
TABLE 7. Job Fit and Political Orientation (ANOVA)
Dependent Variable: Is the / applicant a good fit for the job? Rank the applicant on a scale / of 1 (not a
good fit at...
Source
Type III Sum of
Squares df Mean Square F Sig.
Corrected Model 49.870a 15 3.325 1.936 .019
Intercept 11823.846 1 11823.846 6886.420 .000
job 6.816 1 6.816 3.970 .047
marital 3.607 1 3.607 2.101 .148
gender .397 1 .397 .231 .631
political 4.606 1 4.606 2.683 .102
job * marital 1.279 1 1.279 .745 .389
job * gender 1.308 1 1.308 .762 .383
job * political 8.018 1 8.018 4.670 .031
marital * gender .064 1 .064 .037 .848
marital * political 8.836 1 8.836 5.146 .024
gender * political 9.069 1 9.069 5.282 .022
job * marital * gender .063 1 .063 .037 .848
job * marital * political .613 1 .613 .357 .551
job * gender * political 2.093 1 2.093 1.219 .270
marital * gender *
political 10.527 1 10.527 6.131 .014
job * marital * gender *
political .168 1 .168 .098 .755
Error 558.018 325 1.717
Total 14290.000 341
Corrected Total 607.889 340
a. R Squared = .082 (Adjusted R Squared = .040)
65
XIII. RESOURCES
Acker, Joan, and Donald R. Van Houten. "Differential Recruitment And Control: The Sex
Structuring Of Organizations." Administrative Science Quarterly 19.2 (1974): 152-163.
SocINDEX with Full Text. Web. 21 Dec. 2014.
Acker, Joan. "Hierarchies, Jobs, Bodies: A Theory of Gendered Organizations." Gender &
Society (1990): 139-58. SAGE Journals Online. Web. 9 Oct. 2014.
Alger, Vanessa M., and Jocelyn Elise Crowley. "Aspects Of Workplace Flexibility And Mothers'
Satisfaction With Their Husbands' Contributions To Household Labor." Sociological
Inquiry 82.1 (2012): 78-99. SocINDEX with Full Text. Web. 21 Dec. 2014.
America's Women and the Wage Gap. National Partnership for Women & Families, Sept. 2014.
Web. 18 Apr. 2015. <http://www.nationalpartnership.org/research-library/workplace-
fairness/fair-pay/americas-women-and-the-wage-gap.pdf>.
Babel Group. "Seven Dimensions of Culture." Babel Monthly Newsletter. N.p., n.d. Web. 17
Apr. 2015.
<http://www.babelgroup.co.uk/uimages/File/babel_the_7_dimensions_of_culture.pdf>.
Bailyn, Lotte. "Redesigning Work For Gender Equity And Work-Personal Life Integration."
Community, Work & Family 14.1 (2011): 97-112. SocINDEX with Full Text. Web. 21
Dec. 2014.
Berggren, Caroline, and Nathanael Lauster. "The Motherhood Penalty And The Professional
Credential: Inequality In Career Development For Those With Professional Degrees."
International Studies In Sociology Of Education 24.1 (2014): 44-64. SocINDEX with
Full Text. Web. 21 Dec. 2014.
66
Blau, Francine D., and Lawrence M. Kohn. "The Gender Pay Gap: Have Women Gone as Far as
They Can?" Academy of Management Perspectives 21.1 (2007): n. pag. PDF file.
Bobbitt-Zeher, Donna. "Gender Discrimination At Work: Connecting Gender Stereotypes,
Institutional Policies, And Gender Composition Of Workplace." Gender & Society 25.6
(2011): 764-786. SocINDEX with Full Text. Web. 21 Dec. 2014.
Boghossian, Paul A. "What Is Social Constructionism?" Department of Philosophy: New York
University. New York University, n.d. Web. 13 Apr. 2015.
<http://philosophy.fas.nyu.edu/docs/IO/1153/socialconstruction.pdf>.
Borjas, George. Labor Economics. 4th ed. N.p.: n.p., 2007. Print.
Bosak, Janine, and Sabine Sczesny. "Gender Bias In Leader Selection? Evidence From A Hiring
Simulation Study." Sex Roles 65.3/4 (2011): 234-242. SocINDEX with Full Text. Web.
21 Dec. 2014.
Brines, Julie. "Economic Dependency, Gender, and the Division of Labor at Home." American
Journal of Sociology 100.3 (1994): 652-88. JSTOR. Web. 9 Oct. 2014.
<http://www.jstor.org/stable/pdfplus/2782401.pdf?acceptTC=true>.
Budig, Michelle J., and Paula England. "The Wage Penalty for Motherhood." American
Sociological Review 66 (2001): 204-24. PDF file.
Cabrillo, Francisco. The Economics of the Family and Family Policy. Edward Elgar Pub, 1999.
PDF file.
Cahn, Naomi, and June Carbone. Talk of the Nation: Family Values in Red States v. Blue States.
Hosted by Neal Conan. 12 May 2010. Transcript. NPR News. Web. 11 May 2015.
<http://www.npr.org/templates/story/story.php?storyId=126780035>.
67
Cech, Erin A. "The Self-Expressive Edge Of Occupational Sex Segregation." American Journal
Of Sociology 119.3 (2013): 747-789. SocINDEX with Full Text. Web. 21 Dec. 2014.
Cherlin, Andrew J. "American Marriage in the Early Twenty-First Century." The Future of
Children 15.2 (2005): 33-55. Future of Children. Web. 9 Oct. 2014.
<http://www.futureofchildren.org/futureofchildren/publications/docs/15_02_03.pdf>.
Cohen, Philip N. "The Persistence Of Workplace Gender Segregation In The US." Sociology
Compass 7.11 (2013): 889-899. SocINDEX with Full Text. Web. 21 Dec. 2014.
Cohen, Philip N., and Matt L. Huffman. "Working for the Woman? Female Managers and the
Gender Wage Gap." American Sociological Review 72.5 (2007): 681-704. JSTOR. Web.
21 Dec. 2014. <http://ezproxy.library.nyu.edu:2116/stable/25472487>.
Cohn, D'Vera, et al. "Barely Half of U.S. Adults Are Married – A Record Low." Pew Research
Center. N.p., 2011. Web. 18 Apr. 2015.
<http://www.pewsocialtrends.org/2011/12/14/barely-half-of-u-s-adults-are-married-a-
record-low/>.
Cole, Michael S., Hubert S. Feild, and William F. Giles. "Interaction of Recruiter and Applicant
Gender in Resume Evaluation: A Field Study." Sex Roles 51.9/10 (2004): n. pag. Print.
Correll, Shelley J., Sephen Benard, and In Paik. "Getting a Job: Is There a Motherhood Penalty?"
Chicago Journals 112.5 (2007): 1297-339. JSTOR. Web. 24 Mar. 2015.
<http://www.jstor.org/stable/10.1086/511799>.
Crowley, Jocelyn Elise. "Perceiving And Responding To Maternal Workplace Discrimination In
The United States." Women's Studies International Forum 40.(2013): 192-202.
SocINDEX with Full Text. Web. 21 Dec. 2014.

68
Curran, Margaret M. "Gender And Recruitment: People And Places In The Labour Market."
Work, Employment & Society 2.3 (1988): 335-351. SocINDEX with Full Text. Web. 21
Dec. 2014.
Davis, Mark, Sal Capobianco, and Linda Kraus. "Gender Differences In Responding To Conflict
In The Workplace: Evidence From A Large Sample Of Working Adults." Sex Roles
63.7/8 (2010): 500-514. SocINDEX with Full Text. Web. 21 Dec. 2014.
Desai, Sreedhari D., Dolly Chugh, and Arthur P. Brief. "The Implications Of Marriage Structure
For Men's Workplace Attitudes, Beliefs, And Behaviors Toward Women."
Administrative Science Quarterly 59.2 (2014): 330-365. SocINDEX with Full Text. Web.
21 Dec. 2014.
Dipboye, Robert L., Howard L. Fromkin, and Kent Wiback. "Relative Importance of Applicant
Sex, Attractiveness, and Scholastic Standing in Evaluation of Job Applicant Resumes."
Journal of Applied Psychology 60.1 (1975): 39-43. PDF file.
Eagly, Alice H., Mona Makhijani, and Bruce G. Klonsky. "Gender and the Evaluation of
Leaders: A Meta-Analysis." Psychological Bulletin 112.3 (1992): 557. PsycNET. Web.
13 Apr. 2015. <http://psycnet.apa.org/psycinfo/2008-10512-001>.
"Employed Persons by Detailed Industry, Sex, Race, and Hispanic or Latino Ethnicity." U.S.
Bureau of Labor Statistics. U.S. Bureau of Labor Statistics, 12 Feb. 2015. Web. 11 May
2015. <http://www.bls.gov/cps/cpsaat18.htm>.
England, Paula. "The Gender Revolution: Uneven And Stalled." Gender & Society 24.2 (2010):
149-166. SocINDEX with Full Text. Web. 21 Dec. 2014.
England, Paula. "Gender Inequality in Labor Markets: The Role of Motherhood and
Segregation." Oxford Journal (2005): 264-88. Print.
69
England, Paula, and Katheryne Edin. "The Declining Significance of Gender?" New York:
Russell Sage Foundation (2006): 245-64. Print.
England, Paula, and Nancy Folbre. "The Cost of Caring." American Academy of Political and
Social Science (1999): 39-51. PDF file.
Espenshade, Thomas J. "Marriage Trends in America: Estimates, Implications, and Underlying
Causes." Population and Development Review 11.2 (1985): 193-245. JSTOR. Web. 17
Apr. 2015.
Fernandez, Raquel. "Cultural Change as Learning: The Evolution of Female Labor Force
Participation over a Century." American Economic Review 103.1 (2013): 472-500. PDF
file.
Freeman, Jo. "The Revolution for Women in Law and Public Policy." Jo Freeman. N.p., n.d.
Web. 17 Apr. 2015. <http://www.jofreeman.com/lawandpolicy/revlaw1.htm>.
Fuegen, Kathleen, et al. "Mothers And Fathers In The Workplace: How Gender And Parental
Status Influence Judgments Of Job-Related Competence." Journal Of Social Issues 60.4
(2004): 737-754. SocINDEX with Full Text. Web. 21 Dec. 2014.
Gardner, Donald G., and Richard Discenza. "Sex Effects In Evaluating Applicant Qualifications:
A Reexamination." Sex Roles 18.5/6 (1988): 297-308. SocINDEX with Full Text. Web.
21 Dec. 2014.
Gelman, Susan A. "Essentialism in Everyday Thought." American Psychological Association.
N.p., May 2005. Web. 13 Apr. 2015.
<http://www.apa.org/science/about/psa/2005/05/gelman.aspx>.
Gerdes, Eugenia Proctor, and Douglas M. Garber. "Sex Bias in Hiring: Effects of Job Demands
and Applicant Competence." Sex Roles 9.3 (1983): 308-19. PDF file.

70
Gerson, Kathleen. Hard Choices: How Women Decide About Work, Career and Motherhood.
1986. PDF file.
Glick, Peter. "Trait-Based And Sex-Based Discrimination In Occupational Prestige,
Occupational Salary, And Hiring." Sex Roles 25.5/6 (1991): 351-378. SocINDEX with
Full Text. Web. 21 Dec. 2014.
Glick, Peter, Cari Zion, and Cynthia Nelson. "What Mediates Sex Discrimination in Hiring
Decisions?" Journal of Personality and Social Psychology 55.2 (1988): 178-86. PDF file.
Güngör, Gökçe, and Monica Biernat. "Gender Bias Or Motherhood Disadvantage? Judgments Of
Blue Collar Mothers And Fathers In The Workplace." Sex Roles 60.3/4 (2009): 232-246.
SocINDEX with Full Text. Web. 21 Dec. 2014.
Goldin, Claudia. "Marriage Bars: Discrimination against Married Women Workers." NBER
Working Paper Series (1988): n. pag. PDF file.
- - -. "The Quiet Revolution That Transformed Women's Employment, Education, and Family."
AEA Papers and Proceedings 96.2 (2006): n. pag. PDF file.
Gorman, Elizabeth H. "Gender Stereotypes, Same-Gender Preferences, And Organizational
Variation In The Hiring Of Women: Evidence From Law Firms." American Sociological
Review 70.4 (2005): 702-728. SocINDEX with Full Text. Web. 21 Dec. 2014.
Grönlund, Anne. "On-The-Job Training—A Mechanism For Segregation? Examining The
Relationship Between Gender, Occupation, And On-The-Job Training Investments."
European Sociological Review 28.3 (2012): 408-420. SocINDEX with Full Text. Web.
21 Dec. 2014.

71
Hardin, J. Russell, Kurt F. Reding, and Morris H. Stocks. "The Effect Of Gender On The
Recruitment Of Entry-Level Accountants." Journal Of Managerial Issues 14.2 (n.d.): 251.
SocINDEX with Full Text. Web. 21 Dec. 2014.
Heyman, Gail D., and Jessica W. Giles. "Gender and Psychological Essentialism." PubMed
Central (2011): n. pag. National Center for Biotechnology Information. Web. 13 Apr.
2015. <http://www.ncbi.nlm.nih.gov/pmc/articles/PMC3082140/>.
Hochschild, Arlie, and Anne Machung. The Second Shift. N.p.: n.p., 2003. Print.
Huffman, Matt L., and Philip N. Cohen. "Occupational Segregation And The Gender Gap In
Workplace Authority: National Versus Local Labor Markets." Sociological Forum 19.1
(2004): 121-147. SocINDEX with Full Text. Web. 21 Dec. 2014.
Huppatz, Kate, and Susan Goodwin. "Masculinised Jobs, Feminised Jobs And Men’S ‘Gender
Capital’ Experiences: Understanding Occupational Segregation In Australia." Journal Of
Sociology 49.2/3 (2013): 291-308. SocINDEX with Full Text. Web. 21 Dec. 2014.
Hyde, Janet Shibley. "Gender Similarities and Differences." The Annual Review of Psychology
(2014): 373-98. PDF file.
Jackson, Robert Max. Down So Long. N.p., n.d. Web. 9 Oct. 2014.
Jeffrey Hill, E., et al. "Exploring The Relationship Of Workplace Flexibility, Gender, And Life
Stage To Family-To-Work Conflict, And Stress And Burnout." Community, Work &
Family 11.2 (2008): 165-181. SocINDEX with Full Text. Web. 21 Dec. 2014.
Kelly, Kimberly, and Linda Grant. "Penalties And Premiums: The Impact Of Gender, Marriage,
And Parenthood On Faculty Salaries In Science, Engineering And Mathematics (SEM)
And Non-SEM Fields." Social Studies Of Science (Sage Publications, Ltd.) 42.6 (2012):
869-896. SocINDEX with Full Text. Web. 21 Dec. 2014.

72
Killewald, Alexandra. "A Reconsideration Of The Fatherhood Premium: Marriage, Coresidence,
Biology, And Fathers’ Wages." American Sociological Review 78.1 (2013): 96-116.
SocINDEX with Full Text. Web. 21 Dec. 2014.
Killewald, Alexandra, and Margaret Gough. "Does Specialization Explain Marriage Penalties
And Premiums?." American Sociological Review 78.3 (2013): 477-502. SocINDEX with
Full Text. Web. 21 Dec. 2014.
Kmec, Julie A., Matt L. Huffman, and Andrew M. Penner. "Being A Parent Or Having A Parent?
The Perceived Employability Of Men And Women Who Take Employment Leave."
American Behavioral Scientist 58.3 (2014): 453-472. SocINDEX with Full Text. Web.
21 Dec. 2014.
Kmec, Julie A., Steve McDonald, and Lindsey B. Trimble. “Making Gender Fit and
“Correcting” Gender Misfits: Sex Segregated Employment And The Nonsearch Process."
Gender & Society 24.2 (2010): 213-236. SocINDEX with Full Text. Web. 21 Dec. 2014.
Korenman, Sanders, and David Neumark. "Does Marriage Really Make Men More Productive?."
Journal Of Human Resources 26.2 (n.d.): 282-307. SocINDEX with Full Text. Web. 21
Dec. 2014.
Kricheli-Katz, Tamar. "Choice, Discrimination, And The Motherhood Penalty." Law & Society
Review 46.3 (2012): 557-587. SocINDEX with Full Text. Web. 21 Dec. 2014.
Lee Badgett, M. V. and Nancy Folbre. "Job Gendering: Occupational Choice And The Marriage
Market." Industrial Relations 42.2 (n.d.): 270-298. SocINDEX with Full Text. Web. 21
Dec. 2014.
Luzadis, Rebecca, Mark Wesolowski, and B. Kay Snavely. "Understanding Criterion Choice in
Hiring Decisions from a Prescriptive Gender Bias Perspective." Journal of Managerial
73
Issues 20.4 (2008): 468-84. JSTOR. Web. 21 Dec. 2014.
<http://ezproxy.library.nyu.edu:2116/stable/40604624>.
Mann, Sarah L., et al. "Anterior and Posterior Cingulate Cortex Volume in Healthy Adults:
Effects of Aging and Gender Differences." Brain Research (2011): n. pag. PDF file.
Mastekaasa, Arne, and Anne May Melsom. "Occupational Segregation And Gender Differences
In Sickness Absence: Evidence From 17 European Countries." European Sociological
Review 30.5 (2014): 582-594. SocINDEX with Full Text. Web. 21 Dec. 2014.
Matthaei, Julie A. "Consequences Of The Rise Of The Two-Earner Family: The Breakdown Of
The Sexual Division Of Labor." American Economic Review 70.2 (n.d.): 198-202.
SocINDEX with Full Text. Web. 21 Dec. 2014.
"Median Age at First Marriage for Women (5-Year ACS)." Population Reference Bureau. N.p.,
2015. Web. 11 May 2015.
Osterman, Paul. "Sex Discrimination In Professional Employment: A Case Study." Industrial &
Labor Relations Review 32.4 (1979): 451-464. SocINDEX with Full Text. Web. 21 Dec.
2014.
"Partners in Winning the War: American Women in World War II." National Women's History
Museum. N.p., n.d. Web. 17 Apr. 2015. <https://www.nwhm.org/online-
exhibits/partners/exhibitentrance.html>.
Penner, Andrew M. "Race and Gender Differences in Wages: The Role Of Occupational Sorting
At The Point Of Hire." Sociological Quarterly 49.3 (2008): 597-614. SocINDEX with
Full Text. Web. 21 Dec. 2014.
74
Polavieja, Javier G., and Lucinda Platt. "Nurse Or Mechanic? The Role Of Parental Socialization
And Children's Personality In The Formation Of Sex-Typed Occupational Aspirations."
Social Forces 93.1 (2014): 31-61. SocINDEX with Full Text. Web. 21 Dec. 2014.
"Practice Guidelines for LGB Clients." American Psychological Association. N.p., n.d. Web. 13
Apr. 2015. <http://www.apa.org/pi/lgbt/resources/guidelines.aspx>.
Quintero, Esther. "Gender And The Evaluation Of Job Applicants In A Natural Setting."
Conference Papers -- American Sociological Association (2007): 1. SocINDEX with Full
Text. Web. 21 Dec. 2014.
Reskin, Barbara F. "Bringing the Men Back In: Sex Differentiation and the Devaluation of
Women's Work." Gender and Society 2.1 (1988): 58-81. Print.
Ridgeway, Cecilia L. Framed by Gender: How Gender Inequality Persists in the Modern World.
N.p.: Oxford UP, 2011. Print.
Rubin, Gayle. "The Traffic in Women: Notes on the “Political Economy” of Sex." The Second
Wave: A Reader in Feminist Theory. By Linda Nicholson. N.p.: n.p., 1997. 27-62. Print.
Ruppanner, Leah, and Matt L. Huffman. "Blurred Boundaries: Gender And Work–Family
Interference In Cross-National Context." Work & Occupations 41.2 (2014): 210-236.
SocINDEX with Full Text. Web. 21 Dec. 2014.
Schneider, Daniel. "Gender Deviance and Household Work: The Role of Occupation." American
Journal of Sociology 117.4 (2012): 1029-72. JSTOR. Web. 21 Dec. 2014.
<http://ezproxy.library.nyu.edu:2116/stable/10.1086/662649>.
Seltzer, Judith A. "Cohabitation in the United States and Britain: Demography, Kinship, and the
Future." Journal of Marriage and Family 66.4 (2004): 921-28. JSTOR. Web. 17 Apr.
2015.
75
Snipes, Robin L., Sharon L. Oswald, and Steven B. Caudill. "Sex-Role Stereotyping, Gender
Biases, And Job Selection: The Use Of Ordinal Logit In Analyzing Likert Scale Data."
Employee Responsibilities & Rights Journal 11.2 (1998): 81-97. SocINDEX with Full
Text. Web. 21 Dec. 2014.
Teachman, Jay D., Lucky M. Tedrow, and Kyle D. Crowder. "The Changing Demography of
America's Families." Journal of Marriage and Family 62.4 (2000): 1234-46. JSTOR.
Web. 17 Apr. 2015.
Uhlmann, Eric Luis, and Geoffrey L. Cohen. "Constructed Criteria: Redefining Merit to Justify
Discrimination." Psychological Science 16.6 (2005): 474-80. JSTOR. Web. 21 Dec. 2014.
<http://ezproxy.library.nyu.edu:2116/stable/40064251>.
"Understanding the Social Construction of Gender." The Association of Women Educators. N.p.,
n.d. Web. 13 Apr. 2015.
"What Is Marital Status Discrimination?" Nolo: Law for All. N.p., 2015. Web. 13 Apr. 2015.
<http://www.nolo.com/legal-encyclopedia/what-marital-status-discrimination.html>.
Williams, Melissa J., and Serena Chen. "When "Mom's The Boss": Control Over Domestic
Decision Making Reduces Women's Interest In Workplace Power." Group Processes &
Intergroup Relations 17.4 (2014): 436-452. SocINDEX with Full Text. Web. 21 Dec.
2014.
Williams, Christine L. "The Glass Escalator: Hidden Advantages For Men In The "Female"
Professions." Social Problems 39.3 (1992): 253-267. SocINDEX with Full Text. Web. 21
Dec. 2014.
Wolfers, Justin. "Diagnosing Discrimination: Stock Returns and CEO Gender." Journal of the
European Economic Association (2006): 531-41. PDF file.
76
"Women's Bureau: Women and Families." United States Department of Labor. N.p., n.d. Web.
18 Apr. 2015. <http://www.dol.gov/wb/stats/mother_families.htm>.
Wright, Bradley R.E., et al. "Religious Affiliation and Hiring Discrimination in New England: A
Field Experiment." Research in Social Stratification and Mobility 34 (2013): 111-26.
PDF file.