Embed Size (px)
Citation preview
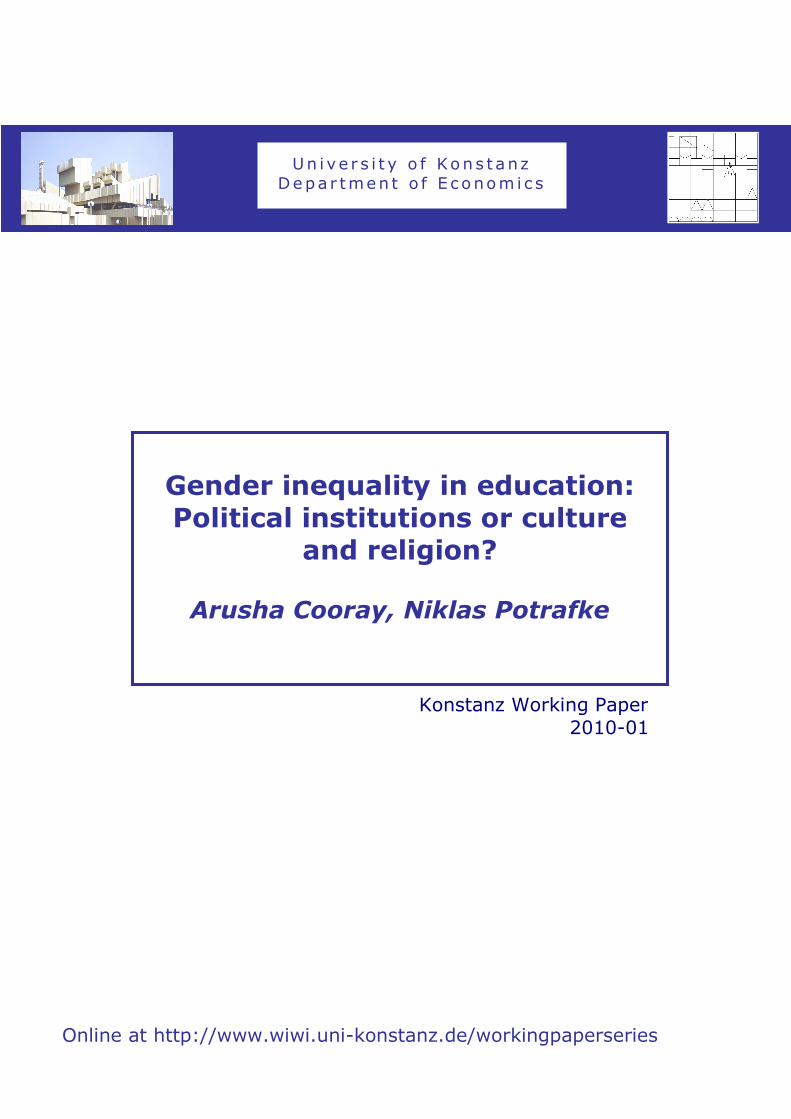
Un i ve r s i t y o f Kons t anz
Depa r tmen t o f E c onom i c s
Gender inequality in education:
Political institutions or culture
and religion?
Arusha Cooray, Niklas Potrafke
Online at http://www.wiwi.uni-konstanz.de/workingpaperseries
Konstanz Working Paper
2010-01

1
Gender inequality in education:
Political institutions or culture and religion?
Arusha Cooray*,a,b
, �iklas Potrafkec
a Department of Economics, University of Wollongong, NSW, 2522, Australia
b Centre for Applied Macroeconomic Analysis, Australian National University,
Canberra, ACT, 0200, Australia c Department of Economics, University of Konstanz, D-78457 Konstanz, Germany
Abstract
We investigate empirically whether political institutions or culture and religion
underlie gender inequality in education. The dataset contains up to 157 countries over
the 1991-2006 period. The results indicate that political institutions do not
significantly influence education of girls: autocratic regimes do not discriminate
against girls in denying educational opportunities and democracies do not
discriminate by gender when providing educational opportunities. The primary
influences on gender inequality in education are culture and religion. Discrimination
against girls is especially pronounced in Muslim dominated countries.
JEL Codes: O11, O15, O43, O57, P26, P36, Z12.
Keywords: Gender discrimination, education, democracy, religion
* Tel: + 61-2-4221-4017; E-mail: [email protected].
2
1. Introduction
Education or human capital is a prominent positive influence on economic
growth and development. In particular, educating girls increases human capital and
growth (Schultz, 1994; Knowles et al., 2002; Klasen, 2002; Dollar and Gatti, 1999).
Educating girls is doubly advantageous. As with males, increased human capital of
females directly increases incomes and growth. However, there is a further benefit of
educating girls because of the positive influence of mothers on the education and
health of their children (Schultz, 2002; Doepke and Tertilt, 2009). Education of girls
is therefore important for economic development because of the human-capital
transmission through mothers.1
Political elites in autocratically ruled societies have incentives not to
encourage education and investment in human capital because economic development
will give rise to a middle class that will seek democratic institutions and
accountability from government (Bourguignon and Verdier, 2000; Welzman, 2010).2
If education of girls is in particular conducive to economic development, self-
preservation of political elites in non-democratic societies is a suggested explanation
for gender bias against girls in education in government schools.3 An investigation of
1 One of the United Nations Millennium Development Goals (MDGs) is to eliminate gender inequality
in education at the primary and secondary levels (UN 2008). However, the goal does not appear to be
on-track for attainment. 2 See Hillman (2007) for an overview of the incentives of non-democratic governments not to provide
quality free-access education. 3 Government does not in general have a monopoly on schooling. Private provision of education is
however usually small relative to public provision. In low-income countries, private schools are for the
elites, whose children are also often sent abroad for education. In reaction to the inadequacies of
government-provided schooling for the general population in low-income countries, there have also
been self-financed user-price schools for children of poor families. Hillman and Jenkner (2004)
describe how parents in low-income countries have circumvented low-quality or absent government
education through user-pay schooling.
3
the reasons for gender inequality in education should therefore consider the role of
political institutions.4
An alternative hypothesis is that culture and religion determine attitudes to
education of girls. For example, a report on democratization in Afghanistan (Larson,
2009) states that:
“Afghanistan is not democratic due to the lack of these key factors: Is this a
democracy, when girls can’t go to school to read, when violence against girls
takes place in many provinces like Kandahar and Faryab? When acid is
spread on the faces of girls, where is democracy? When girls are poisoned in
the schools of Parwan how we can say that we have democracy?
The respondent was here referring to a series of incidents across the country in which
acid has been thrown at schoolgirls by extremists ideologically opposed to girls’
education. In Parwan province in May 2009 there were reports of toxic gas being
dispersed in girls’ school playgrounds by fundamentalist groups also.” (Larson 2009:
13).
Empirical evidence from prior studies on the influence of democracy on
gender equality in education is mixed. A study by Brown (2004) employs the data of
Barro and Lee (1993) on educational attainment, with the dependent variable the
average number of years women attended school divided by the average number of
years men attended school in 1990. Democracy is measured by the sub-indicators of
POLITY III. The independent variables are mean values for each country between
4 With regard to possible reverse causation, previous studies have found that education has a positive
influence on democracy (for example, Castelló-Climent 2008, Barro 1999, Glaeser et al. 2004,
Papaioannou and Siourounis 2005). Acemoglu et al. (2005) suggest however, that after inclusion of
fixed effects, there is no evidence that education enhances democracy. On the related causal relation
between income and democracy, see Gundlach and Paldam (2009). Income distribution, which is itself
politically determined, can influence public spending on education, in particular on different levels of
education: Di Gioacchino and Sabani (2009) show that public education spending can give rise to
persistent inequality if more unequal societies continue to spend more on higher levels of education
rather than basic levels of education.
4
1960 and 1990. The sample consisted of 105 high and low-income countries. The
results suggested that only an executive-recruitment sub-component of democracy
had a positive influence on gender equality in education.5 Beer (2009) considered the
relation between gender equality and political regimes and found the unexpected
result that democracy may have negatively influenced gender equality in educational
attainment. Her dependent variable for gender equality in education is the difference
between the average years of educational attainment of women and men. Democracy
is measured by the level and stock of the POLITY IV democracy indices, as well as
the year in which women gained the right to vote. The sample consisted of 179
developed and low-income countries between 1960 and 2004. She concluded that
countries with longer-term democracy and longer duration of women’s suffrage had
higher proportions of female to male life expectancy, lower fertility rates, and higher
labour force participation rates, due to the ability of women to advance their interests
through voting. However, both the stock of democracy and the year in which women
gained suffrage had a negative influence on gender equality in education, so
contradicting a hypothesized positive relationship between democracy and gender
equality in education. The results are sensitive to the inclusion of an illiteracy
variable, exclusion of which made the democracy variable positive (Beer, 2009, p.
224).
Norton and Tomal (2009) used the data of Barro and Lee (1993) on
educational attainment to show that religion has influenced gender equality in
education. The dependent variable was the log-odds ratio of female educational
attainment and the log-odds ratio of the gender gap (absolute differences between
5 Time from initiation of suffrage has been used to study educational opportunities for women (Beer
2009). We do not use this variable because of ambiguities in the relation between the right to vote and
democracy. In numerous low-income countries, people have the right to vote, or indeed may be
compelled to vote, but there is only one candidate for the position of president or other office.
5
male and female percentages for four levels of educational attainment). Religion was
measured by the share of the population that is Buddhist, ethno-religion, Hindu,
Muslim, Orthodox, Protestant or Roman Catholic (data by Barrett et al. 2001). The
sample consisted of 97 high and low-income countries. The results suggest that the
proportion of Hindu and Muslim adherents in a country has had a negative influence
on female educational attainment.
The empirical strategies of the above studies on democracy and gender
equality have shortcomings that we have aimed to correct. We depart from the
previous studies in three ways. First, we use the new Democracy-Dictatorship (DD)
variables from Cheibub et al. (2010) and the Polity IV sub-indicator “Constraints on
chief executive”. Second, we use enrolment ratios disaggregated at the primary
and secondary, and tertiary levels to measure gender inequality. Third, we focus on
the recent past from 1991 to 2006 to investigate the relation between gender equality
in education and a country’s political institutions. We also juxtapose political
institutions against cultural and religious influences. We measure the influence of
culture and religion with dummy variables that take on the value one when a
particular religion is dominant in a country. The data is from the Encyclopedia of
World Geography (1994) and the CIA World Factbook (2010). For robustness checks,
we also employ the data on religion by Alesina et al. (2003).
We find that political institutions do not matter for advancement of gender
equality in education whereas culture and religion do. In section 2 we elaborate on the
background for our empirical estimates. Section 3 presents the data and empirical
strategy. Section 4 discusses the empirical results. Section 5 concludes.
6
2. Background
Democracy promotes gender equality. Women can better express their views
and interests in democracies; democracies promote gender equality through an
educated middle class; democratic governments spend on educating girls; income
redistribution and public good provision in democracies reduce pressure on sons to
take care of their parents in old age and illness (when parents expect their sons to take
care of them in old age, incentives of a family to invest in the education of a son
rather than in the education of a daughter increase); and men in democracies have a
self-interest in educating their daughters. Democracy also facilitates gender equality
through mobilization of women and electoral accountability (Beer, 2009, p.218):
women can better organize to express their views and interests; they can obtain and
disseminate information; and they may lobby for improving their status through
education. Women may also be empowered to positions of leadership. Democracy
also increases women’s bargaining power within the household (Klasen and Wink,
2003), which can permit a mother to invest more in health and education of her
children. The improved bargaining position of a mother can improve the bargaining
position of a daughter in relation to a son-in-law (Doepke and Tertilt, 2009).
Democratic institutions are therefore conducive to gender equality, including in
particular in education. In contrast, as noted, in countries with limited democracy
rulers who seek to sustain political entrenchment are not interested in the development
of an educated middle class and may discriminate against girls because of the
important development role of educated mothers.6
6 Colonial regimes, on the other hand, often kept women disadvantaged. Women have
disproportionally been employed in low-skilled agriculture, for example, in cash crops plantations
(Adams, 2006). Brown (2000) describes the effects of colonization and democracy on enrolment for
Middle Eastern, African, Asian, Central and South American countries. His results suggest that
colonization decreased enrolment ratios in Sub-Saharan-Africa, despite a strong relationship between
regime types and enrolment ratios in education.
7
Social norms affect gender equality. For example, with regard to labour-force
participation, sons who are raised by a working mother tend to be more supportive of
a working wife (Fernandez et al. 2004). In a similar vein, increased exposure to a
female leader in every-day-life reduces the bias that males may have against
supporting a female political leader.7 Norms can therefore promote equal educational
opportunities for girls.8
However, religion and other aspects of culture including ethics and the
absence of the rule of law can inhibit education of girls (Dollar and Gatti, 1999;
Inglehart and Baker, 2000; Hillman and Jenkner, 2004). Hillman (2004) has described
Nietzschean behaviour as the strong being unconstrained by ethics in actions toward
the weak. With women naturally physically weaker than men, women in Nietzschean
societies are victims of male domination, which includes adverse discrimination
against girls in schooling. If the role of the girl or woman is no more than to bear
children and to provide satisfaction and services to males, education of girls may not
enhance the perceived benefits to men, who are the “strong” and dominate the
women, who are the “weak”. Women can then also become objects to be purchased
for use and traded (Di Tommaso et al., 2009). The uses to which women are subjected
may therefore not require education. Indeed, education of girls can be an impediment
to achieving the objectives through submission of women sought by men in
Nietzschean societies. In cases of radical Islam, education of girls may be punishable
by death, for the girls and for their teachers.
7 Beaman et al. (2009) show that Indian villagers who have never experienced a female leader prefer
male leaders. Exposure to a female leader weakens stereotypes about gender roles in the public and
domestic spheres and eliminates negative bias in how female leaders' effectiveness is perceived among
male villagers. 8 Indeed, the evidence is that girls take better advantage of educational entitlements than boys. For a
summary, see Hillman (2009, chapter 8).
8
3. Data and empirical strategy
3.1 Data
We use data on enrolment ratios of boys and girls in education at the primary
and secondary, and tertiary level, from the World Bank Development Indicators.
Enrolments at the primary and secondary level are measured by one variable. The
dataset contains up to 157 countries. We employ a cross-section for the year 2006. For
some countries, most recent data are not available for 2006 but for 2005 or 2007. We
then use the data for 2005 or 2007 to include as many countries as possible.
The ratio of girls-and-boys in primary and secondary, and tertiary education
differs across regions. An enrolment ratio of 1 indicates parity between females and
males and deviations below (above) 1 can be interpreted as a degree of male (female)
advantage on the enrolment measure. Girls are most underrepresented in South Asia
and Africa. In Chad, for example, the enrolment ratio in primary and secondary
education was 0.61 and in tertiary education 0.06. Gender equality has been
pronounced in Australia-Oceania, South-America and Central-Asia. In Uruguay and
Mongolia, for example, the girls-and-boys-enrolment ratio in primary and secondary
education was 1.06 (both countries) and in tertiary education 1.68 and 1.56 on average
respectively. In high income countries and also former communist countries (Eastern
Europe), gender equality in education was more common which transpires in girls-
and-boys enrolment ratios in primary and secondary education around 1 with low
variance.
Regional differences in education are pronounced at the tertiary level:
discrimination against girls is high in Africa (enrolment ratio 0.60 on average). Girls
are overrepresented in the Middle East (enrolment ratio 1.54 on average) and South
America (girl-and-boys enrolment ratio 1.36 on average).
9
The means of measurement of democracy have been the POLITY IV and the
Freedom House indices. These indices have, however, been criticized on several
grounds (Munk and Verkuilen 2002, Vreeland 2008, Cheibub et al. 2010). For
example, Munck and Verkuilen (2002:28) conclude that Freedom House is an index
“which [exemplifies] problems in all areas of conceptualization, measurement, and
aggregation.” The POLITY IV index has been criticized for similar reasons, but “the
usefulness of the POLITY IV dataset lies in its components” (Cheibub et al. 2010:
76). The POLITY index has five components: XCONST (Constraints on chief
executive), XRCOMP (Competiveness of executive recruitment), XROPEN
(Openness of executive recruitment), PARCOMP (Competiveness of political
participation), and PAREG (Regulation of political participation). In particular, the
Chief Executive variable “provides useful information about whether the chief
executive has unlimited authority, whether there is a legislature with slight or
moderate ability to check the power of the executive, whether the legislature has
substantial ability to check the executive, or whether the executive has parity with or
is subordinate to the legislature” (Cheibub et al. 2010: 76). We therefore employ the
Constraints on Chief Executive variable as a democracy measure.
Cheibub et al. (2010) introduce a Democracy and Dictatorship (DD) measure
of political regimes. The DD measure basically distinguishes between regimes in
which executive and legislative offices are filled through contested elections and
those in which they are not. The DD measure takes on the value 1 for democracies
and 0 otherwise. Cheibub et al. (2010) provide a more encompassing discussion on
classifying democracies and dictatorships.
To address reasonable concerns about reverse causality between democracy
and gender equality in education, we relate gender equality in education in 2006 to the
10
average of democracy over the 1991-2005 period. We focus on the period after 1991
because the DD measure is available for several countries only after 1991. The
variable Constraints on chief executive is not available for all years for every country.
When missing data points for individual years occur, we take averages of the
available years for the individual country.
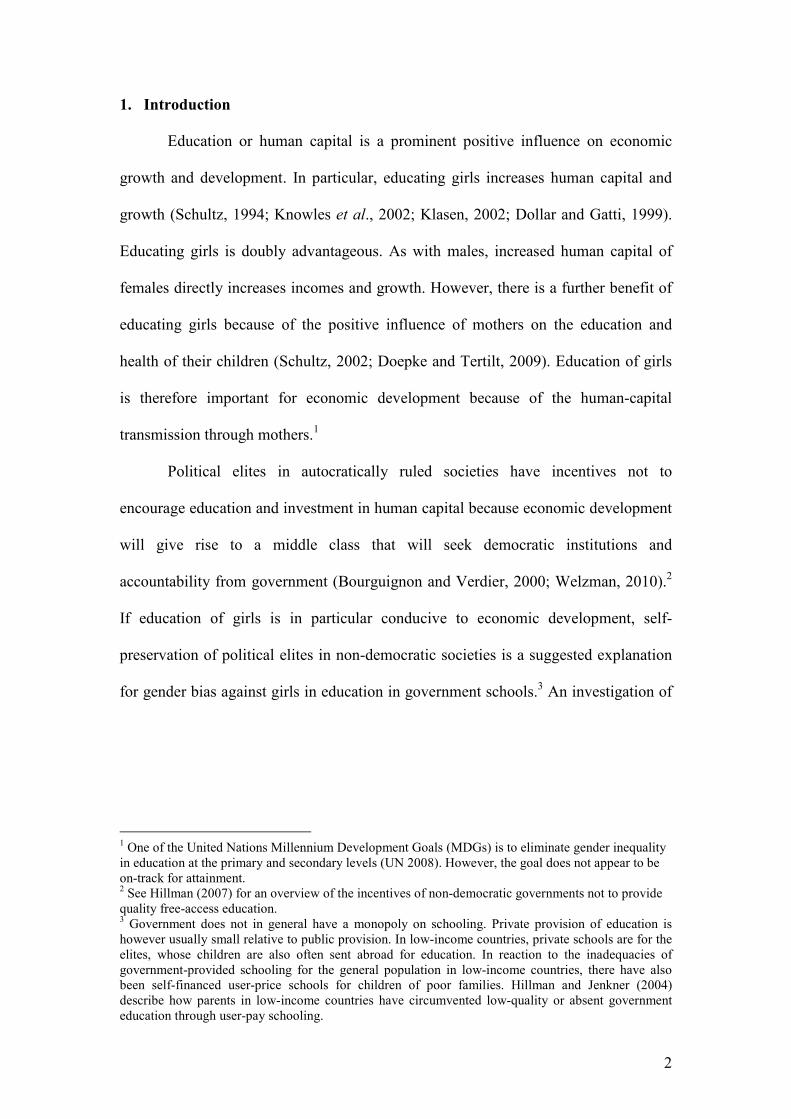
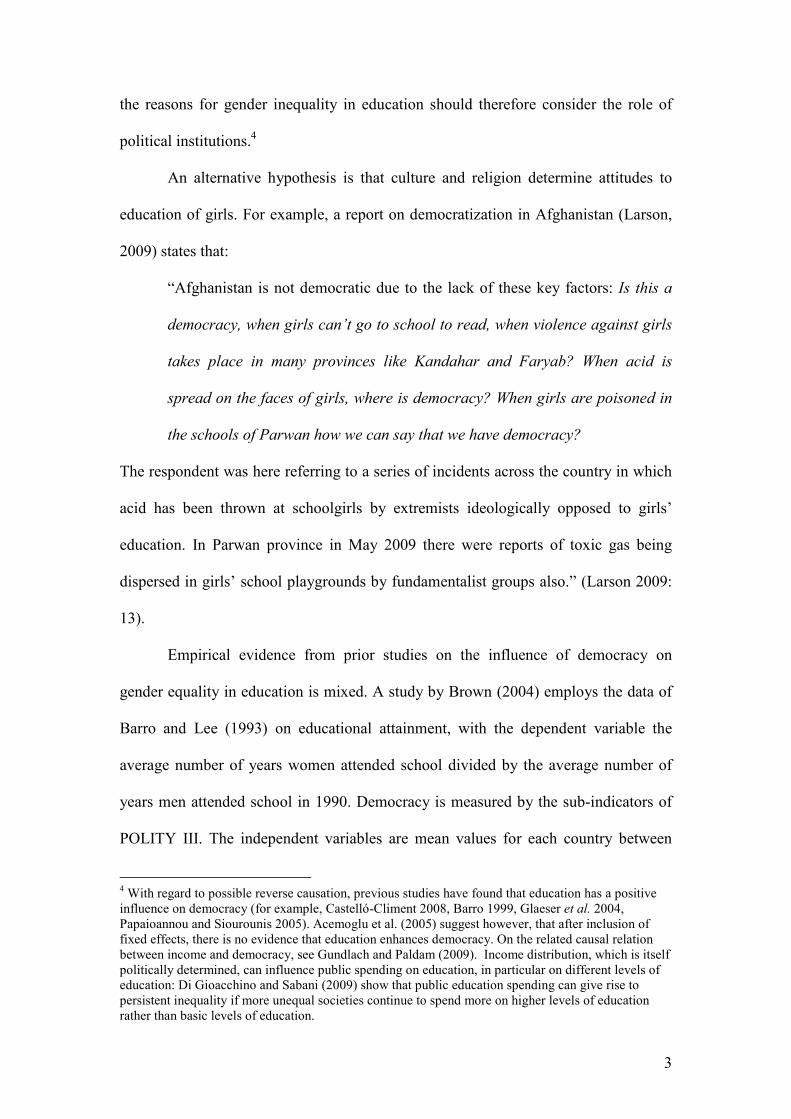
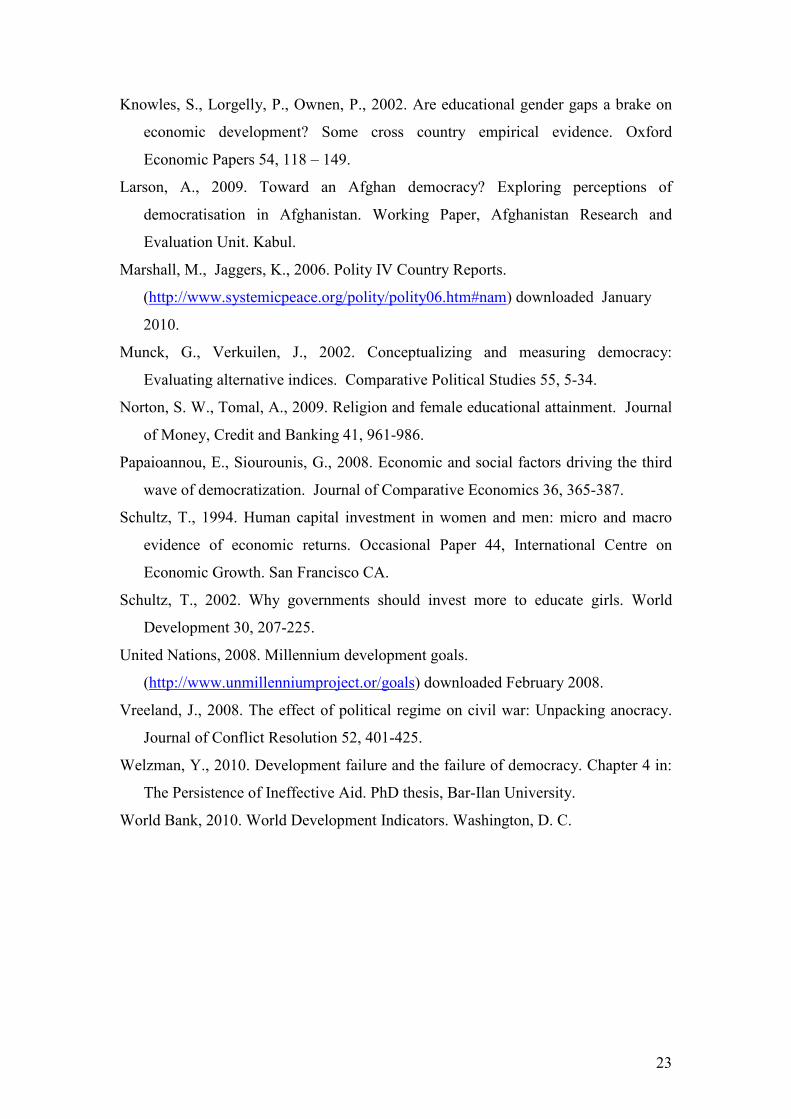
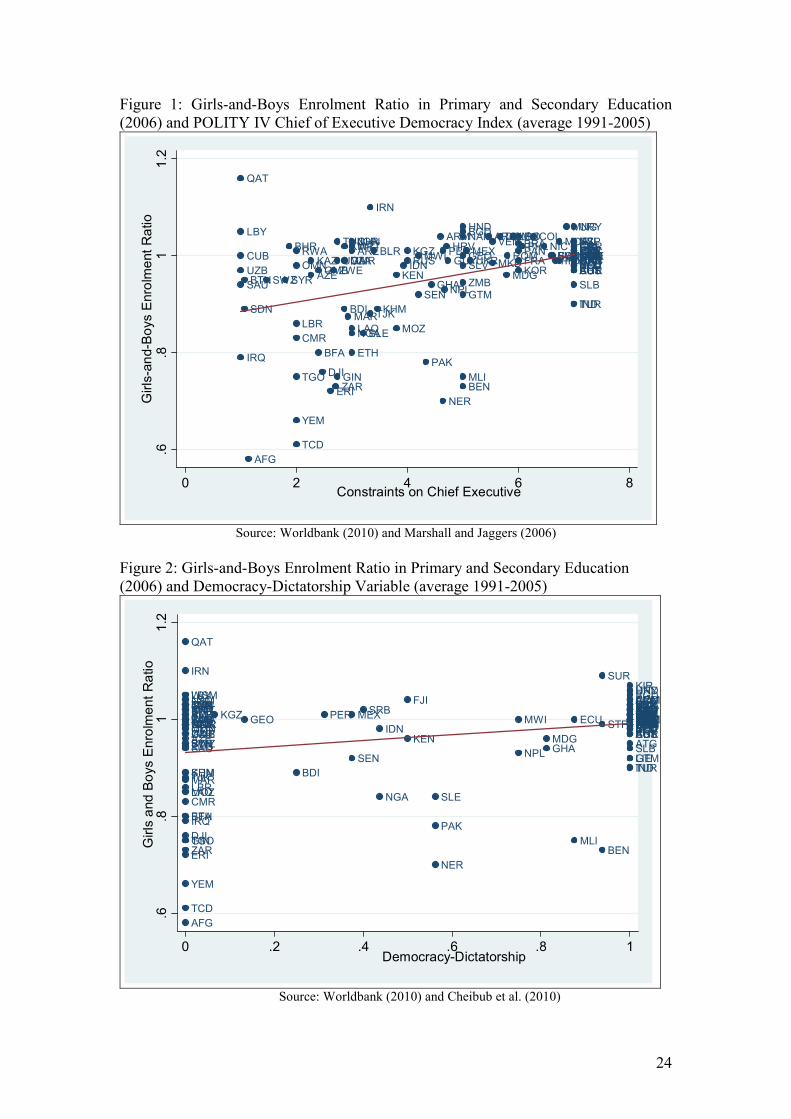
Figures 1 and 2 illustrate the association between the averaged XCONST and
the DD democracy indices and the girls-and-boys enrolment ratios at the primary and
secondary level respectively. Democracy and gender equality in education at the
primary and secondary level are positively associated. In countries such as
Afghanistan, Chad and Yemen, the girls-and-boys enrolment ratios as well as the
democracy variables display low values. In Mongolia and the Dominican Republic,
by contrast, gender equality at the primary and secondary level and democracy are
advanced. We do not show the respective figures for the girls-and-boys enrolment
ratios at the tertiary level and the XCONST and DD democracy indices. The positive
relationship between gender equality at the tertiary level and democracy is somewhat
less pronounced than the positive relationship between gender equality at the primary
and secondary level and democracy.
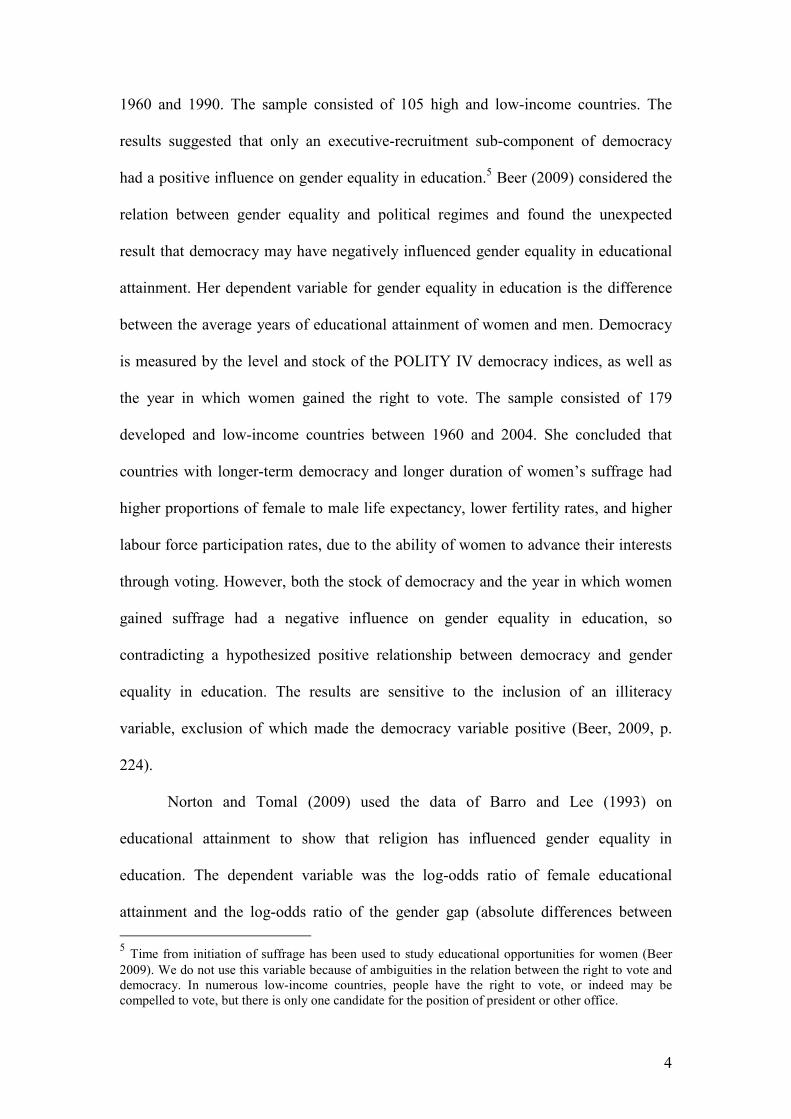
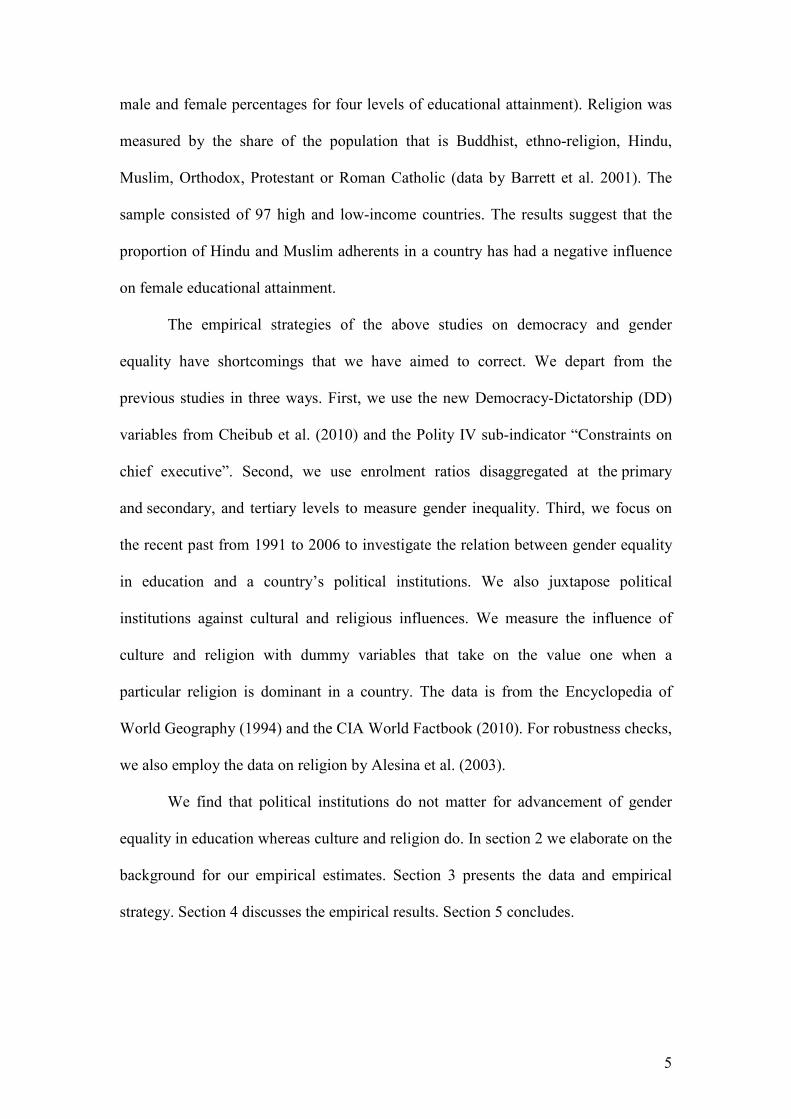
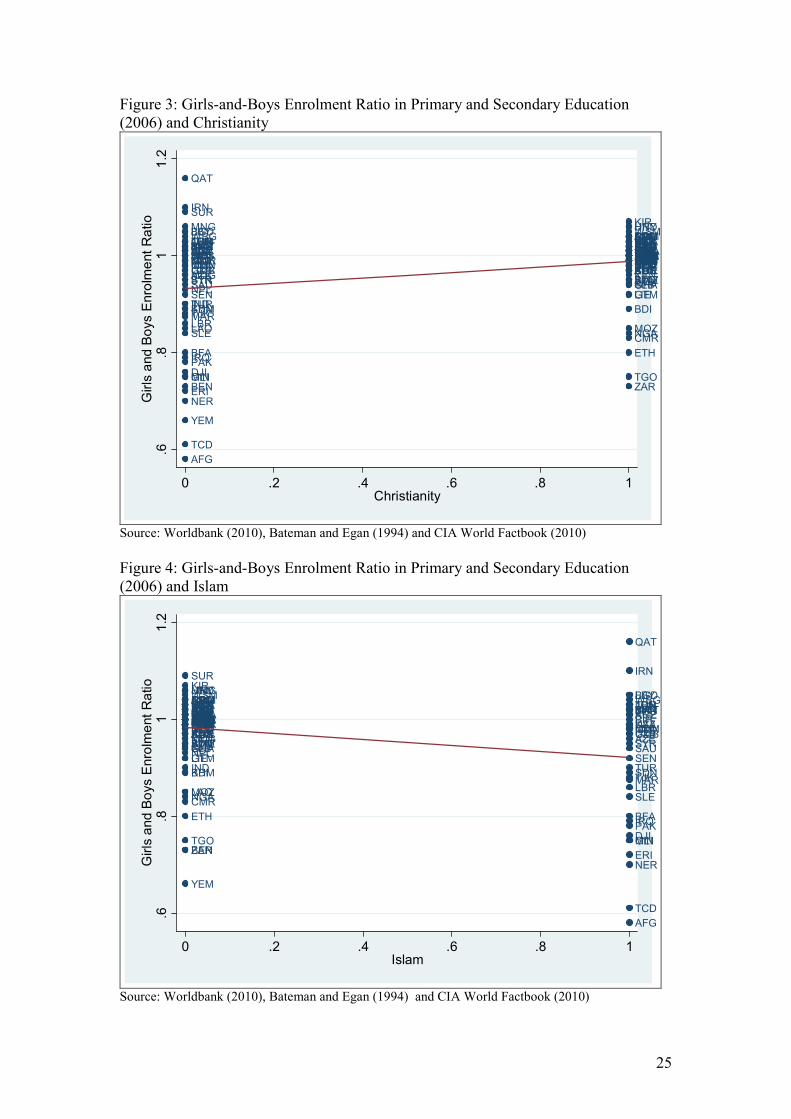
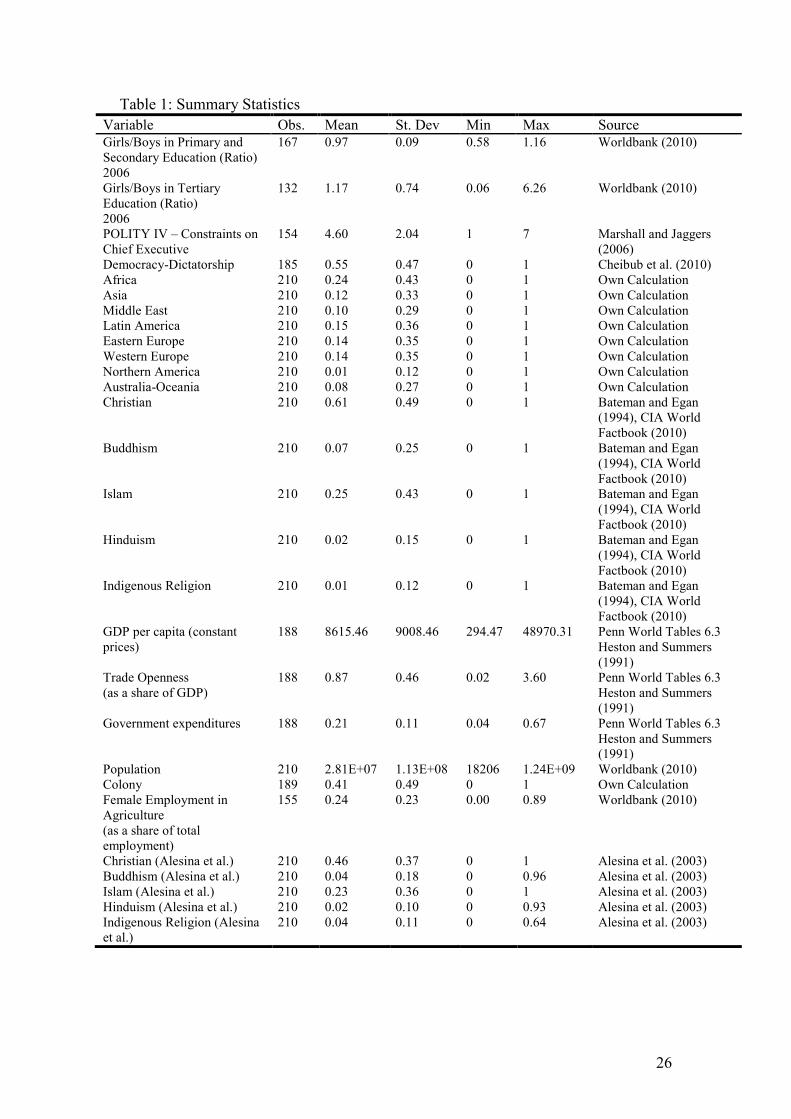
We measure religion with dummy variables that take on the value one when a
particular religion is dominant in a country using information from the Encyclopedia
of World Geography (1994) and the CIA World Factbook (2010). The religion
variables are time-invariant. Both databases report for each country the same
dominant religions.9 Measuring religion is much less controversial than measuring
9 The three main sources of the Encyclopedia of World Geography (1994) are: Britannica World Data
(Encyclpedia Britannica Inc, Chicago annual); Stateman's Yearbook (McMillan London, 1993),
Keesings Record of World Events (Keesings Redhill updated throughout the year), The data relate to
the years 1993 and 1994. The data of the CIA World Factbook (2010) relate to the year 2010.
11
democracy. Muslim dominated countries are, for example, Afghanisthan, Iran, Iraq,
Saudia Arabia. By contrast, OECD countries are dominated by Christianity.
Figure 3 illustrates the association between Christianity and the girls-and-boys
enrolment ratios at the primary and secondary level. Christianity and gender equality
in education at the primary and secondary level are positively associated. By contrast,
Figure 4 shows that Islam and gender equality in education at the primary and
secondary level are negatively associated. We do not show the respective figures for
the girls-and-boys enrolment ratios at the tertiary level and the religion variables. The
relationship between gender equality at the tertiary level and religion is less
pronounced than the relationship between gender equality at the primary and
secondary level and religion.
3.2 Empirical strategy
The base-line cross sectional model has the following form:
EFMi = α + β Democracyij +Σk δ Religionik + Σl ε Regionil +Σm ζ xim + η Colonyi + ui
with i = 1,...,157; j=1,2; k=1,...,5; l=1,...,7; m=1,...,4, where EFMi is the girls-and-boys
enrolment ratio at the primary and secondary, and tertiary level for country i. Political
institutions are indicated by the variable Democracyij which describes the two
alternative democracy measures: the Chief in Executive variable and the Democracy-
Dictatorship indicator respectively. We include one of the two democracy measures.
Σk δ Religionik describes the set religion dummy variables. The religion dummy
variables take on the value of one when a particular religion is dominant and zero
otherwise (see, for example, Dollar and Gatti, 1999; Inglehart and Baker, 2000). We
12
distinguish five religions: Christianity, Buddhism, Islam, Hinduism and Indigenous
Religion. Our reference category is Christianity.10
Protestantism led, for example, to
better education (Becker and Woessmann 2009, 2010). The proportion of Hindu and
Muslim adherents in a country has been shown to have a negative influence on female
educational attainment (Norton and Tomal 2009). We therefore expect negative
influences of the religion dummies on gender equality in education compared to the
reference category Christianity. Σl ε Regionil describes a set of regional dummy
variables, which take on the value of one when a country is in a particular region and
zero otherwise. We distinguish between eight different regions: Africa, Asia, the
Middle East, South America and the West Indies, North America, Eastern Europe and
Central Asia, Western Europe and Australia-Oceania. To avoid multicollinearity
between the region dummies, one of the region dummies functions as the reference
category (here Africa). The estimated effects of the other region dummies are then
interpreted as deviations from the reference category. Colonyi describes a dummy
variable that takes on the value one when the respective country was a British or
French colony and zero otherwise. We expect a negative influence of the colony
variable on the girls-and-boys enrolment ratios in education.11
The vector xi contains
our political-economic control variables. Following the related studies on democracy
and education, we include the logarithm of GDP per capita (Dollar and Gatti 1999,
Klasen 2002). Gender equality in education is expected to increase with GDP per
capita. We also include trade openness (as a share of GDP). The predicted influence
of trade-openness on gender equality on education is ambiguous. Higher trade
openness could decrease gender equality because in several developing countries
10
The British introduced Christianity to the African and Asian colonies. Most of the African countries
are primarily Anglican or protestant and some countries follow their own variants of Christianity such
as Independent Black Christian etc. 11
Brown (2000) illustrates the effect of colonialism on enrolment and Cooray (2009) the influence of
colonialism on the adult literacy rate.
13
unskilled females have been employed in labour intensive export industries (e.g.,
Cagatay and Ozler 1995, Fontana and Wood 2000, Balliamoune-Lutz and McGillvray
2007). By contrast, higher trade openness could also increase gender equality because
trade openness is expected to narrow the wage gap between skilled and unskilled
workers and men and women. Higher relative wages may give women access to
educational opportunities. We also include government expenditures as a share of
GDP as a proxy for public spending on education. Encompassing data on public
spending on education are not available. We expect a positive influence of
government expenditures on gender equality in education. We also include the
logarithm of total population to control for country size. Female employment in
agriculture (as a share of total employment) is not available, however, for the entire
sample. Including female employment in agriculture significantly reduces the sample,
though it does not change the inferences. We therefore discuss the influence of female
employment in agriculture in the robustness tests section. Table 1 shows descriptive
statistics of all variables included.
We estimate the model with Ordinary Least Squares (OLS) with robust
standard errors that are clustered by region.
4 Empirical results
4.1 Basic results
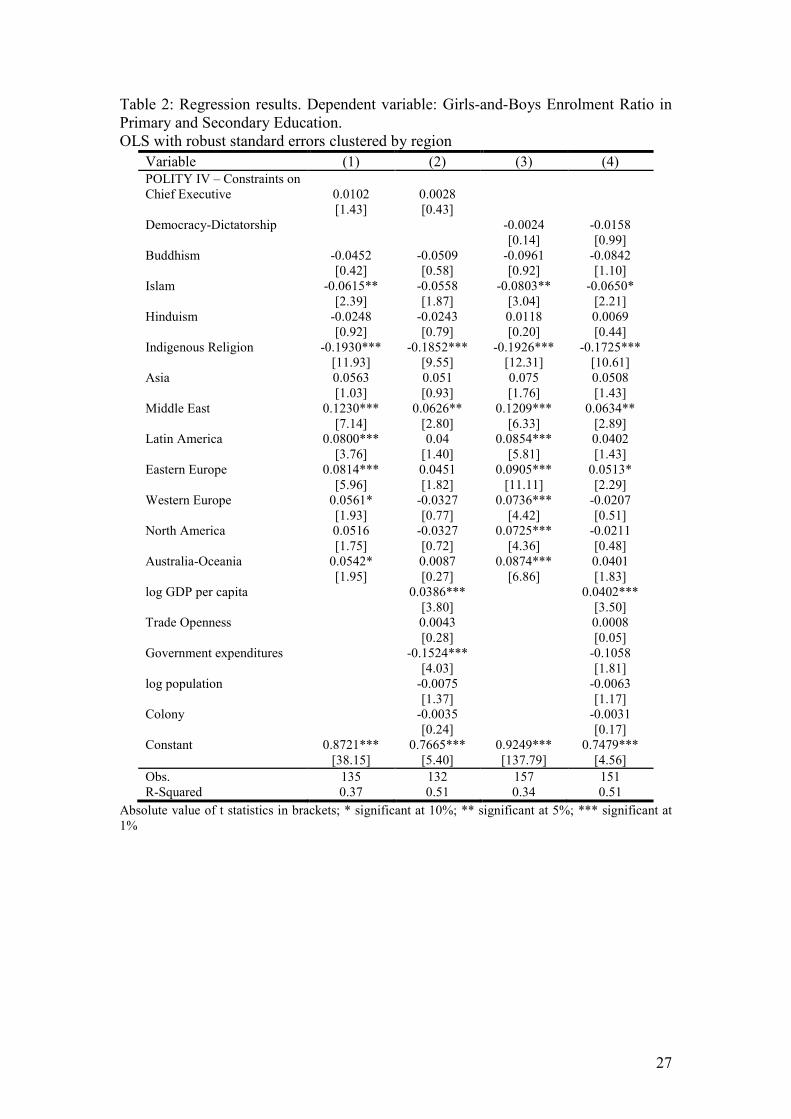
Table 2 illustrates the regression results for education at the primary and
secondary level. The control variables mostly display the expected signs and are
statistically significant in most cases. The regional dummy variables are statistically
significant at the 1% or 5% level in columns (1) and (3) and have positive signs. The
Middle East regional dummy variable is also statistically significant at the 5% level in
14
columns (2) and (4). The regional dummy variables indicate that the girls-and-boys
enrolment ratios have been higher in Middle East compared to Africa (reference
category). The log GDP per capita has the expected positive sign and is statistically
significant at the 1% level in columns (2) and (4). It shows that the girls-and-boys
enrolment ratios increased by about 4 percentage points when GDP per capita
increased by 1%. Trade openness is not statistically significant. The government
expenditure variable is statistically significant at the 1% level in column (2) with an
unexpected negative sign but is not statistically significant in column (4). The
numerical meaning of the coefficient is that girls-and-boys enrolment ratios decreased
by about 0.15 percentage points when government expenditures (as a share of GDP)
increased by one percentage point. The log population variable and the colony
variable are not statistically significant.
The results in Table 2 show that democracy did not influence gender equality
in education: the coefficient of the Chief in Executive variable has a positive sign in
columns (1) and (2), but is not statistically significant. The coefficient of the
Democracy-Dictatorship variable has a negative sign but is not statistically significant
in columns (3) and (4). By contrast, the indigenous religion dummy variable is
statistically significant at the 1% level in columns (1) to (4) with a negative sign; the
Islam religion dummy variable also has a negative sign and is statistically significant
at the 5% level in columns (1) and (3), at the 10% level in column (4), while it is not
statistically significant at conventional levels in column (2). The indigenous religion
and Islam religion dummy variables indicate that girls-and-boys enrolment ratios have
been lower by about 18 and 6 percentage points in countries with Indigenous and
Muslim religion compared to countries with Christian religion (reference category).
15
Table 3 illustrates the regression results for education at the tertiary level.
Most of the control variables again display the expected signs. The log GDP per
capita variable is not statistically significant, however. Gender equality in tertiary
education was significantly lower by about 60, 28 and 34 percentage points in
countries with Buddhist, Muslim and Indigenous religion than in countries with
predominant Christian religion. The democracy variables are not statistically
significant, suggesting that political institutions do not influence gender equality in
education.
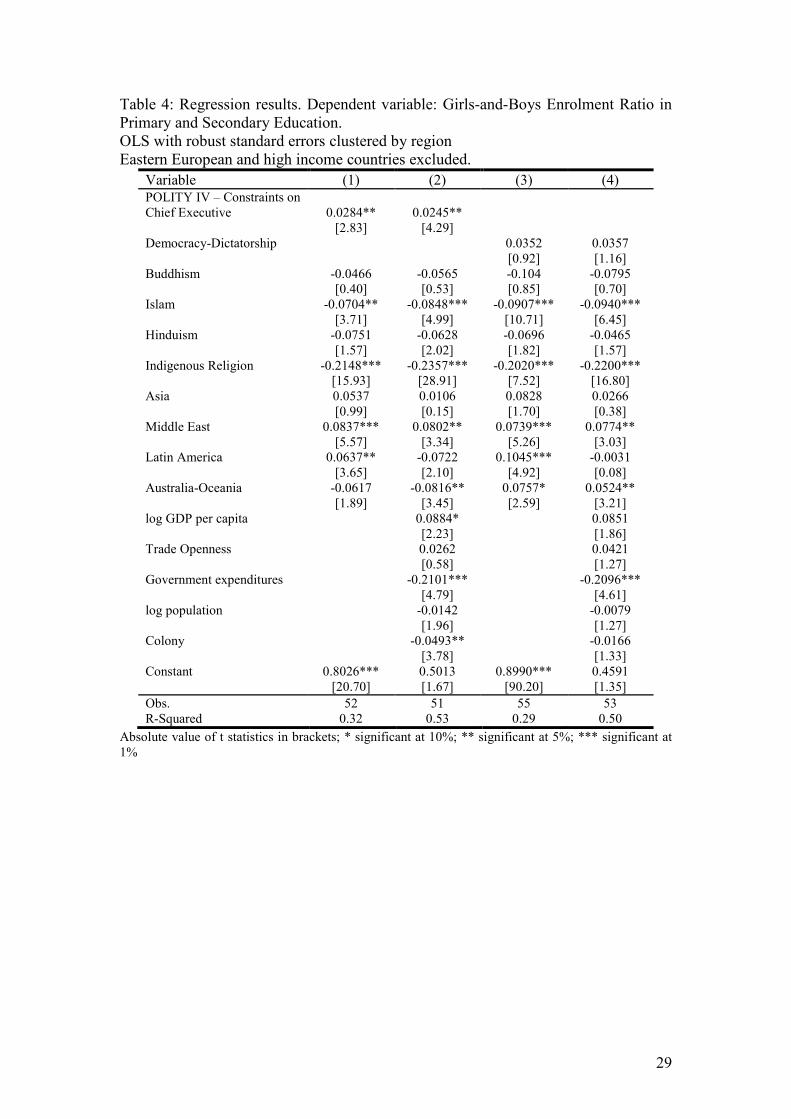
4.2 Robustness Tests
We checked the robustness of the results in several ways. Gender equality has
been very pronounced in (1) socialist countries and (2) high income countries. We
therefore excluded all Eastern European countries and high income countries
(threshold 3855 USD per capita following World Bank definitions), because the
socialist and established democratic past might bias our estimates. The results
reported in Table 4 indicate that excluding the former socialist European and high
income countries changes our base-line inferences in favour of a positive influence of
democracy on gender equality in education. The Chief in Executive variable is
statistically significant at the 5% level in columns (1) and (2). The Democracy-
Dictatorship variable in columns (3) and (4) is not statistically significant at
conventional levels. The positive influence of the Chief in Executive variable is not
robust, however, when we perform further robustness tests for this smaller sample
excluding Eastern European and high income countries (e.g., slightly varying the
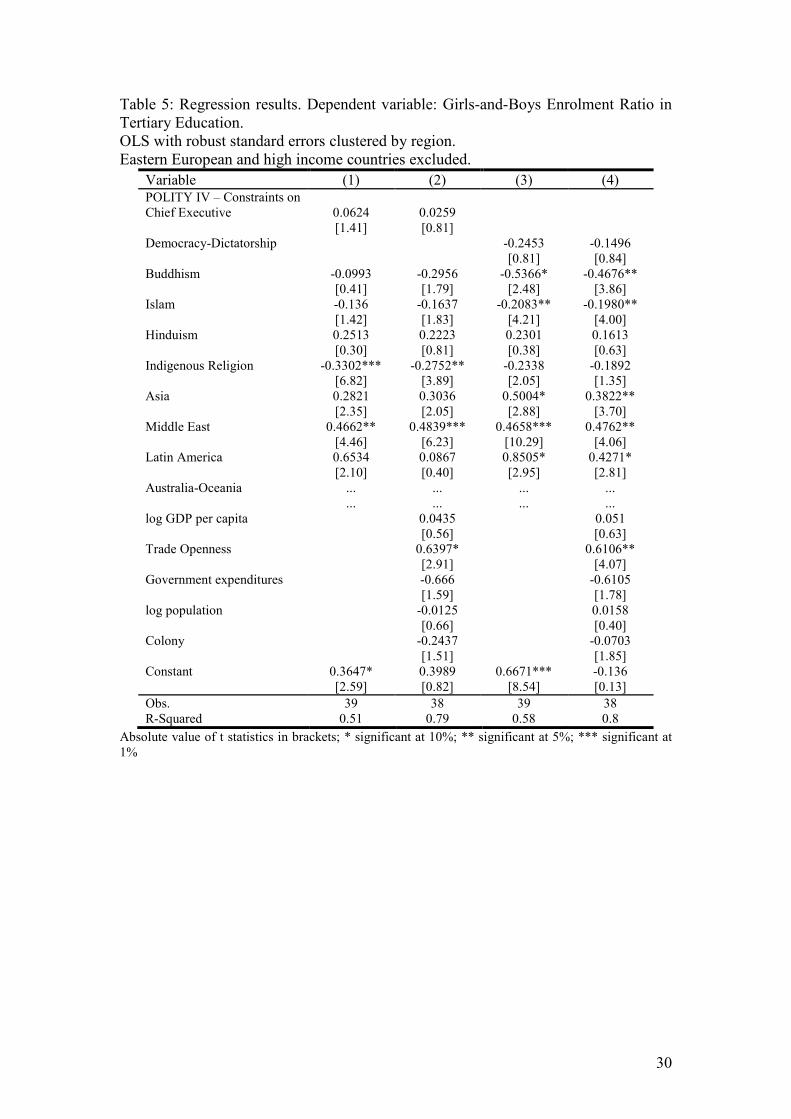
high/low income threshold). Table 5 shows that democracy does not have an
influence on the girls-and-boys enrolment ratios in tertiary education when Eastern
16
European and high income countries are excluded. By contrast, the results in Table 4
show that gender equality in education was significantly lower in countries with
Muslim majorities and countries with Indigenous Religion: the Islam and Indigenous
Religion dummy variables have negative signs and are statistically significant at the
1% level. The religion variables have a somewhat weaker effect on gender equality in
education at the tertiary level when Eastern European and high income countries are
excluded (Table 5) but inferences regarding the influence of religion on gender
equality in education do not change.
The results presented in Tables 2 to 5 could be subject to omitted variable bias.
We have therefore included female employment in agriculture (as a share of total
employment) because employment in agriculture has been traditionally associated
with greater gender and income inequality in favour of males. Female employment in
agriculture has negatively influenced gender equality in education at the primary and
secondary level. Female employment in agriculture has the expected negative sign
and is statistically significant at the 1% level. Including female employment in
agriculture significantly reduces the sample and even turns the democracy variable to
a negative influence on gender equality in education. This robustness test confirms
that the influence of democracy on gender equality in education strongly depends on
the countries included in the sample. Inferences regarding religion do not change.
In the base-line model, we have employed cross-sectional data on girls-and-
boys enrolment ratios for the year 2006 and regressed it on averages of the democracy
variables over the 1991-2005 period. We now replace the cross-sectional data on
girls-and-boys enrolment ratios for the year 2006 by the data for the year 2001 and
17
regress it on averages of the democracy variables over the 1991-2000 period.12
The
results are very similar to the results presented in Tables 2 to 5 and inferences
regarding the influence of democracy and religion on gender equality in education do
not change.
The girls-and-boys enrolment ratio at the tertiary level of education may well
depend on the girls-and-boys enrolment ratio at the primary and secondary level of
education. We have therefore included the girls-and-boys enrolment ratio at the
primary and secondary level of education in 2001 as an explanatory variable in our
model with the girls-and-boys enrolment ratio at the tertiary level of education in
2006 as dependent variable. The girls-and-boys enrolment ratio at the primary and
secondary level of education in 2001 has a positive sign and is statistically significant
at the 10% level in the base-line model and at the 5% level in the subsample when
Eastern European and high income countries are excluded. Including the girls-and-
boys enrolment ratio at the primary and secondary of education in 2001 does not
change the inferences regarding the democracy and religion variables.
We have focused on discrimination against girls. Girls-and-boys enrolment
ratios that are significantly higher than 1 can also be interpreted as discrimination,
against boys, however. We have therefore excluded all countries that have enrolment
ratios in primary and secondary education higher than 1.05 and 1.1 and enrolment
ratios in tertiary education higher than 1.05, 1.1, 1.5, 2.0 (the variance of enrolment
ratios in tertiary education is higher than in primary and secondary education).
Enrolment ratios are especially high in some countries. The reason may well be that
male dominant elites do not care about education because men will rule anyhow and
12
For some countries, data are not available for 2001 but for 2000 or 2002. We then use the data for
2000 or 2002 to include as much countries as possible.
18
consider education as a waste of time. Excluding the countries with high enrolment
ratios does not, however, make the democracy variables statistically significant.
Democracies can be coded more expansively. Cheibub et al. (2010) have
conservatively coded countries as democracy only if there has been alternation in
power. Some countries appear, however, to have "contested" elections for the
executive and legislature, but there has never been an alternation of the government in
power. The data by Cheibub et al. (2010) also allow consideration of these cases as
democracies in addition to their conservative coding. We have included the more
expansive democracy coding. Results suggest that the more expansive democracy
variables do not have an influence on gender equality in education (results not
shown).
We have replaced the religion dummy variables using information from the
Encyclopedia of World Geography (1994) and the CIA World Factbook (2010) by the
data on religious fractionalization by Alesina et al. (2003). This database reports for
each country in the year 1980 the percentage of the population belonging to the three
most widespread religions in the world. We again distinguish Christianity, Buddhism,
Islam, Hinduism and Indigenous Religion. Inferences are very similar to the results
with the dummy variables on religion. In fact, the negative influence of Islam on
gender equality in education is more severe with the data by Alesina et al. (2003).
The reported effects could also be driven or mitigated by idiosyncratic
circumstances in individual countries. For this reason, we checked whether the results
are sensitive to the inclusion/exclusion of particular countries. The results (not
reported here) indicate that this is not the case.

19
5 Conclusion
Numerous studies have focused on government decisions in countries with
limited democratic institutions. Such governments have incentives to resist economic
development in various ways (Hillman, 2007; Doucouliagos and Paldam, 2008). We
have investigated whether political institutions affect gender equality in education,
with the counter explanation being culture and religion. The results suggest no robust
effect of democratic political institutions on discrimination against girls in education.
We find no evidence of gender discrimination in forestalling education in autocracies.
Likewise, there is no gender discrimination in promoting education in democracies.
We have found that culture and religion have a greater influence on gender equality in
education than political institutions.
Modernization may lead to both democratization and cultural change favoring
gender equality. Inglehart et al. (2002), for example, investigate the relationship
between gender equality and democratization by focusing on the role of women in
parliament and politics. They conclude that “support for gender equality is not just a
consequence of democratization. It is part of a broad cultural change that is
transforming industrialized societies and bringing growing mass demands for
increasingly democratic institutions” (p. 343). An important aspect of cultural change
is how religion affects institutions and behaviour. Religion influences the level of
democracy. Muslim countries stand out in being more authoritarian and less
democratic (Borooah and Paldam, 2007). Muslim countries also have less gender
equality (Norton and Tomal, 2009). Our empirical results suggest that the gender
inequality is not attributable to the absence of democracy but to culture and religion.
20
Acknowledgements
We thank Christian Bjørnksov, Arye Hillman, Winfried Pohlmeier, Heinrich
Ursprung and the participants of the Far East and South Asia Meeting of the
Econometric Society, Tokyo, 2009, the Australasian Development Economics
Workshop, Sydney, 2010 and the International Society of New Institutional
Economics, Stirling, 2010 for useful hints and suggestions.
References
Acemoglu, D., Johnson, S., Robinson, J., Yared P., 2005. From education to
democracy. American Economic Association Papers and Proceedings 95, 44-49.
Adams, M., 2006. Colonial policies and women’s participation in public life: The
case of British Southern Cameroons. African Studies Quarterly 8, 1-22.
Alesina, A., Devleeschauwer, A., Easterley, W., Kurlat, S., Wacziarg, R., 2003.
Fractionalization. Journal of Economic Growth 8, 155-194.
Baliamoune-Lutz , M., McGillivray, M., 2007. Gender inequality and growth:
Evidence from Sub-Saharan and Arab countries.
http://www.uneca.org/aec/documents/Mina%20Baliamoune-Lutz.pdf
(downloaded February 2009).
Barrett, D., Kurian, Johnson, T.M. 2001. World Christian Encyclopedia, 2nd Ed.
Oxford University Press, Oxford.
Barro, R., 1999. Determinants of democracy. Journal of Political Economy 107, 158
– 183.
Barro, R., Lee, J.-W, 1993. International comparisons of educational attainment.
Journal of Monetary Economics 32, 363-94.
Bateman, G., Egan, V. (Eds.), 1994. The Encyclopaedia of World Geography.
Andromeda Oxford Limited, Oxford, U.K.
Beaman, L., Chattopadhhyay, R., Duflo, E., Pande, R., Topalova, P., 2009. Powerful
women: Does exposure reduce bias? Quarterly Journal of Economics 124, 1497-
1540.
Becker, S., Woessmann, L., 2009. Was Weber wrong? A human capital theory of
Protestant economic history. Quarterly Journal of Economics 124, 531-596.
21
Becker, S., Woessmann, L., 2010. The effect of Protestantism on education before
industrialization: evidence from 1816 Prussia. Economics Letters, in press.
Beer, C., 2009. Democracy and gender equality. Studies in International Comparative
Development 44, 212-227.
Borooah, V.K., Paldam, M., 2007. Why is the world short of democracy? A cross-
country analysis of barriers to representative government.
European Journal of Political Economy 23, 582-604.
Bourguignon, F., Verdier, T., 2000. Ruling elite, democracy, inequality and growth.
Journal of Development Economics 62, 285-313.
Brown, D., 2000. Democracy, colonization, and human capital in Sub-Saharan Africa.
Studies in Comparative International Development 35, 20-40.
Brown, D., 2004. Democracy and gender inequality in education: A cross national
examination. British Journal of Political Science 34, 137-152.
Cagaty, N., Ozler, S., 1995. Feminization of the labour force: The effects of long
term development and structural adjustment. World Development 23, 1883-1894.
Castelló-Climent, A., 2008. On the distribution of education and democracy.
Journal of Development Economics 87, 179-190.
Cheibub, J., Gandhi, J., Vreeland, J., 2010. Democracy and dictatorship revisited.
Public Choice 143, 67-101.
CIA World Factbook, 2010. (https://www.cia.gov/library/publications/the-world-
factbook/) downloaded April 2010.
Cooray, A., 2009. Does colonialism exert a long term economic impact on adult
literacy? Working Paper No. 176, Queen Elizabeth House, University of Oxford,
Oxford, U.K.
Di Tommaso, M.L., Shima, I., Strøm, S., Bettio, F., 2009. As bad as it gets: Well-
being deprivation of sexually exploited women. European Journal of Political
Economy 25, 143-162.
Di Gioacchino, D., Sabani, L., 2009. Education policy and inequality: A political
economy analysis. European Journal of Political Economy 25, 463-478.
Doepke, M., Tertilt, M., 2009. Women´s liberation: What´s in it for men? Quarterly
Journal of Economics 124, 1541-1591.
Dollar, D., Gatti, R., 1999. Gender inequality, income and growth: Are good times
good for women? Policy Research Report on Gender and Development Working
Paper Series No. 1, World Bank, Washington DC.
22
Doucouliagos, H., Paldam, M., 2008. Aid effectiveness on growth: A meta study.
European Journal of Political Economy 24, 1-24.
Fernandez, R., Fogli, A., Olivetti, C., 2004. Mothers and sons: Preference formation
and female labor force dynamics. Quarterly Journal of Economics 119, 1249-
1299.
Fontana, M., Wood, A., 2000. Modelling the effects of trade on women, at work and
at home. World Development 28, 1173-1190.
Glaeser, E., La Porta, R., Lopez-de-Silanes, F., Shleifer, A., 2004. Do institutions
cause growth? Journal of Economic Growth 9, 271-303.
Gundlach, E., Paldam, M., 2009. A farewell to critical junctures: Sorting out long-run
causality of income and democracy. European Journal of Political Economy
25, 340-354.
Hillman, A.L., 2004. Nietzschean development failures. Public Choice 119, 263-280.
Hillman, A.L., 2007. Democracy and low-income countries. In Casas Pardo, J.,
Schwartz, P. (Eds.), Public Choice and Challenges of Democracy. Edward
Elgar, Cheltenham, U.K., pp. 277 – 294.
Hillman, A.L., 2009. Public Finance and Public Policy: Responsibilities and
Limitaitons of Government, 2nd Ed. Cambridge University Press, New York.
Hillman, A.L., Jenkner, E., 2004. User payments for basic education in low-income
countries. In Gupta, S., Clements, B., Inchauste, G. (Eds.), Helping countries
Develop: The Role of Fiscal Policy. International Monetary Fund, Washington
DC, pp. 233 – 264.
Inglehart, R., Norris, P., Welzel, C., 2002. Gender equality and democracy.
Comparative Sociology 1, 321-345.
Inglehart, R., Baker, W., 2000. Modernization, cultural change and the persistence of
traditional values. American Sociological Review 65, 19-51.
Klasen, S., 2002. Low schooling for girls, slower growth for all? Cross country
evidence on the effect of gender inequality in education on economic
development. World Bank Economic Review 16, 345-373.
Klasen, S., Wink, C., 2003. Missing women: revisiting the debate. Feminist
Economics 9, 263 – 299.
23
Knowles, S., Lorgelly, P., Ownen, P., 2002. Are educational gender gaps a brake on
economic development? Some cross country empirical evidence. Oxford
Economic Papers 54, 118 – 149.
Larson, A., 2009. Toward an Afghan democracy? Exploring perceptions of
democratisation in Afghanistan. Working Paper, Afghanistan Research and
Evaluation Unit. Kabul.
Marshall, M., Jaggers, K., 2006. Polity IV Country Reports.
(http://www.systemicpeace.org/polity/polity06.htm#nam) downloaded January
2010.
Munck, G., Verkuilen, J., 2002. Conceptualizing and measuring democracy:
Evaluating alternative indices. Comparative Political Studies 55, 5-34.
Norton, S. W., Tomal, A., 2009. Religion and female educational attainment. Journal
of Money, Credit and Banking 41, 961-986.
Papaioannou, E., Siourounis, G., 2008. Economic and social factors driving the third
wave of democratization. Journal of Comparative Economics 36, 365-387.
Schultz, T., 1994. Human capital investment in women and men: micro and macro
evidence of economic returns. Occasional Paper 44, International Centre on
Economic Growth. San Francisco CA.
Schultz, T., 2002. Why governments should invest more to educate girls. World
Development 30, 207-225.
United Nations, 2008. Millennium development goals.
(http://www.unmillenniumproject.or/goals) downloaded February 2008.
Vreeland, J., 2008. The effect of political regime on civil war: Unpacking anocracy.
Journal of Conflict Resolution 52, 401-425.
Welzman, Y., 2010. Development failure and the failure of democracy. Chapter 4 in:
The Persistence of Ineffective Aid. PhD thesis, Bar-Ilan University.
World Bank, 2010. World Development Indicators. Washington, D. C.
24
Figure 1: Girls-and-Boys Enrolment Ratio in Primary and Secondary Education
(2006) and POLITY IV Chief of Executive Democracy Index (average 1991-2005)
AFG
DZA
ARGARM
AUSAUTAZE
BHR
BGD
BLR
BEL
BEN
BTN
BOLBWA
BRA
BGR
BFA
BDI KHM
CMR
CAN
TCD
CHL
CHNCOL
ZAR
CRIHRVCUB CYPCZEDNK
DJI
DOM
ECUSLV
ERI
EST
ETH
FJIFIN
FRAGMB
GEODEU
GHA
GRC
GTM
GIN
GUY
HND
HUN
IND
IDN
IRN
IRQ
IRLISRITAJAMJPN
JOR
KAZ
KEN KOR
KWT KGZ
LAO
LVA
LSO
LBR
LBY
LTUMKD
MDG
MWI
MLI
MRTMUSMEX
MDA
MNG
MARMOZ
MMR
NAM
NPL
NLD
NZLNIC
NER
NGA
NOROMN
PAK
PANPRY
PER PHL
POLPRT
QAT
ROMRUSRWA
SAUSEN
SLE
SVKSVN
SLB
ZAF
ESP
SDN
SWZ
SWE
CHESYR
TJK
TGO
TTOTUN
TUR
UGA UKRARE GBR
USA
URY
UZB
VEN
YEM
ZMBZWE
.6.8
11
.2G
irls
-an
d-B
oy
s E
nro
lme
nt
Ra
tio
0 2 4 6 8Constraints on Chief Executive
Source: Worldbank (2010) and Marshall and Jaggers (2006)
Figure 2: Girls-and-Boys Enrolment Ratio in Primary and Secondary Education
(2006) and Democracy-Dictatorship Variable (average 1991-2005)
AFG
DZA
ADO
ATG
ARGARM
AUSAUTAZE
BHSBHR
BGD
BLR
BELBLZ
BEN
BTN
BOLBIHBWA
BRABRN
BGR
BFA
BDIKHM
CMR
CAN
TCD
CHL
CHNCOL
ZAR
CRIHRVCUB CYPCZEDNK
DJI
DMA
DOM
ECUSLV
ERI
EST
ETH
FJIFIN
FRAGMB
GEODEU
GHA
GRCGRD
GTM
GIN
GUY
HND
HUNISL
IND
IDN
IRN
IRQ
IRLISRITAJAMJPN
JOR
KAZ
KEN
KIR
KWT KGZ
LAO
LVA
LBNLSO
LBR
LBY
LIE
LTU
LUX
MKDMDG
MWIMDV
MLI
MLTMHLMRT
MUSMEX FSMMDA
MARMOZ
MMR
NAM
NPL
NLD
NZLNIC
NER
NGA
NOROMN
PAK
PLWPANPRY
PER PHL
POLPRT
QAT
ROMRUSRWA
WSM
STP
SAUSEN
SRBSYC
SLE
SVKSVN
SLB
ZAF
ESPKNALCAVCT
SDN
SUR
SWZ
SWE
CHESYR
TJK
TGO
TON TTOTUN
TUR
UGA UKRARE GBR
USA
URY
UZB
VEN
YEM
ZMBZWE
.6.8
11
.2G
irls
an
d B
oy
s E
nro
lme
nt
Ra
tio
0 .2 .4 .6 .8 1Democracy-Dictatorship
Source: Worldbank (2010) and Cheibub et al. (2010)
25
Figure 3: Girls-and-Boys Enrolment Ratio in Primary and Secondary Education
(2006) and Christianity
AFG
DZA
ADO
ATG
ARGARM
ABWAUSAUTAZE
BHSBHR
BGD
BLR
BELBLZ
BEN
BMUBTN
BOLBIH BWA
BRABRN
BGR
BFA
BDIKHM
CMR
CANCYM
TCD
CHL
CHNCOL
ZAR
CRIHRVCUBCYPCZEDNK
DJI
DMA
DOM
ECUSLV
ERI
EST
ETH
FJIFIN
FRAGMB
GEODEU
GHA
GRCGRD
GTM
GIN
GUY
HND
HKG HUNISL
IND
IDN
IRN
IRQ
IRLISR
ITAJAMJPN
JOR
KAZ
KEN
KIR
KOR
KWTKGZ
LAO
LVA
LBNLSO
LBR
LBY
LIE
LTU
LUX
MKDMDG
MWIMDV
MLI
MLTMHLMRTMUS MEXFSMMDA
MNG
MARMOZ
MMR
NAM
NPL
NLD
NZLNIC
NER
NGA
NOROMN
PAK
PLWPANPRYPERPHL
POLPRT
QAT
ROMRUSRWA
WSM
STP
SAUSEN
SRBSYC
SLE
SVKSVN
SLB
ZAF
ESPKNALCAVCT
SDN
SUR
SWZ
SWE
CHESYR
TJK
TGO
TONTTOTUN
TUR
UGAUKRARE GBR
USA
URY
UZB
VENWBG
YEM
ZMBZWE
.6.8
11
.2G
irls
an
d B
oy
s E
nro
lme
nt
Ra
tio
0 .2 .4 .6 .8 1Christianity
Source: Worldbank (2010), Bateman and Egan (1994) and CIA World Factbook (2010)
Figure 4: Girls-and-Boys Enrolment Ratio in Primary and Secondary Education
(2006) and Islam
AFG
DZA
ADO
ATG
ARGARM
ABWAUSAUT AZE
BHS BHR
BGD
BLR
BELBLZ
BEN
BMUBTN
BOLBIHBWA
BRA BRN
BGR
BFA
BDIKHM
CMR
CANCYM
TCD
CHL
CHNCOL
ZAR
CRIHRVCUBCYPCZEDNK
DJI
DMA
DOM
ECUSLV
ERI
EST
ETH
FJIFIN
FRAGMB
GEODEU
GHA
GRCGRD
GTM
GIN
GUY
HND
HKGHUNISL
IND
IDN
IRN
IRQ
IRLISRITAJAMJPN
JOR
KAZ
KEN
KIR
KOR
KWTKGZ
LAO
LVA
LBNLSO
LBR
LBY
LIE
LTU
LUX
MKDMDG
MWIMDV
MLI
MLTMHLMRT
MUSMEXFSMMDA
MNG
MARMOZ
MMR
NAM
NPL
NLD
NZLNIC
NER
NGA
NOROMN
PAK
PLWPANPRYPERPHL
POLPRT
QAT
ROMRUSRWA
WSM
STP
SAUSEN
SRBSYC
SLE
SVKSVN
SLB
ZAF
ESPKNALCAVCT
SDN
SUR
SWZ
SWE
CHESYR
TJK
TGO
TONTTOTUN
TUR
UGAUKRAREGBR
USA
URY
UZB
VENWBG
YEM
ZMBZWE
.6.8
11
.2G
irls
an
d B
oy
s E
nro
lme
nt
Ra
tio
0 .2 .4 .6 .8 1Islam
Source: Worldbank (2010), Bateman and Egan (1994) and CIA World Factbook (2010)
26
Table 1: Summary Statistics
Variable Obs. Mean St. Dev Min Max Source
Girls/Boys in Primary and
Secondary Education (Ratio)
2006
167 0.97 0.09 0.58 1.16 Worldbank (2010)
Girls/Boys in Tertiary
Education (Ratio)
2006
132 1.17 0.74 0.06 6.26 Worldbank (2010)
POLITY IV – Constraints on
Chief Executive
154 4.60 2.04 1 7 Marshall and Jaggers
(2006)
Democracy-Dictatorship 185 0.55 0.47 0 1 Cheibub et al. (2010)
Africa 210 0.24 0.43 0 1 Own Calculation
Asia 210 0.12 0.33 0 1 Own Calculation
Middle East 210 0.10 0.29 0 1 Own Calculation
Latin America 210 0.15 0.36 0 1 Own Calculation
Eastern Europe 210 0.14 0.35 0 1 Own Calculation
Western Europe 210 0.14 0.35 0 1 Own Calculation
Northern America 210 0.01 0.12 0 1 Own Calculation
Australia-Oceania 210 0.08 0.27 0 1 Own Calculation
Christian 210 0.61 0.49 0 1 Bateman and Egan
(1994), CIA World
Factbook (2010)
Buddhism 210 0.07 0.25 0 1 Bateman and Egan
(1994), CIA World
Factbook (2010)
Islam 210 0.25 0.43 0 1 Bateman and Egan
(1994), CIA World
Factbook (2010)
Hinduism 210 0.02 0.15 0 1 Bateman and Egan
(1994), CIA World
Factbook (2010)
Indigenous Religion 210 0.01 0.12 0 1 Bateman and Egan
(1994), CIA World
Factbook (2010)
GDP per capita (constant
prices)
188 8615.46 9008.46 294.47 48970.31 Penn World Tables 6.3
Heston and Summers
(1991)
Trade Openness
(as a share of GDP)
188 0.87 0.46 0.02 3.60 Penn World Tables 6.3
Heston and Summers
(1991)
Government expenditures 188 0.21 0.11 0.04 0.67 Penn World Tables 6.3
Heston and Summers
(1991)
Population 210 2.81E+07 1.13E+08 18206 1.24E+09 Worldbank (2010)
Colony 189 0.41 0.49 0 1 Own Calculation
Female Employment in
Agriculture
(as a share of total
employment)
155 0.24 0.23 0.00 0.89 Worldbank (2010)
Christian (Alesina et al.) 210 0.46 0.37 0 1 Alesina et al. (2003)
Buddhism (Alesina et al.) 210 0.04 0.18 0 0.96 Alesina et al. (2003)
Islam (Alesina et al.) 210 0.23 0.36 0 1 Alesina et al. (2003)
Hinduism (Alesina et al.) 210 0.02 0.10 0 0.93 Alesina et al. (2003)
Indigenous Religion (Alesina
et al.)
210 0.04 0.11 0 0.64 Alesina et al. (2003)
27
Table 2: Regression results. Dependent variable: Girls-and-Boys Enrolment Ratio in
Primary and Secondary Education.
OLS with robust standard errors clustered by region
Variable (1) (2) (3) (4)
POLITY IV – Constraints on
Chief Executive 0.0102 0.0028
[1.43] [0.43]
Democracy-Dictatorship -0.0024 -0.0158
[0.14] [0.99]
Buddhism -0.0452 -0.0509 -0.0961 -0.0842
[0.42] [0.58] [0.92] [1.10]
Islam -0.0615** -0.0558 -0.0803** -0.0650*
[2.39] [1.87] [3.04] [2.21]
Hinduism -0.0248 -0.0243 0.0118 0.0069
[0.92] [0.79] [0.20] [0.44]
Indigenous Religion -0.1930*** -0.1852*** -0.1926*** -0.1725***
[11.93] [9.55] [12.31] [10.61]
Asia 0.0563 0.051 0.075 0.0508
[1.03] [0.93] [1.76] [1.43]
Middle East 0.1230*** 0.0626** 0.1209*** 0.0634**
[7.14] [2.80] [6.33] [2.89]
Latin America 0.0800*** 0.04 0.0854*** 0.0402
[3.76] [1.40] [5.81] [1.43]
Eastern Europe 0.0814*** 0.0451 0.0905*** 0.0513*
[5.96] [1.82] [11.11] [2.29]
Western Europe 0.0561* -0.0327 0.0736*** -0.0207
[1.93] [0.77] [4.42] [0.51]
North America 0.0516 -0.0327 0.0725*** -0.0211
[1.75] [0.72] [4.36] [0.48]
Australia-Oceania 0.0542* 0.0087 0.0874*** 0.0401
[1.95] [0.27] [6.86] [1.83]
log GDP per capita 0.0386*** 0.0402***
[3.80] [3.50]
Trade Openness 0.0043 0.0008
[0.28] [0.05]
Government expenditures -0.1524*** -0.1058
[4.03] [1.81]
log population -0.0075 -0.0063
[1.37] [1.17]
Colony -0.0035 -0.0031
[0.24] [0.17]
Constant 0.8721*** 0.7665*** 0.9249*** 0.7479***
[38.15] [5.40] [137.79] [4.56]
Obs. 135 132 157 151
R-Squared 0.37 0.51 0.34 0.51
Absolute value of t statistics in brackets; * significant at 10%; ** significant at 5%; *** significant at
1%

28
Table 3: Regression results. Dependent variable: Girls-and-Boys Enrolment Ratio in
Tertiary Education.
OLS with robust standard errors clustered by region
Variable (1) (2) (3) (4)
POLITY IV – Constraints on
Chief Executive -0.0272 -0.0757
[0.39] [1.09]
Democracy-Dictatorship -0.168 -0.2407
[0.97] [1.71]
Buddhism -0.3768 -0.5732** -0.7161** -0.6360***
[0.76] [2.91] [2.40] [3.87]
Islam -0.2437* -0.3071** -0.2894*** -0.2795**
[2.33] [3.46] [4.49] [3.21]
Hinduism 0.3781 0.2829 0.2714 0.2776
[1.09] [0.68] [0.71] [0.65]
Indigenous Religion -0.3763*** -0.3686** -0.3583*** -0.2874*
[12.47] [3.00] [4.87] [2.17]
Asia 0.4985 0.6264** 0.7011*** 0.4951**
[1.70] [2.58] [4.88] [2.78]
Middle East 1.1443*** 0.7307** 1.1410*** 0.7170**
[14.54] [2.55] [20.33] [2.64]
Latin America 0.6465*** 0.4058 0.6509*** 0.4505***
[4.78] [1.75] [6.10] [4.07]
Eastern Europe 0.7134*** 0.4943 0.7083*** 0.5595**
[6.46] [1.57] [10.27] [3.13]
Western Europe 0.6846** 0.0702 0.6733*** 0.0594
[3.05] [0.27] [4.93] [0.35]
North America 0.8370*** 0.4355 0.8347*** 0.3128
[3.66] [1.57] [6.11] [1.16]
Australia-Oceania 0.7446*** 0.1276 0.7234*** 0.1046
[3.62] [0.67] [6.68] [0.60]
log GDP per capita 0.3384 0.3495
[1.67] [1.86]
Trade Openness -0.1171 -0.2214
[0.42] [0.99]
Government expenditures -0.1862 -0.0573
[0.64] [0.19]
log population -0.1241 -0.1029*
[1.72] [2.08]
Colony 0.1498 0.2371
[0.41] [0.76]
Constant 0.7631** 0.4529 0.7433*** -0.2275
[2.85] [0.65] [15.86] [0.19]
Obs. 115 112 123 119
R-Squared 0.29 0.52 0.29 0.54
Absolute value of t statistics in brackets; * significant at 10%; ** significant at 5%; *** significant at
1%
29
Table 4: Regression results. Dependent variable: Girls-and-Boys Enrolment Ratio in
Primary and Secondary Education.
OLS with robust standard errors clustered by region
Eastern European and high income countries excluded.
Variable (1) (2) (3) (4)
POLITY IV – Constraints on
Chief Executive 0.0284** 0.0245**
[2.83] [4.29]
Democracy-Dictatorship 0.0352 0.0357
[0.92] [1.16]
Buddhism -0.0466 -0.0565 -0.104 -0.0795
[0.40] [0.53] [0.85] [0.70]
Islam -0.0704** -0.0848*** -0.0907*** -0.0940***
[3.71] [4.99] [10.71] [6.45]
Hinduism -0.0751 -0.0628 -0.0696 -0.0465
[1.57] [2.02] [1.82] [1.57]
Indigenous Religion -0.2148*** -0.2357*** -0.2020*** -0.2200***
[15.93] [28.91] [7.52] [16.80]
Asia 0.0537 0.0106 0.0828 0.0266
[0.99] [0.15] [1.70] [0.38]
Middle East 0.0837*** 0.0802** 0.0739*** 0.0774**
[5.57] [3.34] [5.26] [3.03]
Latin America 0.0637** -0.0722 0.1045*** -0.0031
[3.65] [2.10] [4.92] [0.08]
Australia-Oceania -0.0617 -0.0816** 0.0757* 0.0524**
[1.89] [3.45] [2.59] [3.21]
log GDP per capita 0.0884* 0.0851
[2.23] [1.86]
Trade Openness 0.0262 0.0421
[0.58] [1.27]
Government expenditures -0.2101*** -0.2096***
[4.79] [4.61]
log population -0.0142 -0.0079
[1.96] [1.27]
Colony -0.0493** -0.0166
[3.78] [1.33]
Constant 0.8026*** 0.5013 0.8990*** 0.4591
[20.70] [1.67] [90.20] [1.35]
Obs. 52 51 55 53
R-Squared 0.32 0.53 0.29 0.50
Absolute value of t statistics in brackets; * significant at 10%; ** significant at 5%; *** significant at
1%
30
Table 5: Regression results. Dependent variable: Girls-and-Boys Enrolment Ratio in
Tertiary Education.
OLS with robust standard errors clustered by region.
Eastern European and high income countries excluded.
Variable (1) (2) (3) (4)
POLITY IV – Constraints on
Chief Executive 0.0624 0.0259
[1.41] [0.81]
Democracy-Dictatorship -0.2453 -0.1496
[0.81] [0.84]
Buddhism -0.0993 -0.2956 -0.5366* -0.4676**
[0.41] [1.79] [2.48] [3.86]
Islam -0.136 -0.1637 -0.2083** -0.1980**
[1.42] [1.83] [4.21] [4.00]
Hinduism 0.2513 0.2223 0.2301 0.1613
[0.30] [0.81] [0.38] [0.63]
Indigenous Religion -0.3302*** -0.2752** -0.2338 -0.1892
[6.82] [3.89] [2.05] [1.35]
Asia 0.2821 0.3036 0.5004* 0.3822**
[2.35] [2.05] [2.88] [3.70]
Middle East 0.4662** 0.4839*** 0.4658*** 0.4762**
[4.46] [6.23] [10.29] [4.06]
Latin America 0.6534 0.0867 0.8505* 0.4271*
[2.10] [0.40] [2.95] [2.81]
Australia-Oceania ... ... ... ...
... ... ... ...
log GDP per capita 0.0435 0.051
[0.56] [0.63]
Trade Openness 0.6397* 0.6106**
[2.91] [4.07]
Government expenditures -0.666 -0.6105
[1.59] [1.78]
log population -0.0125 0.0158
[0.66] [0.40]
Colony -0.2437 -0.0703
[1.51] [1.85]
Constant 0.3647* 0.3989 0.6671*** -0.136
[2.59] [0.82] [8.54] [0.13]
Obs. 39 38 39 38
R-Squared 0.51 0.79 0.58 0.8
Absolute value of t statistics in brackets; * significant at 10%; ** significant at 5%; *** significant at
1%