Embed Size (px)
Citation preview

gender income distributionof top earners in ASX200 companies 2006 EOWA census of women in leadership
Australian Government
Equal Opportunity for Women in the Workplace Agencyadvancing women and business
what gets measuredgets managed
Macquarie University is highly acclaimed for the innovation and high quality of its teaching and research. In 2006 the University was the Gold sponsor of the 2006 EOWA Census of Women in Leadership and conducted the research. The analysis of ASX200 Top Earners from this data, was conducted by Associate Professor Peter McGraw, Director of the Labour Management Studies Foundation and Department of Business, Division of Economic and Financial Studies and Dr. Margaret Mackisack, Consulting Statistician.
www.efs.mq.edu.au/dept/lmsf.htm
© Equal Opportunity for Women in the Workplace Agency 2008
ISBN 978 1 74138 258 7
This work is copyright. Apart from any use as permitted under the Copyright Act 1968, no part may be reproduced by any process without prior written permission from the Equal Opportunity for Women in the Workplace Agency. Requests and enquiries concerning reproduction, rights and content should be addressed to the Equal Opportunity for Women in the Workplace Agency, Level 6, 1 Elizabeth Plaza, North Sydney, NSW, 2060, Australia. Tel. 61 2 9448 8500 Fax. 61 2 9448 8572 www.eowa.gov.au

about eowa
An Australian Government Agency, the Equal Opportunity for Women in the Workplace Agency (EOWA) consults with Australian employers annually regarding their equal opportunity initiatives. EOWA’s vision is to create an Australia where women in the workplace can achieve their greatest potential. Since 2002, EOWA has published the EOWA Census of Women in Leadership, in partnership with Catalyst, in collaboration with Macquarie University and sponsored by ANZ Bank.
www.eowa.gov.au
gender income distributionof top earners in ASX200 companies 2006 EOWA census of women in leadership

preface
This Gender Income Distribution of Top Earners in ASX200 Companies provides an important and unprecedented piece of research to inform issues of pay disparity. Like research such as the Average Weekly Earnings and Employee Earnings, Benefits and Trade Union Membership data, produced by the Australian Bureau of Statistics and the Graduate salaries, by GradStats, this research also exposes large salary gaps between men and women.
Both the existence of a gap at this most senior level and the size of the gaps across roles are surprising and disappointing.
Since 2003, EOWA, together with partners ANZ Bank and Macquarie University, has conducted the Census of Women in Leadership. It has become an important measure of women’s participation in corporate leadership and marks women’s advancement, despite progress being glacial.
Using data collected as part of the 2006 EOWA Census of Women in Leadership, our research partner Macquarie University has been able to examine the declared Top Earners and/or Specified Executives of the 180 companies that published this information in their Annual Report. For the first time we are able to explore how gender interacts with income distribution at this level.
In 1969 the first federal equal pay case established equal pay for equal work. Equal pay for equal value was established three years later in 1972.
Over the past thirty years, women’s workforce participation has increased significantly, as have women’s earnings, however, women today experience an average pay gap of over 16%.
The gaps between women’s and men’s earnings reflect a number of complex and interrelated factors. Women’s lower share of discretionary payments like overtime, occupational and industrial segregation, lesser access to education and training, the impact of family responsibilities, the lack of suitably qualified mentors and champions, the prevalence of limiting gender stereotypes and in some cases outdated ways in which remuneration is calculated, all contribute to the earnings gap.
This research perhaps highlights a further factor – that when all else appears equal, there is a broad undervaluation of women’s skills. Methods used in remunerating senior level employees appear to have left women underpaid and undervalued.
Employers should act now to identify and address pay disparity in their workplace. Conducting audits, using resources like EOWA’s Pay Equity Tool available free on-line, removing gendered performance measures and providing pathways to non-traditional careers for women are just some of the ways of action.
Pay discrimination still exists, let’s make it history.
Anna McPhee Director

introduction
The analysis in this report is based on the data collected and validated for the 2006 EOWA Census of Women in Leadership. It includes companies listed on the ASX200 Index as at the Census Date, 1 February 2006. The information presented for each company is current as at the date of the most recent Annual Report issued before the Census Date.
The Annual Reports analysed for the Census revealed 180 companies which declared one or more Top Earners or Specified Executives (hereafter referred to as Top Earners). The names and gender of this group were validated as part of the Census methodology. Amounts of remuneration were extracted from the Annual Reports.
The position held by the subsequent Top Earners was recorded through the Executive Manager validation, and the actual positions were then coded into categories, which were used for analysis. Each company was asked to verify whether the executive’s position was a Line or Support position, and the company’s decision was final in this matter.
This data set is a Census, recording the population ASX200 Top Earners at the record date. Because it is the complete population, there is no statistical inference associated with the numerical results derived from the data. The numbers quoted are the actual true parameter values for this particular population and there is no uncertainty associated with any of them. There is no sense in which the Census represents a random sample from any larger super-population.

PoSITIon AnD GEnDEr ProfIlE ofexecutive managers*
> The 2006 EOWA Census of Women in Leadership shows women hold 12.0% of Executive Manager positions in the ASX200 Companies – only a marginal increase from previous Census results (Table 1).
> Figure 1 shows the profile of women Executive Managers by Function.
> No position group is dominated by women.
Figure 1. A Profile of Women Executive Managers by Function1
10 20 30 40n =
human resources
legal counsel
corporate communications
company secretary
general support
chief operating officer
information technology
sales, marketing
finance
general line
strategy
chief financial officer
production
chief executive officer
3425
1025
147
918
6408
1010
6
38.2%29.8%27.0%24.8%20.6%17.9%16.1%15.3%
7.8%7.7%7.1%6.5%5.0%3.0%
> Fewer than 10% of executives in CEO, CFO, Production, Strategy, Finance and other Line Positions are female.
> More than 25% of executives in Human Resources, Legal Counsel and Corporate Communications positions are female.
* See Glossary on page 13 for definition

PoSITIon AnD GEnDEr ProfIlE ofexecutive managers
Table 1. General Profile of ASX200 Executive Managers
position female % female male % male total
Chief Executive Officer 6 3.0% 194 97.0% 200
Chief Operating Officer 7 17.9% 32 82.1% 39
Company Secretary 25 24.8% 76 75.2% 101
Chief Financial Officer 10 6.5% 144 93.5% 154
Legal Counsel 25 29.8% 59 70.2% 84
Sales, Marketing 18 15.3% 100 84.7% 118
Production 10 5.0% 191 95.0% 201
Strategy 8 7.1% 105 92.9% 113
Human Resources 34 38.2% 55 61.8% 89
Information Technology 9 16.1% 47 83.9% 56
Corporate Communications 10 27.0% 27 73.0% 37
Finance 6 7.8% 71 92.2% 77
General Line 40 7.7% 479 92.3% 519
General Support 14 20.6% 54 79.4% 68
Total All Executive Positions 222 12.0% 1634 88.0% 1856

EArnInG STATuS oftop earners
> Overall females make up 11.1% of executives in companies which declare Top Earners (190 positions out of 1718).
> Figure 2 shows women hold 7.0% of the Top Earner positions in the ASX200 (80 positions out of 1136).
Figure 2. Top Earner Status of ASX200 companies by gender
> Of women executive managers, 58% are not Top Earners, compared to 31% of male executives. (Table 2)
> 60% of female Top Earners work in the bottom 100 companies by market capitalisation.
7%women 93%
men
female male top not top top not top
CEO 80% 20% 95% 5%
COO 100% 0% 73% 27%
Company Secretary 21% 79% 39% 61%
CFO 80% 20% 79% 21%
Legal 52% 48% 65% 35%
Sales 76% 24% 61% 39%
Production 40% 60% 63% 37%
Strategy 25% 75% 67% 33%
Human Resources 21% 79% 50% 50%
Info Technology 25% 75% 55% 45%
Communications 22% 78% 38% 62%
Finance 0% 100% 67% 33%
General Line 53% 47% 74% 26%
General Support 22% 78% 43% 57%
Grand Total 42% 58% 69% 31%
Table 2. Percentage of Top Earner Status by Gender
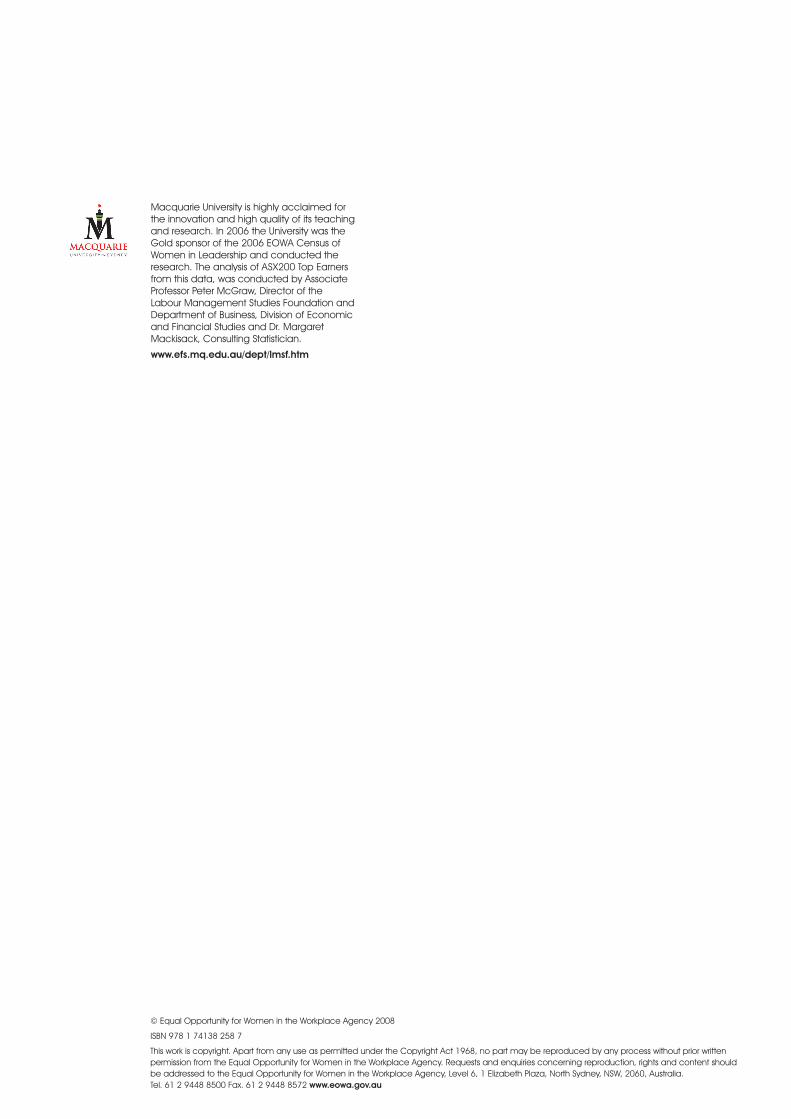
> Irrespective of gender, positions where women are more common, Company Secretary, Human Resources, Corporate Communications and General Support, have 40% or less chance of being Top Earner or Specified Executive. (Table 3)
> Males in the same positions are more likely to be Top Earners. (Table 2)
EArnInG STATuS oftop earners
> Table 4 shows the numbers of men and women who are Top Earners and not Top Earners according to whether they have a line or support position. The table also includes ratios to illustrate the likelihood of being a Top Earner.
> Women in line positions are more likely to be Top Earners than not (ratio 1.33), while women in support positions have less than 50% chance of being a Top Earner (ratio 0.42).
> Men in both line (ratio 2.38) and support positions (ratio1.22) are more likely to be Top Earners.
female ratio top/ male ratio top/ top not top not top top not top not top
Line 44 1.33 33 666 2.38 280
Support 32 0.42 76 224 1.22 183
Table 4. Line and Support Roles by Gender
Table 3. Top Earner Status by Position
executive managers % % grandposition top earner top earner not TE/SE not TE/SE total
CEO 170 94% 10 6% 180
COO 27 77% 8 23% 35
Company Secretary 32 35% 59 65% 91
CFO 111 79% 29 21% 140
Legal 48 62% 30 38% 78
Sales 73 63% 43 37% 116
Production 120 62% 73 38% 193
Strategy 70 64% 40 36% 110
Human Resources 33 39% 52 61% 85
Information Technology 26 50% 26 50% 52
Communications 11 33% 22 67% 33
Finance 43 64% 24 36% 67
General Line 349 73% 131 27% 480
General Support 23 40% 35 60% 58
Grand Total 1136 66% 582 34% 1718
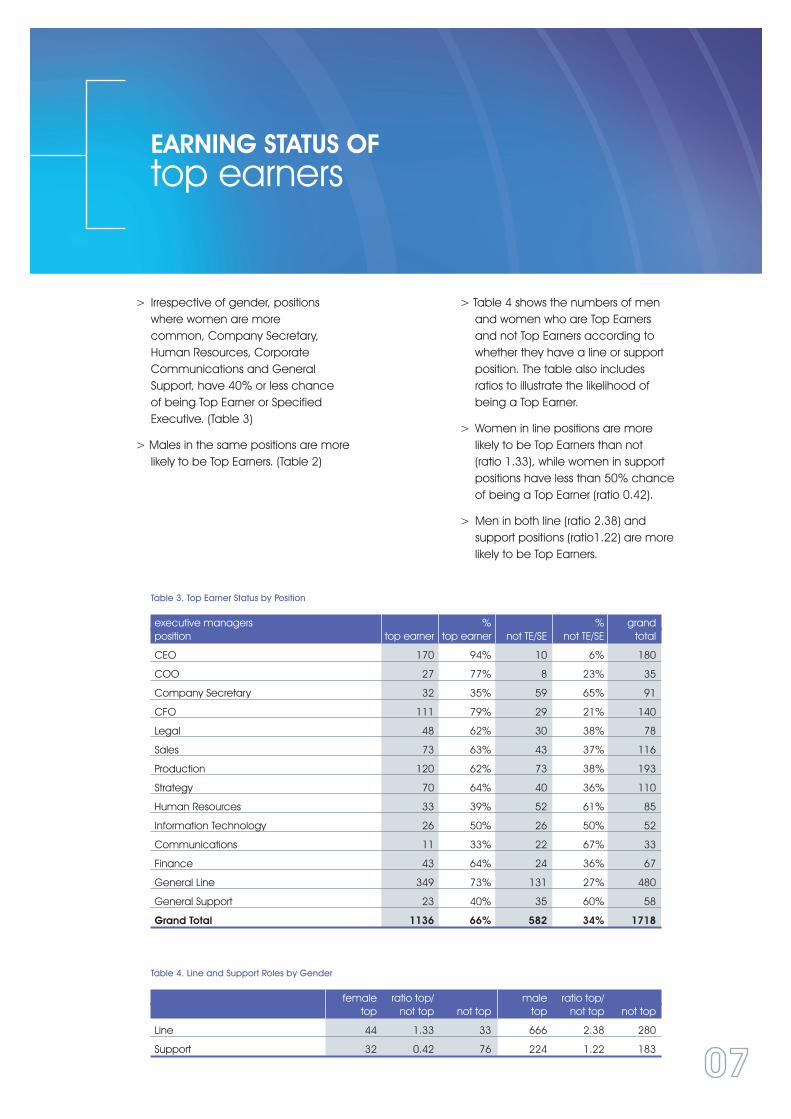
> Overall females make up 11.1% of executives in companies which declare Top Earners.
> Women represent only 7% of the total Top Earners in the ASX200 companies. However Figure 4 shows that in companies with 2+ women on boards, females represent 13% of the Top Earners.
> A higher percentage of Top Earners are female in companies with more women on the Board. (Table 5)
woMEn on boArDS AnDfemale top earners
0
15
10
5
0 % 1 2+
5.0%
7.0%
13.0
%
% to
p e
arn
ers
fem
ale
women board directors
Figure 4. Women on Boards and Female Top Earners
top earners top earners totalwomen board directors female male top earners
0 (n=88) 29 5% 513 95% 542
1 (n=65) 28 7% 384 93% 412
2+ (n=27) 23 13% 159 87% 182
Grand Total 80 7% 1056 93% 1136
Table 5. Top Earners and Women on Boards
remuneration2
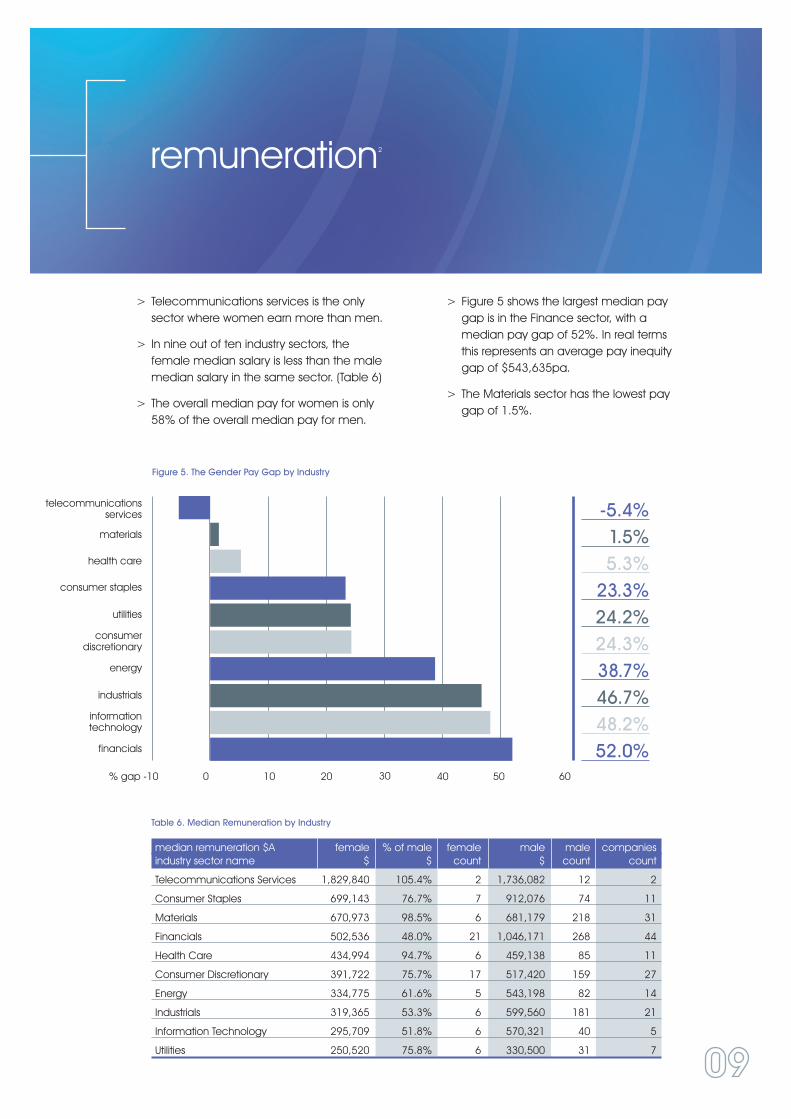
> Telecommunications services is the only sector where women earn more than men.
> In nine out of ten industry sectors, the female median salary is less than the male median salary in the same sector. (Table 6)
> The overall median pay for women is only 58% of the overall median pay for men.
> Figure 5 shows the largest median pay gap is in the Finance sector, with a median pay gap of 52%. In real terms this represents an average pay inequity gap of $543,635pa.
> The Materials sector has the lowest pay gap of 1.5%.
10 20 30 60% gap -10
telecommunications services
materials
health care
consumer staples
utilities
consumer discretionary
energy
industrials
information technology
financials
-5.4%1.5%5.3%
23.3%24.2%24.3%38.7%46.7%48.2%52.0%
40 500
Figure 5. The Gender Pay Gap by Industry
Table 6. Median Remuneration by Industry
median remuneration $A female % of male female male male companiesindustry sector name $ $ count $ count count
Telecommunications Services 1,829,840 105.4% 2 1,736,082 12 2
Consumer Staples 699,143 76.7% 7 912,076 74 11
Materials 670,973 98.5% 6 681,179 218 31
Financials 502,536 48.0% 21 1,046,171 268 44
Health Care 434,994 94.7% 6 459,138 85 11
Consumer Discretionary 391,722 75.7% 17 517,420 159 27
Energy 334,775 61.6% 5 543,198 82 14
Industrials 319,365 53.3% 6 599,560 181 21
Information Technology 295,709 51.8% 6 570,321 40 5
Utilities 250,520 75.8% 6 330,500 31 7

remuneration2
> In ten of thirteen position classifications, the female median salary is less than the male median salary in the same position. (Table 7)
> In the Strategy, Communications and General Support position classes women have higher median remuneration than men. However, these results, like others for women, should be interpreted with caution due to the low numbers.
> Figure 6 shows the positions of Chief Financial Officer and Chief Operating Officer each have a median pay gap of 50%.
> Eight of the fourteen positions have a median pay gap of 25% or more.
female % of male female male malemedian remuneration $A $ $ count $ count
CEO 945,252 67.7% 4 1,395,540 180
Strategy 859,912 161.2% 2 533,578 70
Communications 752,788 139.0% 2 541,741 10
General Support 733,657 121.8% 2 602,253 35
Sales 573,670 94.6% 12 606,559 64
General Line 543,352 74.4% 22 730,045 372
COO 384,856 49.6% 5 776,312 23
Information Technology 336,909 72.1% 2 467,540 24
CFO 323,432 49.1% 4 658,830 111
Human Resources 314,042 57.0% 6 551,237 27
Legal 303,636 53.1% 12 571,337 36
Company Secretary 286,415 89.2% 5 321,000 29
Production 286,089 71.3% 4 401,196 120
Finance n. a. 0 713,600 43
Table 7. Median Remuneration by Position

remuneration2
% gap -70 -60 -50 -40 -30 -20 -10 0 10 20 30 40 50 60
-61.2%-39.0%-21.8%
5.4%25.6%27.9%32.3%43.0%46.9%50.4%50.9%
Figure 6. Median Pay Gap by Position
strategy
communications
general support
sales
general line
information technology
CEO
human resources
legal
COO
CFO
> The median salary for women in line positions is higher than for those in support positions; however compared with their male peers they earn just over two thirds as much pay, a median pay gap of 28%. (Table 8)
> The median pay gap between male and female Top Earners in support positions is 39%.
Table 8. Median Remuneration by Line & Support
female % of male malemedian remuneration $A $ $ count $ count
CEO 945,252 67.7% 4 1,395,540 168
Line 455,234 71.9% 46 632,782 731
Support 331,070 61.3% 32 539,801 245

glossary of terms
ASX200 Index: “Comprises the S&P/ASX100 plus an additional 100 stocks, with an emphasis on liquidity and investability. Representing the top two tiers of S&P/ASX300 stocks, the S&P/ASX200 Index provides investors and fund managers with an effective benchmark for Australian equity performance, yet with an emphasis on broader representation. There will always be a fixed number of companies, 200, in this index. When an index constituent is removed, it will be immediately replaced by a company in the S&P/ASX300, but which is not in the S&P/ASX200 index”. www.standardandpoors.com and www.asx.com.au
ASX200: Refers to ASX200 Index companies as at 1 February 2006.
board Directors: Those holding a seat on a Company Board, including executive and non-executive members.
Executive Managers: The most senior person in the organisation (eg. CEO, MD) and those who report directly to that person, including those based outside Australia.
line roles: Positions with responsibility for profit-and-loss or direct client service. These include the CEO, Operations Manager, Marketing Director, Sales Directors, head of a particular business unit, etc.
Support (Staff) roles: Positions that perform a corporate function with responsibility for supporting main (or line) business functions, including Human Resources Director, Business Affairs/Legal Director, Public Relations Manager, Asset Manager, etc.
Top Earners: Each of the five named company executives who receive the highest remuneration for that year Corporations Act 2001 Section 300A 1 c (iv).
Specified Executives: Executives with the greatest authority for the strategic direction and management of the consolidated entity (‘specified executives’) during the financial year. Specified executives are defined in the accounting standards.

notes and references
1 Figures from 2006 EOWA Census of Women in Leadership in ASX200
2 Remuneration – A number of issues concerning interpretation should be noted in relation to this data. Although there is no reason to assume that these impact on the influence of gender in the distribution of income.
First, each company reports according to its own remuneration structures. The reported amounts can include short and long term incentive payments, termination payments, option values and other benefits. The valuation of components of remuneration is not uniform between companies.
Second, some of the persons included in the Census data collection will have been appointed part way through the financial year, and some possibly even after its end, so that the amounts reported are “left censored”. However, it is not recorded in the Census whether the information is censored or not. In small groups if such censoring is present the effect will be to put a downward bias on any statistics, including the median which we use to record the central remuneration value. This will be particularly problematic for the data relating to women where there are in any case only small numbers. Cases where the dollar amount reported is zero have been removed from the analysis.
Third, in some cases the actual number of female managers in specific positions is very low (See CEO, COO, IT, Strategy and Finance positions in Table 1). This may have a distorting effect on remuneration comparisons (Tables 7 and 8) and where numbers are recorded as percentages (Table 3).
Fourth, the range of remuneration between different industries varies by at least an order of magnitude, with some CEOs receiving less than $1 million and others more than $10 million, and their subordinates similarly ranged behind them. This issue is similar to that which arises in trying to compare house prices, and the same approach is taken here namely to report the median value rather than the mean.
Fifth, because of the difference between the date of the Census count (Annual Report Date) and the date of the remuneration report (end of the financial year) there were a number of individuals whose remuneration was recorded as 0, and these have been deleted. On the other hand, other individuals were included in the remuneration reports who for various reasons (company specific) were not reported as top earners in the Census. Furthermore, in one case six positions occupied by top earners could not be identified because the company did not list them.
Sixth, some companies, such as trusts, do not declare top earners because they do not have any employees. Thus table 8 reports earnings of only 4 female CEOs (Not six which are recorded in the Census) because two Macquarie Trusts did not report top earners.
The impact of the last two issues leads to number counts varying slightly between tables.
3 2006 EOWA Census of Women in Leadership in ASX200, 2006
4 Excluding CEO

level 6, 1 elizabeth plaza north sydney nsw 2060t +61 2 9448 8500f +61 2 9448 8572
www.eowa.gov.au
WOMEN + MEN = buSInESS SuCCESS