Embed Size (px)
Citation preview
Gender Gaps in Technology Diffusion1
Ariel Ben Yishay
College of William & Mary
Maria Jones
World Bank Research Group
Florence Kondylis
World Bank Research Group
Ahmed Mushfiq Mobarak
Yale University
Abstract
Even with comparable innate ability and performance on assigned tasks, women may be subject to
discrimination. We run a field experiment across 142 Malawian villages in which either men or women
were assigned the task of learning about a new agricultural technology, and then communicating it to others
to convince them to adopt. Despite persistent gender gaps in perceptions and attention to their message,
female-assigned communicators, perform just as well as their male-assigned counterparts. Micro-data on
individual interactions from 4,000 households suggest that other farmers perceive female communicators
to be less capable and are less receptive to the women’s messages. Data on social relationships in the village
at large do not support a generalized gender communication gap. Instead, the gender gaps in perceptions
appear to be aimed at women in communicator roles. Yet, other farmers in female-assigned village learn
and retain the new information just as well as in male-assigned villages, and experience similar farm yields.
Keywords: discrimination, gender, technology adoption, agriculture
JEL Codes: J16, O12
1 Corresponding authors: Florence Kondylis ([email protected]) and Mushfiq Mobarak
([email protected]). This draft benefited from comments from Manuel Bagues, Esther Duflo, David Evans,
Arianna Legovini, Isaac Mbiti, David Rorhbach, Gil Shapira, Daniel Stein, and seminar participants at the IFPRI,
DECRG, JPAL-Europe Labor Conference, Yale, UC-Merced and Cornell University. Siyao Zhu provided superb
research assistance. Generous funding from the World Bank i2i, Gender Action Plan and Research Support budget,
the Millennium Challenge Corporation, the Macmillan Center at Yale, and the Center for Business and Environment
at Yale made this research possible, as well as support from the World Bank Development Impact Evaluation unit and
Innovations for Poverty Action in Malawi. The views expressed in this manuscript do not reflect the views of the
World Bank. All errors are our own.
1
1. Introduction
Gender gaps in earnings and in other economic outcomes have been documented
extensively by economists (Blau and Kahn 2000). While gaps favoring men exist in virtually
every country, disparities in income, health, education, and decision-making power are more
pronounced in developing countries (Jayachandran 2015). Understanding the causes of these gaps
has received a lot of attention in the literature, with most of the empirical work focused in
developed countries.2 Review articles on the topic published a decade apart show that the early
literature documented cases of discrimination against women in the market as a source of disparity
in outcomes (Altonji and Blank 1999), while a more recent literature has also considered gender
differences in innate preferences and ability as underlying causes (Bertrand 2011).
Many audit studies (Neumark 1996), blinded natural experiments (Goldin and Rouse 2000,
Moss-Racusin et al 2012), and field experiments with fictitious resumes or emails (Bertrand and
Mullainathan 2004; Riach and Rich 2006; Petit 2007; Milkman et al 2012) have documented
gender discrimination. In parallel, researchers have uncovered innate gender differences in risk
preferences or attitudes towards competition both in the lab (e.g. Gneezy et al 2003, Niederle and
Vesterlund 2007) and in the field (e.g. Flory et al 2015). Yet, if women face a backlash when
adopting behaviors or occupations traditionally associated with men, they may opt out of these
activities (Akerlof and Kranton 2000). Those reactions stemming from discriminatory beliefs or
practices may reflect back as women having worse performance or characteristics in equilibrium
(Bertrand and Duflo 2017).
We report on a field experiment in which we randomly assign either male or female farmers
the task of learning about a new agricultural technique, communicating about it to other villagers,
and convincing them to adopt. In the process, we document gender differences in perceptions,
attention and performance in the context of agricultural technology diffusion of across 142 villages
in Malawi.
We administer knowledge tests to the communicators one and two agricultural seasons
after the initial training to measure how well they learned about the technology and retained that
information, and whether they themselves adopted. To measure these communicators’
2 See Bertrand (2011) and Niederle (2015) for reviews of the literature.
2
performance in the social diffusion task, we collect two years of follow-up data on a random
sample of other nearby farmers to track how well these other farmers learned and retained
information about the technology from their assigned communicator, and whether they adopted
the technology. The former allows us to compare female-reserved and non-reserved
communicators in terms of their raw innate ability to learn, while the latter allows us to track how
that ability translates into performance in the field when those communicators interact with society
at large to complete the assigned task. Information on social interactions and perceptions of these
communicators allows us to causally document attention and perception bias towards female-
reserved communicators, while comparing their performance across the two tasks provides
objective measures of any potential raw ability gap.
Most real-world labor market tasks are characterized by situations where a woman must
rely on or interact with male (or female) colleagues to be successful in her job. This is true for any
job that requires managing or supervising teams of workers, teaching or training others, or
interacting with customers. Labor markets in the modern economy rarely offer opportunities for
individuals to work and succeed in isolation. In such situations, equally able women may under-
perform relative to men because of overt discrimination and lack of cooperation from colleagues
(Bagues and Esteve-Volart 2010; Delfgaauw et al 2013), because of social norms and attitudes
(Gneezy et al 2009, Bertrand, Kamenica and Pan 2013), or because gender identities require
women to behave differently when interacting with male colleagues (Akerlof and Kranton 2000).3
Perceptions and evaluations of women’s performance may also not accurately reflect their actual
performance (Beaman et al 2009; Mengel et al 2018), with important implications for both gender
equity and economic performance.
A lab experimental literature presents some related evidence that women either perform
worse or display some different innate attitudes when they are in mixed-gender environments
compared to single-gender environments (Booth and Nolen 2012a, 2012b). We add to this
literature by setting up a large-scale field experiment to document gender discrimination in the
diffusion of a technology that has important productivity consequences.
3 Hoff and Pandey (2014) provide field experimental evidence on how low-caste children in India perform worse on
cognitive tasks in the presence of high-caste children, especially when caste identity is made salient.
3
We find that female-reserved communicators do just as well as men in learning about and
adopting the technology themselves. However, we find that both male and female maize farmers
perceive communicators in female-reserved villages to be less knowledgeable about agriculture,
although by our objective measures those communicators are just as knowledgeable about the new
technology introduced through the experiment than their non-reserved counterparts. Accordingly,
other farmers are less likely to interact with female-reserved communicators’ messages in both
formal (training) and informal (conversation) settings. Despite these gender gaps in perception and
attention, we find that female-reserved communicators perform just as well as non-reserved
communicators in diffusing knowledge and adoption of the new technology to other male and
female maize farmers in their village.
We use micro data on individual interactions collected from around 4,000 farmers to
explore why this occurs. We are able to rule out several potential causes. First, we show that it is
not the case that women are better learners than they are teachers. Direct measures of teaching
performance indicate that women put as much effort into teaching, pass on as much information,
and farmers they teach experience similar yields compared to those in non-reserved communicator
villages. This does not seem to be about cross-gender frictions in communication either: Nearly
half of all maize plots in our sample villages are farmed by women, and the gender perception and
interaction gaps remain regardless of whether we examine the responses of other male or female
maize farmers. In addition, we do not notice any differences in general social interactions across
male and female farmers. Instead, the evidence suggests that these gaps relate to issues of social
norms and attitudes.
Understanding the role of gender discrimination in the diffusion of a new agricultural
technology is important for policy. Agricultural yields have remained low and flat in Sub-Saharan
Africa over the last 40 years, and low adoption of productive technologies is thought to be a major
cause (World Bank 2008). Lack of persuasive sources of information may make farmers reticent
about new technologies, which makes the communication task we assign to men and women in
our field experiment extremely important. Yield and other outcome data collected from over 4,000
farmers living in our study villages suggest that success in the assigned tasks has large welfare
implications. Use of the new technology increases yields by over 30% in arid areas (BenYishay
and Mobarak 2018; Beaman et al 2018).
4
Gender disparities in the United States and other developed countries have been studied
extensively. Our results outline a similar pattern as found in Mengel et al (2018), who document
gender bias in university teaching evaluations in the Netherlands, despite there being no
performance gaps across gender of the instructor. We add to that literature by investigating the
sources of disparities in developing countries where gender inequality is more pronounced
(Jayachandran 2015). Gender discrimination also has more devastating consequences in
developing countries, where 6 million women are reportedly “missing” at birth, and many do not
survive into adulthood (World Bank 2011; Duflo 2012).
The rest of the paper is organized as follows: In section 2, we describe the context and our
experimental design. Section 3 discusses the data, while results on communicators’ effort and
recipient farmers’ demand for communicators’ teachings are presented in section 4. Mechanisms
are discussed in section 5. We offer a brief conclusion along with implications for policy in section
6.
2. Context and Experiment
2.1 Extension Network
Malawi is predominantly agricultural, and 85% of the population lives in rural areas
(Malawi National Statistics Office 2011). 56.6% of the rural population was classified as poor in
2011 (Malawi National Statistics Office 2011). Maize is the primary staple food in Malawi. With
one rainy season, there is typically one maize harvest per year. The Ministry of Agriculture
communicates with maize farmers through a national public, decentralized agricultural extension
system. All agrarian areas are in principle staffed by an Agricultural Extension Development
Officer (AEDO), but in practice, these frontline positions are chronically understaffed. Each
AEDO is responsible for providing extension services to 1,465 households on average, and
moreover, many AEDO vacancies remain unfilled. At the outset of our study in 2009, only 56%
of all AEDO positions were filled across our study districts, according to Ministry records. As a
result, only 18% of farmers participated in extension activity according to the last National
Agricultural and Livestock Census (Malawi National Statistics Office 2007). Informational
deficiencies remain a key challenge that hinders adoption of yield-enhancing technologies.
5
In addition, the traditional extension network is male-dominated: the average ratio of
male to female AEDOs from 2005-2010 was 8:1 (Masango and Mthinda 2012). The Ministry
had adopted a ‘lead farmer’ approach to extend the reach of extension, in which a few farmers
are chosen to act as extension partners to communicate with their neighbors. These positions are
typically filled by men. These gender imbalances suggest that involving more women to
communicate with farmers about new technologies may be a promising way to address
informational deficiencies, especially since 48% of maize farms in our study area are cultivated
by women. This creates a rich setting to study the roles played by innate ability, social norms and
attitudes, and gender identity in determining the relative performance of men versus women in a
field-based task, by involving women in the delivery of extension advice.
2.2 Experimental Design
We partner with the Ministry of Agriculture and Food Security (MoAFS) in Malawi to
conduct a large-scale field experiment with 142 maize farming communities in 8 districts across
the country. In 2009, the MoAFS was preparing to roll out a new extension activity4 in these
eight districts, and we convinced them to incorporate ideas from the social learning literature to
improve delivery. Under this approach, a few village residents are chosen as extension partners
or communicators, and are asked to serve as the interlocutor between the AEDO assigned to the
area and the rest of the village farming community. A communicator has two main categories of
tasks:
Task A: receive training on a new technology, and acquire, retain and use this knowledge
on her own farm.
Task B: communicate about the new technology to other (non-communicator) farmers in
her village, and convince them to acquire, retain and use this knowledge on their farms.
To explore gender dimensions of communication, we randomly select 48 villages where we
reserved the communicator role for women. In the other 47 treatment villages, we did not impose
4 A decentralized T&V model of extension is set up such that information on new technologies flows from
researchers to extension workers and on to producers via farmer communicators, points of contact between
extension agents and other farmers (Kondylis et al. 2017).
6
any such gender reservation.5 Measuring the relative performance of male and female
communicators (in gender-reserved versus non-reserved villages) in Task A allows us to isolate
gender differences in innate ability, while the comparison to Task B allows us to gauge
performance across these men and women, when success is contingent on communicating with
others and persuading them to accept their message.
2.3 AEDO Training
Each extension officer (AEDO) is responsible for a group of villages, which is called a
“section”. Our sampling frame is restricted to the 457 sections (out of 822) actually staffed by an
AEDO in our study districts. Within this set, we randomly select 121 sections where we conduct
the project. We first randomly assign 26 sections to “pure control” and the 95 other sections to
our communicator treatment.6
Appendix A provides a detailed timeline of project activities. In August 2009, prior to
launching any intervention, AEDOs serving our 95 treatment sections received a three-day
training on (a) the new technologies we were introducing for this project, and (b) how to transfer
knowledge about those technologies to a village-based communicator. The training materials
were prepared and delivered by the two agencies most relevant to the two technologies we
introduced (Departments of Agricultural Research Services and Land Resources Conservation).
The Department of Agricultural Extension Services (DAES) coordinated the trainings. The
sessions were attended by all AEDOs and their direct supervisors (Agricultural Extension
Development Coordinators, AEDCs). Each AEDO and AEDC was trained only on the one
technology relevant to their assigned districts.
The first day of the training was devoted to familiarizing AEDOs and their supervisors
with the aims of the project. The concept of communicator was discussed, as well as the
motivations for a gender reservation mechanism. This part of the training was key in ensuring
good compliance to the study protocols, since the AEDO played a central role in the
5 BenYishay and Mobarak (2018) study social learning and communication in this subset of 47 villages, as well as
48 control villages and 25 additional villages not included in this paper where established extension workers were
the primary communicators. 6 We chose additional “spillover” control villages in 19 of the treated sections, to study whether treatment leads to
displacement of AEDO attention away from other villages he is responsible for. We do not find any evidence of
effort displacement, and all results reported in this paper are robust to controlling for an indicator for such sections.
7
identification of communicators. The second and third days of training were allocated to
classroom and hands-on training on the new technology that the AEDO would then disseminate
to communicators. Classroom discussions took place at the training centre, while hands-on
modules were held in adjacent demonstration plots. The training closed with an explanation of
each AEDO’s specific village assignment, including any gender reservation requirements for the
extension partner or “communicator” they had to help identify.
2.4 Communicator Identification and Gender Assignment
The first village visit was designed to identify the communicators in all treatment
villages. The AEDO assigned to that village convoked and led a half-day meeting that was open
to anyone in the community, including local leaders, social groups and associations within the
village such as youth groups, church, savings and loan associations, etc. Turnout was usually
substantial. Communicators were described as representatives of these main local social groups
who would be willing to learn and disseminate a new technology to others. The specific
(random) gender assignment was shared in this first meeting.7 Both men and women assigned to
the communicator role were well integrated in the social tissue of the community and chosen in
conjunction with community members, to reduce the chance that any chosen communicator of
either gender would be resented thereafter. To reduce gender stereotyping of the communicator
role, AEDOs told the meeting attendees that men and women could be equally successful at this
task.
After this first discussion, leaders worked with the assembled community members to
produce a short list. In a second step, the AEDO selected the communicator from the short list,
and verified the assignment and/or the good faith attempt of complying with the assignment.
Third, AEDOs and leaders went back to the larger assembly to share their final choice of
communicator. This last step ensured that the community endorsed the pick. These meetings
7 In all communities, we asked community leaders to designate up to 5 “peer farmers” and 1 “lead farmer”.
However, the specific communicator type is not the focus of this paper and, in the interest of statistical power, we
pool these groups and focus on the gender assignment. In lead farmer villages, the gender assignment required that
the one selected communicator be a woman. In peer farmer villages, our gender treatment required that a majority of
communicators be women. We pool these two treatment arms into one general communicator treatment, and study
the effects of the (cross-cutting, random) gender reservation treatment. We control for the lead versus peer farmer
treatment in all analysis reported in this paper. A separate paper (BenYishay and Mobarak 2018) studies the effects
of communicator type using only a sub-sample of our villages where there was no gender reservation treatment.
8
were completed during August-September 2009.
Appendix Tables B1 and B2 report compliance with the gender reservation treatment,
separately for all treatment arms reported in BenYishay and Mobarak (2018). The tables show
that there was imperfect compliance with the gender reservation treatment, so we conservatively
report intent-to-treat (ITT) estimates throughout the paper. The ITT tracks the effect of the
village getting assigned a female communicator. If different types of women or men complied
with the treatment assignment, then the local average treatment effect (LATE) of gender
reservation becomes difficult to interpret. 61% of villages assigned to the female-reserved
treatment choose female lead farmers, whereas every single village not assigned to the gender-
reserved treatment chose male lead farmers. 55% of the gender-reserved peer farmer villages
(where we required that the majority of communicators be female) complied with the
experimental instructions, while 18% of the non-reserved villages had a majority of females as
communicators. The experimental assignment therefore did produce a first-stage of increasing
the participation of females in communicator roles, but we do not use it as an instrument to
estimate the LATE because compliance variation across rounds may be related to communicator
performance, and therefore endogenous. We also directly control for the Lead/Peer farmer
assignment, given the compliance variation across these two types of villages.
2.5 Shadow Communicators and Training
We follow the same communicator identification process in control villages, to designate
“shadow communicators” who would have played the communicator role, had that village been
treated.8 These shadow communicators are useful for research purposes, because they represent
the correct counterfactual against which to compare the actions of the actual communicators in
treatment villages. Identifying and surveying the shadow communicators allows us to report
experimental results on what actions and activities the communicators participate in as a result of
the project, holding constant the social identity and other unobserved characteristics of the
communicator. These regressions will prove to be useful to understand the mechanisms
8 In control communities, the process ended after the community endorsed the choice of communicator. Unlike
communicators in treatment communities, shadow communicators were not trained nor contacted beyond the second
step of the identification process.
9
underlying the effects that we will observe, such as differences in social interactions and
perceptions.
This design implies that the only difference between treatment and control communities
is that communicators in treatment villages receive subsequent visits and trainings from the
AEDOs on a new technology, while shadow communicators do not. AEDOs trained the
communicators soon after identification, and ahead of the main planting season. These trainings
lasted for half a day. It involved explaining the merits of and demonstrating the application of the
new technology. The AEDOs then made follow-up visits to treatment communicators over the
course of the next two years.9
2.6 Technology
We promoted one yield-enhancing conservation farming technology in each village.
AEDOs in four arid districts were trained on “pit planting” (Rumphi, Neno, Chikwawa, and
Balaka districts). “Changu composting” was promoted in villages in the other four districts
(Zomba, Mchinji, Dedza, and Mzimba). These conservation agriculture technologies have
proven yield benefits and overall positive returns, as documented experimentally for Malawi
(BenYishay and Mobarak, 2018; Beaman et al., 2015), and observationally for the sub-region
(Thierfelder et al., 2015). These techniques do not confer any added benefit to one gender over
another, and there is no gender gap in knowledge of these techniques in our control villages at
baseline. While the technologies are yield-enhancing, they require some additional up-front labor
effort or learning effort. Farmers may be reluctant to invest this effort on new technologies with
uncertain benefits. We will briefly describe the two technologies here, and Appendices D-F
provide the training program and detailed training manuals for each technology.
Pit planting increases a soil’s capacity for storing water while minimizing soil
disturbance and, thus, nutrient runoff. In practice, rectangular pits are excavated in a field. Seeds
are planted inside the pits, rather than on ridges, which is the status quo practice in Malawi. The
9 In a cross-cutting experiment, performance-based incentive payments were randomly assigned to communicators
in half the villages. Results from this treatment assignment are reported in BenYishay and Mobarak (2018). In this
study, we pool our results across incentive arms since interacting gender reservation with incentive assignment does
not affect our conclusions (we provide an online Appendix, in which we replicate all tables in villages subject to the
incentive payment). We control for incentive treatment assignment in all regression models.
10
pits conserve moisture and allow farmers to use small quantities of inputs more efficiently. Once
prepared, pits can be used for at least two consecutive seasons, after which farmers have to
reshape the pits. Pit planting was virtually non-existent at baseline in our study area. Only 1
percent reported ever practicing it, and only 12 percent of farmers had ever heard of the
technology.
The main benefits of “Changu composting” over other types of compost are (i) reduced
heap maturity and (ii) use of easily accessible materials. At baseline, we record that only 7
percent of farmers in control villages had heard of this particular type of compost (overall, 53%
had heard of compost in general), and only about 25 percent of those who had heard of Changu
composting were able to correctly answer questions on preparation, properties and application
methods.
The data analysis will pool all eight districts together and use district fixed-effects to
absorb any unobserved technique-specific and geographic heterogeneity.
3. Data and Descriptive Statistics
3.1 Data Sources
We first conduct a full listing of all households in each of the 142 villages. We randomly
select households to survey from this sampling frame. We chose all communicators (treated or
shadow), plus 25 other randomly selected households for the surveys. We rotate the sample of
households participating in each survey round and create imperfect panels to both minimize survey
fatigue for each household and prevent communicators from focusing on just a few households,
after observing who we survey. This yields samples of 3,685, 3,496 and 3,314 households of
‘regular’ (non-communicator) farmers and 467, 474, and 329 communicators at baseline, midline
and endline, respectively. The baseline was conducted in August-September 2009,10 a midline in
July – September 2010 at the end of the first agricultural season, and an endline in July – September
10 The baseline survey only allowed for one respondent, the head of the household. This implies that baseline
individual characteristics on communicators are not available whenever the communicator was not head of the
household. We therefore use our midline communicator survey, collected at the time of the on-farm monitoring
survey, to establish compliance to the gender assignment.
11
2011 after the second agricultural season. We augmented our midline and endline instruments with
a spouse/additional farmer module, increasing the total number of respondents to 6,006 and 4,693
at midline and endline, respectively.
These surveys capture a rich set of measures of knowledge and adoption of the promoted
techniques, along with agricultural production, household demographics, individual
characteristics, perception, and social network relationships. To test respondents’ knowledge about
the technology introduced in their village, we ask seven questions regarding the details of how to
apply the technology. The questions are based on the material used by AEDOs to train
communicators in treatment villages.11 We use these questions to construct a [0,1] knowledge
index where 0 indicates a respondent could not correctly answer any question, and 1 that a
respondent answered all questions correctly. We collect data on adoption of the technology in two
different ways: (a) self-reported in the survey, and (b) through direct observations during the on-
farm monitoring.
The social network module records farmers’ interactions with and perceptions of (shadow
or actual) communicators and other farmers in their village. Social network relationships with
other non-communicator farmers were recorded as follows. For each respondent, we drew a list of
six randomly-picked farmers in the community from our baseline listing. We then asked questions
about the nature of the respondent’s interactions with each of these farmers, as well as their
perceptions about those farmers. Appendix C details the construction of all main outcome
variables.
3.2 Descriptive Statistics and Balance
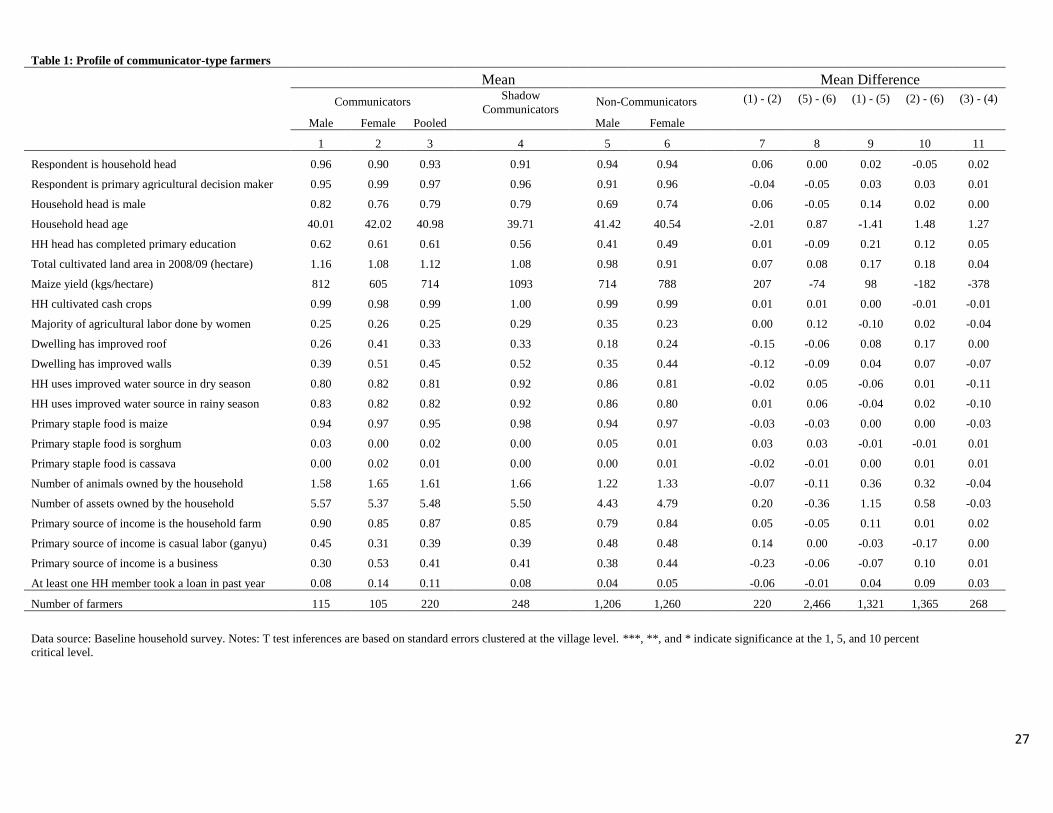
Table 1 displays sample characteristics of the communicators chosen for the experiment,
and compares them to both shadow communicators and other non-communicators who were
randomly selected to respond to our survey. Communicators are similar to regular farmers on
most dimensions, with no significant differences by gender (cols 7, 8, 9). Reassuringly, shadow
and actual communicators share similar characteristics (col 11). Randomly varying the gender of
chosen communicators does not lead to statistical differences in the observable characteristics of
11 See Appendices C and D for a detailed record of the knowledge exam, and training manuals, respectively.
12
the communicators (col 7). This is important to note for the proper interpretation of the statistical
differences in post-treatment outcomes across arms that we will report later. Those outcome
differences will be attributable to randomly assigning a task to either men or women, who are
otherwise similar along observable dimensions.
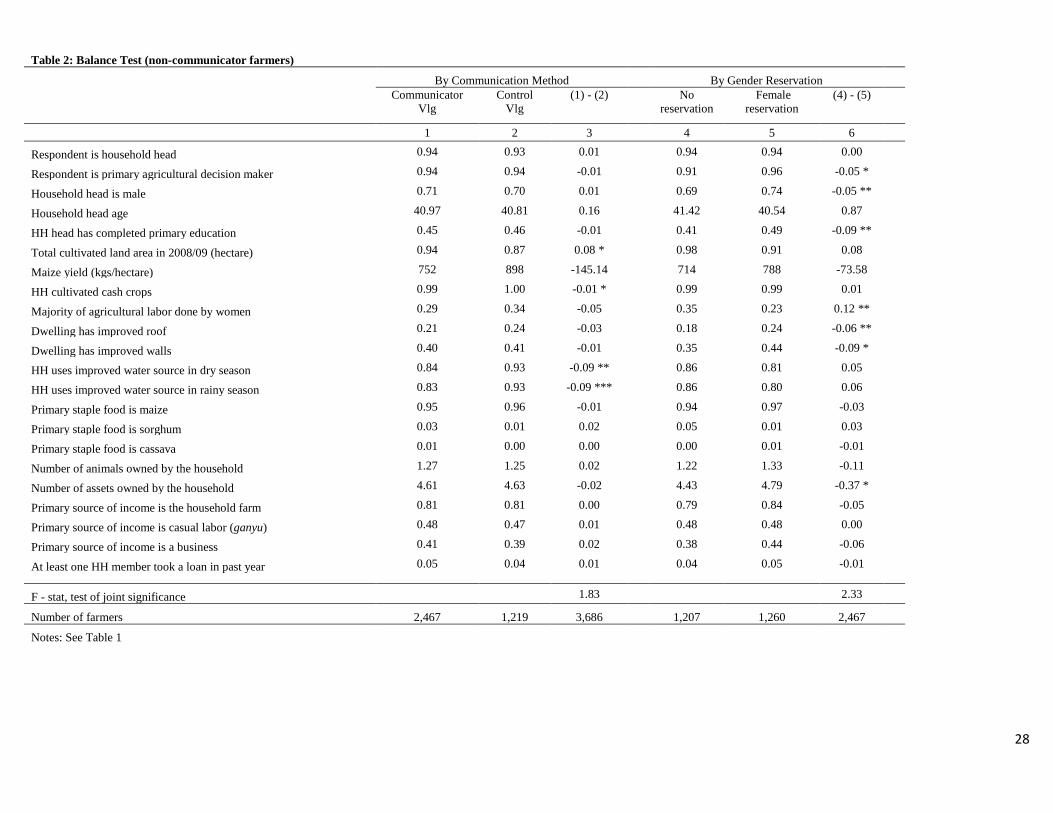
Table 2 tests for balance in randomization by comparing non-communicator respondents
across treatment assignments. We achieve balance on individual observable characteristics
across all treatment arms (cols 3, 6, 9), and reject joint significance of these characteristics in
determining treatment status. Farmers in our study area are about 41 years old, work mainly in
agriculture and cultivate just under 1 hectare of land, own one head of cattle and about 4.6 other
assets. These are relatively poor farming households: they live in dwellings made from local
material, with only 21 percent owning a tin roof. Their diet consists mainly of maize. Only 5
percent had taken any loan in the year prior to baseline.12
4. Main Regression Results
In this section, we describe the results of the experiment along its expected causal chain:
from communicators’ performance in acquiring the new technology (Private Task A), to their
performance in teaching and convincing others to adopt the technology (Socially-mediated Task
B).
4.1 Communicators’ Performance in the Private Task (Task A – Learning about the New
Technology)
To explore possible innate gender differences in performance on the assigned tasks, we
first compare communicators’ relative performance in a task that did not require them to interact
with other farmers in society: acquiring, retaining and adopting the new technology themselves.
For identification, we use the random village-level assignment to gender reservation of the
communicator, comparing the performance of shadow communicators in control villages as the
omitted category. This implies that we are holding constant all socioeconomic characteristics,
network positions and other unobservables associated with identity, and identifying this
12 In Appendix Tables A1 and A2 we reproduce Tables 1 and 2, additionally reporting balance across incentive arms
13
relationship on the basis of random assignment of the task (or not). We estimate the following
specification:
𝑦𝑖𝑣𝑑𝑡 = 𝛽1𝑁𝑜𝑛_𝑅𝑒𝑠𝑒𝑟𝑣𝑒𝑑𝑣𝑑 + 𝛽2𝑅𝑒𝑠𝑒𝑟𝑣𝑒𝑑_𝐹𝑒𝑚𝑎𝑙𝑒𝑣𝑑 + Γ 𝑋𝑖𝑣𝑑𝑡 + 𝐷𝑡 + 𝐷𝑑 + 𝜖𝑖𝑣𝑑𝑡 (1)
𝑦𝑖𝑣𝑑𝑡 is the outcome (such as performance on the technology knowledge test) for communicator i
in village v in district d in year t. We estimate this specification using OLS regression and include
some control variables measured at baseline,13 district fixed effects, and survey year fixed effects.14
We cluster standard errors at the village level, which was the unit of randomization. We also report
statistical tests of gender difference in performance (𝛽1= 𝛽2). These coefficients and tests are
identified off the random assignment of the gender-reservation through the field experiment.
Given imperfect compliance to our gender assignment, we report intent-to-treat (ITT)
estimates of the effect of being assigned to the male or female communicator arm. Treatment-on-
Treated or IV specifications would be more complicated to interpret in our setting because: (a)
men or women of different types or abilities may choose to comply with the assignment of tasks,
and the gender assignment may affect the quality of their replacement; and (b) we report results
on many downstream outcomes, such as agricultural yields or crop failure among other farmers
who are trained by the either the female-reserved or non-reserved communicators. Given the
selection of who chooses to adopt, only the ITT estimates are easily interpretable for many
specifications we report.
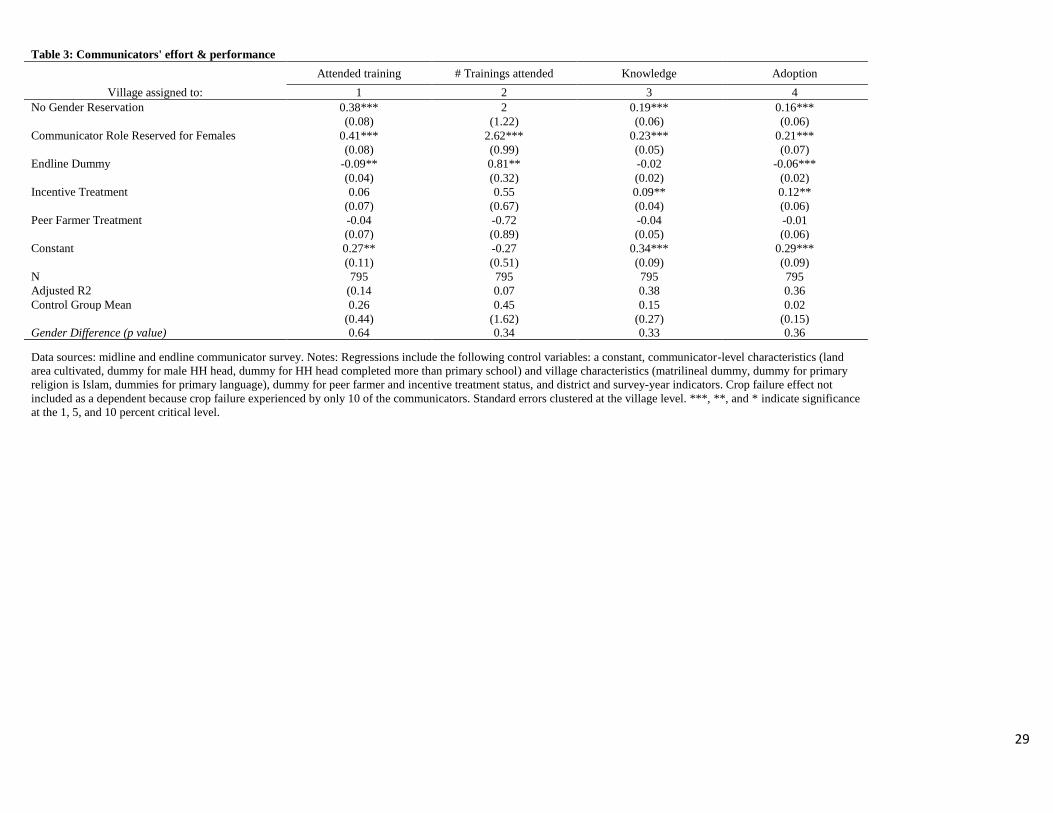
Table 3 reports results on four measures of communicator effort in “private” tasks that do
not require any interaction with other farmers in his/her society: extensive and intensive margins
of participation in AEDO-led trainings on the promoted technology (cols 1, 2), post-training
measures of knowledge about the technology to track how well the information was learnt and
13 Controls include a constant, communicator-level characteristics (mean landholdings, mean number of plots
worked, proportion of HH heads that are male, proportion of HH heads that have completed primary education), and
village characteristics (matrilineal dummy, dummies for religion, dummies for language, dummies for village
primary economic activity, percentage of HHs in village growing maize, dummies for type of staple food), and
district and survey-year indicators. We also add dummies to indicate whether the village was randomly assigned to
the peer farmer and incentive treatments. 14 We pool both survey rounds for parsimony, with no effect on our central conclusions. For reference, we run the
same model on the split survey rounds and find qualitatively similar results (not reported).
14
retained (col 3), and the propensity to adopt the technology on the communicator’s own farm (col
4).
Communicators in treated communities are 38-41 percentage points more likely to have
been trained by AEDOs than shadow communicators, and the difference in training participation
across gender reservation arms is small and imprecisely estimated. Communicators in female-
reserved villages attend 0.62 additional trainings relative to non-reserved villages, although this
difference is imprecisely estimated (p-value=0.34).
Column 3 reports on how well communicators retained the information that they were
trained on. Shadow communicators (the omitted category) obtain average knowledge scores of
0.15 across the two survey rounds, which can be interpreted as correctly answering 15 percent of
the questions about the technology that they are tested on, or one of the seven questions on average.
Trained communicators in treated villages acquire and retain significantly more knowledge about
the technology than their shadow counterparts. Their test scores are about double or triple of
shadows’ scores (0.70-0.85 standard deviations in the control group). Female communicators score
slightly higher than men in the knowledge test, but the difference is imprecisely estimated (p-
value=0.33).
Column 4 shows that only 3% of shadow communicators adopt the new technology, and
that there is a sharp increase in adoption among treated communicators. Communicators are
encouraged to use own adoption as a strategy to teach and persuade others to adopt, and adoption
of the new technologies increases by 23 and 19 percentage points in female-reserved and non-
reserved villages, respectively. Again, while we notice that female-assigned communicators are
slightly more zealous than their non-reserved counterparts, this difference is imprecisely estimated
(p-value=0.36). Communicators in female-reserved villages are 5 percentage points more likely
to adopt the technology themselves than communicators in non-reserved villages, although this
difference is also imprecisely estimated (p-value = 0.36).
4.2 Communicators’ Performance in the Socially Mediated Task (Task B – Teaching and
Convincing Others about the Technology)
We now explore gender differences in performance in the task that requires them to
interact with other farmers in society: demonstrating, training and convincing other farmers to
15
adopt the new technology. Again, we rely on random village-level assignment to gender
reservation of the communicator as we compare other farmers in gender-reserved villages to
those in non-reserved villages.
4.2.1 Interactions between Communicators and Recipient Farmers
Our treatment encouraged communicators to hold formal training activities on the plots in
which they adopted the new technology. While attendance in training may not be a relevant
mediating factor for gender discrimination in the context of formal education where attendance is
regulated, this is not the case in our setting: differences in both communicators’ provision and
farmers’ attendance across gender reservation status provide useful clues to understanding gender
differences in performance. Women may find it harder to communicate their message to others.
For instance, getting others in the community to pay attention to their trainings may be harder for
female than male communicators, especially in the presence of gender bias on the demand side.
Should this be the issue, we might observe lower attendance at the trainings women organize.
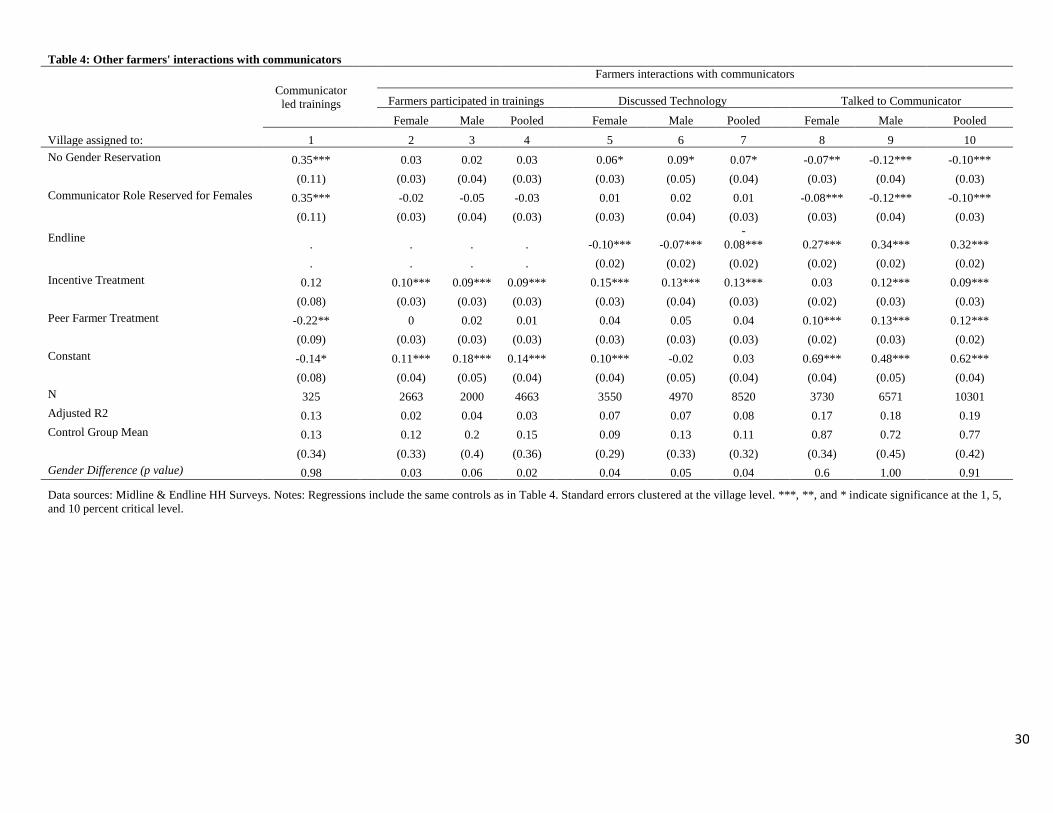
We start by examining communicators’ self-reported provision of trainings for other
farmers (col 1, Table 6). Male and female communicators are equally likely to organize trainings
for other farmers.
Even though there is no gap in the communicators’ effort in offering trainings, other
farmers are significantly less likely (by 6 percentage points, p-value = 0.02) to participate in
trainings organized in the female-reserved communicator villages (cols 2-4). This is equally true
among female (-5 pp, p-value=0.03) and male recipients (-7 pp, p-value=0.06). This highlights a
gender gap in other farmers’ attention: although the supply of trainings is comparable across
female-reserved and non-reserved villages, the demand for that training is not.
We also collected data on more informal interactions between communicators and other
farmers about the new technology. Specifically, we asked all farmers in our random sample
whether they have ever discussed the new technology with a communicator, and columns 5-7 show
that these informal discussions are significantly less likely to occur in female-communicator
reserved villages (p-value=0.04).
Columns 8-10 examine maize farmers’ general interactions with communicators, not
necessarily about this new technology. Conversations about general topics is quite common
16
everywhere: 77% of randomly sampled men and women report talking to shadow communicators
in the control villages. There is no significant difference in general conversations with actual
communicators in either female-reserved or non-reserved villages. In other words, it does not
appear to be the case that female communicators are less “visible” than male communicators in
their respective networks; the gaps arise only when we focus on discussions about the new
agricultural technology.
In summary, farmers generally interact with communicators in female-reserved villages,
but they appear to be less engaged with the information pertaining to a new agricultural technology
when this information originates from a female communicator. We observe this pattern in both
informal (conversations) and formal (training) settings. All of this suggests that either women are
not perceived to be good at farming, or that there are differentials in male and female “identity” in
agricultural occupations (Akerlof and Kranton 2000), and the role of women in agriculture and
training. We explore these ideas further using data on villagers’ subjective perceptions of the
farming ability of men and women.
4.2.2 Other Farmers’ Perceptions of Communicators
Farmers may choose to engage less with female communicators due to biased perceptions
of women’s farming and training abilities (Beaman et al 2009). For instance, farmers may perceive
women to not be as good at farming, and may not want to receive advice from them, or give as
much credence to the advice they impart. Alternatively, farmers may be less inclined to engage in
discussions with female communicators due to social norms and attitudes about women’s place in
society (e.g., “we do not want to talk to women, they should not teach”).
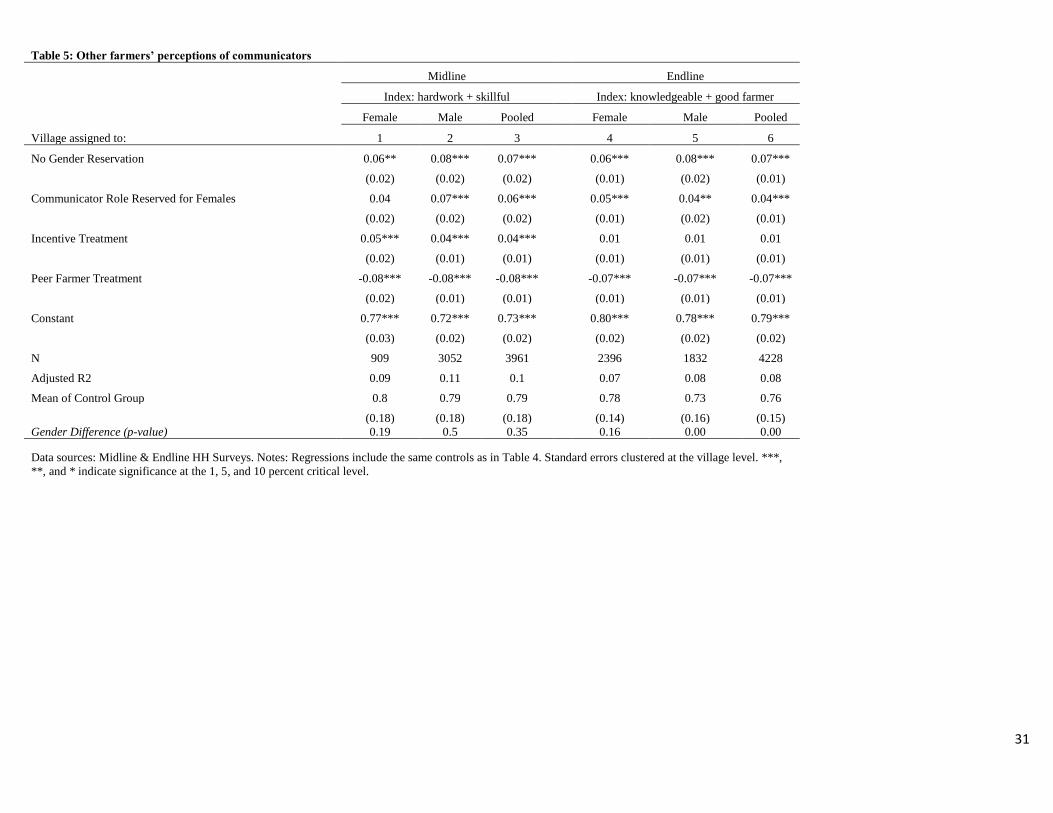
To investigate, we collect data on other farmers’ perceptions of the diligence, skills, and
knowledge of communicators in their village. Each question elicits a subjective rating on a
{1,2,3,4} scale on different dimensions of perception (cf. Appendix C). At midline, perception
questions capture how hardworking and skillful a respondent considers the communicator to be,
with no reference point. At endline, we ask whether the assigned communicator is (a)
knowledgeable and (b) a good farmer, relative to the respondent herself. We construct two
separate indices of these measures, and normalize them on a [0, 1] scale.
17
Table 8 shows that farmers perceive communicators in non-reserved villages to be more
hardworking, skillful and knowledgeable than in female-reserved villages. This difference is
imprecisely measured at midline, but significant at the 1% level at endline. This perception gap
exists regardless of the gender of the respondent. Both men and women think that non-reserved
communicators are better at agriculture. This is in line with other findings in the literature, showing
that discrimination against women is not solely perpetrated by men (Bagues and Esteve-Volart
2010; Jayachandran 2015). We consider these beliefs and perceptions to be biased against women,
because the results in Tables 3 and 4 indicate that communicators in female-reserved villages are
just as knowledgeable about the new technologies introduced through the experiment.
To summarize, farmers in villages where the communicator role was reserved for women perceive
those communicators to be less knowledgeable, pay less attention to their messages, and are less
likely to learn about and adopt the new technology.
4.2.3 Other Farmers’ Knowledge and Adoption
Table 3 focused on tasks that do not require much social interaction with, or dependence
on, the rest of the villagers and showed that gender reservation did not affect communicators’
effort and performance. However, we find that other farmers were less likely to attend trainings
and interact with the communicator about the new technology in gender-reserved communicators.
Similarly, we find that other farmers are less likely to perceive their communicator to be skilled at
farming, despite objective evidence to the contrary (Table 3).
Does this attention and perception gap measured in gender-reserved villages affect
communicators’ performance in diffusing the new technology? Table 6 focuses on tracking the
effect of gender reservation on communicators’ performance in convincing others in the
community to acquire and retain information and, ultimately, use the technology. We reproduce
the analysis presented in Table 3 on the sample of other, non-communicator farmers in all villages
(randomly chosen, excluding the communicators) to evaluate how well information and adoption
traveled from the communicators to others.15 We present the same statistical test as in Table 3,
15 In these regressions, controls (coefficients not reported) include a constant, total landholdings, number of plots
cultivated, baseline HH characteristics (HH head male dummy, dummy if respondent is HH head, HH head
completed primary school education dummy, improved water source dummy, dummy for dwelling with improved
roof, dummy for dwelling with improved walls, dummy for whether any HH member took a loan) and village
characteristics (matrilineal dummy, dummies for primary religion, dummies for primary language, dummies for
18
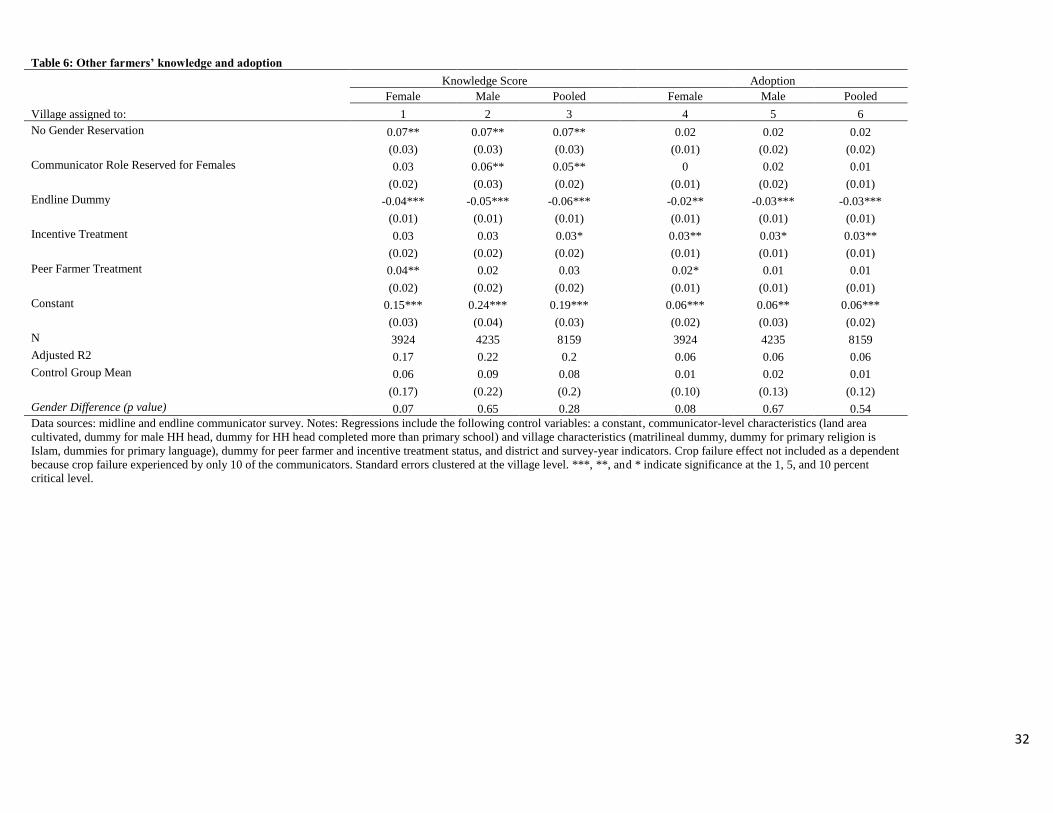
comparing female-reserved villages to unreserved. Table 6 reports results for three different
samples: separately for female and male respondents, and the pooled sample.
Communicators successfully transfer knowledge of the new technology to other farmers in
their villages: knowledge scores increase by 5-7 percentage points across gender reservation arms,
significant at the 5% level. This corresponds to an increase in knowledge of 0.25-0.35 standard
deviations, or 62.5-87.5 percent of the average knowledge score in the control group. Recipient
farmers’ knowledge scores in female-reserved villages are 2 points lower than those of recipient
farmers in unreserved villages, although this difference is imprecisely estimated. This gap is wider
(4 percentage points) and statistically significant (p-value = 0.07) among female recipients (cols
1-3, Table 4).
Coefficient estimates in columns 4-6 indicate that adoption among recipient farmers is a
relatively rare outcome. Interestingly, there is a significant drop (of 4 percentage points, p-value
of the difference is 0.08) when communicators subject to female reservation try to convince other
women, casting doubt on frictions in communication across gender in our context.
Taken together, these results show that communicators in female-reserved villages are as
knowledgeable and as likely to adopt the new technology as their counterparts in non-reserved
villages. Other farmers learn and adopt as much when offered teachings from a female-reserved
of non-reserved communicator, suggesting no gender differences in teaching abilities.
Interestingly, this lack of gender difference in performance across male and female respondents
highlights the absence of cross-gender frictions in teaching. In fact, other female farmers in gender
reserved villages are significantly less likely to learn and adopt the technology, relative to other
female farmers in non-gender reserved villages.
5. Mechanisms
Our results so far suggest that, despite being as knowledgeable, zealous, and effective as
their non-reserved counterparts, communicators in gender-reserved villages experience an
attention and perception gap. While we can hypothesize that these gender differences stem from
social norms and attitudes towards women as trainers, we investigate possible alternative
primary economic activity, percentage of maize growers in the village, dummies for type of staple food), an
indicator for the cross-cutting experiment on peer vs lead farmers, and district and survey-year indicators.
19
explanations to this gender bias. First, we explore the possibility that female communicators may
just be worse at teaching than their male counterparts. Second, we use social network
relationship data to further explore the possibility that our results stem from a more general
gender gap in communication and farming.
5.1 Are Women Simply Worse at Teaching than at Learning?
The results we have reported thus far are consistent with women facing discrimination
despite performing as well as men both in a private task that requires little social interaction and
in more public tasks that do. This may be evidence of discrimination against women in societal
interactions, but it also may simply be the case that women are better learners than they are
teachers. Differences in teaching performance could also arise due to gender disparities in human
capital investment earlier in life. A few salient results presented above suggest this is not the case
in our context. From Table 6, we infer that communicators in female-reserved villages perform
just as well in transferring the new technology as communicators in non-reserved villages. What
is more, female communicators transmit the message effectively, despite getting less face time
(Table 4). This would go against the idea that they are worse at transmitting knowledge within a
given unit of time.
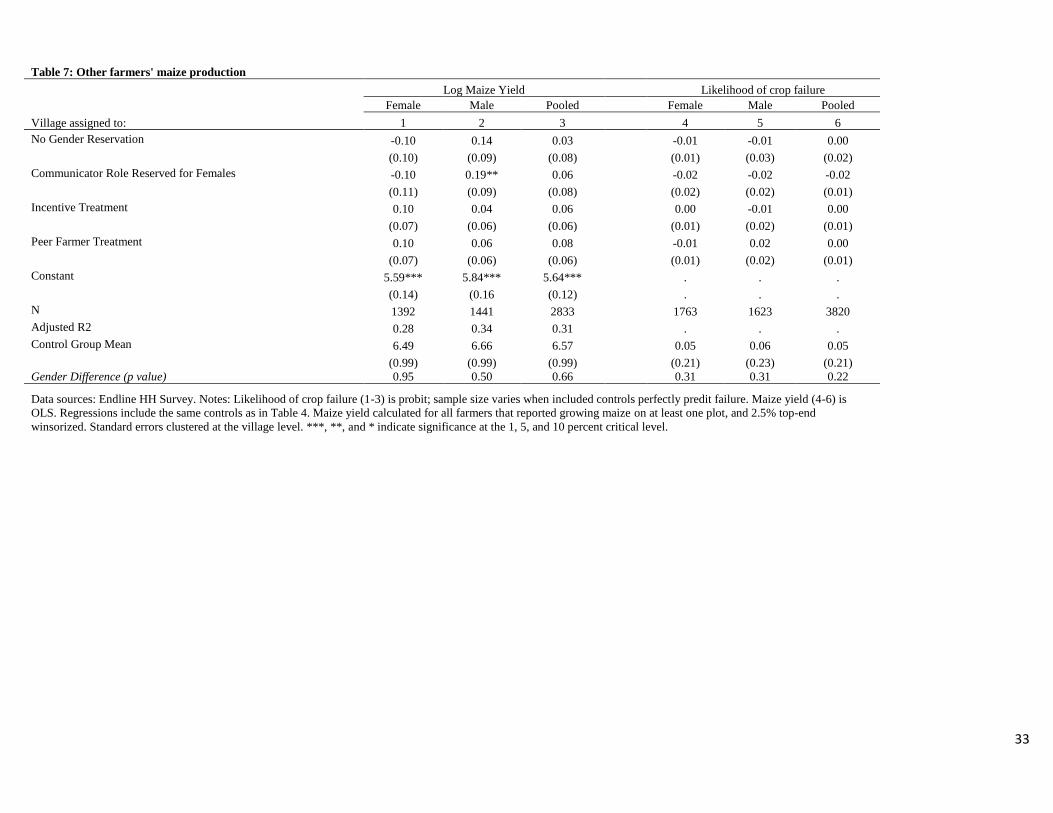
We add further objective measure of teaching quality by studying crop yields and crop
failures amongst recipient (non-communicator) farmers. We report results on yields and crop
failure on a random sample of all recipient farmers residing in the village, not conditioning on
adoption, to avoid any selection issue regarding who the communicators choose to target across
gender-reserved and non-reserved villages (Table 7).
Columns 1-3 report the effect of our treatments on a measure of maize yield on the farm
captured at endline, after the second agricultural season post intervention.16 As noted above, the
overall adoption rate among recipient farmers is very low, so these yield differences are extremely
noisy. We fail to detect any significant difference in yields across gender reservation arms,
although if anything female-reserved villages have a slight advantage.
16 Although we record agricultural production in both survey rounds, we only record it at the plot level in the
endline. This allows us to directly assign changes in yields to the individual farmer managing the plot, while at
midline we can only provide a household level estimate. Yields are winsorized at the top 2.5% end of the
distribution.
20
Given the difficulty in collecting yield data (that may lead to measurement error), we also
study the effects of communication on the incidence of crop failure, which easier to measure.
Columns 4-6 show that the likelihood of crop failure is smaller (but statistically indistinguishable)
in the female communicator villages. Crop failure is a relatively rare event that year (5% in control
villages), and there is no evidence that female communicators cause more disasters or are less able
to transfer skills to other farmers.
The fact that yields are the same (or greater) in female-reserved communicator villages
suggests that when women manage to teach and convince others to adopt, the recipients do just as
well with the technology. It does not appear to be the case that women are worse than men at
teaching. Even if women are less confident as teachers, or in terms of the beliefs they express about
the new technology, it does not undermine their performance as teachers. The gender perception
and interaction bias we measure appears to be related to something else, such as discrimination in
the form of social frictions, or perceptions of women, or willingness to accept messages from
women.
5.2 Social Network Relationships
We investigate whether the lack of interest and perception bias directed towards female-
reserved communicators reflect a broader set of social norms and attitudes about women’s place
in society (e.g., “we do not want to talk to women, they should not teach nor talk about farming”).
For this, we use rich social network data on who in the community talks to whom about what.
We included a social network module in all surveys at midline, which asks the respondent
about her interactions with 6 randomly selected other farmers in the village. Table 8 reports the
gender dimension of these interactions, by estimating the following model using data in which
respondent farmer i is asked about his/her interactions with other farmer j of a given gender
residing in the same village:
𝑦𝑖𝑗𝜐𝑑 = 𝛿𝐹𝐹𝐹𝑒𝑚𝑎𝑙𝑒𝑅𝑒𝑠𝑒𝑟𝑣𝑒𝑑𝑣𝑑 . 𝐹𝑗 + 𝛿𝐹𝑀𝐹𝑒𝑚𝑎𝑙𝑒𝑅𝑒𝑠𝑒𝑟𝑣𝑒𝑑𝑣𝑑 . 𝑀𝑗 +
𝛿𝑀𝐹𝑁𝑜𝑛𝑅𝑒𝑠𝑒𝑟𝑣𝑒𝑑𝑣𝑑 . 𝐹𝑗 + 𝛿𝑀𝑀𝑁𝑜𝑛𝑅𝑒𝑠𝑒𝑟𝑣𝑒𝑑𝑣𝑑 . 𝑀𝑗 + 𝜆𝐹𝑗 + Γ 𝑋𝑖𝑣𝑑 + 𝐷𝑡 + 𝐷𝑑 + 𝜖𝑖𝑣𝑑.𝑗 (2)
21
𝐹𝑒𝑚𝑎𝑙𝑒𝑅𝑒𝑠𝑒𝑟𝑣𝑒𝑑𝑣𝑑 𝑎𝑛𝑑 𝑁𝑜𝑛𝑅𝑒𝑠𝑒𝑟𝑣𝑒𝑑𝑣𝑑 are indicators for the village-level random assignment
of female-reserved communicators or not, and 𝑀𝑗 and 𝐹𝑗 denote whether the other farmer j that the
respondent i is asked about is male and female, respectively. We control for some respondent
characteristics in 𝑋𝑖𝑣𝑑, including the respondent’s own gender. 𝜆𝐹𝑗 captures the effect of gender of
the farmer whom the respondent is asked about. The sample size is large in these regressions (up
to 29,811) because the unit of observation is now an (i,j) pair, and there are up to 6 j’s (other
farmers) for every i (respondent). The excluded category is a male farmer’s interaction with
another male farmer in a control village.
The regressions in Table 8 explore three types of interactions: talking to other farmers in
general (cols 1-3); discussing farming (cols 4-6); and, discussing the new technology introduced
through the field experiment (cols 7-9). We make three central observations. First, people are no
less likely to talk to females in general in the community (cols 1-3), which confirms our earlier
observation that females are generally not less visible or more socially isolated in rural Malawi.
Similarly, we do not observe a gender communication gap on issues of farming (cols 4-6) or the
new technology (cols 7-9). Second, our interventions create more buzz around farming in the
village, especially about the new technology. In all treatment villages, regardless of gender
reservation, there are significantly more conversations between all farmers about agriculture and
about the new technology, relative to control villages. Third, relatively more conversation and
“buzz” occur in male-communicator villages. People appear to engage less about in conversations
about farming in general (cols 4-6) and the technology in particular (cols 7-9) when the
communicator role is reserved for females (4 and 7 percentage points less in interactions with male
and female farmers, respectively), although these differences are only precisely estimated in the
case of interactions with female farmers (p-value=0.06).
Taken together, these results suggest that the attention and perception gaps faced by
female-reserved communicators stems not from a general information failure or social frictions
across gender lines (e.g., “women are not good at farming”) but rather from a gender bias related
to the communicator role itself (e.g., “women should not teach others a new technology”).
22
6. Conclusion
This study contributes causal evidence to a large literature investigating the role of gender
gaps in market outcomes. We run a large-scale field experiment to test whether women perform
differentially at a ‘social task’ that requires them to interact with others to succeed, relative to a
‘private task’ that does not. Women are comparable to men in the private task, and experience
similar success at teaching or persuading others.
Despite the absence of overall performance gaps, we do identify important gaps in attention
and perceptions towards communicators of different genders. Other farmers do not perceive
female-reserved communicators to be as good at farming and teaching as their non-reserved
counterparts and pay less attention to their message and trainings. Rich data on social relationships
between male and female farmers in the village at large do not support a generalized gender
communication gap in our study setting (e.g. “nobody talks to women”), nor is it consistent with
gender frictions in communication (e.g. “women prefer talking to women, men to men”). Instead,
our findings support the notion that farmers in general are less likely to pay attention to and accept
a message from a female communicator. Farm yields and teaching performance controlling for
attendance provide an objective measure of success in the field and indicate that these patterns
correspond to gaps in perceptions that are not objectively based.
Our results highlight the cost that gender gaps in perceptions can impose on society.
Women transmit information about a productive new technology just as successfully as their male
counterparts, and others taught by women experience greater farming yields in a poor, rural society
where increases in productivity hold large welfare consequences. Yet, gender gaps in perceptions
can lead to inefficiencies in their transfer of this information to others. Talent is wasted, as
communication and perception barriers prevent relatively more zealous and accomplished female
communicators from efficiently spreading their knowledge.
Can a policy of assigning female farmers to teach others help overcome such
inefficiencies? Differences in performance in the field stem from gaps in perceptions. Hence,
policy actions empowering women to take a leading role in acquiring and passing a message to
others in their community has the potential to narrow the gender performance gap, and make
better use of the available talent. However, our results suggest such a policy on its own may not
be sufficient to eliminate gaps in perceptions, at least in the short or even medium term. Shifting

23
perceptions of women’s roles as innovators in an agrarian society may require sustained efforts
and policies. The welfare implications of this transition are large, as we show for the adoption of
a new technology which enhances agricultural yields among poor smallholder farmers.
24
References
Akerlof, G.A. and R.E. Kranton. (2000). “Economics and Identity.” The Quarterly Journal of
Economics, 115 (3): 715-753.
Altonji, J. and R. Blank (1999). “Race and Gender in the Labor Market,” in O. Ashenfelter and
D. Card (eds). Handbook of Labor Economics vol 3, Elsevier.
Bagues, M.F., and Esteve-Volart, B. (2010). “Can gender parity break the glass ceiling?
Evidence from a repeated randomized experiment.” The Review of Economic Studies, Vol.
77(4).
Beaman, L., BenYishay, A., Magruder, J., Mobarak, A. M., 2018. Can network theory-based
targeting increase technology adoption. NBER Working Paper 24912.
Beaman, L., Raghabendra Chattopadhyay, Esther Duflo, Rohini Pande and Petia Topalova
(2009). “Powerful Women: Does Exposure Reduce Prejudice?” Quarterly Journal of Economics,
November.
BenYishay, A. and A. M. Mobarak, 2018. "Social Learning and Incentives for Experimentation
and Communication." Review of Economic Studies (forthcoming).
Bertrand, M. (2011) “New Perspectives on Gender,” in O. Ashenfelter and D. Card eds,
Handbook of Labor Economics, Volume 4B, 1543-1590.
Bertrand, M, E. Duflo (2017) “Field Experiments on Discrimination,” in E. Duflo and A.
Banerjee eds, Handbook of Field Experiments, Volume 1 (forthcoming).
Bertrand, M., E. Kamenica, and J. Pan (2015). “Gender Identity and Relative Income Within
Households.” The Quarterly Journal of Economics, 571–614.
Bertrand, M., and S. Mullainathan. 2004. "Are Emily and Greg More Employable Than Lakisha
and Jamal? A Field Experiment on Labor Market Discrimination." American Economic Review,
94(4): 991-1013.
Blau, F. & Kahn, L. M. (2000). “Gender Differences in Pay”, Journal of Economic Perspectives,
14, 75–99.
Booth, A.L. & P. Nolen (2012a). "Gender differences in risk behaviour: does nurture matter?,"
Economic Journal, Royal Economic Society, vol. 122(558), pages F56-F78, 02.
Booth, A.L. & P. Nolen (2012b). "Choosing to compete: How different are girls and boys?,"
Journal of Economic Behavior & Organization, vol. 81(2), pages 542-555.
Delfgaauw, J., R. Dur, J. Sol and W. Verbeke (2013). “Tournament Incentives in the Field:
Gender Differences in the Workplace”. Journal of Labor Economics 31: 305-326.
Duflo, Esther. 2012. "Women Empowerment and Economic Development." Journal of Economic
Literature, 50(4): 1051-79.
25
Gneezy, U., Niederle, M. and Rustichini, A. (2003). “Performance in Competitive Environments:
Gender Differences”, Quarterly Journal of Economics, 118, 1049–1074.
Gneezy, U., Leonard, K. L. and List, J.A. (2009). “Gender Differences in Competition: Evidence
from a Matrilineal and a Patriarchal Society”, Econometrica, 7, 909–931.
Goldin, C., and C. Rouse (2000). "Orchestrating Impartiality: The Impact of "Blind" Auditions
on Female Musicians." American Economic Review, 90(4): 715-741.
Jayachandran, S. (2015). “The Roots of Gender Inequality in Developing Countries”. Annual
Review of Economics, Vol. 7.
Kondylis, F., V. Mueller, and S. Zhu (2017). Seeing is Believing? Evidence from an Extension
Network Experiment. Journal of Development Economics, 125, 1-20.
Malawi National Statistics Office (2007). National Census of Agriculture and Livestock.
http://www.nsomalawi.mw/images/stories/data_on_line/agriculture/NACAL/Nacal%20Report.pdf
Malawi National Statistics Office (2011). Third Integrated Household Survey.
http://www.nsomalawi.mw/publications/integrated-household-survey/third-integrated-
household-survey-ihs3.html
Masangano, C. and C. Mthinda (2012). “Pluralistic Extension System in Malawi.” IFPRI
Discussion Paper 01171.
Mengel, F., J. Sauermann, and U. Zölitz (2018). “Gender Bias in Teaching Evaluations,” Journal
of the European Economic Association, jvx057.
Milkman, K. L., Akinola, M., Chugh, D. (2012). “Temporal Distance and Discrimination: An
Audit Study in Academia”. Psychological Science.
Moss-Racusin, C.A., J.F. Dovidio, V.L.Brescoll, M.J. Graham, and J. Handelsman (2012).
“Science faculty’s subtle gender biases favor male students.” Proceedings of the National
Academy of Sciences, 109(41), pp. 16474-16479.
Neumark, D.(1996). “Sex Discrimination in Restaurant Hiring: An Audit Study.” Quarterly
Journal of Economics, Vol. 111, No. 3, August, pp. 915-41.
Niederle, M. and Vesterlund, L. (2007). “Do Women Shy Away From Competition? Do Men
Compete Too Much?” Quarterly Journal of Economics, 122, 1067–1101.
Niederle, Muriel, “Gender” Handbook of Experimental Economics, second edition, Eds.
John Kagel and Alvin E. Roth, forthcoming (expected publication 2015).
Petit, P. (2007). ‘The Effects of Age and Family Constraints on Gender Hiring Discrimination: A
Field Experiment in the French Financial Sector’, Labour Economics, 14, 371–391.
Riach, P. A., and J. Rich (2006). “An Experimental Investigation of Sexual Discrimination in
Hiring in the English Labor Market.” BE Press Advances in Economic Analysis & Policy 6 (2)
Article 1.
26
Thierfelder, C., Matemba-Mutasa, R., Rusinamhodzi, L., 2015. Yield response of maize (zea
mays l.) to conservation agriculture cropping system in southern Africa. Soil & Tillage Research
146, 230-242.
World Bank (2008). World Development Report 2008: Agriculture for Development.
Washington, D.C.: World Bank.
World Bank. 2011. World Development Report 2012: Gender Equality and Development.
Washington, D.C.: World Bank.
27
Table 1: Profile of communicator-type farmers
Mean Mean Difference
Communicators Shadow
Communicators
Non-Communicators (1) - (2) (5) - (6) (1) - (5) (2) - (6) (3) - (4)
Male Female Pooled
Male Female
1 2 3 4 5 6 7 8 9 10 11
Respondent is household head 0.96 0.90 0.93 0.91 0.94 0.94 0.06 0.00 0.02 -0.05 0.02
Respondent is primary agricultural decision maker 0.95 0.99 0.97 0.96 0.91 0.96 -0.04 -0.05 0.03 0.03 0.01
Household head is male 0.82 0.76 0.79 0.79 0.69 0.74 0.06 -0.05 0.14 0.02 0.00
Household head age 40.01 42.02 40.98 39.71 41.42 40.54 -2.01 0.87 -1.41 1.48 1.27
HH head has completed primary education 0.62 0.61 0.61 0.56 0.41 0.49 0.01 -0.09 0.21 0.12 0.05
Total cultivated land area in 2008/09 (hectare) 1.16 1.08 1.12 1.08 0.98 0.91 0.07 0.08 0.17 0.18 0.04
Maize yield (kgs/hectare) 812 605 714 1093 714 788 207 -74 98 -182 -378
HH cultivated cash crops 0.99 0.98 0.99 1.00 0.99 0.99 0.01 0.01 0.00 -0.01 -0.01
Majority of agricultural labor done by women 0.25 0.26 0.25 0.29 0.35 0.23 0.00 0.12 -0.10 0.02 -0.04
Dwelling has improved roof 0.26 0.41 0.33 0.33 0.18 0.24 -0.15 -0.06 0.08 0.17 0.00
Dwelling has improved walls 0.39 0.51 0.45 0.52 0.35 0.44 -0.12 -0.09 0.04 0.07 -0.07
HH uses improved water source in dry season 0.80 0.82 0.81 0.92 0.86 0.81 -0.02 0.05 -0.06 0.01 -0.11
HH uses improved water source in rainy season 0.83 0.82 0.82 0.92 0.86 0.80 0.01 0.06 -0.04 0.02 -0.10
Primary staple food is maize 0.94 0.97 0.95 0.98 0.94 0.97 -0.03 -0.03 0.00 0.00 -0.03
Primary staple food is sorghum 0.03 0.00 0.02 0.00 0.05 0.01 0.03 0.03 -0.01 -0.01 0.01
Primary staple food is cassava 0.00 0.02 0.01 0.00 0.00 0.01 -0.02 -0.01 0.00 0.01 0.01
Number of animals owned by the household 1.58 1.65 1.61 1.66 1.22 1.33 -0.07 -0.11 0.36 0.32 -0.04
Number of assets owned by the household 5.57 5.37 5.48 5.50 4.43 4.79 0.20 -0.36 1.15 0.58 -0.03
Primary source of income is the household farm 0.90 0.85 0.87 0.85 0.79 0.84 0.05 -0.05 0.11 0.01 0.02
Primary source of income is casual labor (ganyu) 0.45 0.31 0.39 0.39 0.48 0.48 0.14 0.00 -0.03 -0.17 0.00
Primary source of income is a business 0.30 0.53 0.41 0.41 0.38 0.44 -0.23 -0.06 -0.07 0.10 0.01
At least one HH member took a loan in past year 0.08 0.14 0.11 0.08 0.04 0.05 -0.06 -0.01 0.04 0.09 0.03
Number of farmers 115 105 220 248 1,206 1,260 220 2,466 1,321 1,365 268
Data source: Baseline household survey. Notes: T test inferences are based on standard errors clustered at the village level. ***, **, and * indicate significance at the 1, 5, and 10 percent
critical level.
28
Table 2: Balance Test (non-communicator farmers)
By Communication Method By Gender Reservation
Communicator
Vlg
Control
Vlg
(1) - (2)
No
reservation
Female
reservation
(4) - (5)
1 2 3 4 5 6
Respondent is household head 0.94 0.93 0.01 0.94 0.94 0.00
Respondent is primary agricultural decision maker 0.94 0.94 -0.01 0.91 0.96 -0.05 *
Household head is male 0.71 0.70 0.01 0.69 0.74 -0.05 **
Household head age 40.97 40.81 0.16 41.42 40.54 0.87
HH head has completed primary education 0.45 0.46 -0.01 0.41 0.49 -0.09 **
Total cultivated land area in 2008/09 (hectare) 0.94 0.87 0.08 * 0.98 0.91 0.08
Maize yield (kgs/hectare) 752 898 -145.14 714 788 -73.58
HH cultivated cash crops 0.99 1.00 -0.01 * 0.99 0.99 0.01
Majority of agricultural labor done by women 0.29 0.34 -0.05 0.35 0.23 0.12 **
Dwelling has improved roof 0.21 0.24 -0.03 0.18 0.24 -0.06 **
Dwelling has improved walls 0.40 0.41 -0.01 0.35 0.44 -0.09 *
HH uses improved water source in dry season 0.84 0.93 -0.09 ** 0.86 0.81 0.05
HH uses improved water source in rainy season 0.83 0.93 -0.09 *** 0.86 0.80 0.06
Primary staple food is maize 0.95 0.96 -0.01 0.94 0.97 -0.03
Primary staple food is sorghum 0.03 0.01 0.02 0.05 0.01 0.03
Primary staple food is cassava 0.01 0.00 0.00 0.00 0.01 -0.01
Number of animals owned by the household 1.27 1.25 0.02 1.22 1.33 -0.11
Number of assets owned by the household 4.61 4.63 -0.02 4.43 4.79 -0.37 *
Primary source of income is the household farm 0.81 0.81 0.00 0.79 0.84 -0.05
Primary source of income is casual labor (ganyu) 0.48 0.47 0.01 0.48 0.48 0.00
Primary source of income is a business 0.41 0.39 0.02 0.38 0.44 -0.06
At least one HH member took a loan in past year 0.05 0.04 0.01 0.04 0.05 -0.01
F - stat, test of joint significance 1.83 2.33
Number of farmers 2,467 1,219 3,686 1,207 1,260 2,467
Notes: See Table 1
29
Table 3: Communicators' effort & performance
Attended training # Trainings attended Knowledge Adoption
Village assigned to: 1 2 3 4
No Gender Reservation 0.38*** 2 0.19*** 0.16*** (0.08) (1.22) (0.06) (0.06)
Communicator Role Reserved for Females 0.41*** 2.62*** 0.23*** 0.21*** (0.08) (0.99) (0.05) (0.07)
Endline Dummy -0.09** 0.81** -0.02 -0.06*** (0.04) (0.32) (0.02) (0.02)
Incentive Treatment 0.06 0.55 0.09** 0.12** (0.07) (0.67) (0.04) (0.06)
Peer Farmer Treatment -0.04 -0.72 -0.04 -0.01 (0.07) (0.89) (0.05) (0.06)
Constant 0.27** -0.27 0.34*** 0.29*** (0.11) (0.51) (0.09) (0.09)
N 795 795 795 795
Adjusted R2 (0.14 0.07 0.38 0.36
Control Group Mean 0.26 0.45 0.15 0.02 (0.44) (1.62) (0.27) (0.15)
Gender Difference (p value) 0.64 0.34 0.33 0.36
Data sources: midline and endline communicator survey. Notes: Regressions include the following control variables: a constant, communicator-level characteristics (land
area cultivated, dummy for male HH head, dummy for HH head completed more than primary school) and village characteristics (matrilineal dummy, dummy for primary
religion is Islam, dummies for primary language), dummy for peer farmer and incentive treatment status, and district and survey-year indicators. Crop failure effect not
included as a dependent because crop failure experienced by only 10 of the communicators. Standard errors clustered at the village level. ***, **, and * indicate significance
at the 1, 5, and 10 percent critical level.
30
Table 4: Other farmers' interactions with communicators
Communicator
led trainings
Farmers interactions with communicators
Farmers participated in trainings Discussed Technology Talked to Communicator
Female Male Pooled Female Male Pooled Female Male Pooled
Village assigned to: 1 2 3 4 5 6 7 8 9 10
No Gender Reservation 0.35*** 0.03 0.02 0.03 0.06* 0.09* 0.07* -0.07** -0.12*** -0.10***
(0.11) (0.03) (0.04) (0.03) (0.03) (0.05) (0.04) (0.03) (0.04) (0.03)
Communicator Role Reserved for Females 0.35*** -0.02 -0.05 -0.03 0.01 0.02 0.01 -0.08*** -0.12*** -0.10***
(0.11) (0.03) (0.04) (0.03) (0.03) (0.04) (0.03) (0.03) (0.04) (0.03)
Endline . . . . -0.10*** -0.07***
-
0.08*** 0.27*** 0.34*** 0.32***
. . . . (0.02) (0.02) (0.02) (0.02) (0.02) (0.02)
Incentive Treatment 0.12 0.10*** 0.09*** 0.09*** 0.15*** 0.13*** 0.13*** 0.03 0.12*** 0.09***
(0.08) (0.03) (0.03) (0.03) (0.03) (0.04) (0.03) (0.02) (0.03) (0.03)
Peer Farmer Treatment -0.22** 0 0.02 0.01 0.04 0.05 0.04 0.10*** 0.13*** 0.12***
(0.09) (0.03) (0.03) (0.03) (0.03) (0.03) (0.03) (0.02) (0.03) (0.02)
Constant -0.14* 0.11*** 0.18*** 0.14*** 0.10*** -0.02 0.03 0.69*** 0.48*** 0.62***
(0.08) (0.04) (0.05) (0.04) (0.04) (0.05) (0.04) (0.04) (0.05) (0.04)
N 325 2663 2000 4663 3550 4970 8520 3730 6571 10301
Adjusted R2 0.13 0.02 0.04 0.03 0.07 0.07 0.08 0.17 0.18 0.19
Control Group Mean 0.13 0.12 0.2 0.15 0.09 0.13 0.11 0.87 0.72 0.77
(0.34) (0.33) (0.4) (0.36) (0.29) (0.33) (0.32) (0.34) (0.45) (0.42)
Gender Difference (p value) 0.98 0.03 0.06 0.02 0.04 0.05 0.04 0.6 1.00 0.91
Data sources: Midline & Endline HH Surveys. Notes: Regressions include the same controls as in Table 4. Standard errors clustered at the village level. ***, **, and * indicate significance at the 1, 5,
and 10 percent critical level.
31
Table 5: Other farmers’ perceptions of communicators
Midline Endline
Index: hardwork + skillful Index: knowledgeable + good farmer
Female Male Pooled Female Male Pooled
Village assigned to: 1 2 3 4 5 6
No Gender Reservation 0.06** 0.08*** 0.07*** 0.06*** 0.08*** 0.07***
(0.02) (0.02) (0.02) (0.01) (0.02) (0.01)
Communicator Role Reserved for Females 0.04 0.07*** 0.06*** 0.05*** 0.04** 0.04***
(0.02) (0.02) (0.02) (0.01) (0.02) (0.01)
Incentive Treatment 0.05*** 0.04*** 0.04*** 0.01 0.01 0.01
(0.02) (0.01) (0.01) (0.01) (0.01) (0.01)
Peer Farmer Treatment -0.08*** -0.08*** -0.08*** -0.07*** -0.07*** -0.07***
(0.02) (0.01) (0.01) (0.01) (0.01) (0.01)
Constant 0.77*** 0.72*** 0.73*** 0.80*** 0.78*** 0.79***
(0.03) (0.02) (0.02) (0.02) (0.02) (0.02)
N 909 3052 3961 2396 1832 4228
Adjusted R2 0.09 0.11 0.1 0.07 0.08 0.08
Mean of Control Group 0.8 0.79 0.79 0.78 0.73 0.76
(0.18) (0.18) (0.18) (0.14) (0.16) (0.15)
Gender Difference (p-value) 0.19 0.5 0.35 0.16 0.00 0.00
Data sources: Midline & Endline HH Surveys. Notes: Regressions include the same controls as in Table 4. Standard errors clustered at the village level. ***,
**, and * indicate significance at the 1, 5, and 10 percent critical level.
32
Table 6: Other farmers’ knowledge and adoption
Knowledge Score Adoption
Female Male Pooled Female Male Pooled
Village assigned to: 1 2 3 4 5 6
No Gender Reservation 0.07** 0.07** 0.07** 0.02 0.02 0.02
(0.03) (0.03) (0.03) (0.01) (0.02) (0.02)
Communicator Role Reserved for Females 0.03 0.06** 0.05** 0 0.02 0.01
(0.02) (0.03) (0.02) (0.01) (0.02) (0.01)
Endline Dummy -0.04*** -0.05*** -0.06*** -0.02** -0.03*** -0.03***
(0.01) (0.01) (0.01) (0.01) (0.01) (0.01)
Incentive Treatment 0.03 0.03 0.03* 0.03** 0.03* 0.03**
(0.02) (0.02) (0.02) (0.01) (0.01) (0.01)
Peer Farmer Treatment 0.04** 0.02 0.03 0.02* 0.01 0.01
(0.02) (0.02) (0.02) (0.01) (0.01) (0.01)
Constant 0.15*** 0.24*** 0.19*** 0.06*** 0.06** 0.06***
(0.03) (0.04) (0.03) (0.02) (0.03) (0.02)
N 3924 4235 8159 3924 4235 8159
Adjusted R2 0.17 0.22 0.2 0.06 0.06 0.06
Control Group Mean 0.06 0.09 0.08 0.01 0.02 0.01
(0.17) (0.22) (0.2) (0.10) (0.13) (0.12)
Gender Difference (p value) 0.07 0.65 0.28 0.08 0.67 0.54
Data sources: midline and endline communicator survey. Notes: Regressions include the following control variables: a constant, communicator-level characteristics (land area
cultivated, dummy for male HH head, dummy for HH head completed more than primary school) and village characteristics (matrilineal dummy, dummy for primary religion is
Islam, dummies for primary language), dummy for peer farmer and incentive treatment status, and district and survey-year indicators. Crop failure effect not included as a dependent
because crop failure experienced by only 10 of the communicators. Standard errors clustered at the village level. ***, **, and * indicate significance at the 1, 5, and 10 percent
critical level.
33
Table 7: Other farmers' maize production
Log Maize Yield Likelihood of crop failure
Female Male Pooled Female Male Pooled
Village assigned to: 1 2 3 4 5 6
No Gender Reservation -0.10 0.14 0.03 -0.01 -0.01 0.00
(0.10) (0.09) (0.08) (0.01) (0.03) (0.02)
Communicator Role Reserved for Females -0.10 0.19** 0.06 -0.02 -0.02 -0.02
(0.11) (0.09) (0.08) (0.02) (0.02) (0.01)
Incentive Treatment 0.10 0.04 0.06 0.00 -0.01 0.00
(0.07) (0.06) (0.06) (0.01) (0.02) (0.01)
Peer Farmer Treatment 0.10 0.06 0.08 -0.01 0.02 0.00
(0.07) (0.06) (0.06) (0.01) (0.02) (0.01)
Constant 5.59*** 5.84*** 5.64*** . . .
(0.14) (0.16 (0.12) . . .
N 1392 1441 2833 1763 1623 3820
Adjusted R2 0.28 0.34 0.31 . . .
Control Group Mean 6.49 6.66 6.57 0.05 0.06 0.05
(0.99) (0.99) (0.99) (0.21) (0.23) (0.21)
Gender Difference (p value) 0.95 0.50 0.66 0.31 0.31 0.22
Data sources: Endline HH Survey. Notes: Likelihood of crop failure (1-3) is probit; sample size varies when included controls perfectly predit failure. Maize yield (4-6) is
OLS. Regressions include the same controls as in Table 4. Maize yield calculated for all farmers that reported growing maize on at least one plot, and 2.5% top-end
winsorized. Standard errors clustered at the village level. ***, **, and * indicate significance at the 1, 5, and 10 percent critical level.
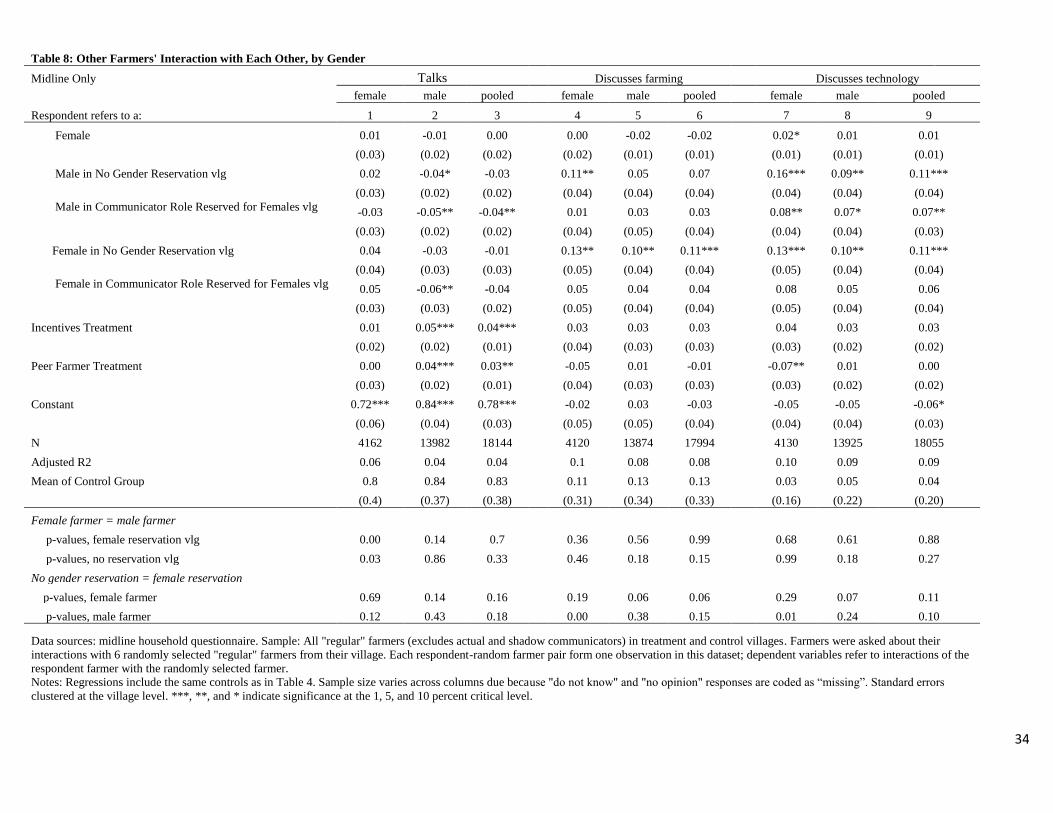
34
Table 8: Other Farmers' Interaction with Each Other, by Gender
Midline Only Talks Discusses farming Discusses technology
female male pooled female male pooled female male pooled
Respondent refers to a: 1 2 3 4 5 6 7 8 9
Female 0.01 -0.01 0.00 0.00 -0.02 -0.02 0.02* 0.01 0.01
(0.03) (0.02) (0.02) (0.02) (0.01) (0.01) (0.01) (0.01) (0.01)
Male in No Gender Reservation vlg 0.02 -0.04* -0.03 0.11** 0.05 0.07 0.16*** 0.09** 0.11***
(0.03) (0.02) (0.02) (0.04) (0.04) (0.04) (0.04) (0.04) (0.04)
Male in Communicator Role Reserved for Females vlg -0.03 -0.05** -0.04** 0.01 0.03 0.03 0.08** 0.07* 0.07**
(0.03) (0.02) (0.02) (0.04) (0.05) (0.04) (0.04) (0.04) (0.03)
Female in No Gender Reservation vlg 0.04 -0.03 -0.01 0.13** 0.10** 0.11*** 0.13*** 0.10** 0.11***
(0.04) (0.03) (0.03) (0.05) (0.04) (0.04) (0.05) (0.04) (0.04)
Female in Communicator Role Reserved for Females vlg 0.05 -0.06** -0.04 0.05 0.04 0.04 0.08 0.05 0.06
(0.03) (0.03) (0.02) (0.05) (0.04) (0.04) (0.05) (0.04) (0.04)
Incentives Treatment 0.01 0.05*** 0.04*** 0.03 0.03 0.03 0.04 0.03 0.03
(0.02) (0.02) (0.01) (0.04) (0.03) (0.03) (0.03) (0.02) (0.02)
Peer Farmer Treatment 0.00 0.04*** 0.03** -0.05 0.01 -0.01 -0.07** 0.01 0.00
(0.03) (0.02) (0.01) (0.04) (0.03) (0.03) (0.03) (0.02) (0.02)
Constant 0.72*** 0.84*** 0.78*** -0.02 0.03 -0.03 -0.05 -0.05 -0.06*
(0.06) (0.04) (0.03) (0.05) (0.05) (0.04) (0.04) (0.04) (0.03)
N 4162 13982 18144 4120 13874 17994 4130 13925 18055
Adjusted R2 0.06 0.04 0.04 0.1 0.08 0.08 0.10 0.09 0.09
Mean of Control Group 0.8 0.84 0.83 0.11 0.13 0.13 0.03 0.05 0.04
(0.4) (0.37) (0.38) (0.31) (0.34) (0.33) (0.16) (0.22) (0.20)
Female farmer = male farmer
p-values, female reservation vlg 0.00 0.14 0.7 0.36 0.56 0.99 0.68 0.61 0.88
p-values, no reservation vlg 0.03 0.86 0.33 0.46 0.18 0.15 0.99 0.18 0.27
No gender reservation = female reservation
p-values, female farmer 0.69 0.14 0.16 0.19 0.06 0.06 0.29 0.07 0.11
p-values, male farmer 0.12 0.43 0.18 0.00 0.38 0.15 0.01 0.24 0.10
Data sources: midline household questionnaire. Sample: All "regular" farmers (excludes actual and shadow communicators) in treatment and control villages. Farmers were asked about their
interactions with 6 randomly selected "regular" farmers from their village. Each respondent-random farmer pair form one observation in this dataset; dependent variables refer to interactions of the
respondent farmer with the randomly selected farmer.
Notes: Regressions include the same controls as in Table 4. Sample size varies across columns due because "do not know" and "no opinion" responses are coded as “missing”. Standard errors
clustered at the village level. ***, **, and * indicate significance at the 1, 5, and 10 percent critical level.

35
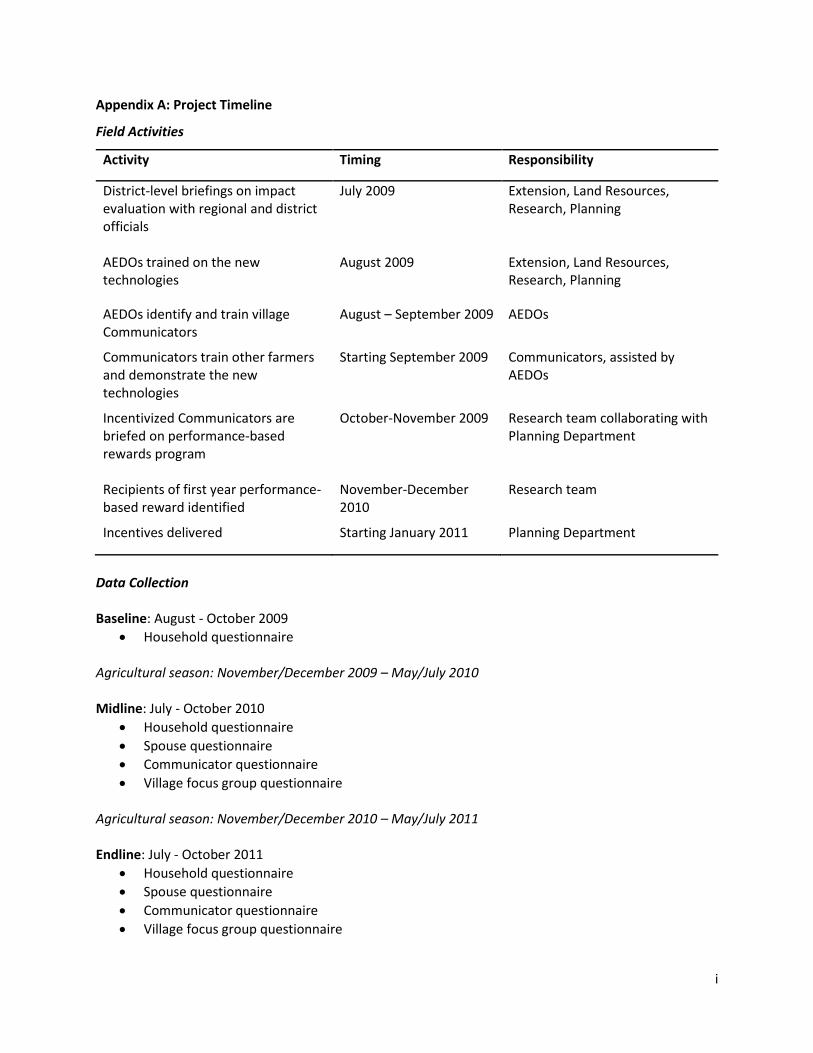
i
Appendix A: Project Timeline
Field Activities
Activity Timing Responsibility
District-level briefings on impact evaluation with regional and district officials
July 2009 Extension, Land Resources, Research, Planning
AEDOs trained on the new technologies
August 2009 Extension, Land Resources, Research, Planning
AEDOs identify and train village Communicators
August – September 2009 AEDOs
Communicators train other farmers and demonstrate the new technologies
Starting September 2009 Communicators, assisted by AEDOs
Incentivized Communicators are briefed on performance-based rewards program
October-November 2009 Research team collaborating with Planning Department
Recipients of first year performance-based reward identified
November-December 2010
Research team
Incentives delivered Starting January 2011 Planning Department
Data Collection Baseline: August - October 2009
• Household questionnaire Agricultural season: November/December 2009 – May/July 2010 Midline: July - October 2010
• Household questionnaire
• Spouse questionnaire
• Communicator questionnaire
• Village focus group questionnaire Agricultural season: November/December 2010 – May/July 2011 Endline: July - October 2011
• Household questionnaire
• Spouse questionnaire
• Communicator questionnaire
• Village focus group questionnaire
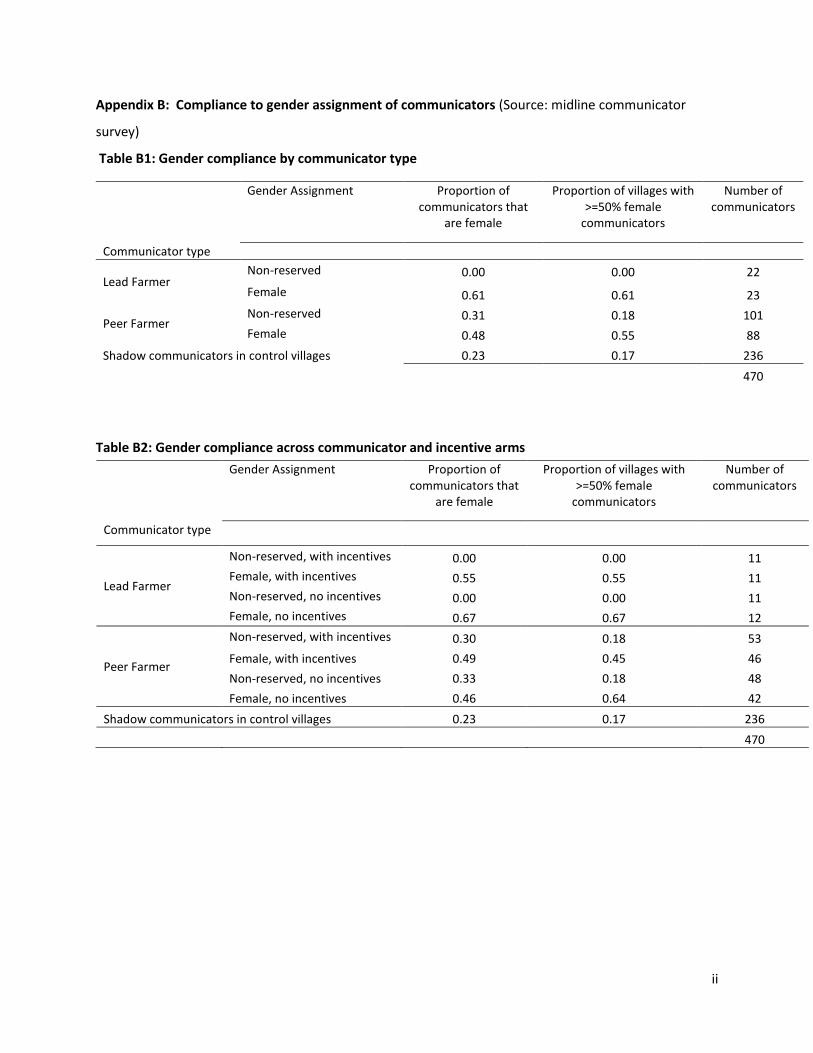
ii
Appendix B: Compliance to gender assignment of communicators (Source: midline communicator
survey)
Table B1: Gender compliance by communicator type
Table B2: Gender compliance across communicator and incentive arms
Gender Assignment Proportion of communicators that
are female
Proportion of villages with >=50% female
communicators
Number of communicators
Communicator type
Lead Farmer Non-reserved 0.00 0.00 22
Female 0.61 0.61 23
Peer Farmer Non-reserved 0.31 0.18 101
Female 0.48 0.55 88
Shadow communicators in control villages 0.23 0.17 236
470
Gender Assignment Proportion of communicators that
are female
Proportion of villages with >=50% female
communicators
Number of communicators
Communicator type
Lead Farmer
Non-reserved, with incentives 0.00 0.00 11
Female, with incentives 0.55 0.55 11
Non-reserved, no incentives 0.00 0.00 11
Female, no incentives 0.67 0.67 12
Peer Farmer
Non-reserved, with incentives 0.30 0.18 53
Female, with incentives 0.49 0.45 46
Non-reserved, no incentives 0.33 0.18 48
Female, no incentives 0.46 0.64 42
Shadow communicators in control villages 0.23 0.17 236
470

iii
Appendix C: Construction of the main variables
Communicators’ Effort (Communicator questionnaire, midline and endline)
• Attended training: A binary variable that indicates whether a Communicator reports working with an
AEDO over the last farming season.
• # Trainings attended: A discrete variable that indicates the number of times a Communicator reports
working with an AEDO over the last farming season.
• Communicator led training: A binary variable that indicates whether a Communicator led any training
involving other farmers in his village during the 12 months prior to the interview.
Knowledge and Adoption (Communicators and Other Farmers)
• Knowledge: A [0;1] continuous variable that measures a respondent’s understanding of the
technology. The score is the fraction of correct answers a respondent provides to seven technology-
specific questions for pit planting, and six for Changu composting. The percentage of correct answers
is the knowledge score.
• Adoption: A binary variable that indicates whether a respondent adopted the promoted technology
(pit planting or Changu composting) in the last farming season.
Other farmer Interactions with Communicator (Other farmers ML and EL; both main and additional
respondent)
• Discussed Technology: A binary variable indicating whether farmers report having discussed the
technology (pit planting or Changu composing) with the communicator during the 12 months prior to
the interview.
• Participated in trainings: A binary variable indicating whether the farmer participated in a group
training held by the communicator during the past 12 (asked at endline only).
• Talked to communicator: A binary variable indicating whether a farmer talked to their assigned
communicator about anything over the past 12 months.
Other Farmers’ Perception of Communicators (household & spouse/additional respondent questionnaire,
Social Network module)
• Midline perception index (hardworking + skillful): An index constructed from two categorical variables
indicating the respondent’s perception of the communicator.
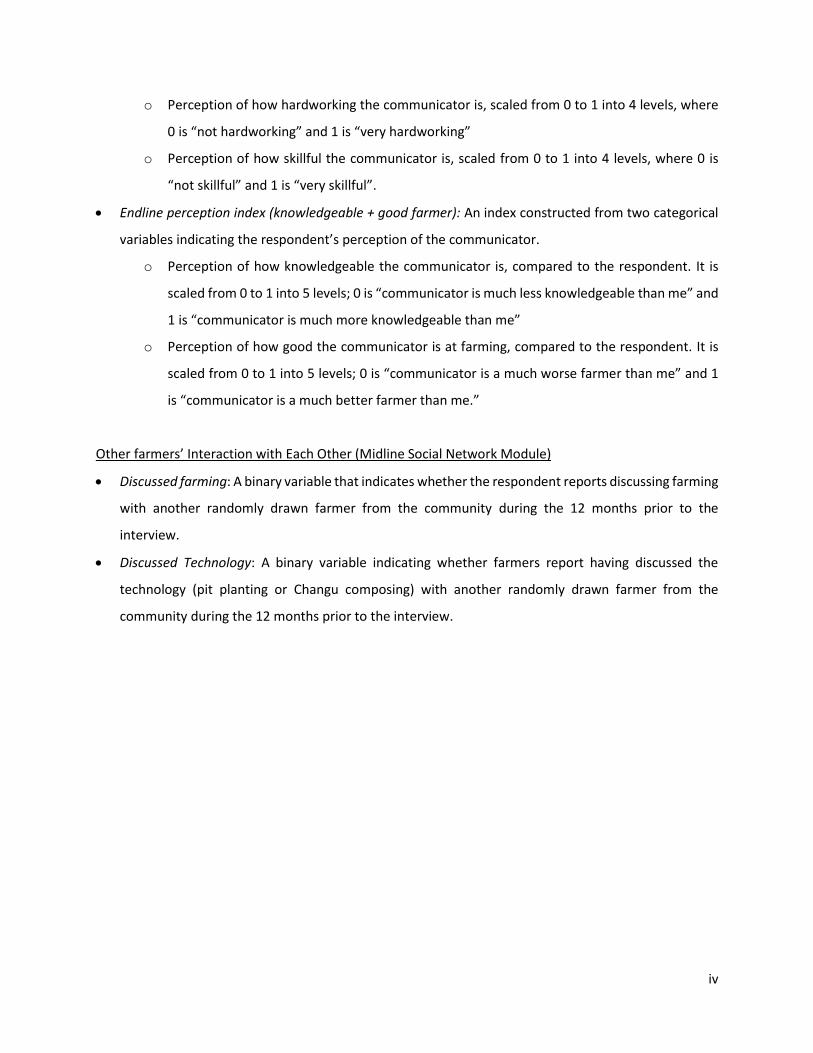
iv
o Perception of how hardworking the communicator is, scaled from 0 to 1 into 4 levels, where
0 is “not hardworking” and 1 is “very hardworking”
o Perception of how skillful the communicator is, scaled from 0 to 1 into 4 levels, where 0 is
“not skillful” and 1 is “very skillful”.
• Endline perception index (knowledgeable + good farmer): An index constructed from two categorical
variables indicating the respondent’s perception of the communicator.
o Perception of how knowledgeable the communicator is, compared to the respondent. It is
scaled from 0 to 1 into 5 levels; 0 is “communicator is much less knowledgeable than me” and
1 is “communicator is much more knowledgeable than me”
o Perception of how good the communicator is at farming, compared to the respondent. It is
scaled from 0 to 1 into 5 levels; 0 is “communicator is a much worse farmer than me” and 1
is “communicator is a much better farmer than me.”
Other farmers’ Interaction with Each Other (Midline Social Network Module)
• Discussed farming: A binary variable that indicates whether the respondent reports discussing farming
with another randomly drawn farmer from the community during the 12 months prior to the
interview.
• Discussed Technology: A binary variable indicating whether farmers report having discussed the
technology (pit planting or Changu composing) with another randomly drawn farmer from the
community during the 12 months prior to the interview.
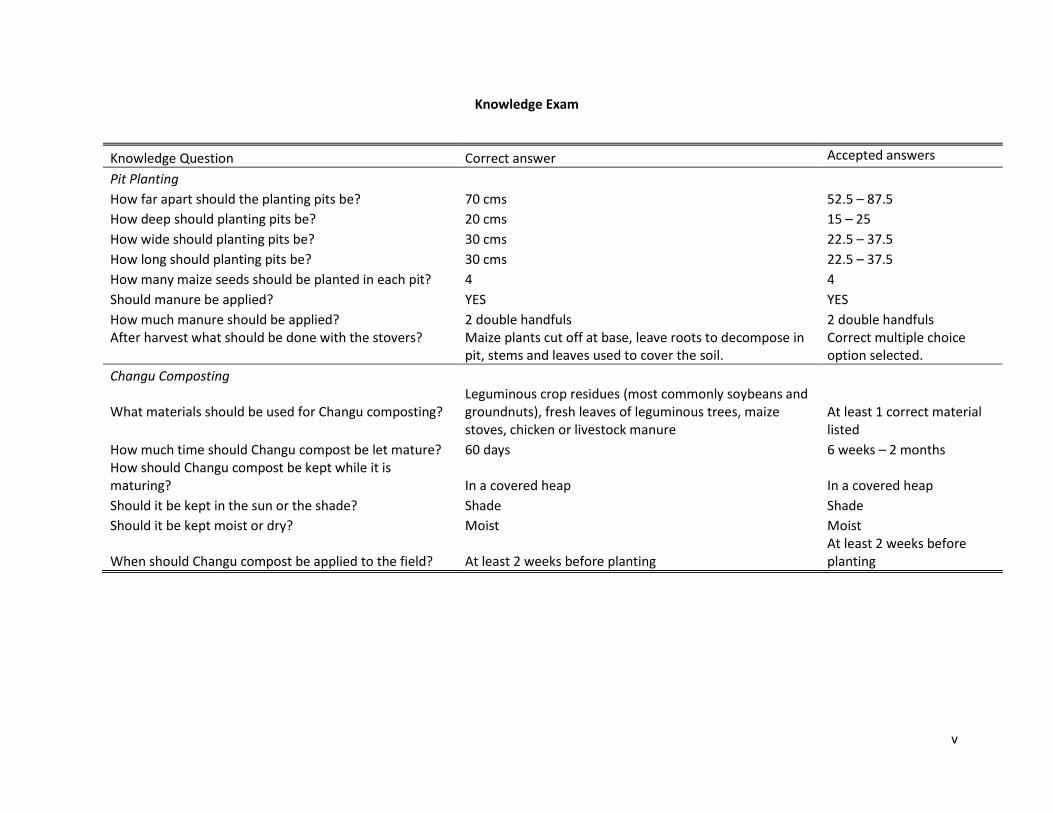
v
Knowledge Exam
Knowledge Question Correct answer Accepted answers
Pit Planting
How far apart should the planting pits be? 70 cms 52.5 – 87.5
How deep should planting pits be? 20 cms 15 – 25
How wide should planting pits be? 30 cms 22.5 – 37.5
How long should planting pits be? 30 cms 22.5 – 37.5
How many maize seeds should be planted in each pit? 4 4
Should manure be applied? YES YES
How much manure should be applied? 2 double handfuls 2 double handfuls After harvest what should be done with the stovers?
Maize plants cut off at base, leave roots to decompose in pit, stems and leaves used to cover the soil.
Correct multiple choice option selected.
Changu Composting
What materials should be used for Changu composting?
Leguminous crop residues (most commonly soybeans and groundnuts), fresh leaves of leguminous trees, maize stoves, chicken or livestock manure
At least 1 correct material listed
How much time should Changu compost be let mature? 60 days 6 weeks – 2 months How should Changu compost be kept while it is maturing? In a covered heap In a covered heap
Should it be kept in the sun or the shade? Shade Shade
Should it be kept moist or dry? Moist Moist
When should Changu compost be applied to the field? At least 2 weeks before planting At least 2 weeks before planting
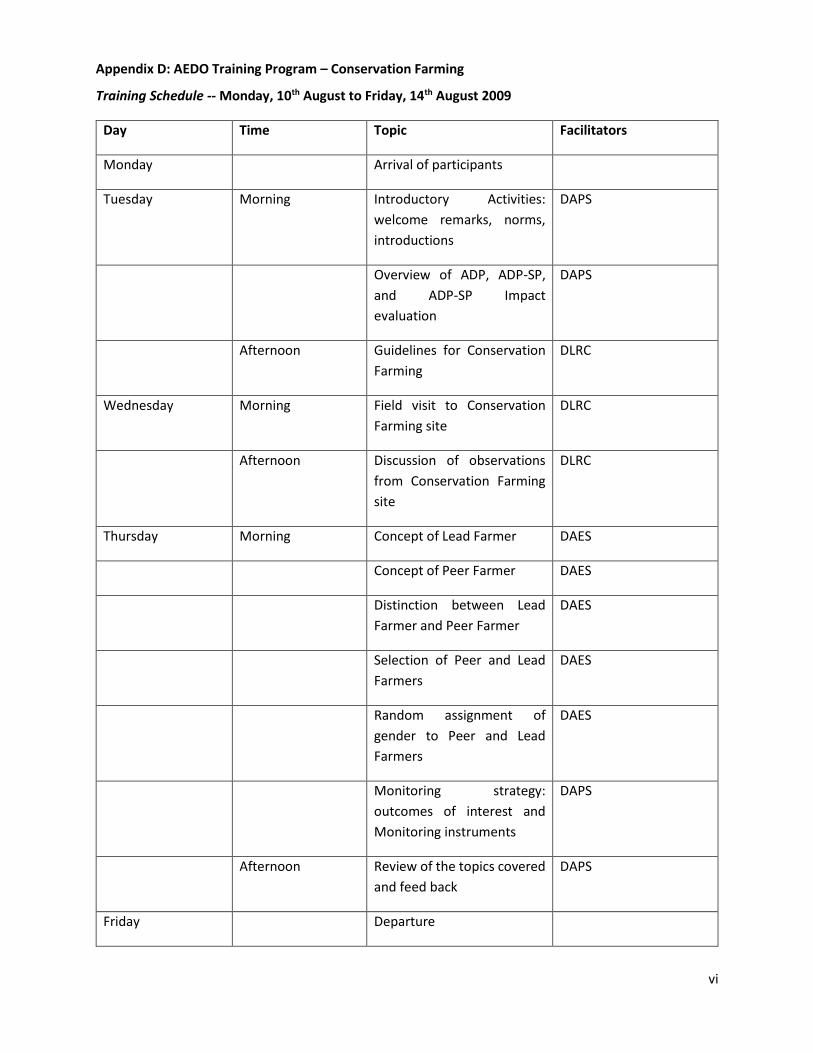
vi
Appendix D: AEDO Training Program – Conservation Farming
Training Schedule -- Monday, 10th August to Friday, 14th August 2009
Day Time Topic Facilitators
Monday Arrival of participants
Tuesday Morning Introductory Activities:
welcome remarks, norms,
introductions
DAPS
Overview of ADP, ADP-SP,
and ADP-SP Impact
evaluation
DAPS
Afternoon Guidelines for Conservation
Farming
DLRC
Wednesday Morning Field visit to Conservation
Farming site
DLRC
Afternoon Discussion of observations
from Conservation Farming
site
DLRC
Thursday Morning Concept of Lead Farmer DAES
Concept of Peer Farmer DAES
Distinction between Lead
Farmer and Peer Farmer
DAES
Selection of Peer and Lead
Farmers
DAES
Random assignment of
gender to Peer and Lead
Farmers
DAES
Monitoring strategy:
outcomes of interest and
Monitoring instruments
DAPS
Afternoon Review of the topics covered
and feed back
DAPS
Friday Departure
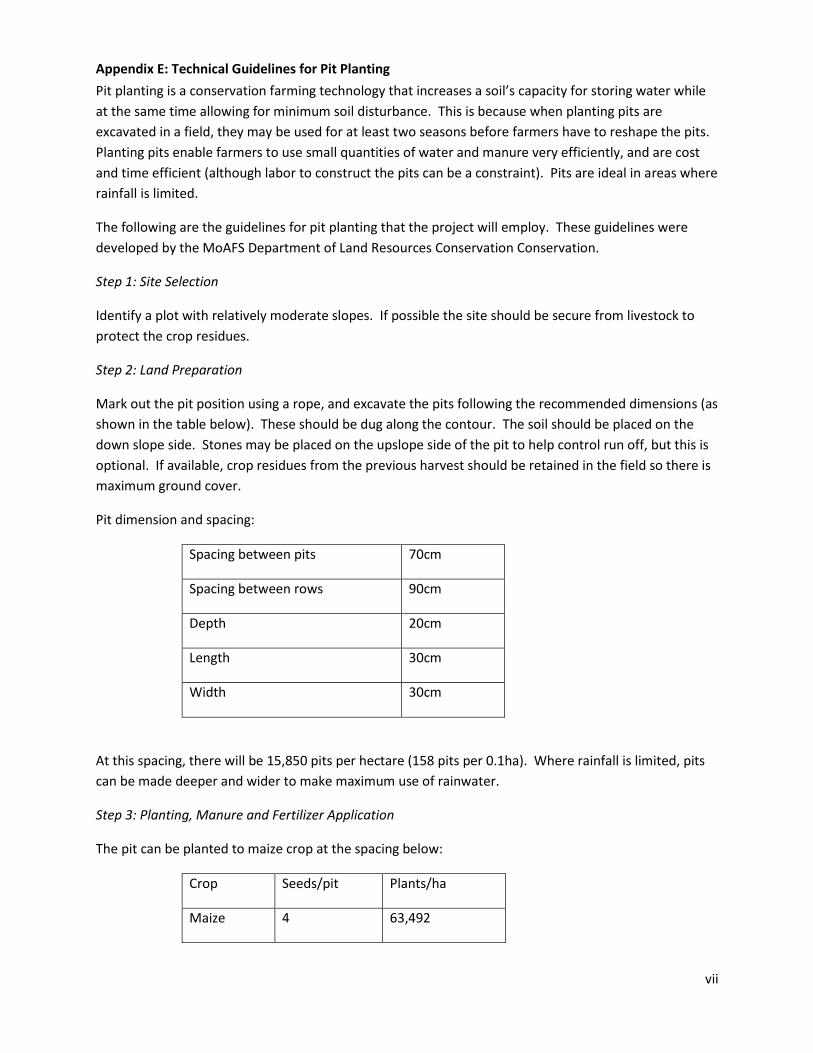
vii
Appendix E: Technical Guidelines for Pit Planting
Pit planting is a conservation farming technology that increases a soil’s capacity for storing water while
at the same time allowing for minimum soil disturbance. This is because when planting pits are
excavated in a field, they may be used for at least two seasons before farmers have to reshape the pits.
Planting pits enable farmers to use small quantities of water and manure very efficiently, and are cost
and time efficient (although labor to construct the pits can be a constraint). Pits are ideal in areas where
rainfall is limited.
The following are the guidelines for pit planting that the project will employ. These guidelines were
developed by the MoAFS Department of Land Resources Conservation Conservation.
Step 1: Site Selection
Identify a plot with relatively moderate slopes. If possible the site should be secure from livestock to
protect the crop residues.
Step 2: Land Preparation
Mark out the pit position using a rope, and excavate the pits following the recommended dimensions (as
shown in the table below). These should be dug along the contour. The soil should be placed on the
down slope side. Stones may be placed on the upslope side of the pit to help control run off, but this is
optional. If available, crop residues from the previous harvest should be retained in the field so there is
maximum ground cover.
Pit dimension and spacing:
Spacing between pits 70cm
Spacing between rows 90cm
Depth 20cm
Length 30cm
Width 30cm
At this spacing, there will be 15,850 pits per hectare (158 pits per 0.1ha). Where rainfall is limited, pits
can be made deeper and wider to make maximum use of rainwater.
Step 3: Planting, Manure and Fertilizer Application
The pit can be planted to maize crop at the spacing below:
Crop Seeds/pit Plants/ha
Maize 4 63,492

viii
It is recommended that farmers apply 2 handfuls of manure in each pit. Two weeks before rainfall,
apply manure and cover the pit with earth. If basal fertilizer is available, it can also be applied at the
same time. When manure has been applied, the pits should be covered with soil. A shallow depression
should still remain on top. If top dressing is available, it should be applied when the maize is knee high.
In some areas, it may be after 21 days.
Step 4: Weed Control and Pest Management
The pits must be kept free of weeds at all times. Weed as soon as the weeds appear and just before
harvesting. This will reduce the amount of weeds in the following season. Use of herbicides to control
weeds is optional.
Step 5: Harvesting
Remove the crop. Cut plants at base, leaving stems and leaves on the soil. The roots should not be
uprooted; they should be left to decompose within the pit.
Increasing the Efficiency of the Pits
It is important to realize that the use of these pits alone will not produce the highest yields. For best
results:
• Always incorporate crop residues, leaving a minimum of 30% of crop residue on the field.
• Apply manure generously.
• Protect crops from weeds, pests, and diseases.
• Always plant with the first productive rains.
• Grow crops in rotation; at least 30% of the cropped land should be planted to legumes.
• Using a cover crop / ground cover in conjunction with pits will give best results
Monitoring and Evaluation Indicators
The following indicators will be used to monitor adoption of pit planting:
1. Number of seeds planted per pit 2. Proper spacing of the pits (measured by the number of pits / size of the plot) 3. Quantity of fertilizer applied 4. Use of crop residues 5. Use of a ground cover / cover crop
Training Plan for Pit Planting
1.0 Objectives
By the end of the session, participants should be able to:
• Understand the concept of conservation agriculture
• Distinguish between conservation agriculture and conservation farming
• Understand the options available in conservation agriculture
• Understand the technical recommendations for pit planting
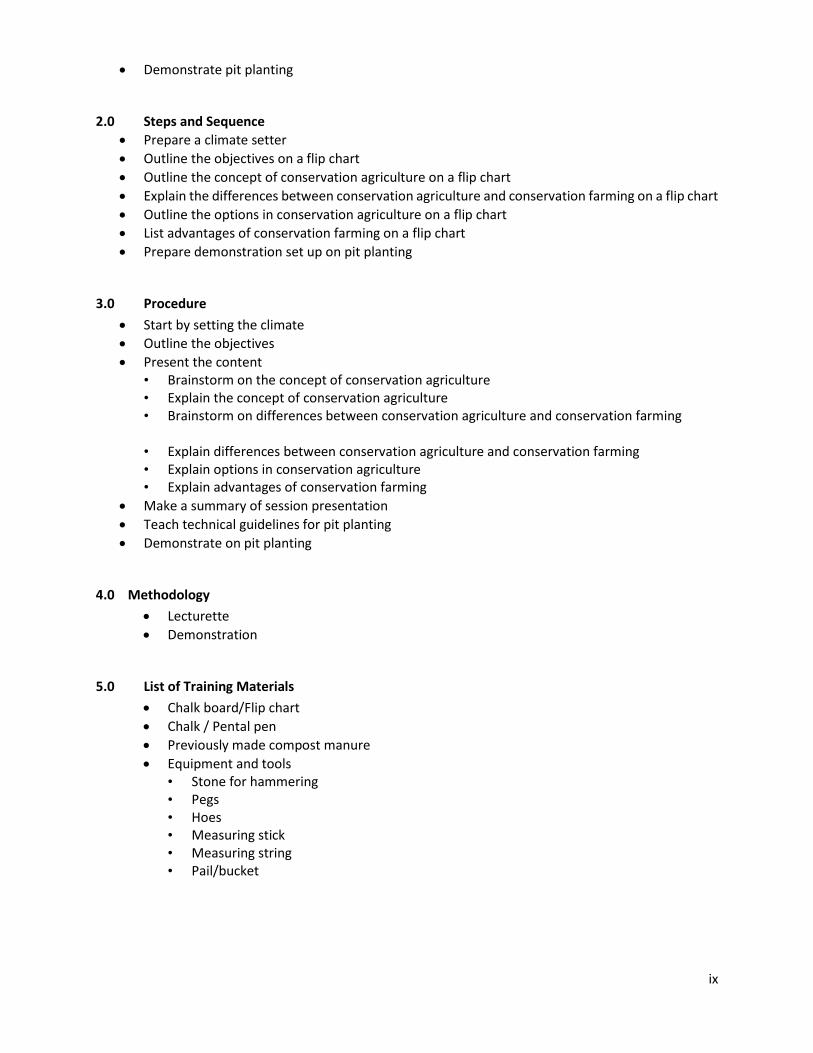
ix
• Demonstrate pit planting
2.0 Steps and Sequence
• Prepare a climate setter
• Outline the objectives on a flip chart
• Outline the concept of conservation agriculture on a flip chart
• Explain the differences between conservation agriculture and conservation farming on a flip chart
• Outline the options in conservation agriculture on a flip chart
• List advantages of conservation farming on a flip chart
• Prepare demonstration set up on pit planting
3.0 Procedure
• Start by setting the climate
• Outline the objectives
• Present the content • Brainstorm on the concept of conservation agriculture • Explain the concept of conservation agriculture • Brainstorm on differences between conservation agriculture and conservation farming
• Explain differences between conservation agriculture and conservation farming • Explain options in conservation agriculture • Explain advantages of conservation farming
• Make a summary of session presentation
• Teach technical guidelines for pit planting
• Demonstrate on pit planting
4.0 Methodology
• Lecturette
• Demonstration
5.0 List of Training Materials
• Chalk board/Flip chart
• Chalk / Pental pen
• Previously made compost manure
• Equipment and tools • Stone for hammering • Pegs • Hoes • Measuring stick • Measuring string • Pail/bucket

x
Appendix F: Technical Guidelines for Nutrient Management
The following are the guidelines to the nutrient management strategy the project will employ. These
guidelines were developed by the MoAFS Department of Agricultural Research.
Step 1: Materials for compost
The following materials are appropriate for making compost: leguminous crop residues (Groundnuts and
Soyabean), fresh leaves of leguminous trees, chopped maize stover (about 6 inches long), animal or
chicken manure (optional)
Step 2: Preparation of compost
Mix three parts of leguminous biomass (crop residues and/or fresh leaves) to two parts maize stover.
Put a layer of legume crop residue followed by a layer of stover then a layer of green leaves of legume
tree repeat making the layers until the heap is 120 cm high. After constructing a set of three layers add 5
liters of water to moisten the materials.
After constructing the heap smear the wet earth around the heap covering the biomass. The materials
should be kept moist throughout the composting period. After 60 days the manure is ready, remove the
manure and keep them under shade.
Step 3: Application method
Apply the manure at least two weeks before planting. Apply 3 kg of manure applied per 10 m ridge.
Split open the ridge about 4 cm deep, spread the manure on the open ridge then bury the manure thus
reconstituting the ridge.
Step 4: Planting
At the rain onset plant maize, one maize seed per planting hole on the ridge at a distance of 25 cm
between planting holes.
Step 5: Use of Inorganic Fertilizer (optional, depends on availability)
Use 23:21:0+4S for basal dressing. Apply fertilizer as dollop; make a hole about 3 cm deep between the
maize planting hills.
• Apply 23 kg N/ha of 23:21:0+4S at a rate 2.5g per hole (cups to be calibrated to measure 2.5 g fertilizer).
• Apply 37 kg N/ha of Urea at a rate of 2g per hole (cups to be calibrated to measure 2g fertilizer) Apply the inorganic fertilizer one (1) week after maize germination. Note that cups must be carefully
calibrated; using a bottle cap will result in fertilizer overdose.
Monitoring and Evaluation Indicators:
The following indicators will be used to determine farmer’s adoption of NM technology:
• Compost materials used (should exclude grass)

xi
• Time and method of manure application
• Quantity of inorganic fertilizer applied
• Number of compost heaps per farmer (should increase in the second season)
• Expansion of area of land planted using the intervention (land area should increase in the second season)
HANDOUT: MAKING CHANGU COMPOST OR CHANGU
This is the type of compost where the organic materials decompose relatively fast hence the name
“Changu.”
Making of this type of manure undergoes several steps which are outlined as follows:
• Site selection The best site for the Changu compost is
• Near the garden where the compost is to applied, to minimize labour and time in transportation, preferably on the edge of the garden to avoid disrupting cultivation operations in the garden.
• This should be under shade, on a fairly flat ground. • Near the source of materials and water • Away from dwelling houses with chickens and goats
• Materials required Composting materials
• Grass • Crop residues • Maize stover • Leaves of various plants
• Booster (Khola manure, previously made compost manure, green fresh matter, leguminous leaves, top soil)
• Water
• Equipment and tools • Bricks • Stone/logs • Poles • Hoes • Measuring stick • Pail/bucket
Procedure for Construction
The process for construction of Changu compost heap is as follows:
xii
• Clear the surface of the ground in at least 2m diameter for easy marking
• Measure a 1.5m to 2m diameter circle by using a peg and a string
• Heap 20 – 30 cm thick layer of composting material over the area marked, which will form as the base of the compost heap
• Water the heap adequately until it just oozes out when materials are squeezed to induce decomposition.
• Add a booster (Khola manure, previously made compost manure, green fresh matter, leguminous leaves, top soil) on top to a height of 3 – 5 cm thick
• Water the booster layer adequately
• Repeat the above process with the diameter of each subsequent layer reducing until the heap is 1.5m high, thereby achieving a conical shape
• Cover the heap with grass to reduce evaporation
Procedure for turning
After two to three days the heap will have formed three distinctive layers.
• Insert a stick into the compost heap to check if decomposition has started
• If the stick is warm, it shows that there is microbial activity and decomposition has started.
• Where decomposition has started turn the heap after 3 to 4 days and there after every 4 to 5 days to speed up decomposition.
• During the turning process remove the outer layer (A) from the heap and separate the middle layer (B) from the inner layer (C).
• In the process of rebuilding the heap • Put layer A at the bottom • Water adequately • Put layer C in the middle • Water adequately • Lastly, put layer B on top/outside the heap. • Water and cover the heap with grass
The process of noted undecomposing heap
This is determined if the stick inserted into the heap is not felt to be warm.
This could be solved by dismantling the heap and remaking the compost, using a different booster, adding
more water if the material looks dry.
Duration of composting for this method
The heap will mature after 30 to 40 days depending on the nature of composting material used.