Embed Size (px)
Citation preview
PP. 95 – 107
EUROPEAN JOURNAL OF BUSINESS AND SOCIAL SCIENCES
95
European Journal of Business and Social Sciences, Vol. 1, No. 9, pp 95-107, December 2012. URL: http://www.ejbss.com/recent.aspx ISSN: 2235 -767X
GENDER GAP IN LITERACY RATE IN MATHURA DISTRICT U.P. A GEOGRAPHICAL STUDY
Dr. Ashok Kumar Kaushik
Lecturer, Department of Geography, K.R. (P.G.) College,
Mathura, U.P. India.
Kapil Kaushik
Research Scholar, Department of Geography, A.M.U., Aligarh, U.P. India.
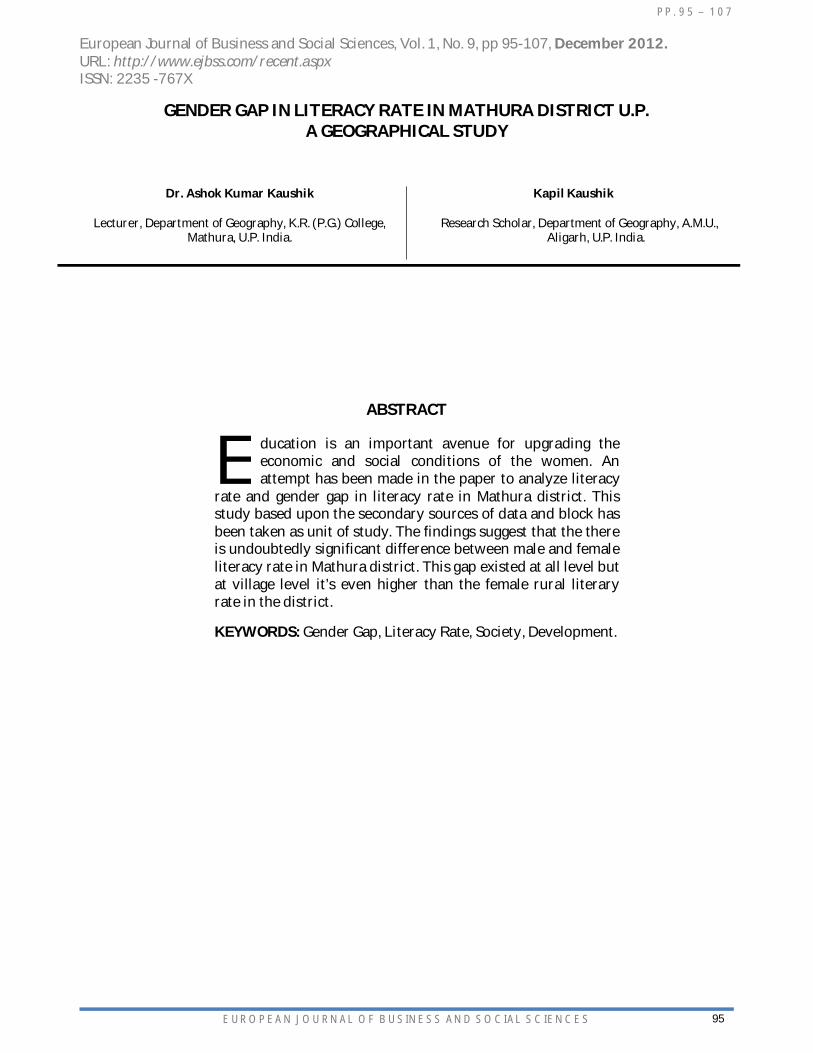
ABSTRACT
ducation is an important avenue for upgrading the economic and social conditions of the women. An attempt has been made in the paper to analyze literacy
rate and gender gap in literacy rate in Mathura district. This study based upon the secondary sources of data and block has been taken as unit of study. The findings suggest that the there is undoubtedly significant difference between male and female literacy rate in Mathura district. This gap existed at all level but at village level it’s even higher than the female rural literary rate in the district.
KEYWORDS: Gender Gap, Literacy Rate, Society, Development.
E
PP. 95 – 107
EUROPEAN JOURNAL OF BUSINESS AND SOCIAL SCIENCES
96
INTRODUCTION
Literacy and educational attainment are powerful indicators of social and economic development among the backward groups especially for women in India. It is the very first step to human well-being but not an end in itself. Gender diversity in literacy is conspicuous. In India, male literacy is higher than female literacy. The male-female gap in literacy rate continued to be unacceptably high. Despite progress in female education over the past four decades, the vast majority of women have remained illiterate. The National Policy of Education, 1986 has laid down that gender discrimination.
The gap between male and female literacy is a sensitive indicator of social discrimination. The gender gap in education occurs when there are systematic differences in schooling levels between men and women. It is a useful measure for providing evidence of the inequalities that exist between the sexes in terms of access to school. The construction of gender roles in any society is influenced by several factors, most of which are largely independent of the sources of poverty or growth. Indicators frequently used to measure gender equality include life expectancy, education, and earnings.
Different scholars have worked on problems of gender literacy. Some of the studies are cited here. Odaga and Heneveld (1995) studied the problems of female education and causes of their low level literacy rate. Bhatty (1998) observed the gender disparities in education out come in India. It is also examine that in backward communities women suffer an additional disadvantage in term of their educational achievement (Sengupta and Guha, 2002 and Vaid, 2004). Lavy (2004) explained discrimination in boys and girls in attaining schools. Lori (2000) studied the gender gap in literacy in Uttar Pradesh. Mensch and Lloyd (1998) explain the Gender differences in the schooling experiences of adolescents in low income countries. Pal (2004) examined the gender difference in children enrolment in rural area. The impact of the socio-economic condition of parents on the gender gap in literacy is also supported by Peter and David (2000) and Kambhampati and Pal (2001). Knowles, Lorgelly and Owen (2002), examine the influence of gender inequality in education on development of society. The relationship between education and regional, economic or social development is analyzed by Siddiqui & Yadav (2004) and Yasmeen, Siddiqui & Khan (2005). In this lightly an attempt has been made to analyze literacy rate and gender gap in literacy rate in Mathura district.
OBJECTIVES The paper was pursued with the following objectives:
To find out the micro-regional (block) variations in the total literacy rate, rural and urban literacy rate literacy rate in Mathura district.
To highlight level of gender gap in the total literacy rate, rural and urban literacy rate literacy rate in Mathura district.
To correlate female literacy rates with variables of socio-economic development. Finally suggest some suitable measures which can help to reduce gender gap in literacy rate.
DATA BASE AND METHODOLOGY
Whole the study based upon the secondary sources of data. Data for the present analysis have been obtained mainly from District Census C.D. 2001, from Directorate of Census Operation, Lucknow, Uttar Pradesh; besides this data were also collected from various government offices in the district. Present study use block as a smallest unity of analysis. To achieve the objectives mentioned above the relevant method of quantitative analysis has been employed. For the identification of block level literacy rate and gender gap in total, rural and urban literacy rate raw data is converted into the percentage and after that, with help of values of mean and standard deviation all the blocks are arranged into three categories of high, medium and low. Karl Pearson’s technique of co-relation has been applied to examine the relationship between female literacy rate (total,
PP. 95 – 107
EUROPEAN JOURNAL OF BUSINESS AND SOCIAL SCIENCES
97
rural and urban) and the twenty eighty independence variables of socio-economic development. With the help of this technique coefficient of co-relation is estimated for each variables and finally student’s T- test technique have adopted to identify the level of significance of their correlation. At the last results were presented with of suitable maps and diagrams.
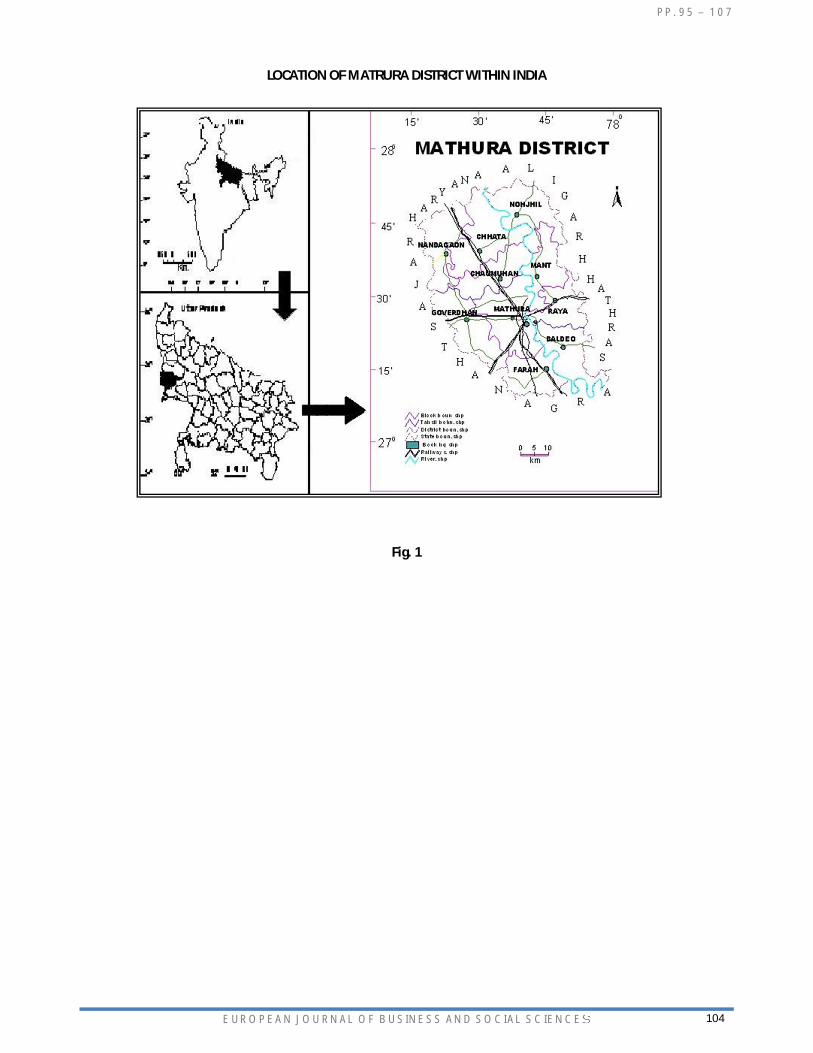
STUDY AREA
Mathura district which is chosen as the study area is located in the western part of Uttar Pradesh. It lies between parallels of latitudes 27014’ north to 27058’ north and its longitudes extension 77017’ east to 77058’ east. It covers a geographical area of 3340 km2 (Fig. 1). The district has been divided into three tehsils - Chhata, Mathura and Mant. These tehsils are further subdivided into ten blocks; they are Nandgaon, Chhata, Chaumuhan, Goverdhan, Mathura, Farah, Baldeo, Mant, Nohjheel and Raya. It lies in the basin of river Yamuna, which flows more or less in the Middle of the district from north to south. Mathura district accounts for 2.07 million population, out of which 54.4 % are males and 45.6 % females (Census, 2001). Only 25.84 % population is living in urban centers. Total literacy rate of the district is 61.5 % which is below the national average (64.8 %). Male literacy rate is 76.5 % and female literacy rate is 43.3 %.
TOTAL LITERACY RATE (2001)
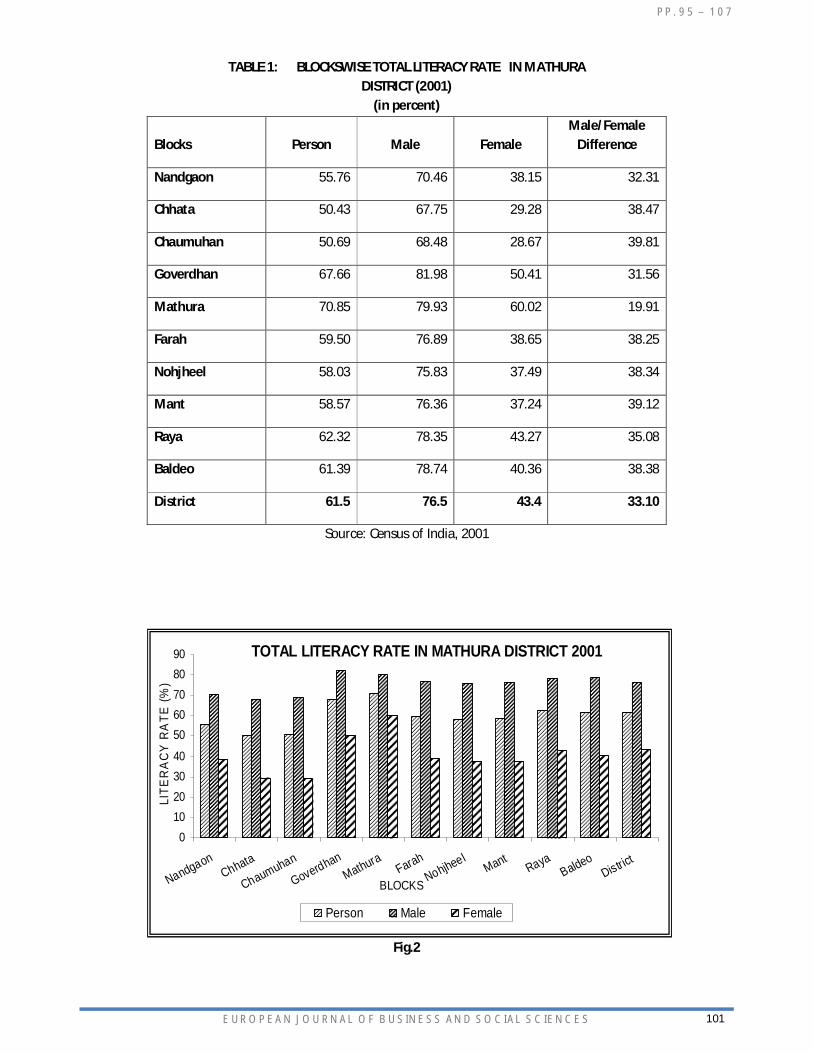
In the year 2001 total literacy rate in the Mathura district is 61.5 percent, which is about 4.14 percent higher than the literacy rate of utter Pradesh (57.36 percent) and nearly 3.3 percent lower than the literacy rate of India (64.8 percent) in the same census. In 2001 male literacy rate is 76.5 percent where as female literacy rate is 43.4 percent. At the block level highest literacy rate is noted in Mathura block about 70.85 percent. As shown in the Table1 the lowest literacy rate is observed in Chhata block (50.43 percent). The distribution of male literacy rate ranges between as high as 81.98 percent in Goverdhan block to as low as 67.75 percent in Goverdhan block. From the Fig. 2 it is noted that highest female literacy rate shown in Mathura block (60.02 percent) and lowest in Chaumuhan (28.67 percent) block.
Gander Gap in Total Literacy Rate
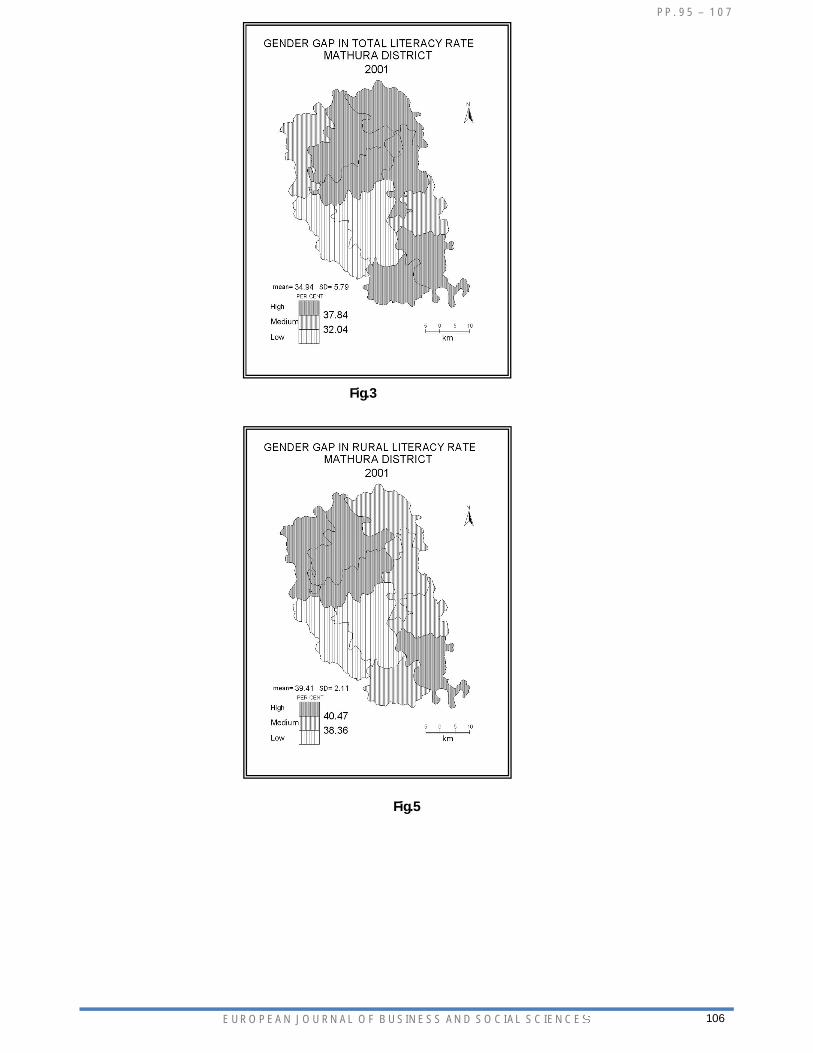
Gender gap in total literacy rate is 33.10 percent during 2001in Mathura district which is 6.5 percent higher than Uttar Pradesh (26.6 percent) and 11.5 percent higher than India (21.6 percent). Gender gap is not homogenous at the block level. It is as low as 19.91 percent in Mathura block to as high 39.81 percent in Chaumuhan block. With help of statistical techniques mean and stander deviation all the blocks of district are divided in to three categories. High grade (37.84 percent and above) is noted in the six blocks. All these the blocks are formed two regions in the study area. One such a region observed in the northern part including Chaumuhan (39.81 percent), Mant (39.21 percent), Chhata (38.47 percent) and Nohjheel (38.34 percent) blocks and other region including Baldeo (38.38 percent) and Farah (38.25 percent) situate in the south-eastern part of the district. Two blocks are noted in medium grade (32.04-37.84 percent) and these blocks are located in two different direction. On such a block Nandgaon (32.3 percent) is in north-western direction and Raya (35.08 percent) in eastern direction of Mathura district. Goverdhan (31.56 percent) and Mathura (19.91 percent) blocks are observed in the low grade (below 32.04 percent) and form a region in center of the district.
RURAL LITERACY RATE (2001)
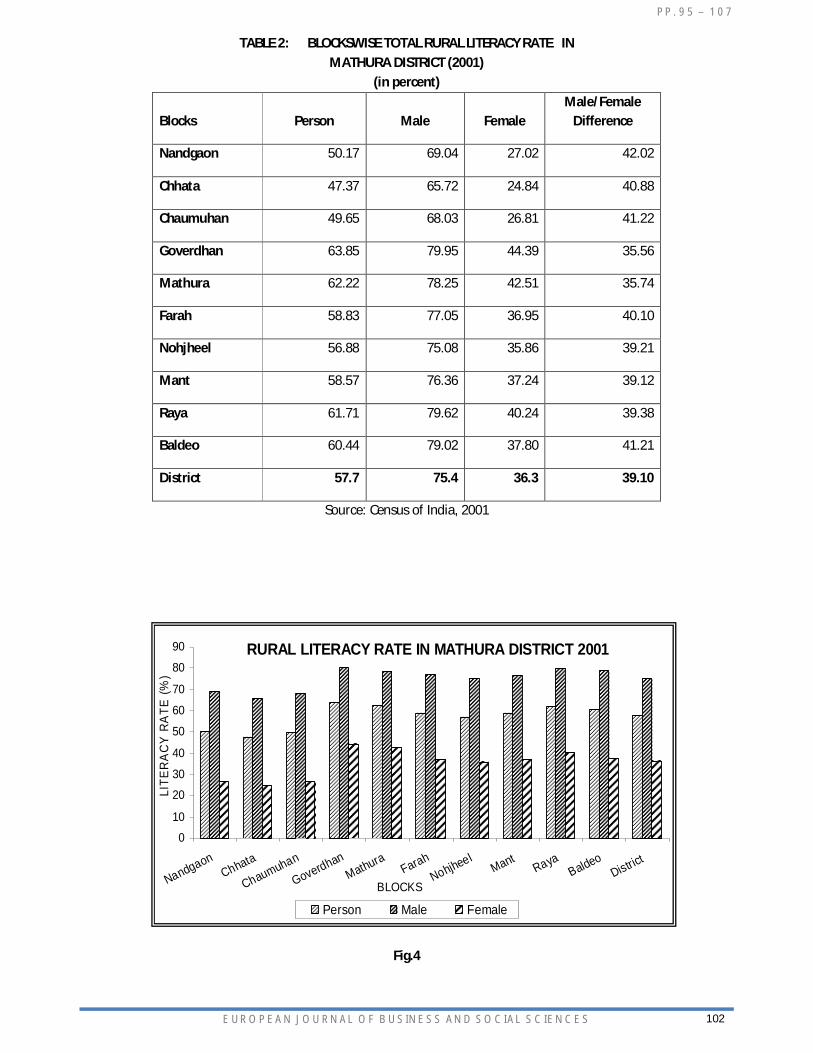
Rural literacy rate in 2001 ranges between 63.85 percent in Goverdhan block to 47.37 percent in Chhata block with average of 57.7 percent in the Mathura district. Male literacy rate is 75.4 percent in the district. The highest percentage of rural male literacy rate is registered in Goverdhan block (79.95 percent) and the lowest observed in Chhata (65.72 percent) block. Table.2.the average rural female literacy rate in 2001 is 36.3 percent more than half of the male rural literacy arte. It is quite surprising that none of the block is crossed even the 50 percent mark in the rural female literacy rate in 2001. As shown in fig. 4 high
PP. 95 – 107
EUROPEAN JOURNAL OF BUSINESS AND SOCIAL SCIENCES
98
percentage of rural female literacy rate noted in Goverdhan (44.39 percent) block on the other side low percentage mark in Chhata block (24.84 percent) block.
Gander Gap in Rural Literacy Rate
The average of gander gap in rural literacy rate is noted 39.10 percent and this is even higher than the rural female literacy rate. All the blocks are arranged into three categories of high (40.47 percent and above), medium (38.36-40.47 percent) and low (below 38.36 percent) percentage. High percent is observed in four blocks and three of them formed a region in the northern part and fourth block is situated in south-eastern part of the district. Blocks of high percentage are arranged in descending order of their percentages as Nandgaon (42.02 percent), Chaumuhan (41.22 percent), Baldeo (41.22 percent) and Chhata (40.88 percent). Blocks of medium percentage are located from north to south in the eastern part of the study area. In includes Nohjheel (39.21 percent), Mant (39.12 percent) and Raya (39.38 percent) blocks. As shown in fig.5, low percentage noted in the Mathura and Goverdhan blocks and both are situated in centre part.
URBAN LITERACY RATE (2001)
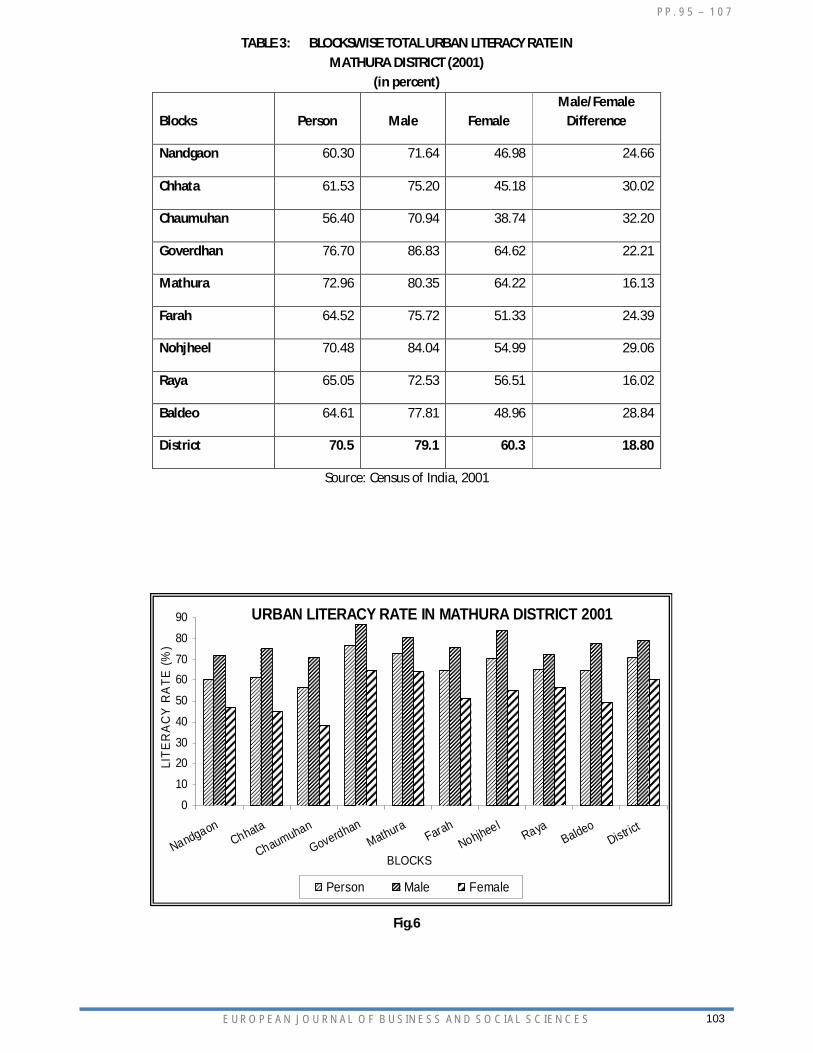
Urban literacy rate is 70.5 percent in Mathura district. Highest percentage of urban literacy rate marked in Goverdhan (76.70 percent) where as lowest percentage marked in Chaumuhan (61.53 percent). In 2001 male urban literacy rate and female urban literacy rate is observed 79.1 percent and 60.3 percent respectively. Male urban literacy rate is ranges between 86.83 percent in Goverdhan block to 70.94 percent in Chaumuhan block where as female urban literacy rate ranges between 64.62 percent in Goverdhan block to 38.74 percent in Chaumuhan block.
Gander Gap in Urban Literacy Rate
Gander gap in urban literacy rate is noted 18.8 percent in the Mathura district. This gap is not equal in all blocks of the district where as the different between highest and lowest is nearly double. It is highest in Chaumuhan (32.20 percent) block and lowest in Raya (16.2 percent) block. Total four blocks are noted in high grade (26.62 percent and above) of gander gap in urban literacy rate. The spatial distribution of these blocks shows that three blocks form a region in the northern part including Chhata (30.02 percent), Chaumuhan (32.20 percent) and Nohjheel (29.06 percent) and one isolated block is marked in south-eastern part of the study area. The blocks of medium grade (17.44- 26.62 percent) formed a continuous chain from north to south in the eastern pert. In this category Nandgaon (24.66 percent), Goverdhan (22.21 percent) and Farah (24.39 percent) blocks. Only two blocks Mathura (16.13 percent) and Raya (16.02 percent) are observed in low grade (17.44 percent). Both these blocks marked in centre part of the district (Fig.7).
FEMALE LITERACY RATE VERSUS VARIABLES OF SOCIO-ECONOMIC DEVELOPMENT
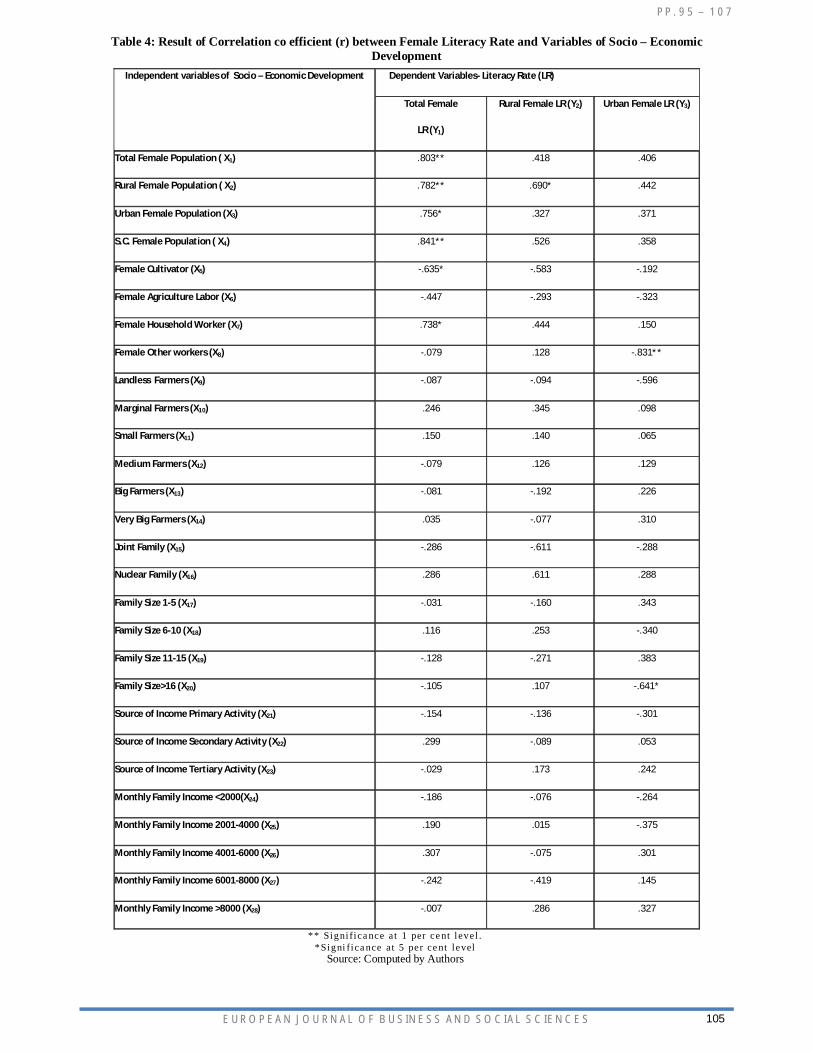
For causal analysis coefficient of correlation is computed between female literacy rate and variables of socio-economic development and t-test is applied to find out level of significant between the independent and dependent variables. Table 5 shows the relationship between the dependent variables (total female literacy rate, rural female literacy rate and urban female literacy rate) and twenty eight independent variables. Total female literacy rate (Y1) is positively correlated with marginal farmers (x10), small farmers (x11), very big farmers (x14), nuclear family (x16), family size 6-10 (x18), source of income secondary activity (x22) and monthly family income 2001-4000 (x25). Beside these variables Y1 positively correlated and significant at 1 percent with total female population (x1), rural female population (x2) and S.C. female population (x4) and significant at 5 percent with urban female population (x3) and female household worker (x7). On the other side total female literacy rate (Y1) is negatively related with female cultivator (x5), female agriculture labor (x6), female other workers (x8), big farmers (x13), family size 11-15 (x19), family size>16 (x20), and source of income primary activity (x21). The relationship between rural female literacy

PP. 95 – 107
EUROPEAN JOURNAL OF BUSINESS AND SOCIAL SCIENCES
99
rate (Y2) is positive with total female population (x1), female household worker (x7), female other workers (x8), marginal farmers (x10), family size 6-10 (x18), source of income tertiary activity (x23), and monthly family income >8000 (x28). As shown in table 4 rural female population (x2) is positively correlated and it is significant at 5 percent level with Y2. Beside this Y2 is negatively related with female cultivator (x5), female agriculture labor (x6), landless farmers (x9), big farmers (x13), joint family (x15)¸ family size 11-15 (x19) and monthly family income <2000 (x24). Third independent variable i.e. urban female literacy rate (Y3) is positively correlated with eighteen independent variables including x1, x2, x3, x4, female cultivator (x5), small farmers (x11), very big farmers (x14) and monthly family income 6001-8000 (x27). Y3 is also negatively related with female cultivator (x5), female agriculture labor (x6), female other workers (x8), source of income primary activity (x21) and monthly family income 2001-4000 (x25).
CONCLUSION
There is an undoubtedly significant difference between male and female literacy rate in Mathura district. Gender gap in literacy is 33.10 percent in the study area. Whereas the male female difference in literacy in rural area is even higher (39.10 percent) than the total literacy rate of female in rural area. On the other hand this problem in urban area is not as the rural area. In urban area gender gap in literacy rate is 18.80 percent. At the block level about 20 percent of gap is noted in gender gap in literacy. In Chaumuhan block the gap in male-female literacy rate is problematic. In this block gender gap in literacy is 39.81 percent for total population, 41.22 percent for rural population and 32.20 percent for urban population. Chhata and Baldeo blocks are also faces same problem of high rate of gender gap in literacy. All these three blocks noted in high percentage of gender gap in total, rural and urban literacy. Mathura is only block which is noted in low percentage of gender gap in total, rural and urban literacy. Result of correlation shows that big farmers and those families mainly engage in primary activities still keep away girls from the schools. Joint family is also gave negative impact on the female literacy.
To fulfill this gap in gender literacy in Mathura district proper educational opportunities should be provide for women especially at the village level. Create an environment where women demand knowledge and information, empowering themselves to change their lives. Literacy campaigns (door to door in villages) have heightened social awareness among women regarding the importance of education, both for themselves as well as for their children. A time frame should be set to eliminate the existing gap between girls and boys, by firstly ensuring universal and equal access to and completion of primary education by all girls. Only then we can stop social discrimination and economic exploitation of our half of the population and fulfill the concept of social justice and achieve social and economic development for society.
ACKNOWLEDGEMENT
The authors are thankful to Prof. Farasat Ali Siddiqui (Chairman, Department of Geography, A.M.U. Aligarh) for his valuable guidance in the preparation of this paper.
PP. 95 – 107
EUROPEAN JOURNAL OF BUSINESS AND SOCIAL SCIENCES
100
References
1. Ann, M. B. and Willam, G. A. (2002), Gender Social Change and Educational Attainment, Economic Development and Cultural, Vol. 5, No.1, pp. 109-134.
2. Bhatty K. (1998), Education deprivation in India: a survey of field investigation, Economic and Political Weekly, July 4 and 18.
3. Glick, P. and David, E. S. (2000), Schooling of girls and boys in a West African Country: the effects of parental education, income and household structure, Economics of Education Review, Vol. 19, pp.63-87.
4. Kambhampati, U.S. and Pal, S. (2001), Role of Parental Literacy in Explaining Gender Difference: Evidence from Child Schooling in India, The European Journal of Development Research, Vol. 13, No. 2, pp.97-119.
5. Knowles. S., Lorgelly, P.K., and Owen, P.D. (2002), Are educational gender gaps a break on economic development? Some cross-country empirical evidence, Oxford Economic Papers, No. 54, pp. 118-149.
6. Lavy, V. (2008), Do Gender Stereotypes Reduce Girls’ or Boys’ Human Capital Outcomes? Evidence from a Natural Experiment, Journal of Public Economics, Vol. 92, No. 10&11, pp. 2083-2105.
7. Mcdougall, L. (2000), Gender Gap in Literacy in Uttar Pradesh; Questions for Decentralized Educational Planning, Economic and Political Weekly, May 6.
8. Mensch, B. and Lloyd, C. (1998). Gender differences in the schooling experiences of adolescents in low income countries: The case of Kenya, Studies in Family Planning, Vol. 29, No. 2. pp.167-184.
9. Odaga, A. and Heneveld, W. (1995), Girls and Schools in sub-Saharan Africa. From Analysis to Action, World Bank Technical Paper – 298, Washington DC: The World Bank.
10. Pal, S. (2004), How much of the Gender Difference in Child School Enrolment Can be Explained? Evidence from Rural India, Bulletin of Economic Research, Vol. 56, No. 2, pp.133-158.
11. Sengupta, P. and Guha, J. (2002), Enrolment, Dropout and Grade Completion of Girl Children in West Bengal, Economic and Political Weekly, Vol.37, pp.1621-1637.
12. Siddiqui, F.A. and Yadav, S. (2005), Health & Educational Development in Aligarh District, The Geographer, Vol. 52, No.2, pp. 6-13.
13. Vaid, D. (2004), Gendered Inequality in Educational Transitions, Economic and Political Weekly, Vol. 39, pp.3927-3938.
14. Yasmeen, N. Siddiqui, F.A. and Khan, K. (2005), Dimensions of Educational Development & Its Correlates in Western Uttar Pradesh , Indian Journal of Regional Science, Vol.37, No.1, pp. 101-110.
PP. 95 – 107
EUROPEAN JOURNAL OF BUSINESS AND SOCIAL SCIENCES
101
TOTAL LITERACY RATE IN MATHURA DISTRICT 2001
010203040
5060708090
NandgaonChhata
Chaumuhan
GoverdhanMathura
FarahNohjheel
MantRaya
BaldeoDistrict
BLOCKS
LITE
RA
CY
RA
TE (%
)
Person Male Female
TABLE 1: BLOCKSWISE TOTAL LITERACY RATE IN MATHURA
DISTRICT (2001) (in percent)
Blocks Person Male Female Male/Female
Difference
Nandgaon 55.76 70.46 38.15 32.31
Chhata 50.43 67.75 29.28 38.47
Chaumuhan 50.69 68.48 28.67 39.81
Goverdhan 67.66 81.98 50.41 31.56
Mathura 70.85 79.93 60.02 19.91
Farah 59.50 76.89 38.65 38.25
Nohjheel 58.03 75.83 37.49 38.34
Mant 58.57 76.36 37.24 39.12
Raya 62.32 78.35 43.27 35.08
Baldeo 61.39 78.74 40.36 38.38
District 61.5 76.5 43.4 33.10
Source: Census of India, 2001
Fig.2
PP. 95 – 107
EUROPEAN JOURNAL OF BUSINESS AND SOCIAL SCIENCES
102
RURAL LITERACY RATE IN MATHURA DISTRICT 2001
0
10
20
30
40
50
60
70
80
90
NandgaonChhata
Chaumuhan
GoverdhanMathura
FarahNohjheel
MantRaya
BaldeoDistrict
BLOCKS
LITE
RA
CY
RA
TE (%
)
Person Male Female
TABLE 2: BLOCKSWISE TOTAL RURAL LITERACY RATE IN MATHURA DISTRICT (2001)
(in percent)
Blocks Person Male Female Male/Female
Difference
Nandgaon 50.17 69.04 27.02 42.02
Chhata 47.37 65.72 24.84 40.88
Chaumuhan 49.65 68.03 26.81 41.22
Goverdhan 63.85 79.95 44.39 35.56
Mathura 62.22 78.25 42.51 35.74
Farah 58.83 77.05 36.95 40.10
Nohjheel 56.88 75.08 35.86 39.21
Mant 58.57 76.36 37.24 39.12
Raya 61.71 79.62 40.24 39.38
Baldeo 60.44 79.02 37.80 41.21
District 57.7 75.4 36.3 39.10
Source: Census of India, 2001
Fig.4
PP. 95 – 107
EUROPEAN JOURNAL OF BUSINESS AND SOCIAL SCIENCES
103
URBAN LITERACY RATE IN MATHURA DISTRICT 2001
0
10
2030
40
50
6070
80
90
NandgaonChhata
Chaumuhan
GoverdhanMathura
FarahNohjheel
RayaBaldeo
District
BLOCKS
LITE
RA
CY
RA
TE (%
)
Person Male Female
TABLE 3: BLOCKSWISE TOTAL URBAN LITERACY RATE IN MATHURA DISTRICT (2001)
(in percent)
Blocks Person Male Female Male/Female
Difference
Nandgaon 60.30 71.64 46.98 24.66
Chhata 61.53 75.20 45.18 30.02
Chaumuhan 56.40 70.94 38.74 32.20
Goverdhan 76.70 86.83 64.62 22.21
Mathura 72.96 80.35 64.22 16.13
Farah 64.52 75.72 51.33 24.39
Nohjheel 70.48 84.04 54.99 29.06
Raya 65.05 72.53 56.51 16.02
Baldeo 64.61 77.81 48.96 28.84
District 70.5 79.1 60.3 18.80
Source: Census of India, 2001
Fig.6
PP. 95 – 107
EUROPEAN JOURNAL OF BUSINESS AND SOCIAL SCIENCES
104
LOCATION OF MATRURA DISTRICT WITHIN INDIA
Fig. 1
PP. 95 – 107
EUROPEAN JOURNAL OF BUSINESS AND SOCIAL SCIENCES
105
Table 4: Result of Correlation co efficient (r) between Female Literacy Rate and Variables of Socio – Economic Development
** Signi fica nce a t 1 per ce nt level . *Signi fica nce a t 5 per ce nt level
Source: Computed by Authors
Independent variables of Socio – Economic Development Dependent Variables- Literacy Rate (LR)
Total Female
LR (Y1)
Rural Female LR (Y2) Urban Female LR (Y3)
Total Female Population ( X1) .803** .418 .406
Rural Female Population ( X2) .782** .690* .442
Urban Female Population (X3) .756* .327 .371
S.C. Female Population ( X4) .841** .526 .358
Female Cultivator (X5) -.635* -.583 -.192
Female Agriculture Labor (X6) -.447 -.293 -.323
Female Household Worker (X7) .738* .444 .150
Female Other workers (X8) -.079 .128 -.831**
Landless Farmers (X9) -.087 -.094 -.596
Marginal Farmers (X10) .246 .345 .098
Small Farmers (X11) .150 .140 .065
Medium Farmers (X12) -.079 .126 .129
Big Farmers (X13) -.081 -.192 .226
Very Big Farmers (X14) .035 -.077 .310
Joint Family (X15) -.286 -.611 -.288
Nuclear Family (X16) .286 .611 .288
Family Size 1-5 (X17) -.031 -.160 .343
Family Size 6-10 (X18) .116 .253 -.340
Family Size 11-15 (X19) -.128 -.271 .383
Family Size>16 (X20) -.105 .107 -.641*
Source of Income Primary Activity (X21) -.154 -.136 -.301
Source of Income Secondary Activity (X22) .299 -.089 .053
Source of Income Tertiary Activity (X23) -.029 .173 .242
Monthly Family Income <2000(X24) -.186 -.076 -.264
Monthly Family Income 2001-4000 (X25) .190 .015 -.375
Monthly Family Income 4001-6000 (X26) .307 -.075 .301
Monthly Family Income 6001-8000 (X27) -.242 -.419 .145
Monthly Family Income >8000 (X28) -.007 .286 .327
PP. 95 – 107
EUROPEAN JOURNAL OF BUSINESS AND SOCIAL SCIENCES
106
Fig.3
Fig.5

PP. 95 – 107
EUROPEAN JOURNAL OF BUSINESS AND SOCIAL SCIENCES
107
Fig.7


![[XLS]xynergy.hkxynergy.hk/attachment/Learning Hub Catalogue_Apr2014.xlsx · Web view92 83 92 62 95 95 83 95 83 62 10 95 10 10 10 10 10 95 97 10 92 10 92 10 95 10 10 95 10 10 95 10](https://img.pdfslide.us/doc/110x75/5a9f35687f8b9a62178c6aa1/xls-hub-catalogueapr2014xlsxweb-view92-83-92-62-95-95-83-95-83-62-10-95-10-10.jpg)