Embed Size (px)
Citation preview

Gender differences in GCSE
Tom Bramley, Carmen Vidal Rodeiro & Sylvia Vitello
Cambridge Assessment Research Report
20th October 2015
2
Author contact details:
ARD Research Division
Cambridge Assessment
1 Regent Street
Cambridge
CB2 1GG
http://www.cambridgeassessment.org.uk/
Cambridge Assessment is the brand name of the University of Cambridge Local Examinations
Syndicate, a department of the University of Cambridge. Cambridge Assessment is a not-for-profit
organisation.
How to cite this publication:
Bramley, T., Vidal Rodeiro, C.L., & Vitello, S. (2015). Gender differences in GCSE. Cambridge
Assessment Research Report. Cambridge, UK: Cambridge Assessment.

3
Introduction
This report presents some analysis of gender1 differences in examination outcomes, focussing
mainly on GCSEs taken in England. This is a topic of perennial interest, because it connects with
a number of issues, including:
Gender equality in the workplace (opportunity and remuneration);
The proportion of women in STEM related jobs;
Gender choices and outcomes in subjects studied at HE level;
Gender stereotypes;
Whether there are gender differences in cognitive ability, and the role of genes and the
environment in creating or maintaining them;
Whether certain types of school structure (e.g. single-sex schools), curriculum, teaching
style or assessment style are better suited to one or other gender;
Whether there are ‘gender gaps’ in exam performance and whether such gaps are closing
or widening.
We start by briefly summarising recent research on gender differences in cognitive ability and
achievement in academic examinations. The bulk of the report presents some analysis of gender
differences in subject choice and examination outcomes, mainly at GCSE.
Background
A large proportion of research on gender differences in cognitive ability and educational attainment
has focused on mathematics, verbal performance and the cognitive abilities related to them.
Mathematics and related abilities
Historically, the widely held view is that males outperform females in tests of mathematical ability
(Halpern, 1986; Hill, Corbett, & St Rose, 2010; Hyde, Fennema, & Lamon, 1990). Early reviews of
empirical research in this field concluded this was a “robust” finding (Halpern, 1986, p. 57) or, at
least, it was one of several “fairly well-established” gender differences (Maccoby & Jacklin, 1974,
p. 352). Although subsequent formal analyses of these data indicated that gender differences in
mathematical ability were often small in size (Hyde et al., 1990), recent research continues to show
some differences but they vary according to certain factors, including level of mathematical ability,
type of mathematical ability and examination format.
There is little evidence of a male advantage in high school mathematics tests in either the US or
the UK. In the US, “trivial differences” between boys’ and girls’ mathematics results have been
found in all school years between Grade 2 (7–8 year olds) and Grade 11 (16–17 year olds) (Hyde,
Lindberg, Linn, Ellis, & Williams, 2008). At the end of high school, it is girls who have been
achieving, on average, higher Grade Point Average points (in mathematics and science combined)
than boys since at least the 1990s (Hill et al., 2010). Similarly, the UK Department for Education
and Skills’ (2006) report on gender and education emphasises a female advantage amongst
students gaining an A*-C grade in GSCE mathematics in England, although this pattern has
changed from the pre-1991 pattern when males outperformed girls (DfES, 2006a). Despite a
female advantage in school results, males in the U.S show a persistent trend to perform better in
high-stakes examinations such as in the mathematics sections of the SAT and ACT examinations
which are taken for entry to universities in the U.S (Hill et al., 2010). Recent international
standardised tests examining 10-11 year-old (TIMSS), 13-14 year-old (TIMSS) and 15 year-old
1 In fact these are sex differences but we follow the usual practice of describing them as gender differences. When
describing data from GCSEs and A levels we use ‘boys’ and ‘girls’ but in some other contexts we use ‘males / females’ as appropriate.

4
(PISA) performance show inconsistent gender differences across countries, although most
countries either show a male advantage or no gender difference.
There is more consistent evidence that, if there is a male advantage for mathematics, it occurs
amongst the high achievers rather than throughout the continuum of ability levels. For several
decades, males have been overrepresented amongst high mathematics performers in high-stakes
mathematics in the U.S, although the male to female ratio has decreased over time and has
stabilised to a much lower rate since the 1990s (Miller & Halpern, 2014; Wai, Cacchio, Putallaz, &
Makel, 2010). Male overrepresentation has also been found amongst 15 year olds who were high
mathematics achievers in the PISA 2012 international test in most countries and economies that
took part (OECD, 2014). In contrast, this gender gap was not found for science performance. The
PISA results also showed that the proportion of girls was marginally larger amongst the lowest
mathematics achievers.
Several reasons have been proposed to explain why males outperform females in certain
mathematics tests but not others and why this advantage is found especially amongst high
achievers. Spelke (2005) argues that gender differences could result from a sample bias; for
example if fewer boys take a particular test they may represent a more selective (i.e., higher
achieving) sample than the girls who take the test. Gender differences may also arise at test level
because tests “consist of a variety of items assessing a complex mix of capacities and strategies”
that vary differentially favour boys compared to girls depending on their composition (Spelke, 2005,
p. 954). This hypothesis is supported by empirical evidence showing that boys and girls outperform
each other on different mathematical operations and related cognitive abilities. Researchers have
highlighted various trends in the literature, including that males tend to perform better on certain
spatial ability tasks, mental rotation, reasoning and problem-solving tasks, geometry, trigonometry
and statistics while females tend to perform better on algebra and test items that require
understanding numerical patterns or representing quantities and quantifiable attributes of objects
(Ceci, Williams, & Barnett, 2009; Liu & Wilson, 2009; Miller & Halpern, 2014). In addition, the
format of the mathematic question may have an impact; for example Liu and Wilson (2009) note
that males have been found to perform better with “word problems involving the applications of
mathematical theories”, while females perform better on “items purely presented by formulas,
equation, or theory” (p.167). Girls also have a tendency to perform better in solving conventional
problems based on textbook content, while boys deal better with unconventional items, which may
disadvantage girls on large-scale standardised tests that do not follow the content of textbooks
studied at school (Gallagher & De Lisi, 1994; Liu & Wilson, 2009).
Some of these differences may relate to the use of differential strategies to solve the mathematics
problems (Liu & Wilson, 2009; Spelke, 2005) such as the preference for females to use
conventional text-based strategies (Gallagher & De Lisi, 1994), which may produce an advantage if
tests are answered more effectively by certain strategies.
In addition, a particular concern for mathematics (and other subjects) is the impact of test format
on gender differences. Test format may affect the magnitude and direction of gender differences.
There is some evidence that boys perform better on multiple-choice tests than free-response tests
(DeMars, 1998, 2000). This pattern, however, has sometimes been found only amongst high
achievers (DeMars, 1998) or has not been replicated (Liu & Wilson, 2009).
While the above explanations related to test-construction are important in understanding why
certain mathematics tests might produce gender differences, they do not explain why these
differences occur. Recent reviews have highlighted that performance in mathematical or related
cognitive ability tests are, to some extent, explained by biology (e.g., hormones affecting mental

5
rotation), environment (e.g., video gaming affecting mental rotation), psychology (e.g., lower self-
confidence in mathematics amongst girls) and social factors (e.g., negative gender stereotypes
affecting girls’ performance) (Hyde, 2014; Miller & Halpern, 2014; OECD, 2015).
Verbal and related abilities
Early reviews of the literature on gender differences in verbal abilities concluded that this is an
domain of female superiority (Maccoby & Jacklin, 1974). In a recent review, Hyde (2014) argues
that this conclusion has not been strongly supported by formal meta-analyses of the data, which
generally have shown only small differences, although they still favour females (Hedges & Nowell,
1995; Hyde & Linn, 1988).
Miller and Halpern (2014), in contrast, call for another re-examination of the magnitude of gender
differences in verbal ability in light of PISA test results that have shown a consistent, moderately
large female advantage in reading across numerous countries. International standardised tests of
reading performance for 9-10 year olds (PIRLS), 11-12 year olds (PIRLS) and 15 year olds (PISA)
have found female superiority in reading in almost all countries that have taken part (Mullis, Martin,
Foy, & Drucker, 2012; OECD, 2014). PISA 2012 data has shown that this gender gap has
increased in 11 countries between 2000 and 2012s (OECD, 2014). The PISA data has also shown
that the gender gap exists amongst both high and low achievers, with fewer boys achieving high
reading proficiency scores and a larger proportion not achieving basic levels of reading literacy. In
the UK, governmental attention has been drawn to the underperformance of boys’ writing test
scores, especially since the introduction of the national tests which showed girls substantially
outperforming boys in writing scores (HMI, 2000). The government has published specific advice
on how to improve boys’ writing (DfES, 2006b). However, recent Ofsted (2012) and DfE (2012)
reports on English standards, have still reported that girls perform better than boys across all
phases and levels of primary and secondary education.
Gender differences in verbal ability have not always been found. No gender difference is any
longer found in sub-tests of high-stake U.S university admission exam that measure vocabulary
and reading comprehension (SAT-Verbal and ACT-R) (Ceci et al., 2009; Wai et al., 2010),
although sub-tests of writing ability (SAT-W) and verbal reasoning ability (ACT-E) have shown
female advantages (Wai et al., 2010).
Miller and Halpern (2014) discussed potential biological (e.g., brain lateralisation and hormones),
psychological and social reasons (e.g., gender stereotypes) for gender differences in verbal
abilities but the evidence is not as convincing and/or more complex than it is for mathematics (e.g.,
they are counterintuitive such as negative stereotypes improving males’ verbal performance).
Clearer understanding of potential reasons for gender differences in reading has come from the
OECD’s PISA 2012 study. The OECD (2015) administered questionnaires to students taking part
in the PISA 2012 administration which has revealed potential environmental and motivational
differences between boys and girls that might explain their differences in reading performance. In
particular, boys reported spending less time doing homework and were more likely to have
negative attitudes towards school across most countries and economies.
Variability in cognitive ability and achievement tests
Strand, Deary, and Smith (2006) note that most studies have focused on the average performance
of males and females but it is also important to assess the variability of performance . There is
converging evidence showing that males are more variable in their scores than females in a variety
of cognitive and achievement tests (Hedges & Nowell, 1995; Strand et al., 2006).

6
GCSE and A-level attainment
Research examining the existence of gender differences in secondary school achievement has
consistently revealed a female advantage across a range of subjects. In one of the earliest
investigations of gender differences in secondary school attainment, Murphy (1980) reported that
females achieved higher pass rates than males in all years between 1951-1977 in GCE O-level
and A-level (combining performance in 13 subjects). The female advantage has been
demonstrated in more recent research. Meadows (2003) examined gender effects in seven
Advanced Subsidiary (AS) specifications across a variety of subjects: biology, psychology,
English, ICT, mathematics, history and general studies. Females performed significantly better
than males in all specifications except mathematics, which showed no significant gender
difference. More recently, Sammons et al. (2014) showed similar gender differences in the results
of a longitudinal study funded by the Department for Education (DfE) that examined a sample of
students from primary through to the end of secondary school. The results showed that female
students achieved higher total GCSE scores, were more likely to achieve 5 A*-C, 5 A*-C including
English and maths and the EBacc, and were also entered for more full GCSEs than male students.
Despite those overall differences, different gender gaps were found between GCSE English and
mathematics. Females outperformed males in GCSE English by, on average, half a grade, which
continued the female advantage in reading and English found at younger ages. In contrast, no
gender differences were found in GCSE mathematics, although females had better mathematics
and science outcomes in primary school. Various researchers have emphasised that effects of
gender on GCSE performance are small in comparison to other factors. For example, Sammons et
al. (2014) reported that gender effects on GCSE results were smaller compared to effects of other
factors such as parents’ qualifications, family socio-economic status, family income and ethnic
heritage. This supports the results of an earlier study looking at GCSE performance between 1997
and 2001, which showed that social class and ethnicity had a greater impact on the GCSE
attainment than gender (Connolly, 2006). One striking example was highlighted by Connolly (2006)
who reported that “while girls have been about one and a half times more likely to gain five or more
GCSE grades A*-C than boys, those from the highest social class backgrounds have been
between five and nine times more likely than those from the lowest social class backgrounds.” (p.
14). Oates (2007) further argues that there is considerable overlap in GCSE marks between boys
and girls which is “more substantial than the difference” (p. 2).
Furthermore, various studies have found that gender differences in GCSE and A-level performance
are moderated by several factors. Sammons et al. (2014) found some evidence of an interaction
between gender and the quality of the pre-school students attended, which suggested that “male
students’ attainment in GCSE English may be more sensitive to the quality of the pre-school” (p.
86). There is some evidence that secondary school type may also affect gender differences in
terms of whether the schools are same-sex or co-education. However this conclusion was not
supported in a review of UK and US research in which Smithers and Robinson (2006) concluded
that “comparisons of girls’ and boys’ achievement by school type come out more often in favour of
single-sex schools…but the differences tend to be small and inconsistent and open to other
explanations, for example, the ability and social background of the pupils” (p. 10).
As with tests of mathematic ability discussed above, the magnitude and direction of gender
differences in GCSE and A-level (or equivalent) examinations have been found to be influenced by
the type of content and format of the examinations. In a study examining GCSE science questions,
Bell (2001) found gender differences on questions that required the retrieval of declarative
knowledge but not on those that required scientific procedural knowledge. In addition, the direction

7
of this gender difference was found to vary according to the subject such that boys had an
advantage in certain physics contexts whereas females had an advantage in the context of human
biology.
Moreover, a set of early research found that changes to the format of GCE examinations can alter
the pattern of gender differences within the same subject. In particular, Murphy (1980) found that a
change to a Geography O-level syllabus in 1977 increased the male advantage in Geography O-
level to the extent that the percentage of male students who obtained a C or above changed from
being 1% to 10% higher than that of female students. This difference was driven by the
introduction of an objective tests paper on which male students were found to perform even better
than written papers when compared to girls. Murphy (1980) suggested that “one possible
explanation for this particular sex difference manifestation in academic performance is the lower
emphasis on verbal ability in objective test papers, as compared with more conventional written
papers” (p. 176). This male advantage on objective test papers was supported in a subsequent
study that examined GCE examinations in a large proportion of 16 subjects (Murphy, 1982). As for
female advantages, there is a widespread belief that females’ superior performance in certain
subjects is due to the introduction of coursework in GCE/GCSE qualifications. Although there is
some evidence that females perform better on coursework than males, there is more converging
evidence that strongly suggests that coursework cannot fully explain the increase in female
performance (Elwood, 1999; Oates, 2007).
Data analysis
For many of the presentations of results in this report we have grouped the different examination
subjects into the following areas, using the categorisation scheme described in Bramley (2014):
– STEM subjects: Science, Technology, Engineering and Mathematics
– Humanities subjects: those where knowledge, skills and understanding are expressed
mainly through extended writing
– Languages: subjects requiring learning some of the grammar and vocabulary of a different
language to English
– Applied subjects: those where knowledge, skills and understanding lead more directly to
jobs or job-related further study
– Expressive subjects: those where knowledge, skills and understanding are expressed
mainly through performances or artefacts.
Of course, there are inevitable difficulties in applying any such categorisation scheme because for
some subjects a case could be made for different categorisations (e.g., psychology, economics).
But given the large number of different examinations available it is helpful to have some way of
grouping them for presentation purposes. We hope that the categorisations are reasonably
plausible.
The analyses consider gender differences in subject choice and in examination outcome. The
former is simply represented by the proportion of boys entering an examination2. Quantifying the
latter is more problematic. The reported outcome of GCSE and A-level examinations is a grade
(A*, B, C, etc.), and so it seems natural to report differences in the proportion or percentage of
boys and girls achieving at or above a particular grade (e.g. at GCSE, differences in the proportion
or percentage achieving a grade C or better). These differences traditionally form the basis of most
discussions of gender differences in exam outcomes, and for some of the analyses, where the only
information we have is the grade obtained, this is what we report. However, this is not an ideal
2 And the proportion of girls is hence 1-p(boys).

8
metric for exploring gender differences, for several reasons. First, the grades are relatively crude
categorisations applied to a more finely divided underlying mark scale. For some questions of
interest (such as the proportions of boys or girls at the extremes of the distribution) it can be more
informative to consider the underlying mark scale instead of the grades. Second, the difference in
cumulative proportion or percentage achieving a grade is a ‘vertical’ measure of difference in
performance which can be very dependent on where the grade boundaries are in relation to the
distribution of scores on the underlying mark scale (see Holland, 2002). This makes it difficult to
compare across subjects where the grade distributions are different. It also makes it particularly
difficult to draw conclusions about changes in ‘gaps’ over time (for example Ho (2008) illustrates
how a situation where both boys and girls increase underlying scores by exactly the same amount
can lead to conclusions about the gender gap both widening and narrowing, depending on where
the grade boundary is).
For this reason, for some of our analyses we used data from OCR where we could obtain the
scores on the underlying mark scale, and instead of considering differences in the proportion or
percentage achieving a particular grade or better we calculated the ‘probability of superiority’
statistic (see for example Ruscio & Gera, 2013). This can be interpreted as the probability that a
randomly sampled boy would have a higher score than a randomly sampled girl, with the
(hypothetical) sampling coming from the actual distribution of scores on the exam. This is a very
convenient measure of difference because it is relatively easy to calculate and communicate, and it
is ‘scale-free’ both in the sense that examinations with mark scales of different lengths can be
compared and also in that effect sizes can be compared with those found in completely different
attributes, such as height, which helps with interpreting the findings. Further analyses also
considered the mean and standard deviation (SD) of scores on the underlying mark scale.

9
1. Subject choice at GCSE (all boards)
The first area we explored was the proportion of boys and girls taking GCSEs in the different
subjects. The data source was the National Pupil Database (NPD)3.
We took data from the first year the NPD was available (2005) and the most recent year (2014) for
comparison. Note that some syllabuses available in 2005 were not available in 2014 and vice
versa. Figures 1.1 to 1.5 show the percentage of boys in the entry in each of the five categories,
with subjects ordered vertically by the proportion of boys in the entry in 2005. The reference line at
50% is for visual convenience – subjects to the right of this line had a greater proportion of the
entry from boys; those to the left had a greater proportion of the entry from girls. Table A1 in
Appendix A gives the data on which Figures 1.1 to 1.5 were based.
Figure 1.1: Percentage of exam entry that were boys in STEM subjects at GCSE in 2005 and
2014.
The most salient features of Figure 1.1 are that in the vast majority of cases the proportion of boys
in the entry for STEM GCSEs was greater than that of girls; and that in 2014 the proportion of boys
and girls taking single sciences (Physics, Chemistry and Biology) was much more similar than in
2005, when a greater proportion of the entry was from boys. Applied Engineering and Computer
Studies/Computing in 2014 had the largest proportion of the entry from boys (these two subjects
were not available in 2005).
3 The NPD, which is compiled by the Department for Education, is a longitudinal database for all children in schools in
England, linking student characteristics to school and college learning aims and attainment.

10
Figure 1.2: Percentage of exam entry that were boys in Humanities subjects at GCSE in 2005 and
2014.
Figure 1.2 shows the majority of the entry for Psychology and Sociology came from girls, but that
differences in other subjects were smaller. Where the same subject appeared in both 2005 and
2014 it was usually the case that the percentage of boys and girls was more similar in 2014 than in
2005. The exception was English, but there were large changes in the entry for this subject
between the two years. In 2005, GCSE English (a combination of language and literature) and
GCSE English Literature were available. The majority of the students took English only. In 2014,
three subjects were available: GCSE English, GCSE English Language and GCSE English
Literature. Most of the cohort took both English Language and English Literature, and a small
percentage continued with English.

11
Figure 1.3: Percentage of exam entry that were boys in Language subjects at GCSE in 2005 and
2014.
12
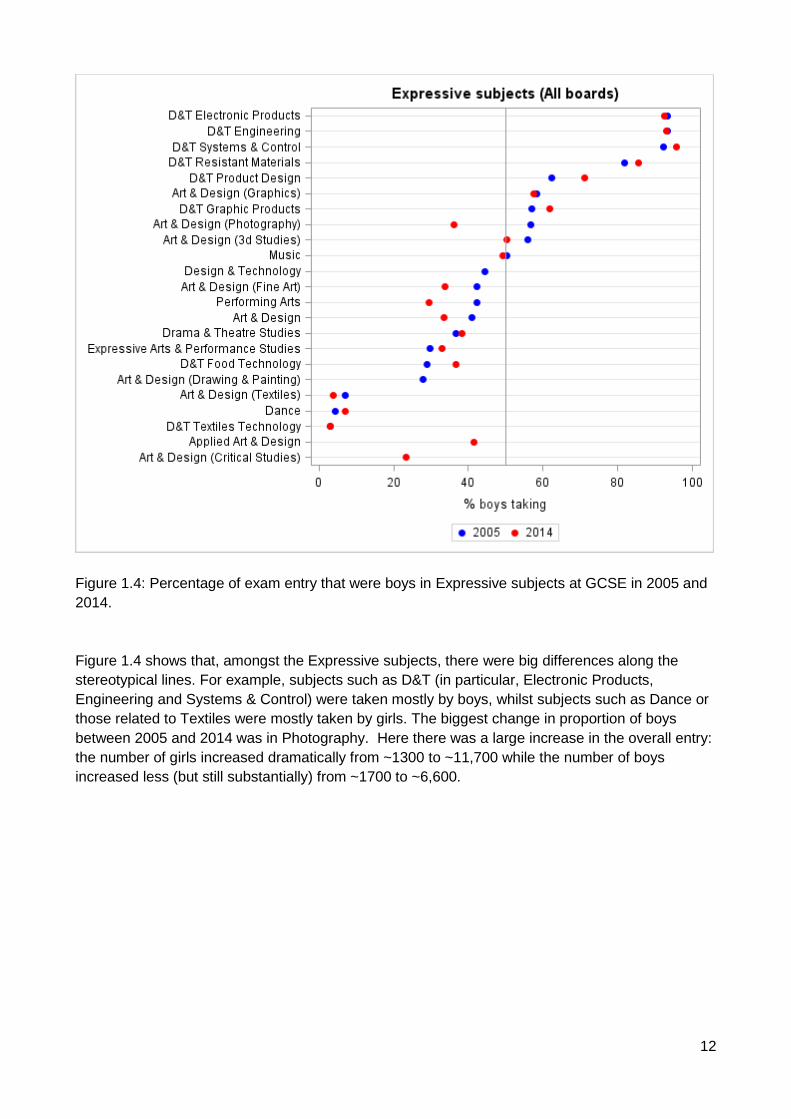
Figure 1.4: Percentage of exam entry that were boys in Expressive subjects at GCSE in 2005 and
2014.
Figure 1.4 shows that, amongst the Expressive subjects, there were big differences along the
stereotypical lines. For example, subjects such as D&T (in particular, Electronic Products,
Engineering and Systems & Control) were taken mostly by boys, whilst subjects such as Dance or
those related to Textiles were mostly taken by girls. The biggest change in proportion of boys
between 2005 and 2014 was in Photography. Here there was a large increase in the overall entry:
the number of girls increased dramatically from ~1300 to ~11,700 while the number of boys
increased less (but still substantially) from ~1700 to ~6,600.

13
Figure 1.5: Percentage of exam entry that were boys in Applied subjects at GCSE in 2005 and
2014.
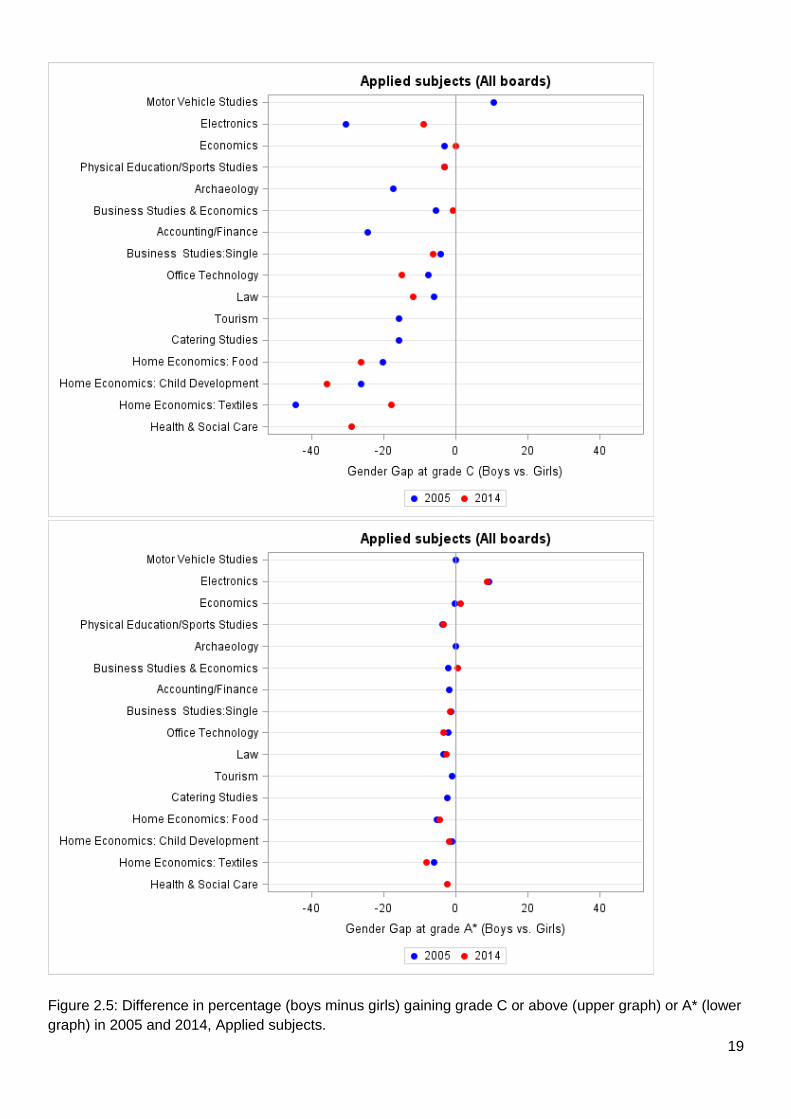
As for the Expressive subjects, Figure 1.5 shows that amongst the Applied subjects there were
also big differences along stereotypical lines. For example, subjects such Motor Vehicle Studies or
Electronics were taken mostly by boys, whilst subjects such as Home Economics or Health and
Social Care were mostly taken by girls.

14
2. Subject outcomes (grades) at GCSE
Figures 2.1 to 2.5 are the counterparts of Figures 1.1 to 1.5, showing the same subjects in the
same order (i.e. vertically ordered by the proportion of boys taking the subject in 2005). Tables 2.1
and 2.2 summarise the information in the graphs. The graphs show the difference in the
percentage (boys minus girls) gaining a grade C or above (upper graph) or A* (lower graph) in
2005 and 2014. That is, if in subject X 12% of the boys got a grade C or above and 10% of the
girls got a grade C or above, the dot for that subject would be at a value of +2 percentage points.
The vertical line at 0 thus represents subjects where the same proportion of boys and girls
achieved at or above the grade in question. Subjects to the right of the line are those where the
‘gender gap’ was in favour of boys; those to the left of the line where the ‘gender gap’ was in favour
of girls.
The graphs show that:
– Girls tended to do better than boys in all GCSEs, regardless of whether it was a subject
where the entry was predominantly from boys or girls;
– The difference (gender gap) in percentage points was greater at grade C and above
(around 10.5) than at grade A* (around 3.0);
– The gender gap was generally smaller in STEM and Language subjects (around 5
percentage points at grade C) and greater in Applied, Expressive and Humanities subjects
(around 14 percentage points at grade C);
– In most subjects the gap tended to be slightly wider in 2014 than it was in 2005 (noting the
caveat mentioned earlier about interpreting changes in gaps with this metric), but this
varied within and between categories.
– The only subjects in 2014 where there was a higher percentage of boys than girls at both
grade C and grade A* were ‘Applications of Mathematics’ and Arabic, taken by ~11,600
and ~1,700 candidates respectively.

15
Figure 2.1: Difference in percentage (boys minus girls) gaining grade C or above (upper graph) or A* (lower
graph) in 2005 and 2014, STEM subjects.

16
Figure 2.2: Difference in percentage (boys minus girls) gaining grade C or above (upper graph) or A* (lower
graph) in 2005 and 2014, Humanities subjects.

17
Figure 2.3: Difference in percentage (boys minus girls) gaining grade C or above (upper graph) or A* (lower
graph) in 2005 and 2014, Language subjects.

18
Figure 2.4: Difference in percentage (boys minus girls) gaining grade C or above (upper graph) or A* (lower
graph) in 2005 and 2014, Expressive subjects.
19
Figure 2.5: Difference in percentage (boys minus girls) gaining grade C or above (upper graph) or A* (lower
graph) in 2005 and 2014, Applied subjects.

20
Table 2.1: Average gender gap at grade C and above (percentage points) in subjects with an entry
of 500 or more4.
Category Year N Mean SD Minimum Maximum
Applied 2005 11 -12.56 9.75 -30.42 -3.15
2014 10 -13.66 12.57 -35.69 -0.07
Expressive 2005 19 -17.09 7.21 -32.31 0.44
2014 19 -16.95 8.46 -35.41 -0.11
Humanities 2005 12 -9.83 4.65 -15.34 -1.90
2014 15 -12.50 4.48 -20.76 -5.72
Languages 2005 14 -6.34 5.89 -13.96 3.03
2014 15 -5.65 5.72 -19.04 1.87
STEM 2005 12 -3.28 3.06 -8.08 1.30
2014 15 -4.13 4.87 -15.20 4.02
All 2005 68 -10.43 8.12 -32.31 3.03
2014 74 -10.71 8.83 -35.69 4.02
Table 2.2: Average gender gap at grade A* (percentage points) in subjects with an entry of 500 or
more.
Category Year N Mean SD Minimum Maximum
Applied 2005 11 -1.16 3.78 -5.32 9.35
2014 10 -0.89 3.79 -4.38 8.66
Expressive 2005 19 -3.82 1.52 -6.74 -0.14
2014 19 -5.17 3.48 -10.94 3.74
Humanities 2005 12 -2.54 1.74 -5.41 1.09
2014 15 -3.42 2.87 -9.28 2.60
Languages 2005 14 -2.75 5.90 -11.82 13.85
2014 15 -6.09 7.78 -24.49 4.73
STEM 2005 12 -1.13 1.38 -4.16 1.26
2014 15 -0.28 4.71 -5.70 15.40
All 2005 68 -2.47 3.38 -11.82 13.85
2014 74 -3.43 5.23 -24.49 15.40
4 Figures 2.1 to 2.5 include subjects with fewer than 500 entries. The restriction was applied here for consistency with
Section 3, and to avoid the values in Tables 2.1 and 2.2 being distorted too much by outliers from small-entry subjects.

21
3. Subject outcomes (scores) at GCSE (OCR specifications with more than 500 entries)
As noted above, grades are not always the best metric for analysing gender differences. Figures
3.1 to 3.5 and Table 3.1 show the probability of superiority p(sup) for boys in 2014 in OCR
specifications with an entry of more than 500. The graphs are vertically ordered by the proportion
of boys in the entry, with the specification with the highest proportion of boys at the top and the one
with the lowest proportion of boys at the bottom. If the confidence bars do not overlap the vertical
reference line at 50% then the value is ‘statistically significant’ in the sense that if the exam scores
were a random sample from a population of scores where p(sup) for boys was 50% there would be
a probability of less than 5% of obtaining a result as far from 50% as the one observed. This is
arguably not relevant since the data represent the entire population taking the exam and not a
random sample. However, the confidence bars are longer where the entry size was smaller so are
perhaps useful aids to interpretation (for example if entries from different years are conceived as
samples from a hypothetical population). The underlying score scale from which the p(sup) was
calculated was either the Uniform Mark Scale (UMS) for exams with a ‘modular’ assessment
structure, or the weighted aggregate mark for exams with a ‘linear’ assessment structure5.
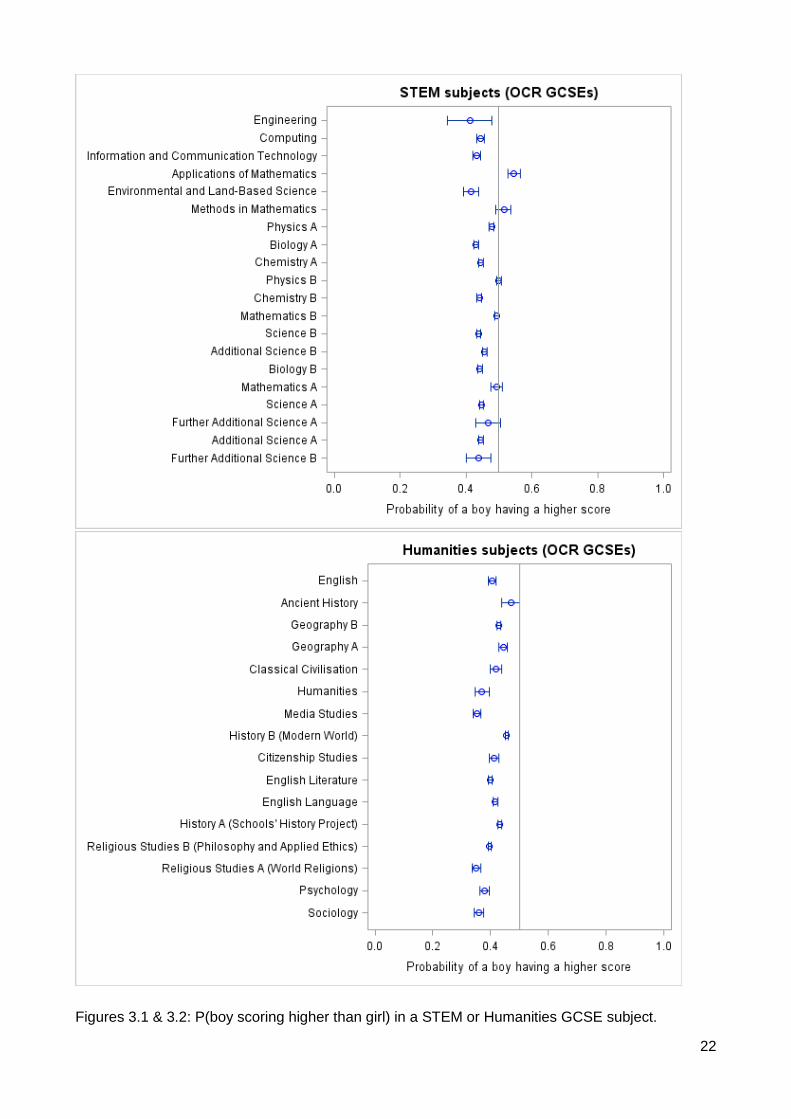
Similarly to the results presented in Section 2, Figures 3.1 to 3.5 and Table 3.1 show that girls
tended to do better than boys in all subjects (the only two exceptions were Applications of
Mathematics and Methods in Mathematics which had entries of ~3,000 and ~2,500 respectively).
Also, in STEM subjects the probability of superiority at 0.46 on average was closer to 0.5 than in
other types of subjects (which would imply that there was less difference between the performance
of boys and girls). The greatest difference between boys and girls was in Expressive subjects,
where the average p(sup) was 0.35. The ordering of p(sup) across the five categories is the same
as the order of the gender gap in percentage points at grade C and above using the full NPD data.
5 For more information about how UMS scores are calculated, see AQA (2013). In modular assessments, modules
(units) can be taken throughout the course, and the UMS result ‘banked’. In linear assessments all the examination components are usually taken at the end of the course.
22
Figures 3.1 & 3.2: P(boy scoring higher than girl) in a STEM or Humanities GCSE subject.

23
Figures 3.3 & 3.4: P(boy scoring higher than girl) in a Language or Expressive GCSE subject.

24
Figure 3.5: P(boy scoring higher than girl) in an Applied GCSE subject.
Table 3.1: Average p(boy scoring higher than girl) by category.
Category N Mean SD Minimum Maximum
Applied 12 0.40 0.07 0.27 0.48
Expressive 14 0.35 0.05 0.27 0.46
Humanities 17 0.41 0.04 0.35 0.50
Languages 10 0.42 0.03 0.36 0.45
STEM 20 0.46 0.03 0.41 0.55
All 73 0.41 0.06 0.27 0.55

25
Contextualising the effect size of the gender difference in examination scores
As mentioned previously, one advantage of the p(sup) statistic is that it is scale-free, allowing
comparison with differences on other metrics. In order to provide a comparator for the p(sup)
values shown in Figures 3.1 to 3.5, we downloaded data from the World Health Organisation
(WHO) website on the heights of children by age in months6. We first verified that approximating
height distributions by assuming normality with the given mean and standard deviation (SD) did not
materially affect calculation of p(sup) compared to using more detailed information about the
centiles of the distribution. We then calculated p(sup) for different differences in age or gender for
comparison with effects from examination scores.
The probability of a randomly sampled boy aged 16 years and 3 months being taller than a
randomly sampled girl of the same age is 0.86, (and hence the probability of being shorter is 0.14).
This is clearly a much bigger gender difference than in examination scores, where the average
across all 73 OCR specifications with an entry of 500+ was 0.41. In terms of height, a p(sup) of
0.41 corresponds to the difference in height between boys in Year 11 who differ in age by around 9
months7 – 2.5 cm. It is therefore not a particularly large difference in the sense of likelihood of
being visible to the naked eye.
Age differences within the school year are also related to academic achievement, with the
disadvantage of ‘summer borns’ the usual focus of the debate (see for example Sykes et al., 2009;
Crawford et al., 2013). For comparison purposes we divided our OCR GCSE data into two groups:
those born in the first six months of the academic year (i.e. September to February) and those born
in the last six months (i.e. March to August). Including only those students who were in Year 11 at
the time of taking their GCSEs we again calculated p(sup) for those born in the last six months.
The graphs in Appendix B show a consistent but small effect of month of birth. Across 68
specifications with an entry of 500+ the average p(sup) for those born in the second half of the
academic year was 0.48. This corresponds to the difference in height between boys in Year 11
who differ in age by two months (0.5 cm) – an effect that definitely would not be visible to the
naked eye.
Gender differences in variability of scores
As noted in the background section, it has often been found that the variability of male scores on
cognitive tests is greater than that of female scores.
Table 3.2: Relative size of mean and SD of boys’ and girls’ scores (OCR GCSEs June 2014,
specifications with an entry of 500+).
STEM Humanities Languages Expressive Applied All
Boys higher mean boys higher SD 2 0 0 0 0 2
Boys higher mean girls higher SD 0 1 0 0 0 1
Girls higher mean boys higher SD 15 14 8 10 5 52
Girls higher mean girls higher SD 3 2 2 4 7 18
Girls higher mean 18 16 10 14 12 70
Boys higher SD 17 14 8 10 5 54
All 20 17 10 14 12 73
6 http://www.who.int/growthref/who2007_height_for_age/en/
7 Specifically, the difference in height between boys aged 16 years and 3 months, and those aged 15 years and 6
months.

26
Table 3.2 shows that boys’ scores had a higher SD than girls’ scores in 54 out of 73 specifications
(80.0%), and that girls’ scores had a higher mean than boys’ scores in 70 out of 73 specifications
(95.9%). The combination of higher mean for girls and higher SD for boys was found in 52 out of
73 specifications (71.2%).
Does this mean that boys are ‘over-represented’ at both extremes of the distribution? For
example, this has recently been claimed for A-level8. To investigate this at GCSE, we looked at
the ‘gender gap’ defined as before as the percentage of boys minus the percentage of girls in the
top 5% and bottom 5% of scores overall. Analysis was restricted to specifications with at least
2,000 entries in order to ensure at least 100 people in the top/bottom 5% of scores. Figures 3.6 to
3.10 clearly show that while boys were certainly over-represented in the bottom 5% of scores, they
were not over-represented in the top 5%: far from it – in only 4 of the 53 specifications was this the
case. All four were STEM subjects, and it is interesting to note that in two of them (Mathematics
and Physics) OCR offered two specifications, and in the other specification there were relatively
more girls in the top 5%.
This suggests that at GCSE, the lower mean and higher SD for boys can mainly be attributed to a
higher proportion of low scores. There is a higher proportion of girls than boys at the extreme top
end of the score distribution in the vast majority of cases.
8 http://www.independent.co.uk/news/education/education-news/boys-tend-to-either-get-top-marks-or-fail-in-exams-says-
new-research-10435842.html

27
Figure 3.6: Difference in the percentage of boys and girls in the top 5% (upper graph) and bottom 5%
(lower graph) of scores, STEM subjects.

28
Figure 3.7: Difference in the percentage of boys and girls in the top 5% (upper graph) and bottom 5%
(lower graph) of scores, Humanities subjects.

29
Figure 3.8: Difference in the percentage of boys and girls in the top 5% (upper graph) and bottom 5%
(lower graph) of scores, Language subjects.

30
Figure 3.9: Difference in the percentage of boys and girls in the top 5% (upper graph) and bottom 5%
(lower graph) of scores, Expressive subjects.

31
Figure 3.10: Difference in the percentage of boys and girls in the top 5% (upper graph) and bottom 5%
(lower graph) of scores, Applied subjects.

32
4. Gender differences relating to type of assessment
GCSE grades are usually determined by performance in written examinations (in recent years,
exams could have either been terminal exams at the end of Year 11, a series of modular
examinations taken throughout the course, or a combination of the two). However, GCSEs also
allow students to complete coursework (or controlled assessment9) during their two years of study.
In such cases, students complete a number of assessed pieces of work which will count towards
their final examination grade. Controlled assessment can contribute to anything from 10–60% of a
pupil's final grade, with some subjects, such as design and technology, art or English often having
a heavier controlled assessment element.
Research has suggested that girls tend to perform better in coursework assessments (e.g., Oates,
2007), which are based over a prolonged period and do not depend on performance on a single
day, whereas boys do better in written examinations. However, one should be careful to generalise
about the strengths of boys and girls in such a way, as there are many boys who do well in
coursework assessments.
In this section, component/unit level data from OCR specifications was obtained. Components
were categorised into coursework (which includes assessment types that measure subject-specific
skills that cannot be tested by written exam papers, such as practicals, portfolios, performances or
controlled assessments) and written examinations. Table 4.1 below shows the numbers of each
type of component in GCSE examinations offered in June 2014, together with the relative size of
mean and standard deviation of boys’ and girls’ scores in each type of assessment.
Table 4.1: Relative size of mean and SD of boys’ and girls’ scores (OCR GCSEs June 2014,
unit/components with an entry of 500+), by type of assessment.
Coursework Written
assessment All
Boys higher mean boys higher SD 5 18 23
Boys higher mean girls higher SD 4 15 19
Girls higher mean boys higher SD 100 117 217
Girls higher mean girls higher SD 26 59 85
Girls higher mean 126 176 302
Boys higher SD 105 135 240
All 135 209 344
Table 4.1 shows that boys’ and girls’ scores (both their mean and standard deviation) differed by
the type of assessment, supporting the hypothesis that girls tend to perform better in coursework
assessments than boys. In particular, in 126 out of 135 coursework components (93.3%), girls’
scores had a higher mean than boys’. However, in written components, 176 out of 209
components (84.2%), girls’ scores had a higher mean than boys’. The combination of higher mean
for girls and higher standard deviation for boys was found in 74.1% and 56.0% of coursework and
written assessment components, respectively.
In written examinations, students are faced with different types of questions, depending on the
subject. For example, some units/components comprise multiple choice questions, others short-
9 Controlled assessment is a form of coursework where control levels for each stage of the process (task setting,
task taking and task marking) have been strictly defined by the qualifications regulator.
33
answer questions or longer essays. Within the coursework or controlled assessments, as
mentioned above, there were also differences by subject, for example, there were science
practicals, art portfolios, artistic performances, etc. The following graphs show, for a selection of
components/units, the probability of superiority for boys in different types of assessments. In these
figures, the graphs are vertically ordered by the probability of superiority statistic. As before, the
underlying score scale from which the probability of superiority was calculated was either the UMS
for exams with a ‘modular’ assessment structure, or the weighted aggregate mark for exams with a
‘linear’ assessment structure
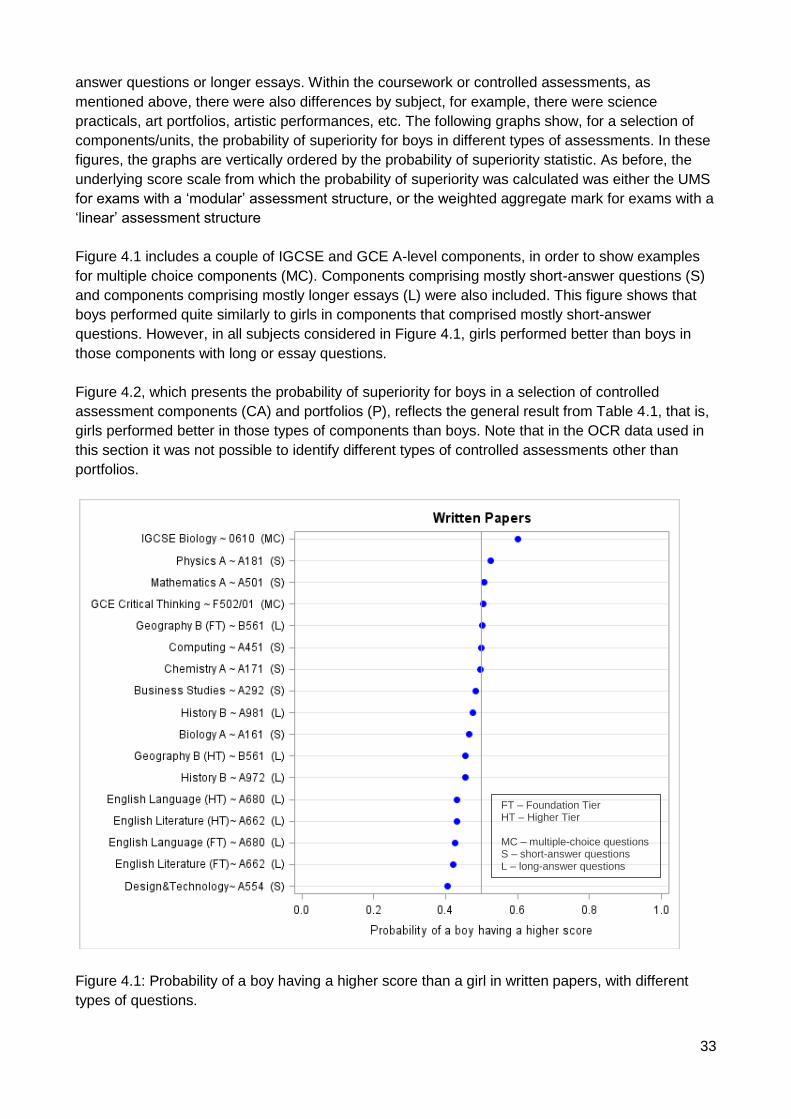
Figure 4.1 includes a couple of IGCSE and GCE A-level components, in order to show examples
for multiple choice components (MC). Components comprising mostly short-answer questions (S)
and components comprising mostly longer essays (L) were also included. This figure shows that
boys performed quite similarly to girls in components that comprised mostly short-answer
questions. However, in all subjects considered in Figure 4.1, girls performed better than boys in
those components with long or essay questions.
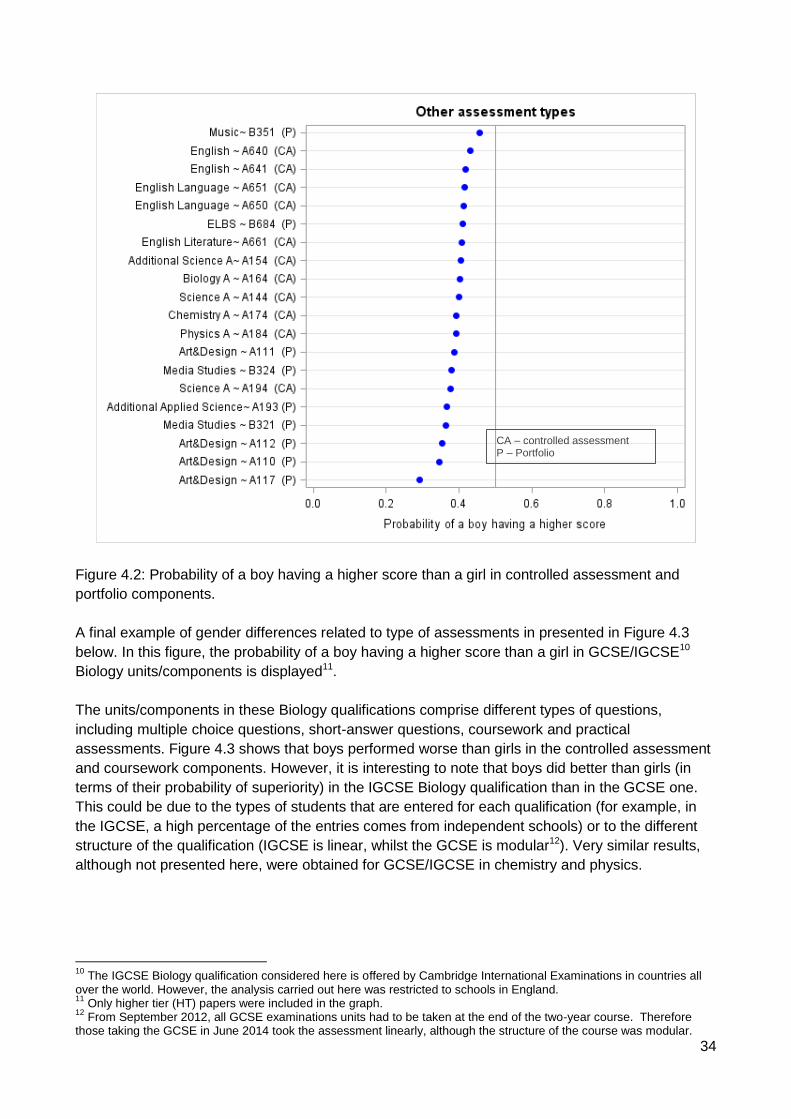
Figure 4.2, which presents the probability of superiority for boys in a selection of controlled
assessment components (CA) and portfolios (P), reflects the general result from Table 4.1, that is,
girls performed better in those types of components than boys. Note that in the OCR data used in
this section it was not possible to identify different types of controlled assessments other than
portfolios.
Figure 4.1: Probability of a boy having a higher score than a girl in written papers, with different
types of questions.
FT – Foundation Tier HT – Higher Tier
MC – multiple-choice questions S – short-answer questions
L – long-answer questions
34
Figure 4.2: Probability of a boy having a higher score than a girl in controlled assessment and
portfolio components.
A final example of gender differences related to type of assessments in presented in Figure 4.3
below. In this figure, the probability of a boy having a higher score than a girl in GCSE/IGCSE10
Biology units/components is displayed11.
The units/components in these Biology qualifications comprise different types of questions,
including multiple choice questions, short-answer questions, coursework and practical
assessments. Figure 4.3 shows that boys performed worse than girls in the controlled assessment
and coursework components. However, it is interesting to note that boys did better than girls (in
terms of their probability of superiority) in the IGCSE Biology qualification than in the GCSE one.
This could be due to the types of students that are entered for each qualification (for example, in
the IGCSE, a high percentage of the entries comes from independent schools) or to the different
structure of the qualification (IGCSE is linear, whilst the GCSE is modular12). Very similar results,
although not presented here, were obtained for GCSE/IGCSE in chemistry and physics.
10
The IGCSE Biology qualification considered here is offered by Cambridge International Examinations in countries all over the world. However, the analysis carried out here was restricted to schools in England. 11
Only higher tier (HT) papers were included in the graph. 12
From September 2012, all GCSE examinations units had to be taken at the end of the two-year course. Therefore those taking the GCSE in June 2014 took the assessment linearly, although the structure of the course was modular.
CA – controlled assessment P – Portfolio

35
Figure 4.3: Probability of a boy having a higher score than a girl in IGCSE/GCSE biology
components (June 2014)

36
Summary and discussion
In this paper we analysed differences between boys and girls in their choice of GCSE subject and
achievement in the examination. For presentation purposes we grouped the subjects into five
categories: STEM, Humanities, Languages, Expressive and Applied. The main findings are
summarised below.
Subject choice
Using data from the National Pupil Database in 2005 and 2014 (which covers children in all
schools in England, whichever exam board they chose) we found that:
Boys formed the greater proportion of the GCSE examination entry in nearly all STEM
subjects in both 2005 and 2014.
In 2014 the proportion of boys and girls in the separate sciences (Physics, Chemistry,
Biology) was almost equal (i.e. 50% of each) whereas in 2005 the proportion of boys in the
separate sciences was around 55-59%.
The proportion of boys and girls in most Humanities subjects was fairly close to 50%, with
the exception of Psychology and Sociology where nearly 70% of the entry was from girls.
For the majority of subjects the proportions of boys and girls were slightly more similar in
2014 than in 2005.
Some language GCSEs were taken by more boys than girls and others were taken by
more girls than boys. There were fewer boys than girls in the largest-entry language
GCSEs (French, Spanish, German).
The biggest gender differences in proportion of the entry were in the Expressive and
Applied categories, and these were invariably along stereotypical lines. For example, D&T
Electronic Products and D&T Engineering comprised ~90% boys, whereas D&T Textiles
and Health & Social Care comprised ~90% girls.
Subject outcomes (grades)
The main findings, again using data from the National Pupil Database in 2005 and 2014, were that:
Girls tended to do better than boys in all GCSEs, regardless of whether it was a subject
where the entry was predominantly from boys or girls.
The difference (gender gap) in percentage points was greater at grade C and above
(around 10.5) than at grade A* (around 3.0).
The gender gap was generally smaller in STEM and Language subjects (around 5
percentage points at grade C) and greater in Applied, Expressive and Humanities subjects
(around 14 percentage points at grade C).
In most subjects the gap tended to be slightly wider in 2014 than it was in 2005, but this
varied within and between subject categories. Interpreting changes in gaps using a
percentage point metric can be problematic given the dependence of this measure on the
shape of the distribution and the location of the grade boundaries.
The only subjects in 2014 where there was a higher percentage of boys than girls at both
grade C and grade A* were ‘Applications of Mathematics’ and Arabic, taken by ~11,600
and ~1,700 candidates respectively.

37
Subject outcomes (scores)
Using data from the exam board OCR we were able to obtain the underlying scores from which the
grades were based and thus carry out some more fine-grained analyses. First of all we considered
the probability that a randomly sampled boy would have a higher score than a randomly sampled
girl – the ‘probability of superiority’ p(sup). This statistic has the advantage of being ‘scale-free’ in
both the sense that examinations with mark scales of different lengths can be compared and also
in that effect sizes can be compared with those found in completely different attributes, such as
height.
As expected from the analysis of grades using data from all boards, we found that p(sup) for boys
was generally lower than 0.50 showing that in all subjects girls were likely to do better than boys.
The overall average across all subjects was 0.41, being highest in STEM subjects (0.46 on
average) and lowest in Expressive subjects (0.35 on average). To put this in context, the p(sup)
for 16 year old boys vs. girls in terms of height is 0.85. A p(sup) of 0.41 corresponds to the
difference in height between Year 11 boys who are 9 months apart in age, so is not a particularly
large difference in terms of being visible ‘to the naked eye’. However, it is bigger than the effect of
month of birth on exam scores where we found the average p(sup) to be 0.48 for those born in the
last 6 months of the academic year compared with those born in the first 6 months.
The data also confirmed the general finding in the research literature that the scores of boys on
cognitive tests are more spread out than those of girls: boys’ scores had a higher standard
deviation (SD) than girls’ scores in 54 out of 73 specifications (80.0%). The combination of higher
mean for girls and higher SD for boys was found in 52 out of 73 specifications (71.2%). However,
it is also often claimed that the higher variability of boys’ scores means that they are over-
represented at both extremes of the score distribution. We did not find this in the OCR GCSE data
– only 4 of 53 specifications had relatively more boys than girls in the top 5% of scores whereas 52
out of 53 specifications had relatively more boys than girls in the bottom 5% of scores. (The one
exception was Economics, where the proportions were practically the same). This suggests that at
GCSE, the lower mean and higher SD for boys can mainly be attributed to a higher proportion of
low scores for boys.
Assessment type
Most GCSEs are made up of assessed components of different types. Within the OCR data we
were able to distinguish between coursework (which includes practicals, portfolios, performances
and controlled assessments) and written examinations. In 126 out of 135 coursework components
(93.3%), girls’ scores had a higher mean than boys’, compared to 176 out of 209 written
examination components (84.2%). This supports the hypothesis that girls tend to perform better in
coursework assessments than boys.
Within a selection of the written examination components we looked for gender differences
between those comprising mainly long-answer or short-answer questions. Boys performed quite
similarly to girls in components that comprised mostly short-answer questions, but girls performed
better than boys in those components with long-answer or essay questions. It is not
straightforward to interpret this kind of finding because subjects differ in the proportion of long and
short answer questions in their assessment components.

38
Conclusion
The findings in this report are generally consistent with what has been found in previous research.
At GCSE, gender differences in subject choice are generally more dramatic than differences in
achievement, with some subjects being chosen by many more boys than girls, and vice versa.
Differences in achievement consistently favour girls, across all subject areas and regardless of
whether we consider the percentage achieving grade C or above, grade A*, mean scores or
probability of superiority. The gender gap is narrower in STEM subjects and languages. In terms
of the size of the boy-girl difference, it is on average roughly comparable to 9 months growth in
height for Year 11 boys. It is thus not a particularly large effect (as Benton (2015) has noted, two
randomly selected boys or girls will differ more from each other than the average girl differs from
the average boy), and as many other authors have noted there are larger and arguably more
concerning differences between groupings based on other demographic variables such as ethnicity
or social class. However, the average boy-girl difference in GCSE outcomes is notably larger than
the average difference between those born in the first six months of the academic year and those
born in the last six months of the academic year.
Future work could extend the analysis to A-levels, where subject choice is more influential. It
would also be interesting to explore further the contributions of subject content, assessment
structure and question type to gender differences in examination scores.
References
Bell, J. F. (2001). Investigating gender differences in the science performance of 16-year-old pupils
in the UK. International journal of science education, 23(5), 469-486.
Benton, T. (2015). Attitudes to learning: questioning the PISA data. Cambridge Assessment
Research Report. Cambridge, UK: Cambridge Assessment.
Bramley, T. (2014). Multivariate representations of subject difficulty. Research Matters: A
Cambridge Assessment Publication, 18, 42-47.
Ceci, S. J., Williams, W. M., & Barnett, S. M. (2009). Women's underrepresentation in science:
sociocultural and biological considerations. Psychological Bulletin, 135(2), 218.
Connolly, P. (2006). The effects of social class and ethnicity on gender differences in GCSE
attainment: a secondary analysis of the Youth Cohort Study of England and Wales 1997–
2001. British educational research journal, 32(1), 3-21.
Crawford, C., Dearden, L., and Greaves, E. (2013). When you are born matters: evidence for
England. IFS Report R80. London: Institute for Fiscal Studies.
DeMars, C. E. (1998). Gender differences in mathematics and science on a high school proficiency
exam: The role of response format. Applied Measurement in Education, 11(3), 279-299.
DeMars, C. E. (2000). Test stakes and item format interactions. Applied Measurement in
Education, 13(1), 55-77.
DfE. (2012). What is the research evidence on writing? London, UK: DfE.
DfES. (2006a). Gender and education: the evidence on pupils in England. Nottingham, UK: DfES
Publications.
DfES. (2006b). Improving writing, with a particular focus on supporting boys’ writing development:
Nottingham, UK: DfES Publications.
Elwood, J. (1999). Equity issues in performance assessment: The contribution of teacher-assessed
coursework to gender-related differences in examination performance. Educational
Research and Evaluation, 5(4), 321-344.

39
Gallagher, A. M., & De Lisi, R. (1994). Gender differences in Scholastic Aptitude Test:
Mathematics problem solving among high-ability students. Journal of Educational
Psychology, 86(2), 204.
Halpern, D. F. (1986). Sex differences in cognitive abilities. Hillsdale, NJ: Erlbaum.
Hedges, L. V., & Nowell, A. (1995). Sex differences in mental test scores, variability, and numbers
of high-scoring individuals. Science, 269(5220), 41-45.
Hill, C., Corbett, C., & St Rose, A. (2010). Why so few? Women in Science, Technology,
Engineering, and Mathematics: ERIC.
HMI. (2000). The teaching of writing in primary schools: Could do better. London: Department for
Education and Skills.
Ho, A. D. (2008). The problem with "proficiency": limitations of statistics and policy under no child
left behind. Educational Researcher, 37(6), 351-360.
Holland, P. W. (2002). Two measures of change in the gaps between the cdfs of test-score
distributions. Journal of Educational and Behavioral Statistics, 27(1), 3-17.
Hyde, J. S. (2014). Gender similarities and differences. Annual review of psychology, 65, 373-398.
Hyde, J. S., Fennema, E., & Lamon, S. J. (1990). Gender differences in mathematics performance:
a meta-analysis. Psychological Bulletin, 107(2), 139.
Hyde, J. S., Lindberg, S. M., Linn, M. C., Ellis, A. B., & Williams, C. C. (2008). Gender similarities
characterize math performance. Science, 321(5888), 494-495.
Hyde, J. S., & Linn, M. C. (1988). Gender differences in verbal ability: A meta-analysis.
Psychological Bulletin, 104(1), 53.
Liu, O. L., & Wilson, M. (2009). Gender differences in large-scale math assessments: PISA trend
2000 and 2003. Applied Measurement in Education, 22(2), 164-184.
Maccoby, E. E., & Jacklin, C. N. (1974). The psychology of sex differences (Vol. 1): Stanford
University Press.
Meadows, M. (2003). AS level grade, age, gender and centre type as predictors of A level grade in
the summer 2002 examinations. Manchester: AQA Centre for Education Research and
Policy.
Miller, D. I., & Halpern, D. F. (2014). The new science of cognitive sex differences. Trends in
cognitive sciences, 18(1), 37-45.
Mullis, I. V., Martin, M. O., Foy, P., & Drucker, K. T. (2012). PIRLS 2011 International Results in
Reading: International Association for the Evaluation of Educational Achievement.
Murphy, R. (1980). Sex Differences in GCE Examination Entry Statistics and Success Rates∗.
Educational Studies, 6(2), 169-178.
Murphy, R. (1982). Sex differences in objective test performance. British Journal of Educational
Psychology, 52(2), 213-219.
Oates, T. (2007). Underachieving boys' and 'overachieving girls' revisited - rhetoric and reality. In
K. Myers & H. Taylor (Eds.), Genderwatch: still watching (pp. 1-7): Trentham Books.
OECD. (2014). PISA 2012 Results in Focus: What 15-year-olds know and what they can do with
what they know: OECD Publishing.
OECD. (2015). The ABC of Gender Equality in Education Aptitude, Behaviour, Confidence: OECD
Publishing.
Ofsted. (2012). Moving English Forward: Action to raise standards in English. London, UK: Ofsted.
Sammons, P., Sylva, K., Melhuish, E., Siraj, I., Taggart, B., Toth, K., & Smees, R. (2014).
Influences on students’ GCSE attainment and progress at age 16: Institute of Education,
University of London.
Ruscio, J., & Gera, B. L. (2013). Generalizations and extensions of the probability of superiority
effect size estimator. Multivariate behavioral research, 48(2), 208-219.
AQA (2013). Guide to the Uniform Mark Scale (UMS). Manchester: AQA Education.
40
Smithers, A., & Robinson, P. (2006). The paradox of single-sex and co-educational schooling:
Carmichael Press Buckingham.
Spelke, E. S. (2005). Sex differences in intrinsic aptitude for mathematics and science?: a critical
review. American Psychologist, 60(9), 950.
Strand, S., Deary, I. J., & Smith, P. (2006). Sex differences in cognitive abilities test scores: A UK
national picture. British Journal of Educational Psychology, 76(3), 463-480.
Sykes, E., Bell, J.F., and Vidal Rodeiro, C. (2009) Birthdate Effects: A Review of the Literature
from 1990-on. Cambridge Assessment Report.
Wai, J., Cacchio, M., Putallaz, M., & Makel, M. C. (2010). Sex differences in the right tail of
cognitive abilities: A 30 year examination. Intelligence, 38(4), 412-423.

41
Appendix A
Table A1: GCSE Entries in 2005 and 2014 (source: National Pupil Database).
Category Subject
2005 2014
Boys Girls Boys Girls
N % N % N % N %
STEM
Geology 307 74.7 104 25.3 533 76.8 161 23.2
Astronomy 140 69.7 61 30.3 856 63.7 487 36.3
Environmental Science 249 64.5 137 35.5 1568 54.6 1302 45.4
Additional Mathematics 171 63.3 99 36.7 . . . .
Rural Science 601 61.8 372 38.2 . . . .
Physics 26935 59.3 18490 40.7 62808 50.6 61222 49.4
Chemistry 26729 58.2 19177 41.8 61935 50.8 59974 49.2
Biology 27096 57.4 20150 42.6 61703 50.7 59909 49.3
Information & Communications Technology 47093 56.8 35808 43.2 44161 57.2 33027 42.8
Statistics 16469 53.9 14093 46.1 18123 53.5 15747 46.5
Environmental Studies. Single 28 50.9 27 49.1 . . . .
Science SA 32464 50.3 32014 49.7 . . . .
Mathematics 296202 50.1 295058 49.9 258592 50.6 252516 49.4
Science: Double Award 222441 49.4 227407 50.6 . . . .
Science: Double Award B 222441 49.4 227407 50.6 . . . .
Other Science 2055 43.7 2646 56.3 . . . .
Biology: Human 419 43.5 544 56.5 . . . .
Applied Engineering . . . . 3822 94.8 211 5.2
Computer Studies/Computing . . . . 13105 84.9 2334 15.1
Applications of Mathematics . . . . 6031 52.1 5553 47.9
Science (Core) . . . . 76054 52.1 70063 48.0
Methods in Mathematics . . . . 4348 50.7 4220 49.3
Additional Science . . . . 130236 48.5 138181 51.5
Humanities
Geography 105524 56.3 82064 43.7 107426 53.7 92522 46.3
General Studies 1871 54.0 1596 46.0 4156 50.6 4061 49.4
Classical Civilisation 2203 53.6 1908 46.4 2048 52.1 1884 47.9
History 102689 50.5 100762 49.5 110389 48.5 117262 51.5
English Language & Literature 295220 49.9 296480 50.1 58640 60.0 39170 40.0
English Literature 251286 48.3 268901 51.7 188032 47.4 208324 52.6
Media/Film/Tv Studies 18953 48.0 20556 52.0 23171 51.7 21620 48.3
Humanities: Single 6811 47.1 7655 52.9 3600 51.1 3444 48.9
Religious Studies 54418 42.9 72425 57.1 110680 46.6 126965 53.4
Social Science 471 36.8 810 63.2 . . . .
Psychology 514 27.6 1349 72.4 4404 32.8 9017 67.2
Sociology 3944 26.7 10805 73.3 5789 29.4 13885 70.6
English Studies . . . . 199 65.5 105 34.5
Film Studies . . . . 3424 58.1 2465 41.9
Ancient History . . . . 580 57.4 430 42.6
English Language . . . . 131035 47.4 145638 52.6
Social Science: Citizenship . . . . 8250 45.0 10068 55.0

42
Table A1 (continued): GCSE Entries in 2005 and 2014.
Category Subject
2005 2014
Boys Girls Boys Girls
N % N % N % N %
Languages
Other Classical Languages 57 85.1 10 14.9 31 60.8 20 39.2
Persian 136 69.0 61 31.0 126 57.0 95 43.0
Classical Greek 561 61.4 353 38.6 676 59.8 455 40.2
Modern Greek 64 59.3 44 40.7 59 51.3 56 48.7
Turkish 317 56.7 242 43.3 287 52.0 265 48.0
Punjabi 384 56.3 298 43.7 186 47.9 202 52.1
Polish 51 54.3 43 45.7 709 51.8 660 48.2
Dutch 66 53.2 58 46.8 62 44.3 78 55.7
Chinese 669 51.3 636 48.7 1022 54.8 844 45.2
Portuguese 158 49.7 160 50.3 374 46.9 424 53.1
Japanese 354 49.5 361 50.5 257 44.4 322 55.6
Arabic 460 48.9 480 51.1 790 47.5 873 52.5
Latin 4089 48.9 4269 51.1 4033 48.0 4367 52.0
Russian 599 48.4 638 51.6 723 54.2 610 45.8
German 46929 48.1 50638 51.9 26277 48.1 28301 51.9
Modern Hebrew 97 47.3 108 52.7 102 39.4 157 60.6
Bengali 722 46.6 826 53.4 366 50.3 362 49.7
French 107550 45.2 130533 54.8 63122 43.1 83224 56.9
Urdu 2243 44.8 2766 55.2 1209 40.1 1809 59.9
Gujarati 142 42.6 191 57.4 105 48.2 113 51.8
Italian 1139 41.9 1577 58.1 1370 42.4 1858 57.6
Spanish 20673 40.8 30030 59.2 35502 43.7 45800 56.3
Expressive
D&T Electronic Products 15782 93.4 1110 6.6 7285 92.4 595 7.6
D&T Engineering 1231 93.3 88 6.7 282 93.1 21 6.9
D&T Systems & Control 10910 92.4 900 7.6 2981 95.8 131 4.2
D&T Resistant Materials 79289 81.8 17615 18.2 42918 85.5 7287 14.5
D&T Product Design 9849 62.3 5960 37.7 23858 71.1 9689 28.9
Art & Design (Graphics) 2581 58.3 1849 41.7 4203 57.5 3112 42.5
D&T Graphic Products 48294 56.9 36581 43.1 19964 61.8 12326 38.2
Art & Design (Photography) 1656 56.6 1270 43.4 6602 36.2 11656 63.8
Art & Design (3d Studies) 1978 56.0 1556 44.0 885 50.3 873 49.7
Music 25823 50.3 25536 49.7 20006 49.3 20579 50.7
Design & Technology 1871 44.3 2349 55.7 . . . .
Art & Design (Fine Art) 21120 42.4 28711 57.6 16739 33.7 32989 66.3
Performing Arts 27 42.2 37 57.8 1006 29.4 2414 70.6
Art & Design 49263 40.9 71200 59.1 27255 33.5 54208 66.5
Drama & Theatre Studies 33795 36.7 58357 63.3 26250 38.4 42173 61.6
Expressive Arts & Performance Studies 2321 29.9 5454 70.1 715 32.9 1455 67.1
D&T Food Technology 26909 29.0 65977 71.0 14022 36.8 24083 63.2
Art & Design (Drawing & Painting) 28 28.0 72 72.0 . . . .
Art & Design (Textiles) 454 7.1 5940 92.9 297 3.9 7407 96.1
Dance 608 4.3 13595 95.7 762 7.0 10153 93.0
D&T Textiles Technology 1513 3.2 46151 96.8 767 3.2 23393 96.8
Applied Art & Design . . . . 386 41.5 544 58.5
Art & Design (Critical Studies) . . . . 15 23.4 49 76.6

43
Table A1 (continued): GCSE Entries in 2005 and 2014.
Category Subject
2005 2014
Boys Girls Boys Girls
N % N % N % N %
Applied
Motor Vehicle Studies 137 95.1 7 4.9 . . . .
Electronics 631 94.7 35 5.3 525 96.5 19 3.5
Economics 2116 77.7 607 22.3 3402 70.7 1408 29.3
Physical Education/Sports Studies 84807 65.3 45094 34.7 65146 66.3 33161 33.7
Archaeology 48 64.9 26 35.1 . . . .
Business Studies & Economics 2533 62.2 1540 37.8 2564 65.4 1356 34.6
Accounting/Finance 148 59.2 102 40.8 . . . .
Business Studies: Single 42272 57.3 31475 42.7 39967 58.6 28281 41.4
Office Technology 14190 49.6 14433 50.4 6917 54.7 5740 45.4
Law 404 48.7 426 51.3 840 44.0 1069 56.0
Tourism 554 40.5 815 59.5 . . . .
Catering Studies 1165 39.0 1824 61.0 . . . .
Home Economics: Food 1452 28.9 3573 71.1 3163 35.6 5725 64.4
Home Economics: Child Development 380 1.3 28863 98.7 258 1.5 17367 98.5
Home Economics: Textiles 4 1.3 304 98.7 5 2.5 199 97.5
Health & Social Care . . . . 301 5.7 4971 94.3

44
Appendix B
The graphs below show the probability of superiority in OCR GCSEs taken in June 2014 for Year
11 students who were born in the summer months13 (March to August) compared to the winter
months (September to February).
13
The term ‘summer-borns’ in other research often refers only to students born in June, July and August.