Embed Size (px)
Citation preview
Gender Differences in Claimed Self-Handicapping: The Role of
Group Status and Effort Prime
A Senior Honors Thesis
Presented in Partial Fulfillment of the Requirements for
graduation with research distinction in Psychology in the
undergraduate colleges of The Ohio State University
by
Joshua J. Eblin
The Ohio State University
May 2009
Project Advisors: Dr. Robert M. Arkin and Dr. Patrick J. Carroll
Gender Differences 2
Abstract
Two studies are reported in which participants‟ group status
(group/individual) and cause of failure (pawn/origin) are used
to predict self-handicapping. Relative to women, men‟s tendency
to engage in self-handicapping and related behaviors remains
stable and high across conditions. In our studies, women are
less likely to self-handicap in group situations and respond
negatively when led to believe that their potential failure
would be attributable to a lack of effort. Implications for
academic, workplace, and sports environments are discussed.
Gender Differences 3
A self-handicap is a voluntarily adopted impediment to
one‟s success. Two varieties of this psychological phenomenon
have been studied. The first type, behavioral self-handicapping,
involves some physical action that is typically carried out
prior to a situation in which failure is anticipated. As such,
an overriding sense of self-doubt is thought to underlie self-
handicapping (Oleson, Poehlmann, Yost, Lynch, & Arkin, 2000).
For example, a student who drinks the night before an important
exam is said to be behaviorally self-handicapping. This is
because he has actively constructed an impediment to his success
and now has a ready excuse for failure. The second type, claimed
self-handicapping, serves the same psychological function as a
behavioral self-handicap. However, a claimed self-handicap is
expressed much differently. It simply involves claiming an
impediment to one‟s success rather than actively constructing
one. For example, a person may claim a headache or a poor mood
in a performance situation.
Beginning with the original self-handicapping studies
(Jones & Berglas, 1978; Berglas & Jones, 1978), it has been
observed that women are less likely to self-handicap
behaviorally than are men but will readily claim a self-handicap
(Baumgardner, Lake, & Arkin, 1985). A few recent studies have
been designed with the intention of shedding light on the
underlying causes of these gender differences (McCrea, Hirt,
Gender Differences 4
Hendrix, Milner, & Steele, 2008) & (McCrea, Hirt, & Milner,
2008). McCrea et al., (2008) developed the Worker Scale to
assess the extent to which a person values effort. When they
administered the scale, they did find a gender difference. Women
scored higher than men on their measure (indicating that they
value effort more than men). According to McCrea and colleagues,
it is this difference in values that accounts for gender
differences in self-handicapping.
Our hypotheses were also conceptually formulated using
information reported in the social loafing literature. Social
loafing is a phenomenon where individuals withdraw effort in
group situations because they expect that others will compensate
for their lack of contribution. Interestingly, it has been
reported in the social loafing literature that women will not
claim to loaf in social situations (Stark, E. M., Shaw, J. D.,
Duffy, M. K., 2007), nor will they engage in socially loafing
behavior (Karau, S. J., Williams, K. D., 1993).
The primary objective of the research reported here is to
elaborate upon the work of McCrea and colleagues by further
investigating the value of effort from a different vantage
point. Furthermore, we take the issue one step further by
attempting to uncover why women value the exertion of effort
more than do men. We do this by conceptually combining the above
Gender Differences 5
mentioned gender related findings in the self-handicapping and
social-loafing literatures.
We agree with McCrea and colleagues regarding the gender
difference in the value of effort. Additionally, based on the
findings in the social loafing literature, we would like to add
that it also seems reasonable that women might not claim a self-
handicap in group situations. If this were true, it would be
appropriate to say that women are generally less likely to
withdraw effort than are men and will only claim to withdraw
effort when their performance has no negative impact on others.
Overview and Hypotheses
Broadly speaking, our studies were designed to investigate
under what conditions participants would claim a self-handicap
and then extend this inquiry by investigating why participants
choose to self-handicap or choose not to self-handicap.
Specifically, in Study 1 we hypothesized that women will not
claim an effort self-handicap when they are in group situations
and that women will report a mood self-handicap when in
individual situations. In Study 2 we hypothesized that women
would report higher negative affect than would men when told
they have failed in the group condition and when the cause of
failure given is lack of effort.
Gender Differences 6
STUDY 1
Method
Design
A 2x2x2 factorial between subjects design was used.
Subjects were assigned randomly to group status
(group/individual) and cause of failure (pawn/origin) in a 2X2X2
factorial design. In pawn conditions the cause of failure is
poor mood, which is presumably out of the participants‟ control.
In origin conditions the cause of failure is the participant, as
they have chosen not to exert effort. The third independent
variable considered is gender. The two dependent variables were
projected effort reported affect. A block randomization chart
was created prior to running any experimental subjects.
Participants
101 (male=54, female=47) undergraduate introductory
psychology students participated in Study 1 for course credit. A
description of the study was posted on The Ohio State University
website (Appendix A). Any student who wished to participate
Gender Differences 7
simply registered online and appeared at their chosen time.
Participation in the study was voluntary. Because the potential
risks to participants were minimal, the Ohio State Institutional
Review Board granted our request to have the consent process
waived.
Materials
Please see Appendix C for actual scale items. To organize
our data we asked participants to fill out the “Subject
Information” survey. Participants completed a “Warm-Up” quiz and
a “Full Length Exam” that were not scored. Participants
completed the “State Self-Doubt Scale” (Reich & Arkin, 2006).
This scale consists of 5 items intended to assess state self-
doubt. Items are on a 6 point likert scale, 1=Strongly Disagree;
6=Strongly Agree. Scores range from 5-30. High scores indicate
high state self-doubt. Participant completed the “State Hope
Scale” (Synder, Sympson, Ybasco, Borders, Babyak, & Higgins,
(1996). The scale consists of 6 items intended to assess state
hope. Items are on an 8 point likert scale, 1=Definitely False;
8=Definitely True. Scores range from 6-48. High scores indicate
high state-hope. A “Research Opinion” survey was administered to
ensure that participants were following experimental
instructions. A “Manipulation Check” was administered, which
Gender Differences 8
consists of 13 items on a 10 point likert scale that are
intended to assess the extent to which participants were engaged
in experimental tasks. 1=Strongly Disagree; 10=Strongly Agree.
Scores range from 13-130. High scores indicate that the
participant was highly engaged. The “Self-Handicapping Scale”
(Jones & Rhodewalt, 1982) consists of 19 items on a 10 point
likert scale intended to assess trait levels of self-
handicapping. 1=Strongly Agree; 10=Strongly Disagree. Scores
range from 19-190. High scores indicate high levels of trait
self-handicapping.
The “Mood Adjective Scale” consists of a total of 42 items.
McFarland and Ross (1982) found a negative mood factor in the
Mood Adjective Scale. The sadness, anger, and threat subscales
loaded positively onto this factor and calmness and safety
loaded negatively onto this factor. The items that comprise the
calmness subscale were mistakenly omitted from the version of
the Mood Adjective Scale that we administered. Therefore, this
data cannot be considered and is not analyzed as a subscale. Our
overall negative mood item consists of the sadness, threat, and
anger subscales in addition to the safety subscale reverse
scored. Items are on an 11 point likert scale. 1=I feel this way
intensely; 11=I do not feel at all this way, right now.
The Projected Effort measure was created by the authors to
be used in this study. No prior psychometric data on this
Gender Differences 9
measure exists. This measure consists of 3 items on an 11 point
likert scale that are intended to assess the extent to which
participants intend to withhold effort on the upcoming task.
High scores indicate intentions to withhold effort (high self-
handicapping). This is a measure of projected effort and not
previously exerted effort.
The “Inclusion of Others in Self Scale” (Aron & Fraley,
1999) consists of one item. Participants are asked to look at
several pairs of circles that are overlapping to various degrees
and choose the pair that most closely matches their perceived
relationship to the other individuals participating in the
experimental session. A larger amount of shared space between
the pair of circles participants choose represents a large sense
of closeness to the other students participating in the session.
Higher scores indicate higher felt closeness.
The “Subjective Overachievement Scale” is comprised of the
Self-Doubt and Concern with Performance subscales (Oleson,
Poehlmann, Yost, Lynch, & Arkin, 2000). The Self-Doubt subscale
is intended to assess trait levels of self-doubt. It consists of
9 items on a 6 point likert scale. 1=Disagree Very Much; 2=Agree
Very Much. Scores range from 9-54. High scores indicate high
self-doubt. The Concern with Performance subscale is intended to
measure trait levels of an individuals concern with performance.
It consists of 8 items on a 6 point likert scale. 1=Disagree
Gender Differences 10
Very Much; 6=Agree Very Much. Scores range from 8-48. High
scores indicate high concern with performance.
Procedure
Subjects first arrived to the designated waiting area in
the psychology building. The experimenter greeted the
participants in the waiting area and led them to an empty
classroom where they were read the experimental instructions
(Appendix B). The experimenter then left the room for 5 minutes
so that the participants could socialize, if they chose to do
so. At the very least, we wanted to ensure that the participants
had some contact with one another before proceeding to the next
part of the experiment. Subjects were run in groups ranging in
size from 2-8 people.
The experimenter returned after 5 minutes and led the
participants to the laboratory where they completed the
remainder of the experiment. Each participant was seated at
their own computer with the experiment loaded onto MediaLab
software. Prior to the participant sitting at the desk, the
experimenter placed a sheet of scrap paper and a pencil at each
computer station. There were 4 experimental rooms, each with 2
computers. A small radio was also left in each room to enhance
the cover story.
Gender Differences 11
Since the entire experiment was conducted on computers,
with the exception of the “socialization” process, the
phenomenological experience of group status was created via
instructions on the computer screen. Those in group conditions
were informed that their work would be part of a group effort
and those in individual conditions were told that their work
would be part of an individual effort. All participants were
fully debriefed after participation to ensure that they left the
experiment in the same psychological state in which they
arrived. No inclusion or exclusion criteria were used.
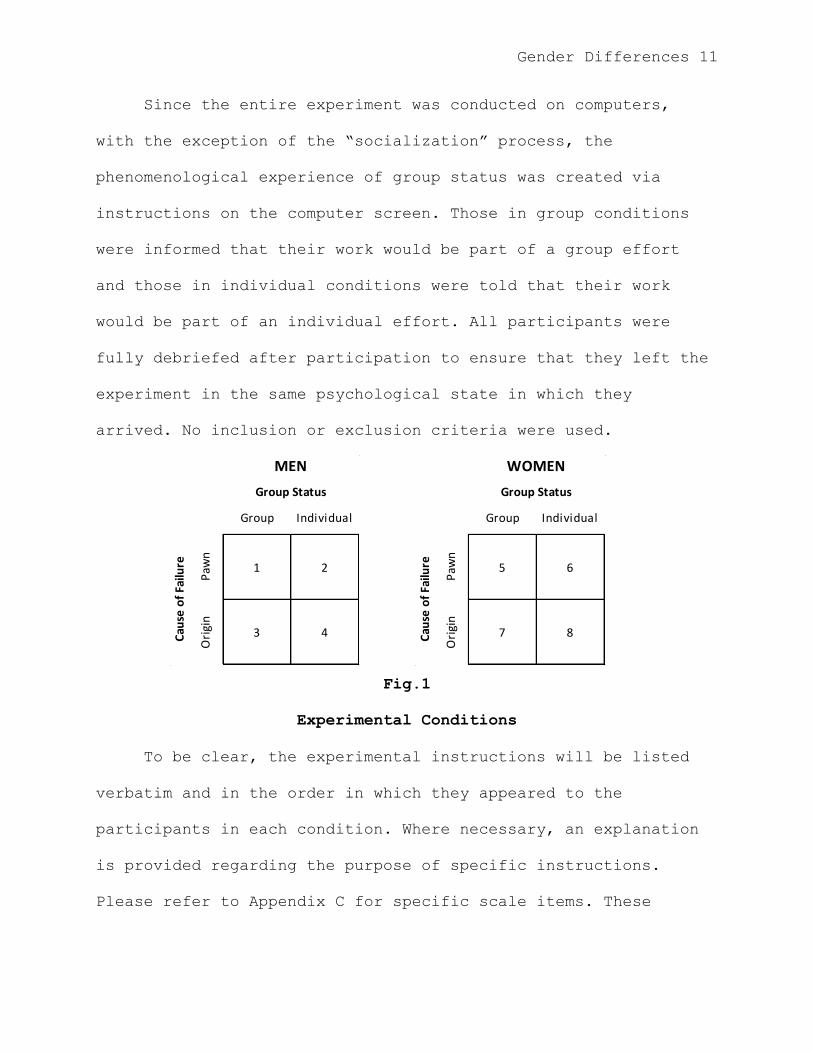
Fig.1
Experimental Conditions
To be clear, the experimental instructions will be listed
verbatim and in the order in which they appeared to the
participants in each condition. Where necessary, an explanation
is provided regarding the purpose of specific instructions.
Please refer to Appendix C for specific scale items. These
5 6
7 8Cau
se o
f Fa
ilure
Paw
nOrigin
WOMEN
Group Status
Group Individual
1 2
3 4
MEN
Group Status
Cau
se o
f Fa
ilure
Paw
nOrigin
IndividualGroup
Gender Differences 12
instructions are crucial to the experimental design and are the
only aspect of the study that varies across conditions.
Participants first viewed a screen thanking them for their
participation. Next, they viewed a series of screens stating,
“You have been randomly selected to participate in the „no
music‟ condition and [(CONDITIONS 1,3,5,&7- your work will be
part of a group effort) (CONDITIONS 2,5,6,8- your work will be
part of an individual effort)]. To ensure that you are
processing information efficiently and optimally, please
complete the 4 question warm up quiz on the following pages.
This quiz will not be scored. Its only purpose is to get you in
an optimal mindset to complete the actual exam. This quiz
contains multiple choice quantitative and antonym questions. On
the antonym questions please select the word you feel is the
opposite of the word given. Please feel free to use the scrap
paper at your desk to make any calculations. You will be given
30 seconds to complete each question. After 30 seconds the
computer will automatically proceed to the next question and you
will not be able to return to the previous question.”
Participants then completed the Warm-Up Questions measure. The
purpose of the Warm-Up Questions measure was to induce a feeling
of self-doubt in the participants. A time limit was imposed on
this measure to prevent participants from stalling on questions
and to further enhance a feeling of self-doubt. The computer
Gender Differences 13
then displayed a screen stating, “On the following pages, please
provide us with some basic information about yourself”. Subjects
then completed the Subject Info measure. To prime participants
to begin thinking about the potential handicaps that they could
claim, the computer displayed a screen titled, “Are you
feeling:” on which all of the mood related adjectives listed on
the Mood Adjective Scale appeared, followed by a screen titled,
“In this experiment will you:” on which all of the Projected
Effort scale items were displayed. A screen then displayed
stating “To disengage would be to not put forth your full
effort. In other words, to disengage from the exam today you
would have to intentionally not try hard”. Participants then
completed the State Self-Doubt Scale. The computer then
displayed the State Hope Scale instructions: “Please read the
following items carefully. Using the scale given, please select
the number that best describes how you think about yourself
right now and put that number in the blank provided. Please take
a few moments to focus on yourself and what is going on in your
life at this moment. Once you have this „here and now‟ set, go
ahead and answer each item according to the scale provided”.
Participants then completed the State Hope Scale. The computer
then displayed a series of screens stating, [(CONDITIONS
1,2,5,&6- “IMPORTANT!!!!!!!!! Research has shown that poor mood
negatively impacts verbal and mathematical reasoning ability.
Gender Differences 14
For example: if you had a headache or just found out that you
lost your job you would probably perform poorly on the upcoming
exam. It is very likely that you are capable of doing well on
this exam, but this does not necessarily mean that you will be
able to do well today. Therefore, it is important for us to
account for mood in our data analysis. Please use the
questionnaire items provided on the upcoming screen to indicate
your current mood. Please keep in mind that your performance
will affect your group‟s score regardless of your mood)
(CONDITIONS 3,4,7,&8- “IMPORTANT!!!!!!!!! Research has shown
that at times even hard working intelligent people don‟t exert
their full effort on all tasks. For example: you can choose not
to exert your full effort today. We cannot make you exert your
full effort. It is very likely that you are capable of doing
well on this exam, but this does not necessarily mean that you
will try hard today. Therefore, it is important for us to
account for this variable in our data analysis. If you do well
on the quiz and don‟t try hard, this would indicate that you are
very gifted. On the other hand, if you do poorly buy don‟t try
hard this quiz would NOT be diagnostic of your true ability.
Please keep in mind that your performance will affect your
group‟s score regardless of how hard you try)]. Throughout the
remainder of this experiment you will be given the opportunity
to let us know what kind of mood you are in today and how hard
Gender Differences 15
you intend to try on the exam you are given. This is the ONLY
way for you to communicate this information to us. This is very
important to our experiment so please be aware that the
questionnaires that you will be given [(CONDITIONS 1,2,5,&6-
REPRESENT YOUR OPPORTUNITY TO LET US KNOW WHAT KIND OF MOOD YOU
ARE IN. If you are in a bad mood and still do well on the quiz,
this would indicate that you are very gifted. On the other hand,
if you are in a bad mood and do poorly, this quiz would NOT be
diagnostic of your true ability) (CONDITIONS 3,4,7,&8- REPRESENT
YOUR OPPORTUNITY TO LET US KNOW HOW HARD YOU INTEND TO TRY.”)]
Please rate the following items according to how you are feeling
RIGHT NOW, AT THIS MOMENT. A rating of 1 indicates that you feel
this way intensely and a rating of 11 indicates that you do not
feel at all this way, right now.” Participants then completed
the Mood Adjective Scale, followed by the Projected Effort
measure. A screen then appeared stating “The following quiz
contains multiple choice quantitative and antonym questions.
[(CONDITIONS 1,3,5,&7- Your score on the full length exam will
be combined to form a group score with those of the other
individuals participating in this session)(CONDITIONS 2,4,6,&8-
The scores you receive on the Full Length Exam will reflect your
individual effort)]. On the antonym questions please select the
word you feel is the OPPOSITE of the word given. Good luck!”
Participants then completed the Full Length Exam. A screen then
Gender Differences 16
displayed informing the participant that the computer was in the
process of scoring their exam. Regardless of how participants
responded on the Full Length Exam, they were all told that they
had answered 4 out of 10 questions correctly. Participants then
completed the Research Opinion Survey, Inclusion of Others in
Self scale, Manipulation Check (adapted from J.L. Smith, 2002),
Subjective Overachievement Scale, and the Self-Handicapping
Scale. A screen then appeared indicating that the experiment was
over and that the participant should advance to the next screen
to view the debriefing.
Results
Study 1 was designed to investigate when individuals will
claim a handicap and whether or not gender moderates this
behavior. Group status (group/individual), cause of failure
(pawn, origin), and participant gender were the independent
variables. The two dependent variables were projected effort and
reported affect. These dependent variables represent our
operationalization of claimed self-handicapping. An ANOVA was
used to test our 2x2x2 factorial design for each dependent
variable.
Using the Projected Effort measure as the dependent
variable and gender, group status, and cause of failure as
Gender Differences 17
independent variables did not yield statistically significant
results. An interaction was expected between gender, cause of
failure, and group status, which was not found F(1,93)=.322,
p=.572. Although these results were not significant,
participants did behave in the direction of our predictions.
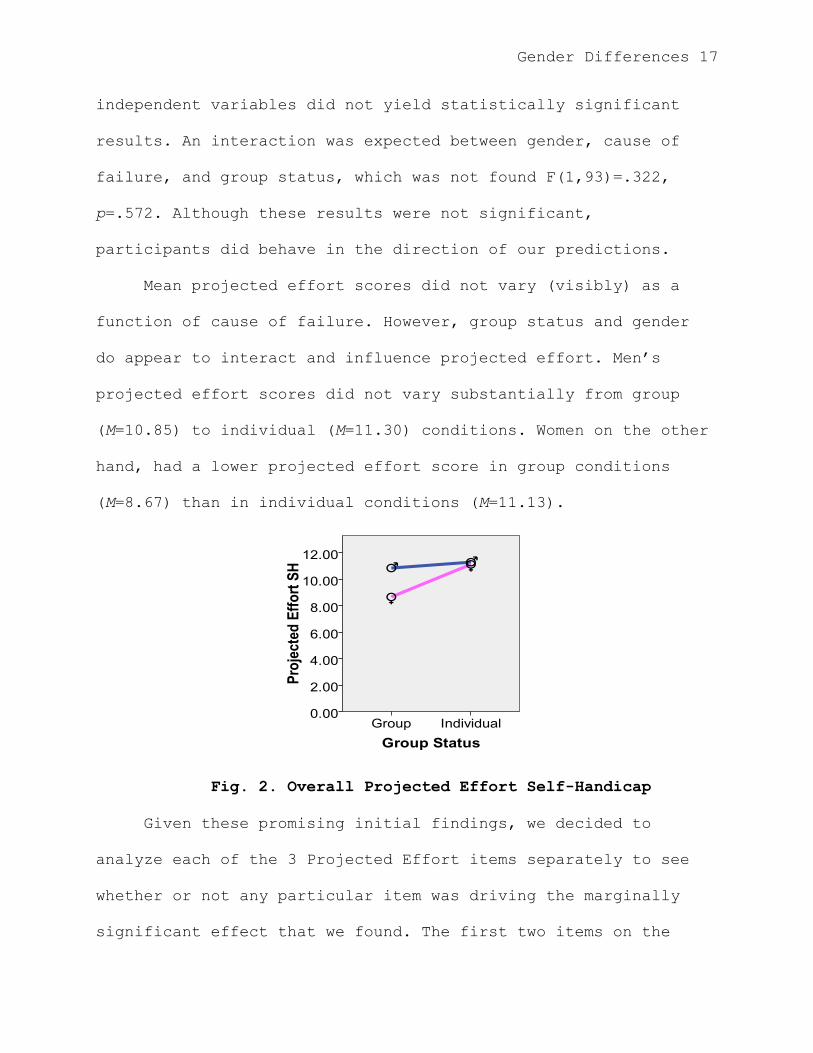
Mean projected effort scores did not vary (visibly) as a
function of cause of failure. However, group status and gender
do appear to interact and influence projected effort. Men‟s
projected effort scores did not vary substantially from group
(M=10.85) to individual (M=11.30) conditions. Women on the other
hand, had a lower projected effort score in group conditions
(M=8.67) than in individual conditions (M=11.13).
Fig. 2. Overall Projected Effort Self-Handicap
Given these promising initial findings, we decided to
analyze each of the 3 Projected Effort items separately to see
whether or not any particular item was driving the marginally
significant effect that we found. The first two items on the
Gender Differences 18
measure do not appear to have contributed to our effort finding.
An ANOVA using the first item as a dependent variable and
gender, group status, and cause of failure as independent
variables did not yield an interaction between group status and
gender, F(1,93)=.000, p= .994. An ANOVA using the second item as
a dependent variable and gender, group status, and cause of
failure as independent variables did not yield a significant
interaction between group status and gender, F(1,93)=.666,
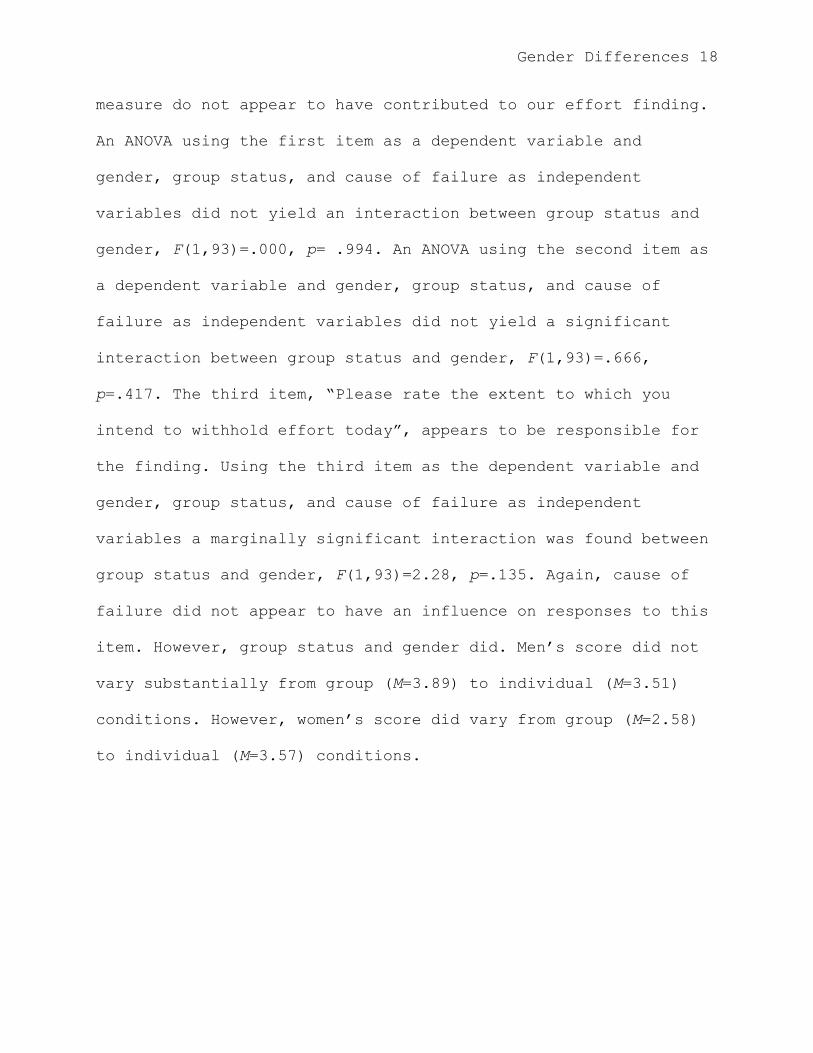
p=.417. The third item, “Please rate the extent to which you
intend to withhold effort today”, appears to be responsible for
the finding. Using the third item as the dependent variable and
gender, group status, and cause of failure as independent
variables a marginally significant interaction was found between
group status and gender, F(1,93)=2.28, p=.135. Again, cause of
failure did not appear to have an influence on responses to this
item. However, group status and gender did. Men‟s score did not
vary substantially from group (M=3.89) to individual (M=3.51)
conditions. However, women‟s score did vary from group (M=2.58)
to individual (M=3.57) conditions.
Gender Differences 19
Fig. 3. Projected Effort Self-Handicap – Item 3
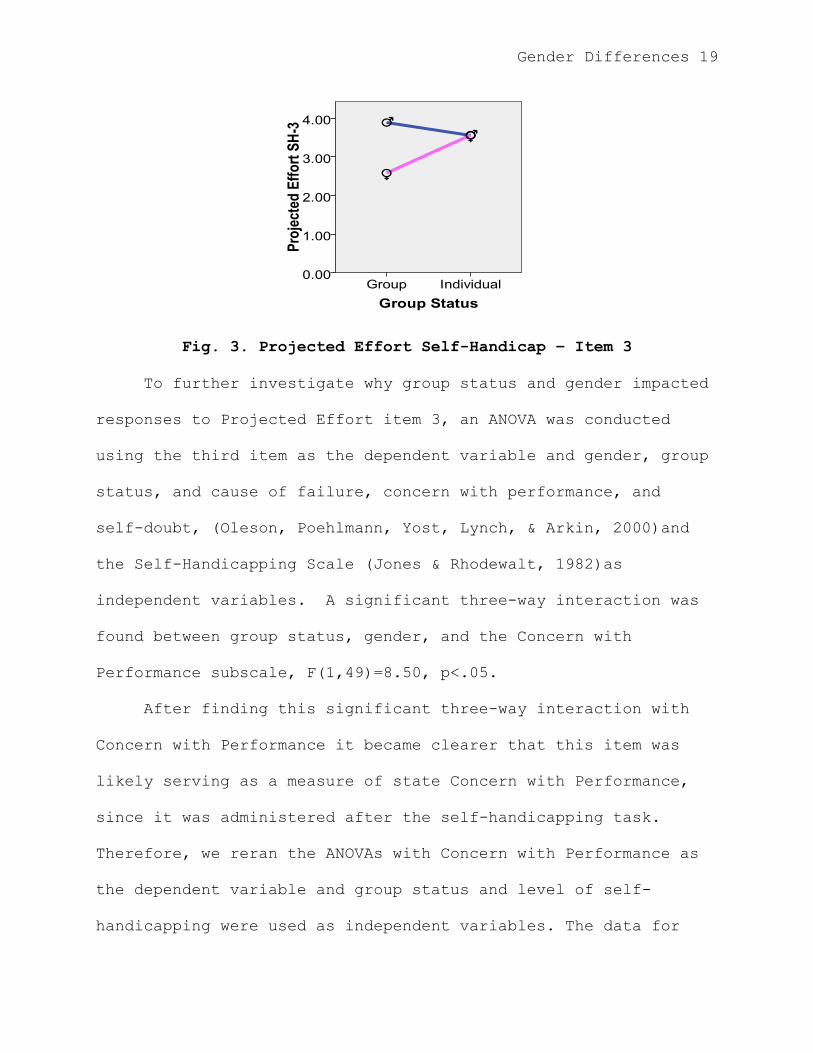
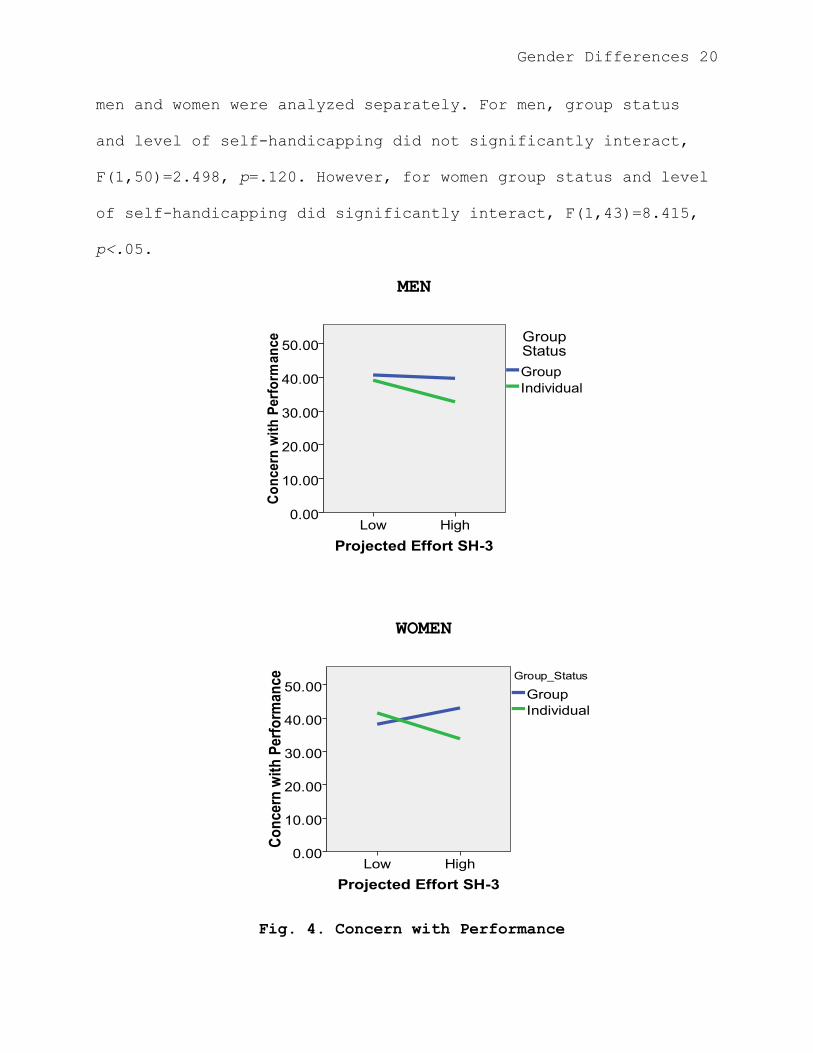
To further investigate why group status and gender impacted
responses to Projected Effort item 3, an ANOVA was conducted
using the third item as the dependent variable and gender, group
status, and cause of failure, concern with performance, and
self-doubt, (Oleson, Poehlmann, Yost, Lynch, & Arkin, 2000)and
the Self-Handicapping Scale (Jones & Rhodewalt, 1982)as
independent variables. A significant three-way interaction was
found between group status, gender, and the Concern with
Performance subscale, F(1,49)=8.50, p<.05.
After finding this significant three-way interaction with
Concern with Performance it became clearer that this item was
likely serving as a measure of state Concern with Performance,
since it was administered after the self-handicapping task.
Therefore, we reran the ANOVAs with Concern with Performance as
the dependent variable and group status and level of self-
handicapping were used as independent variables. The data for
Gender Differences 20
men and women were analyzed separately. For men, group status
and level of self-handicapping did not significantly interact,
F(1,50)=2.498, p=.120. However, for women group status and level
of self-handicapping did significantly interact, F(1,43)=8.415,
p<.05.
MEN
WOMEN
Fig. 4. Concern with Performance
Gender Differences 21
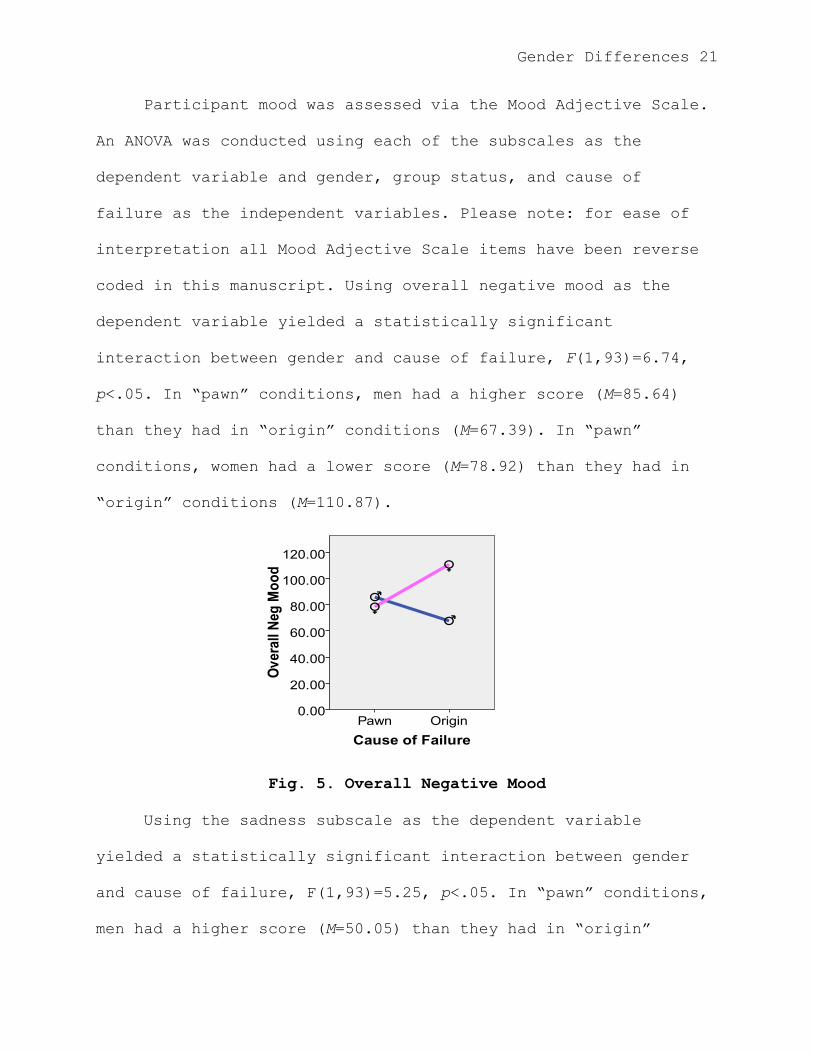
Participant mood was assessed via the Mood Adjective Scale.
An ANOVA was conducted using each of the subscales as the
dependent variable and gender, group status, and cause of
failure as the independent variables. Please note: for ease of
interpretation all Mood Adjective Scale items have been reverse
coded in this manuscript. Using overall negative mood as the
dependent variable yielded a statistically significant
interaction between gender and cause of failure, F(1,93)=6.74,
p<.05. In “pawn” conditions, men had a higher score (M=85.64)
than they had in “origin” conditions (M=67.39). In “pawn”
conditions, women had a lower score (M=78.92) than they had in
“origin” conditions (M=110.87).
Fig. 5. Overall Negative Mood
Using the sadness subscale as the dependent variable
yielded a statistically significant interaction between gender
and cause of failure, F(1,93)=5.25, p<.05. In “pawn” conditions,
men had a higher score (M=50.05) than they had in “origin”
Gender Differences 22
conditions (M=40.02). In “pawn” conditions, women had a lower
score (M=49.32) than they had in “origin” conditions (M=67.76).
Using the anger subscale as the dependent variable yielded a
statistically significant interaction between gender and cause
of failure, F(1,93)=4.59, p<.05. In “pawn” conditions, men had a
higher score (M=13.75) than they had in “origin” conditions
(M=9.75). In “pawn” conditions, women had a lower score (M=9.70)
than they had in “origin” conditions (M=12.89).Using the threat
subscale as the dependent variable yielded a statistically
significant interaction between gender and cause of failure,
F(1,93)=5.80, p<.05. In “pawn” conditions, men had a higher
score (M=18.30) than they had in “origin” conditions (M=15.20).
In “pawn” conditions, women had a lower score (M=16.50) than
they had in “origin” conditions (M=25.17). Using the safety
subscale as the dependent variable yielded a marginally
significant interaction between gender and cause of failure,
F(1,93)=2.62, p=.109. Men‟s score did not vary substantially
from “pawn” (M=15.40) to “origin” (M=16.57) conditions. Women‟s
scores did vary somewhat from “pawn” (M=15.60) to “origin”
(M=13.91) conditions.
Study 1 Discussion
Although our projected effort findings in Study 1 are not
Gender Differences 23
statistically significant, they do trend in the direction that
we predicted. Women were less likely to claim to withdrawal
effort when they were in group situations. On the other hand,
men were almost equally likely to report to withdrawal effort
regardless of whether they were in a group or individual
condition. This trend provides support for our hypotheses.
Interestingly, in Study 1, the Concern with Performance scale
seems to have captured state rather than trait concern. This can
likely be attributed to its placement at the end of the
experiment, after all of the experimental manipulations had
occurred. Again, participants‟ responses on this measure provide
support for our hypotheses, this time statistically significant.
As might be expected, men‟s concern with performance did not
vary as a function of group status or how high their claimed
self-handicap was. On the other hand, women‟s concern with
performance was affected substantially by their group status and
how high their claimed self-handicap was. Women‟s concern with
performance varied such that when in a group condition, their
concern with performance was highest when they had self-
handicapped the most and in individual conditions their concern
with performance was the highest when they had handicapped the
least. This suggests that in individual conditions their failure
is more salient to them when they have not self-handicapped to
excuse a poor performance, but that their sense of
Gender Differences 24
responsibility to others is so strong that they are more aware
of their failure when they are in a group condition and have
used a self-handicap to excuse their poor performance.
Participants‟ reported negative mood was also statistically
significant but is not in the direction of our original
predictions. We expected that mood would serve as a self-
handicap and vary as a function of group status. However, this
finding is made less troubling by the fact that it actually
supports our primary hypothesis in Study 2. Broadly speaking, we
hypothesized that when women attribute their own failure to a
lack of effort, their affect would become more negative. As
expected, women reported higher negative affect when primed with
effort as a potential self-handicap. On the other hand, men‟s
affect actually becomes more positive in the “origin”
conditions. This suggests that women find it highly unacceptable
to fail due to a lack of effort whereas men view the ability to
claim a lack of effort as a way out. In other words, for men, as
long as their competence is not at stake, failing due to a lack
of effort is perfectly acceptable.
Gender Differences 25
STUDY 2
Method
Design
A 2x2x2 factorial between subjects design was used.
Subjects were assigned randomly to group status
(group/individual) and cause of failure (pawn/origin) in a 2X2X2
factorial design. The third independent variable considered is
gender. The two dependent variables were reported positive and
negative affect and reported state self-esteem. A block
randomization chart was created prior to running any
experimental subjects.
Participants
93 (male=43, female=50) undergraduate introductory
psychology students participated in Study 2 for course credit. A
description of the study was posted on The Ohio State University
website (Appendix A). Any student who wished to participate
simply registered online and appeared at their chosen time.
Participation in the study was voluntary. Because the potential
risks to participants were minimal, the Ohio State Institutional
Review Board granted our request to have the consent process
waived.
Gender Differences 26
Materials
Please see Appendix C for actual scale items. To organize
our data we asked participants to fill out the “Subject
Information Survey”. Participants completed a “Full Length Exam”
that was not scored. A “Research Opinion” survey was
administered to ensure that participants were following
experimental instructions. A “Manipulation Check” was
administered, which consists of 13 items on a 10 point likert
scale that are intended to assess the extent to which
participants were engaged in the experiment. 1=Strongly
Disagree; 10=Strongly Agree. Scores range from 13-130. High
scores indicate that the participant was highly engaged.
Participants completed the “Self-Handicapping Scale” (Jones &
Rhodewalt, 1982), which consists of 19 items on a 10 point
likert scale intended to assess trait levels of self-
handicapping. 1=Strongly Agree; 10=Strongly Disagree. Scores
range from 19-190.
The “Inclusion of Others in Self Scale” (Aron & Fraley,
1999) consists of one item. Participants are asked to look at
several pairs of circles that are overlapping to various degrees
and choose the pair that most closely matches their perceived
relationship to the other individuals participating in the
Gender Differences 27
experimental session. A larger amount of shared space between
the pair of circles participants choose represents a large sense
of closeness to the other students participating in the session.
Higher scores indicate higher felt closeness.
The Heatherton & Polivy State Self-Esteem Scale consists of
20 items on a 5 point likert scale intended to measure state
self-esteem. We report data on overall state self-esteem as well
as the performance, social, and appearance subscales reported by
Heatherton and Polivy (1991). Scores range from 20-100. 1=Not at
All; 5=Extremely. High scores indicate high state self-esteem.
The “Subjective Overachievement Scale” is comprised of the
Self-Doubt and Concern with Performance subscales (Oleson,
Poehlmann, Yost, Lynch, & Arkin, 2000). The Self-Doubt subscale
is intended to assess trait levels of self-doubt. It consists of
9 items on a 6 point likert scale. 1=Disagree Very Much; 6=Agree
Very Much. Scores range from 9-54. High scores indicate high
self-doubt. The Concern with Performance subscale is intended to
measure trait levels of a persons concern with performance. It
consists of 8 items on a 6 point likert scale. 1=Disagree Very
Much 6=Agree Very Much. Scores range from 8-48. High scores
indicate high concern with performance.
The original Positive and Negative Affect Schedule
(PANAS)(Watson, Clark, & Tellegen, 1988) consisted of 20 items
on a 5 point likert scale intended to assess positive and
Gender Differences 28
negative affect. In order to assess all of the moral emotions
(shame, embarrassment, guilt, contempt, anger, and disgust)
reported by Rozin and colleagues (1999) we added 4 items to the
PANAS, bringing the total of items to 24. We report data not
only on positive and negative affect, but also on the moral
emotions.
Procedure
Subjects first arrived to the designated waiting area in
the psychology building. The experimenter greeted the
participants in the waiting area and led them to an empty
classroom where they were read the experimental instructions
(Appendix B). The experimenter then left the room for 5 minutes
so that the participants could socialize, if they chose to do
so. At the very least, we wanted to ensure that the participants
had some contact with one another before proceeding to the next
part of the experiment. Subjects were run in groups ranging in
size from 2-8 people.
The experimenter returned after 5 minutes and led the
participants to the laboratory where they completed the
remainder of the experiment. Each participant was seated at
their own computer with the experiment loaded onto MediaLab
software. Prior to the participant sitting at the desk, the
Gender Differences 29
experimenter placed a sheet of scrap paper and a pencil at each
computer station. There were 4 experimental rooms, each with 2
computers. A small radio was also left in each room to enhance
the cover story.
Since the entire experiment was conducted on computers,
with the exception of the “socialization” process, the
phenomenological experience of group status was created via
instructions on the computer screen. Those in group conditions
were informed that their work would be part of a group effort,
and those in individual conditions were told that their work
would be part of an individual effort. All participants were
fully debriefed after participation to ensure that they left the
experiment in the same psychological state in which they
arrived. No inclusion or exclusion criteria were used.
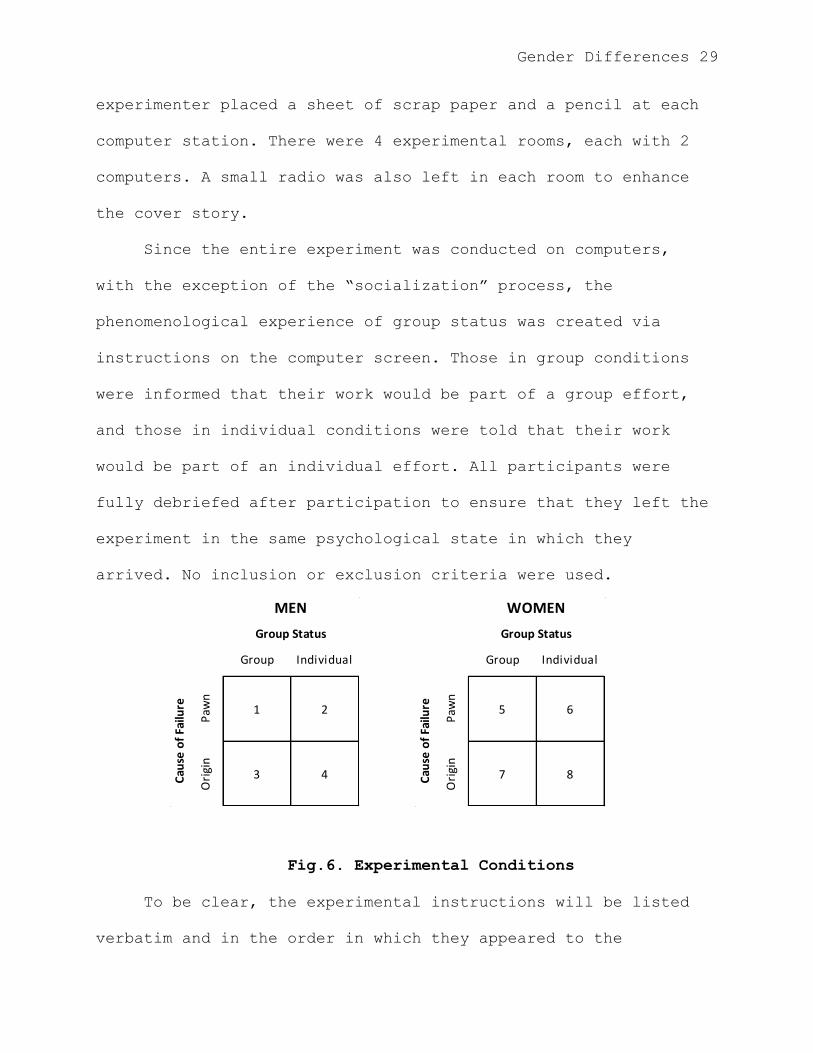
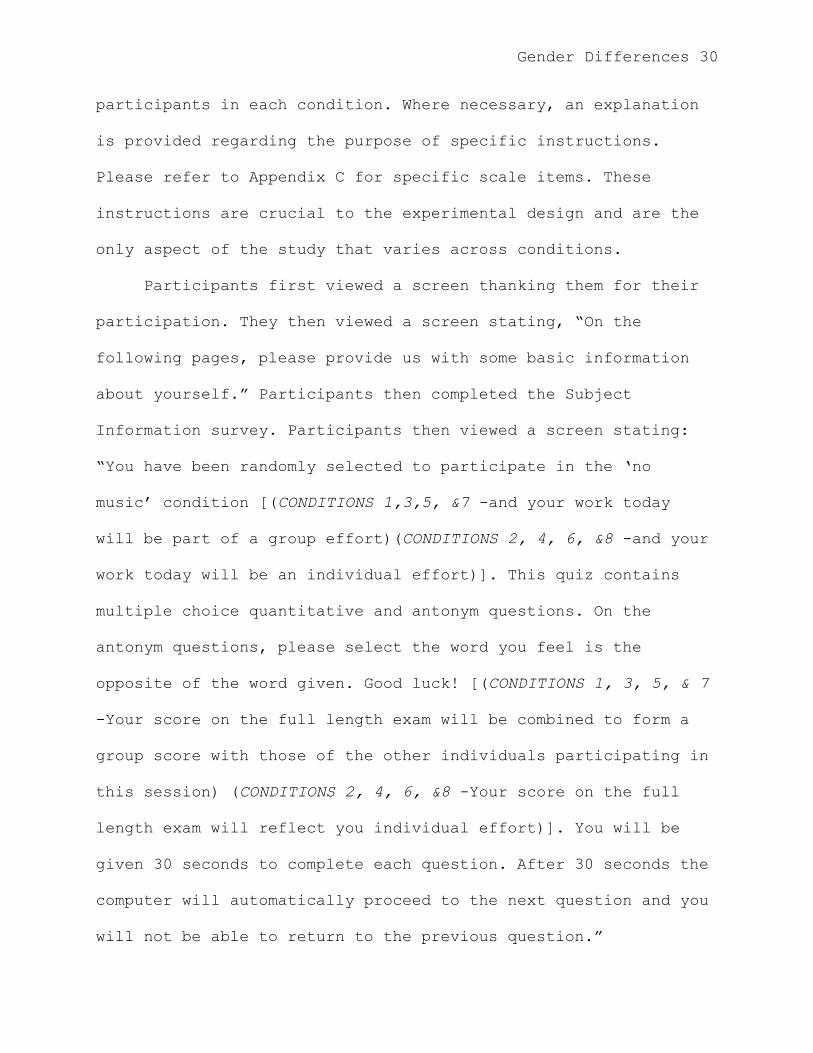
Fig.6. Experimental Conditions
To be clear, the experimental instructions will be listed
verbatim and in the order in which they appeared to the
1 2
3 4
MEN
Group Status
Cau
se o
f Fa
ilure
Paw
nOrigin
IndividualGroup
5 6
7 8Cau
se o
f Fa
ilure
Paw
nOrigin
WOMEN
Group Status
Group Individual
Gender Differences 30
participants in each condition. Where necessary, an explanation
is provided regarding the purpose of specific instructions.
Please refer to Appendix C for specific scale items. These
instructions are crucial to the experimental design and are the
only aspect of the study that varies across conditions.
Participants first viewed a screen thanking them for their
participation. They then viewed a screen stating, “On the
following pages, please provide us with some basic information
about yourself.” Participants then completed the Subject
Information survey. Participants then viewed a screen stating:
“You have been randomly selected to participate in the „no
music‟ condition [(CONDITIONS 1,3,5, &7 -and your work today
will be part of a group effort)(CONDITIONS 2, 4, 6, &8 -and your
work today will be an individual effort)]. This quiz contains
multiple choice quantitative and antonym questions. On the
antonym questions, please select the word you feel is the
opposite of the word given. Good luck! [(CONDITIONS 1, 3, 5, & 7
-Your score on the full length exam will be combined to form a
group score with those of the other individuals participating in
this session) (CONDITIONS 2, 4, 6, &8 -Your score on the full
length exam will reflect you individual effort)]. You will be
given 30 seconds to complete each question. After 30 seconds the
computer will automatically proceed to the next question and you
will not be able to return to the previous question.”
Gender Differences 31
Participants then completed the full length exam. Participants
are then shown a screen indicating that the computer is scoring
their exam, followed by a screen informing them that they
answered 4 out of 10 questions correctly. Participants then
viewed a screen that stated, [(CONDITIONS 1, 2, 5, &6 -“Research
shows that, at times, even hard working intelligent people can
perform poorly due to being in a bad mood. We're confident that
you must have been in a poor mood today, otherwise you clearly
would have performed better. Don‟t be too hard on yourself, even
though your group‟s score will suffer, it‟s not your fault you
didn‟t do well.)(CONDITIONS 3, 4, 7, &8 -“Research shows that,
at times, even hard working intelligent people don‟t exert their
full effort on all tasks. We‟re confident that you must not have
put forth your best effort today, otherwise you clearly would
have performed better.)] This scale consists of a number of
different words that describe different feelings and emotions.
Read each item and then mark the appropriate answer in the space
next to that word. Indicate to what extent you feel this way
right now, that is, at the present moment.” Participants then
completed the PANAS. Participants then viewed a screen stating:
“This questionnaire is designed to measure your current
attitudes. These questions are highly subjective, therefore
there is no single "right" answer to any of these questions. The
best answer is what you feel is true at this moment. Be sure to
Gender Differences 32
answer all of the items, even if you are not sure of the best
answer. Again, answer these items according to how you feel
right now.” Participant then completed the Heatherton & Polivy
State Self-Esteem Scale. Participants then viewed a screen
stating: “Please rate the extent to which you feel the following
items would have had an impact on your performance today.”
Participants then completed the Research Opinion Survey.
Participants then viewed a screen stating: “Take a minute to
think about the other individuals participating in this study
with you.” and then completed the Inclusion of Others in Self
Scale. Participants then viewed a screen stating, “For each of
the following statements, please indicate how strongly you agree
or disagree with the statement” and then completed the
Manipulation Check. Participants then viewed a screen stating,
“Please rate the following items according to the scale
provided” and then completed the Subjective Overachievement
Scale. Participants then viewed a screen stating, “Please rate
the extent to which you agree with the following items” and then
completed the Self-Handicapping Scale, and were then debriefed.
Results
All of the ANOVAs for Study 2 were run with group status,
cause of failure, and gender as independent variables. Using
“total state self-esteem” as the dependent variable there was a
significant main effect of gender F(1,85)=6.007, p<.05.
Gender Differences 33
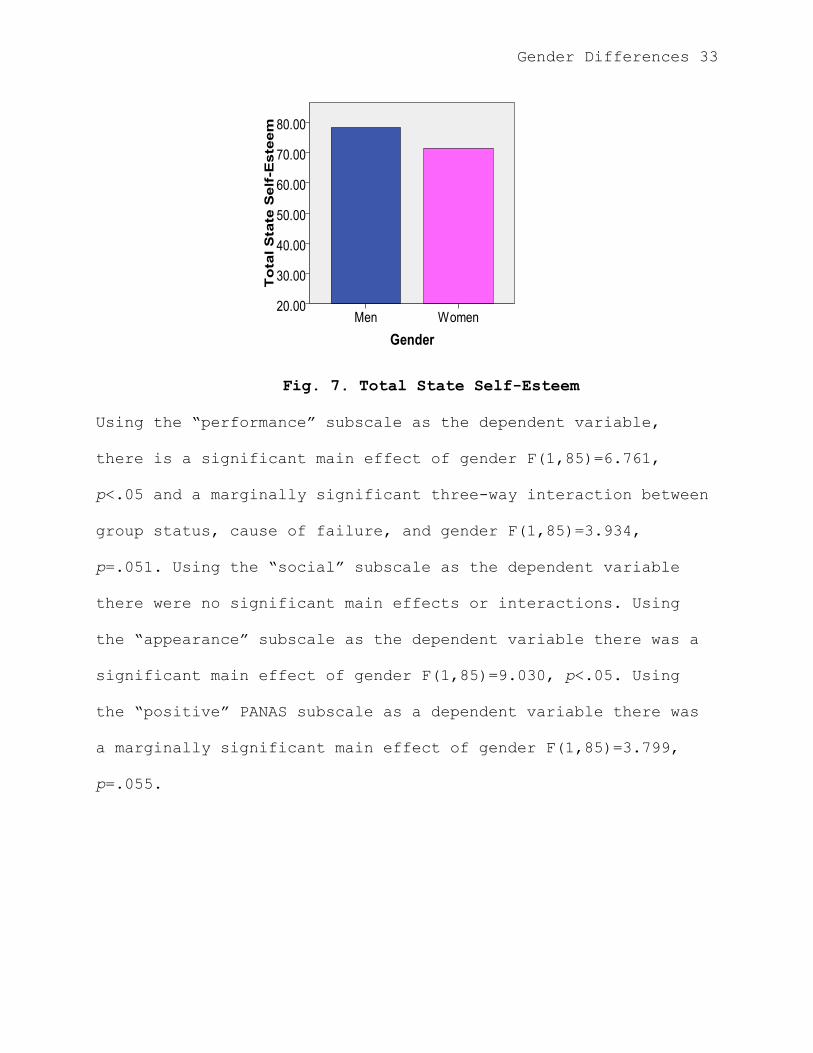
Fig. 7. Total State Self-Esteem
Using the “performance” subscale as the dependent variable,
there is a significant main effect of gender F(1,85)=6.761,
p<.05 and a marginally significant three-way interaction between
group status, cause of failure, and gender F(1,85)=3.934,
p=.051. Using the “social” subscale as the dependent variable
there were no significant main effects or interactions. Using
the “appearance” subscale as the dependent variable there was a
significant main effect of gender F(1,85)=9.030, p<.05. Using
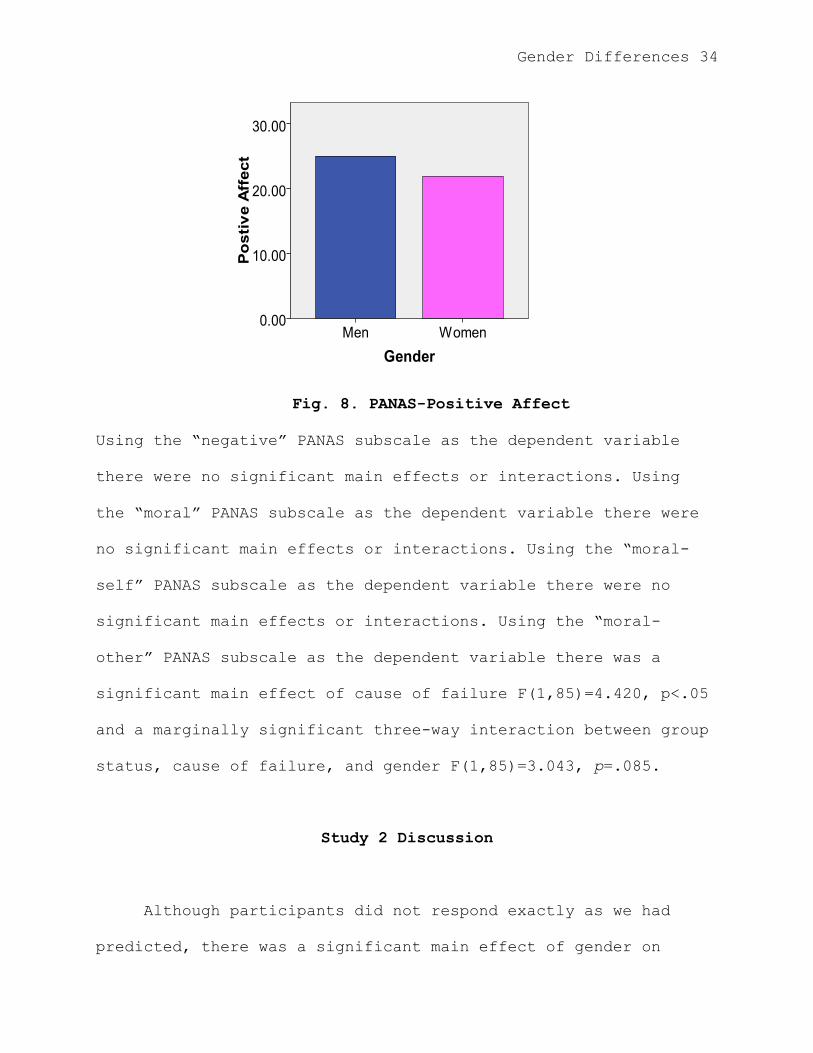
the “positive” PANAS subscale as a dependent variable there was
a marginally significant main effect of gender F(1,85)=3.799,
p=.055.
Gender Differences 34
Fig. 8. PANAS-Positive Affect
Using the “negative” PANAS subscale as the dependent variable
there were no significant main effects or interactions. Using
the “moral” PANAS subscale as the dependent variable there were
no significant main effects or interactions. Using the “moral-
self” PANAS subscale as the dependent variable there were no
significant main effects or interactions. Using the “moral-
other” PANAS subscale as the dependent variable there was a
significant main effect of cause of failure F(1,85)=4.420, p<.05
and a marginally significant three-way interaction between group
status, cause of failure, and gender F(1,85)=3.043, p=.085.
Study 2 Discussion
Although participants did not respond exactly as we had
predicted, there was a significant main effect of gender on
Gender Differences 35
overall state self-esteem as well as all of the subscales except
“social”. Women had lower state self-esteem than men. Since the
Heatherton and Polivy State Self-Esteem Scale was given after
the failure feedback, it appears that the feedback was more
deeply internalized by women. However, it cannot be inferred
from this data that cause of failure played a moderating role in
reported state self-esteem.
Participants PANAS scores also lend support to this
interpretation. Women reported less positive affect than men.
However, there was no main effect of gender on negative affect.
Interestingly, there was a significant main effect of cause of
failure on the moral-other subscale of the PANAS. This is
strange for a couple of reasons. First, these are moral emotions
that are thought to be felt when we witness another person
violate a moral code. Given the nature of our design, one would
expect participants to feel moral-self emotions. Second,
participants reported higher moral-other emotions in the pawn
conditions. Following the logic of our design, this is the
opposite of what one would expect.
General Discussion
It is interesting to note that women‟s state self-esteem is
more deeply affected by failure feedback than men‟s. However,
Gender Differences 36
our ability to make inferences based on data from Study 2 is
limited. Since the bulk of our significant findings are in Study
1, our discussion focuses on those findings. However, it should
be noted that we can still answer the primary question posed in
Study 2 with a fair degree of confidence from data in Study 1.
After analyzing the data for both Studies 1 and 2 it is
clearer now that participants must actually experience events or
be given plausible projected attributions for failure to form
meaningful attributions about their causes, at least regarding
their own actions. Apparently, lack of effort is more implicitly
understood by participants to be a self-handicap, as it was
recognized by some participants as an opportunity to self-
handicap. However, mood appears to not be as intuitively
understood as a self-handicap.
It has been observed in other research that self-
handicapping occurs in sports (Coudevylle, Ginis, & Famose,
2008) and academic (Thomas & Gadbois, 2007) contexts. These are
both situations in which the exertion of effort is a key
component of success. The self-handicapping framework can also
be used to understand drug and alcohol abuse (Berglas & Jones,
1978). Therefore, if the psychological underpinnings of the
self-handicapping phenomenon can be further elucidated, it may
be possible to eradicate this undesirable behavior. It is now
known that self-doubt is largely responsible for motivating
Gender Differences 37
individuals to engage in this behavior (Oleson, Poehlmann, Yost,
Lynch, & Arkin, 2000). It may now be important for researchers
to turn their attention to those individuals who will not self-
handicap, namely women. From our research, it appears that even
when self-doubtful, women will not self-handicap in group
situations. One possible remedy for a lack of effort among
athletes, employees, and students may be to get them to value
the well being of others and then tie their performance to the
well being of others in a meaningful way. Our research also
suggests that women do not like to think of themselves as not
exerting their best effort. Future research should seek to
uncover why women regard effort so highly. If the psychological
underpinnings of this are discovered, it may be possible to
teach self-handicappers to value effort more highly.
Limitations and Future Directions
One particularly elegant method of capturing the
psychological mechanisms underpinning any given behavior is to
“turn it on its head”. In other words, when the experimenter has
isolated variables that are truly responsible for a significant
portion of said behavior, it should be possible to manipulate
that variable in such a way that participants who normally would
not engage in the behavior are now more likely to.
Gender Differences 38
Given the robust finding in much of the self-handicapping
literature that women are less likely to self-handicap than are
men, we knew that the task of designing an experiment to get
women to self-handicap would not be an easy one. Mindful of the
fact that our hypotheses and operationalizations of self-
handicapping related constructs were entirely new and the
potential difficulty of getting women to self-handicap, we
consider our studies to be somewhat exploratory and designed
them with some caution. It was unclear at the outset whether
poor mood would be viewed by participants as an opportunity to
self-handicap or to express how they were actually feeling. As
such, participants were given the opportunity to report their
mood in Studies 1 and 2, but it was expected that mood would
serve a different function in each case. Specifically, based on
prior research (Oleson, Poehlmann, Yost, Lynch, & Arkin, 2000)
it was expected in Study 1 that mood would serve as a dependent
measure of self-handicapping. In Study 2 it was expected that
reported mood would serve as a window into the emotional lives
of our participants, thus revealing their reasoning for whether
or not they would self-handicap.
Study 1
Gender Differences 39
One of the major limitations of Study 1 was our non-
significant projected effort finding. Given the fact that the
results did trend in the predicted direction, we are confident
that we have identified the right constructs. Our downfall seems
to be our operationalizations of the constructs. The non-
significance of the projected effort findings can likely be
attributed to a weak manipulation of group status and a lack of
incentive to perform well. Specifically, rather than simply
telling participants on the computer screen that they are part
of a group after they have already met the participants we now
know that some actual activity to create a sense of group
membership is likely needed. Additionally, in order for
participants to self-handicap in the directions in which we
predicted they must first value the task outcome. If this
prerequisite is not met, participants would have no identity to
protect via self-handicapping. It appears that most of the
participants did not care about the outcome of the task.
A third potential contributor to the non-significance of
the projected effort finding may be our dependent measure of
self-handicapping. As is the case with many psychological
instruments in the developmental stage, some of our scale items
did not perform well and were removed from our data analysis.
This left us with only one item, which is problematic for two
reasons. First, using only one item is not statistically sound.
Gender Differences 40
Second, the wording of this one item may not have been
interpreted as a self-handicap to many of our participants.
Finally, the projected effort measure is unique in that it
actually represents a “claimed/behavioral” self-handicap. It is
not entirely clear what the implications of this may be, or if
it is even a limitation. Nonetheless, we thought it was
important to point out because, to our knowledge, no other study
has used a measure of this nature. This appears to have
influenced responses in “individual/pawn” conditions.
Study 2
The goal of Study 2 was to investigate why men and women
behave differently in self-handicapping situations. Given the
difficulty of creating a situation in which women are compelled
to self-handicap, we attempted to answer our question by
informing them that they had done precisely what they would not
have done naturally and then imposing an attribution for their
failure. Our window into their psyche was going to be their
emotional lives. It is not entirely clear where our experimental
manipulations failed, as almost none of the manipulations
yielded significant results. This leaves us with very little to
interpret. Again, it does seem that we have identified the
correct construct but did not optimally define it. We say this
Gender Differences 41
because our dependent measure in Study 1 behaved in the way we
anticipated in Study 2.
To our knowledge, this type of manipulation, where an
attribution is provided after the fact has not been used in
prior research. Unfortunately, it does not work. It appears that
participants have already formed their own attributions after
having completed the task and receiving failure feedback.
Apparently, these attributions are not very malleable.
Participants are more sensitive to projected effort
manipulations regarding events that have not yet occurred. This
is likely because the event has not yet occurred and so the
attribution we provide for potential failure seems plausible to
the participants.
Future Directions
Having conducted our studies we can now state with a fair
degree of confidence that women are less likely to self-handicap
in group situations and that the exertion of effort is regarded
highly by women. However, based on our data we still cannot
state that women will not self-handicap in group situations and
that this is due to the moralization of effort. Our findings do
not refute this claim and they do not support it. The key
conditions of Study 1 were the “pawn/individual” and
Gender Differences 42
“group/origin” conditions. To confidently state that women will
not self-handicap in group situations and that this is due to
the “moralization” of effort, it should have been the case that
women would not self-handicap in “group/origin” conditions but
would readily self-handicap in the “individual/pawn” conditions.
It may be that women did not self-handicap in the
“individual/pawn” conditions because they self-handicap offered
involved a lack of effort.
As a follow up to these studies, we will be conducting a
meta-analysis of the self-handicapping and social loafing
literatures to further investigate the value of the exertion of
effort. All relevant studies will be coded according to two
primary criteria regarding the experimental task. First, they
will be coded for how intrinsically or extrinsically motivating
the task is. Second, they will be coded for whether or not it is
a group oriented task. It is expected that women will be less
likely to withdraw effort in intrinsically motivating tasks than
men, presumably because men find it a waste of time to exert
effort unless it is for some specific purpose or reward.
If there truly is a gender difference in the value of
effort, it should be possible to create a scale that captures
this and that can be generalized across task domains. We have
developed and administered the “Value of Effort Scale” and will
be analyzing the data soon. It is our hope that this scale will
Gender Differences 43
capture the gender difference in the value of effort that we
believe exists. The next step would be to administer the scale
to participants in a self-handicapping study to see if the value
of effort really does predict self-handicapping behavior.
Gender Differences 44
References
Aron, A & Fraley, B (1999). Relationship closeness as including
other in the self: Cognitive underpinnings and measures.
Social Cognition, 17, 140-160.
Baumgardner, A. H., Lake, E. A., & Arkin, R. M. (1985).
Claiming mood as a self-handicap: The influence of spoiled
and unspoiled public identities. Personality and Social
Psychology Bulletin, 11, 349-357.
Berglas, S. & Jones, E. E. (1978). Drug choice as a self-
handicapping strategy in response to noncontingent
success. Journal of Personality and Social Psychology, 36,
405-417.
Coudevylle, G. R., Ginis, K. M., & Famose, J-P (2008).
Determinants of self-handicapping strategies in sport and
their effects on athletic performance. Social Behavior and
Personality, 36, 391-398.
Heatherton, T. F. & Polivy, J. (1991). Development and
validation of a scale for measuring state self-esteem.
Journal of Personality and Social Psychology, 60, 895-910.
Jones, E. E. & Berglas, S. (1978). Control of attributions
Gender Differences 45
about the self through self-handicapping strategies: The
appeal of alcohol and the role of underachievement.
Personality and Social Psychology Bulletin, 4, 200-206.
Jones, E.E. & Rhodewalt, F. (1982). The Self-Handicapping
Scale. Princeton, NJ: Princeton University.
Karau, S. J. & Williams, K. D. (1993). Social loafing: A meta-
analytic review and theoretical integration. Journal of
Personality and Social Psychology, 65, 681-706.
McCrea, S. M., Hirt, E. R., Hendrix, K. L., Milner, B. J.,
Steele, N. L. (2008). The worker scale: Developing a
measure to explain gender differences in behavioral self-
handicapping. Journal of Research in Personality, 42, 949-
970.
McCrea, S. M., Hirt, E. R., Milner, B. J. (2008). She works
hard for the money: Valuing effort underlies gender
differences in behavioral self-handicapping. Journal of
Experimental Social Psychology, 44, 292-311.
McFarland, C., & Ross, M. (1982). Impact of causal attributions
on affective reactions to success and failure. Journal of
Personality and Social Psychology, 43, 937-946.
Gender Differences 46
Oleson, K. C., Poehlmann, K. M., Yost, J. H., Lynch, M. E., &
Arkin, R. M. (2000). Subjective overachievement: Individual
differences in self-doubt and concern with performance.
Journal of Personality, 68, 491-524.
Reich, D. A. & Arkin, R. M. (2006. Self-Doubt, attributions, and
the perceived implicit theories of others. Self and
Identity, 5, 89-109.
Rozin, P., Lowery, L., Imada, S. & Haidt, J., (1999). The CAD
triad hypothesis: A mapping between three moral emotions
(contempt, anger, disgust) and three moral codes
(community, autonomy, divinity). Journal of Personality
and Social Psychology, 76, 574-586.
Synder, C. R., Sympson, S. C., Ybasco, F. C., Borders, T. F.,
Babyak, M. A., & Higgins, R. L. (1996). Development and
Validation of the State Hope Scale. Journal of Personality
and Social Psychology, 70, 321-335.
Stark, E. M., Shaw, J. D., Duffy, M. K. (2007). Preference for
group work, winning orientation, and social loafing
behavior in groups. Group & Organization Management, 32,
699-723.
Thomas, C. R., & Gadbois, S. A. (2007). Academic self-
Gender Differences 47
handicapping: The role of students‟ learning strategies.
British Journal of Educational Psychology, 77, 101-119.
Watson, D., Clark, L.A., Tellegen, A. (1988). Development and
validation of brief measures of positive and negative
affect: The PANAS scales. Journal of Personality and Social
Psychology, 54, 1063-1070.
Gender Differences 48
Appendix A
Message posted on OSU website to recruit participants
Hello, Fellow Buckeye, and thank you for your interest in
psychology research at Ohio State. You are invited to
participate in a study designed to investigate the impact of
classical music on analytical reasoning skills. The questions
will be taken directly from previously administered GRE tests so
this experiment will serve two purposes. First, it will provide
us (the experimenters) with the data we need to determine the
extent to which classical music impacts mathematical and verbal
reasoning skills. Second, it will provide you as a student with
valuable information about your strengths and weaknesses in
these areas so that you can adequately prepare for exams
containing similar material. Please note that there will be two
experimental conditions. You will only be participating in one
of them. In Condition 1, classical music will be played in the
background as you complete your exam, Condition 2 is a control
condition where no music is played. Thank you for your interest
and we hope to see you soon!
Gender Differences 49
Appendix B
Experimental Instructions
“Hello, my name is ______. I will be calling names for
experiment SRA5R1. Please raise your hand when I call your name.
Thanks for coming today, we really appreciate your
participation. If you could, please follow me to the laboratory
so we can get started.”
Experimenter then leads the participants to the waiting room and
states:
“Please have a seat at the table. First, I‟ll be reading you the
experimental instructions. I will then get the computers ready
so that you may begin the experiment. You will each be sitting
at your own computer throughout the entire experiment. As you
read on the REP website, the experiment today has been designed
to assess the impact of classical music on analytical reasoning.
Since reasoning abilities will be measured throughout the
experiment, in order to avoid distraction, we ask that you not
talk to the other participants for any reason. At the end of the
experiment the computer will automatically generate performance
feedback that is diagnostic of your mathematical and verbal
reasoning ability. All of the experimental instructions from
this point forward will be presented to you on the computer
Gender Differences 50
screen where you will be sitting. On most screens, you may press
the continue button in the bottom right hand corner to proceed
to the next screen when you are ready. However, there are a
couple of screens where there is no continue button. On these
screens the computer will advance to the next section
automatically after a certain number of seconds. At the end of
the experiment, the computer will display a screen asking you to
inform the experimenter. At that point, please see me for an REP
student survey. I‟ll be right outside the door. The experiment
will last for 30 minutes. If you are not finished within the 30
minutes you may leave. Your participation is entirely voluntary
and you may leave at any time that you wish. If you should
choose to do so you will still receive credit for the
experiment. Please feel free to get me if you have any
questions.”
Gender Differences 51
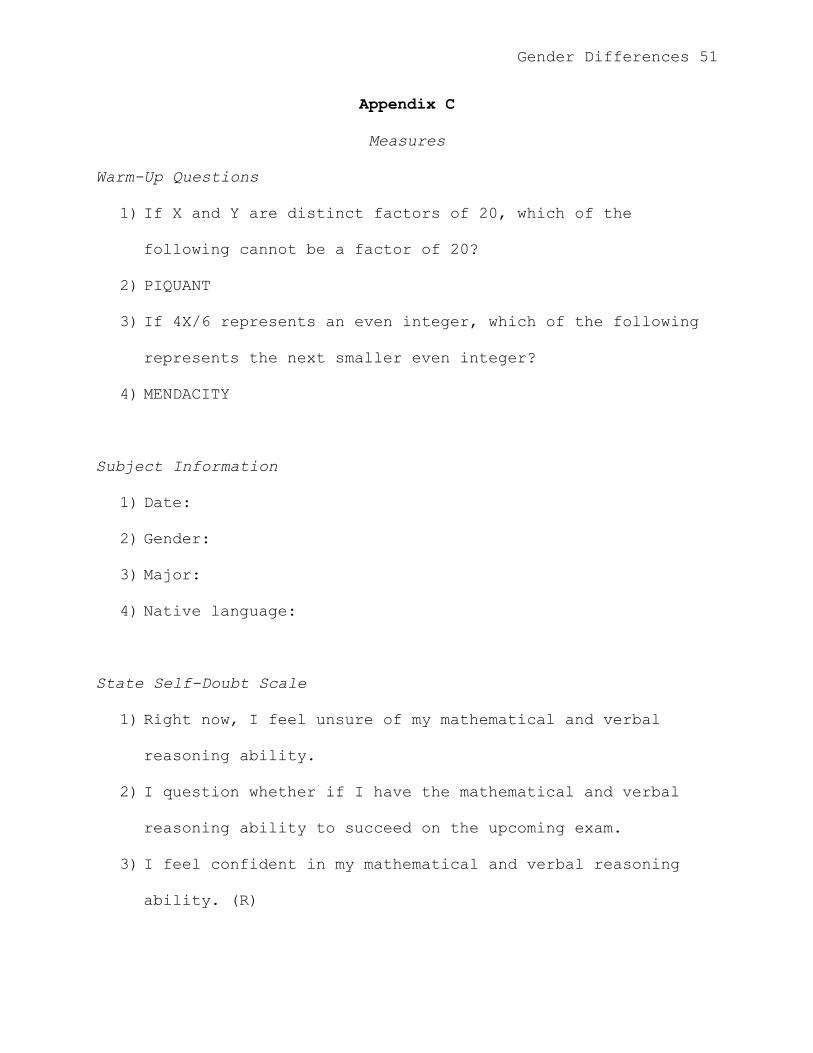
Appendix C
Measures
Warm-Up Questions
1) If X and Y are distinct factors of 20, which of the
following cannot be a factor of 20?
2) PIQUANT
3) If 4X/6 represents an even integer, which of the following
represents the next smaller even integer?
4) MENDACITY
Subject Information
1) Date:
2) Gender:
3) Major:
4) Native language:
State Self-Doubt Scale
1) Right now, I feel unsure of my mathematical and verbal
reasoning ability.
2) I question whether if I have the mathematical and verbal
reasoning ability to succeed on the upcoming exam.
3) I feel confident in my mathematical and verbal reasoning
ability. (R)
Gender Differences 52
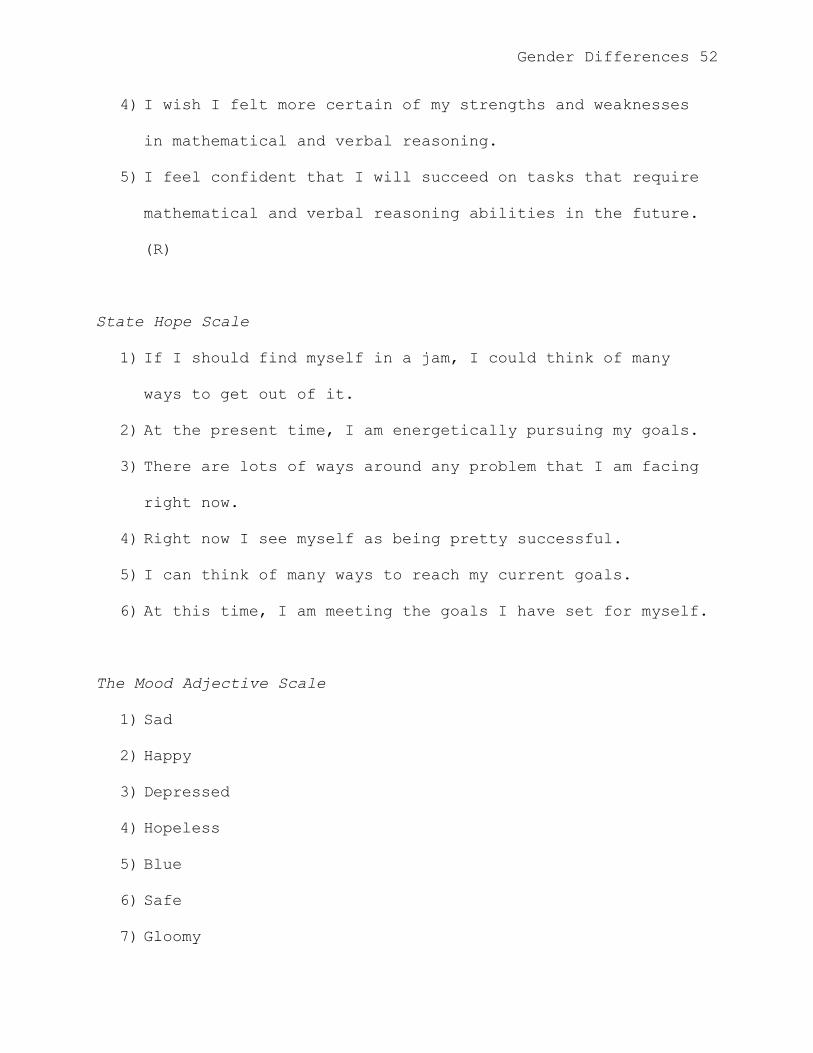
4) I wish I felt more certain of my strengths and weaknesses
in mathematical and verbal reasoning.
5) I feel confident that I will succeed on tasks that require
mathematical and verbal reasoning abilities in the future.
(R)
State Hope Scale
1) If I should find myself in a jam, I could think of many
ways to get out of it.
2) At the present time, I am energetically pursuing my goals.
3) There are lots of ways around any problem that I am facing
right now.
4) Right now I see myself as being pretty successful.
5) I can think of many ways to reach my current goals.
6) At this time, I am meeting the goals I have set for myself.
The Mood Adjective Scale
1) Sad
2) Happy
3) Depressed
4) Hopeless
5) Blue
6) Safe
7) Gloomy
Gender Differences 53
8) Secure
9) Downhearted
10) Perky
11) Disappointed
12) Content
13) Dissatisfied
14) Joyful
15) Displeased
16) Hopeful
17) Discouraged
18) Troubled
19) Discontented
20) Optimistic
21) Frustrated
22) Glad
23) Upset
24) Pessimistic
25) Strong
26) Angry
27) Blessed
28) Mad
29) Blissful
30) Disgusted
31) Carefree
Gender Differences 54
32) Vindictive
33) Radiant
34) Worried
35) Insecure
36) Overjoyed
37) Unsafe
38) Pleased
39) Fearful
40) Fortunate
41) Panicked
42) Helpless
*Sadness Subscale- 1, 3, 5, 7, 9, 11, 13, 15, 17, 19, 18, 21,
23, 4, 24
*Anger Subscale- 26, 28, 30, 32
*Threat Subscale- 34, 35, 37, 39, 41, 42
*Safety Subscale- 6, 8
Projected Effort
1) Please rate the extent to which you intend to try hard
today.(R)
2) Please rate the extent to which you intend to disengage
today.
3) Please rate the extent to which you intend to withhold
effort today.
Gender Differences 55
Full Length Exam
1) An antibiotic is added to a culture of bacteria and is
found to kill 1/3 of the bacteria in the culture every 30
seconds. If a laboratory assistant checks the culture after
2 minutes, what fraction of the original bacteria will have
been killed?
2) If 3^n = 81, then n^3 =
3) LACHRYMOSE
4) If 4X - 12 =3 + X, then X =
5) If X and Y are both positive odd integers, which of the
following must be odd? I. X^Y II. X^Y+3 III. (X+3)^Y
6) PROLIXITY
7) If X^2 -2XY + Y^2 =5 then (X-Y)^6=
8) If A= (X-Y) + Z and B= X- (Y+Z), then A-B=
9) If an aircraft increases its speed by 25 percent and then
increases this speed by 20 percent, what percent of the
original speed is the increase in speed?
10) NOISOME
Research Opinion Survey
1) The weather.
2) My mood.
3) The amount of effort I exerted.
Gender Differences 56
4) What I had for lunch.
5) My political stance.
6) My work today was: A) part of a group effort B) part of an
individual effort
Manipulation Check (adapted from J.L. Smith, 2002)
1) While I was working on the full length exam I lost track of
time.
2) I would describe the exam I took today as very interesting.
3) I am satisfied with my performance on this exam.
4) I think that the exam I took today was valuable.
5) The exam I took today was boring. (R)
6) Overall, I perceived the exam I took today as very
difficult. (R)
7) This experiment was fun to participate in.
8) While working on the exam, I thought about things unrelated
to the experiment. (R)
9) The exam I took today was easy to understand.
10) The exam I took today was a worthwhile thing to do.
11) I felt I had a lot of choice in taking this exam today.
12) I think I did very well on the exam I took today.
13) While working on the exam, I was totally absorbed.
*Flow Subscale- 1, 2, 5, 6, 7, 8, 13
*Attitudes Subscale- 3, 4, 9, 10, 11, 12
Gender Differences 57
The Subjective Overachievement Scale
Concern with Performance Scale Items
1) It is important that I succeed in all that I do.
2) Failure has its advantages. (R)
3) Failure is unacceptable to me.
4) I think in some situations it is important that I not
succeed. (R)
5) Sometimes I am more comfortable when I lose or do poorly.
(R)
6) I try to avoid being too successful. (R)
7) For me, being successful is not necessarily the best thing.
(R)
8) There are some situations where I think it is better that I
fail. (R)
9) I strive to be successful at all times.
Self-Doubt Scale Items
1) When engaged in an important task, most of my thoughts turn
to bad things that might happen (e.g., failing) than to good.
2) For me, avoiding failure has a greater emotional impact
(e.g., sense of relief) than the emotional impact of achieving
success (e.g., joy, pride).
3) More often than not I feel unsure of my abilities.
Gender Differences 58
4) I sometimes find myself wondering if I have the ability to
succeed at important activities.
5) I often wish that I felt more certain of my strengths and
weaknesses
6) As I begin an important activity, I usually feel confident
in my ability. (R)
7) Sometimes I feel that I don't know why I have succeeded at
something.
8) As I begin an important activity, I usually feel confident
in the likely outcome. (R)
The Self-Handicapping Scale
1) When I do something wrong, my first impulse is to blame the
circumstances.
2) I suppose I feel "under the weather" more often than most
people.
3) I am easily distracted by noises or my own creative
thoughts when I try to read.
4) I try not to get too intensely involved in competitive
activities so it will not hurt too much if I lose or do
poorly.
5) I sometimes enjoy being mildly ill for a day or two because
it takes off the pressure.
Gender Differences 59
6) I would do much better if I did not let my emotions get in
the way.
7) I admit that I am tempted to rationalize when I do not live
up to others' expectations.
8) I often think I have more than my share of bad luck in
sports, card games, and other measures of talent.
9) I overindulge in food and drink more than I should.
10) I never let emotional problems in one part of my life
interfere with things in my life. (R)
11) Sometimes I get so depressed that even easy tasks become
difficult.
12) I tend to put things off to the last moment.
13) I tend to over prepare when I have any kind of exam or
"performance". (R)
14) I always try to do my best, no matter what. (R)
15) Before I sign up for a course or engage in any important
activity, I make sure I have the proper preparation or
background. (R)
16) I would do a lot better if I tried harder.
17) I generally hate to be in any condition but "at my best".
(R)
18) I would rather not take any drug that interfered with my
ability to think clearly and do the right thing. (R)
Gender Differences 60
19) When something important is coming up, like an exam or job
interview, I try to get as much sleep as possible the night
before. (R)
PANAS
1) Interested
2) Distressed
3) Embarrassed
4) Upset
5) Strong
6) Contempt
7) Scared
8) Hostile
9) Enthusiastic
10) Angry
11) Irritable
12) Alert
13) Ashamed
14) Inspired
15) Disgust
16) Determined
17) Attentive
18) Jittery
19) Active
Gender Differences 61
20) Afraid
21) Proud
22) Guilty
23) Excited
24) Nervous
*Positive Subscale- 1, 5, 9, 12, 14, 16, 17, 19, 21, 23
*Negative Subscale- 2, 3, 4, 6, 7, 8, 10, 11, 13, 15, 18, 20,
22, 24
*Moral-Self Subscale- 3, 13, 22
*Moral-Other Subscale- 6, 10, 15
The Heatherton and Polivy State Self-Esteem Scale
1) I feel confident about my abilities.
2) I am worried about whether I am regarded as a success or
failure. (R)
3) I feel satisfied with the way my body looks right now.
4) I feel frustrated or rattled about my performance. (R)
5) I have trouble understanding the things that I read. (R)
6) I feel that others respect and admire me.
7) I am dissatisfied with my weight. (R)
8) I feel self-conscious. (R)
9) I feel as smart as others.
10) I feel displeased with myself. (R)
11) I feel good about myself.
Gender Differences 62
12) I am pleased with my appearance right now.
13) I am worried about what others think of me. (R)
14) I feel confident that I understand things.
15) I feel inferior to others at this moment. (R)
16) I feel unattractive. (R)
17) I feel concerned about the impression I am making. (R)
18) I feel that I have less scholastic ability right now than
others. (R)
19) I feel that I am doing well.
20) I am worried about looking foolish. (R)
*Performance Subscale- 1, 4, 5, 9, 14, 18, 19
*Social Subscale- 2, 8, 10, 13, 15, 17, 20
*Appearance Subscale- 3, 6, 7, 11, 12, 16
Gender Differences 63
Appendix D
Debriefing
Thank you very much for your participation. You should know
that some deception was necessary in this experiment. Sometimes
in research it is necessary to use deception. We cannot always
reveal the experimental purpose because it might affect our
results. If we tell people the purpose or predictions of the
experiment, they may deliberately do whatever it is they think
we want them to do, just to help us out. It is also possible
that if we tell people our predictions, they might deliberately
act in the opposite direction. In either situation, we would not
have a good indication of how people would normally act.
In this study, we are actually interested in what conditions
promote and inhibit excuse making and why. We are not at all
interested in the effects of classical music on mathematical and
verbal reasoning performance, and no participants were in the
“music” condition. This was merely a cover story for our
experiment.
Sometimes, when an individual‟s level of ability is questioned
by themselves or another person they make excuses for a poor
performance in order to protect an image of competence. Our
specific interest in this study is whether working individually
Gender Differences 64
or in a group will impact an individual‟s willingness to excuse
a poor performance by claiming a poor mood or to have not tried
hard. This will be assessed using the mood and effort ratings
given by participants on their questionnaires.
Your mathematics and verbal quizzes from the prescreening were
never actually graded. All participants were told that they did
well regardless of their actual performance. This was necessary
to provide a believable justification for inviting the
participants back in for either study one or study two.
You should also know that all participants were given failure
feedback on their “warm-up” quiz and “Full Length Exam”. Failure
feedback was given on the “warm-up” quiz to induce a feeling of
self-doubt, a feeling that is thought to promote excuse making.
All of the performance feedback that you received as a part of
the prescreening and the actual experiment were fabricated and
are NOT diagnostic of your actual ability.
When the data from this experiment is reported in the
manuscript, no information will be given that would allow you to
be identified as a participant. However, if you wish to have
your data removed from the collection of data that will be
reported, please inform the researcher of your request and it
will gladly be honored. If you have any further questions about

Gender Differences 65
this research project please do not hesitate to contact Josh
Eblin at [email protected], or the primary research investigator,
Dr. Robert Arkin at [email protected]. Again, thanks for your
participation!