Embed Size (px)
Citation preview
Atherosclerosis 133 (1997) 105–110
Gender differences and other determinants of the rise in plasmahomocysteine after L-methionine loading
Jonathan Silberberg a,*, Renee Crooks a,b, Jayne Fryer b, John Wlodarczyk b,Balakrishnan Nair a, Xu Wei Guo c, Li Juan Xie c, Nicholas Dudman c
a Cardio6ascular Unit, John Hunter Hospital, Locked Bag No 1, Hunter Region Mail Centre, NSW 2310, Australiab Discipline of Medicine, Uni6ersity of Newcastle, Newcastle, NSW 2308, Australia
c Centre for Thrombosis and Vascular Research, Uni6ersity of New South Wales, Prince Henry Hospital, Little Bay, NSW 2036, Australia
Received 18 November 1996; received in revised form 1 April 1997; accepted 2 May 1997
Abstract
The methionine load test is widely used to identify subjects with mild homocysteinemia. We studied factors influencing the risein plasma homocysteine (tHcy) levels following oral methionine loading, after taking into account determinants of the basal level.The study population comprised 522 persons (mean age 53, range 17 to 95; 63% male; 60% with coronary disease). tHcy wasmeasured fasting and 4 h after administration of L-methionine (dose 4g/m2). The percentage rise in tHcy was greater in females,at younger ages, and with lower serum creatinine. Basal tHcy was lower in those with high levels of serum folate, red cell folateand serum B12; they also showed a greater percentage rise with loading. After adjustment for age, creatinine and serum vitaminsthe percent rise was greater in females (mean 230%, S.D. 92) than in males (mean 172%, S.D. 71, PB0.0001). About 1/4 of thiseffect was explained by the methionine dose, but important independent gender effects remained. When the results of the loadingtest were compared with an overall reference range, females were systematically labelled as ‘high’ but comparison with age andgender-specific reference ranges normalised the sex distribution. Our data show that a single L-methionine loading protocol forboth sexes is not appropriate. Gender-specific reference ranges should be used to define post-load homocysteinemia and previousstudies which have identified a high proportion of females with this trait probably reflect the need for gender specific referenceranges. © 1997 Elsevier Science Ireland Ltd.
Keywords: Methionine loading; Hyperhomocysteinemia; Folate; Vitamin B12; Coronary heart disease
1. Introduction
A mildly raised level of total homocysteine (tHcy) inplasma is now recognised as a common risk factor foratherosclerosis. While some affected individuals displayhigh fasting levels of tHcy, others, such as obligateheterozygotes for cystathionine-b-synthase deficiency,show high levels only after oral methionine loading.
Methionine loading protocols are usually performedby administering oral L-methionine in a dose based onbody weight (0.1 g/kg)[1] or body surface area (4 g/m2)
[2] and are the same for males and females. We under-took this investigation to further examine determinantsof the response in plasma tHcy to oral methionineloading. We questioned whether existing protocols havea systematic tendency to label female subjects as havingmild homocysteinemia because of inappropriate refer-ence ranges.
2. Methods
All subjects in this report were participants in theNewcastle Family History Study, a case-control studyof familial coronary heart disease. Details of the Family
* Corresponding author. Tel.: +61 49 213542; fax: +61 49213537; e-mail: [email protected]
0021-9150/97/$17.00 © 1997 Elsevier Science Ireland Ltd. All rights reserved.PII S 0021 -9150 (97 )00122 -6
J. Silberberg et al. / Atherosclerosis 133 (1997) 105–110106
History Study have been reported elsewhere [3]. Thefirst 522 participants who attended are included in thisreport. We enrolled subjects aged under 70 years withsuspected acute coronary syndromes identified by theNewcastle MONICA project (n=193) [4] as well asother coronary cases attending the hospital (n=119).To establish an overall reference range we enrolledage-matched community controls, selected at randomfrom the New South Wales electoral roll (n=104), andother non-coronary subjects (n=56). We also enrolledapparently healthy, active members of the regions lawnbowling clubs aged over 75 years (n=50) to examinethe response of older persons. All participants wereinterviewed using a standardised questionnaire and de-tailed metabolic studies were undertaken which in-cluded measurement of body weight, waist to hip ratio,serum lipids and lipoproteins, serum and red cell folate,serum B12 and plasma tHcy levels before and after oralmethionine loading.
2.1. Methionine loading protocol
Subjects attended after an overnight fast. Fastingvenous blood was collected in EDTA tubes and held onice before spinning at 700×g (4°C) for 10 min andremoval of plasma. Oral L-methionine (Fisons ScientificEquipment, UK, dose 4 g/m2 [�0.1g/kg]) was thenadministered in orange juice, followed by a standard-ised low protein breakfast (estimated methionine con-tent 0.1 g). Subjects returned at 4 h for repeatvenipuncture.
2.2. Laboratory methods
Plasma was stored at −80°C and assayed in batches.tHcy was measured as the SBD-F derivative, as de-
Table 1Clinical characteristics of study subjects
Males Females
n 330 (63%) 192 (37%)53 (13) 53 (12)Age
98 (51)214 (65)Known coronary disease (n (%))Ever smoked (n (%)) 72 (40)204 (62)Vitamin use (n (%)) 95 (29) 85 (44)Serum B12 (pmol/l) 331 (224)327 (315)Serum folate (nmol/l) 19.0 (8)19.0 (10)
980 (363) 978 (332)Red cell folate (nmol/l)Serum creatinine (mmol/l) 0.09 (.02)0.10 (.02)
83 (13)Weight (kg) 70 (14)Body surface area (m2) 2.0 (0.2) 1.7 (0.2)
27 (6)27 (4)Body mass index (kg/m2)0.93 (0.06)Waist/hip ratio 0.80 (0.06)
Basal tHcy (mmol/l) 13.7 (5.6) 12.5 (4.7)2.47 (0.35)Log basal tHcy (logmmol/l) 2.56 (0.32)
36.0 (12.4) 39.3 (12.6)Post-methionine tHcy (mmol/l)26.8 (10.4)22.2 (9.3)Absolute difference tHcy (mmol/l)
% difference tHcy 230 (93)172 (71)
Values are mean (S.D.) unless otherwise stated.
scribed elsewhere [5]. Serum folate was measured bydual count radioimmunoassay and red cell folate andserum B12 by automated immunoassay using the SanofiPasteur Access kit. Lipids were measured by standardenzymatic methods.
2.3. Statistical methods
Basal tHcy distributions were positively skewed, sowe used the natural logarithm of tHcy to examineassociations by simple and multiple linear regressionanalysis. Explanatory variables considered were age,sex, smoking status (ever/never), coronary status, serumcreatinine, serum B12, serum folate and red cell folate.
Table 2Associations with basal homocysteine (mmol/l)
pre-load tHcy Log pre-load tHcy
Univariate regression coefficient (b) Multivariate regression coefficient (b)Univariate regression coefficient (b)
Male sex 1.24** 0.10*** 0.030.09****Age (years) 0.01**** 0.01****
−0.45 −0.01 0.0Coronary disease (yes/no)
1.14** 0.07*Ever smoked115.9****Creatinine 7.28**** 6.34****
Serum B12 −0.006**** −0.0003****−0.0005****−0.13**** −0.01****−0.01****Serum folate−0.0025****Red cell folate −0.0002****
Waist/hip ratio 6.62** 0.53***−1.6***Self-reported vitamin −0.12****
use−0.07*−0.97HDL-cholesterol
* PB0.05; ** PB0.01; *** PB0.001; **** PB0.0001.
J. Silberberg et al. / Atherosclerosis 133 (1997) 105–110 107
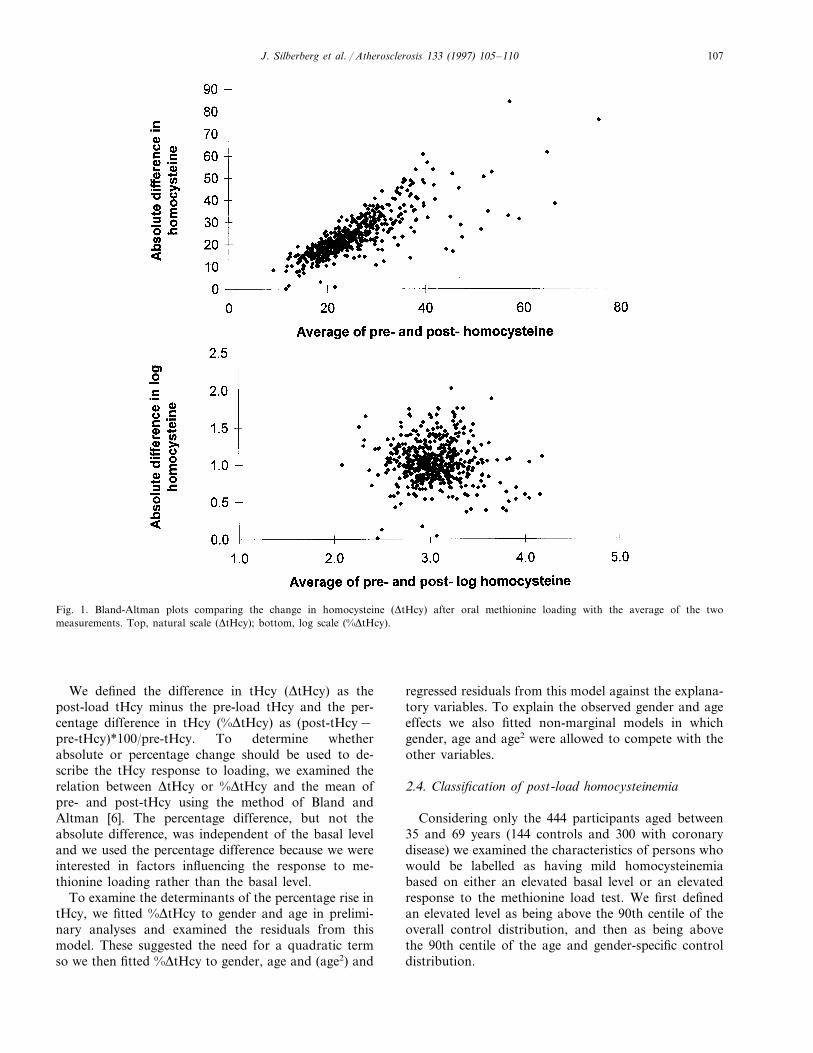
Fig. 1. Bland-Altman plots comparing the change in homocysteine (DtHcy) after oral methionine loading with the average of the twomeasurements. Top, natural scale (DtHcy); bottom, log scale (%DtHcy).
We defined the difference in tHcy (DtHcy) as thepost-load tHcy minus the pre-load tHcy and the per-centage difference in tHcy (%DtHcy) as (post-tHcy−pre-tHcy)*100/pre-tHcy. To determine whetherabsolute or percentage change should be used to de-scribe the tHcy response to loading, we examined therelation between DtHcy or %DtHcy and the mean ofpre- and post-tHcy using the method of Bland andAltman [6]. The percentage difference, but not theabsolute difference, was independent of the basal leveland we used the percentage difference because we wereinterested in factors influencing the response to me-thionine loading rather than the basal level.
To examine the determinants of the percentage rise intHcy, we fitted %DtHcy to gender and age in prelimi-nary analyses and examined the residuals from thismodel. These suggested the need for a quadratic termso we then fitted %DtHcy to gender, age and (age2) and
regressed residuals from this model against the explana-tory variables. To explain the observed gender and ageeffects we also fitted non-marginal models in whichgender, age and age2 were allowed to compete with theother variables.
2.4. Classification of post-load homocysteinemia
Considering only the 444 participants aged between35 and 69 years (144 controls and 300 with coronarydisease) we examined the characteristics of persons whowould be labelled as having mild homocysteinemiabased on either an elevated basal level or an elevatedresponse to the methionine load test. We first definedan elevated level as being above the 90th centile of theoverall control distribution, and then as being abovethe 90th centile of the age and gender-specific controldistribution.
J. Silberberg et al. / Atherosclerosis 133 (1997) 105–110108
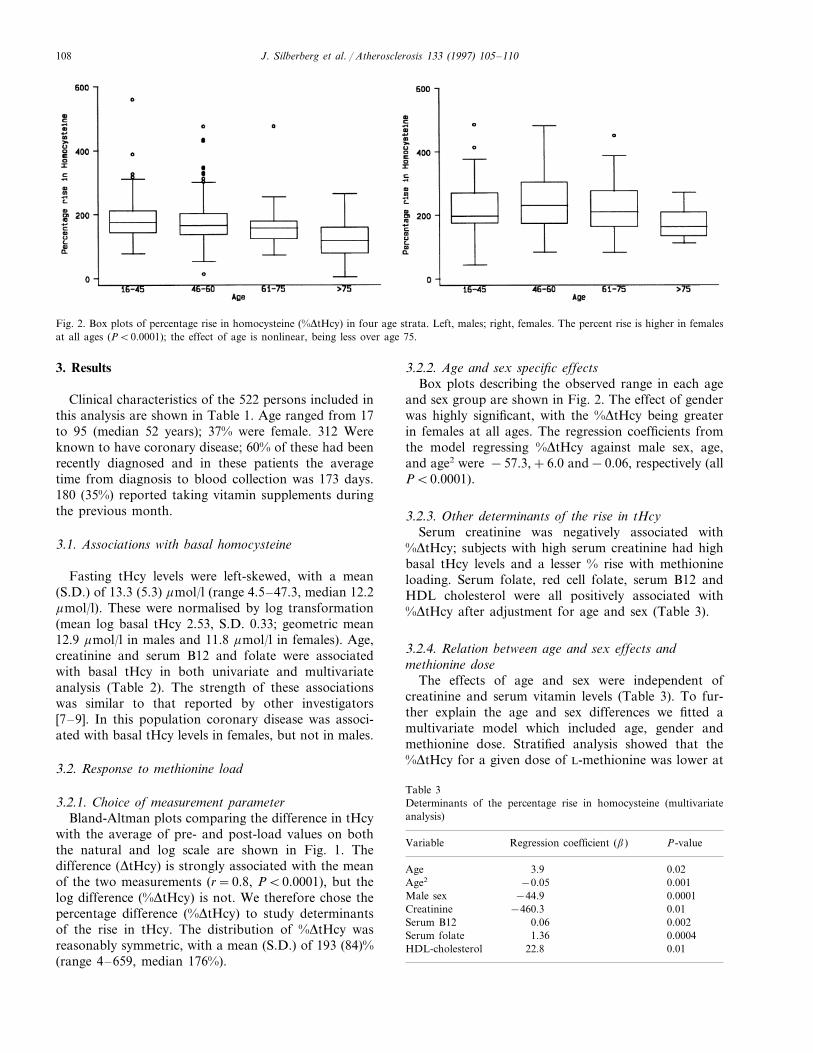
Fig. 2. Box plots of percentage rise in homocysteine (%DtHcy) in four age strata. Left, males; right, females. The percent rise is higher in femalesat all ages (PB0.0001); the effect of age is nonlinear, being less over age 75.
3. Results
Clinical characteristics of the 522 persons included inthis analysis are shown in Table 1. Age ranged from 17to 95 (median 52 years); 37% were female. 312 Wereknown to have coronary disease; 60% of these had beenrecently diagnosed and in these patients the averagetime from diagnosis to blood collection was 173 days.180 (35%) reported taking vitamin supplements duringthe previous month.
3.1. Associations with basal homocysteine
Fasting tHcy levels were left-skewed, with a mean(S.D.) of 13.3 (5.3) mmol/l (range 4.5–47.3, median 12.2mmol/l). These were normalised by log transformation(mean log basal tHcy 2.53, S.D. 0.33; geometric mean12.9 mmol/l in males and 11.8 mmol/l in females). Age,creatinine and serum B12 and folate were associatedwith basal tHcy in both univariate and multivariateanalysis (Table 2). The strength of these associationswas similar to that reported by other investigators[7–9]. In this population coronary disease was associ-ated with basal tHcy levels in females, but not in males.
3.2. Response to methionine load
3.2.1. Choice of measurement parameterBland-Altman plots comparing the difference in tHcy
with the average of pre- and post-load values on boththe natural and log scale are shown in Fig. 1. Thedifference (DtHcy) is strongly associated with the meanof the two measurements (r=0.8, PB0.0001), but thelog difference (%DtHcy) is not. We therefore chose thepercentage difference (%DtHcy) to study determinantsof the rise in tHcy. The distribution of %DtHcy wasreasonably symmetric, with a mean (S.D.) of 193 (84)%(range 4–659, median 176%).
3.2.2. Age and sex specific effectsBox plots describing the observed range in each age
and sex group are shown in Fig. 2. The effect of genderwas highly significant, with the %DtHcy being greaterin females at all ages. The regression coefficients fromthe model regressing %DtHcy against male sex, age,and age2 were −57.3,+6.0 and−0.06, respectively (allPB0.0001).
3.2.3. Other determinants of the rise in tHcySerum creatinine was negatively associated with
%DtHcy; subjects with high serum creatinine had highbasal tHcy levels and a lesser % rise with methionineloading. Serum folate, red cell folate, serum B12 andHDL cholesterol were all positively associated with%DtHcy after adjustment for age and sex (Table 3).
3.2.4. Relation between age and sex effects andmethionine dose
The effects of age and sex were independent ofcreatinine and serum vitamin levels (Table 3). To fur-ther explain the age and sex differences we fitted amultivariate model which included age, gender andmethionine dose. Stratified analysis showed that the%DtHcy for a given dose of L-methionine was lower at
Table 3Determinants of the percentage rise in homocysteine (multivariateanalysis)
Regression coefficient (b)Variable P-value
3.9Age 0.02Age2 0.001−0.05
−44.9Male sex 0.0001Creatinine −460.3 0.01
0.002Serum B12 0.060.00041.36Serum folate
HDL-cholesterol 22.8 0.01
J. Silberberg et al. / Atherosclerosis 133 (1997) 105–110 109
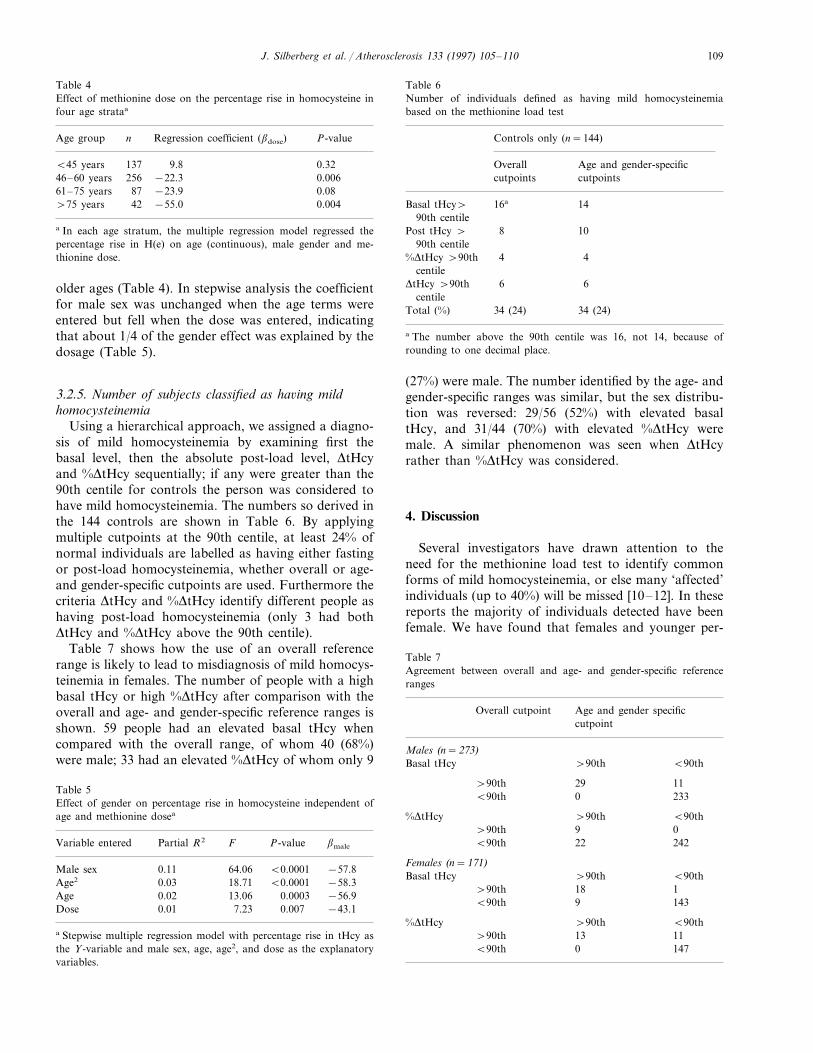
Table 4Effect of methionine dose on the percentage rise in homocysteine infour age strataa
Age group P-valueRegression coefficient (bdose)n
137 9.8 0.32B45 years0.006−22.346–60 years 256
87 −23.9 0.0861–75 years0.00442 −55.0\75 years
a In each age stratum, the multiple regression model regressed thepercentage rise in H(e) on age (continuous), male gender and me-thionine dose.
Table 6Number of individuals defined as having mild homocysteinemiabased on the methionine load test
Controls only (n=144)
Overall Age and gender-specificcutpoints cutpoints
Basal tHcy\ 1416a
90th centile8Post tHcy \ 10
90th centile4%DtHcy \90th 4
centileDtHcy \90th 66
centileTotal (%) 34 (24) 34 (24)
a The number above the 90th centile was 16, not 14, because ofrounding to one decimal place.
older ages (Table 4). In stepwise analysis the coefficientfor male sex was unchanged when the age terms wereentered but fell when the dose was entered, indicatingthat about 1/4 of the gender effect was explained by thedosage (Table 5).
3.2.5. Number of subjects classified as ha6ing mildhomocysteinemia
Using a hierarchical approach, we assigned a diagno-sis of mild homocysteinemia by examining first thebasal level, then the absolute post-load level, DtHcyand %DtHcy sequentially; if any were greater than the90th centile for controls the person was considered tohave mild homocysteinemia. The numbers so derived inthe 144 controls are shown in Table 6. By applyingmultiple cutpoints at the 90th centile, at least 24% ofnormal individuals are labelled as having either fastingor post-load homocysteinemia, whether overall or age-and gender-specific cutpoints are used. Furthermore thecriteria DtHcy and %DtHcy identify different people ashaving post-load homocysteinemia (only 3 had bothDtHcy and %DtHcy above the 90th centile).
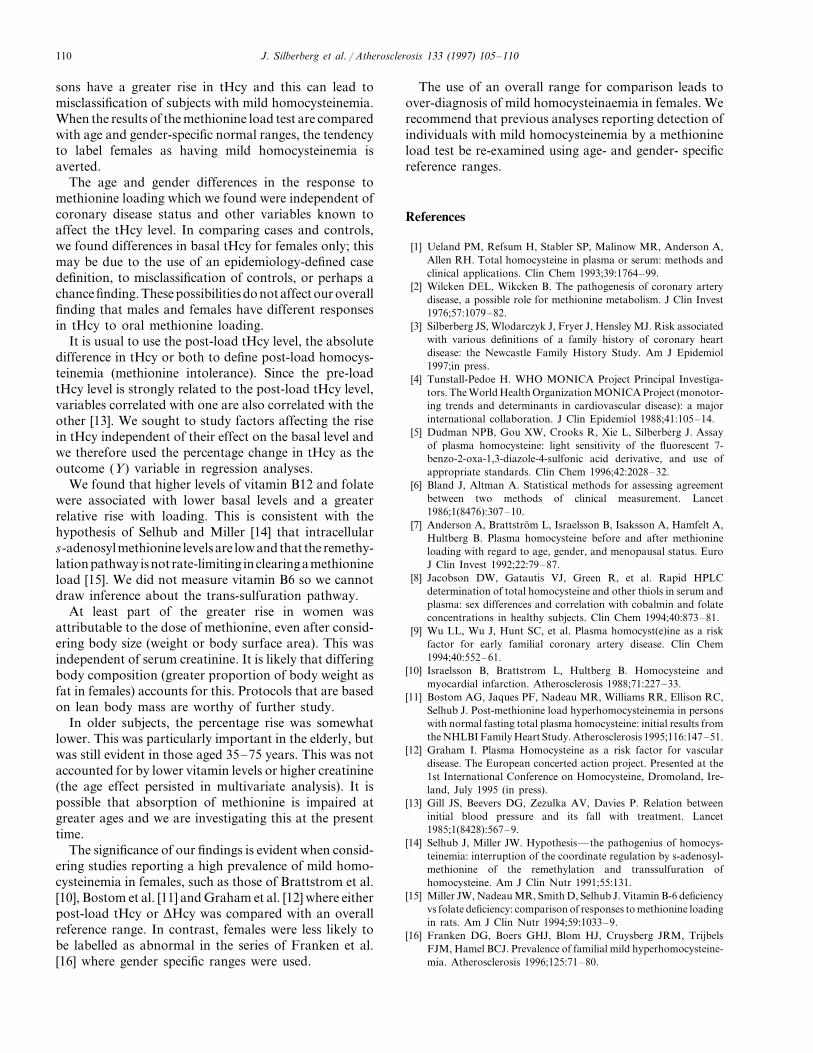
Table 7 shows how the use of an overall referencerange is likely to lead to misdiagnosis of mild homocys-teinemia in females. The number of people with a highbasal tHcy or high %DtHcy after comparison with theoverall and age- and gender-specific reference ranges isshown. 59 people had an elevated basal tHcy whencompared with the overall range, of whom 40 (68%)were male; 33 had an elevated %DtHcy of whom only 9
(27%) were male. The number identified by the age- andgender-specific ranges was similar, but the sex distribu-tion was reversed: 29/56 (52%) with elevated basaltHcy, and 31/44 (70%) with elevated %DtHcy weremale. A similar phenomenon was seen when DtHcyrather than %DtHcy was considered.
4. Discussion
Several investigators have drawn attention to theneed for the methionine load test to identify commonforms of mild homocysteinemia, or else many ‘affected’individuals (up to 40%) will be missed [10–12]. In thesereports the majority of individuals detected have beenfemale. We have found that females and younger per-
Table 7Agreement between overall and age- and gender-specific referenceranges
Overall cutpoint Age and gender specificcutpoint
Males (n=273)\90thBasal tHcy B90th
\90th 29 11B90th 0 233
%DtHcy \90th B90th9 0\90th22 242B90th
Females (n=171)\90thBasal tHcy B90th
118\90thB90th 9 143
B90th%DtHcy \90th\90th 1113B90th 1470
Table 5Effect of gender on percentage rise in homocysteine independent ofage and methionine dosea
F P-valueVariable entered Partial R2 bmale
−57.8B0.00010.11 64.06Male sexB0.0001 −58.3Age2 0.03 18.71
−56.90.000313.060.02Age−43.10.007Dose 0.01 7.23
a Stepwise multiple regression model with percentage rise in tHcy asthe Y-variable and male sex, age, age2, and dose as the explanatoryvariables.
J. Silberberg et al. / Atherosclerosis 133 (1997) 105–110110
sons have a greater rise in tHcy and this can lead tomisclassification of subjects with mild homocysteinemia.When the results of the methionine load test are comparedwith age and gender-specific normal ranges, the tendencyto label females as having mild homocysteinemia isaverted.
The age and gender differences in the response tomethionine loading which we found were independent ofcoronary disease status and other variables known toaffect the tHcy level. In comparing cases and controls,we found differences in basal tHcy for females only; thismay be due to the use of an epidemiology-defined casedefinition, to misclassification of controls, or perhaps achance finding. These possibilities do not affect our overallfinding that males and females have different responsesin tHcy to oral methionine loading.
It is usual to use the post-load tHcy level, the absolutedifference in tHcy or both to define post-load homocys-teinemia (methionine intolerance). Since the pre-loadtHcy level is strongly related to the post-load tHcy level,variables correlated with one are also correlated with theother [13]. We sought to study factors affecting the risein tHcy independent of their effect on the basal level andwe therefore used the percentage change in tHcy as theoutcome (Y) variable in regression analyses.
We found that higher levels of vitamin B12 and folatewere associated with lower basal levels and a greaterrelative rise with loading. This is consistent with thehypothesis of Selhub and Miller [14] that intracellulars-adenosyl methionine levels are low and that the remethy-lation pathway is not rate-limiting in clearing a methionineload [15]. We did not measure vitamin B6 so we cannotdraw inference about the trans-sulfuration pathway.
At least part of the greater rise in women wasattributable to the dose of methionine, even after consid-ering body size (weight or body surface area). This wasindependent of serum creatinine. It is likely that differingbody composition (greater proportion of body weight asfat in females) accounts for this. Protocols that are basedon lean body mass are worthy of further study.
In older subjects, the percentage rise was somewhatlower. This was particularly important in the elderly, butwas still evident in those aged 35–75 years. This was notaccounted for by lower vitamin levels or higher creatinine(the age effect persisted in multivariate analysis). It ispossible that absorption of methionine is impaired atgreater ages and we are investigating this at the presenttime.
The significance of our findings is evident when consid-ering studies reporting a high prevalence of mild homo-cysteinemia in females, such as those of Brattstrom et al.[10], Bostom et al. [11] and Graham et al. [12] where eitherpost-load tHcy or DHcy was compared with an overallreference range. In contrast, females were less likely tobe labelled as abnormal in the series of Franken et al.[16] where gender specific ranges were used.
The use of an overall range for comparison leads toover-diagnosis of mild homocysteinaemia in females. Werecommend that previous analyses reporting detection ofindividuals with mild homocysteinemia by a methionineload test be re-examined using age- and gender- specificreference ranges.
References
[1] Ueland PM, Refsum H, Stabler SP, Malinow MR, Anderson A,Allen RH. Total homocysteine in plasma or serum: methods andclinical applications. Clin Chem 1993;39:1764–99.
[2] Wilcken DEL, Wikcken B. The pathogenesis of coronary arterydisease, a possible role for methionine metabolism. J Clin Invest1976;57:1079–82.
[3] Silberberg JS, Wlodarczyk J, Fryer J, Hensley MJ. Risk associatedwith various definitions of a family history of coronary heartdisease: the Newcastle Family History Study. Am J Epidemiol1997;in press.
[4] Tunstall-Pedoe H. WHO MONICA Project Principal Investiga-tors. The World Health Organization MONICA Project (monotor-ing trends and determinants in cardiovascular disease): a majorinternational collaboration. J Clin Epidemiol 1988;41:105–14.
[5] Dudman NPB, Gou XW, Crooks R, Xie L, Silberberg J. Assayof plasma homocysteine: light sensitivity of the fluorescent 7-benzo-2-oxa-1,3-diazole-4-sulfonic acid derivative, and use ofappropriate standards. Clin Chem 1996;42:2028–32.
[6] Bland J, Altman A. Statistical methods for assessing agreementbetween two methods of clinical measurement. Lancet1986;1(8476):307–10.
[7] Anderson A, Brattstrom L, Israelsson B, Isaksson A, Hamfelt A,Hultberg B. Plasma homocysteine before and after methionineloading with regard to age, gender, and menopausal status. EuroJ Clin Invest 1992;22:79–87.
[8] Jacobson DW, Gatautis VJ, Green R, et al. Rapid HPLCdetermination of total homocysteine and other thiols in serum andplasma: sex differences and correlation with cobalmin and folateconcentrations in healthy subjects. Clin Chem 1994;40:873–81.
[9] Wu LL, Wu J, Hunt SC, et al. Plasma homocyst(e)ine as a riskfactor for early familial coronary artery disease. Clin Chem1994;40:552–61.
[10] Israelsson B, Brattstrom L, Hultberg B. Homocysteine andmyocardial infarction. Atherosclerosis 1988;71:227–33.
[11] Bostom AG, Jaques PF, Nadeau MR, Williams RR, Ellison RC,Selhub J. Post-methionine load hyperhomocysteinemia in personswith normal fasting total plasma homocysteine: initial results fromthe NHLBI Family Heart Study. Atherosclerosis 1995;116:147–51.
[12] Graham I. Plasma Homocysteine as a risk factor for vasculardisease. The European concerted action project. Presented at the1st International Conference on Homocysteine, Dromoland, Ire-land, July 1995 (in press).
[13] Gill JS, Beevers DG, Zezulka AV, Davies P. Relation betweeninitial blood pressure and its fall with treatment. Lancet1985;1(8428):567–9.
[14] Selhub J, Miller JW. Hypothesis—the pathogenius of homocys-teinemia: interruption of the coordinate regulation by s-adenosyl-methionine of the remethylation and transsulfuration ofhomocysteine. Am J Clin Nutr 1991;55:131.
[15] Miller JW, Nadeau MR, Smith D, Selhub J. Vitamin B-6 deficiencyvs folate deficiency: comparison of responses to methionine loadingin rats. Am J Clin Nutr 1994;59:1033–9.
[16] Franken DG, Boers GHJ, Blom HJ, Cruysberg JRM, TrijbelsFJM, Hamel BCJ. Prevalence of familial mild hyperhomocysteine-mia. Atherosclerosis 1996;125:71–80.
![Homocysteine-lowering interventions for preventing … · 2018. 12. 15. · [Intervention Review] Homocysteine-lowering interventions for preventing cardiovascular events Arturo J](https://img.pdfslide.us/doc/110x75/5ff89452656730039f05d58a/homocysteine-lowering-interventions-for-preventing-2018-12-15-intervention.jpg)


![Serum Levels of Homocysteine, Vitamin B12 and Folate in ... · methyltetrahydrofolate and methyl-Vitamin-B12 are essential factors for methionine synthesis of Hcy [10]. Lacking Vitamin](https://img.pdfslide.us/doc/110x75/5ec906dfa105b02e13239827/serum-levels-of-homocysteine-vitamin-b12-and-folate-in-methyltetrahydrofolate.jpg)