Embed Size (px)
Citation preview
Gender Differences in the Choice of Major:
The Importance of Female Role Models∗
Catherine Porter
Heriot-Watt University
Danila Serra†
Texas A&M University
This version: July 26, 2019
Abstract
We conducted a field experiment aimed at increasing the percentage of women ma-
joring in economics. We exposed students enrolled in introductory classes to successful
and charismatic women who majored in economics at the same university. The inter-
vention significantly impacted female students’ enrollment in further economics classes,
increasing their likelihood to major in economics by 8 percentage points. This is a
large effect, given that only 9 percent of women were majoring in economics at base-
line. Since the impacted women were previously planning to major in lower-earning
fields, our low-cost intervention may have a positive effect on their future incomes.
Keywords: Education gender gap, role models, field experiment, economics.
JEL classification codes: A22, C93, I23, I24, J16.
∗The project was funded by the Undergraduate Women in Economics Challenge(https://scholar.harvard.edu/goldin/UWE) and is registered in the AEA RCT Registry with the uniqueidentifying number AEARCTR-0002879. We thank Claudia Goldin and Tanya Avilova for inspiring us tofind ways to reduce the gender gap in the economics major. We are grateful to Kathy Hayes and SantanuRoy for facilitating the implementation of this project, and to all the Principles of Economics instructorsfor allowing us into their classrooms. We thank the editor and four anonymous reviewers, as well as RachelCroson, Klaus Desmet, Jason Lindo, Isaac Mbiti, Jonathan Meer, Daniel Millimet, Saltuk Ozerturk, EliraKuka, Tim Salmon, Laura Schechter and Matt Wiswall and seminar participants at the AEA Meetings,the ESA, the SEA, Southern Methodist University, Texas A&M University, UCLA Anderson School ofManagement, and the University of Winsconsin Madison. We are grateful to undergraduate economicsstudents Tracy Nelson and Emily Towler, who played a crucial role in the implementation and success ofthe study. Finally, we are indebted to the two remarkable women who acted as role models: July Lutz andCourtney Thompson. Without their participation and enthusiasm, this project could have not taken place.†Corresponding author. Email: [email protected]. Address: Texas A&M University, Department of
Economics, 3035 Allen Building, College Station TX 77843. Phone number: 979-862-4412. Fax number:979-847-8757.
1
1 Introduction
This paper addresses an important constraint that may contribute to the lack of women
in traditionally male dominated fields: the scarce number of female role models. Due to
historical gender imbalances, it is difficult for young women to come into direct contact with
successful women who have majored in male dominated fields and can inspire them to do the
same. Lack of representation in introductory textbooks (Stevenson and Zlotnik, 2018) may
also contribute to women’s inability to see themselves majoring in male dominated fields.
We employ a field experiment to examine the impact of an inexpensive and easily scalable
role model intervention designed to influence young women’s majoring decisions in college.
A number of studies (Jensen and Oster, 2009; Chong and Ferrara, 2009; La Ferrara et al.,
2012) have looked at role model effects in other contexts by examining the impact of TV
exposure on relevant behaviors,1 or by showing inspirational videos (Bernard et al., 2014) or
movies (Riley, 2017) to randomly selected individuals. Riley (2017), in particular, provides
evidence that in Uganda, exposing students to a (female) role model movie significantly
increased performance in qualifying exams, with the impact being larger for female students.2
Contrary to previous role model studies, our intervention relies on direct face to face,
albeit brief, communication between role models and our target population. Our outcome
of interest is female students’ decision to major in a male-dominated field. Our setting is
a US university. We focus on economics, a field that, contrary to other subject matters -
including physical sciences, mathematics and business studies3 - has made little progress over
the years in attracting women. In the US, the percentage of bachelor degrees awarded to
women has risen from about 25% in the 1950s to over 50% in the 2000s (National Center
for Education Statistics and NSF, Science & Engineering Indicators, 2016), yet only 30% of
bachelor degrees in economics are awarded to women, the same percentage as in the mid
1990s.
In the specific context of majoring choices, several studies estimate the impact of female
teachers on female students’ attitudes and behaviors and attribute this to a role model effect.4
The evidence is especially strong for STEM majors (Lim and Meer, 2019; Carrell et al., 2010).5
1For instance, La Ferrara et al. (2012) show that in Brazil, exposure to soap operas where the majority ofthe main female characters had either no children or only one child significantly decreased women’s fertility.
2In India, Beaman et al. (2012) have shown that an increase in the presence of women in governmentcouncils in India significantly affected the aspirations of young women and eliminated the gender gap ineducational attainment among adolescents.
3About 47% of business degrees, 46% of natural sciences degrees and 43% of math degrees and 39% ofphysical science degrees are currently awarded by women.See: https://nces.ed.gov/programs/digest/current tables.asp, last accessed 31 May 2019.
4For a review, see Allgood et al. (2015) and Bayer and Rouse (2016).5Lim and Meer (2019) exploit the random assignment of students to classrooms in Korean middle schools
2
However, since instructors may give more attention or otherwise behave differently toward
students of the same gender, the mechanism of causality cannot be clearly delineated. In
contrast, our study isolates the role model mechanism by focusing on women who are not
teachers, have no prior or subsequent relationship with the target students, and give just one
short speech to audiences made of male and female students.
Following Morgenroth et al. (2015), we define female role models as women who can
“influence role aspirants’ achievements, motivation, and goals by acting as behavioral models,
representations of the possible, and/or inspirations” [p.4]. Our role models are two successful
and inspiring career women who had majored at the same university as the target population.
Our experiment consisted in the random selection of Principles of Economics classes – which
are typically gender balanced in our setting – to be visited by the role models. Each visit
consisted of a 15-minute discussion about the role model’s experiences as an economics major,
a description of their career paths and achievements, and an explanation of how their specific
major (economics) contributed to their success on the job. Since treatment and control classes
existed and were taught by the same instructors also the year preceding the intervention
(Spring 2015), we are able to employ a difference-in-differences estimation strategy to assess
the impact of the role model visits on students’ interest in the economics major. Hence, our
methodology allows us to clearly identify the impact of the role models on female students’
education choices.6
We have four outcome variables: enrollment in an Intermediate Economics class the year
after taking the Principles class, enrollment in one or more economics classes at any time
after Principles, the total number of economics classes taken after Principles, and, ultimately,
the decision to major in economics.
An important feature of our design is the method we used to select the role models
according to pre-determined criteria aimed at finding career women that would be particularly
and find that female students that are matched with female math teachers in 7th grade are more likely totake advanced math courses in high school, to attend a STEM-focused high school and to plan to major inSTEM. Carrell et al. (2010) find that the proportion of mandatory introductory courses taught by femaleprofessors at the US Air Force Academy significantly increases the likelihood that top female students, asmeasured by their SAT math score, would complete a STEM major. A few studies in social psychology haveinvestigated the impact that role models may have on female students’ attitudes toward male-dominatedfields. For instance, Stout et al. (2011) conducted experiments where math or STEM majors are eitherexposed to confederates posing as math majors (study 1) or are asked to read biographies of female versusmale engineers (study 2). The outcome variables are students’ subsequent answers to Implicit AssociationTests aimed at measuring implicit attitudes toward math or STEM, as well as direct elicitation of suchattitudes.
6An unpublished study that is methodologically related to ours, despite obvious differences in context, tar-get population and outcomes of interest, is Nguyen (2008), which is based on a field experiment in Madagascarwhere 4th grade students and their parents were presented with either statistics about returns to educationor with speeches from role models about their experiences, or both, employing a total of 72 different rolemodels chosen by the school district head, a local NGO leader, and community leaders.
3

appealing to female students. We enlisted the help of two female students currently majoring
in economics. The students shortlisted economics alumni on the basis of their interests in
their current sectors of work. We then contacted the selected alumni and invited them to
be interviewed via Skype. The students conducted scripted interviews with the finalists who
agreed to be interviewed, and chose the best two on the basis of their assessment of the
alumni’s jobs, communication skills and overall charisma. While there were men in our set
of interviewed finalists, both finally chosen role models were women.7 This is in line with
social psychology studies (Lockwood, 2006; Stout et al., 2011) showing that women are more
likely to identify with and be inspired by female than male role models.
Our results show that the role model intervention had a significant impact on all outcomes
for female students. Specifically, being in a class that received the role model visits increased
the likelihood that a female student would major in economics by 8 percentage points, over
a baseline of 9 percent, i.e., we estimate nearly a 100 percent increase in the share of female
economics majors. Similar effects are observed on intermediate outcomes. The likelihood
that a female student would take an intermediate economics class the year following the
Principles class also doubled, increasing by 11 percentage points over a baseline of 11 percent;
similarly the likelihood of taking another economics class at any time after the Principles
class increased by 14 percentage points over a baseline of 18 percent. While men were not the
focus of the intervention and we did not have any priors on whether and how they would be
impacted, we do have data on male outcomes and we perform a triple-difference regression
as a robustness check. The results show that men were unaffected by the treatment.
By examining which majors saw a significant decline in female students, we are able to
assess which fields of study the impacted female students would have majored in, absent
the intervention. This is important, since, if we were pulling women away from other male-
dominated fields also leading to high-paying jobs – e.g., STEM – our intervention would pos-
sibly be counter-productive, as it would diminish gender diversity in other male-dominated
fields and possibly lower the earnings potential of our target population. Our data suggests
that the role model intervention did not decrease the percentages of women majoring in
male-dominated fields leading to high wages, i.e., STEM, business and finance. Instead, the
intervention significantly lowered the percentage of women planning to major in humani-
ties. The analysis of the grades obtained in a standardized exam given to all Intermediate
Economics students shows that the treated female students performed as well as the control
students, suggesting that the students swayed to study economics by our intervention were
not less skilled or less likely to succeed in the program. We conclude that the economic
7The men in the sample were not deemed as the most inspiring by our two female students. For furtherdiscussion, see Section 2.2.
4
impact of our low-cost role model intervention may be significant, as the future wages of our
target population could be substantially larger as a result.
Our study contributes to the role model literature as well as the literature on the causes
of the under-representation of women in certain fields of study. This includes investigations
of the importance of gender differences in math aptitude (Emerson et al., 2012), sensitivity
to grades (Rask and Tiefenthaler, 2008; Goldin, 2013; Kugler et al., 2017), competitiveness
(Reuben et al., 2017; Buser et al., 2014; Flory et al., 2014),8 taste for the subject matter
(Dynan and Rouse, 1997; Wiswall and Zafar, 2014)9 and preferences over different job at-
tributes, which are linked to different majors (Wiswall and Zafar, 2017).10 Our work also
relates to recent investigations of the effects of mentorship programs on individual behaviors
(Blau et al., 2010; Dennehy and Dasgupta, 2017; Kofoed et al., 2019).11
Overall, our study provides strong evidence of the impact of female role models on
women’s self-selection into fields of study in which men are traditionally over-represented.
Our analysis of mechanisms suggests that, although the role models shared novel information
on the jobs associated with an economics degree, the increase in information is not respon-
sible for the observed impacts, which leads us to conclude that the mechanism might be
inspiration.
Achieving higher gender diversity within majors is important and desirable as it may
enhance productivity and overall performance in team work, and it may contribute to the
production of novel ideas (Bayer and Rouse, 2016; Ellison and Mullin, 2014; Hoogendoorn
et al., 2013; Bear and Woolley, 2011). Moreover, the choice of major significantly affects
one’s earnings potential (Arcidiacono, 2004; Kirkeboen et al., 2016), and male-dominated
fields tend to lead to higher paying jobs. Economics, for instance, is the highest earning
major in the social sciences (Black et al., 2003; Carnevale and Cheah, 2015) and has been
shown to generate higher earnings than a business degree (Black et al., 2003).12 Greater
gender diversity may also have important consequences on aggregate outcomes. Indeed,
under the assumption of no gender differences in innate abilities, gender imbalances in self-
selection into fields of study (and subsequent careers) may result in misallocation of talents
– where individuals are not pursuing their comparative advantages – that could significantly
affect aggregate outputs, as recently shown in Hsieh et al. (2013). Increasing the number
8For seminal evidence on gender differences in competitiveness, see Niederle and Vesterlund (2007).9For a review of the literature, see Allgood et al. (2015) and Bayer and Rouse (2016).
10The authors found that men prioritize earnings prospects while women tend to favor jobs that provideflexibility and job stability.
11See Athey et al. (2000) for a theoretical investigation of the importance of mentoring within organizations.12Using recent census data, Carnevale and Cheah (2015) also report that the median salary of an experi-
enced worker, aged 30 to 54 years of age, who majored in economics is the highest in the social sciences andthe thirteen highest among all majors.
5
of women studying economics may be especially relevant for real-world aggregate outcomes,
as there is evidence (May et al., 2014, 2018) that female and male economists both in the
US and in Europe have significantly different views on a variety of policy issues, including
government intervention, market solutions, environmental protection and gender equality.
What makes our study unique is the use of a controlled field experiment, which allows
clear identification of the impact of the role models, and the novel methodology employed
to identify such role models, which crucially relied on the opinions of current female stu-
dents. The simplicity of the experimental design makes our intervention easily replicable
(in economics as well as in other male-dominated fields) and scalable, and suggests that
the long-term goal of moving towards gender parity in the economics profession at all levels
could be achieved at a relatively low cost by exposing students enrolled in principles classes
to successful and inspiring alumnae.
The paper is organized as follows. In Section 2 we describe the field experiment and the
university setting in which it was implemented. In Section 3, we describe our data and present
our empirical strategy. Section 4 describes our results and Section 5 reports robustness checks.
Then, in Section 6, we discuss the possible mechanisms behind the success of the intervention
and in Section 7 we conclude with some final remarks.
2 Experimental Design
As part of the study, we: 1) conducted a survey of students enrolled in Principles of Economics
classes in Spring 2015 and Spring 2016; 2) implemented a field experiment consisting in
randomly selecting 4 of the 10 Principles of Economics classes offered in Spring 2016 to
receive visits by two carefully chosen role models; and 3) obtained administrative data on
the study paths of the students in our 2015 and 2016 samples. In this section, we start by
describing the university setting where the experiment took place (Section 2.1). We then
provide details about our field experiment and study procedures (Section 2.2). We conclude
by describing our estimation strategy (Section 2.3).
2.1 The University Setting
We conducted our study at Southern Methodist University (SMU). Although SMU is a small
private university,13 the number of students majoring in economics every year, averaging 166
13SMU is located in Dallas, Texas. In the latest (2019) university ranking provided by the US Newsand World Report, SMU appears ranked 59th in the nation, same as the University of Washington andPennsylvania State University. In 2015, SMU had a total of 11,739 students. For additional information
6
between 2009 and 2015, is comparable to that of larger universities and is in line with the
average number of economics majors across the top 100 US universities (Goldin, 2015).14
SMU operates over two semesters: a Fall semester, starting in August and ending in
December, and a Spring semester, starting in January and ending in May. Our study involves
students enrolled in Principles of Economics classes in either Spring 2015 or Spring 2016.15
Principles of Economics classes are especially popular at SMU, with over 600 students enrolled
and multiple classes – or sections – being offered every semester. Crucially, these classes
are typically gender balanced, with women making up between 44 and 47 percent of the
enrolled students in the past 6 academic years.16 In contrast, the next class up - Intermediate
Microeconomics - for which the Principles class is a prerequisite – is gender imbalanced, with
only about 26% of the enrolled students being women (2009-2015 average). The gender
imbalance remains and even worsens by the time of graduation, with less than one fourth of
economics degrees being awarded to women, the average being 21% between 2009 and 2015.
This is below the national average of 30% (Bayer and Rouse, 2016). Using Goldin (2015)’s
conversion ratio, which is the ratio of the percentage of men majoring in economics to the
percentage of women majoring in economics in a given university, SMU has a score of 4.493
(2011-2013 average), meaning that there are more than 4 men for every woman majoring
in economics. This is substantially higher than the average for the top 100 US universities
computed for the same time period, which is equal to 3.
The above statistics make SMU the ideal setting for a study aimed at increasing the
percentage of women majoring in economics. Below, we provide details on our experimental
design and empirical strategy.
2.2 The Field Experiment
The study started in Spring 2015, when we surveyed all students taking Principles of Eco-
nomics classes. There were 11 classes being offered and taught by seven instructors, four
women and three men, at different days and times of the week.17 Students could enroll in
any of the available classes following a first come first serve rule. A total of 722 students
about SMU, see: http://www.smu.edu/AboutSMU/Facts14See: https://scholar.harvard.edu/files/goldin/files/planninggroup data notes 0.pdf15SMU also has two 4-week long Summer terms, in June and July. Classes held during the summer are
very different than standard classes, as they take place daily and they are typically very small (i.e., less than20 students). The student population taking summer classes is also quite different, i.e., typically older andin need of credit hours, e.g., in order to graduate by an imminent date. Given these differences betweensummer classes and regular classes, we exclude summer classes from our analysis.
16One reason for the high number of students taking the Principles classes is the presence of a BusinessSchool, which requires prospective students to take such classes.
17Three instructors taught two classes each.
7
took a Principles class in Spring 2015. We conducted our survey in the last week of classes
at the end of April 2015, involving about 75% of the sample.18 We collected demographic
characteristics and we asked questions on intended major. We also elicited beliefs about the
kinds of jobs associated with the economics major. We conducted an identical survey the
following year, at the end of April, with the 2016 Spring Principles cohort.
In Spring 2016, the same classes – meaning classes taught on exactly a given day and time
of the week, by a given instructor – were offered as in Spring 2015, with two exceptions.19
A total of 688 students were enrolled in a Principles class that semester; we have survey
data for about 70% of them.20 In Spring 2016, there were 4 small classes (i.e., capped at 40
students) and 6 large classes (i.e., of 100 or more students) being offered. The enrollment class
caps are decided by the department of economics on the basis of classroom and instructor
availability. They are not dictated in any way by student demand. At any time during the
class enrollment period, students can only enroll in classes whose cap size has not been met
yet.
Since we aimed to have a balanced number of students in the 2016 treatment and control
classes, we stratified our class-level randomization by class size. We randomly selected one
small class and three large classes to receive the role model intervention. Note that our
randomization also defined treatment and control classes in Spring 2015, even though the
treatment classes were treated only in 2016. The fact that treatment and control classes ex-
isted the year prior the intervention allows us to employ a difference-in-differences estimation
strategy, as discussed in Section 2.3.
Our target population was the set of female students enrolled in Principles of Economics
classes. Hence, we aimed to select role models who could be especially appealing and inspiring
to young women. To this end, we enlisted the help of two undergraduate female students who
were majoring in economics at the time (Fall 2015). We first obtained the list of alumni who
graduated between 1985 and 2010 and then preceded to shortlist 18 role model candidates
based purely on the female students’ interest in the their sector of work and current job. We
contacted the shortlisted candidates via email asking for their availability and willingness to
be interviewed via Skype by our female students. The email did not mention the specific
aim of the study; it only stated that the economics department had shortlisted 18 especially
18The survey was conducted during class time. Therefore, we have data only on the students that werepresent the day of the survey.
19Two instructors taught two classes each. One instructor who taught two classes in 2015 only taught oneclass in 2016, hence the number of classes being 10 rather than 11 in Spring 2016. One control class changedinstructor and weekly schedule in 2016. In Section 5, we conduct robustness checks of our main findings bydropping the classes that changed between the two years and including class fixed effects in the empiricalspecification.
20Again, participation in the survey was conditional on class attendance.
8

inspiring alumni21 and we aimed to gather some additional information about their current
position, as well as their previous jobs and their experience as an economics student at
SMU.22
Seven alumni replied expressing their availability for and interest in the Skype interview.
The Skype (scripted) interviews were conducted by our two female students, which then
proceeded to select our final two role models based on their impressions on the candidates’
jobs, their appreciation for the field of economics, and, crucially, their communication skills
and overall charisma. Both finally selected role models are women. One role model graduated
in 2008 and started her career by working in management consulting for two years. She had
then decided to completely change her career path by going to work for an international NGO
in Nicaragua, and then as a director of operations at a toy company based in Honduras.
She now works in Operations at a fast-growing candy retail company. The second role
model graduated in 1991 and has had a stellar career in marketing, becoming the senior
director of North American Marketing & Information Technology at a large international
communications company. While the two role models work in very different sectors, what
they have in common is that their jobs are not stereotypically associated with the economics
major.
We formally invited each role model to visit SMU in Spring 2016. Both role models
accepted our invitation and independently visited four Principles of Economics classes – our
treatment classes – between March and April 2016. The first role model visited each class on
March 21st or 22nd, depending on the class schedule. The second role model visited each class
on April 6th or April 7th. The 2016 survey took place on the last week of classes, at the end of
April 2016. All treatment classes received a visit from both role models, therefore we cannot
differentiate the impact that each role model, i.e. their specific individual characteristics,
may have had on the treated students. We can only identify the joint impact of the two
alumnae on the students’ interest in the economics major.
The purpose of the role model visits was for the two alumnae to talk about their expe-
riences as economics majors, their career choices and their current jobs. More importantly,
we asked them to discuss how majoring in economics helped them succeed in their careers.
We also emphasized that it was important to try and involve students in the discussion (e.g.
welcoming their questions) as much as possible.
We did not inform the class instructors about the purpose of study, to avoid possible
changes in instructors’ behavior as a result of the intervention. We also did not inform the
role models about the objective of the research study and therefore they did not know that
21We did not restrict the selection to females. Therefore, we initially shortlisted 8 women and 10 men.22The specific content of the email is available upon request.
9
we intended to examine the impact that their visit would have on female students’ decision
to continue studying economics. As a result, the speeches to the classes were gender-neutral,
i.e., no gender-specific issues were discussed. This allows us to examine whether and to what
extent our career women were perceived as role models also by male students. While we did
not have a clear prior on the impact that the role models would have on men, the fact that
the career women were chosen by female students to be inspiring to fellow young women
suggests that the impact on men would most likely be lower. In the results section, we focus
exclusively on the impact of the intervention on our target population - female students.
However, we also conduct robustness checks where we treat the men as an additional control
group.
It is important to note that the selected role models happened to both be female, as
these two were the most inspiring to the undergraduate female students that assisted us in
the role model selection process.23 Ideally, we would have liked to also include a treatment
that exposed students to two “identical” male role models in order to disentangle the role
of gender matching from the role of information about the two specific career paths chosen
by our female role models. However, even if we had a sample size large enough to include
an additional set of treatment classes in our study (which we did not), it would have been
impossible to find male “clones” of our female role models, i.e., two men with same career
profiles, comparable levels of charisma and other individual characteristics to create the
perfect male counterfactual treatment.24 We can however use insights from studies in social
psychology (Lockwood, 2006; Stout et al., 2011), which show that women are more likely
to identify with and be inspired by fellow women. This suggests that, everything else being
equal, the impact of the intervention would have been lower if the role models had been men.
2.3 Empirical Strategy
As outlined above, the treatment took place at the class level in 2016, yet the treatment and
control classes also existed in 2015. Since we had a small number of classes over which we
randomized, it was unlikely that we would achieve a balance between treatment and control
groups.25 We acknowledge that each class may have different types of students since we have
23The initial shortlist did include males, and three men made it to the Skype interviews but were ultimatelynot chosen by the two female students that conducted the scripted interviews.
24While videotaping the role models and using male actors to reproduce their speeches would theoreticallybe possible, in practice, the use of actors presenting themselves as working in given fields and having veryspecific study and work experiences would imply deceiving the students in the audience. Even if deceptionwere not a problem, the Q&A section of the classroom visits would be difficult to predict and handle byactors, as it may involve job specific questions and students’ requests of business cards and contact details.
25However, simple pair-wise chi-square tests of the difference between treatment and control outcomes doshow significant difference in our outcome variables, as shown in Table I.
10

self-selection into classes, and that students in different classes are likely to be subject to
different stimuli, as they are exposed to different instructors, curricula and teaching styles.
Therefore, we take advantage of the fact that the same classes (i.e., same instructors and
time schedules) were offered both in 2015 and 2016 to estimate our treatment effects using a
difference-in-differences model as the optimum strategy (Angrist and Pischke, 2008). Since
class attendance was not mandatory the days of the role model visits, the estimate can be
seen as the intent-to-treat effect of the intervention using equation 1 below,
Yi = β0 + β1dti + β2dTi + β3dti ∗ dTi + δXi + ui (1)
where Yi is our proxy for female student i’s interest in the economics major; dt is a dummy
equal to 1 if she took the class in 2016 and 0 if she took a class in 2015; dT is a dummy equal
to 1 if she is in a treatment class and 0 if he or she is in a control class. The interaction
between these two dummies is our coefficient of interest (i.e. post*treat).26 As noted above
we allow for imbalance in pre-treatment characteristics across classes by including X, a vector
of demographic controls and class characteristics, to account for slight differences seen in our
balance tests (see below for further discussion).
As a robustness check, we also include class fixed effects as shown below (omitting the
treated class dummy and the class characteristics). However, this reduces the sample size,
since only nine classes did not change time of instruction or teacher between the two years..
Yi = β0 + β1dti + β3dti ∗ dTi + δXi + λCj + ui (2)
As a further robustness check, we include male students as an additional control group
and employ a triple difference specification as shown in equation 3 below, with notation as
above, but adding a dummy for female student, dF which is interacted with the treatment
class, the treatment year and the interaction of the two.
Yi = β0 + β1dti + β3dti ∗ dTi + β4dFi + β5dti ∗ dFi + β6dTi ∗ dFi
+β7dti ∗ dTi ∗ dFi + δXi + λCj + ui(3)
Our final outcome variable is a student’s decision to major in economics. We also examine
the effect of our treatment on intermediate outcome variables that can show the pathway to
26We could also have estimated only the difference post-treatment for only those in treated classes. How-ever, if we found a significance difference in the outcomes of students enrolled in post- and pre-treatmenttreatment classes we could not confidently attribute that difference to the intervention, as both students’characteristics and teaching methods may have changed between the two years.
11
choosing a major, or the student’s interest in the economics major. We first look at whether
the student enrolled in Intermediate Microeconomics the following academic year, either in
Fall or Spring. We then create a dummy equal to 1 if the student took any further economics
courses at any time after the Principles class. We then look at the number of economics
courses chosen, and finally examine the decision to declare the economics major. We use
regression analysis (Linear Probability Model, or LPM), and given the dichotomous nature
of most of our dependent variables, we provide robustness tests for equation 1 using probit
estimates.
As our treatment is at the class level, we cluster the standard errors at the class level
(Abadie et al., 2017). Since there are fewer than 30 clusters (12 classes), we follow Angrist
and Pischke (2008) and Cameron and Miller (2015) and apply the correction for the small
number of clusters by using wild cluster bootstrapping (Cameron and Miller, 2015).27
Finally, we note that, since students from the 2016 treated classes may have talked about
the role model visits with their peers in control classes, the treatment effects may have spilled
over into untreated students. This implies that our estimates should be interpreted as a lower
bound of the actual impact of the intervention on students’ study choices.
3 Results
In this section, we start by providing descriptives of our data and conducting balance tests.
Then, in Section 3.2 and Section 3.3 we report and discuss our main results on the impact
of the role model intervention on intermediate and final outcomes. The next subsection,
Section 3.4, examines where we attracted the female students from, i.e., which fields of study
saw a decline in female students as a result of the intervention. Finally, in Section 3.5 we
ask whether the impacted female students were less likely to succeed within the economics
major by looking at the performance of students from treatment versus control classes in the
Intermediate Microeconomics class.
3.1 A first look at the data
We have information on a total of 1397 students who took a Principles of Economics class
in either Spring 2015 (712) or Spring 2016 (685). Of them, 45% (627) were women. Of the
Spring 2016 cohort, 49% (339) of the students were in a class which was treated, i.e. visited
27In a previous draft of the paper we clustered at the class-year level (21 clusters) and obtained similarresults. In the current draft, we follow Abadie et al. (2017) to cluster at the class level only. Note also thatprobit model with score wild Bootstrapped standard errors (Kline et al., 2012) gives extremely similar resultsand these are presented in the Appendix for convenience.
12
by the role models. While the gender compositions of the treatment and control classes in
2015 are not significantly different from each other, with 46% and 44% of students being
women, respectively, in 2016 the treatment classes had significantly fewer women enrolled
than the control classes (38% versus 51%, p-value of 0.001).
In Table I, we report descriptive statistics and conduct balance tests using both the ad-
ministrative data and the survey data. In particular, from the administrative data we have
information on the students’ in-state or out-of-state status, their year of study, e.g. whether
they are freshmen, their cumulative GPA, whether they are American or international stu-
dents. From the survey data we have information about whether they belong to a sorority,
whether they are athletes and whether they took an economics class in high school. We
report balance tests for the male sample in Table A1 in Appendix.
Testing for differences in female student characteristics between control and treatment
classes in 2016 shows some significant differences, as might be expected given the small
number of classes from which we were able to randomize our treatment and control sets
of students. In particular, we see that there are significantly fewer American students in
the treatment group, as well as more freshmen. Moreover, the cumulative GPA of students
enrolled in treatment classes is slightly lower. We do not see any significant differences in
the survey-based individual characteristics between treatment and control classes.
We take the imbalances observed in the data into account in our empirical analysis in
Section 3.2 and Section 3.3, where we include all the available student characteristics in our
set of controls, and show robustness checks with class fixed effects, and using probit estimates.
We check the effect of the role model visits on grades in the Principles class and following
Carrell et al. (2010), we also estimate treatment effects separately for the top performing
female students, in an attempt to identify the marginal students who were affected by the
intervention the most.
Figure I and Table II show a summary of the significant post-treatment outcome differ-
ences in our main outcomes of interest to motivate the further analysis. We report descriptive
statistics and p-values for: i) percentage of female students who took an Intermediate Mi-
croeconomics class the year immediately following their Principles class, i.e. either Fall 2015
or Spring 2016 for the 2015 cohort, and either Fall 2016 or Spring 2017 for the 2016 cohort;
ii) percentage of female students who took another economics class after Principles at all;
iii) number of economics classes taken overall and iv) percentage who majored in economics.
Note that at SMU, students can declare their major at any time after having completed 30
credit hours (in any field). There is no deadline for declaring a major; thus, students can
choose their major at any time, up to their final semester at SMU. We obtained our majoring
data in January 2019. At that time, only 31 students in our sample (2.22 %) had not declared
13
their major.28
3.2 Intermediate Outcomes: Enrollment in Intermediate Micro
within year and enrollment in any class after Principles
We examine two intermediate outcomes of the intervention: 1) enrollment in Intermediate
Microeconomics within a year from the Principles class, and 2) enrollment in at least another
economics class at any time after the Principles class.
Intermediate Microeconomics is a prerequisite for upper level economics classes. If a stu-
dent wants to major in economics, s/he needs to take this class, the sooner the better. We
therefore consider this a good measure of the short-term impact of the intervention.29 As
shown in Table II, in 2015, the proportion of women who enrolled in Intermediate Microe-
conomics within a year from Principles is around 13%, and is the same across treatment
and control groups. In 2016, the proportion in the untreated classes is 10.73%, whereas over
18% of women in the treated classes had enrolled; this difference is statistically significant
(p = 0.05). Similarly, the likelihood of taking another economics class at any time after
Principles is significantly different for the treatment versus control classes in 2016, with the
percentage of women taking at least one more economics class up to 28% in the treated group
as compared to 18% in the 2016 control group.
Next, in Table III we present results from the regression analysis, which allows us to
examine the effects of the role model intervention on female students by conducting difference-
in-differences estimation, as explained in Section 2.3. Columns 1 and 2 show the LPM
results when the dependent variable is a dummy equal to 1 if the female student took the
Intermediate class in the year directly following their Principles class, and 0 otherwise.30 In
columns 3 and 4 the dependent variable is a dummy variable equal to 1 if the student took
at least another economics classes after Principles, and 0 otherwise . In the first and third
columns, we employ our most parsimonious specification, which only includes the 2016 year
dummy, the treatment class dummy and the interaction between the two. In the second
and fourth columns, we include all the controls obtained from administrative data, for which
we provided summary statistics in Table I. We also control for a dummy equal to 1 if
28However, the college subdivision of these students indicates that they would major in a humanities field.We classify students with two or more declared majors as ”economics majors” as long as one of their majorsis economics.
29Administrative data on students who took Principles of Economics in the Spring semesters of 2008 or2009 and completed their degree by Fall 2014 show that about 80 percent of the 2008 and 2009 cohorts whomajored in Economics took the Intermediate class the year following their Principles class. This compares to21 percent of students who were in the same Principles classes and did not major in Economics (differencessignificant at the 1 percent level).
30We analyze men separately in the annex, Table V.
14
the female student was in a small class, and a dummy equal to 1 if the class was taught
by a female professor. Finally, we include the grade that she obtained in the Principles
class, as we observe significantly lower grades in treatment than control classes in 2016 (2.86
versus 3.11, significant at the 5 percent level) and there is evidence (Goldin, 2013; Rask
and Tiefenthaler, 2008) that women’s decision to study economics is affected by the grades
obtained in introductory courses. Note that in Section 4.2 we analyze student performance
in the Principles class and find that the lower grades observed in the treated classes are not
a result of the intervention itself.
For all specifications we report p-values obtained when implementing the wild score boot-
strapping correction for the small number of clusters (Cameron and Miller, 2015). Note that
this method does not assume normality and therefore does not calculate standard errors.
Estimates generated by probits with score bootstrapped standard errors (Kline et al., 2012)
are reported in Table A2 in the Appendix.
We find strong evidence that the intervention had a positive and significant effect on
women’s enrollment rates in further economics classes. The interaction term is significant
for both intermediate outcomes under investigation. The role model visits increased the
likelihood that a female student who took a Principles of Economics class would enrol in
Intermediate Micro within a year by 11 percentage points. This is quite a considerable effect,
considering that the average baseline enrollment rate (considering both 2015 and 2016) is just
below 12%. In fact, our estimates suggest that the role model intervention almost doubled
the percentage of female students taking Intermediate Micro the academic year following
their enrollment in a Principles class.
The results are qualitatively similar for the likelihood of enrolling in another economics
class at any time after the Principles class. The intervention increased such likelihood by
about 14 percentage points, which represents a 70% increase, given the average baseline
enrolment level.
3.3 Final Outcomes: Number of Economics Classes taken and Ma-
joring in Economics
Our final outcomes are the total number of economics classes taken and the decision to major
in economics. Table II and Figure I show significant differences emerging post-treatment in
both outcomes for the treated women. The average number of economics classes taken by
female students after Principles increased from about 0.85 to 1.42 (significant at the 10
percent level). The percentage of women who declared the economics major increased from
below 9% (averaged across years) to above 15% (p = 0.04).
15
As before we present regression results with and without controls. Table IV shows the
impact of the intervention on the number of economics classes taken after the Principles class
(columns 1 and 2) and the final decision to major in economics (columns 3 and 4), whereby
the dependent variable is equal to 1 if the student majors in economics and a zero otherwise.
We find that the treated women took around half an economics class more on average than
untreated women over the course of their studies, though the effect is marginally insignificant
(p=0.115) when a full set of controls are added (column 2). The effect of the role model visits
on the final majoring decision remains significant, up to around 2 years after the treatment.
Specifically, we see an 8 percentage point increase in treated women declaring Economics as
their major. Again, due to a fairly low baseline of just under 9% the effect is quite large, as
it converts to almost a 100% increase in the likelihood that women enrolled in introductory
classes would end up majoring in economics.
Our estimated marginal effects are comparable in size to those found in other studies that
exploit random allocation of students to teachers to examine the impact of female teachers
on female students’ education choices. In particular, Lim and Meer (2019) show that in
Korean schools, female students who are taught by a female versus a male math teacher in
7th grade, are 15.1 percentage points more likely to choose the math-science track in high
school and 15.7 percentage points more likely to take at least one advanced math course.
Carrell et al. (2010) found that being assigned exclusively female professors in introductory
math and science courses at the US Air Force Academy increased the likelihood that (only)
the top female students would major in STEM by 26 percentage points, as compared to
having exclusively male faculty.
Following Carrell et al. (2010), we investigate whether the role model intervention was
especially impactful on top female students, which we define as those who have a cumulative
GPA > 3.7.31 About 30% of all female students belong to the top student category with
no significant differences across years and treatment and control classes. In Table A3, we
replicate the analyses conducted in Tables III and IV while restricting the sample to the top
female students. Keeping in mind that our sample size is severely reduced, the impact of the
intervention on the intermediate outcomes is striking: the marginal effect of the role model
visits is 26 percentage points on enrollment in Intermediate Microeconomics within a year
from Principles. This percentage point increase resembles very closely that found by Carrell
et al. (2010). However the rest of the outcomes show no significant changes when the analysis
is restricted to the top female students, possibly due to the small sample size.
31We do not have data on university entry exams or high school performance that we could use as analternative proxy for student ability.
16
3.4 Where are we attracting female students from?
Overall, our empirical estimates show that the role model intervention had a positive, sig-
nificant and sizeable impact on female students’ interest in the field of economics. While
we believe that achieving gender balance in a male dominated field like economics should
be seen as a goal in itself, role model interventions like ours would be especially desirable if
they could positively affect the earnings potential of female students that would otherwise
major in a field conducive to lower incomes than their male counterpart. Conversely, having
an intervention that attracted toward economics female students who would have otherwise
majored in another male-dominated high-earnings field (e.g. finance or STEM), may be
counter-productive in terms of its overall economic impact.
Here we use administrative data on the majoring decisions of the students in our sample
to identify the fields of study that saw a reduction in female students’ interest as a result
of our intervention. We distinguish between high-earning majors, defined as STEM, finance,
business and marketing, and low-earning majors, defined as other social sciences (e.g., psy-
chology, anthropology and political science), arts, communication studies, and humanities
and languages.
Figures II and III display the percentage female students, in control and treatment classes
in 2015 and 2016, majoring in each field of study, grouped in either the high-earning or the
low-earning category. Figure II shows that the role model intervention did not cause a
decline in women’s interest in any of the high-earning majors. Figure III suggests that the
role model intervention reduced the percentage of women majoring in humanities. This is
confirmed by regression analysis, as shown in Table V, which displays the results obtained for
high-earning majors, and Table VI, which display results obtained for low-earning majors.
In each column, the dependent variable is a dummy equal to 1 if the student majored in the
field under consideration, and 0 otherwise. The estimates reported in Table V and Table VI
show that the only field of study that was affected by the role model intervention, besides
economics, is humanities. In particular, in Column 4 of Table VI we see that the role model
visits significantly reduced the likelihood that female students majored in humanities. This
suggests that the women nudged to study economics by the role model visits would have
otherwise majored in humanities.
3.5 Performance of treated versus control female students in the
economics study program
An important follow up question is whether the performance of the treated female students,
once they enter the economics study program, is in any way different than that of the un-
17
treated students. If the intervention had nudged into economics female students that were
unlikely to do well in this field, this would be less than optimal for multiple reasons. First, the
intervention would have possibly contributed to a misallocation of talents, where individuals
pursuing a given major are not those who have a comparative advantage in it, as discussed in
Hsieh et al. (2013). Second, if the female students who enrolled in Intermediate Economics
classes as a result of the intervention were to perform less well then others, they would be less
likely to enroll in upper level economics classes and ultimately major in economics.32 Hence,
the role model intervention would have had only a short term impact on female students’
choices and behaviors. Third, even if the students remained with the major, they may be
worse off ex post, e.g., their graduation GPA would be lower than if they had majored in
a different field and, as a result, their chances of getting a good job post graduation could
suffer.
Comparing the performance of treated and control students in the economics classes they
took after the Principles class is challenging, since, for instance, multiple sections of the same
classes are usually offered by different professors, and teaching methods and grading systems
vary widely across instructors. Here, we focus on performance in the Intermediate Microeco-
nomics class, which is a prerequisite for most upper level economics classes. Besides reporting
average grades obtained in Intermediate Micro, in Table VII we display the average scores
obtained in a Core Exam, which all the students enrolled in Intermediate Microeconomics
need to take toward the end of the semester. This exam provides a more objective measure
of student performance, as it is prepared and administered by the economics department
rather than the students’ instructors, and it is the same for all the students enrolled in an
Intermediate Microeconomics class in a given semester.33
Descriptives on students’ performance based on both the grade obtained in Intermediate
Micro and the Core Exam, shown in Table VII, reveal that the treated female students
performed as well, if not better, than the control female students. This suggests that the
intervention did not nudge female students who were less likely to succeed in economics.
Instead, it attracted seemingly qualified women who were previously not pursuing economics.
32This is especially true given the empirical evidence on women’s sensitivity to course grades (Goldin, 2013;Rask and Tiefenthaler, 2008).
33In Fall 2015, there were 5 classes of ECO 3301 being offered, taught by 4 instructors. In Fall 2016, therewere 4 classes being offered, taught by 3 professors. Of these 4 classes, 3 were the same as in Fall 2015. InSpring 2016 and Spring 2017, there were 4 classes offered, each taught by a different professor. Two classeswere identical between the 2 years. Comparing the two academic years, in 2015-2016, 328 students wereable to take Intermediate Micro, versus 304 in 2016-2017. Note that it is the department of Economics, notstudent demand, that decides the number of classes being offered every semester. The decision is made basedon funding, instructor availability and classroom constraints.
18
4 Robustness checks
4.1 Pre-Intervention Trends
An important assumption of the difference in differences estimation model is that, in the
absence of the intervention under study, the difference between the treatment and control
group would be constant over time. In order to check whether the assumption of parallel
trends holds in our setting, we obtained data on our four outcome variables for the Spring
2014 cohort, i.e., the female students who took Principles classes in Spring 2014. Since the
2014 cohort enrolled in the Principles class before the start of our study, a total of 4 classes
changed (in terms of instructor or teaching schedule) between Spring 2014 and Spring 2016.
Therefore, our analysis is restricted to 7 classes – 3 treatment classes and 4 control classes –
that remained unchanged between the three years.
The top panel of Figure IV displays the pre-intervention trends for our intermediate
outcomes: enrollment in Intermediate Micro the year after taking Principles, and enrollment
in another economics class at any time after Principles. The bottom panel shows the pre-
intervention trends for our final outcomes: the number of economics classes taken and the
decision to major in economics. The pre-intervention trends are almost indistinguishable (and
not statistically significantly different) for the female students in the 2014 and 2015 cohorts,
whereas the post-treatment trends diverge sharply, with the women in the treatment classes
in the 2016 cohort showing a significant increase in their enrollment rates, number of classes
taken and majoring rate, whereas the women in the control classes follow the slight downward
trend observed in previous years.
4.2 Treatment effects on the grade obtained in Principles
Since the intervention took place about a month before the end of the semester, it is possible
that it affected student performance, for instance by inducing women to work harder. This
could in turn be a channel through which the role model intervention may have impacted
female students, as previous research (Goldin, 2013; Rask and Tiefenthaler, 2008) suggests
that women’s decision to pursue a given major may be conditional on obtaining a high grade
in introductory courses.
In Section 3.2, we noted that grades obtained in Principles were slightly but significantly
lower for treated women in 2016. In Table VIII we report results from regression analysis on
the grade achieved in the Principles class. We find that the grades observed in the treated
classes are not lower because of the intervention; they are lower as a result of pre-intervention
student characteristics, with students’ cumulative GPA being the stronger predictor. Since
19
the intervention did not improve grades in the class, we are able to rule out that channel of
impact.
Note that, if the decision of female students to major in a given field is positively affected
by the grades obtained in introductory classes, the lower average grades obtained by the
treated women would work against us finding a positive impact of the role model intervention.
In other words, the data show evidence of a positive impact of the intervention despite the
fact that the treated female students tended to earn lower grades in the Principles class.
4.3 Including class fixed-effects
As noted earlier, nine Principles classes – 4 treatment classes and 5 control classes – remained
unchanged between 2015 and 2016, i.e., were taught by the same instructor on the same day
of the week and at the same time. In Table IX, we restrict the analysis to these 9 classes and
include class fixed effects in the empirical specification.
The top panel of Table IX shows estimates without controls, while the bottom panel
results include individual controls, with the exception of class characteristics such as gender
of the professor and class size. Even though the sample size is smaller, the main results are
fairly robust. The estimated coefficients are similar in magnitude when class fixed effects are
added. When controls are added, enrollment in Intermediate Micro the year following the
intervention becomes marginally insignificant (p=0.11). Taking another economics class at
any time after Principles remains significant (p=0.057). When looking at final outcomes, we
see that the estimated coefficient of the number of economics classes taken loses significance.
However, the impact on the choice to major in economics remains similar in magnitude to
that observed in Table IV and significant at the 10 percent level.
4.4 Effects on men
We designed our intervention with the aim of impacting the population of female students
enrolled in introductory economics classes. However, male students were also present during
the role model visits. Here, we treat the men enrolled in principles classes as an additional
control group and replicate the analysis on them as a ‘placebo test’ for the intervention.
Figure V shows intermediate and final outcomes for the male students enrolled in control
and treatment Principles classes in 2015 and 2016. We see no evidence of a significant effect of
the intervention on any of our outcomes for the male sample. This is confirmed by regression
analysis, displayed in Table A4 in Appendix.
In Table A5 in Appendix, we take the full sample of female and male students and include
a triple interaction between a female student dummy, the year dummy, and the treatment
20

class dummy. We also include controls and class fixed effects.34 The results confirm that
the intervention had no impact on the male students, whereas it had a significant differential
(positive) effect on the female students.
5 Discussion on mechanisms
Overall, the evidence presented in Sections 3 and 4 shows that a simple, and low cost role
model intervention can significantly increase the percentage of women taking economics
classes and ultimately majoring in economics. A possible limitation of our study is that
we are unable to identify precisely which characteristics of the role models were the most
important in influencing young women to pursue economics: whether it was that the careers
they both had pursued were more attractive to women, yet not usually perceived as linked
to the economics major, or simply personal experiences of success and their charisma which
were inspiring and influential. This is because, by design, we aimed to choose the role models
based on any combination of factors that would make them the most appealing to female
undergraduate students. Hence, we decided to rely on the assessment of two current female
economics majors, who perhaps implicitly knew best what would inspire their peers.
While disentangling experimentally the channels of role model influence is left to future
research, we can gain some insights on the mechanisms at play in our intervention by ex-
amining our survey data. Specifically, in the self-administered questionnaire that we gave to
the 2015 and the 2016 Principles of Economics spring cohorts, we asked students to list the
jobs that they thought one could get with an economics degree. They could enter up to eight
jobs. The caveat is that we have data only for the students who were in class the day of the
survey and decided to answer the jobs question, i.e., a total of 429 female students (68% of
our sample).
The data shows that, as a result of the intervention, significantly more female students
mentioned the fields of work of the two role models (marketing and management) as being
associated with the economics major.35 In particular, 22% of the students in treated classes
in 2016 mentioned either field as a potential sector of work versus only 6% in control classes
(p=0.001). In 2015, the percentages of students mentioning marketing or management were
9.65% in control classes and 10.62% in treatment classes and the difference is not statistically
significant (p=0.749). This is clear evidence that the role models provided novel information
to the students.
34Table A6 in Appendix reports results for the full sample with controls but without class fixed effects.35We do not see a significant increase in the percentage of students who list the non-profit sector as a field
of work.
21
In order to assess whether the intervention worked through the observed increase in
information on attainable jobs, we examine whether, as a result of the role model visits, we
saw a decrease in the majors that are more directly related to the fields of work of the two role
models, i.e., marketing and management. If this were the case, it would be evidence that the
intervention worked by nudging into economics students who wanted a career in marketing
or management and were previously planning to achieve it by majoring in those fields but
that, because of the intervention, decided to do so with an economics degree. Figure II and
Table V show that the intervention did not cause a decline in either the marketing major
nor the business major, to which the field of management belongs. This indicates that the
information given by the role models did not lead students who were planning to major in
those fields to switch to economics.
Another possibility is that the new information on potential jobs associated with eco-
nomics induced students who were not thinking of working in marketing or management to
enter those fields, and to pursue an economics major to do so, just like the role models.
Our survey data provide suggestive evidence that this is not the case. When examining
the majors chosen by the female students who listed management or marketing among the
jobs associated with economics, we see that none of these students ended up majoring in
economics. This is true for both the control and the treatment classes.
Overall, the evidence suggests that, while the role models provided new information on
the jobs that one could get with an economics degree, it is not such information that induced
women to major in economics. We tentatively conclude that the intervention worked mainly
through an inspiration rather than an information channel.
6 Conclusions
Closing the gender gap in quantitative, high-paying subjects such as economics is an impor-
tant goal, which has proven remarkably stubborn to achieve. In this paper, we employed a
field experiment to investigate the impact that female role models may play in young women’s
decisions to major in economics. The existing studies of role model effects in the context of
majoring choices have been looking at the impact of female professors on female students’
behaviors. Crucially, these studies raise questions about the identification of pure role model
effects, since gender-specific teaching methods and/or behaviors toward same-gender students
may confound the impact that female teachers may have on female students solely due to
their ability to inspire them to model their choices after their own.
We employed role models who were not instructors and conducted a field experiment to
clearly identify role model effects on women’s choice of a male-dominated major. Specifi-
22

cally, we randomly selected Principles of Economics classes to receive short visits from two
successful and charismatic career women who majored in economics at the same university.
A crucial feature of our design is that we chose the role models with the help of two current
female economics majors on the basis of their interest in the role models’ careers and their
assessment of the role models’ communication skills and charisma. As a result, the fields
of work of the chosen role models – non-profit, sale management and marketing – are not
stereotypically associated with the economics major.
We found evidence of strong and large, given the baseline levels, effects of the role model
visits on female students’ enrolment in further economics classes and, ultimately, their de-
cision to major in economics. In particular, the likelihood that a female student who took
Principles of Economics would end up majoring in economics increased by about 8 percentage
points (over a baseline level of 9%) as a result of the intervention.
Our majoring data also allowed us to examine which fields of study saw a decline in
female students, allowing us to infer which majors the treated students would have chosen
in the absence of the intervention. We found evidence that the women who were nudged
to study economics would have otherwise majored in humanities. This suggests that our
role model intervention could have a significant impact on the treated women’s lifetime
income streams, as the counterfactual seems to be that, absent the intervention, they would
have ended up in lower-earning jobs. One concern could be that the intervention may have
led to a misallocation of talents by attracting women who were unlikely to do well in the
economics program. Our analysis of students’ performance in Intermediate Microeconomics,
as measured by a standardized test, shows that this is not the case, as the treated female
students performed equally, if not better, than the female students in the control group. This
indicates that the female students who were affected by the intervention were equally if not
better equipped to succeed in the field; they were simply not considering economics as a
possible major.
Overall, the evidence presented shows that a simple, low cost and easily scalable inter-
vention can significantly increase the percentage of women majoring in a male dominated
field like economics. When examining possible mechanisms, we found no evidence that in-
creased information about job choice was responsible for the observed impacts, leading us
to conclude that the intervention may have worked through inspiration. Further work could
compare male and female role models and their differential effects on male and female stu-
dents, as well as experiment with the careers of the role models. The analysis could also be
easily extended to other male-dominated or female-dominated fields of study. Overall, we
consider this paper a first step in a rich potential area of research on role model effects, not
only in undergraduate economics.
23
References
Abadie, Alberto, Susan Athey, Guido W Imbens, and Jeffrey Wooldridge (2017). When
should you adjust standard errors for clustering? Technical Report 24003, National Bureau
of Economic Research.
Allgood, Sam, William B Walstad, and John J Siegfried (2015). Research on teaching eco-
nomics to undergraduates. Journal of Economic Literature 53 (2), 285–325.
Angrist, Joshua D and Jorn-Steffen Pischke (2008). Mostly harmless econometrics: An em-
piricist’s companion. Princeton University Press.
Arcidiacono, Peter (2004). Ability sorting and the returns to college major. Journal of
Econometrics 121 (1), 343–375.
Athey, Susan, Christopher Avery, and Peter Zemsky (2000). Mentoring and diversity. Amer-
ican Economic Review 90 (4), 765–786.
Bayer, Amanda and Cecilia Elena Rouse (2016). Diversity in the economics profession: A
new attack on an old problem. The Journal of Economic Perspectives 30 (4), 221–242.
Beaman, Lori, Esther Duflo, Rohini Pande, and Petia Topalova (2012). Female leadership
raises aspirations and educational attainment for girls: A policy experiment in India.
science 335 (6068), 582–586.
Bear, Julia B and Anita Williams Woolley (2011). The role of gender in team collaboration
and performance. Interdisciplinary science reviews 36 (2), 146–153.
Bernard, Tanguy, Stefan Dercon, Kate Orkin, Alemayehu Taffesse, et al. (2014). The future
in mind: Aspirations and forward-looking behaviour in rural Ethiopia. Centre for Economic
Policy Research London.
Black, Dan A, Seth Sanders, and Lowell Taylor (2003). The economic reward for studying
economics. Economic Inquiry 41 (3), 365–377.
Blau, Francine D, Janet M Currie, Rachel TA Croson, and Donna K Ginther (2010). Can
mentoring help female assistant professors? interim results from a randomized trial. The
American Economic Review 100 (2), 348–352.
Buser, Thomas, Muriel Niederle, and Hessel Oosterbeek (2014). Gender, competitiveness,
and career choices. The Quarterly Journal of Economics 129 (3), 1409–1447.
24
Cameron, A Colin and Douglas L Miller (2015). A practitioner’s guide to cluster-robust
inference. Journal of Human Resources 50 (2), 317–372.
Carnevale, Anthony P and Ban Cheah (2015). From hard times to better times: College
majors, unemployment, and earnings. Georgetown University Center on Education and
the Workforce.
Carrell, Scott E, Marianne E Page, and James E West (2010). Sex and science: How professor
gender perpetuates the gender gap. The Quarterly Journal of Economics 125 (3), 1101–
1144.
Chong, Alberto and Eliana La Ferrara (2009). Television and divorce: Evidence from brazil-
ian novelas. Journal of the European Economic Association 7 (2-3), 458–468.
Dennehy, Tara C and Nilanjana Dasgupta (2017). Female peer mentors early in college
increase women’s positive academic experiences and retention in engineering. Proceedings
of the National Academy of Sciences 114 (23), 5964–5969.
Dynan, Karen E and Cecilia Elena Rouse (1997). The underrepresentation of women in
economics: A study of undergraduate economics students. The Journal of Economic Ed-
ucation 28 (4), 350–368.
Ellison, Sara Fisher and Wallace P Mullin (2014). Diversity, social goods provision, and
performance in the firm. Journal of Economics & Management Strategy 23 (2), 465–481.
Emerson, Tisha LN, KimMarie McGoldrick, and Kevin J Mumford (2012). Women and the
choice to study economics. The Journal of Economic Education 43 (4), 349–362.
Flory, Jeffrey A, Andreas Leibbrandt, and John A List (2014). Do competitive workplaces
deter female workers? a large-scale natural field experiment on job entry decisions. The
Review of Economic Studies 82 (1), 122–155.
Goldin, Claudia (2013). Notes on women and the undergraduate economics major. CSWEP
Newsletter 2013 (15), 4–6.
Hoogendoorn, Sander, Hessel Oosterbeek, and Mirjam Van Praag (2013). The impact of
gender diversity on the performance of business teams: Evidence from a field experiment.
Management Science 59 (7), 1514–1528.
Hsieh, Chang-Tai, Erik Hurst, Charles I Jones, and Peter J Klenow (2013). The allocation of
talent and us economic growth. Technical report, National Bureau of Economic Research.
25
Jensen, Robert and Emily Oster (2009). The power of tv: Cable television and women’s
status in india. The Quarterly Journal of Economics 124 (3), 1057–1094.
Kirkeboen, Lars J, Edwin Leuven, and Magne Mogstad (2016). Field of study, earnings, and
self-selection. The Quarterly Journal of Economics 131 (3), 1057–1111.
Kline, Patrick, Andres Santos, et al. (2012). A score based approach to wild bootstrap
inference. Journal of Econometric Methods 1 (1), 23–41.
Kofoed, Michael S et al. (2019). The effect of same-gender or same-race role models on
occupation choice evidence from randomly assigned mentors at west point. Journal of
Human Resources 54 (2), 430–467.
Kugler, Adriana D, Catherine H Tinsley, and Olga Ukhaneva (2017). Choice of majors: Are
women really different from men? Technical Report 23735, National Bureau of Economic
Research.
La Ferrara, Eliana, Alberto Chong, and Suzanne Duryea (2012). Soap operas and fertility:
Evidence from brazil. American Economic Journal: Applied Economics 4 (4), 1–31.
Lim, Jaegeum and Jonathan Meer (2019). Persistent effects of teacher-student gender
matches. Journal of Human Resources , 0218–9314R4.
Lockwood, Penelope (2006). ”someone like me can be successful”: Do college students need
same-gender role models? Psychology of Women Quarterly 30 (1), 36–46.
May, Ann, Mary G McGarvey, and Robert Whaples (2014). Are disagreements among male
and female economists marginal at best?: A survey of aea members and their views on
economics and economic policy. Contemporary Economic Policy 32 (1), 111–132.
May, Ann Mari, Mary G McGarvey, and David Kucera (2018). Gender and european eco-
nomic policy: A survey of the views of european economists on contemporary economic
policy. Kyklos 71 (1), 162–183.
Menger, Andrew (2015, March). CLUSTSE: Stata module to estimate the statistical signifi-
cance of parameters when the data is clustered with a small number of clusters. Statistical
Software Components, Boston College Department of Economics.
Morgenroth, Thekla, Michelle K Ryan, and Kim Peters (2015). The motivational theory
of role modeling: How role models influence role aspirants’ goals. Review of General
Psychology 19 (4), 465–483.
26
Nguyen, Trang (2008). Information, role models and perceived returns to education: Exper-
imental evidence from Madagascar.
Niederle, Muriel and Lise Vesterlund (2007). Do women shy away from competition? Do
men compete too much? The Quarterly Journal of Economics 122 (3), 1067–1101.
Rask, Kevin and Jill Tiefenthaler (2008). The role of grade sensitivity in explaining the
gender imbalance in undergraduate economics. Economics of Education Review 27 (6),
676–687.
Reuben, Ernesto, Matthew Wiswall, and Basit Zafar (2017). Preferences and biases in edu-
cational choices and labour market expectations: Shrinking the black box of gender. The
Economic Journal 127 (604), 2153–2186.
Riley, Emma (2017). Role models in movies: the impact of queen of katwe on students’
educational attainment. Technical report, Centre for the Study of African Economies,
University of Oxford.
Roodman, David, Morten Ørregaard Nielsen, James G MacKinnon, and Matthew D Webb
(2019). Fast and wild: Bootstrap inference in stata using boottest. The Stata Jour-
nal 19 (1), 4–60.
Stevenson, Betsey and Hanna Zlotnik (2018). Representations of men and women in intro-
ductory economics textbooks. In AEA Papers and Proceedings, Volume 108, pp. 180–85.
Stout, Jane G, Nilanjana Dasgupta, Matthew Hunsinger, and Melissa A McManus (2011).
STEMing the tide: using ingroup experts to inoculate women’s self-concept in science,
technology, engineering, and mathematics (STEM). Journal of personality and social psy-
chology 100 (2), 255.
Wiswall, Matthew and Basit Zafar (2014). Determinants of college major choice: Identifica-
tion using an information experiment. The Review of Economic Studies 82 (2), 791–824.
Wiswall, Matthew and Basit Zafar (2017). Preference for the workplace, investment in human
capital, and gender. The Quarterly Journal of Economics 133 (1), 457–507.
27
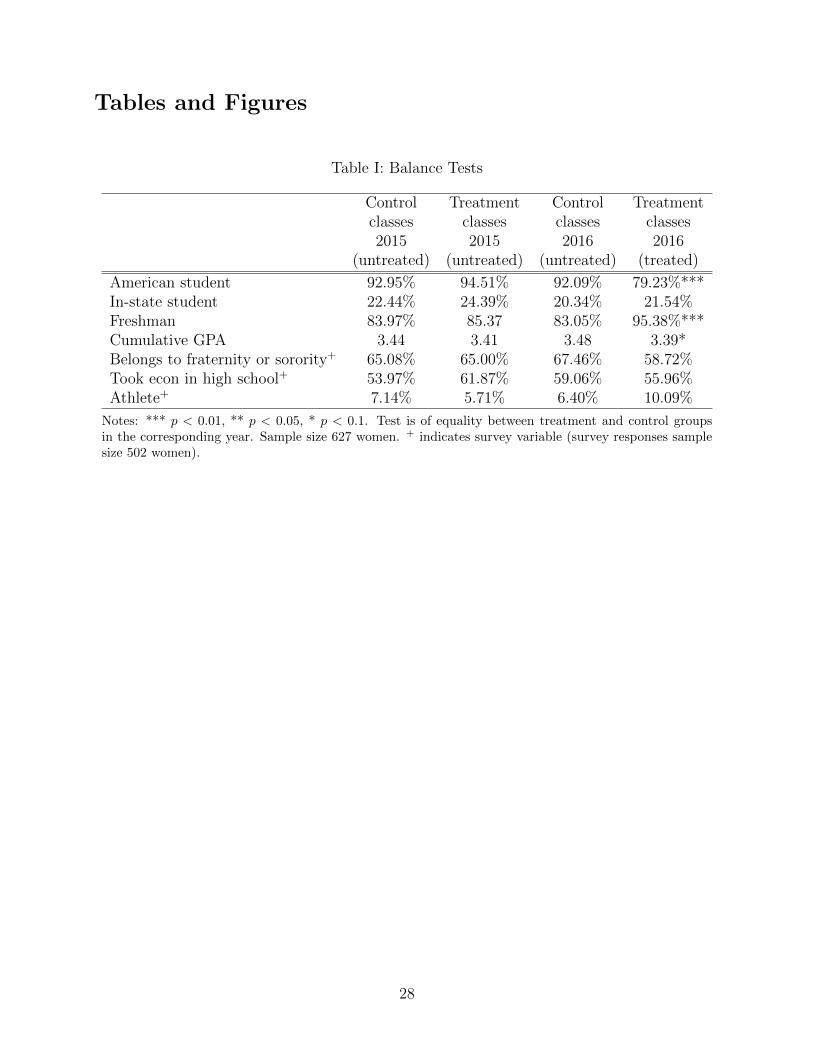
Tables and Figures
Table I: Balance Tests
Control Treatment Control Treatmentclasses classes classes classes2015 2015 2016 2016
(untreated) (untreated) (untreated) (treated)
American student 92.95% 94.51% 92.09% 79.23%***In-state student 22.44% 24.39% 20.34% 21.54%Freshman 83.97% 85.37 83.05% 95.38%***Cumulative GPA 3.44 3.41 3.48 3.39*Belongs to fraternity or sorority+ 65.08% 65.00% 67.46% 58.72%Took econ in high school+ 53.97% 61.87% 59.06% 55.96%Athlete+ 7.14% 5.71% 6.40% 10.09%
Notes: *** p < 0.01, ** p < 0.05, * p < 0.1. Test is of equality between treatment and control groupsin the corresponding year. Sample size 627 women. + indicates survey variable (survey responses samplesize 502 women).
28
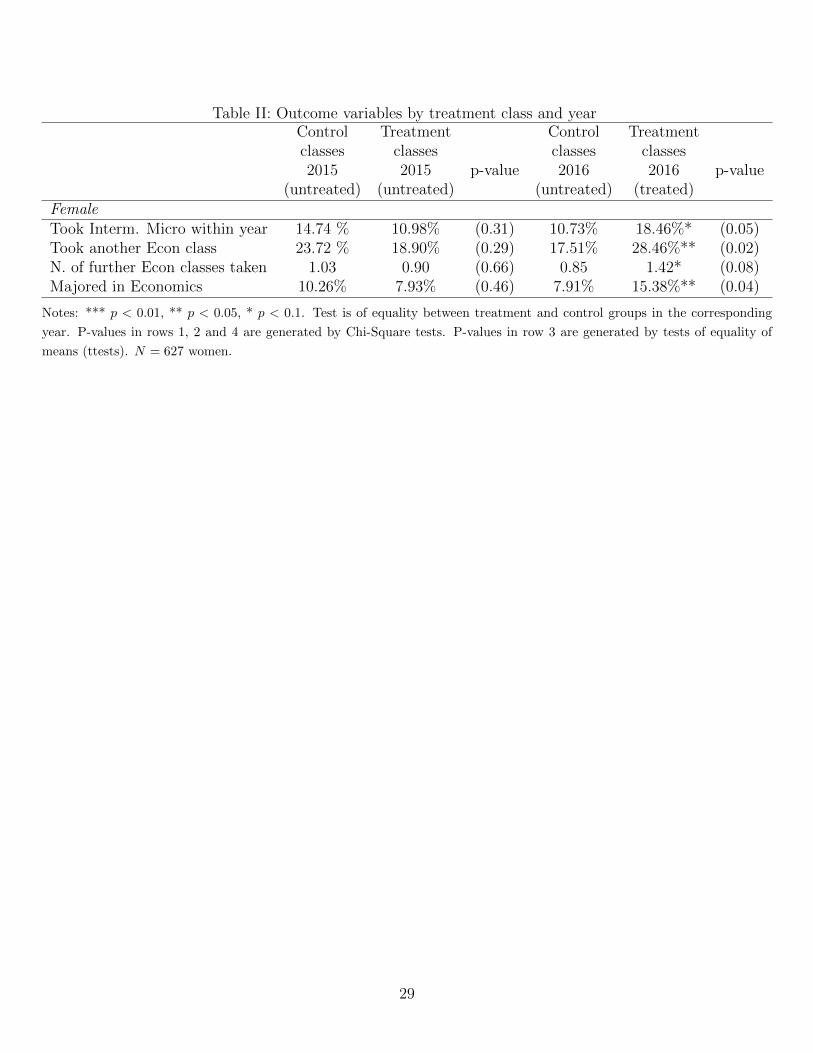
Table II: Outcome variables by treatment class and yearControl Treatment Control Treatmentclasses classes classes classes2015 2015 p-value 2016 2016 p-value
(untreated) (untreated) (untreated) (treated)FemaleTook Interm. Micro within year 14.74 % 10.98% (0.31) 10.73% 18.46%* (0.05)Took another Econ class 23.72 % 18.90% (0.29) 17.51% 28.46%** (0.02)N. of further Econ classes taken 1.03 0.90 (0.66) 0.85 1.42* (0.08)Majored in Economics 10.26% 7.93% (0.46) 7.91% 15.38%** (0.04)
Notes: *** p < 0.01, ** p < 0.05, * p < 0.1. Test is of equality between treatment and control groups in the corresponding
year. P-values in rows 1, 2 and 4 are generated by Chi-Square tests. P-values in row 3 are generated by tests of equality of
means (ttests). N = 627 women.
29
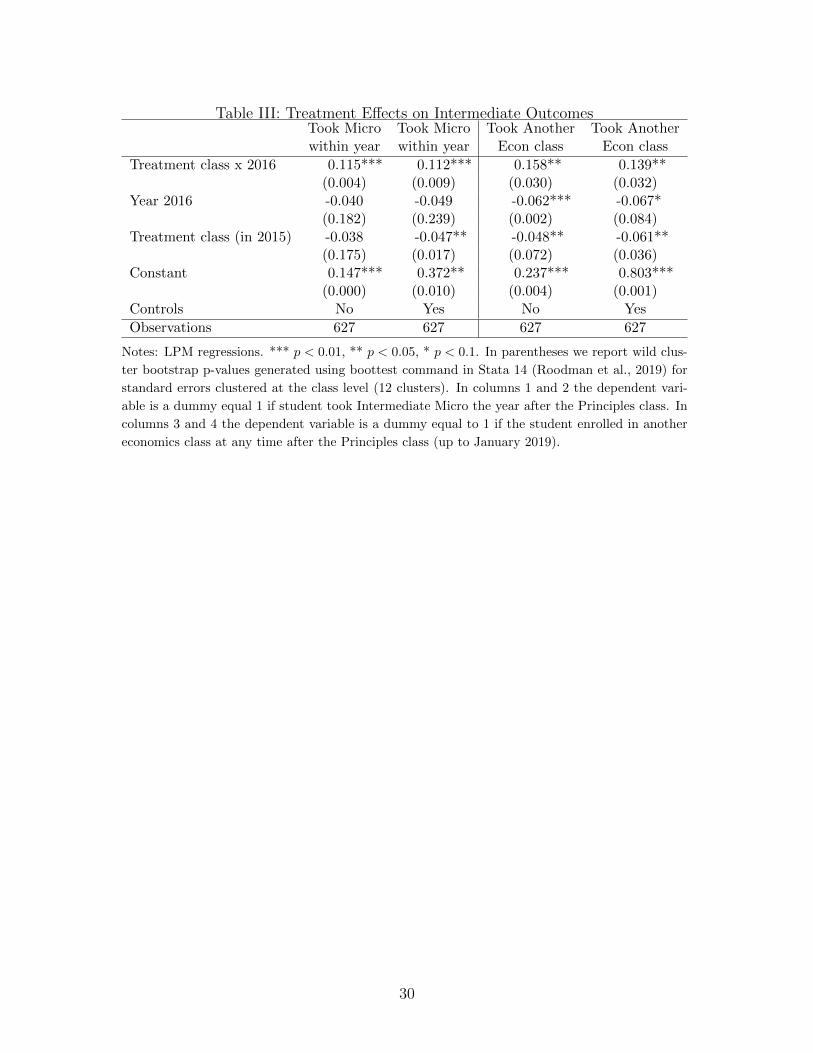
Table III: Treatment Effects on Intermediate OutcomesTook Micro Took Micro Took Another Took Anotherwithin year within year Econ class Econ class
Treatment class x 2016 0.115*** 0.112*** 0.158** 0.139**(0.004) (0.009) (0.030) (0.032)
Year 2016 -0.040 -0.049 -0.062*** -0.067*(0.182) (0.239) (0.002) (0.084)
Treatment class (in 2015) -0.038 -0.047** -0.048** -0.061**(0.175) (0.017) (0.072) (0.036)
Constant 0.147*** 0.372** 0.237*** 0.803***(0.000) (0.010) (0.004) (0.001)
Controls No Yes No Yes
Observations 627 627 627 627
Notes: LPM regressions. *** p < 0.01, ** p < 0.05, * p < 0.1. In parentheses we report wild clus-
ter bootstrap p-values generated using boottest command in Stata 14 (Roodman et al., 2019) for
standard errors clustered at the class level (12 clusters). In columns 1 and 2 the dependent vari-
able is a dummy equal 1 if student took Intermediate Micro the year after the Principles class. In
columns 3 and 4 the dependent variable is a dummy equal to 1 if the student enrolled in another
economics class at any time after the Principles class (up to January 2019).
30
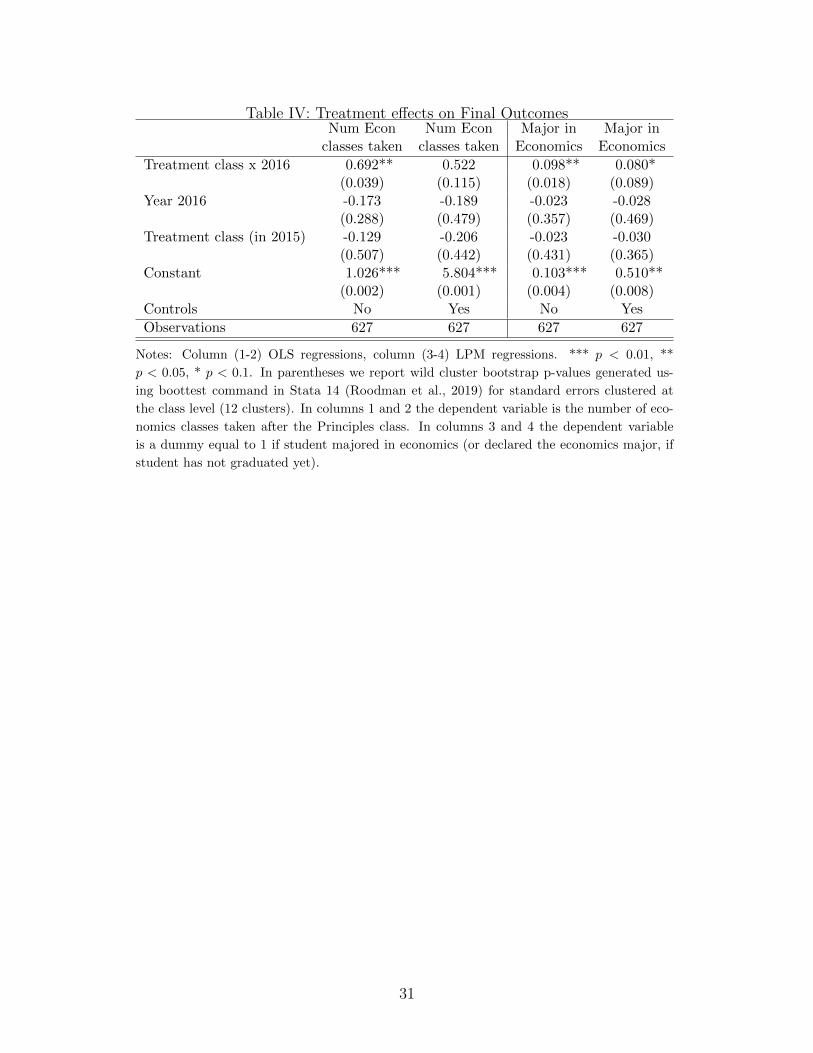
Table IV: Treatment effects on Final OutcomesNum Econ Num Econ Major in Major in
classes taken classes taken Economics Economics
Treatment class x 2016 0.692** 0.522 0.098** 0.080*(0.039) (0.115) (0.018) (0.089)
Year 2016 -0.173 -0.189 -0.023 -0.028(0.288) (0.479) (0.357) (0.469)
Treatment class (in 2015) -0.129 -0.206 -0.023 -0.030(0.507) (0.442) (0.431) (0.365)
Constant 1.026*** 5.804*** 0.103*** 0.510**(0.002) (0.001) (0.004) (0.008)
Controls No Yes No Yes
Observations 627 627 627 627
Notes: Column (1-2) OLS regressions, column (3-4) LPM regressions. *** p < 0.01, **
p < 0.05, * p < 0.1. In parentheses we report wild cluster bootstrap p-values generated us-
ing boottest command in Stata 14 (Roodman et al., 2019) for standard errors clustered at
the class level (12 clusters). In columns 1 and 2 the dependent variable is the number of eco-
nomics classes taken after the Principles class. In columns 3 and 4 the dependent variable
is a dummy equal to 1 if student majored in economics (or declared the economics major, if
student has not graduated yet).
31
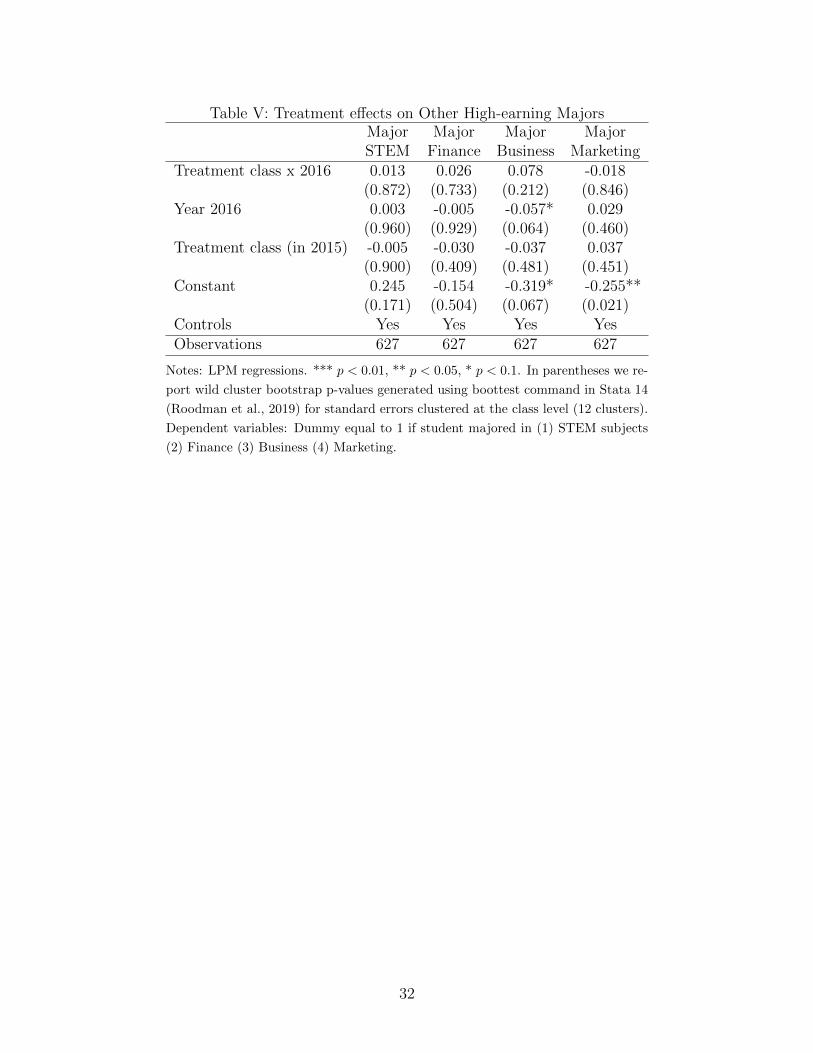
Table V: Treatment effects on Other High-earning MajorsMajor Major Major MajorSTEM Finance Business Marketing
Treatment class x 2016 0.013 0.026 0.078 -0.018(0.872) (0.733) (0.212) (0.846)
Year 2016 0.003 -0.005 -0.057* 0.029(0.960) (0.929) (0.064) (0.460)
Treatment class (in 2015) -0.005 -0.030 -0.037 0.037(0.900) (0.409) (0.481) (0.451)
Constant 0.245 -0.154 -0.319* -0.255**(0.171) (0.504) (0.067) (0.021)
Controls Yes Yes Yes YesObservations 627 627 627 627
Notes: LPM regressions. *** p < 0.01, ** p < 0.05, * p < 0.1. In parentheses we re-
port wild cluster bootstrap p-values generated using boottest command in Stata 14
(Roodman et al., 2019) for standard errors clustered at the class level (12 clusters).
Dependent variables: Dummy equal to 1 if student majored in (1) STEM subjects
(2) Finance (3) Business (4) Marketing.
32
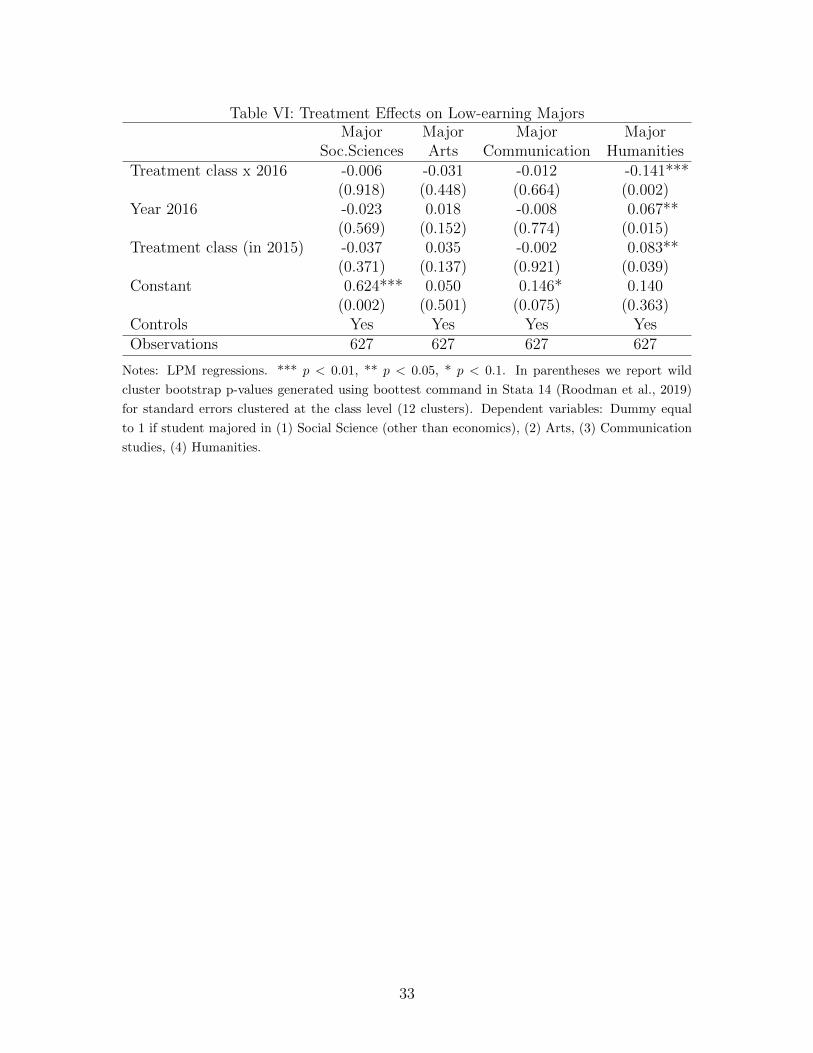
Table VI: Treatment Effects on Low-earning MajorsMajor Major Major Major
Soc.Sciences Arts Communication HumanitiesTreatment class x 2016 -0.006 -0.031 -0.012 -0.141***
(0.918) (0.448) (0.664) (0.002)Year 2016 -0.023 0.018 -0.008 0.067**
(0.569) (0.152) (0.774) (0.015)Treatment class (in 2015) -0.037 0.035 -0.002 0.083**
(0.371) (0.137) (0.921) (0.039)Constant 0.624*** 0.050 0.146* 0.140
(0.002) (0.501) (0.075) (0.363)Controls Yes Yes Yes YesObservations 627 627 627 627
Notes: LPM regressions. *** p < 0.01, ** p < 0.05, * p < 0.1. In parentheses we report wild
cluster bootstrap p-values generated using boottest command in Stata 14 (Roodman et al., 2019)
for standard errors clustered at the class level (12 clusters). Dependent variables: Dummy equal
to 1 if student majored in (1) Social Science (other than economics), (2) Arts, (3) Communication
studies, (4) Humanities.
33
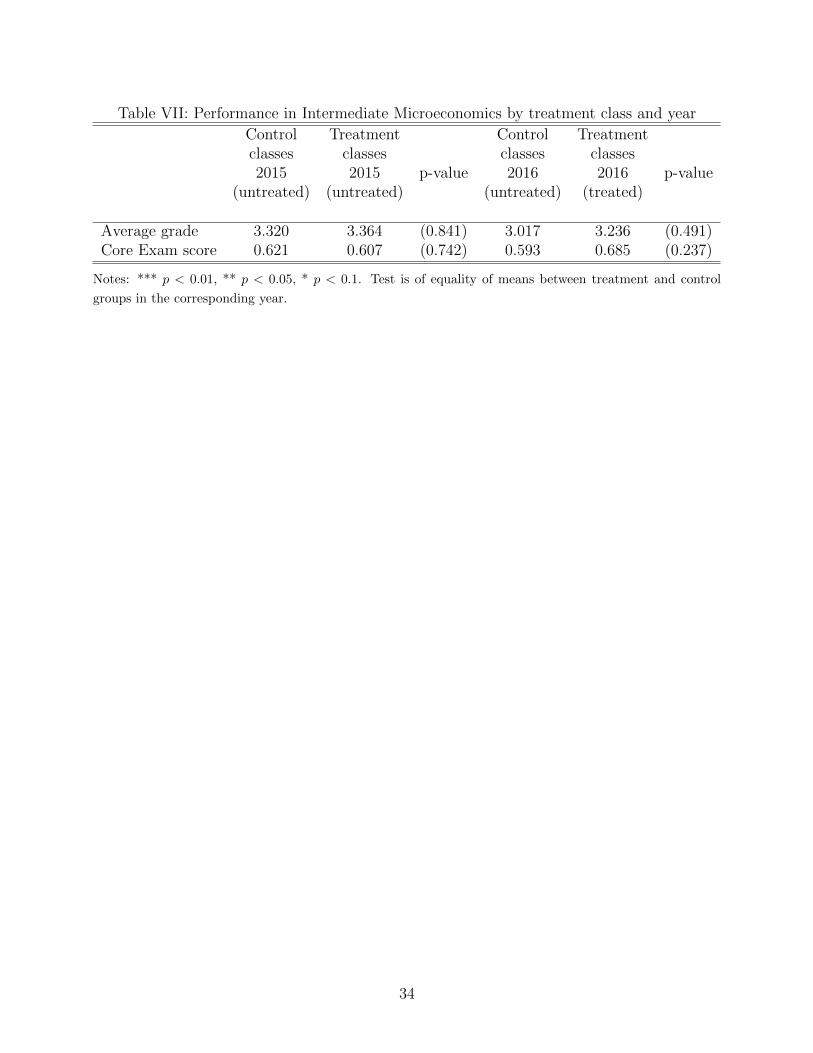
Table VII: Performance in Intermediate Microeconomics by treatment class and year
Control Treatment Control Treatmentclasses classes classes classes2015 2015 p-value 2016 2016 p-value
(untreated) (untreated) (untreated) (treated)
Average grade 3.320 3.364 (0.841) 3.017 3.236 (0.491)Core Exam score 0.621 0.607 (0.742) 0.593 0.685 (0.237)
Notes: *** p < 0.01, ** p < 0.05, * p < 0.1. Test is of equality of means between treatment and control
groups in the corresponding year.
34
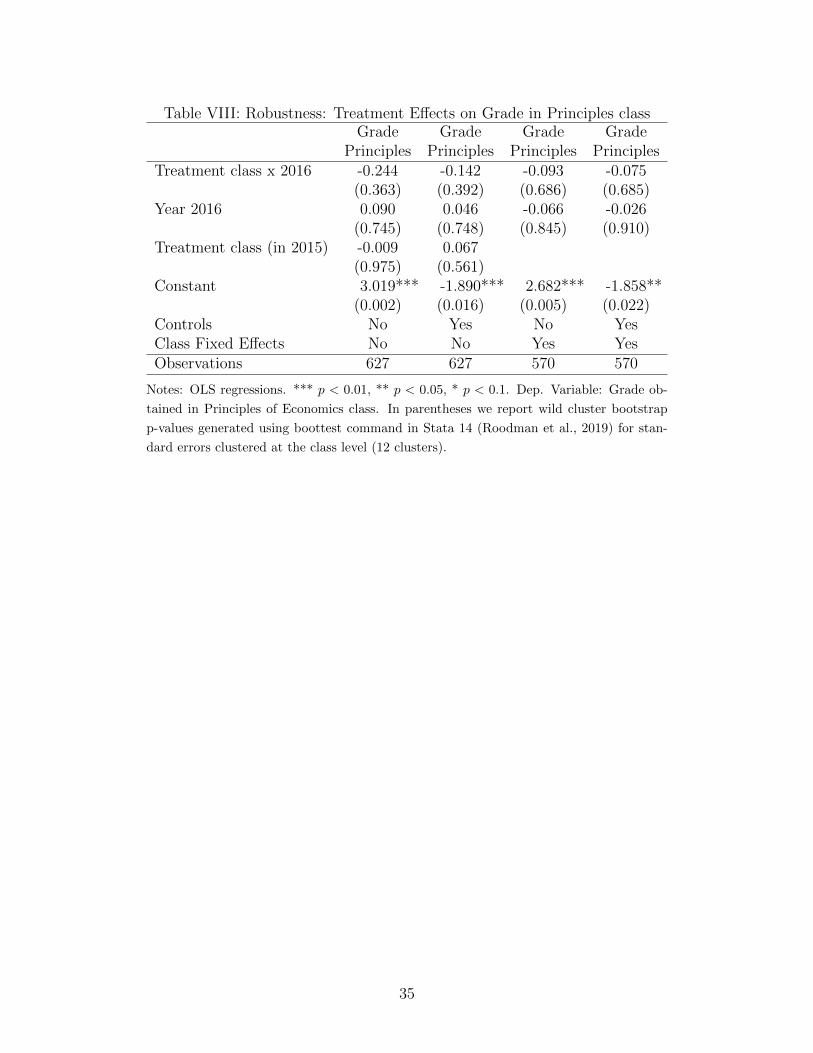
Table VIII: Robustness: Treatment Effects on Grade in Principles classGrade Grade Grade Grade
Principles Principles Principles PrinciplesTreatment class x 2016 -0.244 -0.142 -0.093 -0.075
(0.363) (0.392) (0.686) (0.685)Year 2016 0.090 0.046 -0.066 -0.026
(0.745) (0.748) (0.845) (0.910)Treatment class (in 2015) -0.009 0.067
(0.975) (0.561)Constant 3.019*** -1.890*** 2.682*** -1.858**
(0.002) (0.016) (0.005) (0.022)Controls No Yes No YesClass Fixed Effects No No Yes YesObservations 627 627 570 570
Notes: OLS regressions. *** p < 0.01, ** p < 0.05, * p < 0.1. Dep. Variable: Grade ob-
tained in Principles of Economics class. In parentheses we report wild cluster bootstrap
p-values generated using boottest command in Stata 14 (Roodman et al., 2019) for stan-
dard errors clustered at the class level (12 clusters).
35
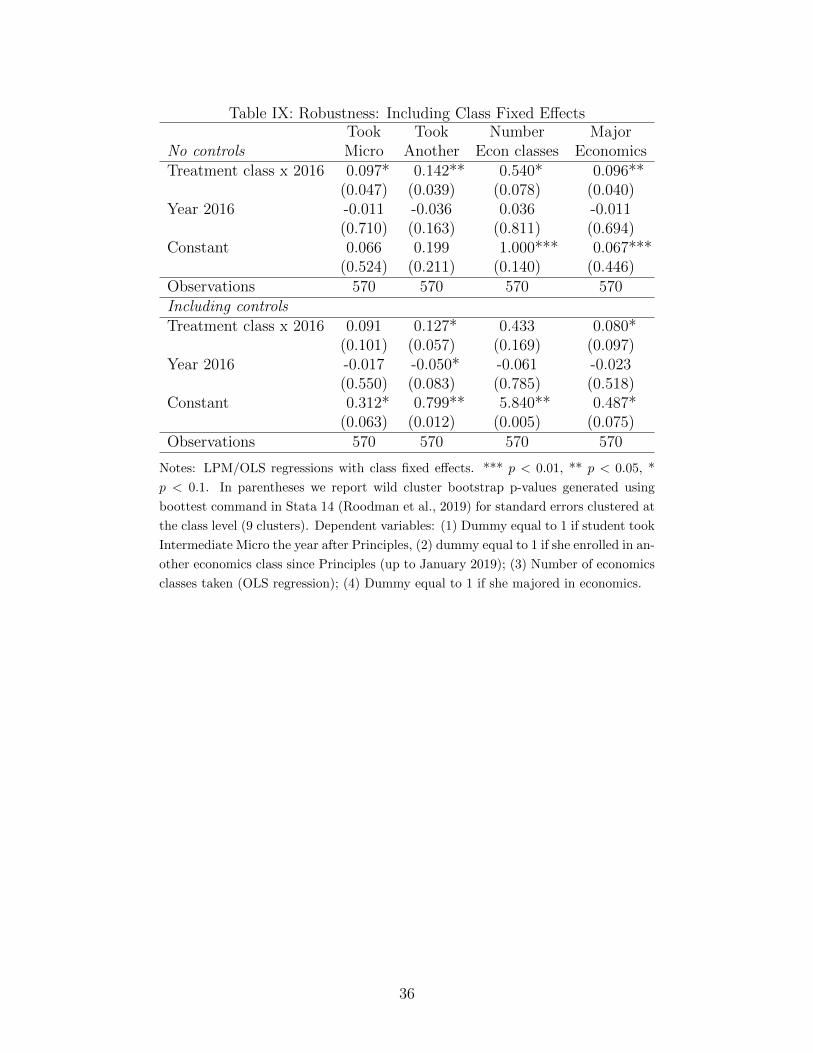
Table IX: Robustness: Including Class Fixed EffectsTook Took Number Major
No controls Micro Another Econ classes EconomicsTreatment class x 2016 0.097* 0.142** 0.540* 0.096**
(0.047) (0.039) (0.078) (0.040)Year 2016 -0.011 -0.036 0.036 -0.011
(0.710) (0.163) (0.811) (0.694)Constant 0.066 0.199 1.000*** 0.067***
(0.524) (0.211) (0.140) (0.446)Observations 570 570 570 570Including controlsTreatment class x 2016 0.091 0.127* 0.433 0.080*
(0.101) (0.057) (0.169) (0.097)Year 2016 -0.017 -0.050* -0.061 -0.023
(0.550) (0.083) (0.785) (0.518)Constant 0.312* 0.799** 5.840** 0.487*
(0.063) (0.012) (0.005) (0.075)Observations 570 570 570 570
Notes: LPM/OLS regressions with class fixed effects. *** p < 0.01, ** p < 0.05, *
p < 0.1. In parentheses we report wild cluster bootstrap p-values generated using
boottest command in Stata 14 (Roodman et al., 2019) for standard errors clustered at
the class level (9 clusters). Dependent variables: (1) Dummy equal to 1 if student took
Intermediate Micro the year after Principles, (2) dummy equal to 1 if she enrolled in an-
other economics class since Principles (up to January 2019); (3) Number of economics
classes taken (OLS regression); (4) Dummy equal to 1 if she majored in economics.
36
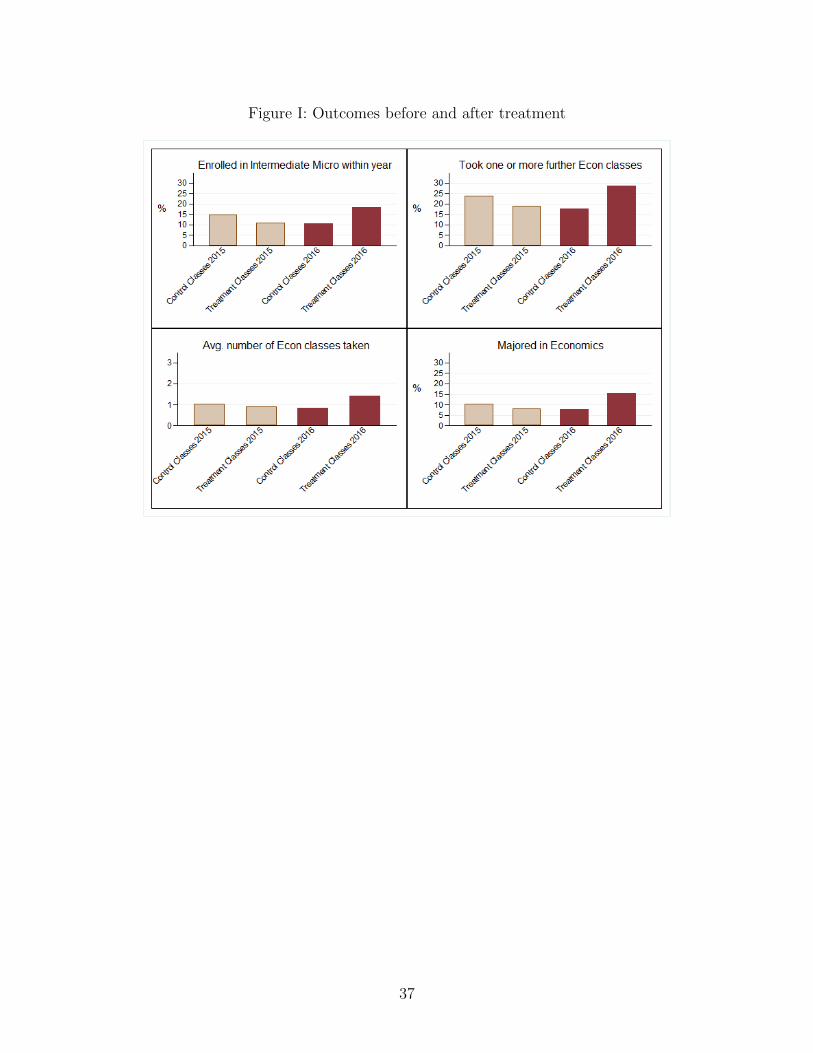
Figure I: Outcomes before and after treatment
37
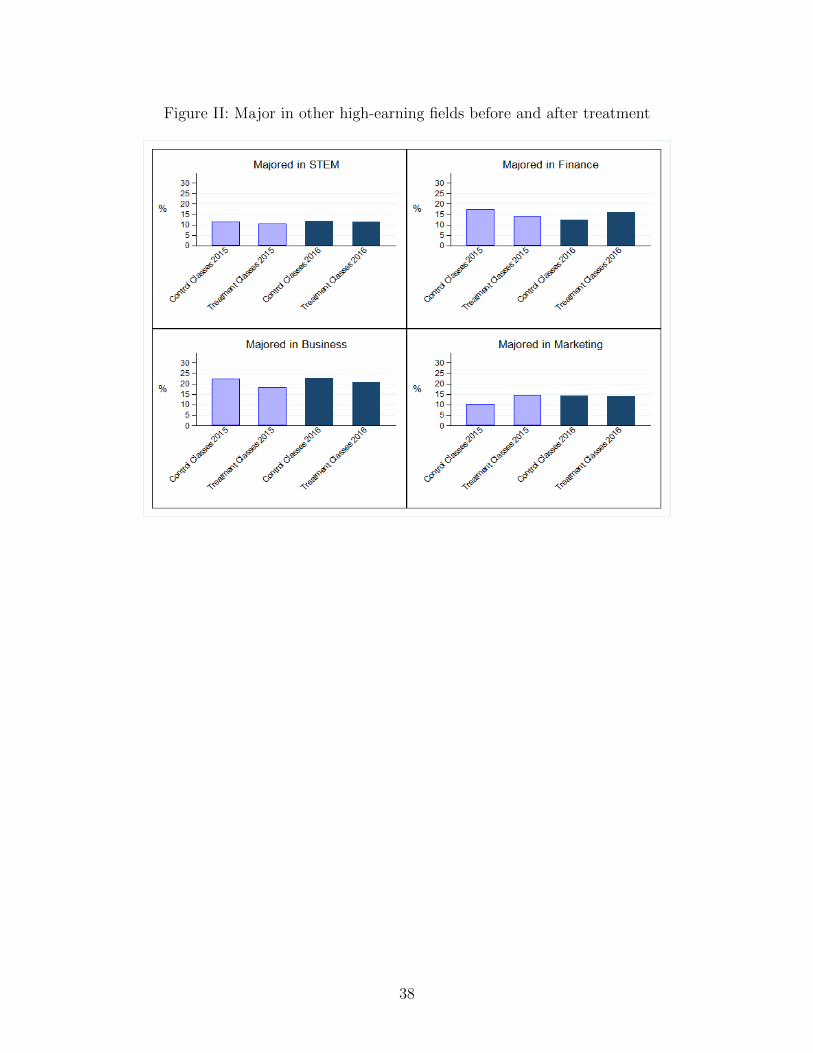
Figure II: Major in other high-earning fields before and after treatment
38
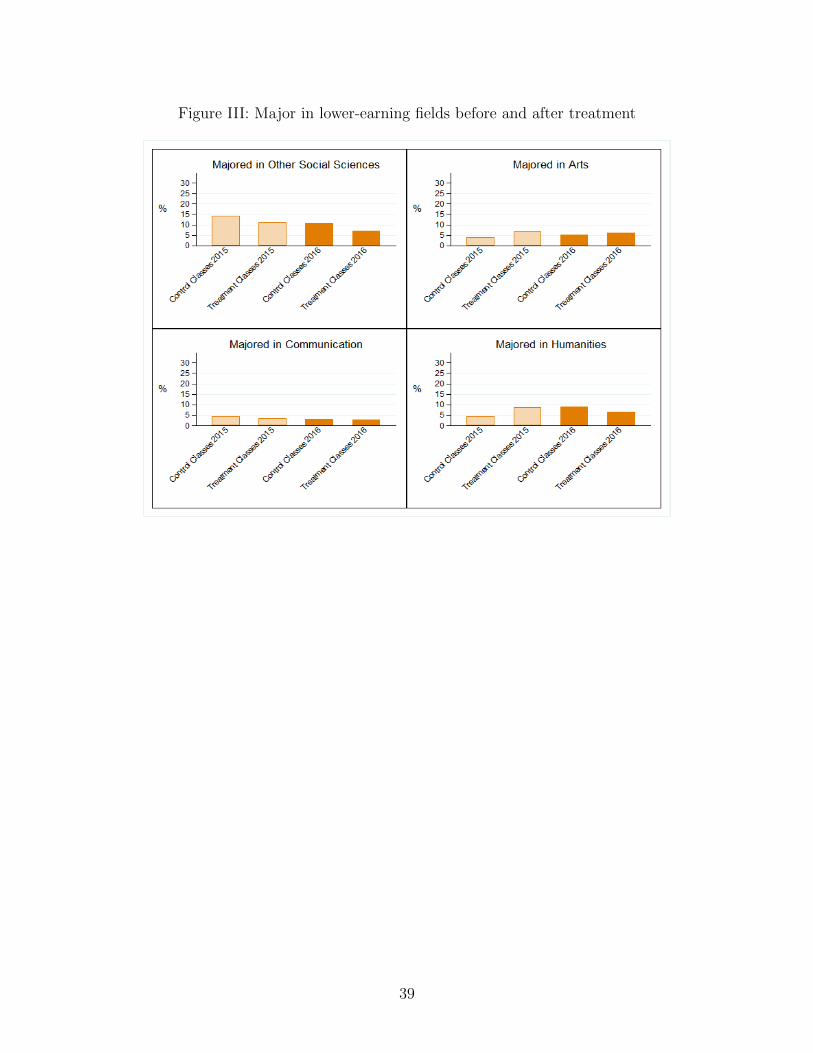
Figure III: Major in lower-earning fields before and after treatment
39
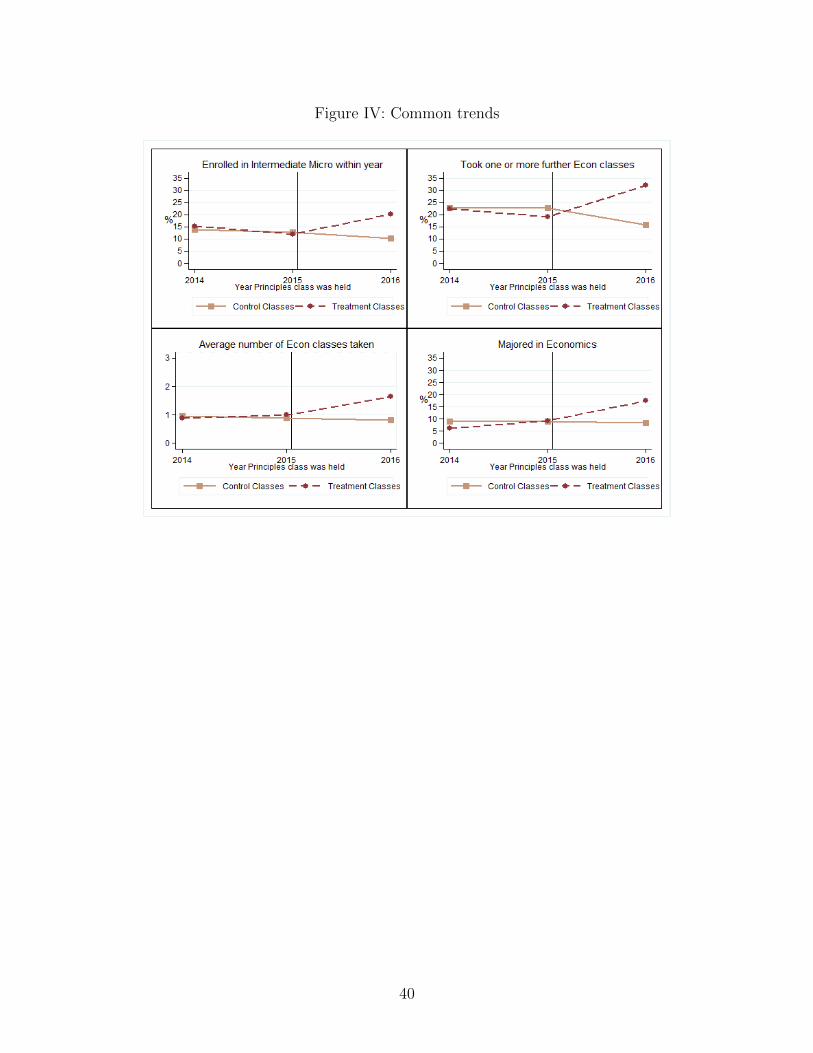
Figure IV: Common trends
40
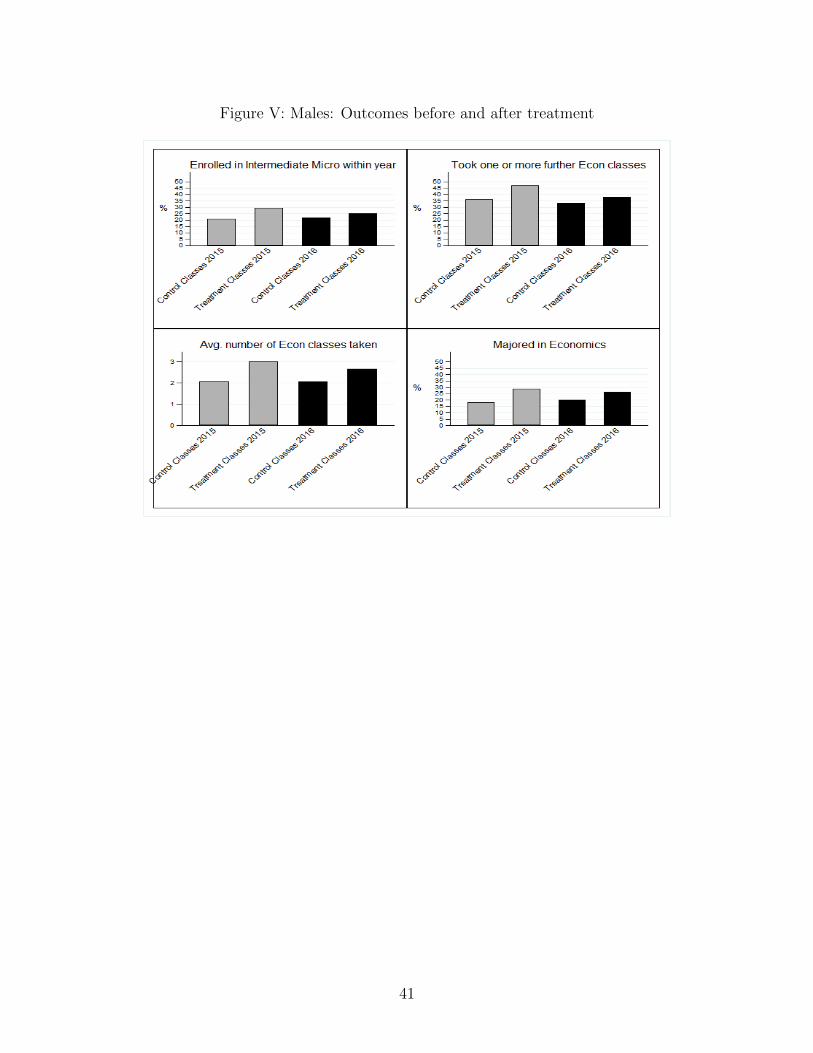
Figure V: Males: Outcomes before and after treatment
41
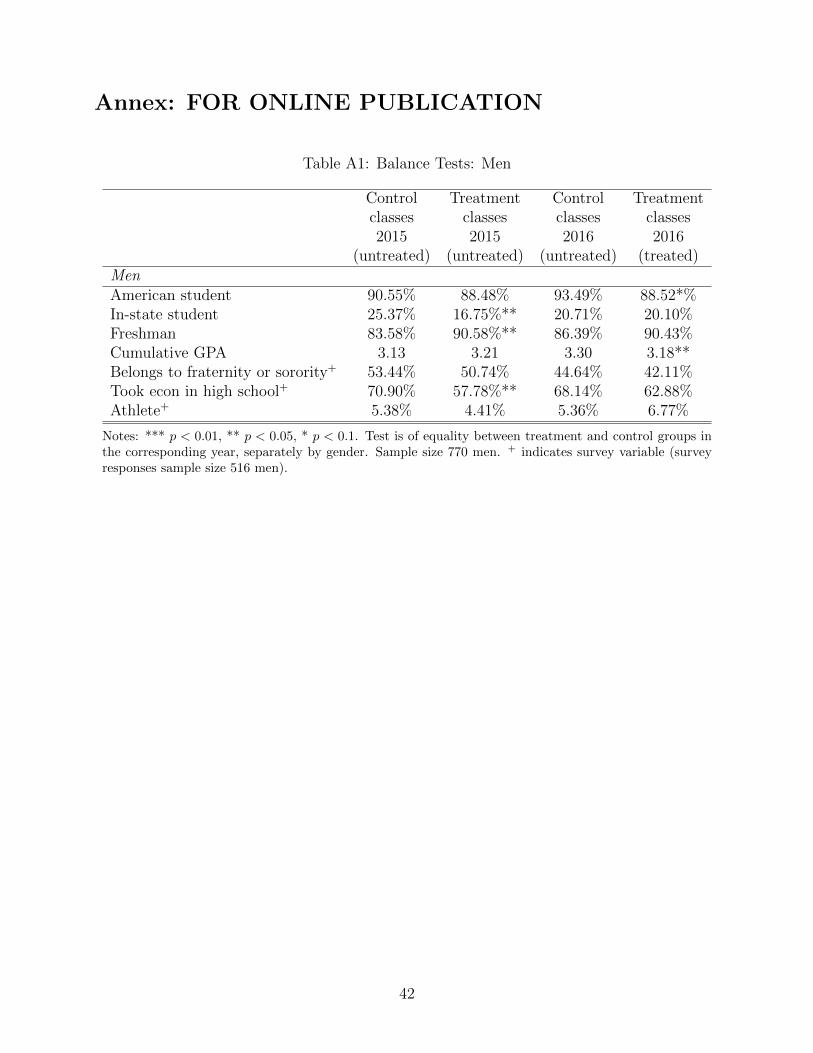
Annex: FOR ONLINE PUBLICATION
Table A1: Balance Tests: Men
Control Treatment Control Treatmentclasses classes classes classes2015 2015 2016 2016
(untreated) (untreated) (untreated) (treated)MenAmerican student 90.55% 88.48% 93.49% 88.52*%In-state student 25.37% 16.75%** 20.71% 20.10%Freshman 83.58% 90.58%** 86.39% 90.43%Cumulative GPA 3.13 3.21 3.30 3.18**Belongs to fraternity or sorority+ 53.44% 50.74% 44.64% 42.11%Took econ in high school+ 70.90% 57.78%** 68.14% 62.88%Athlete+ 5.38% 4.41% 5.36% 6.77%
Notes: *** p < 0.01, ** p < 0.05, * p < 0.1. Test is of equality between treatment and control groups inthe corresponding year, separately by gender. Sample size 770 men. + indicates survey variable (surveyresponses sample size 516 men).
42
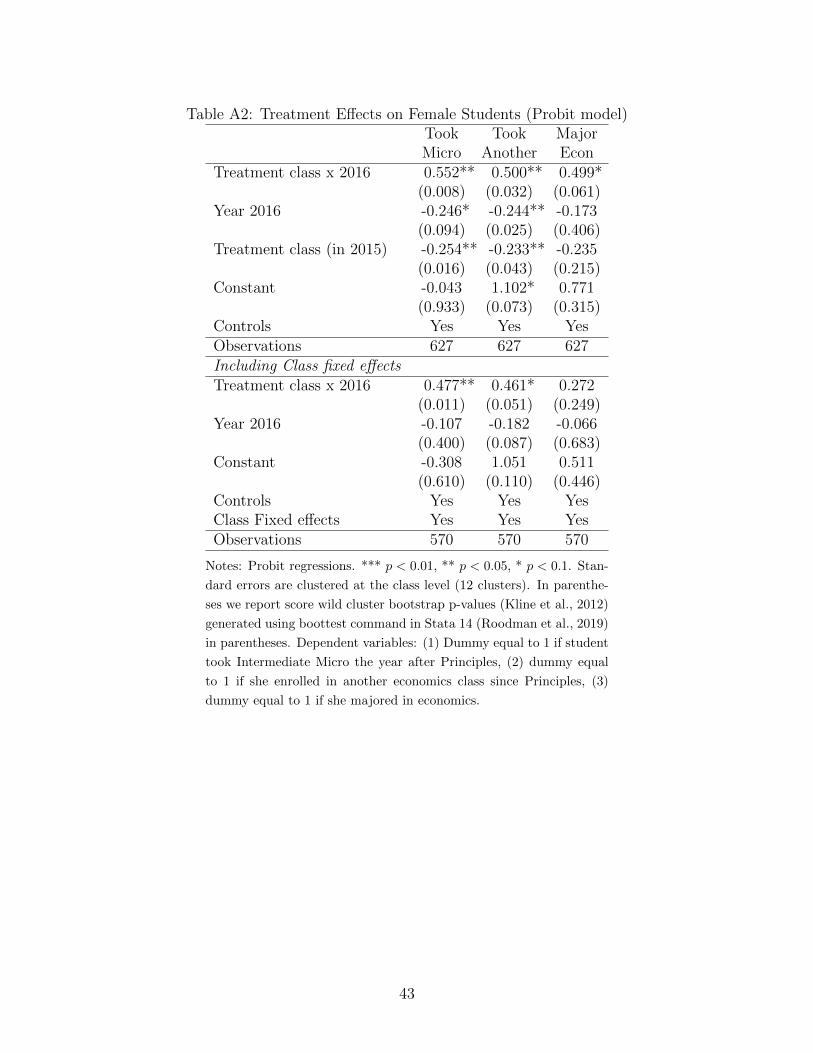
Table A2: Treatment Effects on Female Students (Probit model)Took Took MajorMicro Another Econ
Treatment class x 2016 0.552** 0.500** 0.499*(0.008) (0.032) (0.061)
Year 2016 -0.246* -0.244** -0.173(0.094) (0.025) (0.406)
Treatment class (in 2015) -0.254** -0.233** -0.235(0.016) (0.043) (0.215)
Constant -0.043 1.102* 0.771(0.933) (0.073) (0.315)
Controls Yes Yes YesObservations 627 627 627Including Class fixed effectsTreatment class x 2016 0.477** 0.461* 0.272
(0.011) (0.051) (0.249)Year 2016 -0.107 -0.182 -0.066
(0.400) (0.087) (0.683)Constant -0.308 1.051 0.511
(0.610) (0.110) (0.446)Controls Yes Yes YesClass Fixed effects Yes Yes YesObservations 570 570 570
Notes: Probit regressions. *** p < 0.01, ** p < 0.05, * p < 0.1. Stan-
dard errors are clustered at the class level (12 clusters). In parenthe-
ses we report score wild cluster bootstrap p-values (Kline et al., 2012)
generated using boottest command in Stata 14 (Roodman et al., 2019)
in parentheses. Dependent variables: (1) Dummy equal to 1 if student
took Intermediate Micro the year after Principles, (2) dummy equal
to 1 if she enrolled in another economics class since Principles, (3)
dummy equal to 1 if she majored in economics.
43
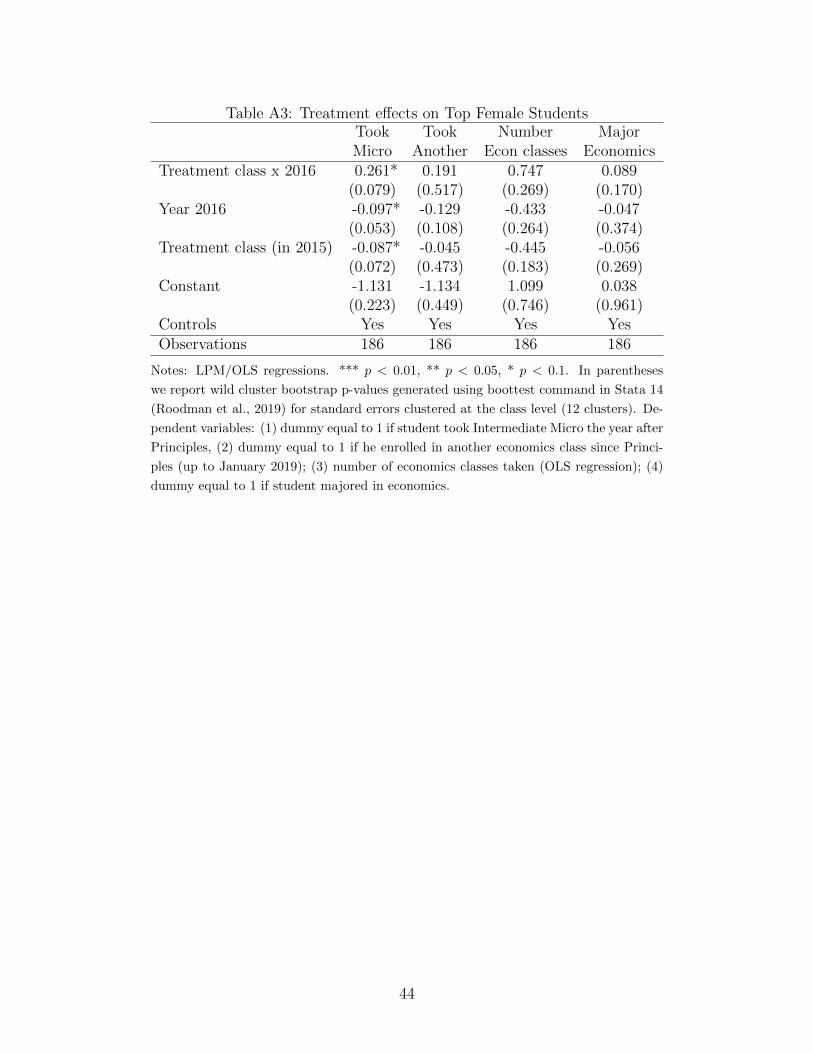
Table A3: Treatment effects on Top Female StudentsTook Took Number MajorMicro Another Econ classes Economics
Treatment class x 2016 0.261* 0.191 0.747 0.089(0.079) (0.517) (0.269) (0.170)
Year 2016 -0.097* -0.129 -0.433 -0.047(0.053) (0.108) (0.264) (0.374)
Treatment class (in 2015) -0.087* -0.045 -0.445 -0.056(0.072) (0.473) (0.183) (0.269)
Constant -1.131 -1.134 1.099 0.038(0.223) (0.449) (0.746) (0.961)
Controls Yes Yes Yes YesObservations 186 186 186 186
Notes: LPM/OLS regressions. *** p < 0.01, ** p < 0.05, * p < 0.1. In parentheses
we report wild cluster bootstrap p-values generated using boottest command in Stata 14
(Roodman et al., 2019) for standard errors clustered at the class level (12 clusters). De-
pendent variables: (1) dummy equal to 1 if student took Intermediate Micro the year after
Principles, (2) dummy equal to 1 if he enrolled in another economics class since Princi-
ples (up to January 2019); (3) number of economics classes taken (OLS regression); (4)
dummy equal to 1 if student majored in economics.
44
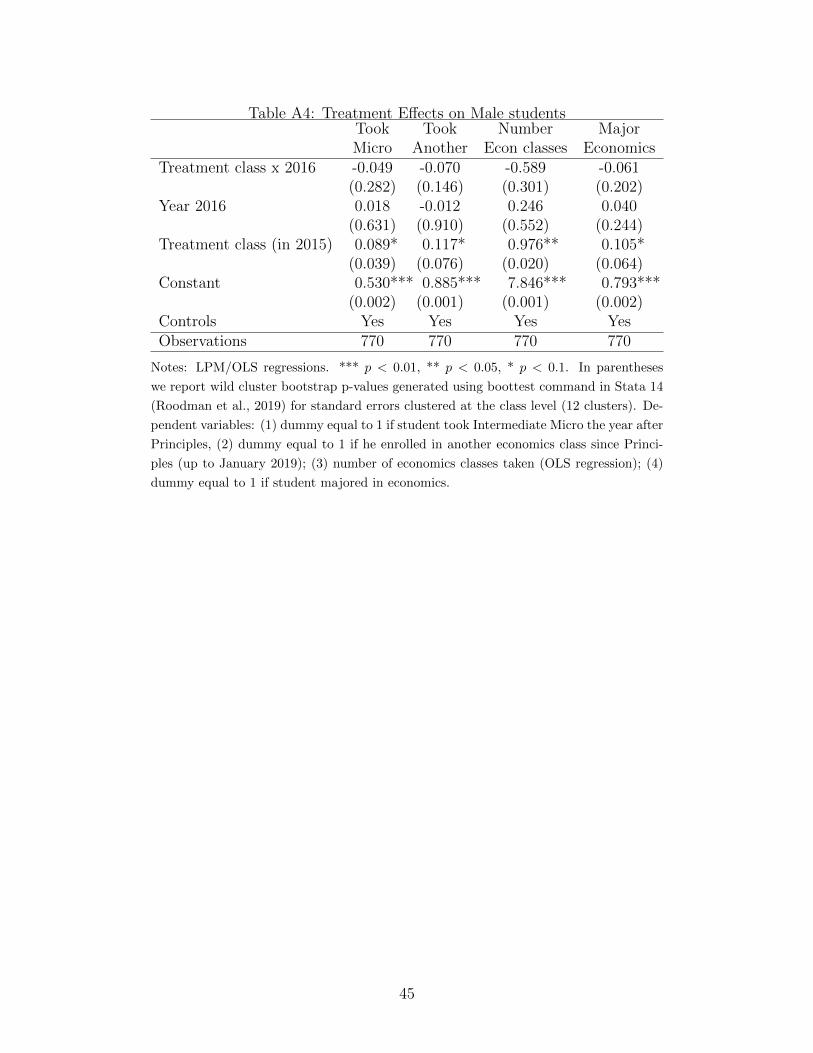
Table A4: Treatment Effects on Male studentsTook Took Number MajorMicro Another Econ classes Economics
Treatment class x 2016 -0.049 -0.070 -0.589 -0.061(0.282) (0.146) (0.301) (0.202)
Year 2016 0.018 -0.012 0.246 0.040(0.631) (0.910) (0.552) (0.244)
Treatment class (in 2015) 0.089* 0.117* 0.976** 0.105*(0.039) (0.076) (0.020) (0.064)
Constant 0.530*** 0.885*** 7.846*** 0.793***(0.002) (0.001) (0.001) (0.002)
Controls Yes Yes Yes YesObservations 770 770 770 770
Notes: LPM/OLS regressions. *** p < 0.01, ** p < 0.05, * p < 0.1. In parentheses
we report wild cluster bootstrap p-values generated using boottest command in Stata 14
(Roodman et al., 2019) for standard errors clustered at the class level (12 clusters). De-
pendent variables: (1) dummy equal to 1 if student took Intermediate Micro the year after
Principles, (2) dummy equal to 1 if he enrolled in another economics class since Princi-
ples (up to January 2019); (3) number of economics classes taken (OLS regression); (4)
dummy equal to 1 if student majored in economics.
45
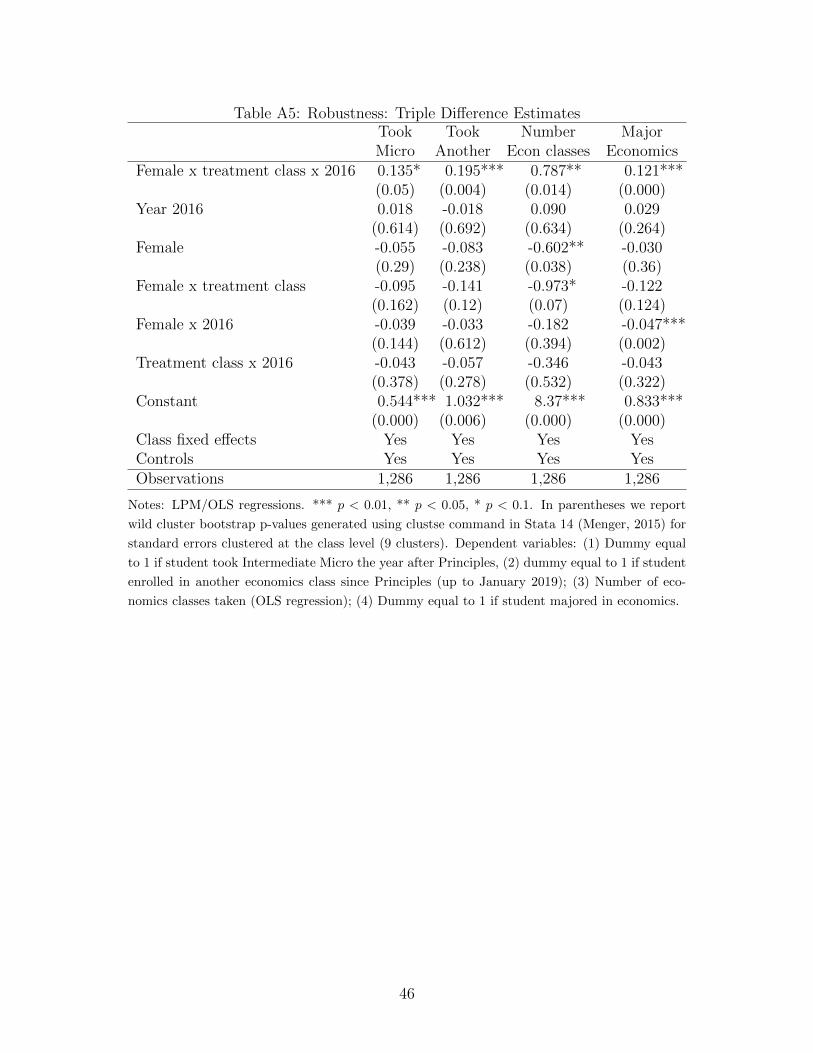
Table A5: Robustness: Triple Difference EstimatesTook Took Number MajorMicro Another Econ classes Economics
Female x treatment class x 2016 0.135* 0.195*** 0.787** 0.121***(0.05) (0.004) (0.014) (0.000)
Year 2016 0.018 -0.018 0.090 0.029(0.614) (0.692) (0.634) (0.264)
Female -0.055 -0.083 -0.602** -0.030(0.29) (0.238) (0.038) (0.36)
Female x treatment class -0.095 -0.141 -0.973* -0.122(0.162) (0.12) (0.07) (0.124)
Female x 2016 -0.039 -0.033 -0.182 -0.047***(0.144) (0.612) (0.394) (0.002)
Treatment class x 2016 -0.043 -0.057 -0.346 -0.043(0.378) (0.278) (0.532) (0.322)
Constant 0.544*** 1.032*** 8.37*** 0.833***(0.000) (0.006) (0.000) (0.000)
Class fixed effects Yes Yes Yes YesControls Yes Yes Yes YesObservations 1,286 1,286 1,286 1,286
Notes: LPM/OLS regressions. *** p < 0.01, ** p < 0.05, * p < 0.1. In parentheses we report
wild cluster bootstrap p-values generated using clustse command in Stata 14 (Menger, 2015) for
standard errors clustered at the class level (9 clusters). Dependent variables: (1) Dummy equal
to 1 if student took Intermediate Micro the year after Principles, (2) dummy equal to 1 if student
enrolled in another economics class since Principles (up to January 2019); (3) Number of eco-
nomics classes taken (OLS regression); (4) Dummy equal to 1 if student majored in economics.
46
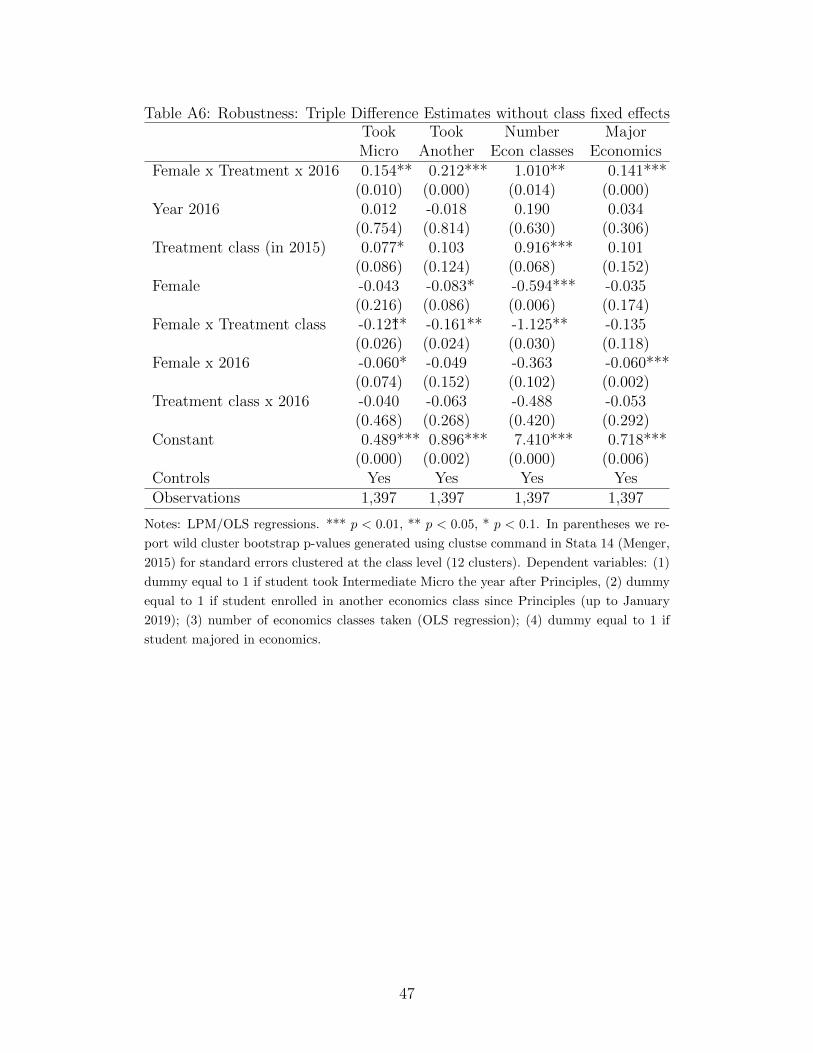
Table A6: Robustness: Triple Difference Estimates without class fixed effectsTook Took Number MajorMicro Another Econ classes Economics
Female x Treatment x 2016 0.154** 0.212*** 1.010** 0.141***(0.010) (0.000) (0.014) (0.000)
Year 2016 0.012 -0.018 0.190 0.034(0.754) (0.814) (0.630) (0.306)
Treatment class (in 2015) 0.077* 0.103 0.916*** 0.101(0.086) (0.124) (0.068) (0.152)
Female -0.043 -0.083* -0.594*** -0.035(0.216) (0.086) (0.006) (0.174)
Female x Treatment class -0.12**1 -0.161** -1.125** -0.135(0.026) (0.024) (0.030) (0.118)
Female x 2016 -0.060* -0.049 -0.363 -0.060***(0.074) (0.152) (0.102) (0.002)
Treatment class x 2016 -0.040 -0.063 -0.488 -0.053(0.468) (0.268) (0.420) (0.292)
Constant 0.489*** 0.896*** 7.410*** 0.718***(0.000) (0.002) (0.000) (0.006)
Controls Yes Yes Yes YesObservations 1,397 1,397 1,397 1,397
Notes: LPM/OLS regressions. *** p < 0.01, ** p < 0.05, * p < 0.1. In parentheses we re-
port wild cluster bootstrap p-values generated using clustse command in Stata 14 (Menger,
2015) for standard errors clustered at the class level (12 clusters). Dependent variables: (1)
dummy equal to 1 if student took Intermediate Micro the year after Principles, (2) dummy
equal to 1 if student enrolled in another economics class since Principles (up to January
2019); (3) number of economics classes taken (OLS regression); (4) dummy equal to 1 if
student majored in economics.
47