Embed Size (px)
Citation preview
www.khda.gov.ae
PISA 2012 School Report
GEMS World Academy

PISA 2012 School Report – GEMS World Academy 2
PISA 2012 School Report – GEMS World Academy 3
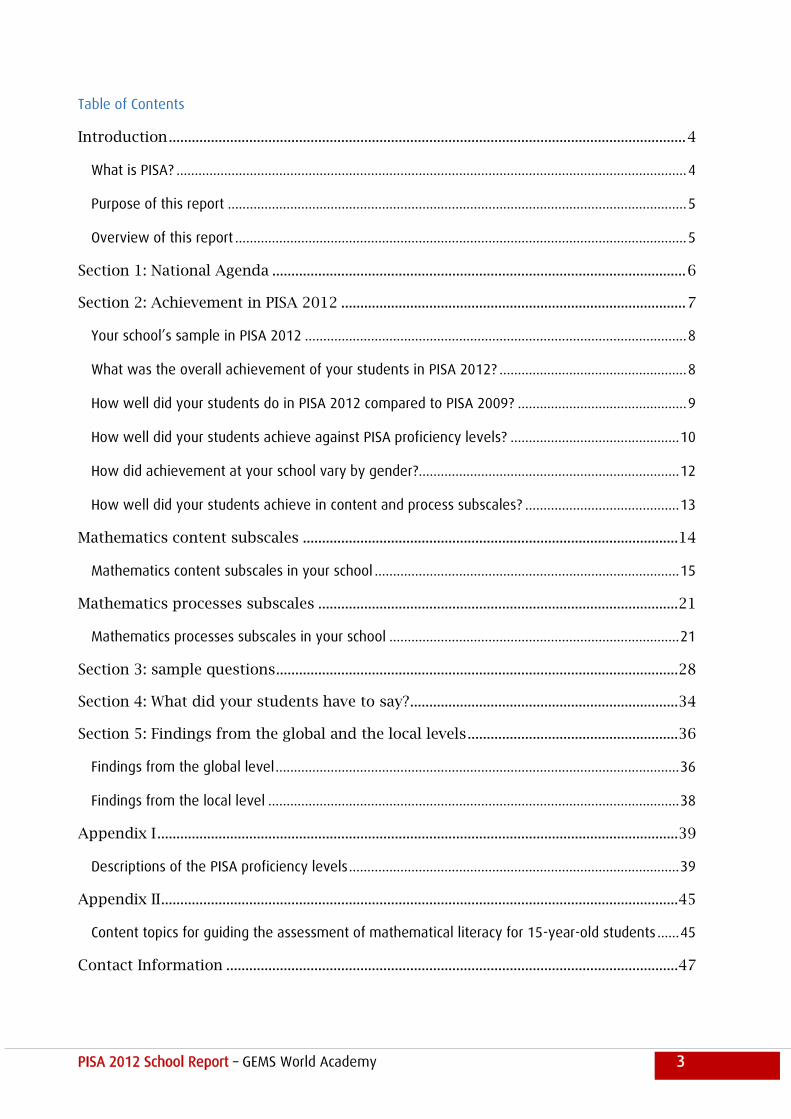
Table of Contents
Introduction ....................................................................................................................................... 4
What is PISA? ........................................................................................................................................... 4
Purpose of this report ............................................................................................................................. 5
Overview of this report ........................................................................................................................... 5
Section 1: National Agenda ............................................................................................................ 6
Section 2: Achievement in PISA 2012 .......................................................................................... 7
Your school’s sample in PISA 2012 ........................................................................................................ 8
What was the overall achievement of your students in PISA 2012? ................................................... 8
How well did your students do in PISA 2012 compared to PISA 2009? .............................................. 9
How well did your students achieve against PISA proficiency levels? .............................................. 10
How did achievement at your school vary by gender?....................................................................... 12
How well did your students achieve in content and process subscales? .......................................... 13
Mathematics content subscales .................................................................................................. 14
Mathematics content subscales in your school ................................................................................... 15
Mathematics processes subscales .............................................................................................. 21
Mathematics processes subscales in your school ............................................................................... 21
Section 3: sample questions ......................................................................................................... 28
Section 4: What did your students have to say?...................................................................... 34
Section 5: Findings from the global and the local levels ....................................................... 36
Findings from the global level .............................................................................................................. 36
Findings from the local level ................................................................................................................ 38
Appendix I ........................................................................................................................................ 39
Descriptions of the PISA proficiency levels .......................................................................................... 39
Appendix II ....................................................................................................................................... 45
Content topics for guiding the assessment of mathematical literacy for 15-year-old students ...... 45
Contact Information ...................................................................................................................... 47
PISA 2012 School Report – GEMS World Academy 4
Introduction
The Knowledge and Human Development Authority (KHDA) follows an integrated approach of
monitoring schools performance that uses an internal benchmarking based on best practices through
school inspections, and external benchmarking through international assessments. This approach
provides school leaders with extensive data that enable them to identify areas of strengths and
improvement affecting their school development and their students’ performance.
In 2012, a number of your students were among 4974 students from Dubai, who participated in the
Programme for International Student Assessment (PISA) along with 510,000 other students from 65
economies. Together, they were representing about 28 million 15-year-olds globally. PISA 2012 is
the second participation for Dubai, which first participated in this international assessments in 2009.
This report provides your school’s individual results in PISA 2012.
What is PISA?
PISA is large-scale assessment carried out every three years by the Organisation of Economic
Cooperation and Development (OECD). It aims to evaluate the quality of student achievement
internationally by testing the skills and knowledge of 15-year-old students in three main areas:
Reading, Mathematics and Science. PISA develops tests which are not directly linked to the school
curriculum. The tests are designed to assess to what extent students at this important phase can
apply their knowledge to real-life situations and be equipped for full participation in society. In
addition, to testing students’ skills, participating students and their principals answer questionnaires
to provide information about the students' backgrounds, school and learning experiences and about
the broader school system and learning environment.
In each cycle of PISA, one domain is the major focus, with a large amount of the assessment time
being devoted to this domain compared to the other two domains. In 2009, Reading was the main
domain, while in 2012 Mathematics was the main domain. PISA 2012 allowed an in-depth analysis
of mathematical literacy and the reporting of results by content and processes subscales.
In PISA, students take a test that lasts 2 hours. The tests are a mixture of open-ended and multiple-
choice questions that are organised in groups based on a passage setting out a real-life situation.
Students take different combinations of different tests.
PISA 2012 School Report – GEMS World Academy 5
Purpose of this report
The purpose of this report is to provide you with a detailed analysis on the performance of your
students in PISA 2012. This report is an important tool for school leaders and subject coordinators to
use in reviewing curriculum, instruction and self-evaluation plans. The different information included
and discussed in this report will help school leaders to identify shortcomings in the academic
performance of their students against international benchmarks. Hence, this report is an important
tool not only to assist school leaders in planning, but in identifying priorities and addressing gaps in
student academic performance. Through school inspections, KHDA will be monitoring how well school
leaders use international assessment reports in their self-evaluation plans, and in improving their
provision to raise students’ attainment.
Overview of this report
The UAE National Agenda, to raise the standards of education and the achievements, in PISA and
TIMSS, of students in Dubai, is at the heart of this report. It describes the performance of your 15 year
old students in PISA 2012 and compares this with the performance of your 15 year olds in 2009. On
the basis of these outcomes, each school has been given targets for PISA 2015 and 2018 so that the
UAE can work towards its aspirations for 2021.
The report provides extensive information on the performance of your students in every domain. It
describes differences between the performances of girls and boys and, where applicable, between
Emirati students and expatriate students. The results of students in your school are compared with
other schools teaching the same curriculum in Dubai, with all schools in Dubai and with the
performance of students in schools in the home country of the curriculum, where this is appropriate.
The report contains an analysis of the school data against the PISA proficiency levels. It tells you what
your 15 year old students could do in 2012 and what they should be able to do in 2015. There are
examples of PISA questions and some background information from the PISA student survey.
PISA 2012 School Report – GEMS World Academy 6
Section 1: National Agenda
At the beginning of 2014, H.H. Sheikh Mohammed Bin Rashid launched the UAE National Agenda,
which includes a set of educational targets that pave the way towards the next phase of educational
development in the UAE. The educational targets cover a wide range of areas affecting the quality of
education and student achievement across the different phases. Two of the major targets are
concerned with the UAE ranking in PISA and TIMSS (Trends in International Mathematics and Science
Study):
The UAE will be among the 20 highest performing countries in PISA in 2021
The UAE will be among the 15 highest performing countries in TIMSS in 2021
The PISA and TIMSS National Agenda targets indicate the high aspirations of the UAE to become a
leading country in education. Although schools in Dubai have improved in the past 6 years, it is time
for school leaders to take this improvement to a higher level. School leaders must aspire to make
their schools high performing educational institutions in Dubai, and also outstanding learning entities
whose students are achieving similar to students in the best educational systems in the world. Only
when school leaders embrace this vision, will Dubai and the UAE be making further improvements in
PISA and TIMSS, and will eventually celebrate in 2021 by being among the highest performing
countries in those two important international assessments.
Your school National Agenda individual targets
In order to work towards achieving PISA targets in the UAE National Agenda, KHDA has set individual
targets for all private schools in Dubai. Using PISA 2012 results, every school has a target for moving
to the next achievement level in PISA. Three targets for all the domains in PISA are described in the
table below according to the different achievement levels in PISA. Although, the individual targets
are high, the detailed information presented in this report should provide school leaders with a full
understanding of their students’ performances in PISA. Therefore, it is important that school leaders
use all the data presented in the different sections of this report to plan for meeting these targets.
PISA 2012 School Report – GEMS World Academy 7
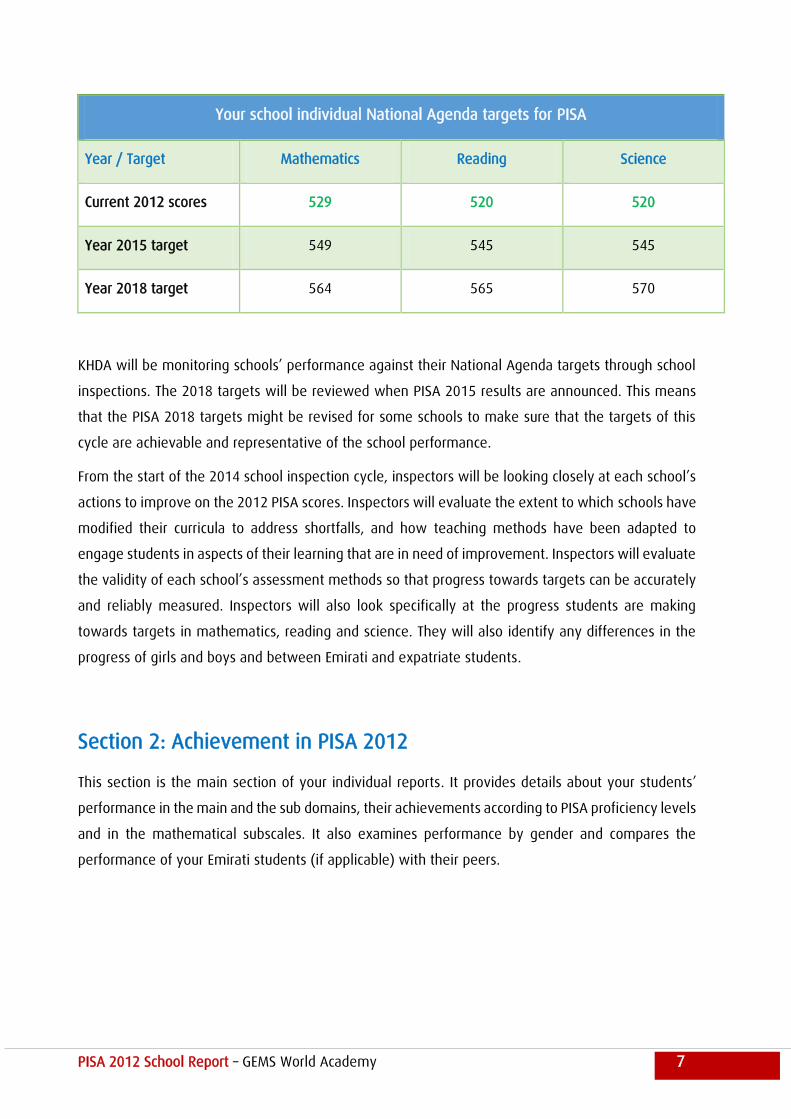
Your school individual National Agenda targets for PISA
Year / Target Mathematics Reading Science
Current 2012 scores 529 520 520
Year 2015 target 549 545 545
Year 2018 target 564 565 570
KHDA will be monitoring schools’ performance against their National Agenda targets through school
inspections. The 2018 targets will be reviewed when PISA 2015 results are announced. This means
that the PISA 2018 targets might be revised for some schools to make sure that the targets of this
cycle are achievable and representative of the school performance.
From the start of the 2014 school inspection cycle, inspectors will be looking closely at each school’s
actions to improve on the 2012 PISA scores. Inspectors will evaluate the extent to which schools have
modified their curricula to address shortfalls, and how teaching methods have been adapted to
engage students in aspects of their learning that are in need of improvement. Inspectors will evaluate
the validity of each school’s assessment methods so that progress towards targets can be accurately
and reliably measured. Inspectors will also look specifically at the progress students are making
towards targets in mathematics, reading and science. They will also identify any differences in the
progress of girls and boys and between Emirati and expatriate students.
Section 2: Achievement in PISA 2012
This section is the main section of your individual reports. It provides details about your students’
performance in the main and the sub domains, their achievements according to PISA proficiency levels
and in the mathematical subscales. It also examines performance by gender and compares the
performance of your Emirati students (if applicable) with their peers.
PISA 2012 School Report – GEMS World Academy 8
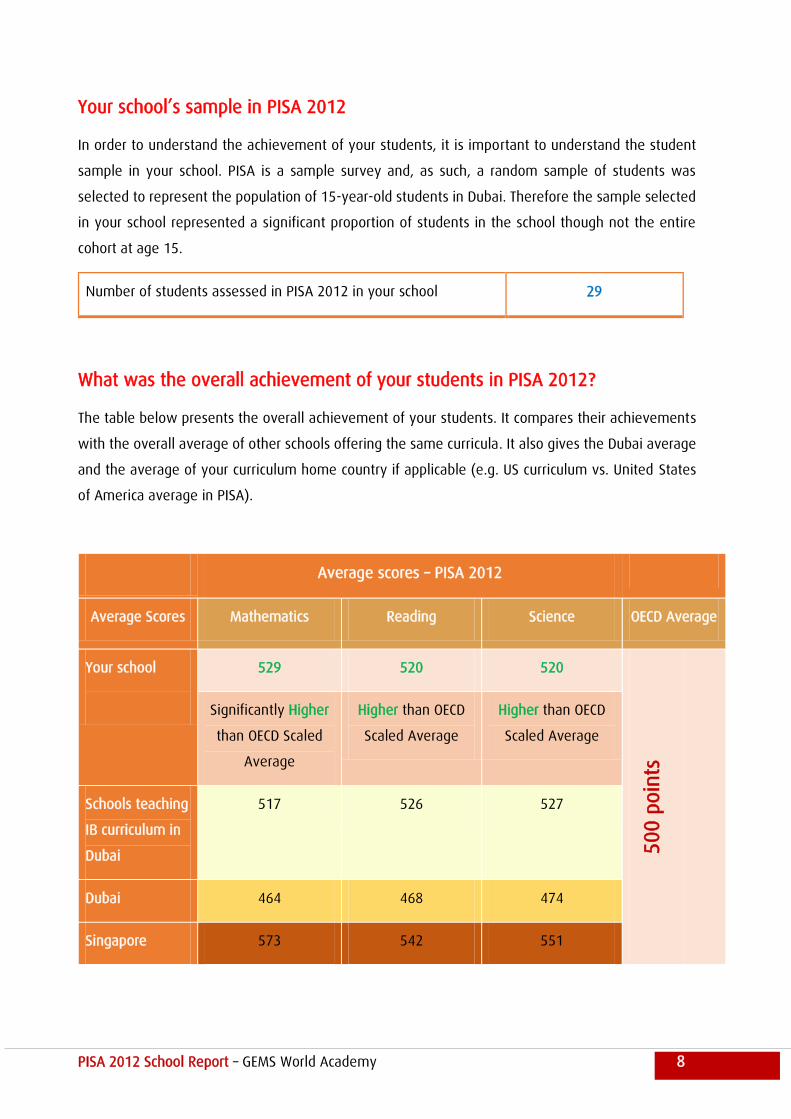
Your school’s sample in PISA 2012
In order to understand the achievement of your students, it is important to understand the student
sample in your school. PISA is a sample survey and, as such, a random sample of students was
selected to represent the population of 15-year-old students in Dubai. Therefore the sample selected
in your school represented a significant proportion of students in the school though not the entire
cohort at age 15.
Number of students assessed in PISA 2012 in your school 29
What was the overall achievement of your students in PISA 2012?
The table below presents the overall achievement of your students. It compares their achievements
with the overall average of other schools offering the same curricula. It also gives the Dubai average
and the average of your curriculum home country if applicable (e.g. US curriculum vs. United States
of America average in PISA).
Average scores – PISA 2012
Average Scores Mathematics Reading Science OECD Average
Your school
529 520 520 500 p
oin
ts
Significantly Higher
than OECD Scaled
Average
Higher than OECD
Scaled Average
Higher than OECD
Scaled Average
Schools teaching
IB curriculum in
Dubai
517 526 527
Dubai 464 468 474
Singapore 573 542 551
PISA 2012 School Report – GEMS World Academy 9
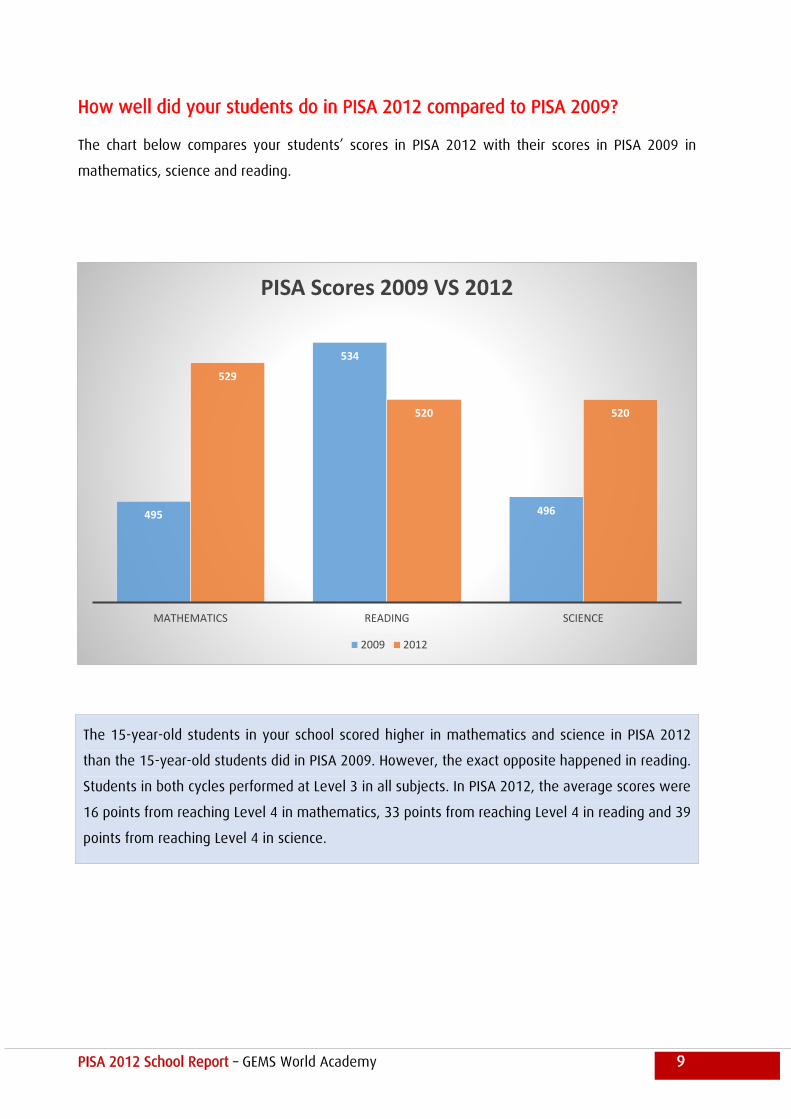
How well did your students do in PISA 2012 compared to PISA 2009?
The chart below compares your students’ scores in PISA 2012 with their scores in PISA 2009 in
mathematics, science and reading.
The 15-year-old students in your school scored higher in mathematics and science in PISA 2012
than the 15-year-old students did in PISA 2009. However, the exact opposite happened in reading.
Students in both cycles performed at Level 3 in all subjects. In PISA 2012, the average scores were
16 points from reaching Level 4 in mathematics, 33 points from reaching Level 4 in reading and 39
points from reaching Level 4 in science.
495
534
496
529
520 520
MATHEMATICS READING SCIENCE
PISA Scores 2009 VS 2012
2009 2012
PISA 2012 School Report – GEMS World Academy 10
How well did your students achieve against PISA proficiency levels?
In addition to measuring average achievement, data from PISA are also described in terms of
proficiency levels that outline the knowledge and skills that are expected of students by age 15. There
are six proficiency levels (Level 1 to Level 6) for mathematics and science in PISA 2012. The reading
domain has seven proficiency levels with the additional level used to describe students who would
have previously been rated as “below Level 1”. The descriptions of the levels of each domain are
included in the Appendix I.
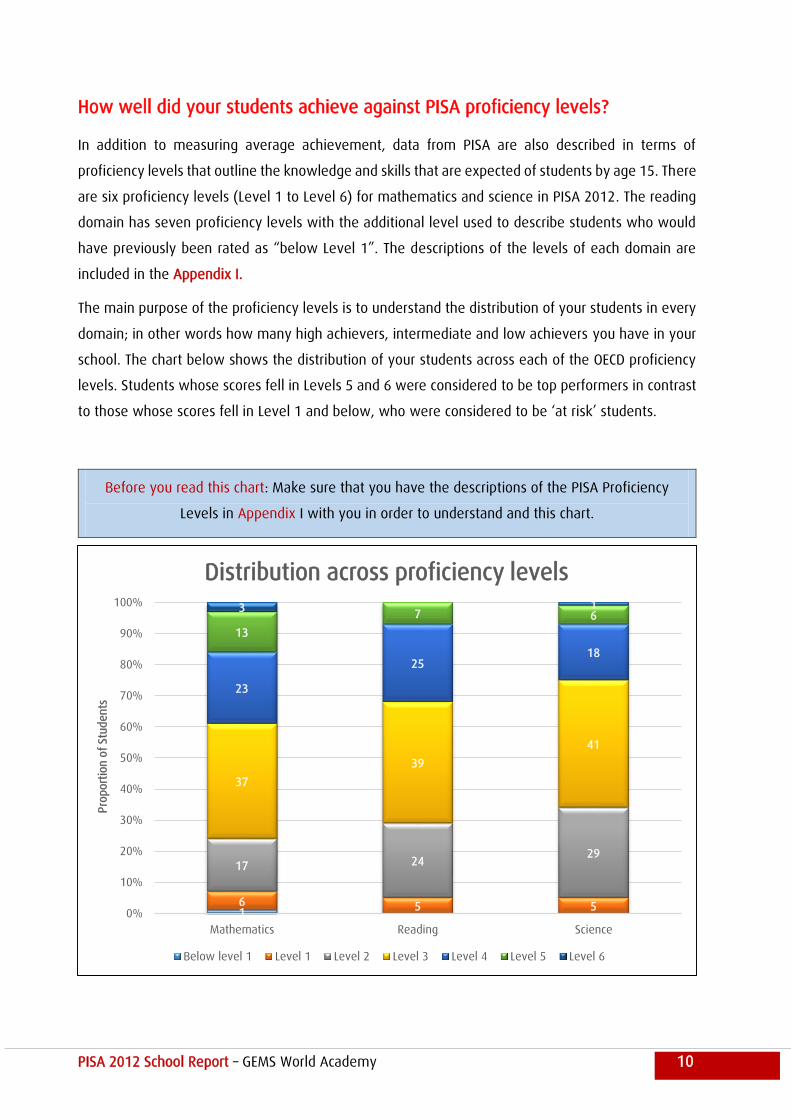
The main purpose of the proficiency levels is to understand the distribution of your students in every
domain; in other words how many high achievers, intermediate and low achievers you have in your
school. The chart below shows the distribution of your students across each of the OECD proficiency
levels. Students whose scores fell in Levels 5 and 6 were considered to be top performers in contrast
to those whose scores fell in Level 1 and below, who were considered to be ‘at risk’ students.
Before you read this chart: Make sure that you have the descriptions of the PISA Proficiency
Levels in Appendix I with you in order to understand and this chart.
16 5 5
17 2429
37
39
41
23
2518
13
7 63 1
0%
10%
20%
30%
40%
50%
60%
70%
80%
90%
100%
Mathematics Reading Science
Pro
port
ion o
f St
udents
Distribution across proficiency levels
Below level 1 Level 1 Level 2 Level 3 Level 4 Level 5 Level 6
PISA 2012 School Report – GEMS World Academy 11
The chart above demonstrates the following:
In mathematics, reading and science, 16%, 7% and 7%, respectively of your students were top
performers.
In mathematics, reading and science, 76%, 71% and 66%, respectively of your students achieved
Level 3 and above
In mathematics, reading and science, 7%, 5% and 5%, respectively of your students were classified
‘at risk’ and therefore the lowest performers.
PISA 2012 School Report – GEMS World Academy 12
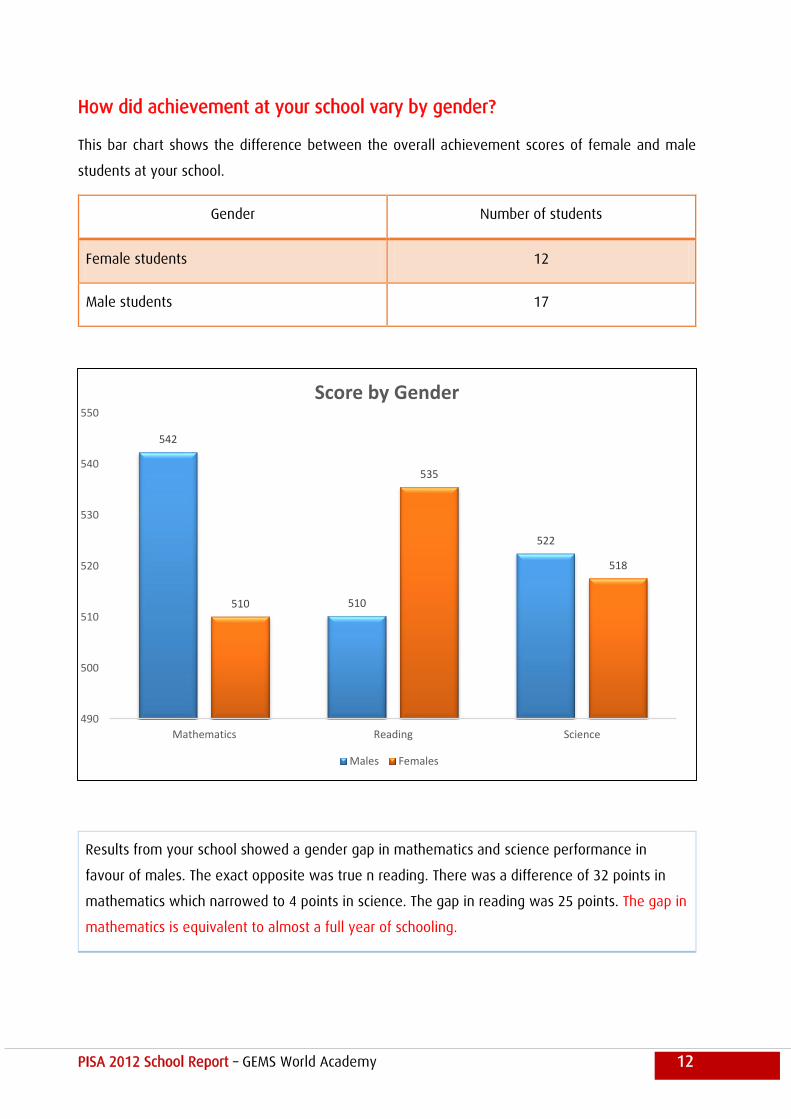
How did achievement at your school vary by gender?
This bar chart shows the difference between the overall achievement scores of female and male
students at your school.
Gender Number of students
Female students 12
Male students 17
Results from your school showed a gender gap in mathematics and science performance in
favour of males. The exact opposite was true n reading. There was a difference of 32 points in
mathematics which narrowed to 4 points in science. The gap in reading was 25 points. The gap in
mathematics is equivalent to almost a full year of schooling.
542
510
522
510
535
518
490
500
510
520
530
540
550
Mathematics Reading Science
Score by Gender
Males Females
PISA 2012 School Report – GEMS World Academy 13
How well did your students achieve in content and processes subscales?
As described in the introduction; in every cycle of PISA one of the three domains (mathematics,
reading and science) becomes the main domain. In addition to the overall achievement results, as
outlined in the first part of this section, PISA framework provides more analysis in the main domain.
In PISA 2012, mathematics is the main domain. Hence, PISA 2012 framework defines mathematics
as mathematical literacy that combines content knowledge with an understanding of processes
required in different areas within mathematics. The PISA 2012 framework emphasises the wide
recognition of the need to identify such a set of general mathematical capabilities, to complement
the role of specific content knowledge in mathematics learning. In this framework, mathematics
proficiency means the capacity of individuals to formulate, employ and interpret mathematics in a
variety of contexts. Individuals are not considered either to possess or lack mathematical literacy.
Instead, mathematical literacy is considered to be a continuum along which individuals develop the
capacity to reason mathematically and use mathematical concepts, procedures, facts and tools to
describe, explain and predict phenomena. Therefore, in addition to evaluating content knowledge
and mathematical processes, PISA collects information on interest in mathematics and its application
in numerous contexts. This section provides you with information on the performance of your students
in the mathematics content and processes subscales.
PISA 2012 School Report – GEMS World Academy 14
Mathematics content subscales
The PISA mathematical literacy assessment framework describes how mathematical content
knowledge is organised into four content categories. These broad categories are based on the
mathematical phenomena that involve different kinds of mathematical thinking and relate to
mathematics curricula in schools. The four content categories are:
Change and relationships: emphasis is on relationships among objects and the mathematical
processes associated with changes in those relationships. An item that involves thinking about the
relationships among the variables speed, distance and time in relation to travel would be an example
of an item classified in this category.
Space and shape: emphasis is on spatial reasoning among objects, and measurement and other
geometric aspects of the spatial world. An example of this item category is spatial reasoning and
working with measurements and area calculations with a model of a real-world object.
Quantity: emphasis is on comparisons and calculations based on quantitative relationships and
numeric properties of objects and phenomena. An example of an item classified in this category
involves reasoning about quantities of given properties of different objects (selecting values that
meet a number of numerical conditions, statements set within a financial context, choosing the
smallest decimal number in a set of numbers in context) and calculations with given quantities.
Uncertainty and data: emphasis is on interpreting and working with data and with different data
presentation forms, and problems involving probabilistic reasoning. A question that involves
interpreting a bar chart is an example of an item that would be classified in this category.
PISA 2012 School Report – GEMS World Academy 15
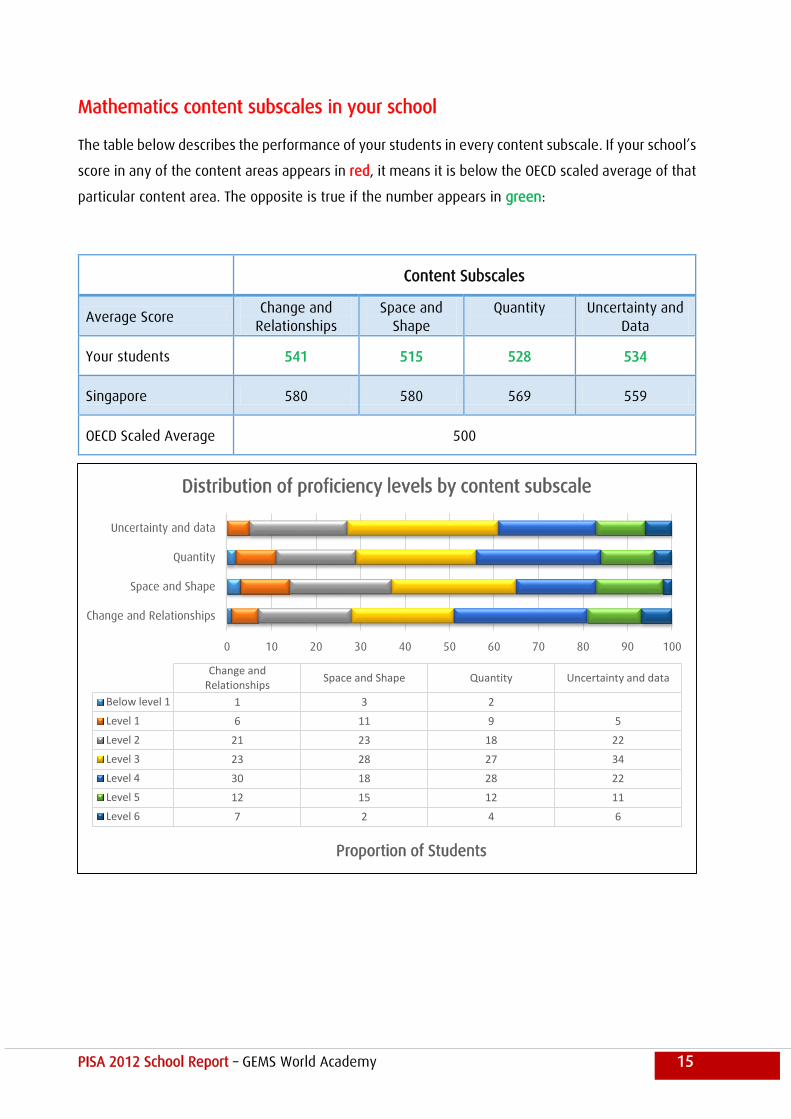
Mathematics content subscales in your school
The table below describes the performance of your students in every content subscale. If your school’s
score in any of the content areas appears in red, it means it is below the OECD scaled average of that
particular content area. The opposite is true if the number appears in green:
Content Subscales
Average Score Change and
Relationships
Space and
Shape
Quantity
Uncertainty and
Data
Your students 541 515 528 534
Singapore 580 580 569 559
OECD Scaled Average 500
0 10 20 30 40 50 60 70 80 90 100
Change and Relationships
Space and Shape
Quantity
Uncertainty and data
Proportion of Students
Change andRelationships
Space and Shape Quantity Uncertainty and data
Below level 1 1 3 2
Level 1 6 11 9 5
Level 2 21 23 18 22
Level 3 23 28 27 34
Level 4 30 18 28 22
Level 5 12 15 12 11
Level 6 7 2 4 6
Distribution of proficiency levels by content subscale
PISA 2012 School Report – GEMS World Academy 16
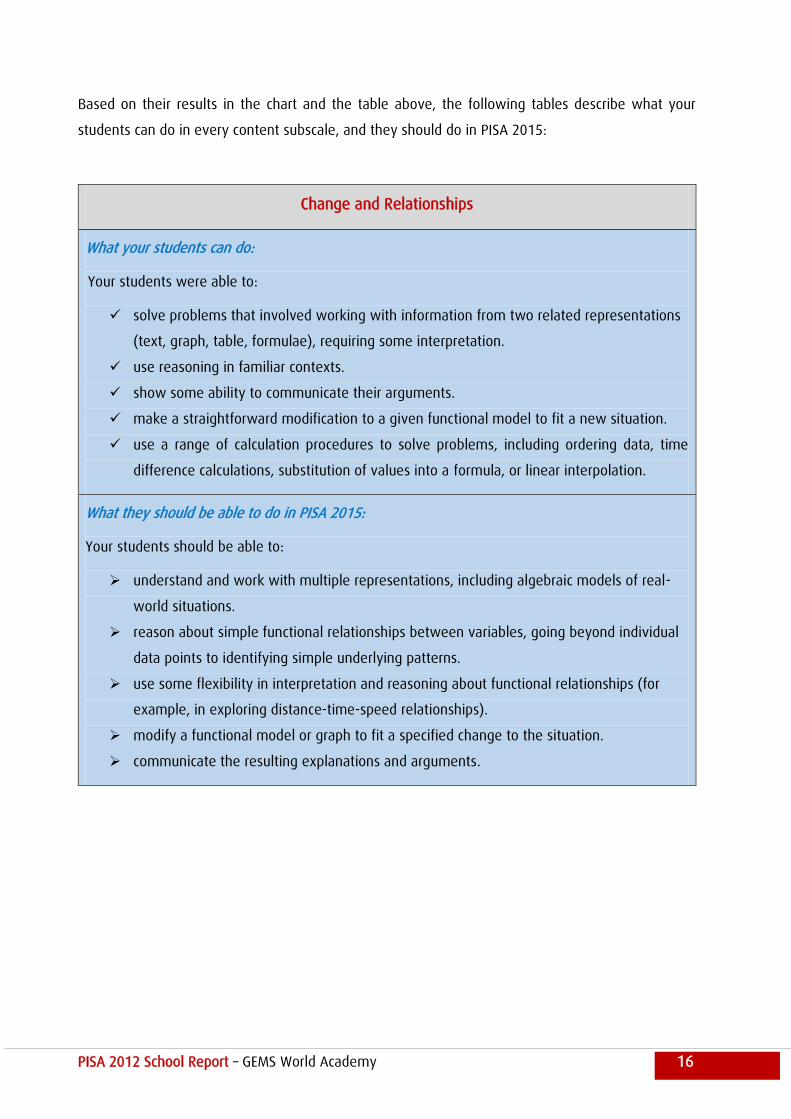
Based on their results in the chart and the table above, the following tables describe what your
students can do in every content subscale, and they should do in PISA 2015:
Change and Relationships
What your students can do:
Your students were able to:
solve problems that involved working with information from two related representations
(text, graph, table, formulae), requiring some interpretation.
use reasoning in familiar contexts.
show some ability to communicate their arguments.
make a straightforward modification to a given functional model to fit a new situation.
use a range of calculation procedures to solve problems, including ordering data, time
difference calculations, substitution of values into a formula, or linear interpolation.
What they should be able to do in PISA 2015:
Your students should be able to:
understand and work with multiple representations, including algebraic models of real-
world situations.
reason about simple functional relationships between variables, going beyond individual
data points to identifying simple underlying patterns.
use some flexibility in interpretation and reasoning about functional relationships (for
example, in exploring distance-time-speed relationships).
modify a functional model or graph to fit a specified change to the situation.
communicate the resulting explanations and arguments.
PISA 2012 School Report – GEMS World Academy 17
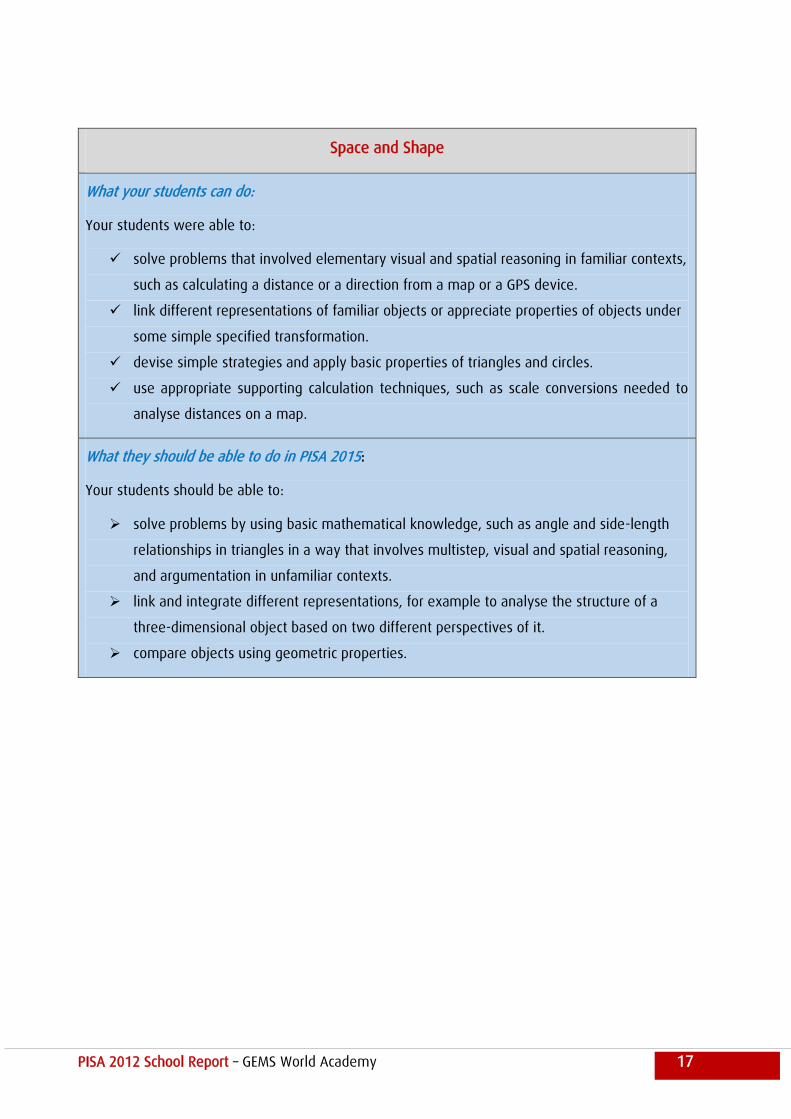
Space and Shape
What your students can do:
Your students were able to:
solve problems that involved elementary visual and spatial reasoning in familiar contexts,
such as calculating a distance or a direction from a map or a GPS device.
link different representations of familiar objects or appreciate properties of objects under
some simple specified transformation.
devise simple strategies and apply basic properties of triangles and circles.
use appropriate supporting calculation techniques, such as scale conversions needed to
analyse distances on a map.
What they should be able to do in PISA 2015:
Your students should be able to:
solve problems by using basic mathematical knowledge, such as angle and side-length
relationships in triangles in a way that involves multistep, visual and spatial reasoning,
and argumentation in unfamiliar contexts.
link and integrate different representations, for example to analyse the structure of a
three-dimensional object based on two different perspectives of it.
compare objects using geometric properties.
PISA 2012 School Report – GEMS World Academy 18
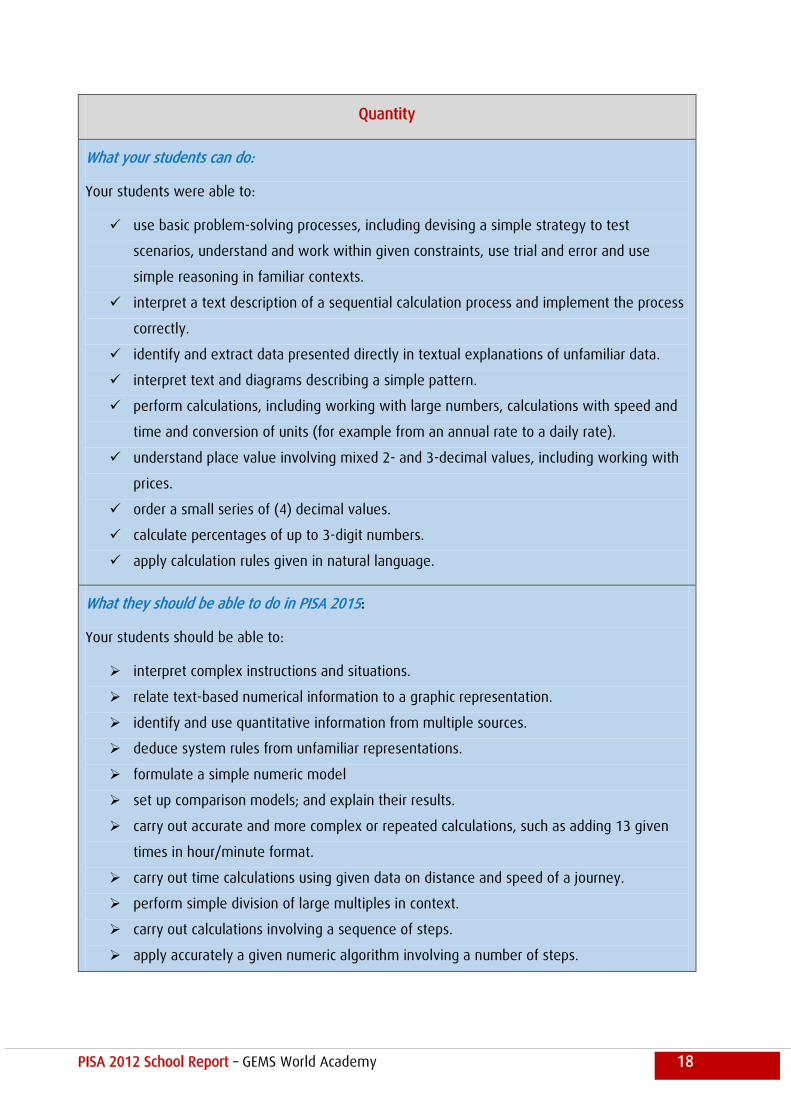
Quantity
What your students can do:
Your students were able to:
use basic problem-solving processes, including devising a simple strategy to test
scenarios, understand and work within given constraints, use trial and error and use
simple reasoning in familiar contexts.
interpret a text description of a sequential calculation process and implement the process
correctly.
identify and extract data presented directly in textual explanations of unfamiliar data.
interpret text and diagrams describing a simple pattern.
perform calculations, including working with large numbers, calculations with speed and
time and conversion of units (for example from an annual rate to a daily rate).
understand place value involving mixed 2- and 3-decimal values, including working with
prices.
order a small series of (4) decimal values.
calculate percentages of up to 3-digit numbers.
apply calculation rules given in natural language.
What they should be able to do in PISA 2015:
Your students should be able to:
interpret complex instructions and situations.
relate text-based numerical information to a graphic representation.
identify and use quantitative information from multiple sources.
deduce system rules from unfamiliar representations.
formulate a simple numeric model
set up comparison models; and explain their results.
carry out accurate and more complex or repeated calculations, such as adding 13 given
times in hour/minute format.
carry out time calculations using given data on distance and speed of a journey.
perform simple division of large multiples in context.
carry out calculations involving a sequence of steps.
apply accurately a given numeric algorithm involving a number of steps.
PISA 2012 School Report – GEMS World Academy 19
perform calculations involving proportional reasoning, divisibility or percentages in simple
models of complex situations.
PISA 2012 School Report – GEMS World Academy 20
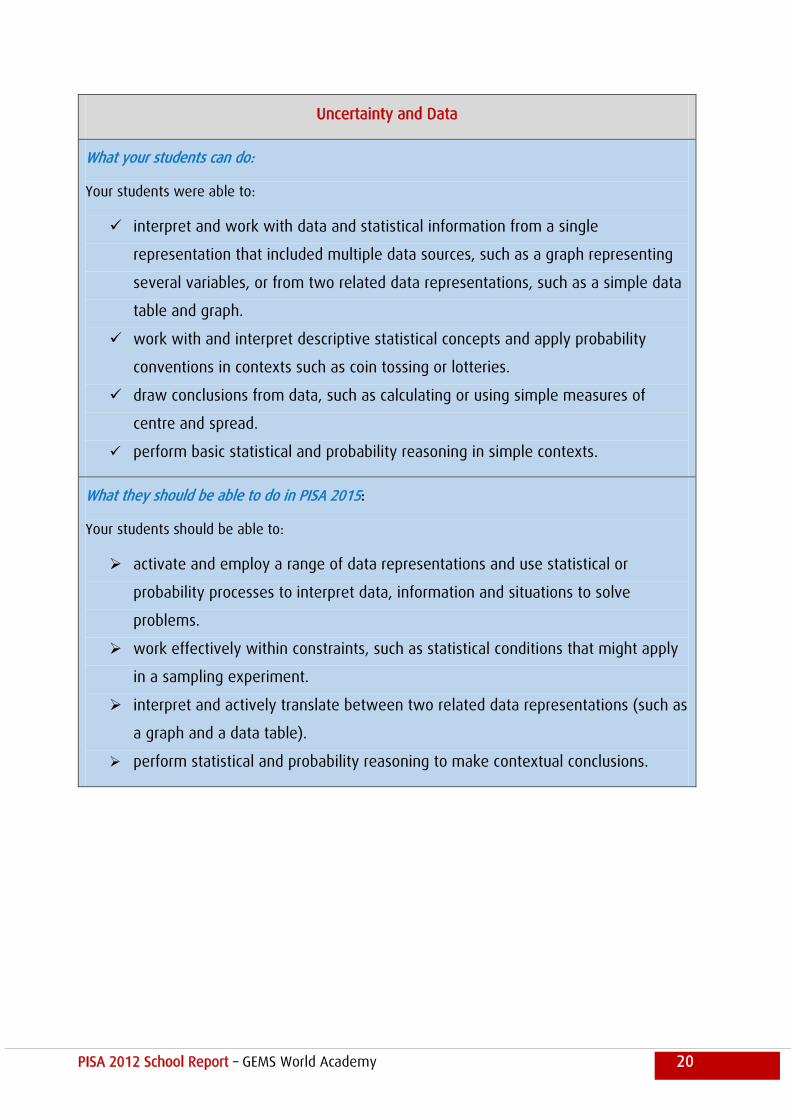
Uncertainty and Data
What your students can do:
Your students were able to:
interpret and work with data and statistical information from a single
representation that included multiple data sources, such as a graph representing
several variables, or from two related data representations, such as a simple data
table and graph.
work with and interpret descriptive statistical concepts and apply probability
conventions in contexts such as coin tossing or lotteries.
draw conclusions from data, such as calculating or using simple measures of
centre and spread.
perform basic statistical and probability reasoning in simple contexts.
What they should be able to do in PISA 2015:
Your students should be able to:
activate and employ a range of data representations and use statistical or
probability processes to interpret data, information and situations to solve
problems.
work effectively within constraints, such as statistical conditions that might apply
in a sampling experiment.
interpret and actively translate between two related data representations (such as
a graph and a data table).
perform statistical and probability reasoning to make contextual conclusions.
PISA 2012 School Report – GEMS World Academy 21
Mathematics processes subscales
Three mathematical processes have been defined in PISA:
Formulating: emphasis is on transforming the problem in context into a mathematical problem. In a
problem about travelling on a bus, the process of a student recognising the elements of speed,
distance and time (and the relationship between these elements as an essential step in solving the
problem) is an example of formulating situations mathematically.
Employing: emphasis is on mathematical reasoning and recognising which mathematical tools will
assist with the mathematical problem. In a problem about travelling on a bus, substituting values
(such as time and distance) into a formula to calculate speed is an example of this mathematical
process.
Interpreting: emphasis is on interpreting the mathematical results of the original problem to obtain
the results in context. In a problem about travelling on a bus, the process of a student evaluating the
results in relation to the original problem is an example of this mathematical process.
Mathematics processes subscales in your school
The definition of mathematical literacy refers to an individual’s capacity to formulate situations
mathematically; employ mathematical concepts, facts, procedures, and reasoning; and interpret,
apply and evaluate mathematical outcomes. The three words, ‘formulate’, ‘employ’ and ‘interpret’,
provide a useful and meaningful structure for organising the mathematical processes that describe
what individuals do to connect the context of a problem with the mathematics and thus solve the
problem. The PISA 2012 mathematics survey, for the first time, reported results according to these
mathematical processes.
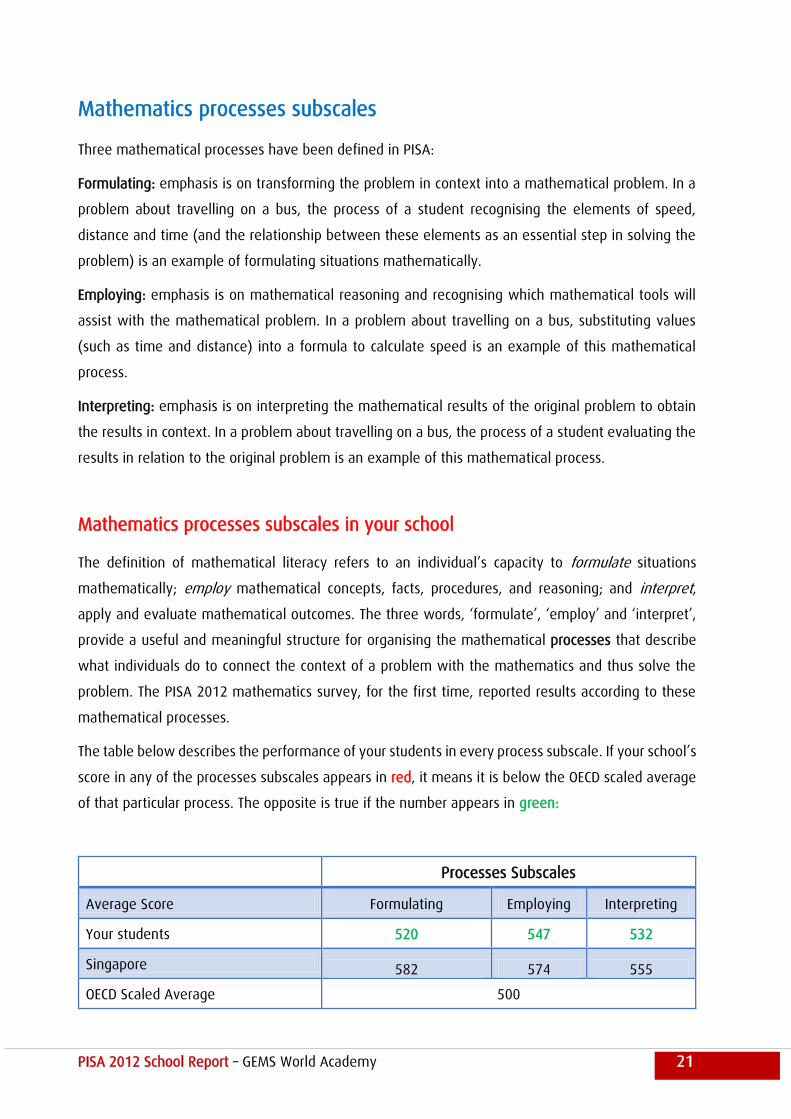
The table below describes the performance of your students in every process subscale. If your school’s
score in any of the processes subscales appears in red, it means it is below the OECD scaled average
of that particular process. The opposite is true if the number appears in green:
Processes Subscales
Average Score Formulating Employing Interpreting
Your students 520 547 532
Singapore 582 574 555
OECD Scaled Average 500
PISA 2012 School Report – GEMS World Academy 22
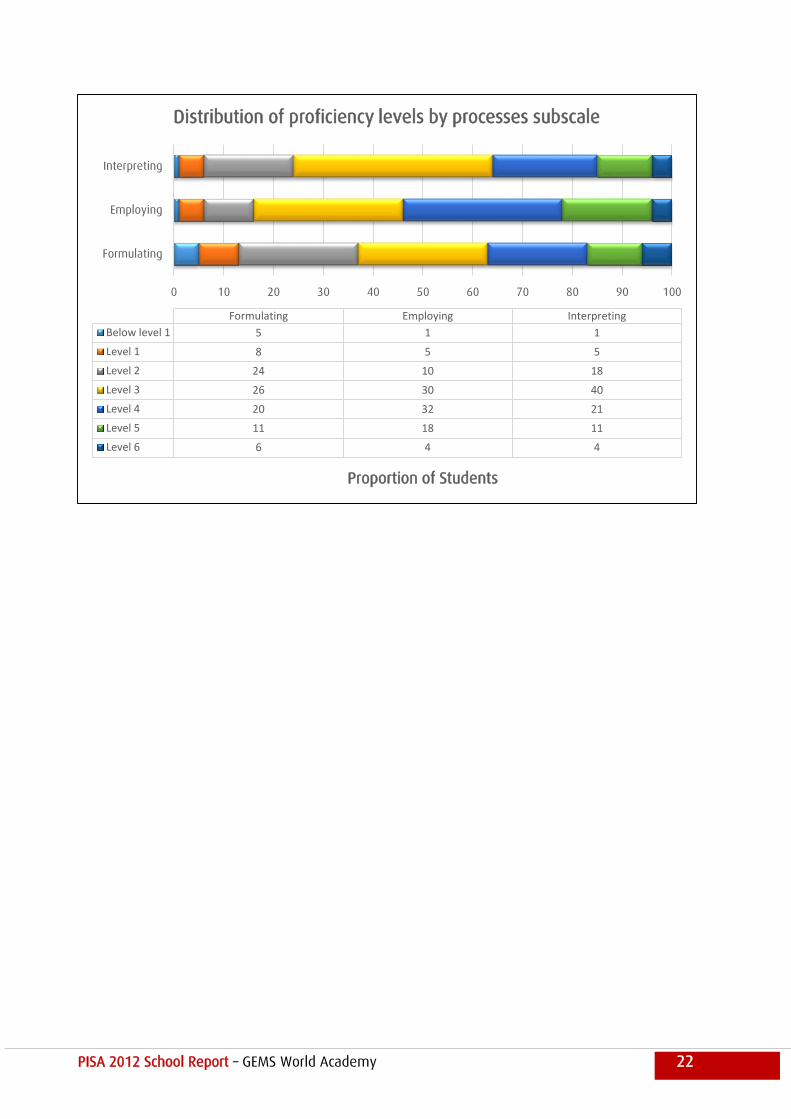
0 10 20 30 40 50 60 70 80 90 100
Formulating
Employing
Interpreting
Proportion of Students
Formulating Employing Interpreting
Below level 1 5 1 1
Level 1 8 5 5
Level 2 24 10 18
Level 3 26 30 40
Level 4 20 32 21
Level 5 11 18 11
Level 6 6 4 4
Distribution of proficiency levels by processes subscale
PISA 2012 School Report – GEMS World Academy 23
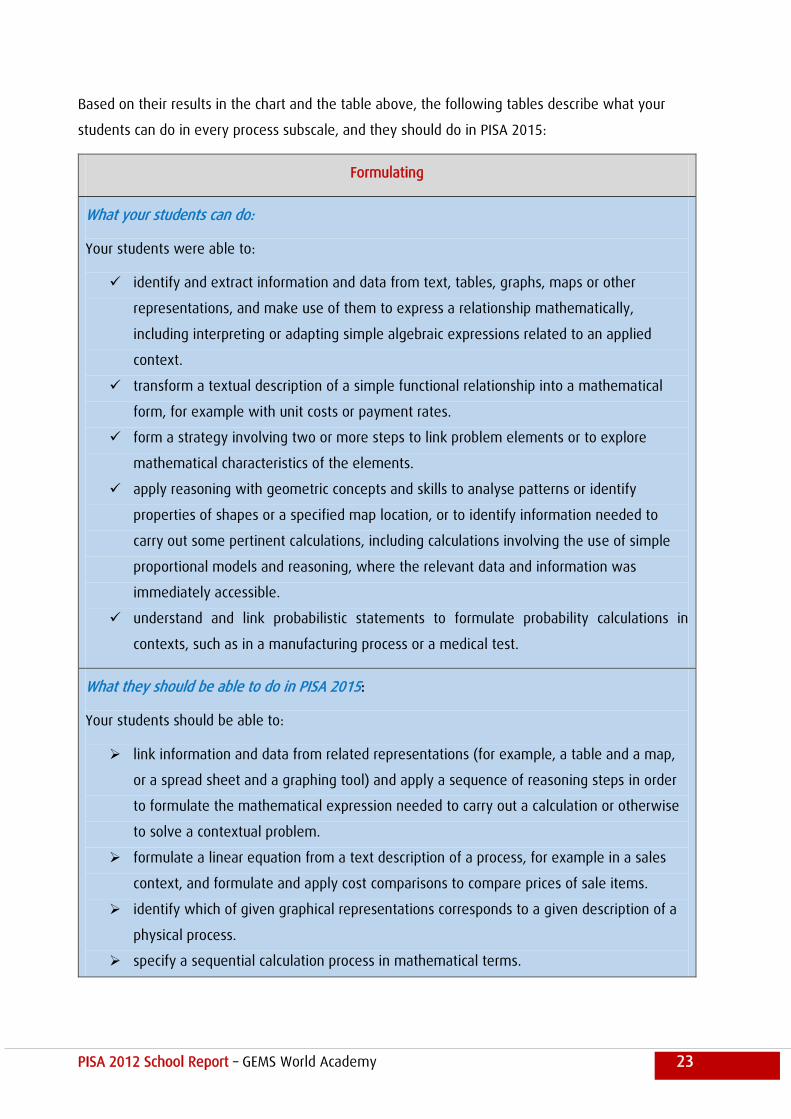
Based on their results in the chart and the table above, the following tables describe what your
students can do in every process subscale, and they should do in PISA 2015:
Formulating
What your students can do:
Your students were able to:
identify and extract information and data from text, tables, graphs, maps or other
representations, and make use of them to express a relationship mathematically,
including interpreting or adapting simple algebraic expressions related to an applied
context.
transform a textual description of a simple functional relationship into a mathematical
form, for example with unit costs or payment rates.
form a strategy involving two or more steps to link problem elements or to explore
mathematical characteristics of the elements.
apply reasoning with geometric concepts and skills to analyse patterns or identify
properties of shapes or a specified map location, or to identify information needed to
carry out some pertinent calculations, including calculations involving the use of simple
proportional models and reasoning, where the relevant data and information was
immediately accessible.
understand and link probabilistic statements to formulate probability calculations in
contexts, such as in a manufacturing process or a medical test.
What they should be able to do in PISA 2015:
Your students should be able to:
link information and data from related representations (for example, a table and a map,
or a spread sheet and a graphing tool) and apply a sequence of reasoning steps in order
to formulate the mathematical expression needed to carry out a calculation or otherwise
to solve a contextual problem.
formulate a linear equation from a text description of a process, for example in a sales
context, and formulate and apply cost comparisons to compare prices of sale items.
identify which of given graphical representations corresponds to a given description of a
physical process.
specify a sequential calculation process in mathematical terms.
PISA 2012 School Report – GEMS World Academy 24
identify geometrical features of a situation and use their geometric knowledge and
reasoning to analyse a problem, for example to estimate areas or to link a contextual
geometric situation involving similarity to the corresponding proportional reasoning.
combine multiple decision rules needed to understand or implement a calculation where
different constraints apply.
formulate algebraic expressions when the contextual information is reasonably straight-
forward, for example to connect distance and speed information in time calculations
PISA 2012 School Report – GEMS World Academy 25
Employing
What your students can do
Your students were able to:
identify relevant data and information from contextual material and use it to perform
such tasks as calculating distances, using proportional reasoning to apply a scale factor,
converting different units to a common scale, or relating different graph scales to each
other.
work flexibly with distance-time-speed relationships, and were able to carry out a
sequence of arithmetic calculations.
use algebraic formulations, and followed a straightforward strategy and described it.
What they should be able to do in PISA 2015:
Your students should be able to:
use a range of knowledge and skills to solve problems.
link information sensibly in graphical and diagrammatic form to textual information.
apply spatial and numeric reasoning skills to express and work with simple models in
reasonably well-defined situations and where the constraints are clear.
work systematically, for example to explore combinatorial outcomes, and to sustain
accuracy in their reasoning across a small number of steps and processes.
work competently with expressions, formulae and use proportional reasoning. They should
be able to work with and transform data presented in a variety of forms.
PISA 2012 School Report – GEMS World Academy 26
Interpreting
What your students can do
Your students were able to:
use reasoning, including spatial reasoning, to support their interpretations of
mathematical information in order to make inferences about features of the context.
combine reasoning steps systematically to make various connections between
mathematical and contextual material or when required to focus on different aspects of a
context. For example where a graph showed two data series or a table contained data on
two variables that must be actively related to each other to support a conclusion.
test and explore alternative scenarios, using reasoning to interpret the possible effects of
changing some of the variables under observation.
use appropriate calculation steps to assist their analysis of data and support the formation
of conclusions and interpretations, including calculations involving proportions and
proportional reasoning, and in situations where systematic analysis across several related
cases was needed.
interpret and analyse relatively unfamiliar data presentations to support their conclusions.
What they should be able to do in PISA 2015:
Your students should to be able to:
apply appropriate reasoning steps, possibly multiple steps, to extract information from a
complex mathematical situation and interpret complicated mathematical objects,
including algebraic expressions.
interpret complex graphical representations to identify data or information that answers a
question.
perform a calculation or data manipulation (for example, in a spread sheet) to generate
additional data needed to decide whether a constraint (such as a measurement condition
or a size comparison) is met.
interpret simple statistical or probabilistic statements in such contexts as public transport,
or health and medical test interpretation, to link the meaning of the statements to the
underlying contextual issues.
conceptualise a change needed to a calculation procedure in response to a changed
constraint.
PISA 2012 School Report – GEMS World Academy 27
analyse two data samples, for example relating to a manufacturing process, to make
comparisons and draw and express conclusions.
PISA 2012 School Report – GEMS World Academy 28
Section 3: sample questions
Below is a sample of two passages similar to the ones your students actually had on the exam. It
covers content areas and processes subscales your students underperformed in. Questions are not
provided in sequential order. Classification is indicated under each question. For a full list of
questions please refer to the separate release document.
CLIMBING MOUNT FUJI
Mount Fuji is a famous dormant volcano in Japan.
Question 1: CLIMBING MOUNT FUJI
Mount Fuji is only open to the public for climbing from 1 July to 27 August each year. About 200 000
people climb Mount Fuji during this time.
On average, about how many people climb Mount Fuji each day?
A 340
B 710
C 3400
D 7100
E 7400
PISA 2012 School Report – GEMS World Academy 29
CLIMBING MOUNT FUJI SCORING 1
Description Identify an average daily rate given a total number and a specific
time period (dates provided)
Mathematical content area Quantity
Context Societal
Process Formulate
Correct Answer C
Question 2: CLIMBING MOUNT FUJI
The Gotemba walking trail up Mount Fuji is about 9 kilometres (km) long.
Walkers need to return from the 18 km walk by 8 pm.
Toshi estimates that he can walk up the mountain at 1.5 kilometres per hour on average, and down
at twice that speed. These speeds take into account meal breaks and rest times.
Using Toshi’s estimated speeds, what is the latest time he can begin his walk so that he can return
by 8 pm?
Translation Note: In this unit please retain metric units throughout.
CLIMBING MOUNT FUJI SCORING 2
Description Calculate the start time for a trip given two different speeds, a total
distance to travel and a finish time
Mathematical content area Change and relationships
Context Societal
Process Formulate
Correct Answer 11 (am) [with or without am, or an equivalent way of writing time,
for example, 11:00]
PISA 2012 School Report – GEMS World Academy 30
Question 3: CLIMBING MOUNT FUJI
Toshi wore a pedometer to count his steps on his walk along the Gotemba trail.
His pedometer showed that he walked 22 500 steps on the way up.
Estimate Toshi’s average step length for his walk up the 9 km Gotemba trail. Give your answer in
centimetres (cm).
Answer: .................................................. cm
CLIMBING MOUNT FUJI SCORING 3
Description Divide a length given in km by a specific number and express the
quotient in cm
Mathematical content area Quantity
Context Societal
Process Employ
Correct Answer 40
PISA 2012 School Report – GEMS World Academy 31
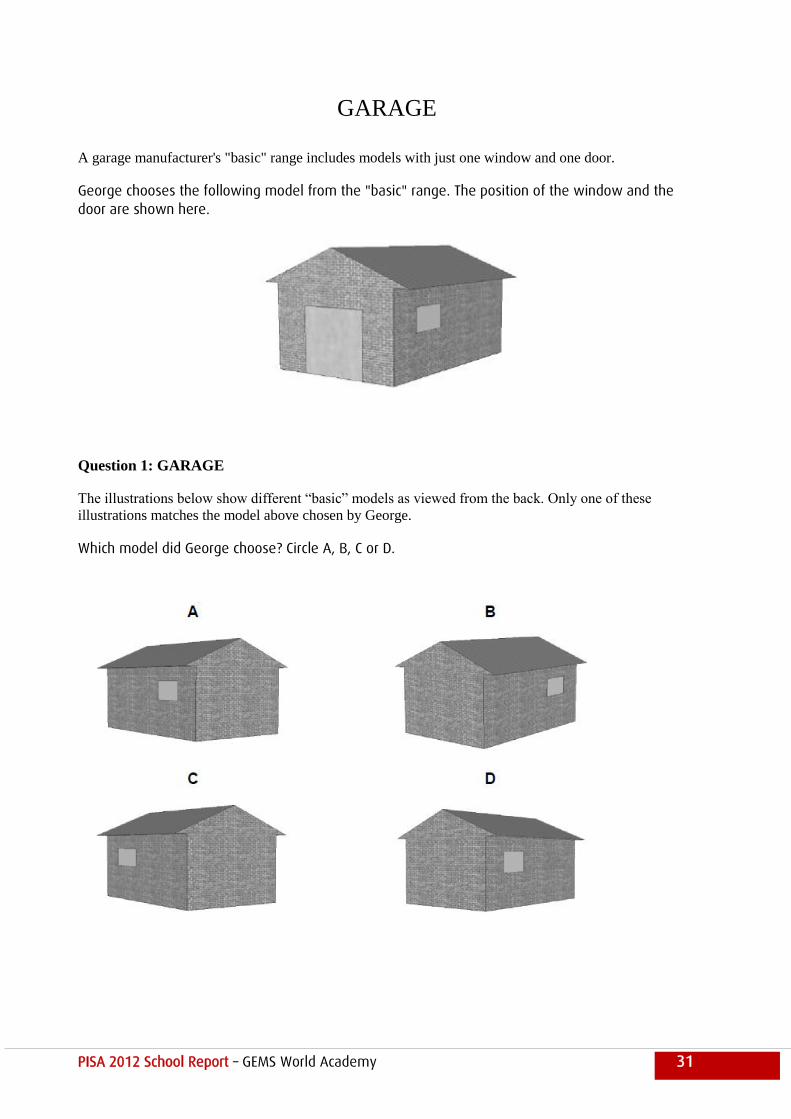
GARAGE
A garage manufacturer's "basic" range includes models with just one window and one door.
George chooses the following model from the "basic" range. The position of the window and the
door are shown here.
Question 1: GARAGE
The illustrations below show different “basic” models as viewed from the back. Only one of these
illustrations matches the model above chosen by George.
Which model did George choose? Circle A, B, C or D.
PISA 2012 School Report – GEMS World Academy 32
GARAGE SCORING 1
Description Use space ability to identify a 3D view corresponding to another
given 3D view
Mathematical content area Space and Shape
Context Occupational
Process Interpret
Correct Answer C
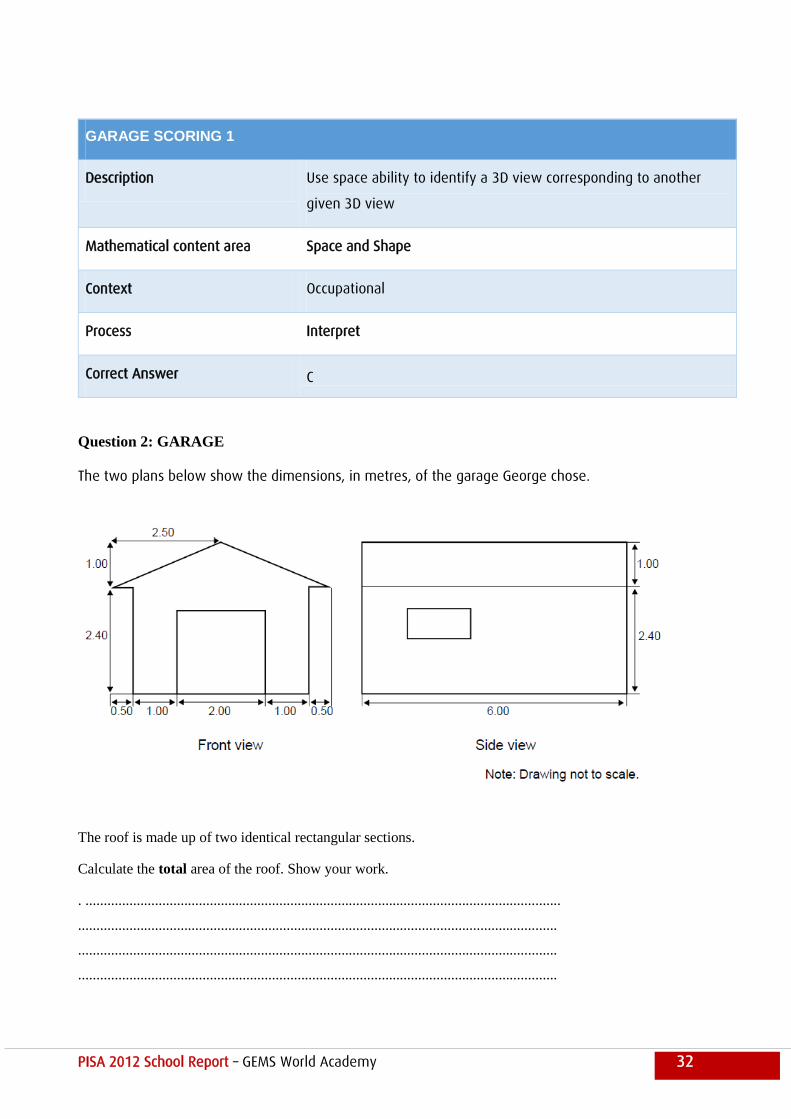
Question 2: GARAGE
The two plans below show the dimensions, in metres, of the garage George chose.
The roof is made up of two identical rectangular sections.
Calculate the total area of the roof. Show your work.
. ..................................................................................................................................
...................................................................................................................................
...................................................................................................................................
...................................................................................................................................
PISA 2012 School Report – GEMS World Academy 33
GARAGE SCORING 2
Description Interpret a plan and calculate the area of a rectangle using the
Pythagorean theorem or measurement
Mathematical content area Space and Shape
Context Occupational
Process Employ
Correct Answer Any value from 31 to 33, either showing no working at all or supported
by working that shows the use of the Pythagorean theorem (or
including elements indicating that this method was used). [Units (m2)
not required]. 12√7.25 m2
12 × 2.69 = 32.28 m2
32.4 m2
PISA 2012 School Report – GEMS World Academy 34
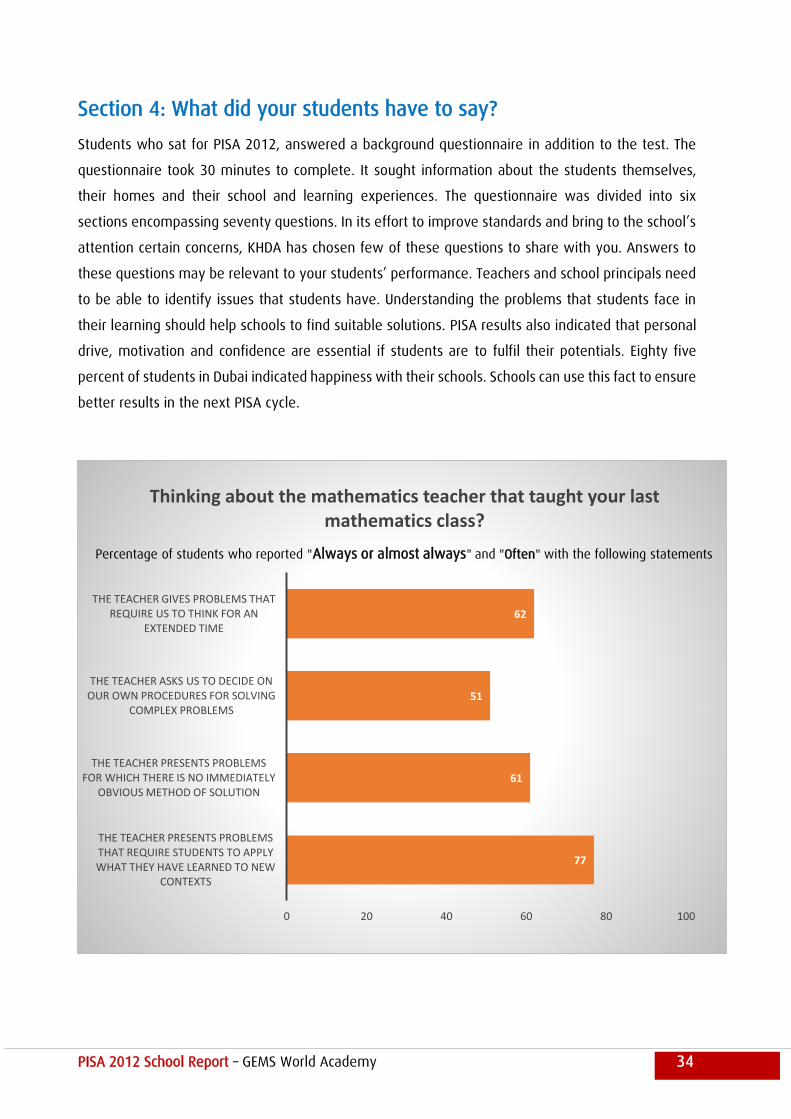
Section 4: What did your students have to say?
Students who sat for PISA 2012, answered a background questionnaire in addition to the test. The
questionnaire took 30 minutes to complete. It sought information about the students themselves,
their homes and their school and learning experiences. The questionnaire was divided into six
sections encompassing seventy questions. In its effort to improve standards and bring to the school’s
attention certain concerns, KHDA has chosen few of these questions to share with you. Answers to
these questions may be relevant to your students’ performance. Teachers and school principals need
to be able to identify issues that students have. Understanding the problems that students face in
their learning should help schools to find suitable solutions. PISA results also indicated that personal
drive, motivation and confidence are essential if students are to fulfil their potentials. Eighty five
percent of students in Dubai indicated happiness with their schools. Schools can use this fact to ensure
better results in the next PISA cycle.
77
61
51
62
0 20 40 60 80 100
THE TEACHER PRESENTS PROBLEMS THAT REQUIRE STUDENTS TO APPLY WHAT THEY HAVE LEARNED TO NEW
CONTEXTS
THE TEACHER PRESENTS PROBLEMS FOR WHICH THERE IS NO IMMEDIATELY
OBVIOUS METHOD OF SOLUTION
THE TEACHER ASKS US TO DECIDE ON OUR OWN PROCEDURES FOR SOLVING
COMPLEX PROBLEMS
THE TEACHER GIVES PROBLEMS THAT REQUIRE US TO THINK FOR AN
EXTENDED TIME
Thinking about the mathematics teacher that taught your last mathematics class?
Percentage of students who reported "Always or almost always" and "Often" with the following statements
PISA 2012 School Report – GEMS World Academy 35
39
57
48
44
21
0 10 20 30 40 50 60
WHEN CONFRONTED WITH A PROBLEM, I DO MORE THAN WHAT IS
EXPECTED OF ME
I CONTINUE WORKING ON TASKS UNTIL EVERYTHING IS PERFECT
I REMAIN INTERESTED IN THE TASKS THAT I START
I PUT OFF DIFFICULT PROBLEMS
WHEN CONFRONTED WITH A PROBLEM, I GIVE UP EASILY
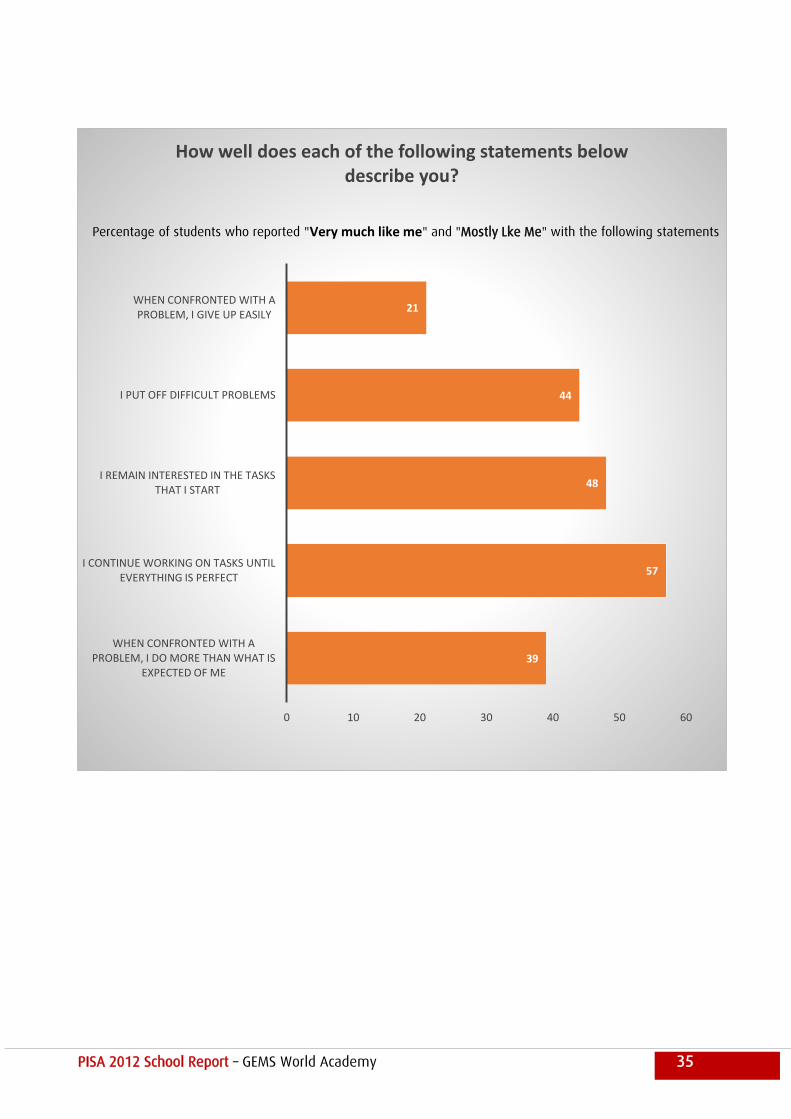
How well does each of the following statements below describe you?
Percentage of students who reported "Very much like me" and "Mostly Lke Me" with the following statements
PISA 2012 School Report – GEMS World Academy 36
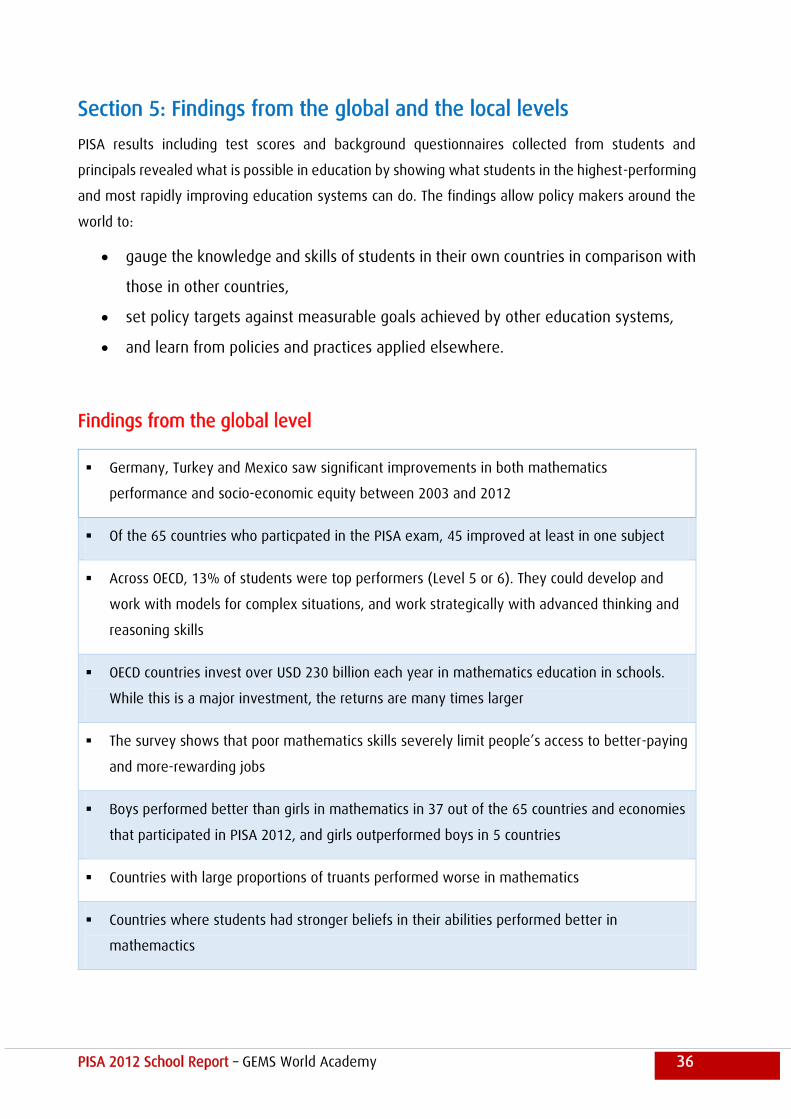
Section 5: Findings from the global and the local levels
PISA results including test scores and background questionnaires collected from students and
principals revealed what is possible in education by showing what students in the highest-performing
and most rapidly improving education systems can do. The findings allow policy makers around the
world to:
gauge the knowledge and skills of students in their own countries in comparison with
those in other countries,
set policy targets against measurable goals achieved by other education systems,
and learn from policies and practices applied elsewhere.
Findings from the global level
Germany, Turkey and Mexico saw significant improvements in both mathematics
performance and socio-economic equity between 2003 and 2012
Of the 65 countries who particpated in the PISA exam, 45 improved at least in one subject
Across OECD, 13% of students were top performers (Level 5 or 6). They could develop and
work with models for complex situations, and work strategically with advanced thinking and
reasoning skills
OECD countries invest over USD 230 billion each year in mathematics education in schools.
While this is a major investment, the returns are many times larger
The survey shows that poor mathematics skills severely limit people’s access to better-paying
and more-rewarding jobs
Boys performed better than girls in mathematics in 37 out of the 65 countries and economies
that participated in PISA 2012, and girls outperformed boys in 5 countries
Countries with large proportions of truants performed worse in mathematics
Countries where students had stronger beliefs in their abilities performed better in
mathemactics
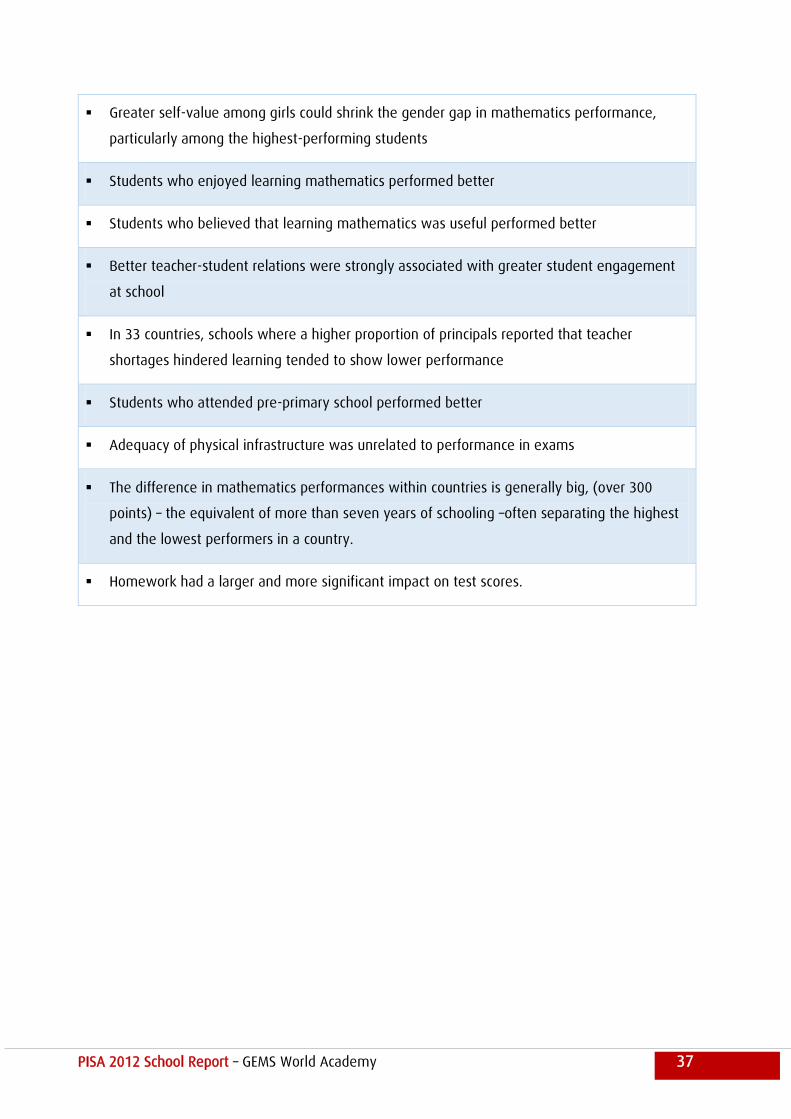
PISA 2012 School Report – GEMS World Academy 37
Greater self-value among girls could shrink the gender gap in mathematics performance,
particularly among the highest-performing students
Students who enjoyed learning mathematics performed better
Students who believed that learning mathematics was useful performed better
Better teacher-student relations were strongly associated with greater student engagement
at school
In 33 countries, schools where a higher proportion of principals reported that teacher
shortages hindered learning tended to show lower performance
Students who attended pre-primary school performed better
Adequacy of physical infrastructure was unrelated to performance in exams
The difference in mathematics performances within countries is generally big, (over 300
points) – the equivalent of more than seven years of schooling –often separating the highest
and the lowest performers in a country.
Homework had a larger and more significant impact on test scores.
PISA 2012 School Report – GEMS World Academy 38
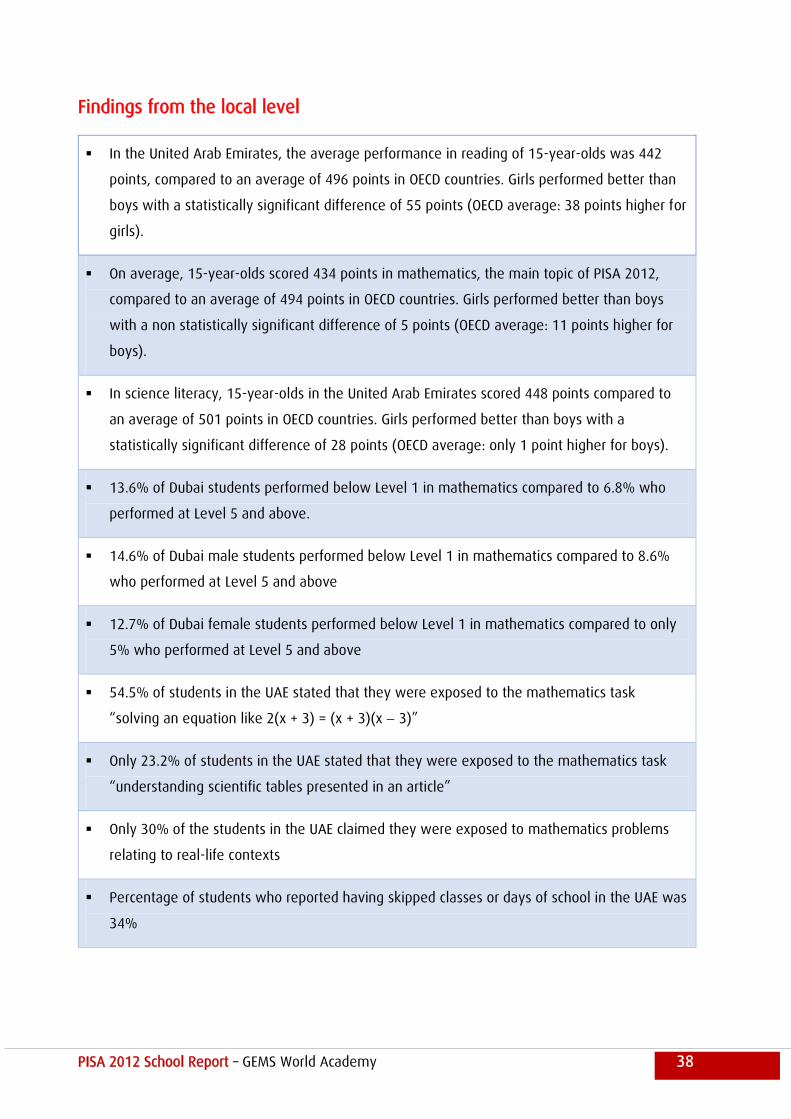
Findings from the local level
In the United Arab Emirates, the average performance in reading of 15-year-olds was 442
points, compared to an average of 496 points in OECD countries. Girls performed better than
boys with a statistically significant difference of 55 points (OECD average: 38 points higher for
girls).
On average, 15-year-olds scored 434 points in mathematics, the main topic of PISA 2012,
compared to an average of 494 points in OECD countries. Girls performed better than boys
with a non statistically significant difference of 5 points (OECD average: 11 points higher for
boys).
In science literacy, 15-year-olds in the United Arab Emirates scored 448 points compared to
an average of 501 points in OECD countries. Girls performed better than boys with a
statistically significant difference of 28 points (OECD average: only 1 point higher for boys).
13.6% of Dubai students performed below Level 1 in mathematics compared to 6.8% who
performed at Level 5 and above.
14.6% of Dubai male students performed below Level 1 in mathematics compared to 8.6%
who performed at Level 5 and above
12.7% of Dubai female students performed below Level 1 in mathematics compared to only
5% who performed at Level 5 and above
54.5% of students in the UAE stated that they were exposed to the mathematics task
“solving an equation like 2(x + 3) = (x + 3)(x 3)”
Only 23.2% of students in the UAE stated that they were exposed to the mathematics task
“understanding scientific tables presented in an article”
Only 30% of the students in the UAE claimed they were exposed to mathematics problems
relating to real-life contexts
Percentage of students who reported having skipped classes or days of school in the UAE was
34%
PISA 2012 School Report – GEMS World Academy 39
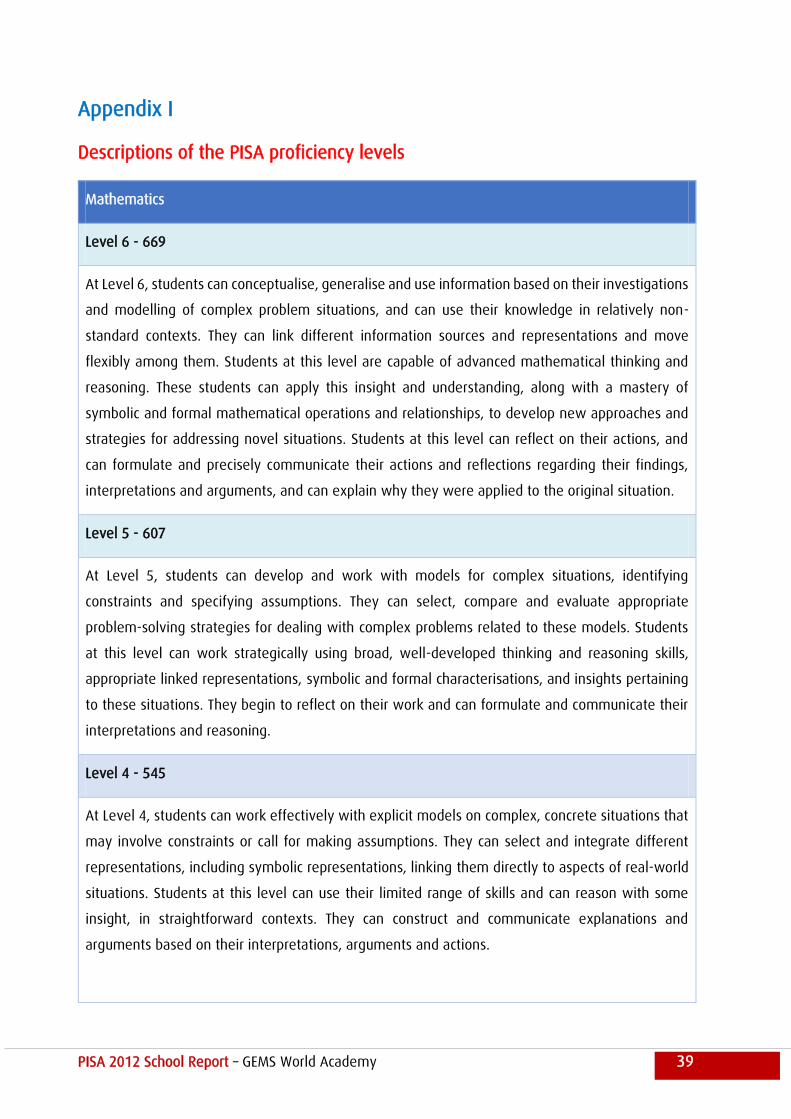
Appendix I
Descriptions of the PISA proficiency levels
Mathematics
Level 6 - 669
At Level 6, students can conceptualise, generalise and use information based on their investigations
and modelling of complex problem situations, and can use their knowledge in relatively non-
standard contexts. They can link different information sources and representations and move
flexibly among them. Students at this level are capable of advanced mathematical thinking and
reasoning. These students can apply this insight and understanding, along with a mastery of
symbolic and formal mathematical operations and relationships, to develop new approaches and
strategies for addressing novel situations. Students at this level can reflect on their actions, and
can formulate and precisely communicate their actions and reflections regarding their findings,
interpretations and arguments, and can explain why they were applied to the original situation.
Level 5 - 607
At Level 5, students can develop and work with models for complex situations, identifying
constraints and specifying assumptions. They can select, compare and evaluate appropriate
problem-solving strategies for dealing with complex problems related to these models. Students
at this level can work strategically using broad, well-developed thinking and reasoning skills,
appropriate linked representations, symbolic and formal characterisations, and insights pertaining
to these situations. They begin to reflect on their work and can formulate and communicate their
interpretations and reasoning.
Level 4 - 545
At Level 4, students can work effectively with explicit models on complex, concrete situations that
may involve constraints or call for making assumptions. They can select and integrate different
representations, including symbolic representations, linking them directly to aspects of real-world
situations. Students at this level can use their limited range of skills and can reason with some
insight, in straightforward contexts. They can construct and communicate explanations and
arguments based on their interpretations, arguments and actions.
PISA 2012 School Report – GEMS World Academy 40
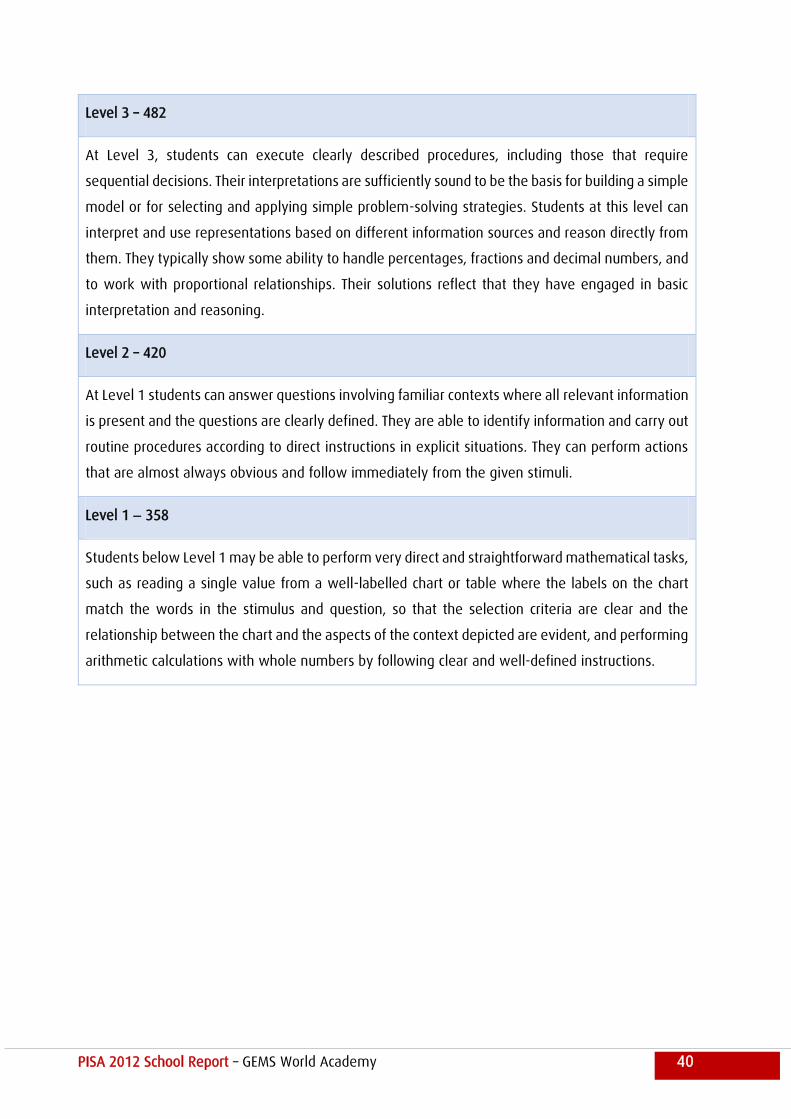
Level 3 – 482
At Level 3, students can execute clearly described procedures, including those that require
sequential decisions. Their interpretations are sufficiently sound to be the basis for building a simple
model or for selecting and applying simple problem-solving strategies. Students at this level can
interpret and use representations based on different information sources and reason directly from
them. They typically show some ability to handle percentages, fractions and decimal numbers, and
to work with proportional relationships. Their solutions reflect that they have engaged in basic
interpretation and reasoning.
Level 2 – 420
At Level 1 students can answer questions involving familiar contexts where all relevant information
is present and the questions are clearly defined. They are able to identify information and carry out
routine procedures according to direct instructions in explicit situations. They can perform actions
that are almost always obvious and follow immediately from the given stimuli.
Level 1 358
Students below Level 1 may be able to perform very direct and straightforward mathematical tasks,
such as reading a single value from a well-labelled chart or table where the labels on the chart
match the words in the stimulus and question, so that the selection criteria are clear and the
relationship between the chart and the aspects of the context depicted are evident, and performing
arithmetic calculations with whole numbers by following clear and well-defined instructions.
PISA 2012 School Report – GEMS World Academy 41
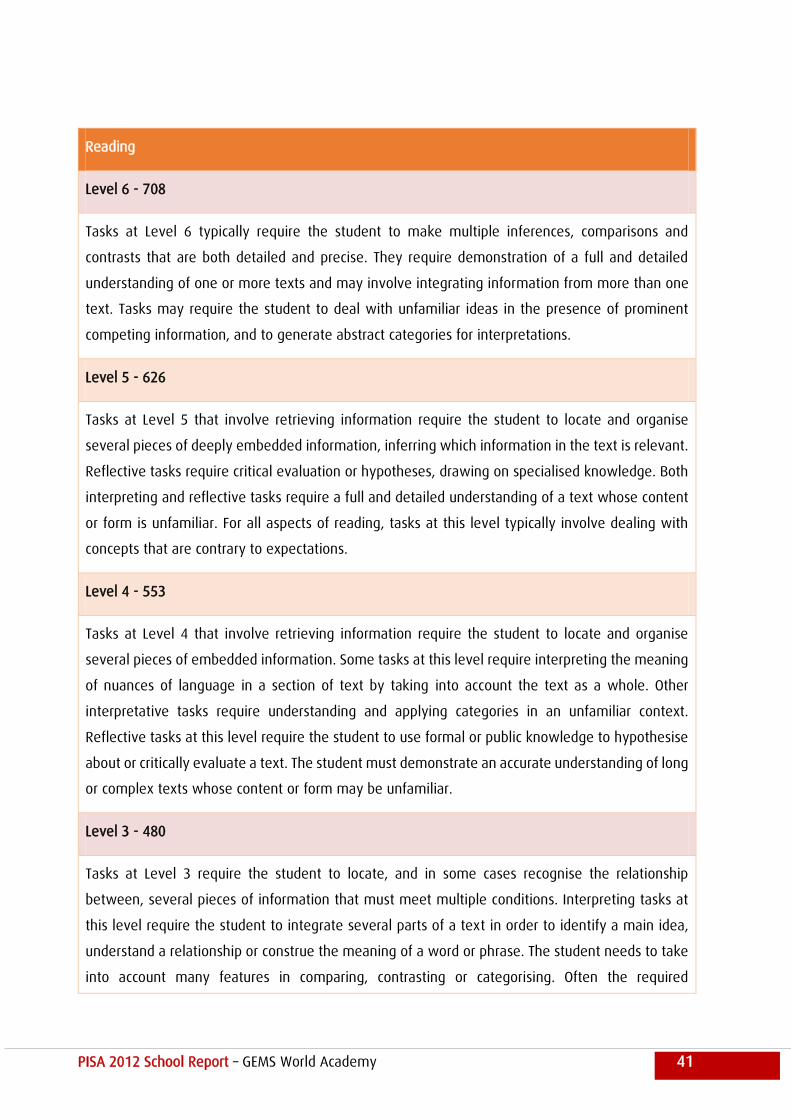
Reading
Level 6 - 708
Tasks at Level 6 typically require the student to make multiple inferences, comparisons and
contrasts that are both detailed and precise. They require demonstration of a full and detailed
understanding of one or more texts and may involve integrating information from more than one
text. Tasks may require the student to deal with unfamiliar ideas in the presence of prominent
competing information, and to generate abstract categories for interpretations.
Level 5 - 626
Tasks at Level 5 that involve retrieving information require the student to locate and organise
several pieces of deeply embedded information, inferring which information in the text is relevant.
Reflective tasks require critical evaluation or hypotheses, drawing on specialised knowledge. Both
interpreting and reflective tasks require a full and detailed understanding of a text whose content
or form is unfamiliar. For all aspects of reading, tasks at this level typically involve dealing with
concepts that are contrary to expectations.
Level 4 - 553
Tasks at Level 4 that involve retrieving information require the student to locate and organise
several pieces of embedded information. Some tasks at this level require interpreting the meaning
of nuances of language in a section of text by taking into account the text as a whole. Other
interpretative tasks require understanding and applying categories in an unfamiliar context.
Reflective tasks at this level require the student to use formal or public knowledge to hypothesise
about or critically evaluate a text. The student must demonstrate an accurate understanding of long
or complex texts whose content or form may be unfamiliar.
Level 3 - 480
Tasks at Level 3 require the student to locate, and in some cases recognise the relationship
between, several pieces of information that must meet multiple conditions. Interpreting tasks at
this level require the student to integrate several parts of a text in order to identify a main idea,
understand a relationship or construe the meaning of a word or phrase. The student needs to take
into account many features in comparing, contrasting or categorising. Often the required
PISA 2012 School Report – GEMS World Academy 42
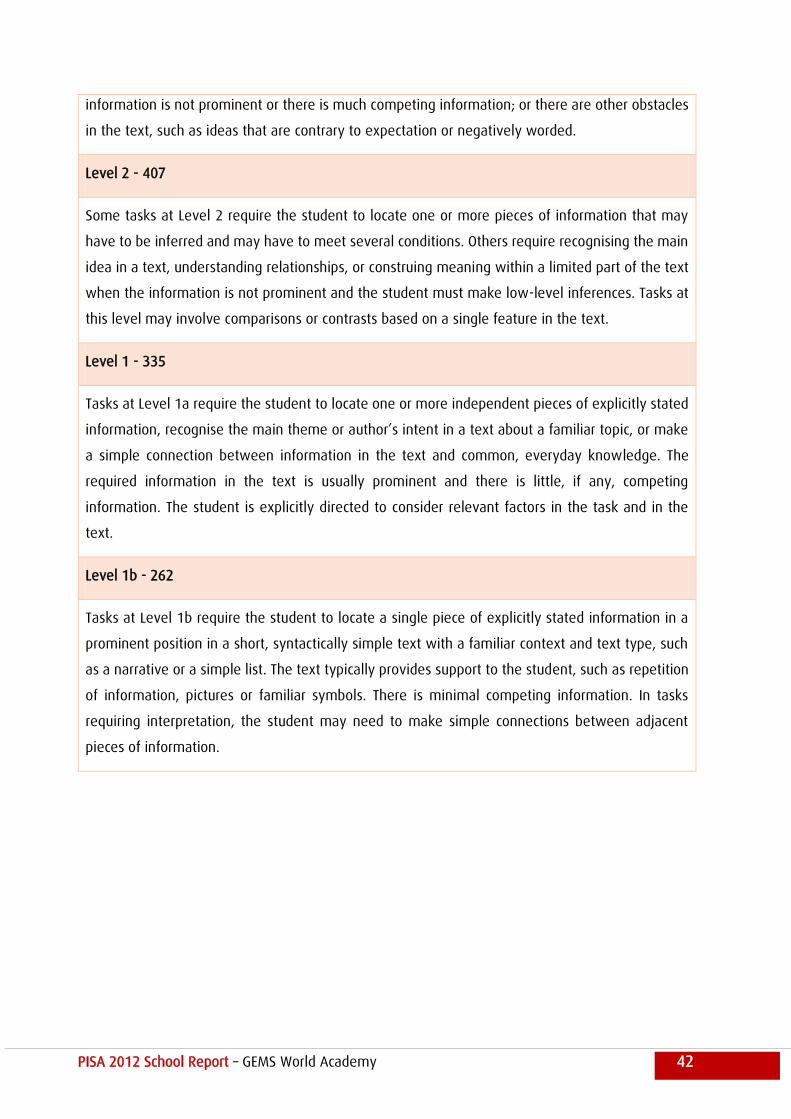
information is not prominent or there is much competing information; or there are other obstacles
in the text, such as ideas that are contrary to expectation or negatively worded.
Level 2 - 407
Some tasks at Level 2 require the student to locate one or more pieces of information that may
have to be inferred and may have to meet several conditions. Others require recognising the main
idea in a text, understanding relationships, or construing meaning within a limited part of the text
when the information is not prominent and the student must make low-level inferences. Tasks at
this level may involve comparisons or contrasts based on a single feature in the text.
Level 1 - 335
Tasks at Level 1a require the student to locate one or more independent pieces of explicitly stated
information, recognise the main theme or author’s intent in a text about a familiar topic, or make
a simple connection between information in the text and common, everyday knowledge. The
required information in the text is usually prominent and there is little, if any, competing
information. The student is explicitly directed to consider relevant factors in the task and in the
text.
Level 1b - 262
Tasks at Level 1b require the student to locate a single piece of explicitly stated information in a
prominent position in a short, syntactically simple text with a familiar context and text type, such
as a narrative or a simple list. The text typically provides support to the student, such as repetition
of information, pictures or familiar symbols. There is minimal competing information. In tasks
requiring interpretation, the student may need to make simple connections between adjacent
pieces of information.
PISA 2012 School Report – GEMS World Academy 43
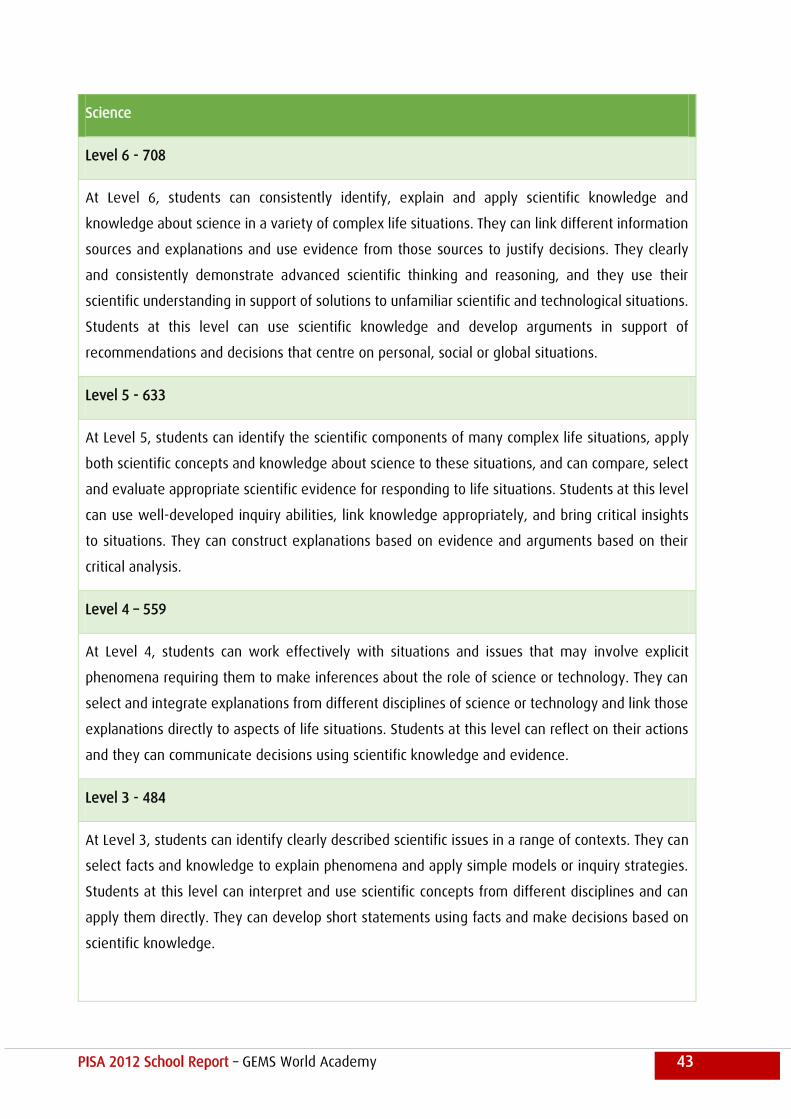
Science
Level 6 - 708
At Level 6, students can consistently identify, explain and apply scientific knowledge and
knowledge about science in a variety of complex life situations. They can link different information
sources and explanations and use evidence from those sources to justify decisions. They clearly
and consistently demonstrate advanced scientific thinking and reasoning, and they use their
scientific understanding in support of solutions to unfamiliar scientific and technological situations.
Students at this level can use scientific knowledge and develop arguments in support of
recommendations and decisions that centre on personal, social or global situations.
Level 5 - 633
At Level 5, students can identify the scientific components of many complex life situations, apply
both scientific concepts and knowledge about science to these situations, and can compare, select
and evaluate appropriate scientific evidence for responding to life situations. Students at this level
can use well-developed inquiry abilities, link knowledge appropriately, and bring critical insights
to situations. They can construct explanations based on evidence and arguments based on their
critical analysis.
Level 4 – 559
At Level 4, students can work effectively with situations and issues that may involve explicit
phenomena requiring them to make inferences about the role of science or technology. They can
select and integrate explanations from different disciplines of science or technology and link those
explanations directly to aspects of life situations. Students at this level can reflect on their actions
and they can communicate decisions using scientific knowledge and evidence.
Level 3 - 484
At Level 3, students can identify clearly described scientific issues in a range of contexts. They can
select facts and knowledge to explain phenomena and apply simple models or inquiry strategies.
Students at this level can interpret and use scientific concepts from different disciplines and can
apply them directly. They can develop short statements using facts and make decisions based on
scientific knowledge.
PISA 2012 School Report – GEMS World Academy 44
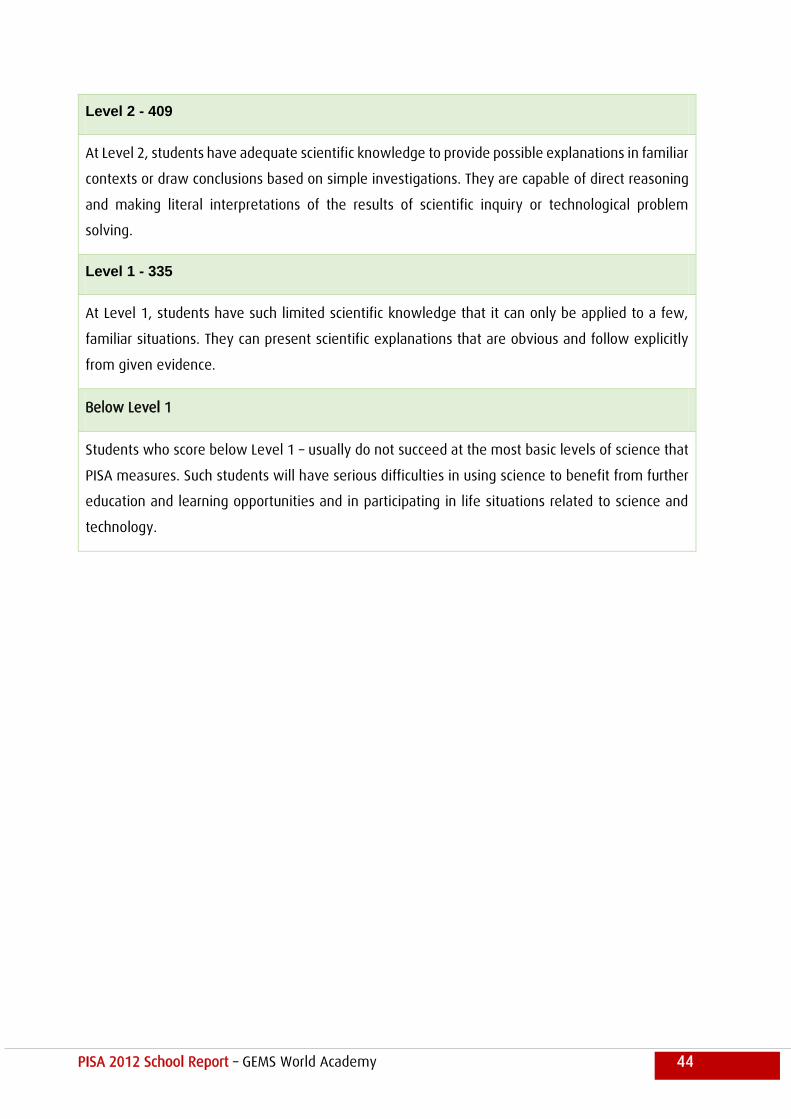
Level 2 - 409
At Level 2, students have adequate scientific knowledge to provide possible explanations in familiar
contexts or draw conclusions based on simple investigations. They are capable of direct reasoning
and making literal interpretations of the results of scientific inquiry or technological problem
solving.
Level 1 - 335
At Level 1, students have such limited scientific knowledge that it can only be applied to a few,
familiar situations. They can present scientific explanations that are obvious and follow explicitly
from given evidence.
Below Level 1
Students who score below Level 1 – usually do not succeed at the most basic levels of science that
PISA measures. Such students will have serious difficulties in using science to benefit from further
education and learning opportunities and in participating in life situations related to science and
technology.
PISA 2012 School Report – GEMS World Academy 45
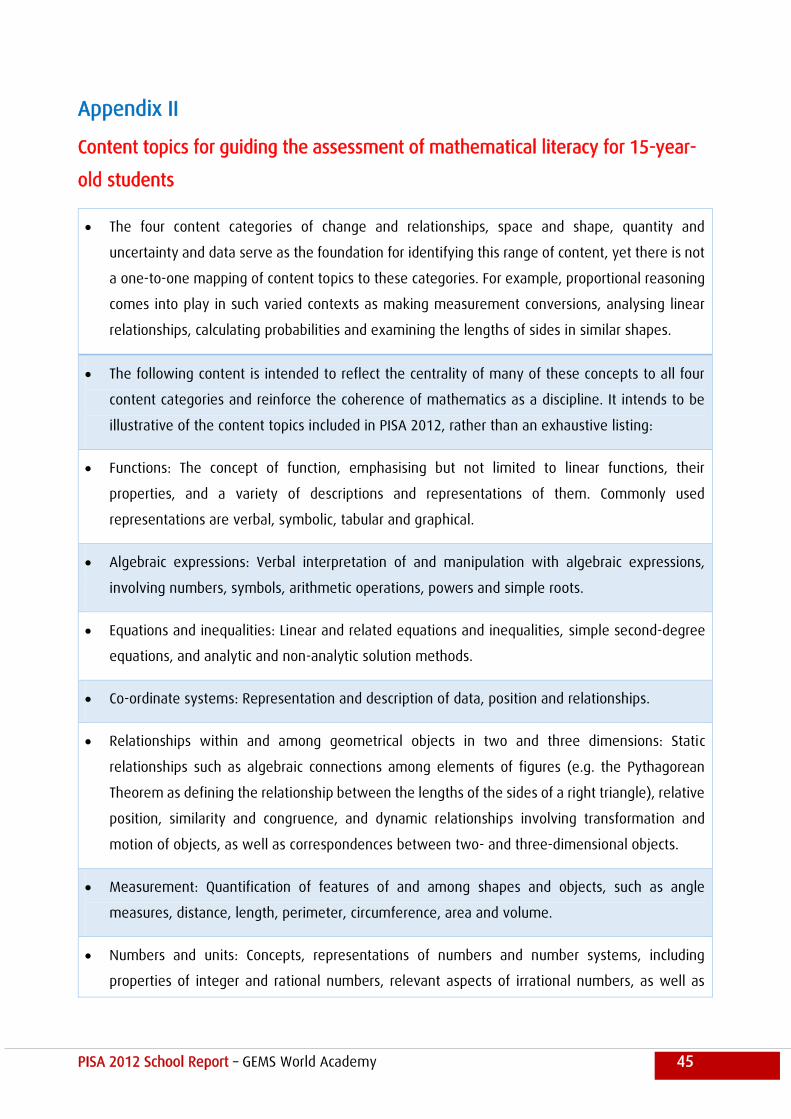
Appendix II
Content topics for guiding the assessment of mathematical literacy for 15-year-
old students
The four content categories of change and relationships, space and shape, quantity and
uncertainty and data serve as the foundation for identifying this range of content, yet there is not
a one-to-one mapping of content topics to these categories. For example, proportional reasoning
comes into play in such varied contexts as making measurement conversions, analysing linear
relationships, calculating probabilities and examining the lengths of sides in similar shapes.
The following content is intended to reflect the centrality of many of these concepts to all four
content categories and reinforce the coherence of mathematics as a discipline. It intends to be
illustrative of the content topics included in PISA 2012, rather than an exhaustive listing:
Functions: The concept of function, emphasising but not limited to linear functions, their
properties, and a variety of descriptions and representations of them. Commonly used
representations are verbal, symbolic, tabular and graphical.
Algebraic expressions: Verbal interpretation of and manipulation with algebraic expressions,
involving numbers, symbols, arithmetic operations, powers and simple roots.
Equations and inequalities: Linear and related equations and inequalities, simple second-degree
equations, and analytic and non-analytic solution methods.
Co-ordinate systems: Representation and description of data, position and relationships.
Relationships within and among geometrical objects in two and three dimensions: Static
relationships such as algebraic connections among elements of figures (e.g. the Pythagorean
Theorem as defining the relationship between the lengths of the sides of a right triangle), relative
position, similarity and congruence, and dynamic relationships involving transformation and
motion of objects, as well as correspondences between two- and three-dimensional objects.
Measurement: Quantification of features of and among shapes and objects, such as angle
measures, distance, length, perimeter, circumference, area and volume.
Numbers and units: Concepts, representations of numbers and number systems, including
properties of integer and rational numbers, relevant aspects of irrational numbers, as well as
PISA 2012 School Report – GEMS World Academy 46
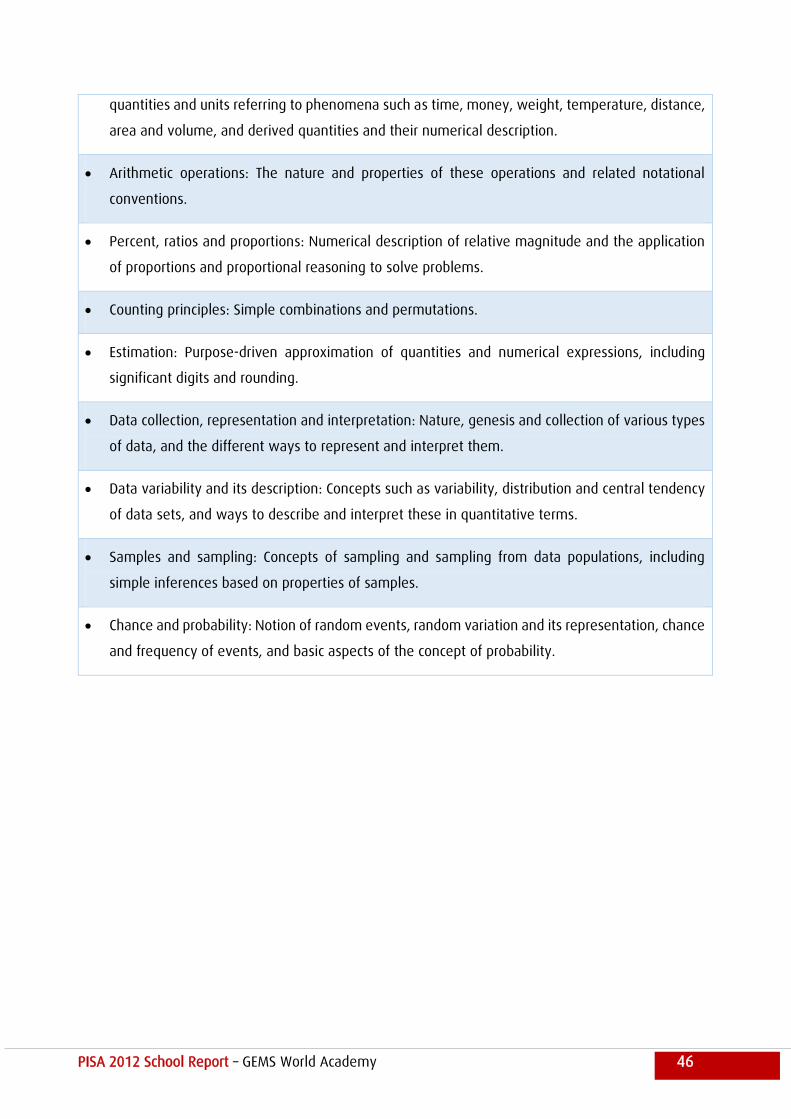
quantities and units referring to phenomena such as time, money, weight, temperature, distance,
area and volume, and derived quantities and their numerical description.
Arithmetic operations: The nature and properties of these operations and related notational
conventions.
Percent, ratios and proportions: Numerical description of relative magnitude and the application
of proportions and proportional reasoning to solve problems.
Counting principles: Simple combinations and permutations.
Estimation: Purpose-driven approximation of quantities and numerical expressions, including
significant digits and rounding.
Data collection, representation and interpretation: Nature, genesis and collection of various types
of data, and the different ways to represent and interpret them.
Data variability and its description: Concepts such as variability, distribution and central tendency
of data sets, and ways to describe and interpret these in quantitative terms.
Samples and sampling: Concepts of sampling and sampling from data populations, including
simple inferences based on properties of samples.
Chance and probability: Notion of random events, random variation and its representation, chance
and frequency of events, and basic aspects of the concept of probability.
PISA 2012 School Report – GEMS World Academy 47
Contact Information
For more information about Dubai’s participation in PISA 2012, please check Dubai’s PISA
report:
http://www.khda.gov.ae/CMS/WebParts/TextEditor/Documents/PISA_2012_Report_EN.pdf
How to contact us:
If you have a concern or wish to comment on any aspect of this report you should contact:

PISA 2012 School Report – GEMS World Academy 48