Embed Size (px)
DESCRIPTION
http://www.gea.com/global/en/binaries/GEA%20Group%20CMD%202013%20-%20Praesentation%20GEA%20CFO%20Dr%20Schmale%20FINAL_tcm11-25478.pdf
Citation preview
GEA Group
Dr. Helmut Schmale, CFOOelde, June 26-27, 2013
Capital Markets Day 2013Accelerating Growth through focusing on Core

engineering for a better world
Disclaimer
Forward-looking statements are based on our current assumptions and forecasts. These statements naturally entail
risks and uncertainties, which may cause the actual results of operations, financial position or performance to diverge
significantly from the estimates given here. Factors that could cause such a divergence include changes in the
economic and business environment, fluctuations in exchange rates and interest rates, launches of competing
products, poor acceptance of new products or services, and changes in business strategy. We are under no obligation
to update forward-looking statements.
Due to rounding, the sum of percentages of order intake and sales by region as well as by customer industry may vary
from 100%.
2 GEA Group CMD 2013 - Presentation Dr Schmale, CFO

engineering for a better world
Agenda
3 GEA Group CMD 2013 - Presentation Dr Schmale, CFO
IV. Strategy update
II. GEA Bonus System: Strong Focus on Cash and ROCE
I. Actual Performance
III. Outlook

engineering for a better world
I. Actual PerformanceOrder Intake YTD May 2013
4 GEA Group CMD 2013 - Presentation Dr Schmale, CFO
[in EUR million]
2012 2013
May
April
Q1
Jan – May -2%
+7%
+3%
-6%
YTD May 2012 YTD May 2013
GEA FS
GEA FT
GEA HX
GEA ME
GEA PE
GEA RT
Jan – May -2%
-13%
-10%
+13%
-3%
+1%
+1%
Q1 2013 yoy: -6%
-22%
-11%
+6%
-6%
-6%
0%

engineering for a better world
35% 38%
24% 22%
16% 16%
9% 10%
7% 7%
6% 4%
4%5%
YTD May 12 YTD May 13
Africa
Middle-East
Latin America
Eastern Europe& CIS
North America
Asia-Pacific
Western Europe26% 28%
9%11%
18%17%
6%7%
9% 7%
5% 5%
7% 5%
3% 3%
11% 11%
4% 4%
YTD May 12 YTD May 13
Other Industries
Climate &Environment
Marine
Chemicals
Pharma
Power
Oil & Gas
Food - Solid
Food - Beverages
Food - Dairy
I. Actual PerformanceOrder Intake YTD May 2013
5 GEA Group CMD 2013 - Presentation Dr Schmale, CFO
-2 %
Order Intake per customer industry Order Intake per region
-2 %
+5%
-9%
-2%
+7%
-3%-37%+8%
+8%
7
-18%
-12%-21%-7%
-2%
+15%
+3%
-3%
abs. yoy abs. yoy

engineering for a better world
I. Actual PerformanceSales YTD May 2013
6 GEA Group CMD 2013 - Presentation Dr Schmale, CFO
[in EUR million]
2012 2013
May
April
Q1
Jan – May 0%
+2%
+4%
-2%
YTD May 2012 YTD May 2013
GEA FS
GEA FT
GEA HX
GEA ME
GEA PE
GEA RT
Jan – May 0%
+16%*
-12%
+4%
-4%
+5%
+9%
*As reported in statements, after EUR 42m POC-related accounting adjustments in Q1 2012. Incl. this adjustments sales would be down 16% in Q1 13 and down 14% YTD May 13.
Q1 2013 yoy: -2%
+51%*
-18%
+1%
-6%
+6%
+2%

engineering for a better world
36%(36%)
24%(22%)
15%(14%)
10%(10%)
6%(7%)
5%(5%)
5%(5%)
Emerging markets* exposure: 42% (43%)
abs.: -1% YoY
Sales LTM perMay 2013:
EUR 5,715 m+1% YoY
I. Actual PerformanceRegional Sales LTM May 2013
7 GEA Group CMD 2013 - Presentation Dr Schmale, CFO
China10% (10%) abs.: +1% YoY
USA14% (13%) abs.: +11% YoY
Germany10% (10%) abs.: -4% YoY
Top 3 Countries
Western Europe abs.: -1% YoY
Asia-Pacific abs.: +6% YoY
North America abs.: +10% YoY
Latin America abs.: -9% YoY
Eastern Europe & CIS abs.: -6% YoY
Middle East abs.: -9% YoY
Africa abs.: 0% YoY
* According to the definition of emerging/developing economies by International Monetary Fund.

engineering for a better world
I. Actual PerformanceStructural development since 2008
8 GEA Group CMD 2013 - Presentation Dr Schmale, CFO
41%
55%
13%
6%14%
10%5%
5%8% 6%6% 3%
11% 11%
2% 3%
2008 L4Q per Q1 2013
Sales by Customer Industry
Other Industries
Climate &Environment
Marine
Chemicals
Pharma
Power
Oil & Gas
Food
43%35%
15%
15%
16%23%
12% 9%
6%7%
3% 5%5% 5%
2008 L4Q per Q1 2013
Sales by Region
Middle - East
Africa
Latin America
Eastern Europe& CIS
Asia - Pacific
North America
Western Europe
Strong increase of food exposureStrong increase of sales exposure with fast growing emerging markets from

engineering for a better world
I. Actual PerformanceStructural development since 2008
9 GEA Group CMD 2013 - Presentation Dr Schmale, CFO
66%58%
12%
11%
10%18%
5% 9%4% 2%1% 1%2% 0%
2008 Q1 2013
Production Employee by Region
43%35%
15%
15%
16%23%
12% 9%
6%7%
3% 5%5% 5%
2008 L4Q per Q1 2013
Sales by Region
Middle - East
Africa
Latin America
Eastern Europe& CIS
Asia - Pacific
North America
Western Europe
Strong shift of production workforce from high cost regions such as Western Europe and North America to low cost regions, in particular Asia-Pacific andEastern Europe.
27% of workforcelocated in Asia-Pacific and Eastern Europe
15% of workforcelocated in Asia-Pacific
and Eastern Europe

engineering for a better world
Per Q1 2013 at EUR 1.3bn annual run rate
I. Actual PerformanceService business: Approaching aim of >25% of sales
10 GEA Group CMD 2013 - Presentation Dr Schmale, CFO
769 802901
1,066
1,317 1,31814.9%
18.2%
20.4%
19.7%
23.0% 23.2%25,0%
2008 2009 2010 2011 2012 Q1 2013 LTM Aim
Service Sales GEA Service as % of Sales
[in EUR million]
>25%
CAGR GEA Service business 2008-2012:
+14%

engineering for a better world
Agenda
11 GEA Group CMD 2013 - Presentation Dr Schmale, CFO
IV. Strategy update
II. GEA Bonus System: Strong Focus on Cash and ROCE
I. Actual Performance
III. Outlook

engineering for a better world
II. GEA Bonus System - Three Bonus ComponentsStrong Focus on CFD Margin & ROCE to create value
12 GEA Group CMD 2013 - Presentation Dr Schmale, CFO
2013 2014 20152011 2012
Weight of the three bonus components (%ppts of X, Y, Z) depends on management level scoring

engineering for a better world
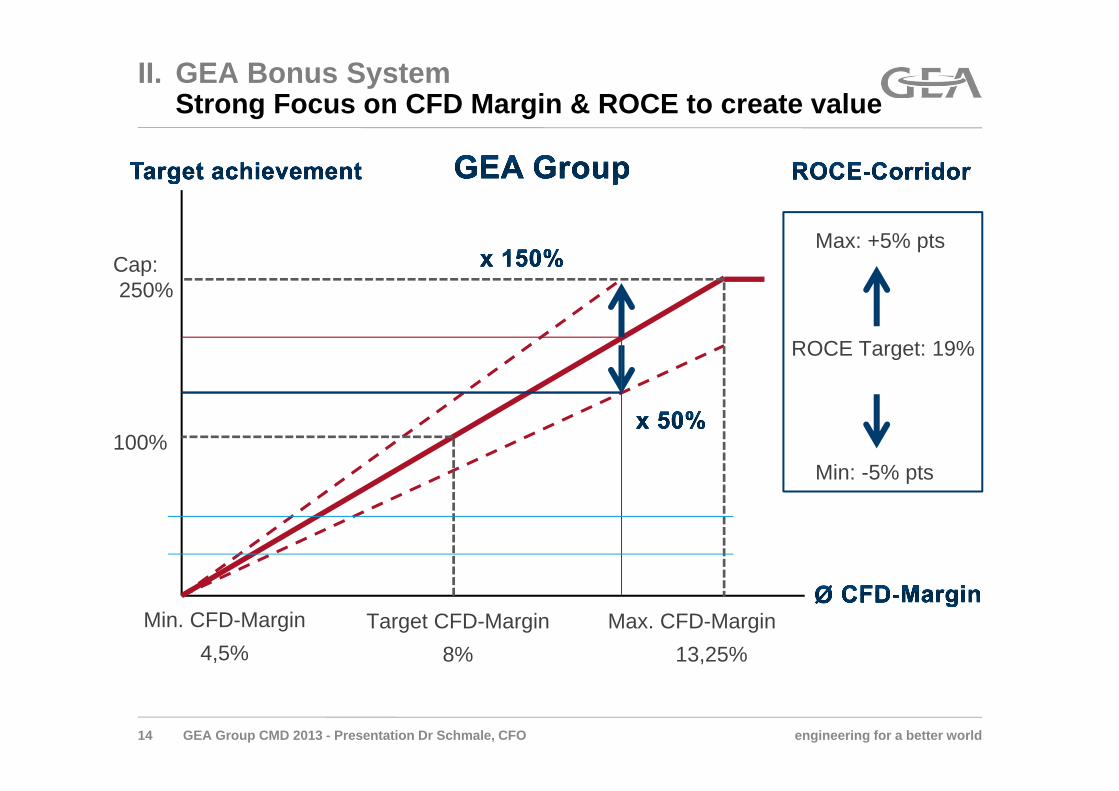
II. GEA Bonus SystemStrong Focus on CFD Margin & ROCE to create value
13 GEA Group CMD 2013 - Presentation Dr Schmale, CFO
engineering for a better world
II. GEA Bonus SystemStrong Focus on CFD Margin & ROCE to create value
14 GEA Group CMD 2013 - Presentation Dr Schmale, CFO
ROCE Target: 19%
Min: -5% pts
Max: +5% pts
Target CFD-Margin8%
Max. CFD-Margin13,25%
Min. CFD-Margin4,5%
100%
Cap:250%

engineering for a better world
0%
2%
4%
6%
8%
10%
12%
14%
16%
18%
0% 5% 10% 15% 20% 25% 30% 35% 40% 45% 50% 55%
II. GEA Bonus System Strong Focus on CFD Margin & ROCE to create value
15 GEA Group CMD 2013 - Presentation Dr Schmale, CFO
Ø ROCE last 36 monthsGEA Group Set Point: 19%
GEA PE
GEA ME
GEA HX
GEA FT
GEA RTCas
h Fl
ow D
river
Mar
gin
(L36
M)
ROCE* (L36M)* Capital employed excl. Goodwill from the acquisition of the former GEA AG by the former Metallgesellschaft AG in 1999
ROCE* and Cash Flow Driver Margin Ø 2010-2012 vs. Ø 2009-2011
GEA
ROCE (L36M) for all Segments increased
Ø CFD-Margin last 36 monthsGEA Group Set Point: 8%
Ø 2009-2011
Ø 2010-2012

engineering for a better world
Ø CFD-Margin last 36 monthsGEA Group Set Point: 8%
0%
2%
4%
6%
8%
10%
12%
14%
16%
18%
0% 5% 10% 15% 20% 25% 30% 35% 40% 45% 50% 55% 60% 65%
II. GEA Bonus System Strong Focus on CFD Margin & ROCE to create value
16 GEA Group CMD 2013 - Presentation Dr Schmale, CFO
Ø ROCE last 36 monthsGEA Group Set Point: 19%
GEA PE
GEA ME
GEA HX
GEA FT GEA RT
Cas
h Fl
ow D
river
Mar
gin
(LTM
)
ROCE* (LTM)
ROCE* and Cash Flow Driver Margin 2012 (LTM) vs. 2011 (LTM)
GEA
Cash Flow Driver Margin (LTM) of GEA, GEA FT, GEA HX and GEA RT improved
* Capital employed excl. Goodwill from the acquisition of the former GEA AG by the former Metallgesellschaft AG in 1999
ROCE declinedue to capex in new factories
ROCE decline due working capitalincrease in 2012
FY 2011 (LTM)
FY 2012 (LTM)

engineering for a better world
ROCE decline due working capitalincrease in 2012
ROCE 2011
ROCE 20120%
2%
4%
6%
8%
10%
12%
14%
16%
18%
20%
22%
0,0 1,0 2,0 3,0 4,0 5,0 6,0 7,00%
2%
4%
6%
8%
10%
12%
14%
16%
18%
20%
22%
0,0 1,0 2,0 3,0 4,0 5,0 6,0 7,0
GEA FT: 13.4%
GEA HX: 19.4%
GEA ME: 43.0%
GEA PE: 55.9%
GEA RT: 21.2%
GEA Group: 17.8%
0%
2%
4%
6%
8%
10%
12%
14%
16%
18%
20%
22%
0,0 1,0 2,0 3,0 4,0 5,0 6,0 7,0
II. GEA Bonus SystemStrong Focus on CFD Margin & ROCE to create value
17 GEA Group CMD 2013 - Presentation Dr Schmale, CFO
Capital turnover (Sales / Capital Employed* average LTM)
EBIT
-Mar
gin
(LTM
)
* Capital employed excl. Goodwill from the acquisition of the former GEA AG by the former Metallgesellschaft AG in 1999
ROCE as product of EBIT-Margin and capital turnover 2012 (LTM)Higher capital employed
due to capex in newfactories only partially
balanced by higher margin

engineering for a better world
II. GEA Bonus SystemFocus on ROCE
18 GEA Group CMD 2013 - Presentation Dr Schmale, CFO
1.796 1.950 2.1282.314 2.463 2.518 2.548 2.556 2.546 2.535
14.0% 14.1%
16.2%
20.5%
17.9%18.8% 18.6%
17.8%19.2% 19.3% ~19%
Q1 11 Q2 11 Q3 11 Q4 11 Q1 12 Q2 12 Q3 12 Q4 12 Q1 13 May 13
Capital Employed (average LTM) ROCE (average LTM)
[in EUR million]
*ROCE LTM = EBIT (LTM) / Capital employed excluding goodwill from the acquisition of the former GEA AG by the former Metallgesellschaft AG in 1999 (average LTM)
ROCE 2011: 20.5% ROCE 2012: 17.8%
P&L adjustments
GEA FS
Additional larger one-off expenses
GEA FS
Bonus Set point for 3
years average
Aim: 19% ROCE* over three years period

engineering for a better world
II. GEA Bonus SystemFocus on Cash Flow Driver
19 GEA Group CMD 2013 - Presentation Dr Schmale, CFO
374298 283 319
252299 329
368
470 499
8.3%
6.2%5.6%
5.9%
4.5%
5.3%5.7%
6.4%
8.3%8.7%
~8%
Q1 11 Q2 11 Q3 11 Q4 11 Q1 12 Q2 12 Q3 12 Q4 12 Q1 13 May 13
Cash Flow Driver (average LTM) CFD-Margin (average LTM)
[in EUR million]
CFD-Margin 2011: 5.9% CFD-Margin 2012: 6.4%
P&L adjustments
GEA FS
AcquisitionsGEA FS andGEA Bock
Bonus Set point for 3
years average
Aim: ~ 8% Cash Flow Driver Margin over three years period

engineering for a better world20 GEA Group CMD 2013 - Presentation Dr Schmale, CFO
166
129
81
115 122
6
7
4039
3.2%
2.9%
1.8%
2.1% 2.1%
3.2%3.1%
2.0%
2.9% 2.8%
0,0%
0,5%
1,0%
1,5%
2,0%
2,5%
3,0%
3,5%
0
20
40
60
80
100
120
140
160
180
2008 2009 2010 2011 2012 Aim
Capex GEA Capex GPC Capex as % of Sales (w/o) GPC Capex as % of Sales
II. GEA Bonus SystemComponents of Cash Flow Driver – Capex
[in EUR million]
~2%
Capex: Aim of ~2% of sales seen as sustainable

engineering for a better world
Further Working Capital reduction per May 2013
II. GEA Bonus SystemComponents of Cash Flow Driver – Working Capital
21 GEA Group CMD 2013 - Presentation Dr Schmale, CFO
[in EUR million]
657
482567 555 566
445
647707 720
577
772 764 741
533
726 720
17.2%16.4%
15.0%
13.9%13.1%
12.4% 12.4% 12.4% 12.6% 12.6% 12.9%13.3% 13.3% 13.2% 12.9% 12.6%
0%
2%
4%
6%
8%
10%
12%
14%
16%
18%
0
100
200
300
400
500
600
700
800
900
Q3 09 Q4 09 Q1 10 Q2 10 Q3 10 Q4 10 Q1 11 Q2 11 Q3 11 Q4 11 Q1 12 Q2 12 Q3 12 Q4 12 Q1 13 May 13
Working Capital Working Capital (average LTM) as % of sales (LTM)
- 461 bps

engineering for a better world
Agenda
22 GEA Group CMD 2013 - Presentation Dr Schmale, CFO
IV. Strategy update
II. GEA Bonus System: Strong Focus on Cash and ROCE
I. Actual Performance
III. Outlook
engineering for a better world
4
1 2 21
4 4
12
6
-4
1
7 8
-1
3
-1
67
6
97
4
9
7 6
2
5
13
10
18
14
11
43
5
10
8
10
14
19 1918
1210
-5
0
5
10
15
20
Aug
. 11
Sep
. 11
Okt
. 11
Nov
. 11
Dez
. 11
Jan.
12
Feb.
12
Mrz
. 12
Apr
. 12
Mai
. 12
Jun.
12
Jul.
12
Aug
. 12
Sep
. 12
Okt
. 12
Nov
. 12
Dez
. 12
Jan.
13
Feb.
13
Mrz
. 13
Apr
. 13
Mai
. 13
3 months 12 months
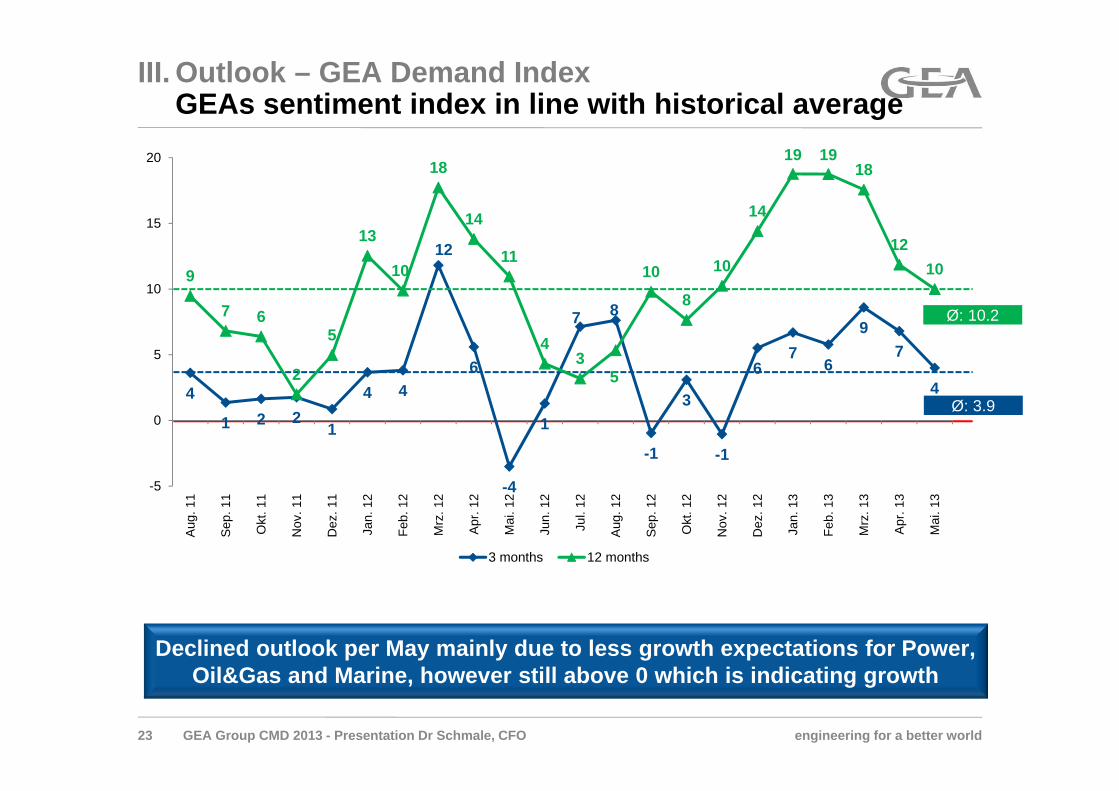
III. Outlook – GEA Demand IndexGEAs sentiment index in line with historical average
23 GEA Group CMD 2013 - Presentation Dr Schmale, CFO
Declined outlook per May mainly due to less growth expectations for Power, Oil&Gas and Marine, however still above 0 which is indicating growth
Ø: 10.2
Ø: 3.9

engineering for a better world
III. OutlookKey Figures FY 2013
24 GEA Group CMD 2013 - Presentation Dr Schmale, CFO
Sales: moderate growth
Calculation Cash Flow Driver Margin:
EBITDA – Capex - / + Working Capital (LTM)Sales Sales Sales
EBITDA: around EUR 700m
Assuming that there is no downturn in global economic growth, we are aiming at the following in the current fiscal year
Cash Flow Driver Margin: at least 8%

engineering for a better world
III. OutlookAdditional Financial Information for 2013
25 GEA Group CMD 2013 - Presentation Dr Schmale, CFO
Tax rate in P&L after impact from tax around 22.5%loss carry forwards:
Impact from PPA in 2013 and in around EUR 25m p.a.subsequent years: thereof GEA FS around EUR 14m p.a.
Sustainable capex level: around 2.0% of sales
Working Capital LTM: approx. 12% - 14% of sales LTM
Interest result: interest rate for financial liabilities(excl. pensions) below 4% p.a.
Dividend policy: around 1/3 of net income
Depreciation & amortization in FY 2012: amounted to around EUR 145m in FY 2012

engineering for a better world
Agenda
26 GEA Group CMD 2013 - Presentation Dr Schmale, CFO
IV. Strategy update
II. GEA Bonus System: Strong Focus on Cash and ROCE
I. Actual Performance
III. Outlook

GEA Group
Dr. Helmut SchmaleCFO
Capital Markets Day 2013Accelerating Growth through focusing on Core

engineering for a better world
Agenda
28 GEA Group CMD 2013 - Presentation Dr Schmale, CFO
I. Separation from HX – Channelling GEA‘s resources
III. The GEA Vision – Driving Food and Process Industry Technologies
II. Portfolio review – Setting the stage for GEA’s long-term success
IV. Outlook – Taking GEA’s evolution to the next level

engineering for a better world29 GEA Group CMD 2013 - Presentation Dr Schmale, CFO
In-depth review of GEA portfolio revealed: Technologies for food industry and technologically sophisticated process industries offer most compelling development opportunities
GEA to further extend leading position in these segments; Proportion of Group revenue accounted for by food technologies to be increased to ~70-75 percent
Strong performance of HX, but limited synergies between HX and remaining business units and different end-markets
Separation of HX provides opportunity to fully explore GEA’s and HX’s long-term potential
II. Separation from HXChannelling GEA‘s resources to unlock further growth
GEA reinforces core business and pursues separation from HX

engineering for a better world
Selling to('inter-segment')
HXAFC CS
PHE
ACC-H
S&T
WC
AT
HX business units
AFC ST
Sales FY 2012 EUR 1,608m
RefrigerationProcess Eng.
7
1
Mech. Separation
Refrigeration
Farm Technologies 13
124
Process Eng.Refrigeration
01
In EURm
Process Eng.
Refrigeration
Process Eng.Refrigeration
01
1
0
~ EUR31m inter-segment sales
Limited inter-company relations and limited future cross-applications synergy potentialKey message
Process Eng.
GEA Group CMD 2013 - Presentation Dr Schmale, CFO
II. Separation from HXHX has only limited business relations within GEA
30

engineering for a better world
Agenda
31 GEA Group CMD 2013 - Presentation Dr Schmale, CFO
I. Separation from HX – Channelling GEA‘s resources
III. The GEA Vision – Driving Food and Process Industry Technologies
II. Portfolio review – Setting the stage for GEA’s long-term success
IV. Outlook – Taking GEA’s evolution to the next level

engineering for a better world32 GEA Group CMD 2013 - Presentation Dr Schmale, CFO
Need to optimally allocate limited resources (management and financial)
Analytic approaches (technology and application mapping) to develop a reasoned vision of the desirable future set of activities (“Pick your battles”)
Maximize value creation for stakeholders as a consequence of targeted and harmonized orientation of the organization
II. Portfolio ReviewMotivation: Keep the growth effort focused!

engineering for a better world33 GEA Group CMD 2013 - Presentation Dr Schmale, CFO
Long-term strategic direction Portfolio health checkStrategy “Focus & Grow” BUs
Strategy for remaining BUs
Initial top-down portfolio assessment based on pre-selected market, competition and financial criteria
Top-down identification of long-list of “subject to further review” BUs that are to be further analyzed
Bottom-up strategic analysis of long-listed “subject to further review” BUs
Definition of GEA Group long-term strategic direction based on strategic analysis and Executive Board workshops
Long-term strategic direction to serve as “guiding path”throughout strategy process
Which BUs support the vision?Vision of GEA? Uses and sources of free cash?
Development of long-term strategy for “focus & grow” businesses
Development of strategy for remaining businesses
1. 2. 3a
3b
Key questions
II. Portfolio ReviewThe three core questions asked

engineering for a better world
Product Leadership Operational Excellence
Customer Proximity• Given the importance of product
leadership for GEA, a technology mapping has already been carried out in order to analyze the position of GEA and secure it subsequently
• A complementary competency mapping has been initiated to systematically assess GEA's application knowledge and analyze it in the context of core technologies
• To ensure customer proximity a strategy by core applications across segments / BUs will be developed
II. Portfolio ReviewGEA’s DNA dimensions: Products and Customers
34 GEA Group CMD 2013 - Presentation Dr Schmale, CFO

engineering for a better world35 GEA Group CMD 2013 - Presentation Dr Schmale, CFO
HX
AFC SingleAFC Com-pact….….
ME
SeparationFlow Com-ponents….….
FT
Milking & CoolingFarm Equipment….
RT
ComponentsFreezers….….
PE
Concentra-tionChemical Drying ….….
FS
PPMPSL….
BUs BUsBUs BUsBUsBUs
Market Applications (e.g. cheese, beer, marine)
Technology & competence mapping
II. Portfolio ReviewFoundation: Holistic analysis of entire organization...

engineering for a better world
Evaluation and selection of suitable business models for GEA(e.g. component picker vs. solution provider)
36 GEA Group CMD 2013 - Presentation Dr Schmale, CFO
Note: simplified representation for illustrative purposes
Milk intake, storage &
distribution
Bacteria removal
Whey drainage
Curd production
Pressing, brining & ripening
Pasteur-ization
Standard-ization
Definition process chain & key components by process step
Cutting & Slicing
Primary packagingSt
eps
Equi
pmen
t
Mapping GEA presence & competences
Adjacent equipment & technologies (e.g. plant design, measurement devices, automation control)
Evaluation of attractiveness
Customer interviews to understand buyer preferences (e.g. components, turnkey)
+
II. Portfolio Review...with analysis of production and buyer preferences…

engineering for a better world37 GEA Group CMD 2013 - Presentation Dr Schmale, CFO
Attractive application “white spots”Attractive application “white spots”
Assessment of attractive “white spots” along all key applications based on: Strategic attractiveness Value potential
The selected strategic options for GEA outline a concrete strategic development path and a roadmap to its implementation
Evaluation of options for GEAEvaluation of options for GEA
Portfolio attractiveness Capturing sustainable trends? Reaching targets of GEA?Portfolio balance Risk vs. return? Cash generation vs. cash use? Short vs. long-term value creation?Implementation Can we finance it? What are the risks?
II. Portfolio Review…to determine GEA‘s future winning strategy

engineering for a better world
Cheese Fruit & Vegetables
Meat & Poultry Milk Powder
Fish & Shrimps …
Existing applications, e.g. New applications…
…
…
Cross-application technology
… … ...
Cross-application M&A
A B
C
New application with many expected "white spots”
Attractive "white spots" ("sweet spots")
II. Portfolio ReviewNext Step: Continously developing more applications
38 GEA Group CMD 2013 - Presentation Dr Schmale, CFO

engineering for a better world
Agenda
39 GEA Group CMD 2013 - Presentation Dr Schmale, CFO
I. Separation from HX – Channelling GEA‘s resources
III. The GEA Vision – Driving Food and Process Industry Technologies
II. Portfolio review – Setting the stage for GEA’s long-term success
IV. Outlook – Taking GEA’s evolution to the next level

engineering for a better world
III. The GEA VisionKey investment case post strategy implementation
40 GEA Group CMD 2013 - Presentation Dr Schmale, CFO
Increasingly stringent hygiene and safety regulations in end markets
Growth driven by shift in consumer preferences towards functional, processed and convenience foods
Global leading positions with exceptionally high barriers to entry
Unrivalled quality and breadth of product range
Pure Play: Highly focused and resilient end market exposure
Balanced income split resting on strong food share of revenue of around 70-75 percent
1
2
3
4
5
6

engineering for a better world
54%
6%
11%
11%
5%6%
3%4%
35%
23%
15%
10%
7%5% 5%
72%
7%
6%4%
3%3%3%
2%
41
GEA Group by customerindustry
Food
Oil & Gas
Power
Pharma
ChemicalsMarine
Climate & Environment
Other
GEA Group excl. HX bycustomer industry
GEA Group by region GEA Group excl. HX by region
SalesFY 2012:
EUR 5,720m
Asia-Pacific
North America
LatinAmerica
Eastern Europe
Middle East Africa
Western Europe
Food
Oil & Gas Power
Pharma
Chemicals
MarineClimate & Environment
Other
SalesFY 2012:
EUR 4,142m
32%
26%
18%
10%
7%4%4%
SalesFY 2012:
EUR 4,142m
Asia-Pacific
North America
LatinAmerica
Eastern Europe
Middle East Africa
Western Europe
SalesFY 2012:
EUR 5,720m
GEA Group CMD 2013 - Presentation Dr Schmale, CFO
III. The GEA VisionPure Play: Focused and resilient end market exposure

engineering for a better world
Agenda
42 GEA Group CMD 2013 - Presentation Dr Schmale, CFO
I. Separation from HX – Channelling GEA‘s resources
III. The GEA Vision – Driving Food and Process Industry Technologies
II. Portfolio review – Setting the stage for GEA’s long-term success
IV. Outlook – Taking GEA’s evolution to the next level

engineering for a better world43
Examples for Systematic capital allocationExamples for Systematic capital allocation
Organicgrowth
M&A
R&D spent for development of new technologies Expansion of service network Penetration of new markets Stronger focus on realization of intra-group
synergy potential
Bolt-on acquisitions (as in the past) Acquisition of adjacent products to strengthen GEA’s
current portfolio Acquisition of new technologies that can’t be
developed efficiently internally Partnerships or acquisitions to unlock potential from
regional expansion (e.g. distribution channels)
GEA Group CMD 2013 - Presentation Dr Schmale, CFO
IV. OutlookInvestment plan to bolster GEA’s strategy
Debt reduction Leveraging operating cash flow to reduce debt levels

engineering for a better world
Phase I Phase II Phase III Now: Phase IV
20132012
Strategy review of GEA's businesses around different key criteria
Decision about Separation of HX
Preparation of separation of HX
Full team of advisers will be mandated shortly
"Health checks" per BU to review and challenge business model
• End market characteristics
• Growth and profitability patterns
• Competitive positioning
• Sources of competitive advantage
• Optimal ownership from synergies perspective
44 GEA Group CMD 2013 - Presentation Dr Schmale, CFO
IV. OutlookTimeline: GEA portfolio strategy process in four phases

45

engineering for a better world
Investor Relations CalendarUpcoming Roadshows and Conferences
46 GEA Group CMD 2013 - Presentation Dr Schmale, CFO
July 8, 2013 Roadshow Italy Milano
August 1-2, 2013 Roadshow UK London
July 31, 2013 Roadshow Ireland Dublin
August 2, 2013 Roadshow Germany Frankfurt
September 3, 2013 Roadshow UK Edinburgh
September 4-6, 2013 Roadshow/Conference UK London
September 5, 2013 Roadshow Denmark Copenhagen
August 30, 2013 Conference Germany Frankfurt
September 16-19, 2013 Roadshow/Conference USA & Canada New York, Boston, Toronto
September 19 & 24-25, 2013 Roadshow/Conference Germany Frankfurt, Munich

engineering for a better world
Financial Calendar
47 GEA Group CMD 2013 - Presentation Dr Schmale, CFO
July 30, 2013 Interim Report Q2 2013
October 31, 2013 Interim Report Q3 2013