Embed Size (px)
Citation preview


gË`_{d O`V{
dmof©H$ na[m{Q>©Annual Report
2013-2014
Z_H$ od^mJSALT DEPARTMENT
^maV gaH$maGovt. of India
dmoUÁ` Ed§ CÚm{J _§Ìmb`Ministry of Commerce & Industry
Am¡Úm{oJH$ ZroV Am¡a g§dY©Z od^mJDepartment of Industrial Policy & Promotion
NaCl


àñVmdZmo"kZ 2013&14 dh ;g okf"kZd fjikVZ ued vk;qDr laxBu ¼,l-lh-vks½ tks fd okf.kT; ,oa m|ksx ea=ky; ds
v/khu vkS|ksfxd uhfr ,o alao/kZu foHkkx dk ,d lac} dk;kZy; gS] }kjk rS;kj dh xbZ gSA ;g okf"kZd fjiksVZ Hkkjrh; ued m|ksx dh :ijs[kk] ued vk;ksMhuhdj.k dk;ZØe rFkk foHkkx }kjk dh xbZ fofHkUUk xfrfof/k;ksa dks n'kkZus dk ,d mi;ksxh nLrkost gSA y?kq o lhekar ued fuekZrkvksa ls lacaf/kr okLrfod vkdM+s miyC/k ugha gksus ds vHkko esa bl fjiksVZ esa dsoy vuqekfur vkadM+ksa dks gh 'kkfey fd;k x;k gSA ;g okf"kZd fjiksVZ foHkkx dh osclkbV www.saltcomindia.gov.in ij Hkh miyC/k gSA
Hkkjr ued mRiknu ds {ks= esa fo'o esa phu vkSj vesfjdk ds ckn rhljs LFkku ij viuh fLFkfr cuk, gq, gS o vk;ksMhu ;qDr ued mRiknu esa fo'o esa phu ds ckn nwljk lcls cM+k mRiknd ns'k gSA rFkkfi y?kq ued mRikndksa dh ued mRikndrk esa lq/kkj ykus gsrq vHkh Hkh ued vk;qDr laxBu ds lg;ksx dh vko';drk gSA
bl o"kZ fofHkUu ued mRiknd jkT;ksa esa ued mRiknu dky ds nkSjku gqbZ O;kid o"kkZ ds dkj.k ued mRiknu izHkkfor gqvk gSA bl o"kZ xqtjkr jkT; esa flrEcj@vDVwcj] 2013 ds nkSjku gqbZ Hkkjh o"kkZ ds ifj.kke Lo:Ik ued dk mRiknu de gqvk gS fQj Hkh mRiknu esa gqbZ deh dh vkaf'kd iwfrZ vfrfjDr mRiknu {ks=ksa ds 'kkfey gksus ls gqbZ gSA tuojh&Qjojh] 2014 ds nkSjku :d&:d dj gqbZ o"kkZ ls jktLFkku esa ued mRiknu izHkkfor gqvk gSA ifj.kkeLo:Ik o"kZ 2012&13 esa gq;s dqy 245 yk[k Vu ued mRiknu dh rqyuk esa o"kZ 2013&14 esa 230 yk[k Vu ued dk mRiknu gqvk gSA blh izdkj o"kZ 2013&14 esa ns'k esa dqy vk;ksMhu ;qDr ued dk mRiknu 58-47 yk[k Vu jgk tks fd yf{kr mRiknu ls de Fkk] ijUrq ns'k Hkj esa dgha Hkh vk;ksMhu;qDr ued dh dksbZ deh eglwl ugha dh xbZA
Hkkjrh; ued viuh xq.koRrk esa lq/kkj rFkk canjxkgksa ij csgrj cqfu;knh lqafo/kkvksa ds ifj.kkeLo:Ik varjkZ"Vªh; cktkj esa viuk LFkku cuk jgk gSA o"kZ 2011&12 esa 37-72 yk[k Vu ued dk fu;kZr fd;k x;k Fkk tks o"kZ 2013&14 esa c<dj 59-61 yk[k Vu gks x;k gSA Hkkjrh; ued ds Øsrk ns'kksa phu] tkiku] fo;ruke] la;qDr vjc vehjkr] drj] dksfj;k] FkkbZySaM] eysf'k;k] caxykns'k] baMksfuf'k;k] HkwVku bR;kfn gSa ftUgsa eq[;r;k vkS|ksfxd mi;ksx gsrq fu;kZr fd;k x;k FkkA yxHkx 2-29 yk[k Vu vk;ksMhu;qDr ued dk fu;kZr usiky] Jhyadk] nqacbZ] dqoSr vkfn ns'kksa dks fd;k gSA
LokLF; vkSj ifjokj dY;k.k ea=ky; rFkk ;wfulsQ }kjk o"kZ 2009 esa djok;sa x;s gkmlgksYM losZ{k.k esa ik;k x;k gS fd ns'k dh 71 izfr'kr vkcknh Ik;kZIr :Ik ls vk;ksMhu;qDr ued dk miHkksx dj jgh gS o 'ks"k 20 izfr'kr vkcknh vi;kZIr vk;ksMhu;qDr ued dk miHkksx dj jgh gS tcfd o"kZ 2005 esa ;g ek= 51 izfr'kr FkkA vk;ksMhu ;qDr ued ds miHkksx dks yksdfiz; cukus ds fy, lkewfgd iz;kl fd, x,A Hkkjr esa vk;ksMhuhdj.k dk;ZØe dh leh{kk ds rgr iksyhiSd vk;ksMhu;qDr ued eas le; ds lkFk vk;ksMhu va'k dks cjdjkj j[kus gsrq ued vk;qDr laxBu] vf[ky Hkkjrh; vk;qfoZKku laLFkku] ;wfulsQ] xsu rFkk vkbZ-lhlh-vkbZ-Mh-Mh- la;qDr :Ik ls ,d v/;;u dj jgs gSaA ued vk;qDr us ,e-vkbZ] xsu dh lgHkkfxrk esa fofHkUu jkT;ksa esa i;kZIr vk;ksMhu;qDr ued ds miktZu o forj.k gsrq fgr/kkjdksa ds lkFk lQyrkiwoZd cSBdsa vk;ksftr dh xbZA izR;sd txg O;kikfj;ksa] fofHkUu xSjljdkjh lxaBu] jkT; ljdkj ds LokLF; foHkkx] [kk| ,oa ukxfjd vkiwfrZ foHkkx] f'k{kk foHkkx uss bl dk;ZØe dks lQy cukus esa lfØ; Hkkxhnkjh iznku dhA miHkksDrk }kjk vf/kd ialn fd, tkus ds dkj.k ifj"d`r@oSD;we vk;ksMhu;qDr ued /khjs&/khjs lk/kkj.k vk;ksMhu;qDr ued dk LFkku ys jgk gS vkSj vc ;g ?kjsyw cktkj dk izeq[k fgLlk cu x;k gSA
jsyos dh izkFkfedrk ̂lh* esa vifj"d`r vk;ksMhu;qDr ued ds ifjogu gsrq ubZ mnkjhd`r ifjogu uhfr cukbZ xbZ gS] ftlls vk;ksMhu;qDr ued fuekZrk muds ikl miyC/k ekax ds vuqlkj vk;ksMhu;qDr ued dk fuxZeu dj ldsa] ;fn muds }kjk is'k vk;ksMhu;qDr ued [kk| lqj{kk ekudksa ds vuq:Ik o vk;ksMhuhdj.k la;a=ksa dh LFkkfir {kerkuqlkj gksA
ued vk;qDr laxBu ds lefUor iz;klksa ls Hkkjrh; m|ksx ifjla?k us psUubZ esa lkYV bafM;k dkuDyso] 2014 dk vk;kstu fd;kA dkWUDyso dh flQkfj'kksa ij dkjZokbZ dh tk jgh gSA
foHkkx us ued Jfedksa ds ykHk ds fy, dbZ LokLF; f'kfojksa vkSj o [ksydwn izfr;ksfxrkvksa dk vk;kstu fd;kA fpYMªu fjokMZ Ldhe ds rgr 3500 es/kkoh cPpksa dks 45 yk[k :Ik;s ds iqjLdkj iznku fd;s x;s ftlesa yM+fd;ksa dks izkFkfedrk nh xbZA ued Jfedksa ds dkS'ky esa lq/kkj o rduhdh mUu;u ds fy, osnkj.;e] rfeyukMq esa ,d izf'k{k.k dk;ZØe vk;ksftr fd;k x;kA
eq>s fo'okl gS fd ;g okf"kZd fjiksVZ ued fuekZrkvksa] ued vk/kkfjr m|ksx ds tqM+s m/kfe;ksa o vU; yksxksa dh vko';drkvksa dks iwjk djsxhA rFkkfi] bldh xq.koRrk] izLrqfr vkSj lkexzh esa lq/kkj djus gsrq fdlh Hkh lq>ko dk Lokxr gSA
fnukad 25 twu] 2014(E_. E. AÝgmar) Z_H$ Am`wº$

PREFACE
Jaipur, 25 June, 2014
This Annual Report for the year 2013-14 brought out by the Salt Commissioner's Organisation (SCO), an attached office of the Department of Industrial Policy and Promotion under the Ministry of Commerce and Industry is an useful document which outlines the status of Indian Salt Industry, Salt Iodisation programme and various activities undertaken by the Department. In the absence of actual data in respect of small and marginal salt manufacturers, only estimated figure have been incorporated in this report. The annual report is also available on the website: www.saltcomindia.gov.in of the department.
India continues to hold third position in the production of salt after China and USA. India is second largest producer of iodised salt next to China. There is still need for SCO to support the efforts of small salt producers in improving their productivity.
During this year the production of salt was affected due to wide spread rain during the manufacturing season in all salt manufacturing state. Heavy rains during September/October 2013 in Gujarat has delayed season resulting in loss of production. The loss of production was partly compensated by bring additional area under salt production. The intermittent (showers) during January - February in Rajasthan has affected production. The net result was the production of salt during the period under report was 230 lakh MT against 245 lakh tons during 2012-13. The production of iodised salt was 58.47 Lac MT which is less than the targeted production but there was no scarcity of iodised salt throughout the country.
Indian salt is penetrating international market due to improvement in its quality and improved infrastructure facilities at Ports. It has increased from 37.72 lakh tones during 2011-12 to 59.61 during 2013-14. The buyers' countries are China, Japan, Vietnam, UAE, Qatar, Korea, Thailand, Malaysia, Bangladesh, Indonesia, Bhutan etc. The export was mainly for industrial application; about 2.29 lakh MT of iodised salt was exported to Nepal, Sri Lanka, Dubai, Kuwait etc.
The house hold survey carried out by the Ministry of Health & Family Welfare and UNICEF about the consumption of adequately iodised salt reveals that 71% population has access to adequately iodised salt during 2009 against 51% during 2005. Similarly consumption of non iodised salt is reduced from 34% to 9% during aforesaid period.. The remaining 20% population has consumed inadequately iodised salt. Concerted efforts were made to popularize consumption of iodised salt. To review salt iodisation program in India Salt Commissioner Organisation, AIIMS, UNICEF, GAIN and ICCIDD are jointly carrying out a study on retention of iodine in poly packed iodised salt with passage of time. Salt Commissioner in collaboration with the MI and GAIN successfully organized meetings with stakeholders in procurement and distribution of adequate iodised salt in different states. Each place the traders, different NGO, state government official of Health Department, Food and Civil Supply Department, Education Department actively participated for the success of their program. Refined/Vacuum iodised salt is gradually replacing ordinary iodised salt due to its preference by consumer and now holds major share in the domestic market.
The new liberalized transport policy for the movement of non refined iodised salt under Railway priority 'C' has been framed under which iodised salt producer can dispatch edible salt as per demand available with them subject to offering salt meeting Food safety standards and installed capacity of salt iodisation plant.
With co-ordinated efforts of SCO, confederation of Indian Industry organized salt India Conclave 2014 at Chennai. The recommendations of this conclave is being processed.
Department conducted several Health camps and organized sports meet for the benefit of the Salt workers. 3500 meritorious children were granted rewards of Rs. 45 lakh under Children reward scheme wherein preference was given to female children. A program for training of salt labourers for technological up gradation to improve their skill has been conducted at Vedaranyam, Tamil Nadu.
The Annual report, I believe, will meet the needs of entrepreneurs, manufacturers and others connected with salt and salt based industry. However, any suggestions to improve its quality, presentation and content are most welcome.
M. A. Ansari
Salt Commissioner
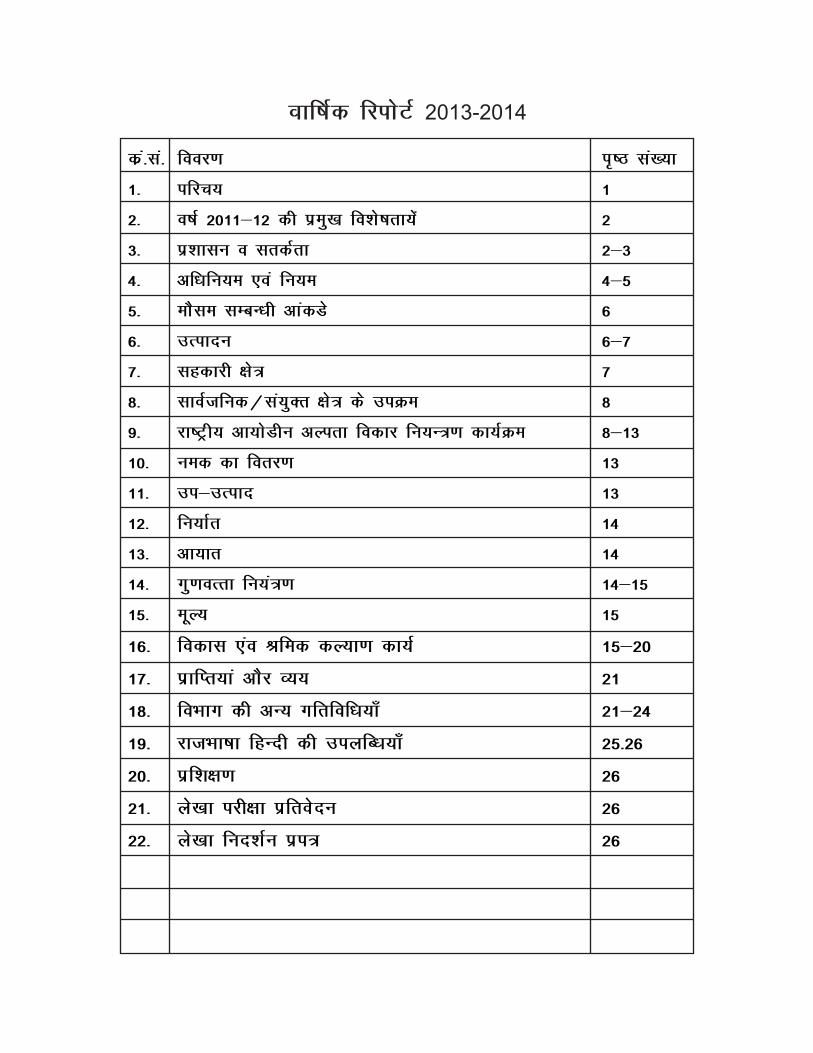
dza-la- fooj.k i`"B la[;k
1- ifjp; 1
2- o"kZ 2011&12 dh izeq[k fo'ks"krk;as 2
3- iz'kklu o lrdZrk 2&3
4- vf/kfu;e ,oa fu;e 4&5
5- ekSle lEcU/kh vkadMs 6
6- mRiknu 6&7
7- lgdkjh {ks= 7
8- lkoZtfud@la;qDr {ks= ds miØe 8
9- jk"Vªh; vk;ksMhu vYirk fodkj fu;U=.k dk;ZØe 8&13
10- ued dk forj.k 13
11- mi&mRikn 13
12- fu;kZr 14
13- vk;kr 14
14- xq.koRrk fu;a=.k 14&15
15- ewY; 15
16- fodkl ,ao Jfed dY;k.k dk;Z 15&20
17- izkfIr;ka vkSj O;; 21
18- foHkkx dh vU; xfrfof/k;k¡ 21&24
19- jktHkk"kk fgUnh dh miyfC/k;k¡ 25-26
20- izf'k{k.k 26
21- ys[kk ijh{kk izfrosnu 26
22- ys[kk fun'kZu izi= 26
Okkf"kZd fjiksVZ 2013-2014

ANNUAL REPORT2013-14
S.No. CONTENTS Page No.
1. Introduction 1
2. Highlights during 2013-14 2
3. Administration & Vigilance 2-3
4. Acts & Rules 4-5
5. Meteorological Data 6
6. Production 6-7
7. Co-operative Sector 7
8. Public/Joint Sector Undertaking 8
9. National IDD Control Programme 8-13
10. Distribution of Salt 13
11. By-Products 13
12. Exports 14
13. Imports 14
14. Quality Monitoring 14-15
15. Prices 15
16. Development and Labour Welfare Works 15-20
17. Receipts & Expenditure 21
18. Other Activities of the Department 21-24
19. Raj Bhasha Hindi-Achievements 25-26
20. Training 26
21. Audit Report 26
22. Proforma Account 26

ANNEXURES
Contents Annexure Page
1. Functions of Salt Department 1.1 29-30
2. Salient Features of Salt Industry 2.1 31
3. Particulars of various offices of the Salt Department
- Headquarters/Regions/Divisions/Circles 3.1 32-35
- Quality control laboratories 3.2 36-39- Strength of Salt Department 3.3 40- Public Information Officers (PIO) under RTI Act, 2005 3.4 41
4. Acts & Rules- Concessions/ Exemptions in the rate of cess 4.1 42-43
under Salt Cess Rules, 1964- Inspection Agency under Export Act, 1963 4.2 44- Details of Salt Department Lands 4.3 45- Inter Policy Guidelines for Transfer of Salt PAN lands 4.4 46-49- Assignment Fee & Ground Rent 4.5 50-51
5. Meterorlogical Data
- Rainfall 5.1 52- Mean wind velocity 5.2 53- Average Relative Humidity 5.3 54- Maximum & Minimum Temperatures 5.4 55
6. Common Salt
- Production of Salt in leading salt producing countries 6.1 56-60- Statewise salt producing district and average production 6.2 61- Number of categorywise Units, area and actual area 6.3 62
worked- Particulars of new area registered for Salt Manufacture 6.4 63- Salt Production in the Country from 1947 to 2013-14 6.5 64- State/Sectorwise Production of Salt 6.6 65- Category / Statewise Production of Salt 6.7 66- State/Sourcewise Production of Salt 6.8 67- Yearly Target and production of common salt 6.9 68- State-wise stock of salt 6.10 69- Average yield of salt 6.11 70
7. Particulars of Co-operative Societies 7.1 71
8. Particulars of Public/ Joint Sector undertaking 8.1 72
9. Iodised Salt
- Target & Production 9.1 73- Particulars of Iodisation Plants commissioned 9.2 74- State-wise Production 9.3 75- State-wise Supplies & Export 9.4 76-77

10. Distribution
- Supply of Edible salt to various states/U.T.'s 10.1 78- State-wise salt Loading Stations 10.2 79- State-wise movement of salt by Rail, Road & Sea 10.3 80- Supplies of edible salt from production sources 10.4 81-83- Movement of salt for edible and industrial purposes 10.5 83
in the country by different modes of transport
11. Industrial Consumption and By-Products
- Production of Caustic Soda and Soda Ash 11.1 84- Particulars of By-Products in various States 11.2 85
12. Exports
- Exemption from pre-shipment inspection 12.1 86- Export of Salt 12.2 87- Country-wise exports of salt 12.3 88- Port-wise export of salt and its value 12.4 89
13. Imports
- Import of Salt 13.1 90
14. Quality Monitoring
- BIS Specification of Vacuum/Refined Iodised Salt 14.1 91- FSSA Specification of Double Fortified Salt 14.2 92
15. Prices
- Prices of salt at some important salt producing 15.1 93-94centres
- Retail prices of salt in some important consuming centres 15.2 95- Iodised Salt distribution through PDS/FPS 15.3 96
16. Central/Regional Advisory Board for Salt
- Code of Principles 16.1 97-99
17. Labour
- Average number of labourers employed 16.2 100
18. Receipts & Expenditure
- Receipts & Expenditure on the Salt Department 17.1 101- Receipts of Salt Department-Regian wise 17.2 102- Expenditure of Salt Department 17.3 103- Expenditure incurred on Development/Labour Welfare, 17.4 104
and other works
19. Constitutional Committee-USI 18.1 105-106
20. Salt Department official's Training 19.1 107
21. Proforma Account 20.1 108

ANNUAL REPORT2013-14
1.0 INTRODUCTION
“Salt” is a Central subject in the Constitution of India and appears as item No 58 of the Union list of the 7th Schedule, which reads:
(a) “Manufacture, Supply and Distribution of salt by Union Agencies; and
(b) “Regulation and control of manufacture, supply and distribution of salt by other agencies”.
Central Government is responsible for controlling all aspects of the Salt Industry. Salt Commissioner's Organisation, an attached office under the Ministry of Commerce & Industry (Department of Indus t r ia l Po l i cy & Promot ion) , Government of India, is entrusted with the above task. The main functions of the Salt Commissioner's Organisation are:
• Leasing of Central Government land for
salt manufacture;
• Planning and facilitating production of salt;
• Arranging equitable distribution and
monitoring the quality and prices;
• Promotion of technological development
and training of personnel;
• Ma in tenance o f s t anda rds and
improvement in quality of salt;
• Nodal Agency for monitoring production,
distribution and quality control of iodised
salt;
• Management of Departmental lands;
• Planning, formulating and monitoring
execution of development and labour
welfare schemes;
• Promotion of exports and pre-shipment
inspection;
• Collection of Salt Cess, Assignment Fee,
Ground Rent and other dues;
• Rehabilitation of Salt Works affected by
natural calamities.
Detailed functions of the Salt Department are
listed in Annexure-1.1
okf"kZd fjiksVZ2013-14
1- ifjp;
Hkkjr ds lafo/kku esa Þuedß ,d dsUnzh; fo"k; gS vkSj bls lkroha vuqlwph dh la?kh; lwph esa en la[;k 58 ij crk;k x;k gS] tks bl izdkj gS %
¼d½ la?kh; vfHkdj.kksa }kjk ued dk fuekZ.k] vkiwfrZ vkSj forj.k] rFkk
¼[k½ vU; vfHkdj.kksa }kjk ued ds fuekZ.k] vkiwfrZ vkSj forj.k dk fu;eu vkSj fu;a=.kA
dsUnz ljdkj] ued m|ksx ds lHkh i{kksa ds fu;a=.k ds fy, ftEesnkj gS A Hkkjr ljdkj ds okf.kT; ,oa m|ksx ea=ky; ¼vkS|ksfxd uhfr ,oa lao/kZu foHkkx½ ds varxZr ued vk;qDr laxBu dks buds v/khuLFk dk;kZy; ds :i esa mi;qZDr dk;Z lkSisa x, gSaA ued vk;qDr laxBu ds eq[; dk;Z bl izdkj gSa %&
• ued fuekZ.k ds fy, dsUnz ljdkj dh Hkwfe ds iV~Vs nsuk A
• mRiknu y{;ksa dh ;kstuk cukuk A
• lkE;;qDr forj.k dk izcU/k djuk vkSj xq.koRrk rFkk dherksa ij fuxjkuh j[kukA
• izkS|ksfxdh; fodkl dh izksUufr vkSj dkfeZdksa dk izf'k{k.kA
• ued ds ekudksa dks cuk, j[kuk rFkk ued dh xq.koRrk esa vfHko`f}A
• vk;ksMhu;qDr ued dk mRiknu] forj.k vkSj xq.koRrk fu;a=.k dh fuxjkuh gsrq dsUnzh; vfHkdj.k ds :i esa dk;Z djuk A
• foHkkxh; Hkwfe dk izcU/kuA
• fodkl vkSj Jfed dY;k.k Ldheksa ds fu"iknu ds fy, ;kstuk cukuk vkSj fuxjkuh laca/kh dk;ZA
• fu;kZr vfHko`f}vkSj tgktksa ij ynkbZ ls iwoZ fujh{k.k djuk A
• ued midj] leuqns'ku 'kqYd]Hkwfe fdjk;k vkSj vU; cdk;ksa dk laxzg djukA
• izkd`frd vkinkvksa ls izHkkfor ued fuekZ.k dk;ksZa dk iquokZl djuk A
ued foHkkx ds dk;ksZa dk foLr`r fooj.k vuqyXud 1-1 esa fn;k x;k gSA
(1)

2.0 HIGHLIGHTS DURING 2013-14
• Production of 230.19 lakh tonnes of salt during 2013-14.
? Export of 59.61 lakh tonnes of salt valuing about Rs 844.40 crore during 2013-14.
• Development and Labour Welfare projects worth Rs.122.4 lakh were executed during 2013-14.
• The production of Iodised Salt was 58.47
lakh tonnes and 55.08 lakh tonnes was
supplied for domestic use against the
target of production & dispatches of 63.0
lakh tonnes fixed by the Health Ministry.
2.29 lakh tones of iodised salt was
exported to foreign countries.
• Government of India has decided to explore possibility of promoting use of double fortified salt with iron & iodine to combat with IDD & anemia in nutritional programme.
• The salient features of Salt Industry are given in Annexure 2.1.
3.0 ADMINISTRATION & VIGILANCE
3.1 Salt Department is headed by the Salt Commissioner with its headquarter at Jaipur (Raj). Under him, there are five Regional Offices located at Chennai, Mumbai, Ahmedabad, Jaipur and Kolkata. The first four are headed by Deputy Salt
2-0 o"kZ 2013&14 dh izeq[k ?kVuk,a %
• o"kZ 2013&14 ds nkSjku 230-19 yk[k Vu ued dk mRiknu gqvk A
• o"kZ 2013&14 ds nkSjku : 844-40 djksM+ ewY; ds 59-61 yk[k Vu ued dk fu;kZr fd;k x;k A
• o"kZ 2013&14 ds nkSjku 122-40 yk[k :i;s dh fodkl o Jfed dY;k.k ifj;kstuk,a fu"ikfnr dh xbZA
• vk;ksMhu;qDr ued dk mRiknu 58-47 yk[k Vu Fkk vkSj 55-08 yk[k Vu vk;ksMhu;qDr ued dh vkiwfrZ ?ksjyw iz;ksx ds fy, dh xbZ tcfd LokLF; ea=ky; }kjk 63-0 yk[k Vu vk;ksMhu;qDr ued ds mRiknu o isz"k.k dk y{; j[kk x;k FkkA 2-29 yk[k Vu vk;ksMhu;qDr ued dks fons'kksa esa fu;kZr fd;k x;kA
• Hkkjr ljdkj us ikS"kf.kd dk;ZØe esa vkbZMhMh ,oa ,uhfe;k dk lkeuk djus ds fy, ykSg ,oa vk;ksMhu lfgr Mcy QksfVZQkbZM ued ds iz;ksx ds lao/kZu dh laHkkouk ryk'kus dk fu.kZ; fy;k gSA
• ued m|ksx dh izeq[k fo'ks"krk,a vuqyXud% 2-1 ij nh xbZ gS A
3-0 iz'kklu o lrZdrk
3-1 ued foHkkx dk eq[;ky; t;iqj ¼jktLFkku½ esa fLFkr gS rFkk blds izeq[k ued vk;qDr gSaA muds v/khu ikap {ks=h; dk;kZy; psUubZ] eqEcbZ] vgenkckn] t;iqj vkSj dksydkrk esa fLFkr gS A izFke pkj dk;kZy;ksa ds izeq[k mi ued vk;qDr
(2)

Commissioners and the last by the Asst. Salt Commissioner. The Iodine Deficiency Disorders Control Division is under the charge of the Deputy Salt Commissioner (NIDDCP) stationed at Head Qrs. Office, Jaipur. Particulars of Offices of Salt Department as on 31.03.2014 are given in Annexure 3.1.
3.2 The details of Quality Control Laboratories are given in Annexure 3.2.
3.3 The total sanctioned strength of the Salt Organization as on 31st March, 2014 is 800 as detailed in Annexure 3.3
3.4 The Public Information Officers (P.I.Os) notified under the Right to Information Act, 2005 in the Salt Commissionerate is detailed in Annexure 3.4. Relevant information has also been made available on the website www.saltcomindia.gov.in.
3.5 The Office of the Salt Commissioner, Jaipur does not have separate Vigilance Branch. Presently the Administration Section is dealing with vigilance cases in general. The Regional Officers of the Salt Department are dealing with the vigilance cases within their competency.
3.6 The administration of the Salt Department continued to remain under overall control of Shri, M.A. Ansari, Salt Commissioner.
3.7 Implementation of Reservation Policy for SC,ST & OBC in the Salt Department :
The reservation policy in direct recruitment and promotion is being followed strictly in this department. The reservation roster is being maintained as per Government of India instructions issued from time to time. The Deputy Salt Commissioner posted in Headquarter & every Regional Office has been appointed as Liaison Officer for implementing reservation policy. The Liaison Officer appointed in the Salt Organisation enforces implementation of reservation policy which is being checked by the Liaison Officer for SC/ST Department of Industrial Policy & promotion, New Delhi. The Ministry has ordered to keep filling up the direct vacancies in abeyance till a decision is taken on ERC recommendation in respect of this department. Therefore, there is no direct recruitment in this department since 2001. The representation of Scs/ STs/ OBCs is as under :-
rFkk vafre dk;kZy; ds izeq[k lgk;d ued vk;qDr gSaA vk;ksMhu vYirk fodkj fu;a=.k izHkkx] eq[;ky; t;iqj fLFkr mi ued vk;qDr ¼jk-vk-v-fo-fu-dk-½ ds izHkkj esa gS A fnukad 31 ekpZ] 2014 dks ued foHkkx ds dk;kZy;ksa dk fooj.k vuqyXud 3-1 esa fn;k x;k gSA
3-2 xq.koRrk fu;a=.k iz;ksx'kkykvksa dk foLr`r fooj.k vuqyXud 3-2 esa fn;k x;k gS A
3-3 ued foHkkx esa 31 ekpZ] 2014 dks dqy dkfeZdksa dh la[;k 800 gS] ftldk fooj.k vuqyXud 3-3 esa fn;k x;k gS A
3-4 lwpuk dk vf/kdkj vf/kfu;e] 2005 ds varxZr vf/klwfpr ued vk;qDrky; ds tulwpuk vf/kdkfj;ksa dk fooj.k vuqyXud 3-4 esa fn;k x;k gS A lEcfU/kr lwpuk osclkbV www.saltcomindia.gov.in ij miyC/k gS A
3-5 ued vk;qDr dk;kZy; t;iqj esa vyx ls dksbZ lrdZrk 'kk[kk dk;Zjr ughaa gS] orZeku esa lkekU; :Ik ls iz'kklu vuqHkkx lrdZrk ekeyksa dks ns[k jgk gSA ued vk;qDrky; ds {ks=h; vf/kdkjh vius vf/kdkj {ks= esa lrdZrk ekeyksa dks ns[k jgs gSA
3-6 xr o"kZ dh Hkkafr] bl o"kZ Hkh Jh ,e-,- vUlkjh] ued vk;qDr ds ikl ued foHkkx dk lEiw.kZ iz'kklfud fu;U=.k jgkA
3-7 ued vk;qDr dk;kZy; esa vuqlwfpr tkfr] vuqlwfpr tutkfr ,oa vU; fiNM+k oxZ ds fy, vkj{k.k uhfr dk fØ;kUo;uA
bl foHkkx esa lh/kh HkrhZ ,oa inksUufr ds fy, vkj{k.k O;oLFkk dk dM+kbZ ls ikyu fd;k tk jgk gSA vkj{k.k jksLVj dk vuqj{k.k ljdkj }kjk le;& le; ij tkjh funsZ'kksa ds vuqlkj fd;k tkrk gSA mi ued vk;qDr tks eq[;ky; ,oa lHkh {ks=h; dk;kZy; esa inLFkkfir gSa] dks vkj{k.k ;kstuk ds dk;kZUo;u gsrq lEidZ vf/kdkjh ds :i esa fu;qDr fd;k x;k gSA ued laxBu esa fu;qDr lEidZ vf/kdkfj;ksa us vkj{k.k uhfr dks izofrZr djk;k ftls vuqlwfpr tkfr@ tutkfr ds fy, lEidZ vf/kdkjh vkS|ksfxd uhfr ,oa lao/kZu foHkkx] ubZ fnYyh }kjk tkapk tk jgk gSA bl foHkkx ds laca/k esa bZ-vkj-lh- dh vuq'kalk ij fu.kZ; gksus rd ea=ky; us lh/kh fjfDr;ksa dh HkrhZ dks LFkfxr j[kus ds vkns'k fn, gSaA blfy,] bl foHkkx esa 2001 ls lh/kh HkrhZ ugha gqbZ gSA vuqlwfpr tkfr;ksa@vuqlwfpr tutkfr;ksa@vU; fiNM+k oxZ dk izfrfuf/kRo fuEu izdkj gS%&
(3)

4.0 ACTS & RULES
4.1 Cess on Salt
Cess on salt is collected under Salt Cess Act, 1953. There was no amendment in the Salt Cess Rules during 2013-14. The concessions in the rate of Cess are given in Annexure 4.1.
4.2 Export Inspection
Quality of salt exported is regulated under
the “Quality Control and Export Inspection
Act, 1963”. Under this Act, Salt
Commissioner has been declared as the
Inspecting Agency for issuing Export
Worthy Certificates for export of salt vide
Notification dated 02.07.1977 (Annexure
4.2). Certain categories of exporters are
exempted from the purview of the above
order vide notification dated 27.07.1991.
4.3 Salt Department Lands
848 acres lands surplus to the requirement
of the 860 has been transferred to other
agencies as per guidelines approved by
the Govt.of India for the disposal of
surplus land. The Department had
identified 2421 acres of land surplus to its
requirement. Transfer of this land to other
agencies including Ministry of New &
Renewable Energy (N&RE) for setting up
solar/wind energy plant.
The Union of India through Salt Commissioner's Organization own about 60587 Acres of Salt pan lands in the states of Andhra Pradesh, Gujarat, Haryana, Himachal Pradesh, Karnataka,
4-0 vf/kfu;e vkSj fu;e%
4-1 ued ij midj
ued midj vf/kfu;e] 1953 ds vUrxZr ued ij midj ,df=r fd;k tkrk gSSA o"kZ 2013&14 ds nkSjku ued midj fu;eksa esa dksbZ la'kks/ku ugha FkkA midj esa NwV dh njsa vuqyXud 4-1 esa nh xbZ gSA
4-2 fu;kZr fujh{k.k
fu;kZfrr ued dh xq.koÙkk ^^xq.koÙkk fu;a=.k vkSj fu;kZr fujh{k.k vf/kfu;e] 1963 ^^ ds vUrxZr vkrh gSA fnukad 2 tqykbZ] 1977 dks tkjh dh xbZ vf/klwpuk ds }kjk bl vf/kfu;e ds rgr ued vk;qDr dks ued fu;kZr ds fy, fu;kZr ;ksX; izek.k&i= tkjh djus ds fy, fujh{k.k vfHkdj.k ?kksf"kr fd;k x;k gS ¼vuqyXud&4-2½A fnukad 27-07-1991 dks tkjh dh xbZ vf/klwpuk ds rgr dfri; Jsf.k;ksa ds fu;kZrdksa dks mDr vf/kfu;e dh ifjlhek ls ckgj j[kk x;k gSA
4-3 ued foHkkx dh Hkwfe
Hkkjr ljdkj }kjk vuqeksfnr vf/k'ks"k Hkwfe ds fuiVku laca/kh fn'kk&funsZ'kksa ds vuqlkj 860 ,dM+ Hkwfe dh vko';drk ds ckn 'ks"k cph gqbZ 848 ,dM+ vf/k'ks"k Hkwfe vU; fudk;ksa dks gLrkarfjr dj nh x;h gSA foHkkx us 2421 ,dM+ Hkwfe dks viuh vko';drk ds ckn vf/k'ks"k Hkwfe ds :i esa fpfUgr fd;k gSA bl fpfUgr Hkwfe dks vU; fudk;ksa dks gLrkarfjr fd;k x;k ftlesa uohu ,oa uohdj.kh; mtkZ ea=ky; ¼,u,aMvkjbZ½ Hkh 'kkfey gS] ftls lkSj@iou mtkZ la;a= LFkkfir djus gsrq Hkwfe gLrkarfjr dh xbZA
Hkkjr ljdkj] ued vk;qDr laxBu ds ekQZr vka/kzizns'k] xqtjkr] gfj;k.kk] fgekpy izns'k] dukZVd] egkjk"Vª] mM+hlk] rfeyukMq o if'pe caxky jkT;ksa es yxHkx 60587 ,dM yo.kh;
(4)
Groups Representation of SCs/Sts/OBCs
Total No. of sanctioned posts
Scs STs OBCs
15 1 1 0 Group ‘B’ 264 32 15 27
Group ‘C’ 113 19 7 14
Group ‘C’MTS 396 93 30 25
Total 788 145 53 66
Group ‘A’
15 1 1 0 264 32 15 27
113 19 7 14
396 93 30 25
788 145 53 66
xzqi vuq- tkfr@vuq- tu tkfr@vU; fiNM+k oxZ dk izfrfuf/kRodqy
LohÑrin
vuq-tkfr
vuq- tu tkfr
vU;fiNM+koxZ
xzqi ^v*xzqi ^c*xzqi ^l*xzqi ^l*,eVh,l
;ksx

Maharashtra, Odisha, Tamil Nadu and West Bengal. Details are given in Annexure 4.3. Salt Department carried out survey and demarcated its land in Andhra Pradesh & Tamil Nadu. It is being done in other states also.
The Ministry of Commerce & Industry, Dept. of Industrial Policy & Promotion, New Delhi v ide their let ter No. 04011/10/2010-Salt dated 24th January, 2012 has conveyed the approval of the competent authority for “Internal Policy Guidelines of the Dept. of Industrial Policy & Promotion, to consider request received from various agencies for transfer of salt pan land owned by the Govt. of India th rough the Off i ce o f the Sa l t Commissioner, at places other than Mumbai and its suburbs, for public purposes”. A copy of which is available at Annexure - 4.4
A special derive for survey of Salt Commissioner organisation, monitoring & prevention of encroachment on land is being carried out.
4.4 Assignment Fee and Ground Rent
4.4.1 The Salt Pan lands are leased for
manufacture of salt in transparent manner
on 'Open Tender' basis. The assignment
fee has been revised to Rs. 100/- per
ton/annum subject to minimum yield per
acre fixed for each State and ground rent
@ Rs. 120/- per acre/annum under M/o C
& I, DIPP letter No. 04014/1/2012-Salt
dated 9-10-2013. Many Writ Petitions have
been filed in the Madras High Court
against the revision of the rate of
Assignment fee from 1.1.2013 (Annexure
4.5).
4.4.2 Review of the policy for renewal of leases
for salt manufacture.
Government has decided that the leases in
respect of Central Government land for
salt manufacture would not be renewed
after expiry of lease period and fresh
tender for the assignment of land for salt
manufacture will be called. The present
lessee on expiry of the existing lease may
participate along with fresh aspirants.
Accordingly issued Resolution No.
04014/1/2012-Salt dated 9-10-2013 by
Hkwfe+ dh ekfyd gS A fooj.k vuqyXud 4-3 es fn;k x;k gSA ued foHkkx us vk/kzizns'k vkSj rfeyukMq esa Hkwfe dk losZ{k.k djk;k rFkk viuh Hkwfe dks lhekafdr fd;kA bl izdkj dk losZ{k.k vU; jkT;kss esa Hkh fd;k tk jgk gSA
okf.kT; ,oa m|ksx ea=ky;] vkS|ksfxd uhfr ,oa lao/kZu foHkkx] ubZ fnYyh us vius i= la-04011@10@2010&lkYV fnukad 24 tuojh] 2012 esa l{ke vf/kdkjh }kjk vkS|ksfxd uhfr ,oa lao/kZu foHkkx dh vkaUrfjd uhfr fn'kk funsZ'kksa dh Lohd`fr lwfpr dh gS ftleas lkYV iSu Hkwfe tks Hkkjr ljdkj }kjk ued vk;qDr dk;kZy; ds ek/;e ls eqEcbZ ,oa vU; miuxjksa ls ijs /kkfjr gS] dks fofHkUu ,tsfUl;ksa dks lkoZtfud mÌs';ksa gsrq gLrkarj.k ls lacaf/kr izkFkZuk ij fopkj djus ls lacaf/kr gSA bldh izfr vuqyXud 4-4 esa miyC/k gSA
fof'k"V ifj.kke izkIr djus ds fy, ued vk;qDr laxBu dk losZ] Hkwfe ij dCts dh fuxjkuh ,oa Hkwfe ij dCtk jksdus ds fy, fd;k tk jgk gSA
4-4 leuqns'ku 'kqYd o Hkwfe fdjk;k
4-4-1 yo.kh; Hkwfe dks yo.k mRiknu gsrq Þ[kqyh fufonkß ds vk/kkj ij yht ij fn;k tkrk gSA izR;sd jkT; ds fy, leuqns'ku 'kqYd U;wure mit izfr ,sdM+ ij fu/kkZfjr Fkh ftls 100@& izfr Vu@okf"kZd ds vk/kkj ij la'kksf/kr fd;k x;k rFkk Hkwfe fdjk, dks okf.kT; vkSj m|ksx ea=ky;] vkS|ksfxd uhfr vkSj lao/kZu foHkkx ds i= la- 04014@1@2012&ued fnuakd 09-10-2013 ds rgr :-120@& izfr ,dM+@okf"kZd dh nj ls la'kksf/kr fd;k x;kA fnukad 01-01-2013 ls leuqns'ku 'kqYd dh nj esa la'kks/ku gksus ds dkj.k enzkl mPp U;k;ky; esa dbZ fjV ;kfpdk;sa nk;j dh xbZA ¼vuqyXud 4-5½
4-4-2 ued mRikndksa ds fy, iV~Vksa ¼yht+½ ds uohdj.k gsrq uhfr dh leh{kkA
ljdkj us ;g fu.kZ; fy;k gS fd dsUnz ljdkj dh ued mRiknu dh tehu ls lacaf/kr iV~Vksa dk vof/k lekfIr ds ckn uohdj.k ugha fd;k tk;sxk rFkk ued mRikndksa ds fy, Hkwfe leuqns'ku gsrq ubZ fufonk vkeaf=r dh tk,xhA orZeku iV~Vk /kkjd py jgs iV~Vs dh vof/k dh lekfIr ds ckn u;s mEehnokj ds :i esa ubZ fufonk esa 'kkfey dks ldrk gSA
rnuqlkj] ladYi la- 04014@2012&ued fnukad 09-10-2013 jkti= vf/klwpuk fnukad
(5)

gazette notification dated 9-10-2013 to this
effect which has been published in Govt of
India Gazette – Part II-Section 3-Sub-
Section (ii) in the weekly gazette of
October 20, 2013 – October 26, 2013.
5.0 METEOROLOGICAL DATA
Production of Salt involves extensive use of renewable sources of energy like wind and solar energy. Weather conditions play an important role in production of salt. Meteorological data at some of the important salt producing centers are indicated in Annexures 5.1 to 5.4.
6.0 PRODUCTION
6.1 India is the 3rd largest salt producing country in the World after China and USA with a production of 230.19 lakh tones during 2013-14. The production of salt in some of the leading countries for the years 2008 to 2012 is given in Annexure 6.1.
6.2 Salt is being produced in 52 districts in the country. The average district wise production is given in Annexure 6.2. Regian/State wise particulars of Salt works including new areas developed for production during 2013-14 are furnished in Annexure 6.3 & 6.4.
6.3 Private sector continues to contribute
significantly in the production of salt. About
91.0 % salt is produced by the Private
Sector. Public / Joint Sector contributed
1.6% and rest 7.4 % by Co-operative
09-10-2013 ds }kjk tkjh fd;k x;k tks fd Hkkjr ljdkj ds jkti= Hkkx &II & [kaM 3&mi [kaM ¼ii½ ess izdkf'kr gqvk rFkk 20 vDVwcj] 2013 &26 vDVwcj] 2013 ds lkIrkfgd jkti= esa izdkf'kr gqvkA
5-0 ekSle lEcU/kh vkadM+s
ued mRiknu esa uohdj.kh; ÅtkZ L=ksrkas dk foLr`r mi;ksx lfUufgr gS A ekSleh n'kk;sa ued ds mRiknu esa vge~ Hkwfedk fuHkkrh gSa A dqN egRoiw.kZ ued mRiknu dsUnzksa ij fy, x, ekSle lEcU/kh vkadM+s vuqyXud 5-1 ls 5-4 esa n'kkZ;s x, gS A
6-0 mRiknu
6-1 o"kZ 2013&14 ds nkSjku 230-19 yk[k Vu ued mRiknu ds lkFk gh Hkkjr vesfjdk o phu ds i'pkr~ fo'o esa rhljk lcls cM+k ued mRiknd ns'k gSA o"kZ 2008 ls 2012 rd dqN vxz.kh ns'kksa dk ued mRiknu vuqyXud 6-1 esa n'kkZ;k x;k gS A
6-2 ns'k ds 52 ftyksa esa ued dk mRiknu gksrk gSA ued dk ftysokj vkSlr mRiknu vuqyXud 6-2 esa n'kkZ;k x;k gSA o"kZ 2013&14 ds nkSjku ued mRiknu ds fy, fodflr fd, x, u, {ks= Hkh 'kkfey gSa tks fd vuqyXud 6-3 ,oa 6-4 esa izLrqr fd;s x;s gSA
6-3 ued mRiknu esa futh {ks= dk egRoiw.kZ ;ksxnku jgkA yxHkx 91-0 izfr'kr ued futh {ks= }kjk mRikfnr fd;k tkrk gSA o"kZ 2013&14 ds nkSjku 1-6 izfr'kr ;ksxnku lkoZtfud
(6)
Salt Field at Chennai

Sector during 2013-14. The State/ Sector-
wise details of production during 2011-12
to 2013-14 are given in Annexures 6.5 to
6.8.
6.4 State wise target and production of
Common Salt for the years 2011-12 to
2013-14 are given in Annexure 6.9.
6.5 The stock of salt as on 30th June, 31st December and 31st March for the years 2012, 2013 & 2014 is given in Annexure 6.10.
6.6 The Average yield of salt per acre at various producing centres during the years 2011-12, 2012-13 & 2013-14 is given in Annexure 6.11.
7.0 CO-OPERATIVE SECTOR
7.1 Co-operative Sector contributed 7.4% of the total production of salt during 2013-14. Particulars of Co-Operative Societies functioning in different salt producing States are given in Annexure 7.1.
@la;qDr {ks= dk jgk rFkk 'ks"k 7-4 izfr'kr ;ksxnku lgdkjh lfefr;ksa dk vkadk x;k gSA o"kZ 2011&12 ls 2013&14 ds nkSjku mRiknu dk {ks=okj@ jkT;okj C;kSjk vuqyXud 6-5 ls 6-8 esa fn;k x;k gS A
6-4 o"kZ 2011&12 ls 2013&14 rd lk/kkj.k ¼vk;ksMhu jfgr½ ued ds mRiknu vkSj y{; dk jkT;okj C;kSjk vuqyXud 6-9 esa fn;k x;k gS A
6-5 o"kZ 2012] 2013 o 2014 esa dze'k% 30] twu] 31 fnlEcj o 31 ekpZ dks ued ds HkaMkj dk C;kSjk vuqyXud 6-10 esa fn;k x;k gS A
6-6 o"kZ 2011&12] 2012&13 o 2013&14 ds nkSjku fofHkUu ued mRiknd dsUnzksa ij ued dh izfr ,dM+ vkSlr iSnkokj vuqyXud 6-11 esa n'kkZbZ xbZ gS A
7-0 lgdkjh {ks=
7-1 o"kZ 2013&14 ess dqy ued mRiknu dk 7-4 izfr'kr ;ksxnku lgdkjh {ks= dk jgkA fofHkUu ued mRiknd jkT;ksa esa dk;Zjr lgdkjh lfefr;ksa dk C;kSjk vuqyXud 7-1 esa ns[kk tk ldrk gS A
(7)
170.19
21.89 24.774.94
194.24
18.2526.70
6.28
180.95
17.01 25.86
0
50
100
150
200
250
STATEWISE PRODUCTION OF SALT
(IN LAKH TONNES)
2011-12 2012-13 2013-14
Gujarat Rajasthan Tamil Nadu Others

8.0 PUBLIC / JOINT SECTOR
UNDERTAKINGS
8.1 Five Public / Joint Sector Undertakings engaged in salt manufacture have accounted for 3.64 lakh tones during the year 2013-14 contributing about 1.6% of the total production of salt in the country. The details are given in Annexure 8.1.
9.0 NATIONAL IODINE DEFICIENCY DISORDERS CONTROL PROGRAMME (NIDDCP)
9.1 Survey conducted by UNICEF & Ministry of Health shows that 71% population in country have access to adequately iodised salt against 51% as per NFHS III survey carried out during 2005-06 & reduction of consumption of non-iodised salt from 34% to 9%. This is a remarkable achievement of Salt Commissioner's Organisation.
9.2 Status of Iodisation in the Country
The NIDDCP launched by the Ministry of Health & Family Welfare Govt. of India envisages prevention & control of Iodine Deficiency Disorders in the Country through supply & consumption of iodised salt in place of common salt for direct human consumption. Salt Department is the Nodal Agency for implementing the programme in as far as it relates to creation of iodisation capacity, monitoring
8-0 lkoZtfud@la;qDr {ks= ds miØe
8-1 o"kZ 2013&14 ds nkSjku ued mRiknu esa dk;Zjr ikap lkoZtfud@la;qDr {ks= ds miØeksa }kjk 3-64 yk[k Vu dk mRiknu fd;k x;k] tksfd iwjs ns'k ds dqy ued mRiknu dk 1-6 izfr'kr FkkA fooj.k vuqyXud 8-1 esa n'kkZ;k x;k gSA
9-0 jk"Vªh; vk;ksMhu vYirk fodkj fu;a=.k dk;ZØe ¼,u-vkbZ-Mh-Mh-lh-ih-½
9-1 ;wfulsQ rFkk LokLF; ea=ky; }kjk djok;s x;s losZ{k.k esa ns'k dh 71% tula[;k dks i;kZIr ek=k esa vk;ksMhuhd`r ued izkIr gksuk ik;k x;k gS tcfd 2005&06 esa fd;s x;s ,u-,Q-,p-,l kkk losZ esa bldk izfr'kr ek= 51% FkkA vk;ksMhujfgr ued dk miHkksx Hkh 34% ls ?kVdj 9% rd vk x;kA tksfd ued vk;qDr laxBu dh ,d fof'k"V miyfC/k gSA
9-2 ns'k esa vk;ksMhuhdj.k dh fLFkfr
ekuo miHkksx ds fy, lk/kkj.k ued dh txg vk;ksMhu;qDr ued dh vkiwfrZ vkSj mi;ksx ds }kjk vk;ksMhu vYirk fodkjksa ¼vkbZ-Mh-Mh-½ ls cpko ,oa fu;a=.k ds iz;kstukFkZ ns'k esa Hkkjr ljdkj }kjk jk"Vªh; vk;ksMhu vYirk fodkj fu;a=.k dk;ZØe] LokLF; ,oa ifjokj dY;k.k ea=ky;] Hkkjr ljdkj }kjk pyk;k x;k gS A vk;ksMhuhdj.k {kerk ds l`tu] mRiknu L=ksrksa ij mRiknu ,oe~ xq.koRrk fuxjkuh vkSj ns'k esa
(8)

STATEWISE PRODUCTION OF IODISED SALT
the production and quality at production sources and equitable distribution in the country. The production of iodised salt, which was 28.34 lakh tonnes during 1992-93, has increased to 58.47 lakh tones during the year 2013-14, moving closer towards the goal of Universal Salt Iodisation (USI).
A state level workshop was held on 13th
June, 2013 regarding State Coalition on
Universal Salt Iodisation under National
Iodine Deficiency Disorder Control
Programme (NIDDCP) at Lucknow, Uttar
Pradesh. In this meeting the Salt
Commissioner reiterated the need for
supply of iodised salt through PDS to
make availability of adequately iodised
salt to BPL families. He also requested
food Safety officers to check the quality of
salt being sold in the state. As a follow up
action to this meeting, IDD cells at Meerat,
Allahabad and Gorakhpur have been
established and a laboratory has been
established. The local officers are
informing the State agencies regarding the
movement of edible salt to the destinations
in UP. At the unloading point, samples
have been drawn by the State officials and
results have been shared with Salt
Department for better monitoring of quality
of the edible salt moved by rail.This
leku forj.k gsrq ued foHkkx dks dsUnzh; vfHkdj.k ¼uksMy ,tsUlh½ ekuk x;k gS A vk;ksMhu;qDr ued dk mRiknu tks 1992&93 ds nkSjku 28-34 yk[k Vu Fkk] tksfd o"kZ 2013&14 esa c<+ dj 58-47 yk[k Vu gks x;k gS] tksfd lkoZHkkSe ued vk;ksMhuhdj.k ds y{; ds djhc gSA
jk"Vªh; vk;ksMhu vYirk fodkj fu;a=.k dk;ZØe ¼,uvkbZMhMhlhih½ ds vUrxZr lkoZHkkSe ued vk;ksMhuhdj.k ij mÙkjizns'k ds y[kuÅ esa fnukad 13 twu 2013 dks ,d jkT;Lrjh; dk;Z'kkyk dk vk;kstu fd;k x;kA bl cSBd esa ued vk;qDr us xjhch js[kk ls uhps ds yksxksa ds fy, tuforj.k iz.kkyh ds }kjk vk;ksMhu;qDr ued ds forj.k ij tksj fn;kA mUgksus [kk| forj.k vf/kdkfj;ksa ls jkT; esa fcdus okys [kk| ued dh xq.koÙkk tkapus dk vkgoku Hkh fd;kA bl cSBd dh vuqorhZ dkjZokbZ ds :i esa esjB] bykgkckn rFkk xksj[kiqj esa vkbZMhMh lsYl dh LFkkiuk dh xbZ rFkk ogka ij ,d iz;ksx'kkyk Hkh LFkkfir dh xbZA mRrj izns'k ds xarO; LFkkuks ij [kk| ued ds lapkyu ls lacaf/kr lwpuk jkT; vfHkdj.kksa dks LFkkuh; vf/kdkfj;ksa }kjk nh tkrh gSA eky mrkjus ds LFkku ij jkT; dkfeZdksa ds }kjk ued ds uewus ,df=r fd, tkrs gSa rFkk jsy }kjk lapkfyr [kk| ued dh xq.koÙkk ij vkSj vf/kd fuxjkuh j[kus ds fy, ,df=r uewuksa ds ifj.kkeksa dks ued foHkkx ds lkFk lk>k fd;k tkrk gSA blds
(9)

resulted in improvement of availability of
adequately iodised salt in U.P.
9.3 Food Safety & Standards Act 2006
(i) Government of India enacted Food Safety & Standards Act 2006 and notified Food Safety & Standards Regulation to monitor/regulate quality of food products including iodised salt. This Act has repealed/replaced Prevention of Food Adulteration Act 1954 and rules made there under.
(ii) As per Ministry of Health and Family Welfare (Food Safety and Standard
ifj.kkeLo:Ik mRrjizns'k esa fu/kkZfjr ek=k ds vk;ksMhu;qDr ued dh miyC/krk esa c<+ksrjh gqbZ gSA
9-3 [kk| lqj{kk ,oa ekud vf/kfu;e 2006 %
¼i½ Hkkjr ljdkj us vk;ksMhu;qDr ued lfgr] lHkh [kk| inkFkksZa dh xq.koÙkk lqfuf'pr djus ds fy;s [kk| lqj{kk ,oa ekud vf/kfu;e] 2006 ikfjr fd;k gS ftlus ^fizosU'ku vkWQ QwM ,MYVjslu ,DV] 1954* rFkk mlds v/khu cuk;s x;s fu;eksa dk LFkku ys fy;k gSA
¼ii½ Hkkjr ljdkj ds LOkkLF; ,oa ifjokj dY;k.k ea=ky; ¼ QwM ls¶Vh ,.M LVS.MMZ vkFkksfjVh vkWaQ bafM;k½ ds }kjk tkjh uksfVfQds'ku ua-
(10)
Meeting at Lucknow on quality monitoring of edible Salt-2013
Salt Refinery

Authority of India) Notification No. 2-15015/30/2010 dated 1st August, 2011, published in Part of III – Section 4 of the Gazette of India : Extraordinary, all food business Operators in the country will be registered or licensed in accordance with the procedure laid down in Food Safety and Standard (Licensing and Registration of Food Business) regulations, 2011.
9.4 As on 31st March 2014, 777 Salt iodisation units have been established with a capacity of about 222.43 lakh tones per annum. This capacity is more than sufficient to meet the edible salt requirement of the country which is estimated at 62.68 lakh tonnes. Consumer's preference for refined/ washed iodised salt has resulted in i n c r e a s e i n t h e p r o d u c t i o n o f refined/vacuum iodised salt. During the year 2013-14, the production of refined salt was 34.22 lakh tones as compared to 34.64 lakh tones during last year 2012-13. The state-wise Target, production and supply of iodised salt, refined / vacuum iodised salt and number of salt Iodisation plants/refineries installed are furnished in Annexures 9.1 to 9.4.
2&15015@30@2010 fnukad 01 vxLr] 2011 tksfd xtsV vkWQ bafM;k ds ikVZ III & lsD'ku 4 esa izdkf'kr gqvk] ds vuqlkj & Þns'k ds lHkh [kk| inkFkksZa ds O;kikfj;ksa dks QwM ls¶Vh ,.M LVS.MMZ ¼[kk| O;kikj jftLVsª'ku o ykblsal tkjh djus okys½ fu;e] 2011 ds vUrxZr viuk jftLVsª'ku djokuk rFkk ykblsal izkIr djuk vko';d gSA
9-4 31 ekpZ] 2014 dks yxHkx 222-43 yk[k Vu okf"kZd {kerk dh 777 ued vk;ksMhuhdj.k bdkb;kWa LFkkfir gks pqdh gSa A ;g {kerk ns'k dh [kk| ued dh 62-68 yk[k Vu vkadfyr vko';drk dh rqyuk esa vf/kd gSA miHkksDrkvksa }kjk ifj"d`r@LoPN vk;ksMhu ued dks izkFkfedrk fn;s tkus ds dkj.k ifj"d`r@fuokZr okf"ir vk;ksMhu ued dk mRiknu c<+k gSA o"kZ 2012&13 ds 34-64 yk[k Vu dh rqyuk esa o"kZ 2013&14 esa 34-22 yk[k Vu ifj"d`r@LoPN ued dk mRiknu gqvk gSA jkT;okj vk;ksMhu;qDr ued] ifj"d`r@fuokZr~ okf"ir vk;ksMhu;qDr ued ds y{;] mRiknu vkSj vkiwfrZ] rFkk laLFkkfir ued vk;ksMhuhdj.k la;a=@ifj"dj.kh;ksa dh la[;k vuqyXud 9-1 ls 9-4 esa nh xbZ gS A
(11)
mRrjh Hkkjr dh lcls cMh lkYV fjQkbZujh txUukFk dseQqM izk-fy-dh teZu fufeZr e'khuks dk voyksdu djrs >kj[k.M ljdkj o ;qfulsQ ds izfrfuf/k

9.5 Double Fortified Salt (DFS)
Principal Secretary to the Prime Minister took a meeting on 18th April, 2011 and asked the DIPP/Salt Commissioner to work with the private industries and cooperatives to promote manufacture of iron fortified iodised salt (DFS). They further directed that DIPP will also explore the possibility of taking up Scheme to promote capi ta l investment and technology up gradation so that installed capacity for producing iron fortified iodised salt in the country is substantially stepped up.
As a follow up action of the decision, Salt Commissioner had two consultation meetings with the salt producers of Gujarat and Tami l Nadu a longw i th t he representative of the NIN, Hyderabad. The industry has raised several issues relating to cost of chemicals to be used for fortification, its availability, working capital requirement for undertaking this scheme, creation of public awareness, training facilities etc.
The expert committee to discuss issues on DFS held on 2.11.2011 at New Delhi, Planning Commission had asked the Ministry of Health & Family Welfare, New Delhi to appraise of the developments in the field of double fortified salt and to develop an action plan on introduction of DFS across the country. No decision is taken by Ministry of Health & Family Welfare till date.
9.6 Policy for Registration of Iodisation Units and transportation of edible salt by rail
Framing of new Transportation Policy - The new Transport Policy for the movement of non-refined iodised salt under railway priority 'c' is framed under which the capacity of salt iodisation plants is delinked with the consent of common salt producers and would be based on actual subject to the installed capacity of the iodisation plant.
There was no change in the policy of the Government in registration of Salt iodisation plants at the manufacturing and consuming centres. However, permission
9-5 nqgjk iq"Vhd`r ued ¼Mcy QksfVZQkbM lkYV½ %&
iz/kkuea=h ds iz/kku lfpo us fnukad 18 vizSy] 2011 dks ,d cSBd yh rFkk MhvkbZihih@ued vk;qDr dks vkbZju QksVhZQkbM vk;ksMhu;qDr ued ¼Mh,Q,l½ ds fuekZ.k dks c<+kok nsus ds fy, futh m|ksxksa rFkk lgdkjh lfefr;ksa ds lkFk dke djus ds fy, dgkA mUgksusa vkxs funs'k fn, fd MhvkbZihih iwath fuos'k vkSj izkS|ksfxdh mUu;u dks c<+kok nsus ds fy, laHkkoukvksa dks ryk'ksxk rkfd ns'k esa vkbZju QksVhZQkbM vk;ksMhu;qDr ued ds mRiknu ds fy, LFkkfir {kerk dks c<+k;k tk ldsA
fu.kZ; dh ,d vuqorhZ dkjZokbZ ds :i esa] ued vk;qDr us ,uvkbZ,u] gSnkjkckn ds izfrfuf/k;ksa ds lkFk xqtjkr vkSj rkfeyukMq ds ued mRikndksa ds lkFk nks ijke'kZ cSBdsa dhA ued m|ksx us QksVhZfQds'ku esa bLrseky fd, tkus okys jlk;uksa dh dher] budh miyC/krk] bl ;kstuk dks pykus ds fy, dk;Z'khy iwath dh vko';drk] lkoZtfud tkx:drk dk l`tu] izf'k{k.k lqfo/kkvksa bR;kfn ls lacaf/kr dbZ eqn~nksa dks mBk;kA
Mh,Q,l ds eqÌksa ij ppkZ djus ds fy, fo'ks"kK lfefr dh cSBd fnukad 02-11-2011 dks ubZ fnYyh esa vk;ksftr dh gqbZA ;kstuk vk;ksx us Mcy QksfVZQkbZM ued ds {ks= esa fodkl dk ewY;kadu djus rFkk ns'k Hkj esa Mh,Q,l ds ckjs esa tkudkjh iznku djus ds fy, ,d dk;Z ;kstuk fodflr djus ds fy, ds fy, LokLF; vkSj ifjokj dY;k.k ea=ky;] ubZ fnYyh dks dgkA LokLF; vkSj ifjokj dY;k.k ea=ky; us vkt rd bl fo"k; ij dksbZ fu.kZ; ugha fy;k gSA
9-6 vk;ksMhuhdj.k bdkb;ksa ds iathdj.k dh uhfr rFkk [kk| ued dk jsy }kjk ifjogu
ubZ ifjogu uhfr dk <kapk rS;kj djuk& vifj"d`r vk;ksMhu ;qDr ued ds jsyos vxzrk Js.kh ̂lh* ds v/khu lapyu ds fy, ubZ ifjogu uhfr rS;kj dh xbZ ftlesa lkekU; ued mRikndksa dh lgefr ds lkFk vk;ksMhuhdj.k la;a=ksa dh {kerk dks de fd;k x;k rFkk ;g vk;ksMhuhdj.k la;a= dh okLrfod laLFkkfir {kerk ij vk/kkfjr gksxkA
mRiknu vkSj miHkksx dsUnzksa ij ued vk;ksMhuhdj.k la;a=ksa dh vuqefr fn, tkus dh ljdkj dh uhfr esa dksbZ ifjorZu ugha gqvk gS A
(12)
for establishing salt iodisation plant at consuming centres was granted on the specif ic recommendations of the concerned State Governments.
9.7 Potassium Iodate Manufacture
Potassium Iodate, used for fortifying salt with iodine is produced indigenously, however, Iodine, the basic raw material for its production, is imported. 13 Potassium Iodate manufacturing units are registered with the department. There was substantial reduction in the price of KIO3 during 2013-14
10.0 DISTRIBUTION OF SALT
10.1 The supply of edible salt to various
States/Union Territories during 2013-14 is
given in Annexure 10.1. The state-wise
salt loading stations are given in
Annexure 10.2. A total quantity of 165.48
lakh tones of salt consumed for edible and
industrial use in the country during 2013-
14. The State-wise movement of salt from
p r o d u c t i o n s o u r c e s t o v a r i o u s
States/Union Territories by rail, road and
sea for human consumption are furnished
in Annexures 10.3, 10.4 & 10.5.
Supply of salt was satisfactory and no
scarcity was reported from anywhere in
the country.
10.2 SUPPLY OF SALT FOR INDUSTRIAL
CONSUMPTION
Salt is extensively used in various industries like Caustic Soda, Soda Ash, soaps & detergents, chemicals, water softening plants, dyes etc. The Chlor-Alkali industries, however, are the major consumer of salt. Various Industries in the country consumed 110.05 lakh tones of salt during the year 2013-14 as against 114.38 lakh tonnes in 2012-13. The consumption by Chlor-Alkali Industries (i.e. for production of Caustic Soda & Soda Ash) was 85.14 lakh tones during the year 2013-14 as against 86.26 lakh tones in 2012-13. The details of Soda Ash & Caustic Soda production are given in Annexure 11.1.
11.0 By - Products
11.1 The major by-products recovered in the
Salt Industry are Gypsum, Bromine,
rFkkfi] miHkksDrk dsUnzk s a ij ued vk;ksMhuhdj.k la;a= LFkkfir djus ds fy, vuqefr lacaf/kr jkT; ljdkj dh fo'ks"k vuq'kalk ij gh nh tkrh gS A
9-7 iksVsf'k;e vk;ksMsV fofuekZ.k
ued vk;ksfMuhdj.k izfØ;k esa iz;qDr gksus okys jlk;u iksVsf'k;e vk;ksMsV dk mRiknu ns'k esa gh gksrk gS] ;|fi ewyHkwr dPps inkFkZ vk;ksMhu dk vk;kr fd;k tkrk gSA orZeku esa 13 iksVsf'k;e vk;ksMsV fofuekZ.k bdkbZ;ka foHkkx esa iathd`r gSA o"kZ 2013&14 ds nkSjku iksVkf'k;e vk;ksMsV dh dher esa i;kZIr :i ls deh gqbZ gSA
10-0 ued dk forj.k
10-1 fofHkUu jkT;ksa@la?k 'kkflr izns'kksa dh o"kZ 2013&14 esa ued dh vkiwfrZ vuqyXud 10-1 esa nh xbZ gS A jkT;okj ued ynku LVs'kuksa dh tkudkjh vuqyXud 10-2 ij nh xbZ gSA o"kZ 2013&14 ds nkSjku 165-48 yk[k Vu ued dh dqy ek=k dk miHkksx ns'k esa [kkus o vkS|ksfxd iz;ksx esa gqvkA ued dh jkT;okj [kk| vkSj vkS|ksfxd mi;ksx ds fy, jsy] lMd o leqnzh ekxZ ds }kjk mRiknu dsUnzksa ls fofHkUu jkT;ksa@la?k 'kkflr izns'kksa dks Hksth xbZ ek=k dk fooj.k vuqyXud 10-3]10-4 o 10-5 esa fn;k x;k gSA
ns'kHkj esa ued dh vkiwfrZ larks"ktud jgh vkSj dgha ls Hkh miyC/krk esa deh dh fjiksVZ izkIr ugha gqbZ gSA
10-2 vkS|ksfxd miHkksx gsrq ued dh vkiwfrZ
dkfLVd lksMk] lksMk ,s'k] lkcqu o iz{kkyd ¼fMVjtsUV½] jlk;u] ty e`nqdj.k la;a=] jaxkbZ vkfn fofHkUu m|ksxksa esa ued dk O;kid mi;ksx fd;k tkrk gS A rFkkfi Dyksj&vYdyh m|ksx ued dk lcls cM+k miHkksDrk gS A ns'k esa fofHkUu m|ksxksa }kjk o"kZ 2012&13 ds 114-38 yk[k Vu dh rqyuk esa o"kZ 2013&14 esa 110-05 yk[k Vu ued dk miHkksx fd;k x;k A o"kZ 2012&13 ds 86-26 yk[k Vu dh rqyuk esa o"kZ 2013&14 esa 85-14 yk[k Vu dk miHkksx Dyksj* vYdyh m|ksxksa ¼vFkkZr dkfLVd lksMk o lksMk ,s'k ds mRiknu ds fy;s ½ }kjk fd;k x;kA foxr o"kksZ esa mRikfnr dkfLVd lksMk o lksMk ,s'k dk C;kSjk vuqyXud 11-1 esa fn;k x;k gSA
11-0 mi&mRikn
11-1 ued m|ksx ls izfrizkIr izeq[k mi&mRikn ftIle] czksehu] eSXuhf'k;e DyksjkbM o
(13)

Magnesium Chloride and Magnesium
Sulphate. The details of the By-Products
recovered are given in Annexure 11.2.
12.0 EXPORTS
12.1 Exports of salt have been brought under
Open General License (OGL) with effect
from 25th August,1987 vide Ministry of
Commerce, New Delhi, Export Trade
Control Public Notice No. 26 –ETC (PN)/
87 dated 25th August, 1987. The Ministry
of Commerce, Government of India, vide
Notification No. 482(E) dated 25th July,
1991 has exempted certain categories of
exports from compulsory pre-shipment
inspection. (Annexure 12.1).
12.2 A quantity of 59.61 lakh tones of salt valuing at Rs. 844.40 crore was exported during 2013-14 as against 50.04 lakh tones valuing about Rs. 679.44 crore during 2012-13. The details of country / port-wise export of salt are given in Annexure 12.2, 12.3 & 12.4.
13.0 IMPORTS
The Government of India has been allowing import of rock salt from Pakistan with effect from 24th May, 1978 under Open General License (OGL). A quantity of 17273 tones of salt valued at Rs. 6.78 crore was imported during 2013-14 as against 18105.6 tones valued at Rs 5.23 crore during 2012-13 as detailed in Annexure 13.1.
14.0 QUALITY MONITORING
eSXuhf'k;e lYQsV gSaA ued ls izkIr mi&mRiknksa dk C;kSjk vuqyXud 11-2 esa fn;k x;k gS A
12-0 fu;kZr
12-1 okf.kT; ea=ky;] ubZ fnYyh ds fu;kZr O;kikj fu; a=.k lko Ztfud l wpuk l a[;k 26&bZVhlh@¼ih,u½ @87 fnukad 25 vxLr] 1987 ds }kjk ued ds fu;kZr dks fnukad 25 vxLr] 1987 ls eqDr lkekU; ykblsal ¼vks-th-,y-½ ds vUrxZr yk;k x;k gSA okf.kT; ea=ky;] Hkkjr ljdkj us vf/klwpuk la-482 ¼bZ½ fnukad 25 tqykbZ] 1991 }kjk dfri; Jsf.k;ksa ds fu;kZrdksa dks tgktksa esa ued ynku ls iwoZ fujh{k.k lEcU/kh vfuok;Zrk esa NwV nh gSA vuqyXud 12-1 ij ns[kh tk ldrh gS A
12-2 o"kZ 2012&13 ds nkSjku :- 679-44 djksM+ ewY; ds 50-04 yk[k Vu dh rqyuk esa o"kZ 2013&14 esa :- 844-40 djksM+ ewY; ds 59-61 yk[k Vu ued dh ek=k dk fu;kZr fd;k x;k A ued fu;kZr dk jk"Vª vkSj cUnjxkg&okj fooj.k vuqyXud 12-2] 12-3 o 12-4 esa fn;k x;k gS A
13-0 vk;kr
Hkkjr ljdkj us eqDr lkekU; ykblsUl ¼vksth,y½ ds vUrxZr 24 ebZ]1978 ls ikfdLrku ls pÎkuh ued vk;kr djus dh vuqKk nh gS A o"kZ 2012&13 esa :- 5-23 djksM+ ewY; ds 18105-6 Vu ued ds vk;kr dh rqyuk esa o"kZ 2013&14 esa :- 3-63 djksM+ ewY; dk 12584 Vu ued vk;kr fd;k x;k tk sfd vuqyXud 13-1 esa n'kkZ;k x;k gS A
14-0 xq.koRrk fu;a=.k
(14)
Salt Upgradation Unit (Washery) at Orissa

14-1 ued dh xq.koRrk dks c<+kus ds fy, ued mRikndksa esa tkx:drk iSnk djus ds fujUrj iz;kl fd;s x;s A Dyksj ,Ydyh m|ksx] fu;kZr rFkk [kk| mÌs'; dh vko';drkvksa dh iwfrZ ds fy, dPps ued dh xq.koRrk es lq/kkj gsrq ued /kksou@ifj"dj.k la;a= LFkkiuk ckcr ued mRikndksa dks izksRlkfgr fd;k x;k A ued vk;qDrky; us fuokZr vk;ksMhu ued lfgr ifj'kksf/kr ued mRiknu ds fy, 124-96 yk[k Vu okf"kZd mRiknu {kerk ds 112 ued /kksou@ifj'kks/ku la;a=ksa dh LFkkiuk dks izksUur fd;k gS A
fuokZr okf"ir lfgr ifj"d`r vk;ksMhu ued dk mRiknu o"kZ 2012&13 esa 34-64 yk[k Vu Fkk tcfd ;g o"kZ 2013&14 esa 34-21 yk[k Vu gqvk gSA Hkkjrh; ekud C;wjks ¼ch-vkbZ-,l½ us vk;ksMhu;qDr ued dh fof'kf"V;ksa dks la'kksf/kr fd;k gS rFkk vkbZ-,l- 7224%2006 ds rgr fuokZr okf"ir ¼ oSD;we boSiksjsVsM ½ ued o ifj"d`r vk;ksMhu ued ds u, ekinaM izfrikfnr fd;s gS A fooj.k vuqyXud 14-1 esa fn;k x;k gS A
14-2 Mcy QksfVZQkbM ued ds fy, ,Q,l,l, ekunaM dk C;kSjk vuqyXud 14-2 esa fn;k x;k gSA
15-0 ewY;
15-1 ued dh dherksa o miyC/krk dh le; & le; ij fuxjkuh j[kh xbZ o vko';drkuqlkj lq/kkjkRed dne mBk, x, A ued mRiknu ds fofHkUu L=ksrksa ij o"kZ 2013&14 ds nkSjku izpfyr ued ds ,Dl&QSDVªh ,oa ,Q-vks-vkj- dhersa vuqyXud 15-1 ij n'kkZ;h xbZ gaS A
15-2 fofHkUu miHkksDrk dsUnzksa ij o"kZ 2011&12] 2012&13 rFkk 2013&14 esa ued ds [kqnjk ewY; vuqyXud 15-2 ij n'kkZ;s x;s gSa A
15-3 fofHkUu jkT;@dsUnz 'kkflr izns'k lkoZtfud forj.k iz.kkyh ds rgr vk;ksMhu;qDr ued dk forj.k djrs gSa tSlk fd vuqyXud 15-3 esa n'kkZ;k x;k gSA
16-0 fodkl ,oe~ Jfed dY;k.k dk;Z %
16-1 Hkkjr ljdkj us ued vk;qDr dks fodkl@Jfed dY;k.k dk;Z ftldh ykxr 35 yk[k :- rd dh gS] dh laLohd`fr nsus dh 'kfDr iznku dh gSA ued vk;qDr laxBu us fodkl ,oa Jfed dY;k.k ds izLrko dh tkap ds fy, lfefr;ka xfBr dj j[kh gSa rkfd ued vk;qDr
14.1 Concerted efforts were made to create
awareness among the salt manufacturers
for improving the quality of salt. The salt
manufacturers were encouraged to
establish salt washeries / refineries to
upgrade the quality of salt to meet the
requirements of Chlor-Alkali Industry,
exports and for edible purpose. The Salt
Commisionerate has encouraged
establishment of 112 Refineries with
annual capacity of 124.96 lakh tones.
The production of refined iodised salt
including vacuum salt was 34.21 lakh
tones in 2013-14 against 34.64 lakh tones
during 2012-13. The Bureau of Indian
Standards (BIS) has revised the
Specification of Iodised Salt and
formulated new specification for Refined
Iodised Salt and Vacuum Evaporated
Iodised Salt under IS 7224:2006. The
details are given in Annexure 14.1.
14.2 The details of FSSA specification for
double fortified salt are given in Annexure
14.2.
15.0 PRICES
15.1 The prices and availability of salt were monitored periodically and corrective action taken wherever required. The Ex-factory and F.O.R. prices of salt at various salt production sources during the year 2013-14 are given in Annexure 15.1.
15.2 The Retail prices of salt at various consuming centres during the year 2011-12 , 2012-13 & 2013-14 are given in Annexure 15.2.
15.3 Various States/ UTs are distributing Iodised salt through Public Distribution System (PDS) as shown in Annexure 15.3.
16.0 DEVELOPMENT & LABOUR WELFARE WORKS
16.1 Government of India has since delegated power to the Salt Commissioner to sanction development/labour welfare works costing upto Rs. 35 lakhs. Salt Commiss ioner Organ izat ion has constituted committees to examine proposals for the sanction of development
(15)

mudks Lohd`r djus esa l{ke gks ldsA vuqyXud 16-1 ij nh xbZ vkpkj lafgrk ds vuqlkj ued m|ksx dks fodkl ,oa Jfed dY;k.k dk;ksZ ds fy, foRrh; lgk;rk iznku dh tkrh gSA
16-2 ued m|ksx esa fu;ksftr Jfed
Hkkjrh; ued m|ksx vHkh rd Je vfHkeq[kh gSA lHkh izeq[k dk;Z tSls fd D;kfj;ksa dk fuekZ.k] ued fudkyuk] IysVQkeZ ij HkaMkj.k] <sj yxkuk] Vªd@jsYos ds ekyfMCcksa esa ynku vkfn dk;Z Jfedksa }kjk gh fd;s tkrs gSa A ;|fi dqN cM+h ued fofuekZ.k bZdkb;ksa us ;kaf=d iz.kkyh yxk yh gSA vuqekur% 0-85 yk[k ls vf/kd etnwj bl m|ksx esa yxs gq, gS A blds vfrfjDr] ,d yk[k Jfed ued vk;ksMhuhdj.k] ifj"dj.k vkfn dk;ksZa esa yxs gq, gSaA rFkkfi] m|ksx dks Jfedksa dh deh dk lkeuk djuk iM jgk gSA dk;Z dh l[r o tfVy ifjfLFkfr;ka Jfedks dks ued m|ksx ls foeq[k j[krh gSA ued {ks=ksa ds vklikl vkS|ksfxd fodkl ds dkj.k ued Jfedksa dk iyk;u vU; vkS|ksfxd xfrfof/k;kas dh vksj gksus ds dkj.k ued m|ksx o bldh dk;Z'kfDr oafpr gqbZ gSA bl leL;k ds funku gsrq ued ladekasZ ds vk/kqfudhdj.k o ;kaf=dhdj.k dh vko';drk gSA ued m|ksx esa dk;Zjr Jfedksa dh vkSlr la[;k vuqyXud 16-2 esa n'kkZbZ xbZ gSA
and labour welfare to enable Salt Commissioner to sanction them. The Code of Principles governing grant of financial assistance to salt industry for development & labour welfare work are given in Annexure 16.1.
16.2 Labourers Employed in the salt industry
Indian Salt Industry is still labour intensive. All the major operations like preparation of beds, extraction of salt, storing on platforms, stacking of heaps, loading into Railway wagons/ Motor trucks etc. is done manually, however some of the large salt manufacturing units have gone for mechanization. It is estimated that on an average over 0.85 lakh labourers are employed in the industry. Another one lakh labourer are engaged in salt iodisation, refining, handling of salt etc.. Of late, industry is experiencing shortage of labour. Harsh and difficult working condition keeps labour away from the Salt Industry.Industrial developments in the vicinity of salt fields have caused migration of salt workers to other industrial activity, depriving salt industry with its work force. There is a need for modernization & mechanization of salt works to overcome this problem. The average number of laborers employed in the salt industry is given in Annexure 16.2.
(16)
ued mRiknu esa lksyj ,uthZ dk mi;ksx & [kkjk?kksMk

16.3 Development and Labour Welfare Works / Activities
Salt Commissioner is providing financial
a s s i s t a n c e i n p a r t n e r s h i p w i t h
beneficiaries / State Governments for
construction of rest sheds, class rooms
and providing potable water in the salt
works and the area where salt workers
were living.
16.3.1 Children Reward Scheme
As per Scheme approved by the Ministry of
Commerce & Industry for grant of rewards
to 3500 meritorious school children of Salt
Labourers Rs.45 Lakh was sanctioned
keeping provision of 50% awards to female
children during the year 2013-14. Salt
Region-wise details are given below.
16.3.2 General Health-cum-Eye Camps
27 General Health-cum-Eye Camps 'were
organized during 2013-14 for benefit of salt
labourers and their family members with
cent percent assistance from Salt Cess
Proceeds. Medical check-up conducted by
the camps and free medicines were
distributed. The region-wise details is
given below.
16-3 fodkl ,oa Jfed dY;k.k dk;Z@ xfrfof/k;ka
ued vk;qDrky;] ykHkkfFkZ;ksa@jkT; ljdkjksa
dh lk>snkjh ls ued ladeksZa ,oa mu {ks=ksa esa
tgka ued Jfed jgrs gS] esa foJke LFky]
fo|ky;ksa esa dejksa ds fuekZ.k rFkk is;ty
miyC/k djkus ds fy;s vkfFkZd lgk;rk iznku
djrk gSA
16-3-1 Jfedksa ds cPpksa dks ikfjrksf"kd forj.k ;kstuk %&
okf.kT; o m|ksx ea=ky; }kjk izfrikfnr
iqjLdkj ;kstuk ds rgr o"kZ 2013&14 esa ued
etnwjksa ds 3500 izfrHkk'kkyh cPpksa dks dqy jkf'k
:- 45 yk[k forfjr dh xbZ] ftlesa 50 izfr'kr
ikfjrksf"kd dk izko/kku yM+fd;kssa ds fy, j[kk
x;kA ued {ks=&okj fooj.k fuEu izdkj gS %&
16-3-2 lkekU; LokLF; lg us= dSEi
o"kZ 2013&14 ds nkSjku ued dkexkjksa vkSj muds ifjokj ds lnL;ksa ds fy, 27 lkekU; LokLF;&lg&us= dSEi ued midj izkfIr;ksa ls 'kr izfr'kr lgk;rk ds lkFk vk;ksftr fd, x,A bu dSEiksa esa fo'ks"kK MkWDVjksa ds ny }kjk esfMdy tkap dh xbZ ,oa muds }kjk eq¶r nokbZ;ksa dk forj.k Hkh fd;k x;kA {ks=okj fooj.k uhps fn;k x;k gS %&
(17)
Gujarat 1519 18,99,000
Chennai 1120 15,00,000
Rajasthan 705 9,04,000
Kolkata 76 97,000
Mumbai 80 1,00,000
Total 3500 45,00,000/-
RegionsNo. of rewardsallotted during
2013-14
Amountsanctioned(Rs) during
2013-14
cPpksa dh forfjrjkf’kla[;k
xqtjkr 1519 18,99,000
psUubZ 1120 15,00,000
jktLFkku 705 9,04,000
dksydkrk 76 97,000
eqEcbZ 80 1,00,000
dqy 3500 45,00,000
jkT;
2013-14 2013-14

1 Gujarat - 10 Gandhidham 'A',Santalpur,Samakhiyali,Kharaghoda,Halvad,Maliya Miyana,(Haripar)Rajula City,Bhavnagar,Bharuch, Jambusar.
2. Rajasthan - 5 Didwana,Sujangarh,Phalodi,Nawa CityRajas
3. Chennai - 10 Maginopudi,Chinnaganjam South,Covelong, Pakala,Iskapalli, Pundi,Puthalam,Valinokkam,Sevendakulam,Thambikottai
4. Mumbai - 2 Palghar, Karanja
S.No.
Region/State & No. of Camps
Places where GeneralHealth cum-Eye Camp
Organized1 xqtjkr & 10
2 jktLFkku & 5 MhMokuk]
3- psUubZ & 10 eSxhuksiqMh]
4- eqEcbZ & 2 iky?kj] djatk
xka/kh/kke&,] lkaryiqjlkek[;kyh][kkjk?kksMk]gyon] ekfy;k fe;kuk]¼gfjikj½jktqyk flVh]Hkkouxj]Hk:p] tEcwlj]
lqtkux<QykSnh]Ukkoka flVh]jktkl]
fpUukxate nf{k.k]dksoyksx] idkyk]bLdkiYyh] iq.Mh]iqFkkYye]oSyhuksdelsosUMkdqye]FkkEchdksVbZ
Ø-la- {ks=@jkT; ,oa dSEiksa dh la[;k
LFkku
16.3.3 Sports Meets
9 Sports Meets were organized for the
welfare of salt labourers during 2013-14.
The region-wise detail is given below.
16-3-3 [ksydwn izfr;ksfxrk,sa
o"kZ 2013&14 ds nkSjku 09 [ksydwn izfr;ksfxrk,sa ued Jfedksa ds dY;k.k ds fy, vk;ksftr dh xbZA {ks=okj fooj.k uhps fn;k x;k gSA
(18)
Health Camp at Nawa, Rajasthan

S.No. Salt Region & Place where SportsNo. Sports Meets Meets Organized
1. Gujarat - 3 Gandhidham-BDharasanaSingach
2. Rajasthan - 1 Phalodi
3. Chennai - 3 Naupada, VeppolodaiVedaranyam, Parent
4. Mumbai - 1 Palghar
5. Kolkatta - 1 Ganjam Salt Factory
Ø-la- {ks=@jkT; ,oa LFkkuizfr;ksfxrkvksadh la[;k
1 xqtjkr & 3 xka/kh/kke&ch]/kjklukflaxp
2 jktLFkku & 1 QykSnh
3 psUubZ & 3 ukSikMk] osiksyksMbZosnj.;e] ijsUV
4 eqEcbZ & 1 iky?kj
4 dksydkrk & 1 xatke lkYV QSDVªh
16-3-4 ekWMy lkYV QkeZ
ued foHkkx us vkS|ksfxd ued ds ;qfDr;qDr ekudksa dks iwjk djus vkSj vUrjkZ"Vªh; cktkj esa izfrLi/kkZ djus ds fy, ued dh xq.koRrk esa lq/kkj djus ds mnn~s'; ls ued fofuekZrkvksa dks lkekU; :i ls rFkk y?kq ued mRikndksa dks fo'ks"k :i ls f'kf{kr djus ds laxfBr iz;kl fd;s gSaA mM+hlk ds xate vkSj jktLFkku ds ukoka esa cus ekWMy lkYV QkeZ esa csgrj xq.koRrk okys ued ds mRiknu dh rduhdksa dk lQy izn'kZu fd;k x;k gSA ued fuekZrk la?k ds vuqjks/k ij rkfeyukMq ds ejDdue es rhljk ekWMy lkYV QkeZ LFkkfir fd;k tk jgk gSA rkfeyukMq ds ejDdue esa ekWMy lkYV QkeZ dh LFkkiuk ds dk;Z ij 30 yk[k :- dh vuqekfur ykxr vk,xh ftlesa ls 20 yk[k :i;s dh foRrh; lgk;rk ued lsl QaM ls rFkk ckdh 10 yk[k :i;s dh lgk;rk dsUnzh; ued ,oa eSjhu jlk;u vuqla/kku laLFkku ¼lh,l,elhvkjvkbZ½] Hkkouxj ¼lh,l,elhvkjvkbZ dh ,d ;wfuV½ ds }kjk oSKkfud ekuo'kfDr ds :i esa nh tk,xhA
16.3.4 Model Salt Farm
The Salt Department has been making concerted efforts to educate Salt Manufacturers in general and Small Salt Producers in particular for improving the quality of salt to meet the stringent standards of industrial salt and to compete in international market. The Model Salt Farm set up at Ganjam in Odisha and Nawa in Rajasthan have successfully demonstrated the techniques of production of good quality salt in the concerned states. On the request of the Salt Manufacturers Association, the third Model Salt Farm being established at Markanam in Tamil Nadu. The work of establishment of Model Salt Farm at Markanam in Tamil Nadu has been sanctioned for an estimated cost of Rs. 30 lakhs with financial assistance of Rs. 20 lakhs from salt cess proceeds and remaining Rs. 10 lakhs to be borne by the Central Salt & Marine Chemical Research Institute (CSMCRI), Bhavnagar (A CSIR Unit) in form of scientific man power. The
(19)
Sports Meet at Veppaloadai Factory Sports Meet at Phalodi

project is being executed by the CSMCRI, Bhav nagar.
16.3.5 Training for technology upgradation
The Scheme “Training to salt workers for technology upgradation” has been approved by the Ministry of Commerce and Industry, Department of Industrial Policy and Promotion, Government of India and it is going to be implemented during the 12th Plan period. A total number of 200 training programmes costing to Rs.3.00 Crore have been approved to be conducted during the 12th Plan period ending in 2016-17. It was proposed to organize 5 training programme (costing Rs.1.5 lakh each) during the year 2013-14. But owing to some constraints felt locally with regard to the period of training, the proposals were revised reducing the period of training and increasing the number of participants. Owing to the parameters for utilization of Budget grant in the last quarter and in the last month of the last quarter, only one training programme has been organized at Vedaranyam in Chennai Salt Region in the month of March, 2014.
ifj;kstuk dk fu"iknu lh,l,elhvkjvkbZ] Hkkouxj }kjk fd;k tk jgk gSA
16-3-5 izkS|ksfxdh mUu;u ds fy, izf'k{k.k
ÞizkS|ksfxdh mUu;u ds fy, ued dkexkjksa dk izf'k{k.kß ;kstuk dk vuqeksnu okf.kT; vkSj m|ksx ea=ky;] vkS|ksfxd uhfr vkSj lao/kZu foHkkx] Hkkjr ljdkj }kjk fd;k x;k rFkk bls 12oha iapo"khZ; ;kstuk dh vof/k ds nkSjku dk;kZfUor fd;k tk,xkA o"kZ 2016&17 esa lekIr gksus okyh 12oha iapo"khZ; ;kstuk vof/k ds nkSjku 3 djksM+ :i;s dh ykxr okys dqy 200 izf'k{k.k dk;ZØeksa dk vk;kstu fd;k tk,xkA o"kZ 2013&14 ds nkSjku 5 izf'k{k.k dk;ZØe ¼izR;sd 1-5 yk[k :i;s dh ykxr okys½ dk vk;kstu izLrkfor FkkA ysfdu izf'k{k.k dh vof/k ls lacaf/kr dqN LFkkuh; etcwfj;ksa ds dkj.k bu izLrkoksa esa la'kks/ku fd;k x;k ftlesa izf'k{k.k dh vof/k dks ?kVk;k x;k vkSj Hkkxhnkjksa dh la[;k esa c<ksrjh dh xbZA vafre frekgh ds vafre ekg esa ctV vuqnku ds mi;ksx ds ekinaMks ds dkj.k ekpZ] 2014 esa dsoy ,d izf'k{k.k dk;ZØe dk vk;kstu psUubZ ued {ks= ds osnj.;e esa fd;k x;kA
(20)
Training to salt workers for technology upgradation at Vedaranyam

17.0 RECEIPTS & EXPENDITURE
17.1 RECEIPTS
The Cess realization during the year 2013-14 was Rs. 330.44 lakh as against Rs. 348.99 lakh during 2012-13. The Miscellaneous Receipts of the Salt Department which includes Assignment fees, Ground rent etc., during the year 2013-14 amounted to Rs. 289.70 lakh as against Rs. 274.28 lakh during 2012-13. The details are given in Annexure 17.1 & 17.2.
17.2 Expenditure
The Expenditure during 2013-14 was Rs. 2717.82 lakh as against Rs. 2611.83 lakh in 2012-13, which includes an expenditure of Rs. 122.42 lakh on Development & Labour Welfare works. The details are given in Annexure 17.1, 17.3 & 17.4.
18.0 O T H E R A C T I V I T I E S O F T H E DEPARTMENT
18.1 I N T E R N A T I O N A L / N A T I O N A L WORKSHOPS / SYMPOSIUM/TRAININGPROGRAMMES
1. Work shop National consultation to
develop State level strategies for
strengthening the supply chain of
adequately iodised salt in select
sates in India at Centre for
Community Medicine, AIIMS, New
Delhi 27-28 April, 2013.
2. MIS Training conducted by VB Soft
Officials to the Staff Members of Salt
Department
3. To review salt iodisation programme
in India with AIIMS, UNICEF, GAIN,
ICCIDD with special reference to
carry out a study on retention of
iodine in poly packed iodised salt with
passage of time, 23.7.2013,
4. Workshop held on 13 June 2013
regarding State Iodisation under
National Iodine Deficiency Disorder
Control Programme at Lucknow
(U.P).
17 izkfIr;ka ,oa O;;
17-1 izkfIr;ka
o"kZ 2012&13 ds 348-99 yk[k midj dh izkfIr dh rqyuk esa o"kZ 2013&14 ds nkSjku midj izkfIr :- 330-44 yk[k jghA fofo/k izkfIr;ka ftlesa ,lkbuesaV ¼leuqnsf'kr½ Qhl o Hkwfe fdjk;k bR;kfn 'kkfey gS] o"kZ 2012&13 esa :i;s 274-28 yk[k dh rqyuk esa o"kZ 2013&14 esa :Ik;s 289-70 yk[k jghA foLr`r C;kSjk vuqyXud 17-1 vkSj 17-2 ij fn;k x;k gS A
17-2 O;;
o"kZ 2012&13 esa :i;s 2611-83 yk[k dh rqyuk esa o"kZ 2013&14 ds nkSjku O;; :- 2717-82 yk[k jgk ftlesa 122-42 yk[k :i;s dk O;; fodkl o Jfed dY;k.k xfrfof/k;ksa gsrq fd;k x;kA fooj.k vuqyXud 17-1] 17-3 o 17-4 esa fn;k x;k gS A
18-0 foHkkx dh vU; xfrfof/k;ka
18-1 vUrZjk"Vªh;@jk"Vªh; dk;Z'kkyk,a@xks"Bh@izf'k{k.k dk;ZØe
1- lsaVj QkWj dE;wfuVh esfMflu] vf[ky Hkkjrh; vk;qZfoKku laLFkku] ubZ fnYyh esa fnukad 27&28 vizSy] 2013 dks ,d dk;Z'kkyk dk vk;kstu fd;k x;k ftldk fo"k; ßHkkjr ds pqfuank jkT;ksa esa vk;ksMhu;qDr ued dh i;kZIr vkiwfrZ dks lqn`< cukus ds fy, jkT; Lrjh; j.kuhfr dks fodflr djus gsrq jk"Vªh; ijke'kZÞ jgkA
2- ued foHkkx ds LVkWQ ds fy, oh-ch- lkWQ~V dkfeZdksa }kjk vk;ksftr ,e-vkbZ-,l- izf'k{k.k
3- vf[ky Hkkjrh; vk;qfoZKku laLFkku] ;wfulsQ] xsu] vkbZlhlhvkbZMhMh ds lkFk fo'ks"k lanHkZ esa vk;ksMhu dh vo/kkj.kk ij v/;;u djus rFkk vk;ksMhu ;qDr ikWyhiSd ued ls laacaf/kr ued vk;ksMhuhdj.k dk;ZØe dh leh{kk dh xbZA
4- jk"Vªh; vk;ksMhu vYirk fodkj fu;a=.k dk;ZØe ds rgr jkT; vk;ksMhuhdj.k ls lacaf/kr ,d dk;Z'kkyk fnukad 13 twu] 2013 dks y[kuÅ ¼m-iz-½ esa vk;ksftr dh xbZA
(21)

Name of the office
Dates of Training
No. of persons took training
HQ/Regional/Divisional/Circle Offices covered
Office of ASCTuticorin
19th to 21st
Aug., 2013
16 Persons
All Factory Officers & Lab.Inspector
Circle Office, Humma
23rd to 25th July, 2013
3 Persons
Staff of Kolkata Region
Circle Office, Bhavnagar
9th to 11 th
July, 2013
9 Persons
All factory officers & STL staff of Bhavnagar, Jamnagar Rajula, Mithapur, Singach&Dharsana
Regional office, Mumbai
18th to 20th June, 2013
26 Persons
All factory officers of Bhayandar, Bhandup &Uran
Circle Office, Dhargandhra
21st May to 23rd
May, 2013
11 Persons
HQ Jaipur
14th to 17th May, 2013
12 Persons
Nawa, Kuchaman, Rajas, Sambhar &Sujangarh Laboratory Staff
Nawa&Phalodi
5 Persons
Divisional office, Jodhpur
6th to 9th
May 2013
PGandhidham'B', Bhavnagar & Bharuch
Office ofDSCChennai
22nd to24th Aug.,2013
22Persons
All FactoryOfficers &Lab.Inspectors
Office ofASCKakinada
27th to29th Aug.,2013
12Persons
All FactoryOfficers &Lab.Inspectors
Again atHQJaipur
25th to27th Nov.,2013
2Persons
Nawa &Pokaran
dk;kZy; dkuke
eaMydk;kZy;]tks?kiqj
eq[;ky;]t;iqj
lfdZydk;kZy;]/kzkxa/kzk
{ks=h;dk;kZy;]eqEcbZ
lfdZydk;kZy;]Hkkouxj
lfdZydk;kZy;]gqEek
lgk;d uedvk;qDrdk;kZy;]rqfrdksjhu
mi uedvk;qDrdk;kZy;]pSUubZ
lgk;d uedvk;qDrdk;kZy;]dkfdukMk
iqu% eq[;ky;]t;iqj esa
izf'k{k.k dh rkjh[k
06&09 ebZ] 2013
14 ls 17 ebZ] 2013
21 ebZ ls 23 ebZ] 2013
18 ls 20 twu] 2013
9 ls 11 tqykbZ] 2013
23 ls 25 tqykbZ] 2013
19 ls 21 vxLr] 2013
22 ls 24 vxLr] 2013
27 ls 29 vxLr] 2013
25 ls 27 uoEcj] 2013
izf'k{k.k izkIr djus okys O;fDr;ksa dh la[;k
5 O;fDr
12 O;fDr
11 O;fDr
26 O;fDr
9 O;fDr
3 O;fDr
16 O;fDr
22 O;fDr
12 O;fDr
2 O;fDr
'kkfey dk;kZy; ¼eq[;ky;@ {ks=h;@ eaMyh;@ lfdZy dk;kZy;½
ukoka rFkk QykSnh
ukoka] dqpkeu]jktkl] lkaHkjvkSj lqtkux<+] iz;ksx'kkyk dk LVkQ
xka/kh/kke ^ch^ Hkkouxj ,oa Hk:p
Hkk;anj] HkkaMwi] vkSj mj.k ls lHkh dkj[kkuk vf/kdkjh
leLr dkj[kkuk vf/kdkjh rFkk Hkkouxj] tkeuxj] jktwyk] flaxp vkSj /kjkluk dk ,l-Vh-,y- LVkWQ
dksydkrk {ks= dk LVkWQ
leLr dkj[kkuk vf/kdkjh rFkk iz;ksx'kkyk fujh{kd
leLr dkj[kkuk vf/kdkjh rFkk iz;ksxk'kkyk fujh{kd
leLr dkj[kkuk vf/kdkjh rFkk iz;ksx'kkyk fujh{kd
ukoka rFkk iks[kj.k
(22)

5. State level workshop for USI at
Conference Hall, Swasthy Bhawan,
Jaipur 21st Oct. 2013.
6. India Salt Conclave - 2014
With coordinated efforts of Salt Commissioner 's Organizat ion Confederation of Indian Industry (CII) organized India Salt Conclave - 2014. on 8th February, 2014 at Chennai. Dr. E.M.Sudharsana Natchiappan, Hon'ble Minister of Sate for Commerce and Industry, Government of India was the Chief Guest of the Conclave. A copy of the recommendations of the Conclave is enclosed. The proceedings of the Conclave would be published later on..
5- ;w-,l-vkbZ- LokLF; Hkou] t;iqj ds lEeysu d{k esa fnukad 21 vDVwcj] 2013 dks ,d jkT; Lrjh; dk;Z'kkyk dk vk;kstu fd;k x;kA
6- bafM;k lkWYV dkWUDyso & 2014 ued vk;qDr laxBu ds leUo;dkjh iz;klksa ls Hkkjrh; m|ksx egkla?k ¼lhvkbZvkbZ½ us 8 Qjojh] 2014 dks psUubZ esa bafM;k lkYV dkWUDyso dk vk;kstu fd;k A MkW- bZ-,e- lqn'kZu ukfp;Iiu] ekuuh; okf.kT; vkSj m|ksx jkT;ea=h] Hkkjr ljdkj dkWUDyso esa eq[; vfrfFk FksA dkWUDyso esa dh xbZ flQkfj'kksa dh ,d izfr layXu gSA dkWUDyso dh dk;Zokgh ckn esa izdkf'kr dh tk,xhA
(23)
USI Meeting at Lucknow
Salt Conclave 2014 - Chennai

7. I n d i a n S a l t M a n u f a c t u r e r Association's in collaboration with GAIN, ICCIDD, UNICEF & SCO organize a multi sectoral workshop on universal salt iodisation at Ahmedabad on 22.11.13.
8. IDD workshop was held on 21st October, 2013 at Swastya Bhawan, Jaipur.
9. “State USI coalition meet” held on 21st October, 2013 at Conference hall, State health Society, Bihar .This meeting was attended by Salt Commissioner.
18.2 The following awareness/ campaigns/ sensitization workshops on NIDDCP were conducted by Salt Department are :
18.2.1 “Bharat Nirman” I.E.C Campaigns: (2013-14)
Bharat Nirman Public Information Campaign was held at Vandavasi of Thiruvanamalai District of Tamil Nadu. A stall was put up at the Campaign displaying various brands of iodised salt and propaganda on the use of iodised salt was carried out by Factory Officers of Chunampet and Markanam Factories who were deputed to the campaign.
18.2.2 Global Iodine Deficiency Disorders Prevention Day was observed in the various Salt Factory/ Circle/ Divisional/ Regional/Head Quarter's level.
7- Hkkjrh; ued fuekZrk la?k }kjk xsu] vkbZlhlhvkbZMhMh] ;wfulsQ rFkk ued vk;qDr laxBu ds lg;ksx ls lkoZHkkSfed ued vk;ksMhuhdj.k ij cgq&{ks=h; dk;Z'kkyk dk vk;kstu fnukad 22-11-2013 dks vgenkckn esa fd;k x;kA
8- vkbZMhMh dk;Z'kkyk dk vk;kstu 21 vDVwcj] 2013 dks LokLF; Hkou] t;iqj esa fd;k x;k A
9- ßjkT; ;w,lvkbZ xBca/ku cSBdÞ 21 vDVwcj] 2013 dks jkT; LokLF; lfefr] fcgkj ds lEeysu d{k esa vk;ksftr gqbZA bl cSBd esa ued vk;qDr us Hkkx fy;kA
18-2 ,uvkbZMhMhlhih ij fuEufyf[kr tkx:drk vfHk;ku@lqxzfgrk dk;Z'kkyk ued foHkkx }kjk vk;ksftr dh xbZ %
18-2-1 ßHkkjr fuekZ.kÞ vkbZ-bZ-lh- vfHk;ku % ¼2013&14½
Hkkjr fuekZ.k lkoZtfud lwpuk vfHk;ku rfeyukMq ds fFk:oUukeyS ftys ds oUMkolh esa vk;ksftr fd;k x;kA vfHk;ku LFky ij ,d LVkWy yxkbZ xbZ ftlesa vk;ksMhuhd`r ued dh fofHkUu fdLeksa dk izn'kZu fd;k x;k rFkk vfHk;ku esa fu;qDr pqueisV vkSj ejdkue dkj[kkuksa ds vf/kdkfj;ksa us vk;ksMhuhd`r ued ds mi;ksx dk izpkj & izlkj fd;kA
18-2-2 fo'o vk;ksMhu vYirk fodkj fuokj.k ¼Xykscy v kb Z M hM h ½ fnol fo f H k U U k ued QSDVªh@lfdZy@eaMy@{ks=h;@eq[;ky; Lrj ij euk;k x;kA
(24)
Multi Sectoral Workshop at Ahmedabad

19-0 jktHkk"kk fgUnh dh miyfC/k;k¡
vkS|ksfxd uhfr vkSj lao/kZu foHkkx] okf.kT; vkSj m|ksx ea=ky;] ubZ fnYyh dh fnukad 22 tqykbZ] 2013 dks vk;ksftr fganh lykgdkj lfefr dh cSBd esa Jh eqgEen vul valkjh] ued vk;qDr rFkk Jh jktchj flag] ofj"B fganh vuqoknd us Hkkx fy;kA blh Øe esa foHkkx dh nwljh fganh lykgdkj lfefr dh cSBd tksfd ekuuh; okf.kT; vkSj m|ksx jkT; ea=h MkW- bZ-,e-,l- ukfPp;Iiu dh v/;{krk esa fnukad 10 tuojh] 2014 dks laiUu gqbZ Fkh mlesa Jh eqgEen vul valkjh] ued vk;qDr] Jh vks- ih- eh.kk] lgk;d ued vk;qDr ¼iz'kklu½] rFkk Jh pUnzs'k dqekj eh.kk] ofj"B fganh vuqoknd us Hkkx fy;kA mDr cSBdksa esa ued vk;qDr dk;kZy;] t;iqj }kjk ljdkjh dkedkt esa fganh dks c<+kok nsus ds laca/k esa fd, tk jgs iz;klksa dks ljkgk x;kA
uxj jktHkk"kk dk;kZUo;u lfefr ¼dsanzh; dk;kZy;½] t;iqj dh fnukad 19-8-2013 dks laiUu 65oha v)Zokf"kZd cSBd esa ued vk;qDr egksn; Jh eqgEen vul valkjh rFkk ofj"B fganh vuqoknd Jh jktchj flag }kjk Hkkxhnkjh dh xbZA blh Øe esa u-jk-dk-l-] t;ij dh 66oha v)Zokf"kZd cSBd tksfd fnukad 24-1-2014 dks vk;ksftr gqbZ] mlesa Jh eqgEen vul valkjh] ued vk;qDr] Jh vks-ih- eh.kk] lgk;d ued vk;qDr ¼iz'kklu½ rFkk Jh pUnzs'k dqekj eh.kk] fganh vuqHkkx izHkkjh us Hkkx fy;kA cSBd esa ued vk;qDr dk;kZy;] t;iqj }kjk jktHkk"kk fganh esa fd, x, dk;ksZa ij larks"k O;Dr fd;k x;kA
dk;kZy; jktHkk"kk dk;kZUo;u lfefr dh cSBdsa izR;sd frekgh ds nkSjku fu;fer :i ls ued vk;qDr dk;kZy;] t;iqj ¼eq[;ky;½ rFkk {ks=h; dk;kZy;ksa esa vk;ksftr dh tkrh gSaA dk;kZy; ds vf/kdkfj;ksa@deZpkfj;ksa dks jktHkk"kk fganh ls lacaf?kr fo"k;ksa ij izf'k{k.k nsus ds mn~ns'; ls fganh dk;Z'kkykvksa dk vk;kstu Hkh fu;fer :i ls fd;k tkrk gSA
19-1 fgUnh i[kokM+s dk vk;kstu
fganh i[kokM+s dk vk;kstu fnukad 13-9-2013 ls 27-9-2013 rd fd;k x;kA bl vof/k ds nkSjku ued vk;qDr dk;kZy;] t;iqj esa fofHkUu izfr;ksfxrk,a tSls fganh fuca/k izfr;ksfxrk] fganh dkO;ikB izfr;ksfxrk] fganh vk'kqokrkZ izfr;ksfxrk] fganh Vad.k izfr;ksfxrk rFkk ,e-Vh-,l- lkekU; Kku izfr;ksfxrk dk vk;kstu fd;k x;k rFkk fotsrkvksa dks udn iqjLdkj ckaVs x,A blh izdkj {ks=h; dk;kZy;ksa esa Hkh fganh i[kokM+s dk vk;kstu fd;k x;kA
ued laxBu dh ,dy if=dk ̂lyksuh^ ds 7osa okf"kZdkad ¼vDVwcj 2012 ls flracj] 2013 rd½ dk izdk'ku fd;k x;k rFkk bldk foekspu fganh i[kokM+s ds nkSjku fd;k x;kA
(25)
fnukad 10 tuojh] 2014 dks ekuuh; okf.kT; vkSj m|ksx jkT;ea=h MkW- bZ-,e- lqn'kZu ukfPp;Iiu egksn; dh v/;{krk esa ubZ fnYyh esa vk;ksftr fganh lykgdkj lfefr dh cSBd

20 izf'k{k.k
20-1-1 ued foHkkx ds dkfeZdksa us fofHkUu fo"k;ksa esa izf'k{k.k izkIr fd;k ftudk fooj.k vuqyXud 20-1 esa izLrqr gSA
21-0 ys[kk ijh{kk izfrosnu
Lkjdkj dks iszf"kr viuh fjiksVZ esa egkfu;a=d ,oa egkys[kkijh{kd ¼lh-,-th-½ us ued vk;qDrky; ds laca/k esa o"kZ 2012&13 ds nkSjku dksbZ fVIi.kh ugha dh gSA
22-0 ys[kk fun'kZu izi=
ued laxBu dk o"kZ 2012&13 dk ys[kk fun'kZu izi= vuqyXud 25-1 ij fn;k x;k gSA
(26)
lalnh; jktHkk"kk lfefr dh vkys[k ,oa lk{; mi lfefr dk fnukad 2 vizSy] 2013 dksujkdkl] t;iqj ds v/;{k o lnL; dk;kZy;ksa ls fopkj&foe'kZ
20.0 TRAINING
20.1.1 Various officials underwent Training in various disciplines are shown in Annexure 20.1.
21.0 AUDIT REPORT
The CAG has not made any observation in their report to Government in respect of Salt Commissionerate during the year 2012-13.
22.0 PROFORMA ACCOUNT
The Proforma Accounts of the Salt Organization for the year 2012-13 is given in Annexure 25.1

vuqyXudANNEXURES


vuqyXudAnnexure 1.1
FUNCTIONS OF SALT DEPARTMENT
ACTS
Administration of Salt Cess Act, 1953 and Rules made thereunder.
TARGETS AND PRODUCTION
Planning for the production of all grades of salt in the country for edible, industrial and export purposes in consultation with the State Governments, Director General of Technical Development, State Trading Corporation, Salt Manufacturers' Associations and the Central Salt & Marine Chemicals Research Institute and maintenance of production record.
TECHNOLOGICAL DEVELOPMENT
Promotion of technological development in all aspects pertaining to Salt Industry.
DISTRIBUTION OF SALT
Rational distribution of salt in the entire country by rail, road/sea in consultation with the Railways, State Governments, and Director General of Shipping and Department of Chemicals and Fertilisers. Formulation and implementation of Zonal Scheme for distribution of salt by rail.
EXPORTS
Promotion of export of salt, pre-shipment inspection and issue of quality control and export-worthy certificates.
PRICE CONTROL
To monitor ex-works and retail price of salt and to initiate appropriate steps to prevent abnormal price rise.
IODISED SALT
Planning production and distribution of iodised salt to meet demands of the entire country under the NIDDCP in consultation with the Ministry of Health and Family Welfare, concerned State Governments and Railways.
STANDARDS
Fixing various grades of salt for different purposes in consultation with the Bureau of Indian Standards.
(29)

QUALITY CONTROL
Maintenance and running of Salt Test Laboratories for improving quality of salt.
DEVELOPMENT AND LABOUR WELFARE WORKS
Administration of Cess proceeds for the development and labour welfare measures as per the provisions of the Salt Cess Act, 1953.
DEVELOPMENT LOANS
Grant of loans for the development of salt works under the Grant of Loans to the licensed manufacturers Rules, 1959. Planning & Execution of development works in the salt factories through the department or through Central/State Government agencies, recommended by the various Regional Advisory Boards and the Central Advisory Board for salt as per code of principles.
RELIEF ON NATURAL CALAMITIES
To assess the damages caused to the salt works due to natural calamities and to work out the financial assistance to be given to the affected salt works in the form of grant of ex-gratia and loans according to the rules.
LANDS AND BUILDINGS
a. Custodian of Central Government (Salt Department) lands in the states of Tamil Nadu, Andhra Pradesh, West Bengal, Orissa, Karnataka, Maharashtra, Gujarat and Rajasthan and leasing them for salt manufacture and other purposes.
b. Maintenance of a large number of residential and non-residential buildings of the Department throughout the country.
REVENUE COLLECTION
Levy and collection of Salt Cess & Assignment Fee, Ground Rent etc. from lessees of Salt Department lands.
CO-OPERATIVE SECTOR
Promotion of Co-operative Societies in the Salt Industry and promotion of labour welfare activities in the salt works.
BY-PRODUCTS
Promoting recovery of by-products of salt industry viz. Gypsum, Bromine, Magnesium Chloride, Sodium Sulphate etc.
TRAINING
Conducting training programmes to improve skills of salt workers, manufacturers, quality control personnels etc.
(30)

2011-12 2012-13 2013-14
vuqyXudAnnexure - 2.1
SALIENT FEATURES OF SALT INDUSTRY
(31)
1 Total area assigned for Acres 609825 612562 615058
Salt Production Hectares 246793 247903 249011
2 Area under Salt Cultivation : Acres 336958 355075 358912
Hectares 136365 143699 145308
3. Production (Lakh Tonnes) i) Public Sector 2.99 3.60 3.64 ii) Private Sector 200.29 221.82 209.46iii) Co-Op. Societies 18.51 20.05 17.09
Total 221.79 245.47 230.19
4. Distribution (Lakh Tonnes) i) Human Consumption : 59.67 59.08 55.43 ii) Export : 37.71 50.04 59.61iii) Industries : 112.89 114.38 110.05
Total 210.27 223.50 225.09
5 Stock at the end of year (Lakh Tonnes) 39.86 51.61 46.34( As on 31st March)
6 IODISED SALT (Lakh Tonnes) i) Production : a) Refined 31.42 34.64 34.22 b) Non-Refined 30.58 27.17 24.25
Total 62.00 61.81 58.47
ii) Supplies (Indigenous) : 59.70 59.14 55.08
Units No. Capacity
7 No. of Iodisation Plants/ Plants 665 97.47Refineries (2011-12) Refineries 112 124.96
Total 777 222.43
8 Receipts (Rs. in Lakhs) i) Cess Collection : 367.03 348.99 330.44ii) Misc. : 230.82 274.28 289.70
Total 597.85 623.27 620.14
9 Expenditure (Rs. in Lakhs).) i) Administration : 2364.9 2490.1 2595.4 ii) Labour Welfare & Development works : 148.2 121.7 122.4iii) Ex-gratia : 0.0 0.0 0.0
Total 2513.10 2611.80 2717.8
10 Namak Mazdoor Awas Yojana (Rs. in Lakhs) 0.00 0.00 1.10
11 NIDDCP (Admn.) - Plan (Rupees in Lakhs) 211.46 219.05 246.43

vuqyXudAnnexure-3.1
ued foHkkx ds fofHkUu dk;kZy;ksa dk fooj.kPARTICULARS OF VARIOUS OFFICES OF THE SALT DEPARTMENT
OFFICE POSTAL ADDRESS TELEPHONETELEX / FAX & E-mail
A HEADQUARTERS
Salt Commissioner, Post Box No.139 Tel/Fax : 0141 - 2705571'Lavan Bhawan' Jaipur 0141 - 27058212-A,Lavan Marg, PIN - 302 001 0141 - 2704598Jhalana Doongri 0141 - 2711379Jaipur (Rajasthan)PIN - 302 004 EPABX: 0141-2709570
E.Mail : [email protected] [email protected] Website : http://www.saltcomindia.gov.in
Pay & Account Officer (Salt) Post Box No.139 0141-2710663'Lavan Bhawan' Jaipur 2-A,Lavan Marg, PIN - 302 001Jhalana DoongriJaipur (Rajasthan)PIN - 302 004
B REGIONS
Deputy Salt Commissioner Post Box No.706 Tel/Fax : 044-28278846
II Block, IInd Floor Chennai 044-2827617126,Haddows Road, PIN - 600 006Shastri Bhawan, Nungambakkam E.Mail : [email protected] (Tamil Nadu) PIN - 600 006
Deputy Salt Commissioner Post Box No. 21 Tel/Fax. 079-27540116Ajanta Commercial Centre Ahmedabad 079-27543687B-Block,4th Floor PIN - 380 014 079-27540116Ashram Road, Ahmedabad (Gujarat) E.Mail : [email protected] - 380 014
Deputy Salt Commissioner Post Box No.1561 Tel /Fax : 022-22671192Exchange Building, Mumbai 022-226115274th Floor, PIN- 400 038 022-22695206Sir Shivsagar Ramgulam Marg,Ballard Estate,Mumbai (Maharashtra) E.Mail : [email protected] 400 038
(32)

Asstt. Salt Commissioner1, Council House Street, Tel/Fax : 033 - 22130337Ground Floor, E-mail : [email protected] , West BengalPIN - 700 001.
C DIVISIONS
Asstt. Salt Commissioner Post Box No.510Salt Department Building, Jamnagar Tel/Fax : 0288-2564639Sumair club road, PIN - 361 001 E-Mail : [email protected] Hathi Colony, Jamnagar (Gujarat)PIN - 361 001
Asstt. Salt Commissioner Post Box No.215 Tel/Fax 02836-233670Gandhidham Chamber of Gandhidham E-mail [email protected] & Industry building, PIN - 370 2011st floor, Plot No.71,Sector No.8,Gandhidham. (Gujarat)PIN - 370 201.
Asstt. Salt CommissionerPithapuram Road,Kakinada, Tel/Fax 0884-2368861East Godavari District, E-mail [email protected](Andhra Pradesh)PIN - 533 003
Asstt. Salt Commissioner80, George Road, Tel/Fax 0461-2320065Tuticorin, E-Mail : [email protected] District,(Tamil Nadu)PIN - 628 001
Asstt. Salt Commissioner480-A, Pal Link Road,Jodhpur (Rajasthan)PIN - 342 008 Tel/Fax 0291-2706874
E-mail [email protected]
D CIRCLES
Superintendent of SaltHumma Salt Circle Tel : 06811-254351Humma Post, E-mail [email protected] : Ganjam, (Orissa)PIN - 761 027
Superintendent of SaltNaupada Salt Circle, Naupada Post Tel : 08945-249731District : Srikakulam E-mail : [email protected](Andhra Pradesh)PIN - 532 211
(33)

Superintendent of SaltPenuguduru Salt Circle Tel : 0884-2334235Guruzanapalli Post, E-mail [email protected] Kakinada, Chemical Road, Karapa Mandal,East Godavari .District,(Andhra Pradesh)PIN - 533 016
Superintendent of SaltCuddalore Salt Circle, Tel : 04142-238002Cuddalore O.T., E-mail [email protected] District,Tamil NaduPIN - 607 003.
Superintendent of SaltTuticorin Salt Circle, Tel : 0461-232041879, George Road, E-mail [email protected],Tuticorin District (Tamil Nadu)PIN - 628 001
Superintendent of SaltChennai Salt Circle, Tel : 044-28271126Vth Block, IIIrd Floor, E-mail : chennaisaltcircleShashtri Bhawan, Nungam bakkam @gmail.com26,Haddows Road,Chennai (Tamil Nadu)PIN - 600 006
Superintendent of SaltUran Salt Circle Tel : 022-27222459Uran PostDistrict : Raigad,Maharashtra,PIN - 400 702.
Superintendent of SaltBhandup Salt Circle Tel : 022-25660688Bhandup (East) E-mail [email protected] (Maharashtra)PIN - 400 042
Superintendent of SaltBhayandar Salt Circle Tel : 022-28192225Near Railway Station, E-mail supdt_bhayandarBhayandar (West) @yahoo.inDistrict : ThaneMaharashtra,PIN - 401 101
(34)

Superintendent of SaltDhrangadhra Salt Circle, Chemical Road Tel/Fax 02754-282679Dhrangadhr Post E-mail [email protected] : Surendranagar,(Gujarat)PIN - 363 315
Superintendent of Salt Tel : 0278-2564378Bhavnagar Salt Circle E-mail
[email protected], Radha KunjNear Ram Mantra Mandir,Kaliya Bid,Bhavnagar (Gujarat)PIN - 364 002
Superintendent of Salt Post Box No. 215 Tel/Fax 02836-233670Gandhidham Salt Circle, Gandhidham E-mail : [email protected] Chamber of PIN - 370 201Commerce & Industry building,1st floor, Plot No.71,Sector No.8,Gandhidham, District : Kutch (Gujarat)PIN-370 201.
Superintendent of Salt Tel/Fax 01586-262716Goraj Chowk, Nawa City, E-mail [email protected] Post Distt : Nagore ( Rajasthan )PIN - 341 509
Deputy Superintendent of Salt,Salt Circle Office, Tel : 04652-257514Sasthan Kovilvilai Post, E-mail [email protected](Via) SuchindrumNagercoil,Kanyakumari District(Tamil Nadu)PIN - 629 704
(35)

vuqyXudAnnexure-3.2
xq.koRrk fu;arz.k iz;ksx'kkyk,saQUALITY CONTROL LABORATORIES
S.No. State/Place Postal address
I. GUJARAT
1. Bharuch Deputy Superintendent of Salt
Salt Test Laboratory
X-2/3, Ashwmegh Building,
Ratan Nagar, Station Road,
Bharuch PIN - 392001.
E-mail: [email protected]
2. Jamnagar Deputy Superintendent of Salt
Salt Test Laboratory
Salt Department Building,
Sumair Club Road,,
Near Hathi Colony,
Jamnagar PIN - 361 001
E-mail : [email protected]
3. Gandhidham Deputy Superintendent of Salt
Salt Test Laboratory
Gandhidham Chamber of
Commerce and Industry Building,
1st floor, Plot No.71,
Sector No.8, Gandhidham (Gujarat)
PIN-370 201.
E-mail : [email protected]
4. Bhavnagar Deputy Superintendent of Salt
Salt Test Laboratory,
C-24, Radhakunj,
Near Ram Mantra Mandir,
Kaliya Bid
Bhavnagar (Gujarat) PIN - 364 001
E-mail : [email protected]
5. Kharaghoda Deputy Superintendent of Salt
Salt Test Laboratory,
Kharaghoda, District : Surendra Nagar
PIN- 382 760
E-mail : [email protected]
6. Halvad Deputy Superintendent of Salt
Salt Test Laboratory,
Opp. Sita Ram Mandir
(36)

Temple, Nr. Vagdva Railway Crossing
Halvad, District : Surendra Nagar
PIN - 363330
E-mail : [email protected]
7. Santalpur Deputy Superintendent of Salt
Salt Test Laboratory,
Santalpur, District : Banaskantha
PIN - 385 350
E-mail : [email protected]
8. Maliya Deputy Superintendent of Salt
Salt Test Laboratory,
Maliya (Miyana)
District : Rajkot
PIN - 363 670
II. RAJASTHAN1. Phalodi Deputy Superintendent of Salt
Salt Test Laboratory,
Phalodi, District : Jodhpur
PIN - 342 301
E-mail : [email protected]
2. Jaipur Deputy Superintendent of Salt
Salt Test Laboratory,
O/o Salt Commissioner,
Lavan Bhawan, 2-A, Lavan Marg,
Jhalana Doongri, P.B.No.139,
Jaipur
PIN - 302 004
3. Nawa City Deputy Superintendent of Salt
Salt Test Laboratory,
O/o Superintendent of Salt,
Goraj Chowk
Nawa City
District : Nagaur.
PIN - 341 509
4. Rajas Inspector of Salt
(Sub laboratory) Nawa Road, Rajas, Distt. Nagaur.
(attached to Nawa) E-mail : [email protected]
III. TAMIL NADU
1. Tondiarpet Salt Test Laboratory
O/o Inspector of Salt
Tondiarpet, Chennai -81
E-mail : [email protected]
(37)
2. Tuticorin Salt Test Laboratory
O/o Asstt. Salt Commissioner,
80, George Road,
Tuticorin, PIN - 628 001.
E-mail : [email protected]
3. Adirampatnam Deputy Superintendent of Salt
Salt Test Laboratory,
Adirampatnam Salt Factory,
District : Thanjavur,
PIN - 614 701
4. Vedaranayam Deputy Superintendent of Salt
Vedaranayam Salt Factory,
Vedaranayam, Distt :Nagapattinam
PIN - 614810
E-mail : [email protected]
5. Veppolodai Deputy Superintendent of Salt
Veppolodai Salt Factory,
Veppolodai,
Tuticorin
PIN - 628 002
6. Marakanam Salt Test Laboratory,
O/o Deputy Superintendent. of Salt,
Marakanam Salt Factory
Marakanam - 604303
E-mail : [email protected]
7. Nagercoil Deputy Superintendent of Salt
Salt Circle Office,
Sansthan Kovililai Post,
Via -Suchindrum, Nagercoil,
District : Kanyakumari
PIN - 629 704
IV. ANDHRA PRADESH
1. Kakinada Salt Test Laboratory
O/o Asstt. Salt Commissioner,
Pithapuram Road
Kakinada, East Godavari Distt.
PIN - 533 003.
E-mail : [email protected]
2. Naupada Salt Test Laboratory,
O/o Superintendent. of Salt,
Naupada Salt Circle, Naupada Post,
District : Srikakulam, PIN - 532 211.
E-mail : [email protected]
(38)

3. Chinnaganjam Salt Test Laboratory,
Chinnaganjam Salt Factory,
Chinnaganjam Post,
Prakasam District, PIN - 523 135
E-mail : [email protected]
V. ODISHA
1. Humma Salt Test Laboratory
O/o Superintendent. of Salt,
Humma Post,
District : Ganjam, PIN - 761 027.
E-mail : [email protected]
2. Bhubaneshwar Inspector of Salt,
Government of India,
Plot No. 37,
Bapuji Nagar,
Bhubaneshwar
Distt: Khurda
PIN - 751 009.
VI. MAHARASHTRA
1. Bhayandar Salt Test Laboratory
Old Circle Office,
Uttam Road,
Bhayandar, Dist. Thane
PIN - 401 101.
VII. WEST BENGAL
1. Contai Inspector of Salt,
Govt. of India,
Contai Salt Bungalow,
P.O.Contai,
District : Purba Midnapur (W.B.)
PIN - 721 401.
2. Kolkata Deputy Superintendent of Salt
Salt Test Laboratory,
O/o Assistant Salt Commissioner
1, Council House Street
Ground Floor,
Kolkata, PIN - 700 001.
E-mail : [email protected]
(39)

vuqyXudAnnexure - 3.3
fnukad 31-3-2014 dks ued foHkkx ds dfeZ;ksa dh la[;kSTRENGTH OF THE SALT DEPARTMENT FOR 2013-2014 AS ON 31.03.2014
S.No. Gr. - A Gr. - B Gr. - B Gr. - C Gr. - C Total
1 Headquarter Gaz Non Gaz Re-clasfd
PlanNon-Plan
2 Ahmedabad Region
PlanNon-Plan
3 Kolkata Region
PlanNon-Plan
4 Chennai Region
PlanNon-Plan
5 Jodhpur Region
PlanNon-Plan
6 Mumbai Region
PlanNon-Plan 3 6 38 18 112 177
Total
PlanNon-Plan
Grand Total
7 Pay & Accts.
PlanNon-Plan
Grand Total
2 1 8 2 5 184 2 34 16 26 82
1 1 9 2 4 172 4 41 18 57 122
0 0 2 0 2 40 2 14 8 29 53
0 0 0 1 0 13 7 81 43 131 265
0 0 5 1 1 70 1 8 4 29 42
0 0 0 0 0 0
3 2 24 6 12 4712 22 216 107 384 741
15 24 240 113 396 788
0 0 0 0 0 00 3 4 4 1 12
15 27 244 117 397 800
(40)

vuqyXudAnnexure - 3.4
LIST OF APPELLATE AND PUBLIC INFORMATION OFFICERS (P.I.O.), THEIR TELEPHONE NO.AS NOTIFIED UNDER RTI ACT - 2005 IN THE SALT ORGANISATION AS ON 31.03.2014
(41)
S.No. Name As per RTI Act CPIO for Phone/Fax/E-mailU/S. 5 & 19(1) Address
1 Sh. M.A. Ansari Apppellate Salt Organisation 0141-2705571Salt Commissioner, Authority [email protected] [email protected]
2 Dr. R.S. Kashyap CPIO CPIO for Chennai 044-28276171 &Assistant Salt Commissioner Region 044-28278846 (Fax)Jaipur. [email protected]
3 Shri H.K. Sharma, CPIO CPIO for Mumbai 022-22671192 (Fax)Deputy Salt Commissioner, Region 022-22611527 &Mumbai 022-22695206
[email protected]@bom.nic.in
4 Sh. R.M. Bunkar, CPIO CPIO for Kolkatta 033-22130337,Superintendent of Salt Region 06811-254351Humma [email protected]
5 Sh. O.P. Meena, CPIO CPIO for Salt 0141-2708116Assistant Salt Commissioner Commissioner's 0141-2711379(Admn.) Office and 0141-2705571 (Fax)
Rajasthan Region [email protected]@nic.in
6 Sh. H.C. Pant, CPIO CPIO for Gujarat 079 - 27540116(Fax)Superintendent of Salt 079-27543687Ahmedabad Region [email protected]
Website : http://www.saltcomindia.gov.in

vuqyXudAnnexure 4.1
MINISTRY OF INDUSTRY
NOTIFICATION
thNew Delhi the 6 June, 1964
S.O. 2167- In exercise of the powers, conferred by Section 6 of the Salt Cess Act, 1953 (49 of 1953), and in suppression of the Salt Cess Rules, 1953 the Central Govt. hereby makes the following rules -
Salt Cess Rules - 1964
--------------------------------------------------------------------------------------------------------------------------------------------------------------------------------------------------------------------------------------
9. Exemption from payment of cess: - In the following cases, salt shall be exempt from payment of cess to the extent specified against each.
(a) Salt exported by sea from India.........the whole.
(b) Salt manufactured by any person or group of persons in a salt work, the area of which does not exceed 4.04686 Hectare......... the whole.
(c) Salt manufactured in a Salt Work by a cooperative society the area held by each individual member thereof being 4.04686 Hectares or less........ the whole.
(d) Salt manufactured in a salt work the area of which exceeds 4.04686, but does not exceed 40.4686...... one half.
(e) Salt manufactured in a salt work by a cooperative society the area held by each individual member thereof being more than 4.04686 Hectare not more than 40.4686 Hectares........ one half.
(f) Salt despatched from India to Nepal through the agencies of the State Trading Corporation of India Ltd., New Delhi and Salt Trading Corporation Ltd., Kathmandu, Nepal...... the whole.
-------------------------------------------------------------------------------------------------------------------
-------------------------------------------------------------------------------------------------------------------
(42)

( TO BE PUBLISHED IN GAZETTE OF INDIA, SECTION 3, SUB-SECTION (II) )
Government of IndiaMinistry of Industry
(Department of Industrial Development).....
thNew Delhi, dated 9 September, 1981
N O T I F I C A T I O N
No. S.O In exercise of the powers conferred by section 6 of the Salt Cess Act, 1953 (4) of 1953), the Central Government hereby makes the following rules further to amend the Salt Cess Rules, 1964, namely :-
1. These rules may be called the Salt Cess (Amendment) Rules, 1981
2. In rule 9 of the Salt Cess Rules, 1964
(i) for clause (a), the following clause shall be substituted, namely :-
"(a) Salt taken out of India to any country outside India by se and if the country is not connected by sea then by rail or road ---------------- the whole."
(ii) clause (f) shall be omitted.
Sd/-- (Puran Chand)
Under Secretary to the Govt. of India
To
The Manager,Government of India Press,Ring Road,New Delhi.
Note : The Salt Cess Rules, 1964 have already been amended vide S.O. No. 4037 th thdated 17 November, 1964, S.O. No. 2038 dated 16 June, 1965, S.O. No. 1519 th thdated 12 May, 1966 S.O. No. 3592 dated 18 November, 1966, and S.O. No.
th2543 dated 27 August, 1973.
(43)
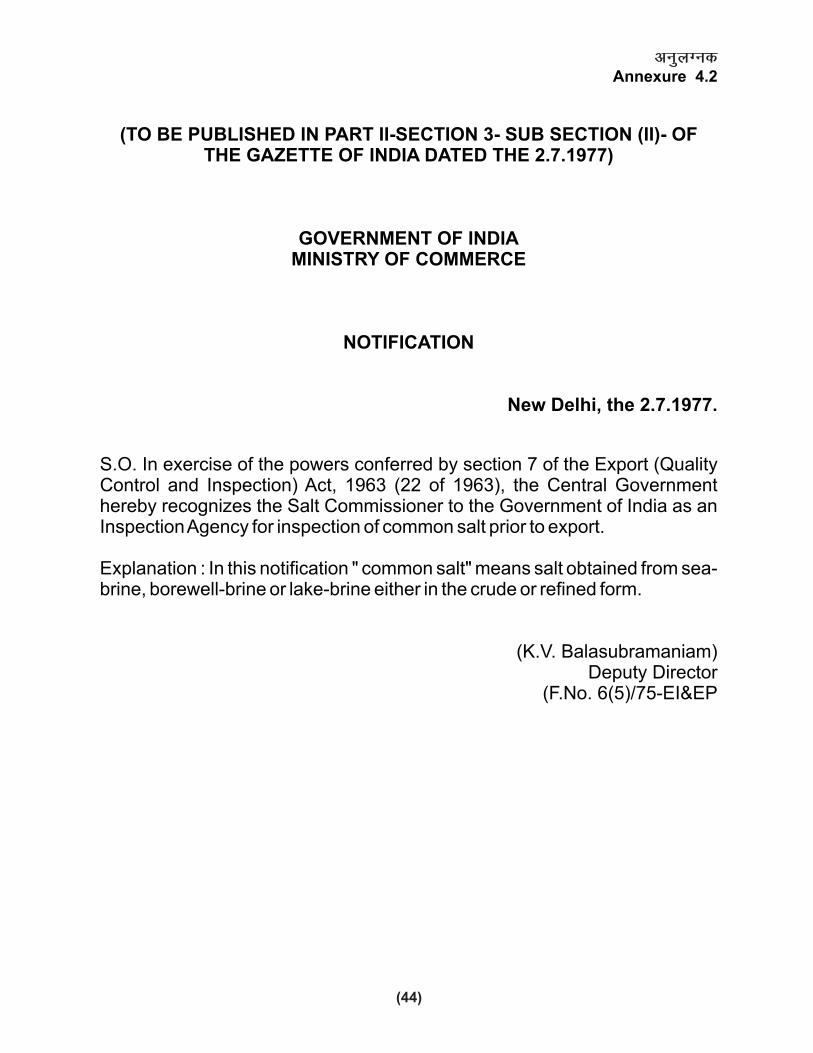
vuqyXudAnnexure 4.2
(TO BE PUBLISHED IN PART II-SECTION 3- SUB SECTION (II)- OF THE GAZETTE OF INDIA DATED THE 2.7.1977)
GOVERNMENT OF INDIAMINISTRY OF COMMERCE
NOTIFICATION
New Delhi, the 2.7.1977.
S.O. In exercise of the powers conferred by section 7 of the Export (Quality Control and Inspection) Act, 1963 (22 of 1963), the Central Government hereby recognizes the Salt Commissioner to the Government of India as an Inspection Agency for inspection of common salt prior to export.
Explanation : In this notification " common salt" means salt obtained from sea-brine, borewell-brine or lake-brine either in the crude or refined form.
(K.V. Balasubramaniam)Deputy Director
(F.No. 6(5)/75-EI&EP
(44)

(45)
DE
TA
ILS
OF
SA
LT
DE
PA
RT
ME
NT
LA
ND
IN
IN
DIA
( In
acr
es )
S
l.N
am
e o
f th
e S
tate
Lan
d u
nd
er
Lan
d u
nd
er
Lan
d u
sed
Lan
d leased
W
aste
d
To
tal
lan
d N
o.
Salt
Dep
t. b
ldg
s.
for
NM
AY
/o
ut
for
oth
er
man
ufa
ctu
reTsu
nam
ith
an
salt
ho
uses
man
ufa
ctu
re
1
Tam
il N
adu
16688
61
12
118
011
16890
2
Andhra
Pra
desh
17969
51
12
709
0182
18923
3
Odis
ha
8390
113
00
87
8491
4
West
Be
ngal
02
00
00
2
5
Mahara
shtr
a13061
47
00
359
243
13710
6
Guja
rat
1860
30
40
12
1879
7
Karn
ata
ka469
50
00
2476
8
Hary
ana
00
00
083
83
9
Him
ach
al P
radesh
133
00
00
0133
TO
TA
L58570
180
27
831
359
620
60587
vuqyXu
d
Hkkjr e
sa ued foHkkx d
h Hkwfe d
k fooj
.k
An
nexu
re 4.3
Lan
d
Alr
ead
yd
ecla
red
su
rplu
s
To
be
decla
red
su
rplu
s
* T
he la
nds
show
n in
Col.
3 o
f th
e s
tate
ment in
cludes
the la
nds
under
creeks
, sw
am
ps,
tops
whic
h a
re a
nci
llary
and in
cidenta
l to s
alt
pro
duct
ion.

vuqyXudAnnexure - 4.4
F. No. 04011/10/2010-SaltGovernment of India
Ministry of Commerce & IndustryDepartment of Industrial Policy and Promotion
Dated 24th January, 2012
INTERNAL POLICY GUIDELINES FOR TRANSFER OF SALT PAN LAND OWNED BY THE GOVT OF INDIA THROUGH THE OFFICE OF THE SALT COMMISSINOER, AT PLACES OTHER THAN MUMBAI AND ITS SUBURBS, FOR PUBLIC PURPOSES.
The Department of Industrial Policy and Promotion (DIPP) has been receiving requests fro Central Government Ministries / Departments, State Governments, Central & State Public Sector Enterprises for transfer of land owned by the Govt of India through the office of the Salt Commissioner, at places other than Mumbai and its suburbs, for public purposes.
2. Following Internal Policy Guidelines are being issued to deal with such requests:
2 (i) Land used for salt production and related activities, as a rule, shall not be transferred to any agency.
(DIPP will take a decision in the matter based on the inputs from the Salt Commissioner regarding the use of land for salt production and related activities).
2 (ii) Notwithstanding (i) above, land under active salt production shall be considered for transfer for public purposes only in exceptional cases as determined by DIPP. The transfer shall be in exchange for alternative land of equivalent value suitable for salt production, falling which, on payment of market value.
2 (iii) Land declared surplus to the requirement of the Ofice of the Salt Commissioner shall alone be considered for transfer for public purposes in accordance with Rules 278 and 279 of the General Financial Rules (GFR), under intimation to the Ministry of Urban Development.
(Declaration of land surplus to the requirement of the Office of the Salt Commissioner will be done by DIPP based on a report from the Salt Commissioner on the economic viability of salt production).
2 (iv) Land surplus to the requirement of the Office of the Salt Commissioner shall be offered first to other Central Government Departments, next to Central Public Sector Enterprises, failing which the Government of the State in which the land is situated and lastly to the State Public Sector Enterprises.
2 (v) The transfer of land will be on freehold basis.
2 (vi) There shall be no transfer of land to private sector agencies.
2 (vii) While considering requests for transfer of land, due consideration will be given to environment related issues and related restrictions.
2 (viii) Request for transfer of land shall be made to DIPP, in the prescribed format (copy enclosed).
2 (ix) Inter-se priority shall be fixed by DIPP in case of multiple requests for the same land, depending on the nature of public purpose.
(46)

2 (x) On the direction of DIPP, the Salt Commissioner shall examine, as far as possible, within 60 days, all such requests taking into account the impact of such transfer on salt production, the requirement of the said land for salt manufacture in future and the availability of saline land for exchange, if required.
2 (xi) The actual extent of land to be transferred shall be worked out by the Office of the Salt Commissioner, in consultation with the transferee agency. If required assistance of state government revenue officials for proper survey of land and demarcation by fixing of survey stones would be sought.
2 (xii) For land under active salt cultivation and under consideration for transfer, the transferee agency shall pay compensation to the lessees, if any, for extinguishing the lease hold rights and meet the cost of rehabilitation of the salt workers.
2 (xiii) Any legal case arising out of land transfer proposal in regard to compensation to be paid to the lessees, etc. or any other matter shall be taken care of and defended by the transferee agency at its own cost.
2 (xiv) A token value of Re.1 (Rupee One) will be charged for transferring land to Central Government Departments as per Rule 279 (2) of the General Financial Rules after obtaining the approval of the Minister in charge of DIPP.
2 (xv) In respect of cases, pertaining to central public sector enterprises, state governments and their enterprises, market value will be charged for theland, as defined in paragraph 2 of Appendix 11 of the General Financial Rules, 2005.
2 (xvi) The market value fo the land and its transfer shall be approve by the Minister in charge of DIPP.
2 (xvii) Govt of India / DIPP shall retain the right to resume / reclaim ownership of the land transferred, as long as the land is vacant or not used for the purposes for which it was transferred, on payment of suitable compensation. If the land is required by a central public sector enterprise and stands allotted, then it will be resumed on payment of the cost of allotment and proportionate development.
3. A Flow-chart indicating the procedure to be followed for fixing the market value of land is enclosed.
4. The above Internal Policy Guidelines will be treated as general delegation required under Rule 28 of GFR 2005 for transfer of land, etc. Whenever any general policy is framed by the Government, these guidelines shall be suitably reviewed / modified to make them consistent with general policy.
(47)

Format
Application for transfer of land
1 Name of the organization and address
2 Status of organization(a) Central Government(b) Central Government Undertaking / Enterprise(c) Autonomous body of Central Government(d) State Government(e) State Government Undertaking / Enterprise(f) Autonomous body of State Government(g) Private institution / body(h) Any other to be indicated
3 Extent of land required for transfer(a) Area in acre / hectare(b) Survey number(c) Name of village / taluka / district(d) Sketch / site plan with boundaries
4 Whether the required land is used for salt manufacture or declared surplus to the requirement of department.
5. If declared surplus, authority and the reference number of DIPP / Salt Commissioner.
6. Purpose for which the land is required and its national / regional importance.
7. Details of project indicating whether it is a permitted activity under(a) CRZ(b) Master plan of the State Govt / local authority etc.
8 Efforts made to obtain the land from State Government / private parties.
9. Undertaking to pay market value fixed by DIPP payment of compensation to the salt lessee / manufacturer and cost of rehabilitation of salt workers and right of DIPP to reclaim / resume ownership of the land on payment of suitable compensation.
10 Undertaking to defend court / legal cases if any, arising out of transfer of land.
11 Recommendations of the competent authority of Ministry / Department of Central / State Government
(48)

(49)
FLOWCHART
Receipt of order from DIPP for fixing market value
c
Deputy Salt Commissioner invites tenders for valuation of land from Government registered / approved valuers.
c
Receipt, opening of tender by Deputy Salt Commissioner & forwarding report to the Salt Commissioner as per prescribed procedure followed by evalution.
c
Acceptance of tendered rate by Salt Commissioner
c
Award of work to successful valuer by Salt Commissioner
c
Submission of valuation report by the valuer to Salt Commissioner
c
Recommendation of Salt Commissioner to DIPP on the market value of the land
c
Examination of the proposal by Salt Division and obtaining the views of IF Wing on valuation
c
Placing the proposal before Secretary (IPP)
c
Obtaining the approval of Minister in charge of DIPP on valuation & transfer of land
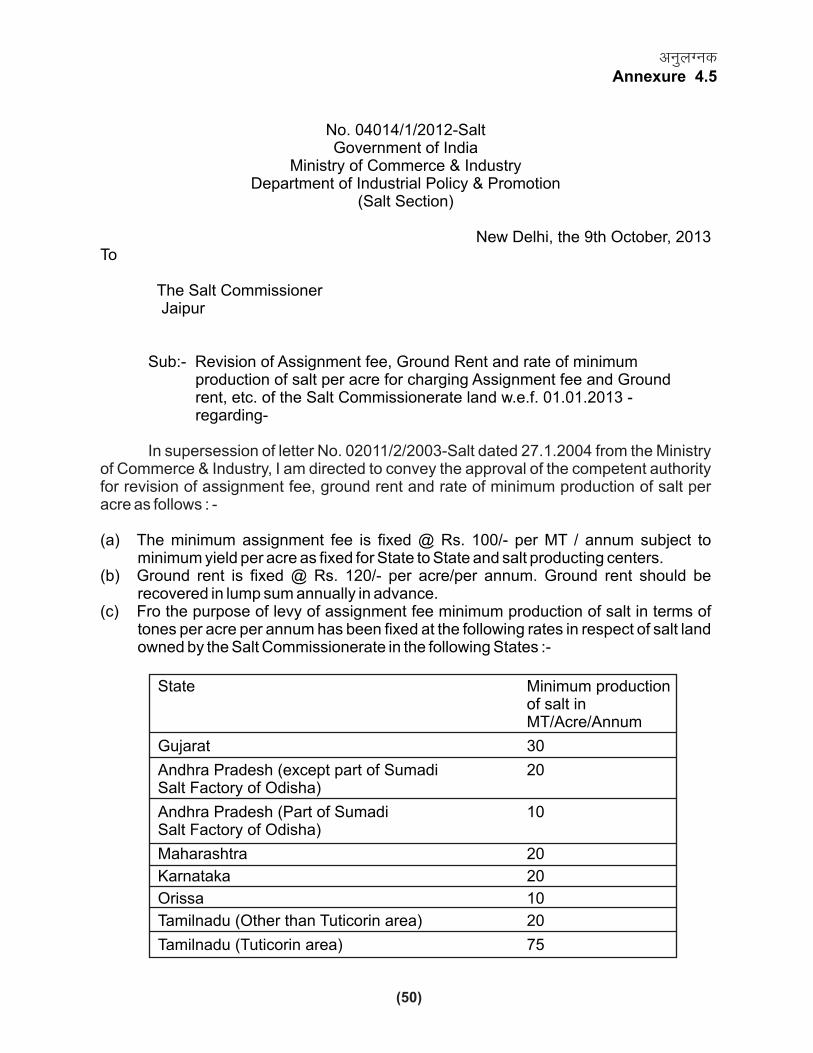
vuqyXudAnnexure 4.5
No. 04014/1/2012-SaltGovernment of India
Ministry of Commerce & IndustryDepartment of Industrial Policy & Promotion
(Salt Section)
New Delhi, the 9th October, 2013To
The Salt Commissioner Jaipur
Sub:- Revision of Assignment fee, Ground Rent and rate of minimum production of salt per acre for charging Assignment fee and Ground rent, etc. of the Salt Commissionerate land w.e.f. 01.01.2013 - regarding-
(a) The minimum assignment fee is fixed @ Rs. 100/- per MT / annum subject to minimum yield per acre as fixed for State to State and salt producting centers.
(b) Ground rent is fixed @ Rs. 120/- per acre/per annum. Ground rent should be recovered in lump sum annually in advance.
(c) Fro the purpose of levy of assignment fee minimum production of salt in terms of tones per acre per annum has been fixed at the following rates in respect of salt land owned by the Salt Commissionerate in the following States :-
State Minimum productionof salt in MT/Acre/Annum
Gujarat 30
Andhra Pradesh (except part of Sumadi 20Salt Factory of Odisha)
Andhra Pradesh (Part of Sumadi 10Salt Factory of Odisha)
Maharashtra 20
Karnataka 20
Orissa 10
Tamilnadu (Other than Tuticorin area) 20
Tamilnadu (Tuticorin area) 75
In supersession of letter No. 02011/2/2003-Salt dated 27.1.2004 from the Ministry of Commerce & Industry, I am directed to convey the approval of the competent authority for revision of assignment fee, ground rent and rate of minimum production of salt per acre as follows : -
(50)

(d) The new rates of assignment fee and ground rent will be effective from 1st January, 2013 onwards.
2. The following procedure shall be adopted for levy of assignment fee/ lease money in the said States :-
(a) Ground rent should be recovered in lump sum annually in advance.
(b) The assignment fee may be collected in installment, not exceeding four in a year subject to the payment of simpl interest fixed by the Government from time to time.
(c) The assignment fee / ground rent in respect of land whose lease was renewed on payment of assignment fee/ground rent as per DIPP letter No. 02011/2/2003-Salt dated 27.1.2004 would stand revised to the aforesaid rate w.e.f. 1.1.2013. In case lessees are already paying assignment fee more than Rs. 100/- per ton, they shall continue to pay the same amount.
(d) Before the lands ar formally assigned, the assignees should be required to deposit a fixed amount equal to the estimated amount of assignment fee for one year as security deposit. This would be refundable after the expiry of the successful terms of the lease. The assignment fee paid as advance shall be adjusted against outstanding dues in case the lease of land given for manufacture of salt is cancelled owing to violation of lease conditions.
(e) In respect of fresh and undeveloped lands as well as salt lands lying fallow for more that 7 years, lease money/ assignment fee at half of this scale should be recovered for the first three year from the assignee and for the first five years from duly registered cooperative societies. However, such condition should be incorporated in the NIT and subsequently in lease agreement.
(f) In cases where the highest tender rate of assignment fee being more than Rs. 100, the lessee shall pay the tendered rate.
(g) In cases where the land has been allotted on lease by inviting tenders and the highest bid accepted for payment of assignment fee was less than Rs. 100/- per MT, the lessee will continue to pay the assignment fee during the remaining period of lease as per their respective highest bid accepted.
(h) All lessees will be required to pay ground rent at revised rate.
3. The new rates of assignment fee adn ground rent will automatically increase by 10% after every three years and will be reviewed after every five years by the Committee constituted by the Government of India.
4. This issues with the concurrence of IF Wing vide their Dy. No. 650 dated 10.7.2013.
Yours faithfully
(Sanjivani Tamhane)Deputy Secretary to the Govt. of India
Copy to1. Pay and accounts Officer, Salt Commissioner, Jaipur2. IF Wing, Department of Industrial Policy & Promotion3. Sanction folder/Guard file4. Deputy Salt Commissioner, Mumbai, Chennai and Ahmedabad5. Assistant Salt Commissioner, Kolkata and Jodhpur.
(Sanjivani Tamhane)Deputy Secretary to the Govt. of India.
(51)

Sl. Name of the
No. State/Place
Apr. May June July Aug. Sept. Oct. Nov. Dec. Jan. Feb. "Mar. Total
2013 2013 2013 2013 2013 2013 2013 2013 2013 2014 2014 2014
1 Jamnagar 0.00 0.00 29.70 27.60 6.90 36.20 1.50 0.00 0.00 0.00 0.00 0.00 101.90
2 Mithapur 0.00 0.00 14.15 6.85 2.90 14.40 2.10 0.00 0.00 0.00 0.00 0.00 40.40
3 Kharaghoda 4.40 0.00 13.00 14.70 3.60 22.80 0.00 0.00 0.00 0.00 0.00 58.50
4 Gandhidham 0.00 0.00 3.60 15.00 20.40 36.70 0.00 0.00 0.00 0.00 0.00 0.00 75.70
5 Bhavnagar 0.00 0.00 27.50 22.00 31.10 52.40 7.50 0.00 0.00 0.00 0.00 0.00 140.50
6 Dharasana 0.20 0.00 71.90 133.70 39.40 72.20 0.40 0.00 0.00 0.20 0.00 0.00 318.00
7 Santalpur 0.00 0.00 7.40 19.30 31.50 60.90 3.90 0.00 0.00 0.00 0.00 0.00 123.00
TAMIL NADU
8 Tuticorin 0.00 0.80 4.80 0.00 0.70 3.40 23.20 246.70 37.10 21.30 43.90 4.70 386.60
9 Chennai 3.60 3.60 34.00 146.60 195.10 240.10 157.20 193.70 85.90 0.10 9.90 0.00 1069.80
10 Adiramapatnam 35.10 16.30 39.20 3.60 52.30 0.00 49.50 91.70 86.90 12.00 8.50 0.00 395.10
11 Nagapattinam 0.00 1.00 4.20 27.20 215.60 156.20 100.90 205.90 275.50 7.00 4.40 0.00 997.90
ORISSA
12 Ganjam 0.00 0.00 0.00 0.00 0.00 0.00 0.00 0.00 0.0 0.00 0.0 0.00 0.00
RAJASTHAN
13 Nawa City 0.00 0.00 1.50 12.20 19.40 5.90 3.30 3.50 0.20 0.3 3.8 0.50 50.60
14 Sujangarh 0.10 0.60 3.30 20.70 17.10 8.10 0.60 0.9 0.00 0.30 0.7 1.10 53.50
15 Pokran 0.00 0.30 2.70 0.50 1.00 15.00 3.00 1.00 0.00 0.0 0.0 0.00 23.50
16 Sambhar 0.00 0.00 7.00 9.50 22.70 6.00 1.30 0.60 0.00 1.2 0.0 0.40 48.70
17 Phalodi 0.20 0.50 3.00 9.90 10.90 4.40 0.00 0.00 0.00 0.0 0.0 0.00 28.90
18 Kuchaman 0.00 0.00 1.50 12.20 19.40 5.90 3.30 2.70 0.20 0.3 3.8 0.5 49.80
19 Didwana 0.2 0.80 3.30 5.40 30.80 8.20 0.00 0.20 0.00 0.0 1.2 2.0 52.10
ANDHRA PRADESH
20 Kakinada 24.00 26.00 90.20 235.50 69.40 113.80 620.10 80.10 12.30 1.00 0.00 0.00 1272.40
21 Machilipatanam 27.70 35.10 119.10 224.30 100.00 107.40 381.30 117.50 0.00 30.00 0.00 0.00 1142.40
22 Vishakhapatnam 32.70 9.60 89.50 61.30 127.60 208.80 510.80 183.90 0.00 19.30 0.00 0.00 1243.50
23 Nellore 5.40 0.00101.90 188.60 131.90 108.20 270.40 168.60 1.60 0.40 9.20 0.00 986.20
GUJARAT
vuqyXudAnnexure - 5.1
o"kZ 2013-14 ds nkSjku ued dkj[kkuksa ds lehiLFk dqN egRoiw.kZ LFkkuksa ds ekSle lEca/kh vkadM+sMETEOROLOGICAL DATA IN RESPECT OF SOME
IMPORTANT PLACES DURING 2013-14
o"kkZR A I N F A LL
(52)
(Fig. in Cms.)

(53)
Sl. Name of the Apr May June July Aug Sept Oct. Nov. Dec.No. State/Place 13 13 13 13 13 13 13 13 13 14 14 14
TAMIL NADU
Jan Feb Mar
1 Tuticorin 8 9 10 11 10 9 8 7 7 9 9 9
2 Chennai 6 7 9 7 7 6 6 7 8 8 6 6
3 Adiramapatnam 7 9 7 8 7 8 7 5 6 7 7 7
vuqyXudAnnexure - 5.2
gok dh e/;e xfrMEAN WIND VELOCITY
(Km. Per Hour)

vuqyXudAnnexure - 5.3
vkSlr lkis{k vknzrk (%)
AVERAGE RELATIVE HUMIDITY (%)
Sl. Name of the Apr. May June July Aug. Sept. Oct. Nov. Dec.No. State/Place 13 13 13 13 13 13 13 13 13 14 14 14
TAMIL NADU
Jan Feb. Mar.
1 Tuticorin (M) 83 76 77 77 78 81 80 88 89 88 87 85
(E) 88 87 91 94 91 85 92 88 95 93 87 85
2 Chennai (M) 77 73 61 80 83 82 86 86 80 78 79 72
(E) 77 74 60 76 76 78 81 81 73 69 67 64
3 Adiramapatnam (M) 78 76 65 63 73 76 76 86 83 87 85 77
(E) 70 76 72 74 75 76 77 78 76 68 64 61
4 Nagapattinam (M) 77 72 64 67 80 83 85 90 92 85 85 81
(E) 70 70 55 61 74 74 76 83 83 77 68 69
5 Vishakhapatnam (M) 69 70 73 75 74 78 80 65 64 76 67 63
(E) 77 73 71 73 78 79 80 70 64 72 67 70
6 Kakinada (M) 78 74 76 82 81 86 88 80 77 84 81 76
(E) 67 64 65 72 73 75 81 72 60 71 61 58
7 Machilipatnam (M) 76 69 71 79 78 82 86 81 79 88 80 79
(E) 71 65 59 69 66 71 79 73 64 70 63 64
8 Nellore (M) 77 65 60 75 75 77 81 85 79 86 82 77
(E) 65 53 47 63 59 64 69 75 64 86 60 59
9 Mithapur (M) 79.70 78.86 76.50 82.70 79.75 80.73 83.62 66.54 61.73 57.04 67.79 68.46
(E) 77.80 76.45 74.00 79.70 77.33 78.08 80.85 64.33 59.04 54.33 65.17 66.71
ANDHRA PRADESH
GUJARAT
(54)
M-Morning E-Evening

Sl. Name of the Apr. May June July Aug. Sept. Oct. Nov. Dec.No. State/Place 13 13 13 13 13 13 13 13 13 14 14 14
TAMIL NADU
Jan Feb. Mar.
1. Tuticorin Max. 35.9 39.4 38.6 38.3 38.9 38.7 38.1 32.5 31.7 32.8 32.4 38.5 Min. 26.3 27.6 26.4 26.6 26.3 26.0 25.1 24.1 22.6 22.1 23.1 25.0
2. Adirampatnam Max. 36.4 37.1 38.6 38.6 37.7 35.2 36.0 33.6 33.7 33.0 34.1 36.0Min. 27.5 27.8 26.6 26.6 25.5 25.6 25.4 23.1 21.0 20.7 21.1 22.8
3. Chennai Max. 37.4 42.7 39.7 28.3 36.9 35.7 35.6 33.6 32.1 30.6 32.3 36.6Min. 27.6 28.7 28.3 26.0 26.1 25.9 25.9 24.3 22.1 22.5 22.2 24.4
4. Nagapattinam Max. 38.5 40.6 39.6 38.6 38.5 35.8 36.4 31.6 32.4 29.9 31.8 34.4Min. 26.8 28.0 27.5 26.6 25.4 25.2 25.5 24.2 22.3 23.1 22.7 24.5
5. Kakinada Max. 35.3 38.6 34.6 31.8 33.1 33.8 31.1 30.6 29.6 30.3 31.5 33.8 Min. 25.8 28.3 26.8 25.9 26.0 26.1 25.3 22.5 19.9 20.6 20.7 23.6
6. Vishakhapatnam Max. 32.1 34.3 33.1 32.1 32.1 31.9 30.7 30.3 29.2 28.9 29.3 30.8 Min. 24.4 27.7 27.1 26.5 26.2 25.6 24.9 22.3 20.7 20.7 21.0 23.5
7. Nellore Max. 38.5 41.2 38.1 32.9 34.0 34.6 34.0 31.1 30.7 30.4 31.6 34.7 Min. 27.1 29.5 28.6 26.5 26.5 26.1 25.9 23.6 21.6 21.5 22.0 24.3
8. Machilipatnam Max. 35.1 37.9 36.2 33.2 33.6 33.8 31.4 30.6 29.9 29.4 30.7 33.2Min. 25.7 28.0 26.3 25.0 25.3 25.4 24.6 22.8 19.8 20.3 20.7 22.7
11 Mithapur Max. 31.40 32.83 34.30 31.81 31.24 31.35 32.82 31.53 28.05 25.04 27.13 30.51Min. 21.40 24.46 25.10 24.18 22.92 23.18 22.90 20.29 16.85 13.15 15.28 18.35
ANDHRA PRADESH
GUJARAT
vuqyXudAnnexure - 5.4
vf/kdre ,oa U;wure rkieku fMxzh lsfYl;l esaMAXIMUM & MINIMUM TEMPERATURE IN °C
(55)

vuqyXudAnnexure - 6.1
lalkj esa ued mRiknu & vxz.kh jk"Vªksa esaPRODUCTION OF SALT IN LEADING
SALT PRODUCING COUNTRIES IN THE WORLD(In Tonnes)
Country 2008 2009 2010 2011 2012
Albania (Sea Salt) 47000 47000 47000 47000 47000
Armenia 37334 29402 29440 35570 37798
Austria
Rock Salt 503 50 95 169 222
Salt in brine 866674 1035044 1071842 1150474 3193216
Azerbaijan 7527 5466 4449 18848 19000
Belarus 1866499 2089282 2411683 2576330 2176650
Bosnia & Herzegovina 538357 556089 662631 721046 743807
Bulgaria 2100000 1300000 1900000 2200000 2100000
Croatia 3956 57186 66835 53963 45992
Denmark 496593 511063 601046 600000 600000
France Salt in brine (K) 6000000 6100000 6000000 6000000 6100000
Germany
Rock Salt 5545000 7709844 9992156 8765168 5938855
Brine Salt 989000 1862630 2118484 2217205 2182440
Salt in brine 7307000 7300000 4500000 6458628 10900000
Greece 220000 189000 190000 190000 190000
Italy
Rock Salt & brine salt 2334315 3471206 4973533 2912128 2862440
Montenegro
Sea Salt 25200 17000 11200 10000 16000
Netherlands 6200000 5967000 5982000 6866000 6513000
Poland
Rock Salt 618111 988545 1235533 1233800 793000
Brine Salt 2783198 2533413 2464363 2633000 2732200
Other salt 706618 763385 763515 547700 724000
Portugal
Rock Salt 606545 594578 618961 631295 520284
Sea Salt 69249 72325 44574 48048 88693
(56)

Country 2008 2009 2010 2011 2012
Romania 2526774 2072744 2388357 2248940 1888516
Russia 1800000 1600000 2000000 2000000 2000000
Serbia 30115 28783 30816 23334 16506
Slovakia 109510 41000 0 0 0
Slovaria 535 2924 59 4291 5684
Spain
Rock Salt 2909907 2763081 2650940 3200000 2785959
Sea Salt 1290672 1338789 1242718 1171435 1155475
Other salt 102149 99853 92644 91735 100643
Switzerland 368000 554000 643000 478324 528000
Turkey 4000000
Sea Salt 500000 500000 500000 500000 0
Other salt 1367981 1300000 1300000 4100000 0
Ukraine 4424878 5394512 4908186 5938000 6181415
United Kingdom 6700000 6100000
Rock Salt 2000000 2000000 2000000 0 0
Brine Salt 1000000 1000000 1000000 0 0
Salt in brine 2800000 2800000 2800000 0 0
Algeria
Brine Salt & Sea Salt 201603 269255 187160 190000 178000
Angola 35000 35000 35000 35000 40000
Benin (c ) 15000 15000 15000 0 0
Botswana 170994 241114 250000 446525 389481
Burkina Faso 5000 5000 5000 5000 5000
Cape Verde 1600 0 0 0 0
Djibouti 138000 0 0 30000 30000
Egypt (b) 1879351 2951636 3000000 2460462 2883577
Eritrea 26071 26000 26000 26000 26000
Ethiopia ( c) 100000
Rock Salt (e) 30414 41847 40000 70000 0
Other Salt (e) (f) 31971 70541 70000 40000 0
Ghana 250000 250000 250000 250000 150000
Guinea 15000 15000 15000 15000 15000
Kenya (d) 24345 24125 24000 24000 24000
Libya 40000 40000 40000 40000 10000
Madagascar 70000 70000 70000 70000 70000
(57)

Country 2008 2009 2010 2011 2012
Mali 6000 6000 6000 6000 6000
Mauritania 570 455 391 690 700
Mauritius (e ) 5042 2301 2000 4000 3800
Morocco 219187 310300 503351 720814 720000
Mozambaque (c ) 80000 80000 80000 110000 110000
Namibia 732000 807348 783036 780000 738000
Niger 1300 1300 1300 1300 1300
Senegal 240600 222500 231400 258200 237300
Somalia 1000 1000 1000 1000 1000
South Africa 415996 408422 394493 381177 399135
Sudan 20000 35793 141840 0 150000
Tanzania 25896 27393 34455 36352 34016
Tunisia (c ) 1063500 1260100 1692800 1180500 1131200
Uganda 0 0 0 0 0
Bahamas 10244 10430 11833 8430 1000000
Bonaire 0 0 0 300000 400000
Canada
Rock Salt 12043000 12381000 9197000 11629830 9820792
Other Salt (e) 2125000 2185000 1623000 994718 1023832
Costa Rica 20000 0 0 0 0
Cuba 157300 265700 271800 280800 280000
Dominican Republic
Sea Salt 50000 50000 50000 50000 50000
El. Salvador ( c) 31000 31000 0 98200 103100
Guatemala ( c) 50000 50000 50000 50000 50000
Honduras 40000 40000 40000 40000 40000
Mexico 8808714 7445025 8634098 9361454 10100935
Netherlands Antilles 343457 303565 337321 0 0
Nicaragua (c ) 30000 30000 30000 30000 30000
Panama (c ) 21053 19548 27587 16577 15596
USA
Rock Salt (h) 19800000 20700000 19800000 19360000 14472000
Salt in brine (h) 18900000 17480000 17100000 16720000 18894000
Evaporated salt (h) 8580000 8280000 8100000 7920000 6834000
Argentina 1900000 1477532 1500000 1500000 1900000
Brazil
Rock Salt 1528000 1443000 1300000 1400000 1300000
(58)

(59)
Country 2008 2009 2010 2011 2012
Sea Salt 5200000 4462000 500000 5600000 5000000
Chile 6431029 8382215 7694879 9966038 8057130
Colombia
Rock Salt 245170 255332 288676 305706 308547
Sea Salt 386461 356797 139810 116265 211721
Ecuador 75000 75000 75000 75000 75000
Peru 1276274 1567279 1228900 1468266 1242765
Venezuela (c ) 350000 350000 350000 350000 350000
Afghanistan 145532 163641 168827 169000 169000
Bangladesh (d) 1349000 1368000 1389000 1409239 1430329
Burma (a) ( h) 101083 127169 79187 162319 223747
Cambodia 75000 30000 170000 95000 80000
China 66644300 66627900 62748000 64294000 62158000
India
Rock Salt ( h) 2100 2300 1200 0 0
Sea Salt (h ) 13970500 17478600 14202300 18188300 24500000
Other Salt ( h) 5178600 6470400 4406600 3990800 0
Indonesia 700000 720000 720000 720000 650000
Iran (j) 2158280 2816235 2800000 3300000 2800000
Iraq 108870 103130 102000 136007 143441
Israel ( e) 420809 356889 420749 399649 414984
Japan (hI ) 1132000 1095000 1122000 978000 925000
Jordan 25400 2500 32542 0 0
Kazakishtan 504100 222942 276131 364222 463960
Korea Dem. P.R. of 500000 382270 222509 500000 308847
Korea Republic of 384304 500000 500000 372230 500000
Kuwait 50000 50000 50000 50000 50000
Laos 0 35000 35000 35100 47600
Lebanon 15000 15000 15000 15000 15000
Mongolia 100000 5 0 0 2461
Myanmar (b) (c ) 0 0 0 0
Oman 10400 30600 31000 12400 12800
Pakistan
Rock Salt (b) 1849199 1917486 1943527 1953711 2135760
Sea Salt (b) 11000 11000 11000 186697 292135
Philippines (e ) 510059 516066 557644 720146 725000

Country 2008 2009 2010 2011 2012
Saudi Arabia
Rock Salt & brine salt 1600000 1600000 1600000 1800000 2000000
Sri Lanka 65972 102500 104000 87256 85000
Syria 88600 78289 80000 80000 80000
Taiwan 118046 171583 262594 104854 70750
Tajikistan 47446 49772 50365 26994 27954
Thailand
Rock Salt 1211581 1200000 1200000 1545900 1363539
Other Salt 100000 100000 100000 100000 100000
Turkmenistan 215000 215000 215000 215000 215000
Uzbekistan 60000 60000 60000 60000 60000
Vietnam 717000 718000 718000 928900 1177900
Yemen Republic of 69000 80000 80000 80000 70000
Australia (I) 11160000 10316000 11968000 11403000 10821000
New Zealand 67000 67000 60000 70000 88000
Totals 266211523 275353324 261997365 281751470 276506929
Note(s) :
(1) This table does not include production of refined salt(2) Salt is known to be produced in many countries for which statistics are not available.
(a) Salt ; all forms(b) Years ended 30 June of that stated(c) Years ended 7 July of that stated(d) Lake Salt(e) Sea Salt(f) Including salt in brine(g) Sold or used by producers(h ) Years ended 31 March following that stated(i) Seasons beginning in November and ending in May of the year stated.(j ) Years ended 20 March following that stated
(60)

(61)
1 Tamilnadu
1 Tuticorin 1635985
2 Ramanad 256052
3 Nagapattnam 567345
4 Villupuram 38271
5 Cuddalore 480
6 Kanyakumari 6929
7 Pudukottai 2477
8 Tanjavur 17180
9 Tiruvallur 6198
10 Kancheepuram 47193
Total 2578110
2 Andhra Pradesh
1 Srikakulam 53231
2 Vizayanagaram 557
3 Vishkhapatnam 16681
4 East Godawari 10017
5 Krishna 180132
6 Prakasam 100232
7 Nellore 22896
Total 383746
3 Gujarat
1 Surendranagar 2044128
2 Rajkot 1198395
3 Patan 885439
4 Jamnagar 3070488
5 Porbandar 38076
6 Kutch 6073268
7 Anand 22249
8 Bharuch 1522971
9 Bhavnagar 2430100
10 Amreli 605663
11 Junagarh 76624
12 Valsad 27930
13 Surat 93704
14 Navsari 6500
Total 18095535
vuqyXudAnnexure - 6.2
jkT;okj ued mRiknd ftys o vkSlr mRiknuStatewise Salt producing districts & average production
4 Diu & Daman 00.00
5 Rajasthan
1 Ajmer 423500
2 Churu 21147
3 Jaipur 109959
4 Jaisalmer 7555
5 Jodhpur 205756
6 Nagaur 902002
7 Barmer 31400
8 Sikar 400
Total 1701719
6 Maharashtra
1 Mumbai 3150
2 Mumbai Sub.Urban 123778
3 Thane 123579
4 Raigad 5355
5 Sindhudurg 1665
Total 257527
7 Karnataka
Uttar Kannada 15454.00
8 Himachal Pradesh
Mandi 0.00
9 West Bengal
Midnapore 9010.00
10 Odisha
Ganjam 19333.00
Balasore 4.00
Total 19337.00
11 Goa 1718
Grand Total 23062156.00
S Name of State/District AverageNo. Production
S Name of State/District AverageNo. Production

(62)
Sl.
Nam
e o
f th
eN
o o
f U
nit
sA
rea
in A
cres
Act
ual
Are
a W
ork
ed (
in A
cres
)
No
.R
egio
n/S
tate
Cat
.I*C
at.II
*C
at.II
I*C
at.IV
*To
tal
Cat
.I*C
at.II
*C
at.II
I*C
at.IV
*To
tal
Cat
.I*C
at.II
*C
at.II
I*C
at.IV
*To
tal
1.
2.3.
4.5.
6.7.
8.9.
10.
11.
12.
13.
14.
15.
16.
17
I.G
uja
rat
Reg
ion
Gu
jara
t M
arin
e41
49
2680
312
5232
9141
471
6014
8030
3436
5620
5612
297
3796
7272
2169
77
Inla
nd
131
1184
1024
1250
5818
768
114
912
1024
084
020
1971
727
391
8210
090
3926
2
Tota
l54
520
110
1827
2502
3873
2811
5220
926
1827
042
7676
2253
2957
012
978
1736
225
6239
Diu
& D
aman
12
20
591
616
369
50
1774
00
00
0
Tota
l Gu
jara
t R
egio
n54
622
112
1827
2507
3882
4413
1521
621
1827
042
9450
2253
2957
012
978
1736
225
6239
II.C
hen
nai
Reg
ion
An
dh
ra P
rad
esh
2695
1329
7631
1015
916
3394
1812
8248
2937
012
490
1926
1626
6890
2293
2
Tam
il N
adu
4712
45
4078
4254
2904
546
0685
014
596
4909
725
577
3195
493
1433
943
604
Tota
l Ch
enn
ai R
egio
n73
219
1870
5473
6444
961
8000
2662
2284
478
467
3806
751
2121
1921
229
6653
6
IIIM
um
bai
Reg
ion
Mah
aras
htr
a47
112
265
190
1254
053
5722
5440
2019
183
1931
9221
7340
1372
4
Go
a0
00
4343
00
021
821
80
00
218
218
Kar
nat
aka
12
122
2611
188
469
158
826
111
8846
915
882
6
Tota
l Mu
mb
ai R
egio
n48
114
2770
259
1265
154
4527
2341
621
235
8430
3280
2642
416
1476
8
IVK
olk
ata
Reg
ion
Wes
t B
eng
al7
401
048
1098
1470
137
027
0581
273
213
60
1680
Od
ish
a5
204
1140
1965
866
1355
3942
2513
0729
933
918
1963
Tota
l Ko
lkat
a R
egio
n12
605
1188
3063
2336
1492
3969
3021
1910
3147
518
3643
VR
ajas
than
Reg
ion
Raj
asth
an2
142
1215
5717
1357
744
5422
691
1511
978
976
1700
3056
480
1249
017
726
H.P
.(M
and
i)0
00
00
00
00
00
00
00
Tota
l Raj
asth
an R
egio
n2
142
1215
5717
1357
744
5422
691
1511
978
976
1700
3056
480
1249
017
726
G
ran
d T
ota
l 201
3-14
681
557
174
1051
911
931
5066
6322
518
2918
956
688
6150
5827
5645
1305
818
694
5151
535
8912
G
ran
d T
ota
l 201
2-13
678
609
176
1051
111
974
5066
6222
346
2956
853
985
6125
6227
4048
1417
918
393
4845
435
5075
*
Cat
. I -
Exc
eed
ing
100
Acr
es
C
at. I
I - E
xcee
din
g
10 A
cres
bu
t U
pto
100
Acr
es.
C
at. I
II -
Co
-Op
. So
ciet
ies
C
at. I
V -
Up
to 1
0 ac
res
(exc
ept
Co
-op
. So
ciet
ies)
vuqyXu
dA
nn
ex
ure
- 6
.3
o"kZZ 20
13&14
esa Js.khokj b
dkb;ksa dh la[;k]
{ks=
,oa o
kLrfod d
k;Zjr
{ks=
NU
MB
ER
OF
CA
TE
GO
RY
WIS
E U
NIT
S, A
RE
A &
AC
TU
AL
AR
EA
WO
RK
ED
DU
RIN
G 2
013-1
4

vuqyXudAnnexure - 6.4
o"kZ 2013&14 esa ued fuekZ.k ds fy;s iathd+`r fd;s x;s u;s {ks=ksa dk fooj.kPARTICULARS OF NEW AREA REGISTERED FOR SALT MANUFACTURE
DURING 2013-14
Sl. State/District No. of Location Area Regis- Ownership
No. Units tered (Acres) of land
1 TAMIL NADU
2 GUJARAT
(i) Nagapattoma 0 Neidavasal 0 Salt Dept.
(ii) Ramnad 0 Valinokkam 0 Patta
(iii) Pudukottai 0 Kattumavad 0 Salt Dept.
(iv) Ramnad 0 Theethandathanam 0 Salt Dept.
TOTAL 0 0.00
(iii) Kutch 1 Mithirohar, Padana 100 KPT
TOTAL 1 100.00
(63)

(64)
vuqyXudAnnexure - 6.5
o"kZ 1947 ls 2013&14 rd ns'k esa ued mRiknuSALT PRODUCTION IN THE COUNTRY
FROM 1947 TO 2013-14('000 MT)
YEAR PRODUCTION YEAR PRODUCTION
1947 1929.8
1948 2374.8
1949 2075.8
1950 2661.9
1951 2776.1
1952 2868.9
1953 3213.2
1954 2758.6
1955 3025.2
1956 3317.6
1957 3670.1
1958 4195.7
1959 3177.9
1960 3435.5
1961 3480.6
1962 3886.1
1963 3544.1
1964 4646.8
1965 4119.3
1966 4521.5
1967 4488.2
1968 5043.7
1969 5173.4
1970 5588.2
1971 5426.1
1972 6517.1
1973 6860.2
1974 5912.9
1975 5842.9
1976 4076.4
1977 5328.5
1978 6693.5
1979 7037.0
1980 8007.4
1981 8923.2
1982 7308.4
1983 7004.8
1984 7652.9
1985 9874.9
1986 10111.5
1987 9899.5
1988 8311.5
1989 9870.3
1990 12398.0
1991 12394.6
1992 13552.8
1993 13727.8
1994 12344.2
1995 12544.0
1996 14466.1
1997 14251.1
1998 11964.4
1999 14452.7
2000 15651.3
2001 14284.0
2002 17879.2
2003 14882.4
2004 14761.2
2005-06 18969.0
2006-07 17898.2
2007-08 17845.2
2008-09 19151.2
2009-10 23951.3
2010-11 18610.1
2011-12 22179.1
2012-13 24546.9
2013-14 23019.3

(65)
vuqyXudAnnexure - 6.6
jkT;okj ,oa {ks=okj ued mRiknuSTATE & SECTOR WISE PRODUCTION OF SALT
('000 Tonnes)
Sl. Name of the Public Private Coop. TotalNo. State Joint Sect. Sector Sector
1 2 3 4 5 6
1. Andhra Pradesh2011-12 1.9 279.0 24.2 305.1 2012-13 4.6 380.6 18.1 403.3 2013-14 7.2 412.6 22.9 442.7
2. Goa2011-12 0.0 2.0 0.0 2.02012-13 0.0 1.9 0.0 1.92013-14 0.0 1.8 0.0 1.8
3. Gujarat2011-12 0.0 15282.7 1735.9 17018.6 2012-13 1.2 17538.4 1884.3 19423.9 2013-14 1.2 16506.0 1588.3 18095.5
4. Himachal Pradesh2011-12 0.0 0.0 0.0 0.0 2012-13 0.0 0.0 0.0 0.0 2013-14 0.0 0.0 0.0 0.0
5. Karnataka2011-12 0.0 3.1 9.9 13.0 2012-13 0.0 3.1 11.4 14.5 2013-14 0.0 3.8 11.7 15.5
6. Maharashtra2011-12 0.0 120.6 34.6 155.2 2012-13 0.0 124.7 35.7 160.4 2013-14 0.0 114.1 31.4 145.5
7. Orissa2011-12 0.0 7.9 1.7 9.6 2012-13 0.0 26.6 7.2 33.8 2013-14 0.0 16.1 3.2 19.3
8. Rajasthan2011-12 141.9 2025.8 21.2 2188.9 2012-13 168.7 1630.0 26.2 1824.9 2013-14 178.9 1488.2 34.0 1701.1
9. Tamil Nadu2011-12 154.9 2299.9 22.6 2477.4 2012-13 185.2 2464.2 20.9 2670.3 2013-14 176.9 2392.9 16.7 2586.5
10. West Bengal2011-12 0.0 7.8 1.4 9.2 2012-13 0.0 12.8 1.1 13.9 2013-14 0.0 10.8 0.6 11.4
11. Diu & Daman2011-12 0.0 0.1 0.0 0.1 2012-13 0.0 0.0 0.0 0.0 2013-14 0.0 0.0 0.0 0.0
TOTAL2011-12 298.7 20028.9 1851.5 22179.1
2012-13 359.7 22182.3 2004.9 24546.9
2013-14 364.2 20946.3 1708.8 23019.3

(66)
vuqyXudAnnexure - 6.7
('000 Tonnes)
Js.kh@jkT;okj ued mRiknuCATEGORY/ STATEWISE PRODUCTION OF SALT
Sl. Name of the C A T E G O R Y
No. State I II III IV Total
Cat. I - Exceeding 100 AcresCat II - Exceeding 10 Acres but Upto 100 Acres.Cat. III - Co-Operative SocietiesCat. IV - Upto 10 acres (except Co-op. Societies)
1 Andhra Pradesh2011-12 124.1 38.5 24.2 118.3 305.12012-13 218.2 34.5 18.1 132.5 403.32013-14 234.2 38.0 22.9 147.6 442.7
2 Goa2011-12 0.0 0.0 0.0 2.0 2.02012-13 0.0 0.0 0.0 1.9 1.92013-14 0.0 0.0 0.0 1.8 1.8
3 Gujarat2011-12 12428.1 30.3 1735.9 2824.3 17018.62012-13 14669.9 29.0 1884.3 2840.7 19423.92013-14 13516.5 27.4 1588.4 2963.2 18095.5
4 Himachal Pradesh2011-12 0.0 0.0 0.0 0.0 0.02012-13 0.0 0.0 0.0 0.0 0.02013-14 0.0 0.0 0.0 0.0 0.0
5 Karnataka2011-12 0.7 0.0 9.9 2.4 13.02012-13 0.6 0.5 11.4 2.0 14.52013-14 0.8 1.1 11.7 1.9 15.5
6 Maharashtra2011-12 86.0 32.8 34.6 1.8 155.22012-13 88.0 34.6 35.7 2.1 160.42013-14 79.1 32.3 31.1 3.0 145.5
7 Orissa2011-12 5.0 2.9 1.7 0.0 9.62012-13 16.0 10.5 7.2 0.1 33.82013-14 11.3 4.6 3.2 0.2 19.3
8 Rajasthan2011-12 144.7 112.0 21.2 1911.0 2188.92012-13 169.8 56.2 26.2 1572.7 1824.92013-14 181.1 55.6 33.7 1430.7 1701.1
9 Tamil Nadu2011-12 994.4 139.3 22.6 1321.1 2477.42012-13 1097.0 146.4 20.9 1406.0 2670.32013-14 1115.5 138.9 16.6 1315.5 2586.5
10 West Bengal2011-12 3.0 4.8 1.4 0.0 9.22012-13 5.9 6.9 1.1 0.0 13.92013-14 4.6 5.5 1.3 0.0 11.4
11 Diu & Daman2011-12 0.0 0.1 0.0 0.0 0.12012-13 0.0 0.0 0.0 0.0 0.02013-14 0.0 0.0 0.0 0.0 0.0
GRAND TOTAL 2011-12 13786.0 360.7 1851.5 6180.9 22179.1
2012-13 16265.4 318.6 2004.9 5958.0 24546.9
2013-14 15143.1 303.4 1708.9 5863.9 23019.3

(67)
vuqyXudAnnexure - 6.8
('000 Tonnes)
fofHkUu L=ksrks ls ued mRiknu dk jkT;okj fooj.kSTATE & SOURCE WISE PRODUCTION OF SALT
2011-12 2012-13 2013-14
Source Sea Inland Sea Inland Sea Inland
Andhra Pradesh 305.1 0.0 403.3 0.0 442.7 0.0
Gujarat 15216.7 1801.9 15907.5 3516.4 14294.3 3801.2
Goa 2.0 0.0 1.9 0.0 1.8 0.0
Karnataka 13.0 0.0 14.5 0.0 15.5 0.0
Maharashtra 155.2 0.0 160.4 0.0 145.5 0.0
Odisha 9.6 0.0 33.8 0.0 19.3 0.0
Rajasthan 0.0 2047.0 0.0 1656.2 0.0 1521.5
Tamilnadu 2477.4 0.0 2670.3 0.0 2586.5 0.0
West Bengal 9.2 0.0 13.9 0.0 11.4 0.0
Diu & Daman 0.1 0.0 0.0 0.0 0.0 0.0
TOTAL 18188.3 3848.9 19205.6 5172.6 17517.0 5322.7
ROCK SALT
Himachal Pradesh 0.0 0.0 0.0 0.0 0.0 0.0
LAKE SALT
Rajasthan(Sambhar) 0.0 141.9 0.0 168.7 0.0 179.6
18188.3 3990.8 19205.6 5341.3 17517.0 5502.3
Grand Total 22179.1 24546.9 23019.3
{ { {
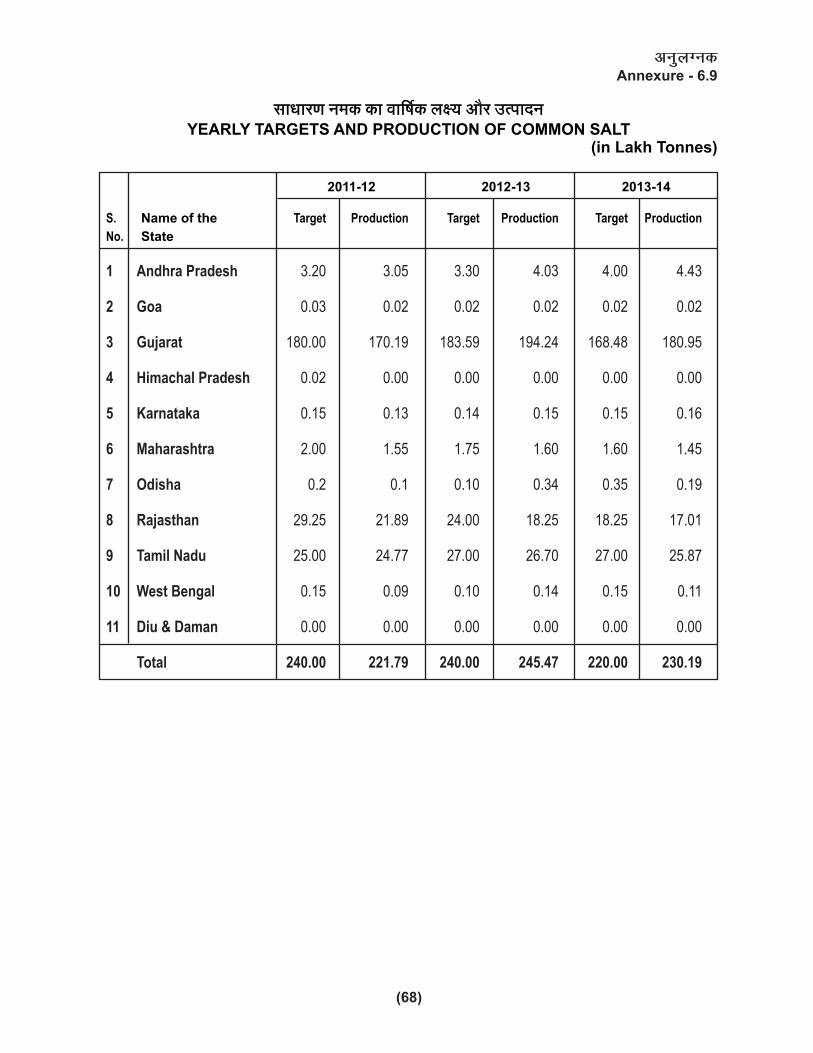
(68)
vuqyXudAnnexure - 6.9
gmYmaU Z_H$ H$m dmof©H$ bú` Am¡a CË[mXZYEARLY TARGETS AND PRODUCTION OF COMMON SALT
(in Lakh Tonnes)
2011-12 2012-13 2013-14
S. Name of the Target Production Target Production Target Production
No. State
1 Andhra Pradesh 3.20 3.05 3.30 4.03 4.00 4.43
2 Goa 0.03 0.02 0.02 0.02 0.02 0.02
3 Gujarat 180.00 170.19 183.59 194.24 168.48 180.95
4 Himachal Pradesh 0.02 0.00 0.00 0.00 0.00 0.00
5 Karnataka 0.15 0.13 0.14 0.15 0.15 0.16
6 Maharashtra 2.00 1.55 1.75 1.60 1.60 1.45
7 Odisha 0.2 0.1 0.10 0.34 0.35 0.19
8 Rajasthan 29.25 21.89 24.00 18.25 18.25 17.01
9 Tamil Nadu 25.00 24.77 27.00 26.70 27.00 25.87
10 West Bengal 0.15 0.09 0.10 0.14 0.15 0.11
11 Diu & Daman 0.00 0.00 0.00 0.00 0.00 0.00
Total 240.00 221.79 240.00 245.47 220.00 230.19
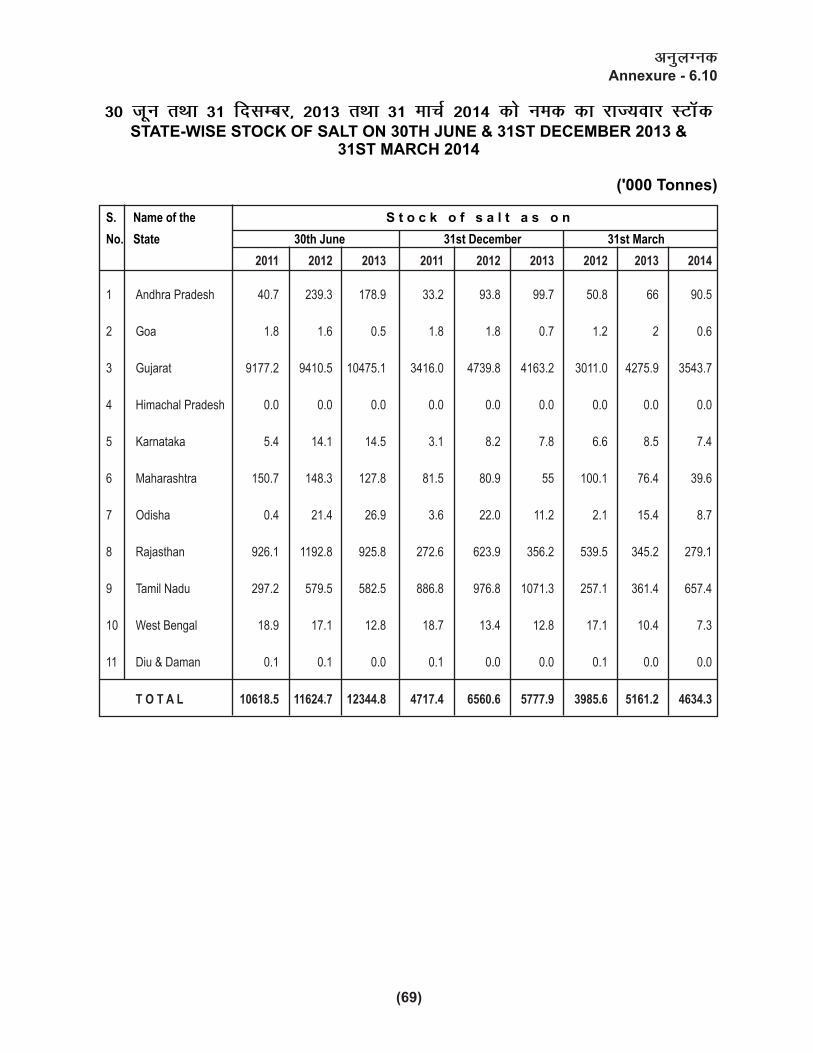
(69)
vuqyXudAnnexure - 6.10
30 twu rFkk 31 fnlEcj] 2013 rFkk 31 ekpZ 2014 dks ued dk jkT;okj LVkWdSTATE-WISE STOCK OF SALT ON 30TH JUNE & 31ST DECEMBER 2013 &
31ST MARCH 2014
('000 Tonnes)
S. Name of the S t o c k o f s a l t a s o n
No. State 30th June 31st December 31st March
2011 2012 2013 2011 2012 2013 2012 2013 2014
1 Andhra Pradesh 40.7 239.3 178.9 33.2 93.8 99.7 50.8 66 90.5
2 Goa 1.8 1.6 0.5 1.8 1.8 0.7 1.2 2 0.6
3 Gujarat 9177.2 9410.5 10475.1 3416.0 4739.8 4163.2 3011.0 4275.9 3543.7
4 Himachal Pradesh 0.0 0.0 0.0 0.0 0.0 0.0 0.0 0.0 0.0
5 Karnataka 5.4 14.1 14.5 3.1 8.2 7.8 6.6 8.5 7.4
6 Maharashtra 150.7 148.3 127.8 81.5 80.9 55 100.1 76.4 39.6
7 Odisha 0.4 21.4 26.9 3.6 22.0 11.2 2.1 15.4 8.7
8 Rajasthan 926.1 1192.8 925.8 272.6 623.9 356.2 539.5 345.2 279.1
9 Tamil Nadu 297.2 579.5 582.5 886.8 976.8 1071.3 257.1 361.4 657.4
10 West Bengal 18.9 17.1 12.8 18.7 13.4 12.8 17.1 10.4 7.3
11 Diu & Daman 0.1 0.1 0.0 0.1 0.0 0.0 0.1 0.0 0.0
T O T A L 10618.5 11624.7 12344.8 4717.4 6560.6 5777.9 3985.6 5161.2 4634.3

(70)
vuqyXudAnnexure - 6.11
fofHkUu ued mRiknd jkT;ksa dh vkSlr ued iSnkokjAVERAGE YIELD OF SALT IN DIFFERENT SALT
PRODUCING STATES
Average yieldSl. Name of the (Tonnes/Acre)No. State/Salt Producing Centre 2011-12 2012-13 2013-14
Andhra Pradesh1 Pakala 14 17 142 Iskapalli 17 11 213 Naupada 13 10 84 Calingapatnam 8 6 135 Polavaram 11 27 17
Goa1 Goa 17 9 8
Gujarat1. Gandhidham/Chirai 97 84 822. Jamnagar 58 75 633. Bhavnagar/Rajula 64 67 604. Dhrangadhra/Kharaghoda 60 59 635. Halvad 177 210 1386. South Gujarat 45 47 38
Karnataka1 Sanikatta 18 18 19
Maharashtra1 Shiroda 27 21 212 Rai 9 16 103 Palghar 14 14 124 Bhayandar 11 16
Odisha1 Ganjam 2 14 142 Goka 8 12 63 Surla 7 22 124 Sumadi 2 9 75 Bolong 0.3 0.0 0.1
Rajasthan1 Sujangarh 48 41 582 Nawa City 200 166 1453 Phalodi 43 35 374 Sambhar Lake 89 105 1125 Didwana 98 37 496 Kuchaman City 57 21 217 Pokaran 13 17 25
Tamil Nadu1 Veppalodai 54 60 662 Urani 132 125 993 Valinokkam 50 56 564 Marakanam 13 21 185 Adirampatnam 15 18 226 Vedaranyam (P) 46 66 447 Vedaranyam (E) 51 64 598 Covelong 10 12 9
West Bengal1 Contai 5 7 5
(P) - Parent(E) - Extension

vuqyXudAnnexure - 7.1
ued m|ksx esa dk;Zjr lgdkjh lfefr;ksa dk jkT;okj fooj.kPARTICULARS OF CO-OPERATIVE SOCIETIES ENGAGED IN
SALT MANUFACTURE
Sl. Name of the No. of Co-op Total No.of Area Actual area ProductionNo. State Societies Members (In Acres) worked ('000 Tonnes)
(In Acres)
1. Andhra Pradesh
2011-12 13 4178 1812 1741 24.2
2012-13 13 4178 1812 1568 18.1
2013-14 13 4178 1812 1626 22.9
2. Gujarat (a) Marine
2011-12 26 5761 5113 4325 259.0
2012-13 26 5761 6014 3553 190.4
2013-14 26 5761 6014 3796 162.7
(b) Inland
2011-12 84 14297 15017 8911 1476.9
2012-13 84 14297 14912 10182 1693.9
2013-14 84 14297 14912 9182 1425.7
3. Karnataka
2011-12 1 0 469 469 9.9
2012-13 1 350 469 469 11.4
2013-14 1 350 469 469 11.7
4. Maharashtra
2011-12 26 0 2243 2135 34.6
2012-13 26 0 2243 2135 35.7
2013-14 26 0 2243 2173 31.4
5. Odisha
2011-12 3 801 1353 610 1.7
2012-13 3 801 1355 294 7.2
2013-14 4 801 1355 339 3.2
6. Rajasthan
2011-12 12 265 621 480 21.2
2012-13 13 265 621 480 26.2
2013-14 12 265 691 480 33.9
7. Tamil Nadu
2011-12 5 1060 832 556 22.6
2012-13 7 1240 1310 576 20.9
2013-14 5 1060 850 493 16.7
8. West Bengal
2011-12 1 170 137 137 1.4
2012-13 1 170 137 137 1.1
2013-14 1 170 137 136 0.6
9 Diu & Daman
2011-12 0 0 0 0 0.0
2012-13 0 0 0 0 0.02013-14 2 0 0 0 0.0
2011-12 171 26532 27597 19364 1851.5
2012-13 174 27062 28873 19394 2004.9
2013-14 174 26882 28483 18694 1708.8
(71)

S.No. State Name Public/Joint Area held ProductionSector (In Acres) (In Tonnes)
1 Tamil Nadu Tamil Nadu Salt Public Sector 5504 166215Corporation, Valinokkam
2 Tamil Nadu Maruthi Marine Industries Joint Sector 956 10749Ltd., Covelong
3 Andhra Pradesh M/s. S.K. Salts, Pandraka Joint Sector 992 7150
4 Gujarat M/s. Hindustan Salts Ltd., Public sector 23595 0Kharaghoda
5 Gujarat Central Salt & Marine Public sector 300 0Chemicals Research Institute, Bhavnagar
6 Himachal Pradesh M/s. Hindustan Salts Limited, Public sector 130 0Mandi.
7 Rajasthan M/s. Sambhar Salts Ltd., Public sector 57600 179561Sambhar.
TOTAL 89077 363675
vuqyXudAnnexure - 8.1
o"kZ 2013&14 ds nkSjku dk;Zjr ljdkjh {ks= ds midzeksa dk C;kSjkPARTICULARS OF PUBLIC/JOINT SECTOR
UNDERTAKINGS FUNCTIONED DURING 2013-14
(72)

YEAR TARGET PRODUCTION
1970-85 6.00 1.00 to 2.00
1986-87 7.00 7.70
1987-88 12.00 16.87
1988-89 22.00 21.90
1989-90 26.00 22.56
1990-91 40.00* 25.04* Reduced to 26 Lakh Tonnes
1991-92 50.00 26.21
1992-93 50.00 28.34
1993-94 50.00 29.27
1994-95 50.00 29.22
1995-96 50.00 38.03
1996-97 52.00 40.99
1997-98 53.63 41.28
1998-99 50.00 40.17
1999-2000 50.00 46.16
2000-01 50.00 45.35
2001-02 50.00 47.92
2002-03 52.00 36.89
2003-04 52.00 42.53
2004-05 52.00 46.10
2005-06 52.00 49.83
2006-07 54.00 51.54
2007-08 52.00 49.61
2008-09 52.00 53.68
2009-10 52.00 58.23
2010-11 55.00 62.20
2011-12 58.00 62.00
2012-13 63.00 61.81
2013-14 63.00 58.47
vuqyXudAnnexure - 9.1
(Figures in Lakh Tonnes)
y{; ,oa vk;ksMhu;qDr ued dk mRiknuTARGET AND PRODUCTION OF IODISED SALT
(73)

(74)
vuqyXudAnnexure - 9.2
31 ekpZ 2014 rd yxk;s x;s ued vk;ksMhuhdj.k l;a=ksa dk fooj.kPARTICULARS OF IODISATION PLANTS COMMISSIONED UPTO
31ST MARCH 2014(Qty. in '000 Tonnes)
Sl. Name of the State Number of Installed Capacity TOTAL
No. Iodisation Refineries * Iodisation Refineries * No. of CapacityPlants Plant Plants
1 Andhra Pradesh 21 0 223.0 0.0 21 223.0
2 Assam 5 0 103.0 0.0 5 103.0
3 Gujarat 321 56 5400.0 9200.0 377 14600.0
4 Himachal Pradesh 1 0 12.0 0 1 12.0
5 Jammu & Kashmir 11 0 149.0 0 11 149.0
6 Karnataka 5 0 24.0 0 5 24.0
7 Maharashtra 0 0 0.0 0 0 0.0
8 Meghalaya 2 0 20.0 0 2 20.0
9 Nagaland 1 0 10.0 0 1 10.0
10 Odisha 8 0 63.0 0 8 63.0
11 Rajasthan 210 27 3171.0 2366.0 237 5537.0
12 Tamilnadu 33 28 458.0 929.0 61 1387.0
13 Tripura 4 0 18.0 0 4 18.0
14 Uttar Pradesh 1 1 15.0 1.0 2 16.0
15 West Bengal 41 0 79.0 0 41 79.0
16 Arunachal Pradesh 1 0 2.0 0 1 2.0
TOTAL 665 112 9747.0 12496.0 777 22243.0
* Includes two Vacuum evaporated plants of M/s. Tata Chemicals of 5 lakh tonnes capacity and M/s. Nirma Ltd. of 1.3 lakh tonnes capacity respectively.

vuqyXudAnnexure - 9.3
jkT;okj vk;ksMhu ued mRiknuSTATE WISE PRODUCTION OF IODISED SALT
( '000 tonnes)
S.No. Name of the State Production Total
Refined Un-Refined
1 Andhra Pradesh2011-12 0.00 0.06 0.062012-13 0.00 0.66 0.662013-14 0.00 3.05 3.05
2 Assam2011-12 0.00 6.70 6.702012-13 0.00 0.53 0.532013-14 0.00 0.10 0.10
3 Gujarat2011-12 2632.09 1331.03 3963.122012-13 2709.18 1252.45 3961.632013-14 2493.73 1346.53 3840.26
4 Himachal Pradesh2011-12 0.00 0.00 0.002012-13 0.00 0.00 0.002013-14 0.00 0.00 0.00
5 Jammu & Kashmir2011-12 0.00 6.13 6.132012-13 0.00 1.36 1.362013-14 0.00 0.00 0.00
6 Karnataka2011-12 0.00 7.38 7.382012-13 0.00 7.79 7.792013-14 0.00 8.32 8.32
7 Maharashtra2011-12 0.00 0.00 0.002012-13 0.00 0.00 0.002013-14 0.00 0.00 0.00
8 Odisha2011-12 0.00 6.68 6.682012-13 0.00 4.18 4.182013-14 0.00 0.08 0.08
9 Rajasthan2011-12 247.10 894.25 1141.352012-13 478.52 688.68 1167.202013-14 571.82 504.83 1076.65
10 Tamil Nadu2011-12 263.24 782.46 1045.702012-13 276.48 726.14 1002.622013-14 355.99 527.61 883.60
11 Tripura2011-12 0.00 8.50 8.502012-13 0.00 8.43 8.432013-14 0.00 9.09 9.09
12 Uttar Pradesh2011-12 0.00 0.00 0.002012-13 0.00 0.00 0.002013-14 0.00 0.00 0.00
13 West Bengal2011-12 0.00 14.87 14.872012-13 0.00 26.67 26.672013-14 0.00 25.78 25.78
14 Meghalaya 2011-12 0.00 0.0 0.02012-13 0.00 0.0 0.002013-14 0.00 0.0 0.0
2011-12 3142.43 3058.06 6200.49
T O T A L 2012-13 3464.18 2716.89 6181.07
2013-14 3421.54 2425.39 5846.93
(75)

vuqyXudAnnexure - 9.4
vk;ksMhu ued dh jkT;okj vkiwfrZ o fu;kZrSTATEWISE SUPPLIES AND EXPORT OF IODISED SALT
('000 tonnes)
Sl. Name of the Supplies
No. State 2011-12 2012-13 2013-14
1 Andhra Pradesh 332.13 323.75 307.37
2 Assam 250.97 283.86 269.89
3 Arunachal Pradesh 0.00 0.00 2.56
4 Bihar 645.91 605.47 680.39
5 Chattisgarh 206.87 231.83 252.11
6 Delhi 307.30 259.24 187.35
7 Gujarat 326.57 295.34 329.05
8 Goa 1.18 4.03 5.62
9 Himachal Pradesh 21.59 10.59 7.88
10 Haryana 25.53 70.51 64.75
11 Jammu & Kashmir 38.97 44.66 32.05
12 Jharkhand 122.25 176.04 115.63
13 Kerala 104.90 141.00 156.93
14 Karnataka 232.65 247.61 246.33
15 Manipur 7.67 13.10 0.00
16 Madhya Pradesh 218.83 195.74 206.85
17 Maharashtra 380.99 373.37 367.91
18 Meghalaya 0.00 0.00 0.00
19 Mizoram 2.56 0.00 0.00
20 Nagaland 0.00 2.57 16.69
21 Odisha 190.20 169.00 149.94
22 Punjab 139.66 112.63 94.88
23 Rajasthan 212.25 236.34 187.79
24 Sikkim 5.21 2.59 2.58
25 Tamil Nadu 576.92 518.33 381.00
26 Tripura 15.48 16.73 12.81
27 Uttar Pradesh 906.59 828.47 810.08
28 Uttaranchal 19.17 36.83 24.49
29 West Bengal 672.43 655.62 586.67
30 Andaman Nicobar 0.00 0.00 0.03
31 Chandigarh 1.17 2.45 2.22
32 Dadra & Nagar Haveli 0.28 0.26 0.03
33 Diu & Daman 0.05 0.02 0.02
34 Lakshadweep 0.00 0.00 0.00
35 Pondicherry 3.51 6.11 6.21
36 Defence 0.00 0.00 0.00
Total (Indigenous) 5969.79 5864.09 * 5508.11
(76)
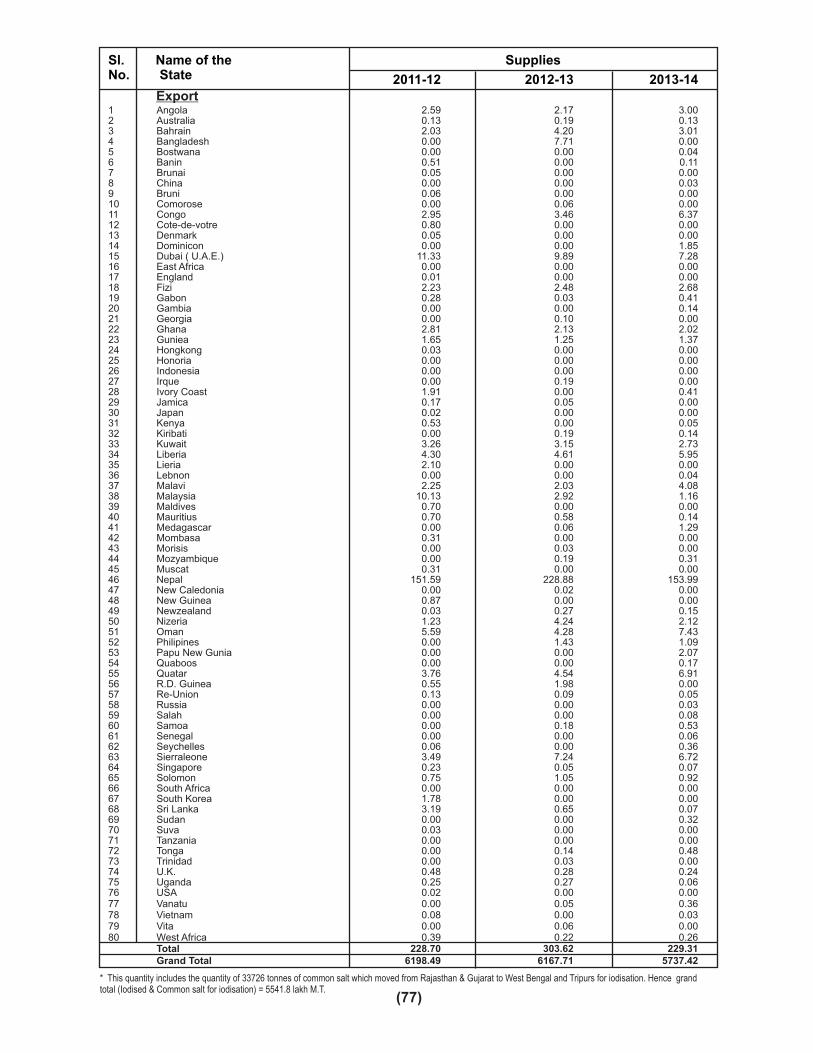
Sl. Name of the SuppliesNo. State 2011-12 2012-13 2013-14
Export1 Angola 2.59 2.17 3.002 Australia 0.13 0.19 0.133 Bahrain 2.03 4.20 3.014 Bangladesh 0.00 7.71 0.005 Bostwana 0.00 0.00 0.046 Banin 0.51 0.00 0.117 Brunai 0.05 0.00 0.008 China 0.00 0.00 0.039 Bruni 0.06 0.00 0.0010 Comorose 0.00 0.06 0.0011 Congo 2.95 3.46 6.3712 Cote-de-votre 0.80 0.00 0.0013 Denmark 0.05 0.00 0.0014 Dominicon 0.00 0.00 1.8515 Dubai ( U.A.E.) 11.33 9.89 7.2816 East Africa 0.00 0.00 0.0017 England 0.01 0.00 0.0018 Fizi 2.23 2.48 2.6819 Gabon 0.28 0.03 0.4120 Gambia 0.00 0.00 0.1421 Georgia 0.00 0.10 0.0022 Ghana 2.81 2.13 2.0223 Guniea 1.65 1.25 1.3724 Hongkong 0.03 0.00 0.0025 Honoria 0.00 0.00 0.0026 Indonesia 0.00 0.00 0.0027 Irque 0.00 0.19 0.0028 Ivory Coast 1.91 0.00 0.4129 Jamica 0.17 0.05 0.0030 Japan 0.02 0.00 0.0031 Kenya 0.53 0.00 0.0532 Kiribati 0.00 0.19 0.1433 Kuwait 3.26 3.15 2.7334 Liberia 4.30 4.61 5.9535 Lieria 2.10 0.00 0.0036 Lebnon 0.00 0.00 0.0437 Malavi 2.25 2.03 4.0838 Malaysia 10.13 2.92 1.1639 Maldives 0.70 0.00 0.0040 Mauritius 0.70 0.58 0.1441 Medagascar 0.00 0.06 1.2942 Mombasa 0.31 0.00 0.0043 Morisis 0.00 0.03 0.0044 Mozyambique 0.00 0.19 0.3145 Muscat 0.31 0.00 0.0046 Nepal 151.59 228.88 153.9947 New Caledonia 0.00 0.02 0.0048 New Guinea 0.87 0.00 0.0049 Newzealand 0.03 0.27 0.1550 Nizeria 1.23 4.24 2.1251 Oman 5.59 4.28 7.4352 Philipines 0.00 1.43 1.0953 Papu New Gunia 0.00 0.00 2.0754 Quaboos 0.00 0.00 0.1755 Quatar 3.76 4.54 6.9156 R.D. Guinea 0.55 1.98 0.0057 Re-Union 0.13 0.09 0.0558 Russia 0.00 0.00 0.0359 Salah 0.00 0.00 0.0860 Samoa 0.00 0.18 0.5361 Senegal 0.00 0.00 0.0662 Seychelles 0.06 0.00 0.3663 Sierraleone 3.49 7.24 6.7264 Singapore 0.23 0.05 0.0765 Solomon 0.75 1.05 0.9266 South Africa 0.00 0.00 0.0067 South Korea 1.78 0.00 0.0068 Sri Lanka 3.19 0.65 0.0769 Sudan 0.00 0.00 0.3270 Suva 0.03 0.00 0.0071 Tanzania 0.00 0.00 0.0072 Tonga 0.00 0.14 0.4873 Trinidad 0.00 0.03 0.0074 U.K. 0.48 0.28 0.2475 Uganda 0.25 0.27 0.0676 USA 0.02 0.00 0.0077 Vanatu 0.00 0.05 0.3678 Vietnam 0.08 0.00 0.0379 Vita 0.00 0.06 0.0080 West Africa 0.39 0.22 0.26
Total 228.70 303.62 229.31Grand Total 6198.49 6167.71 5737.42
(77)
* This quantity includes the quantity of 33726 tonnes of common salt which moved from Rajasthan & Gujarat to West Bengal and Tripurs for iodisation. Hence grand total (Iodised & Common salt for iodisation) = 5541.8 lakh M.T.

vuqyXudAnnexure - 10.1
o"kZ 2013&14 esaa fofHkUu jkT;kssa@ la?kksa esa [kk| ued dh vkiwfrZSUPPLY OF EDIBLE SALT TO VARIOUS STATES/U.T.'S OF THE COUNTRY
DURING 2013-2014(Qty. in '000 Tonnes)
Supply of Salt for Human Consumption
S. Name of theRail Road & Sea Total
No. State
1 Andhra Pradesh 138.6 168.8 307.4
2 Arunachal Pradesh 2.6 0.0 2.6
3 Assam 269.8 0.0 269.8
4 Bihar 666.4 14.0 680.4
5 Chhatisgarh 248.0 4.1 252.1
6 Delhi 161.3 26.1 187.4
7 Goa 0.0 5.6 5.6
8 Gujarat 34.7 294.4 329.1
9 Haryana 32.4 32.3 64.7
10 Himachal Pradesh 0.0 7.9 7.9
11 Jammu & Kashmir 23.7 8.3 32.0
12 Jharkhand 109.6 5.4 115.0
13 Karnataka 11.7 234.6 246.3
14 Kerala 0.0 156.9 156.9
15 Madhya Pradesh 125.9 81.0 206.9
16 Maharashtra 160.4 208.4 368.8
17 Manipur 0.0 0.0 0.0
18 Mizoram 0.0 0.0 0.0
19 Meghalaya 0.0 0.0 0.0
20 Nagaland 16.7 0.0 16.7
21 Odisha 142.8 7.8 150.6
22 Punjab 50.1 44.8 94.9
23 Rajasthan 33.8 154.0 187.8
24 Sikkim 2.6 0.0 2.6
25 Tamil Nadu 40.1 340.9 381.0
26 Tripura 20.5 0.0 20.5
27 Uttar Pradesh 652.4 160.2 812.6
28 Uttarakhand 14.1 10.4 24.5
29 West Bengal 608.0 2.1 610.1
30 Andaman Nicobar 0.0 0.0 0.0
31 Chandigarh 0.0 2.2 2.2
32 Dadra & Nagar Haveli 0.0 0.3 0.3
33 Diu & Daman 0.0 0.2 0.2
34 Lakshadweep 0.0 0.0 0.0
35 Pondicherry 0.0 6.2 6.2
36 Defence 0.0 0.0 0.0
TOTAL QTY. 3566.2 1976.9 5543.1
(78)
* Received supplies from adjoining states.

vuqyXudAnnexure - 10.2
jkT;okj ued ynku LVs'kuSTATE-WISE LIST OF APPROVED SALT LOADING STATIONS
ANDHRA PRADESH
A. East Coast Railways
1 Naupada
2 Palasa
3 Srikakulam Road
4 Visakhapatnam
B South Central Railways
1 Anakapalli
2 Amamanabrolu
3 Bitragunta
4 Chinnaganjam
5 Ellamanchali
6 Kakinada Port
7 Masulipatnam
8 Narasimhapatanam
9 Nellore
10 Ongole
11 Singarayakonda
TAMIL NADU
A Southern Railways
1 Adirampatnam
2 Agastiampalli
3 Arumuganeri
4 Milavittan
5 Ramnd
6 Salt Cotaurs
GUJARAT
A. Western Railways
1 Adesar
2 Bhavnagar/ Bhavnagar C.J
3 Bhimasar
4 Bhimrana
5 Bharuch
6 Bhuj
7 Chirai
8 Hapa
9 Halvad
10 Khambaliya
11 Kandla
12 Kharaghoda
13 Kankaria (Ahmedabad)
14 Kuda Salt -siding
15 Kharirohar
16 Lavanpur
17 Maliya-Miyana
18 Mehsana
19 Mundra
20 Porbandar
21 Rajkot
22 Santalpur
23 Samakhyali
24 Vadodra
25 Wawania
RAJASTHAN
A North Western Railways
1 Govindi Marwar
2 Kuchaman City
3 Kanakpura (Jaipur)
4 Nawa City
5 Phalodi
6 Sambhar Lake
(79)

Sl. Name of the BY RAIL BY ROAD BY SEA TOTAL GRAND
No. State HC IC HC IC HC IC HC IC TOTAL
1 2 3 4 5 6 7 8 9 10 11
1. Andhra Pradesh 138.6 0.0 168.8 622.4 0.0 41.0 307.4 663.4 970.8
2. Arunachal Pradesh 2.6 0.0 0.0 0.0 0.0 0.0 2.6 0.0 2.6
3. Assam 269.8 15.6 0.0 0.0 0.0 0.0 269.8 15.6 285.4
4. Bihar 666.4 28.5 14.0 0.5 0.0 0.0 680.4 29.0 709.4
5. Chhatisgarh 248.0 0.0 4.1 0.0 0.0 0.0 252.1 0.0 252.1
6. Delhi 161.3 0.0 26.1 24.9 0.0 0.0 187.4 24.9 212.3
7. Goa 0.0 0.0 5.6 1.8 0.0 0.0 5.6 1.8 7.4
8. Gujarat 34.7 0.0 294.4 7210.7 0.0 65.5 329.1 7276.2 7605.3
9. Haryana 32.4 0.0 32.3 68.9 0.0 0.0 64.7 68.9 133.6
10. Himachal Pradesh 0.0 0.0 7.9 31.8 0.0 0.0 7.9 31.8 39.7
11. Jammu & Kashmir 23.7 0.0 8.3 1.4 0.0 0.0 32.0 1.4 33.4
12. Jharkhand 109.6 178.6 5.4 0.0 0.0 0.0 115.0 178.6 293.6
13. Karnataka 11.7 0.0 234.6 96.6 0.0 0.0 246.3 96.6 342.9
14. Kerala 0.0 0.0 156.9 44.1 0.0 45.0 156.9 89.1 246.0
15. Madhya Pradesh 125.9 213.7 81.0 214.9 0.0 0.0 206.9 428.6 635.5
16. Maharashtra 160.4 0.0 208.4 348.3 0.0 0.0 368.8 348.3 717.1
17. Manipur 0.0 0.0 0.0 0.0 0.0 0.0 0.0 0.0 0.0
18. Mizoram 0.0 0.0 0.0 0.0 0.0 0.0 0.0 0.0 0.0
19. Meghalaya 0.0 0.0 0.0 0.0 0.0 0.0 0.0 0.0 0.0
20. Nagaland 16.7 0.0 0.0 0.0 0.0 0.0 16.7 0.0 16.7
21. Odisha 142.8 9.3 7.8 86.3 0.0 0.0 150.6 95.6 246.2
22. Punjab 50.1 105.1 44.8 42.7 0.0 0.0 94.9 147.8 242.7
23. Rajasthan 33.8 0.0 154.0 364.8 0.0 0.0 187.8 364.8 552.6
24. Sikkim 2.6 0.0 0.0 0.0 0.0 0.0 2.6 0.0 2.6
25. Tamil Nadu 40.1 0.0 340.9 575.8 0.0 0.0 381.0 575.8 956.8
26. Tripura 20.5 0.0 0.0 0.0 0.0 0.0 20.5 0.0 20.5
27. Uttar Pradesh 652.4 176.0 160.2 105.5 0.0 0.0 812.6 281.5 1094.1
28. Uttarakhand 14.1 0.0 10.4 1.2 0.0 0.0 24.5 1.2 25.7
29. West Bengal 608.0 121.5 2.1 15.5 0.0 0.0 610.1 137.0 747.1
30. Andaman & Nicobar 0.0 0.0 0.0 0.0 0.0 0.0 0.0 0.0 0.0
31. Chandigarh 0.0 0.0 2.2 1.4 0.0 0.0 2.2 1.4 3.6
32 Dadra & Nagar Haveli 0.0 0.0 0.3 0.0 0.0 0.0 0.3 0.0 0.3
33 Diu & Daman 0.0 0.0 0.2 0.0 0.0 0.0 0.2 0.0 0.2
34 Lakshadweep 0.0 0.0 0.0 0.0 0.0 0.0 0.0 0.0 0.0
35 Pondicherry 0.0 0.0 6.2 145.8 0.0 0.0 6.2 145.8 152.0
36 Defence 0.0 0.0 0.0 0.0 0.0 0.0 0.0 0.0 0.0
Total 3566.2 848.3 1976.9 10005.3 0.0 151.5 5543.1 11005.1 16548.2
vuqyXudAnnexure - 10.3
o"kZ 2013&14 esa ued dk jsy] lMd ,oa leqnzh ekxZ }kjk jkT;okj lapyuSTATEWISE MOVEMENT OF SALT BY RAIL, ROAD & SEA DURING THE YEAR 2013-14.
(Quantity in '000 Tonnes)
(80)
* Received supplies from adjoining states. H.C. : Human ConsumptionI.C. : Industrial Consumption

vuqyXudAnnexure - 10.4
o"kZ 2013&14 esa ued mRiknu vWapyks ls fofHkUu jkT;ksa dks [kk| ued dh vkiwfrZSTATE- WISE SUPPLIES OF EDIBLE SALT FROM PRODUCTION SOURCES DURING 2013-14
(Quantity in 000 tonnes )
Sl. Name of the GUJRAT TAMIL NADU RAJASTHAN
No. State RAIL ROAD TOTAL RAIL TOTAL RAIL ROAD TOTAL
1 2 3 4 5 6 7 8 9 10 11
1. Andhra Pradesh 138.6 10.7 149.3 0.0 158.1 158.1 0.0 0.0 0.0
2. Arunachal Pradesh 2.6 0.0 2.6 0.0 0.0 0.0 0.0 0.0 0.0
3. Assam 269.8 0.0 269.8 0.0 0.0 0.0 0.0 0.0 0.0
4. Bihar 313.3 4.8 318.1 0.0 0.0 0.0 353.1 9.2 362.3
5. Chhatisgarh 229.8 3.3 233.1 0.0 0.0 0.0 18.2 0.8 19.0
6 Delhi 161.3 8.8 170.1 0.0 0.0 0.0 0.0 17.3 17.3
7 Goa 0.0 1.0 1.0 0.0 4.7 4.7 0.0 0.0 0.0
8 Gujarat 34.7 294.4 329.1 0.0 0.0 0.0 0.0 0.0 0.0
9 Haryana 32.4 9.5 41.9 0.0 0.0 0.0 0.0 22.8 22.8
10 Himachal Pradesh 0.0 0.6 0.6 0.0 0.0 0.0 0.0 7.3 7.3
11 Jharkhand 77.3 0.0 77.3 0.0 0.0 0.0 32.3 5.4 37.7
12 Jammu & kashmir 23.7 5.7 29.4 0.0 0.0 0.0 0.0 2.6 2.6
13 Karnataka 11.7 9.0 20.7 0.0 217.3 217.3 0.0 0.0 0.0
14 Kerala 0.0 0.0 0.0 0.0 156.9 156.9 0.0 0.0 0.0
15 Madhya Pradesh 125.9 54.6 180.5 0.0 0.0 0.0 0.0 26.4 26.4
16 Maharashtra 160.4 205.8 366.2 0.0 1.3 1.3 0.0 0.4 0.4
17 Manipur 0.0 0.0 0.0 0.0 0.0 0.0 0.0 0.0 0.0
18 Mizoram 0.0 0.0 0.0 0.0 0.0 0.0 0.0 0.0 0.0
19 Meghalaya 0.0 0.0 0.0 0.0 0.0 0.0 0.0 0.0 0.0
20 Nagaland 16.7 0.0 16.7 0.0 0.0 0.0 0.0 0.0 0.0
21 Odisha 126.4 3.1 129.5 0.0 3.7 3.7 16.3 1.0 17.3
22 Punjab 50.1 11.7 61.8 0.0 0.0 0.0 0.0 33.1 33.1
23 Rajasthan 33.8 38.9 72.7 0.0 0.0 0.0 0.0 115.1 115.1
24 Sikkim 2.6 0.0 2.6 0.0 0.0 0.0 0.0 0.0 0.0
25 Tamil Nadu 40.1 0.1 40.2 0.0 340.8 340.8 0.0 0.0 0.0
26 Tripura 20.5 0.0 20.5 0.0 0.0 0.0 0.0 0.0 0.0
27 Uttar Pradesh 533.9 33.1 567.0 0.0 0.0 0.0 118.6 127.1 245.7
28 West Bengal 436.2 0.1 436.3 0.0 0.0 0.0 171.7 1.9 173.6
29 Uttranchal 14.1 2.5 16.6 0.0 0.0 0.0 0.0 7.8 7.8
30 Andman & Nicobar 0.0 0.0 0.0 0.0 0.0 0.0 0.0 0.0
31 Chandigarh 0.0 0.1 0.1 0.0 0.0 0.0 0.0 2.1 2.1
32 Dadra & Nagar Haveli 0.0 0.3 0.3 0.0 0.0 0.0 0.0 0.0 0.0
33 Diu & Daman 0.0 0.2 0.2 0.0 0.0 0.0 0.0 0.0 0.0
34 Defence 0.0 0.0 0.0 0.0 0.0 0.0 0.0 0.0 0.0
35 Lakshdweep 0.0 0.0 0.0 0.0 0.0 0.0 0.0 0.0 0.0
36 Pondichery 0.0 0.0 0.0 0.0 6.2 6.2 0.0 0.0 0.0
Total 2855.9 698.3 3554.2 0.0 889.0 889.0 710.2 380.3 1090.5
(81)
* Received supplies from adjoining states.
SEAROAD &

MAHARASHTRA WEST BENGAL TOTAL
RAIL ROAD TOTAL RAIL ROAD TOTAL RAIL TOTAL
12 13 14 15 16 17 18 19 20
0.0 0.0 0.0 0.0 0.0 0.0 138.6 168.8 307.4
0.0 0.0 0.0 0.0 0.0 0.0 2.6 0.0 2.6
0.0 0.0 0.0 0.0 0.0 0.0 269.8 0.0 269.8
0.0 0.0 0.0 0.0 0.0 0.0 666.4 14.0 680.4
0.0 0.0 0.0 0.0 0.0 0.0 248.0 4.1 252.1
0.0 0.0 0.0 0.0 0.0 0.0 161.3 26.1 187.4
0.0 0.0 0.0 0.0 0.0 0.0 0.0 5.7 5.7
0.0 0.0 0.0 0.0 0.0 0.0 34.7 294.4 329.1
0.0 0.0 0.0 0.0 0.0 0.0 32.4 32.3 64.7
0.0 0.0 0.0 0.0 0.0 0.0 0.0 7.9 7.9
0.0 0.0 0.0 0.0 0.0 0.0 109.6 5.4 115.0
0.0 0.0 0.0 0.0 0.0 0.0 23.7 8.3 32.0
0.0 8.3 8.3 0.0 0.0 0.0 11.7 234.6 246.3
0.0 0.0 0.0 0.0 0.0 0.0 0.0 156.9 156.9
0.0 0.0 0.0 0.0 0.0 125.9 81.0 206.9
0.0 0.9 0.9 0.0 0.0 0.0 160.4 208.4 368.8
0.0 0.0 0.0 0.0 0.0 0.0 0.0 0.0 0.0
0.0 0.0 0.0 0.0 0.0 0.0 0.0 0.0 0.0
0.0 0.0 0.0 0.0 0.0 0.0 0.0 0.0 0.0
0.0 0.0 0.0 0.0 0.0 0.0 16.7 0.0 16.7
0.0 0.0 0.0 0.0 0.1 0.1 142.7 7.9 150.6
0.0 0.0 0.0 0.0 0.0 0.0 50.1 44.8 94.9
0.0 0.0 0.0 0.0 0.0 0.0 33.8 154.0 187.8
0.0 0.0 0.0 0.0 0.0 0.0 2.6 0.0 2.6
0.0 0.0 0.0 0.0 0.0 0.0 40.1 340.9 381.0
0.0 0.0 0.0 0.0 0.0 0.0 20.5 0.0 20.5
0.0 0.0 0.0 0.0 0.0 0.0 652.5 160.2 812.7
0.0 0.0 0.0 0.0 0.0 0.0 607.9 2.0 609.9
0.0 0.0 0.0 0.0 0.0 0.0 14.1 10.3 24.4
0.0 0.0 0.0 0.0 0.0 0.0 0.0 0.0 0.0
0.0 0.0 0.0 0.0 0.0 0.0 0.0 2.2 2.2
0.0 0.0 0.0 0.0 0.0 0.0 0.0 0.3 0.3
0.0 0.0 0.0 0.0 0.0 0.0 0.0 0.2 0.2
0.0 0.0 0.0 0.0 0.0 0.0 0.0 0.0 0.0
0.0 0.0 0.0 0.0 0.0 0.0 0.0 0.0 0.0
0.0 0.0 0.0 0.0 0.0 0.0 0.0 6.2 6.2
0.0 9.2 9.2 0.0 0.1 0.1 3566.1 1976.9 5543.0
(82)
SEAROAD &

vuqyXudAnnexure - 10.5
ifjogu ds fofHkUu lk/kuksa }kjk [kk| ,oa vkS/kksfxd mn~ns';ks ds fy;s ued dh vkiwfrZMOVEMENT OF SALT FOR EDIBLE AND INDUSTRIAL PURPOSE
BY DIFFERENT MODES OF TRANSPORT
(Quantity in '000 Tonnes)
Purpose Mode of 2011-12 2012-13 2013-14
Transport
HumanConsumption Rail 3571.2 3480.9 3566.2
Road 2395.4 2424.7 1976.9
Sea 0.0 2.0 0.0
Total 5966.6 5907.6 5543.1
IndustrialConsumption Rail 1118.6 958.4 848.3
Road 9967.5 10395.6 10005.3
Sea 202.8 84.1 151.5
Total 11288.9 11438.1 11005.1
Total Rail 4689.8 4439.3 4414.5
Road 12362.9 12820.3 11982.2
Sea 202.8 86.1 151.5
Total 17255.5 17345.7 16548.2
(83)

vuqyXudAnnexure - 11.1
dkfLVd lksMk ,oa lksMk ,'k dk foxr ckjg o"kksZ esa mRiknuPRODUCTION OF CAUSTIC SODA AND SODA ASH DURING LAST 12 YEARS
(Lakh Tonnes)
Year Soda Ash Caustic Soda
Source : Alkali Manufacturers' Association of India, New Delhi.
2002-03 21.38 16.15
2003-04 22.38 17.35
2004-05 23.46 18.09
2005-06 22.22 19.39
2006-07 20.47 19.93
2007-08 21.06 21.60
2008-09 21.29 21.92
2009-10 21.47 23.26
2010-11 23.00 24.52
2011-12 25.18 25.56
2012-13 24.92 25.4
2013-14 24.16 25.92
(84)

vuqyXu
dA
nn
exu
re -
11.2
fofHkUu jkT;ksa esa ued d
ss mi&
mRikndksa dk fooj
.kP
art
icu
lars
of
By-P
rod
ucts
in
vari
ou
s S
tate
s
S.
Nam
e o
f th
eN
am
e o
f B
y P
rod
uct
2011-1
22012-1
32013-1
4
No
.S
tate
Qty
.V
alu
eQ
ty.
Valu
eQ
ty.
Valu
e(I
n T
on
nes
)(I
n L
akh
Rs.
)(I
n T
on
nes
)(I
n L
akh
Rs.
)(I
n T
on
nes
)(I
n L
akh
Rs.
)
1G
uja
rat
Gyp
sum
129565.0
01091.6
9230467.4
42261.2
9131999.0
0949.4
6
2Ta
mil
Nadu
Gyp
sum
37100.0
0242.0
930245.0
0262.6
538917.0
0273.6
7
To
tal
166665.0
01333.7
8260712.4
42523.9
4170916.0
01223.1
3
3G
uja
rat
Liq
uid
Bro
min
e1341.1
62445.0
41573.0
12468.6
11904.2
62502.2
0
4Ta
mil
Nadu
Liq
uid
Bro
min
e231.0
0373.6
9200.0
0200
227.0
0227.0
0
To
tal
1572.1
62818.7
31773.0
12668.6
12131.2
62729.2
5G
uja
rat
Magnesi
um
Chlo
ride
16336.0
0660.2
416200.0
0525.1
014670.0
0725.5
6
6G
uja
rat
Magnesi
um
Sulp
hate
37.0
02.2
240.0
02.4
30.0
02.5
5
7R
aja
sthan
Cattle
Lic
ks1286 B
rick
s0.7
71375
2426
1.7
1C
rude S
ulp
hate
--
--
Brick
s
(85)

vuqyXudAnnexure 12.1
The Gazette of India
EXTRAORDINARY
PART II Section 3 -Sub-Section (ii)
PUBLISHED BY AUTHORITY
NEW DELHI, THURSDAY, JULY25, 1991/SRAVANA 3, 1913
Separate paging is given to this part in order that it may be filed as a separate compilation.
S.Q. 482(E) In exercise of the powers conferred by sub-section (I) of Section 16 A of the Export (Quality Control and Inspection) Act, 1963 (22 of 1963), the Central Government hereby directs that the sub-section (d) of Section 6 of the Act shall not apply from the date of publication of this Notification in the Official Gazette for export of Agriculture and Food Products, Fruit Products, Fish and Fishery Products, Chemicals & Allied Products, Jute Products, Coir Products including Coir Yarn (baled) and Coir Yarn ( Non-Baled), hand knotted Woollen Carpets and Human Hair (Double Drawn) by Star Trading Houses, Trading Houses and Export Houses recognized by the Central Government.
( F.No. 6/597-EI&EP)A.K. Goswami, Jt. Secretary
(86)

vuqyXudAnnexure - 12.2
ued dk fu;kZrEXPORT OF SALT
(Quantity in '000 tonnes)
YEAR QUANTITY OF SALTEXPORTED
1949 149.3
1950 138.1
1951 76.1
1952 296.7
1953 298.7
1954 232.7
1955 249.3
1956 312.3
1957 445.2
1958 296.8
1959 344.5
1960 448.6
1961 158.4
1962 164.7
1963 267.6
1964 357.7
1965 330.8
1966 386.9
1967 449.8
1968 617.8
1969 621.3
1970 479.0
1971 319.3
1972 435.9
1973 394.3
1974 308.8
1975 491.3
1976 466.9
1977 410.2
1978 63.0
1979 91.0
1980 109.8
YEAR QUANTITY OF SALTEXPORTED
1981 229.9
1982 330.8
1983 486.5
1984 251.9
1985 447.2
1986 433.0
1987 431.2
1988 549.5
1989 605.8
1990 666.1
1991 572.9
1992 406.6
1993 605.4
1994 472.6
1995 516.4
1996 546.7
1997 531.1
1998 406.9
1999 828.8
2000 1056.8
2001 1613.5
2002 1365.9
2003 1222.4
2004 2204.4
2005-06 2976.4
2006-07 1897.5
2007-08 1893.1
2008-09 2438.77
2009-10 2895.75
2010-11 3867.9
2011-12 3771.8
2012-13 5003.66
2013-14 5960.98
(87)

vuqyXudAnnexure - 12.3
ns'kokj ued dk fu;kZrCOUNTRY - WISE EXPORT OF SALT
('000 tonnes)
A. BY SEA
1 Angola 3.60 2.40 2.91
2 Australia 1.00 0.2 0.73
3 Africa 0.00 0 0.03
4 Bahrain 2.14 6.00 3.39
5 Bangladesh 238.00 736.30 250.32
6 Barkin 0.00 0.00 0.03
7 Brunei 0.10 0.03 0.08
8 Benin 0.00 0.00 2.13
9 Botswana 0.00 0.00 0.04
10 China 270.29 912.20 2744.20
11 Comoros 0.00 0.10 0.00
12 Congo 3.05 3.40 6.56
13 Cote-Divoire 0.00 0.60 3.89
14 Cyprus 0.00 0.00 0.03
15 Denmark 0.15 0.00 0.00
16 Dominican Republic 0.00 0.00 1.95
17 Equatorial Guinea 0.15 0.30 1.40
18 East Timor 0.00 0.00 0.17
19 Fiji 3.00 3.00 3.06
20 Gabon 0.50 0.10 0.42
21 Georgia 0.00 0.10 0.00
22 Germany 0.00 0.03 0.00
23 Ghana 1.53 2.40 2.21
24 Guade Loupe 0.05 0.00 0.00
25 Guinea 2.00 0.00 0.13
26 Guyana 0.02 0.10 0.07
27 Gambia 0.00 0.00 0.03
28 Hongkong 50.00 40.40 1.80
29 Indonesia 473.20 221.00 203.00
30 Iraq 0.00 0.20 0.00
31 Ireland 0.10 0.00 0.00
32 Ivory Coast 4.00 1.40 0.70
33 Italy 0.00 0.00 0.05
34 Jamaica 0.00 0.10 0.05
35 Japan 1741.45 1844.40 1036.92
36 Jordan 0.10 0.00 0.00
37 Kelag 0.15 0.00 0.00
38 Kenya 0.30 0.01 0.08
39 Kiribati 0.00 0.30 0.14
40 Korea 112.40 131.20 700.59
41 Kuwait 4.00 3.30 3.36
42 Liberia 8.00 5.00 5.83
43 Lebnon 0.00 0.00 0.04
44 Malawi 2.30 2.00 4.46
45 Malaysia 47.00 51.10 109.08
46 Maldives 3.45 2.30 4.19
47 Mauritius 1.00 1.00 1.46
48 Medagascar 1.00 0.10 1.31
49 Mozambique 0.10 0.20 0.82
Sl. Name of the 2011-12 2012-13 2013-14
No. Country
Sl. Name of the 2011-12 2012-13 2013-14
No. Country
50 Muscat 0.35 0.00 0.00
51 Martinque 0.00 0.00 0.04
52 New Calendonia 0.10 0.10 0.10
53 New Guniea 0.80 0.00 0.00
54 New Zealand 0.10 0.20 0.40
55 Nigeria 1.90 6.60 2.12
56 Oman 6.85 7.50 10.04
57 Papu New Guinea 1.11 5.00 2.36
58 Philipines 0.00 2.50 2.06
59 Qutar 213.40 436.02 469.40
60 Quboos 0.00 0.00 0.22
61 Reunion 16.45 0.20 0.78
62 Russia 0.00 0.00 0.02
63 Samoa 0.05 0.20 0.51
64 Saudia Arabia 0.00 0.00 0.21
65 Seyechelles 0.10 0.80 0.42
66 Sierraleone 5.60 10.20 10.22
67 Singapore 122.10 0.70 0.96
68 Solomon Ireland 1.05 1.10 1.08
69 South Africa 0.05 0.10 0.05
70 South Korea 0.00 1.40 0.00
71 Sri Lanka 3.60 2.20 0.91
72 Sudan 1.20 0.10 0.32
73 Suriname 0.10 0.00 0.00
74 Senegal 0.00 0.00 0.06
75 Taiwan 0.00 0.00 33.05
76 Tanzania 0.00 1.00 0.40
77 Thailand 0.00 27.70 0.00
78 Togo 0.00 0.11 0.11
79 Tonga 0.00 0.00 0.37
80 Trinidad 0.00 0.05 0.00
81 U.A.E. 48.70 36.50 35.74
82 U.K 0.55 0.30 0.75
83 Uganda 0.15 0.30 0.07
84 Vanuatu 0.00 0.20 10.41
85 Vietnam 226.06 275.00 115.51
86 Vita 0.00 0.10 0.00
87 W. Africa 0.20 0.10 0.27
88 Western Australia 0.00 0.00 0.04
89 Yeman 0.00 0.00 0.00
90 Zambia 0.00 0.00 0.11
Total By Sea 3624.70 4787.55 5796.77
B. BY RAIL
1 Bangladesh 0.00 0.00 0.00
2 Bhutan 2.59 2.56 0.00
3 Nepal 149.11 215.95 164.21
Total By Rail 151.70 218.51 164.21
Grand Total 3776.40 5006.06 5960.98
(88)

vuqyXudAnnexure - 12.4
canjxkgokj fu;kZr fd;s x;s ued dk fooj.kPORT-WISE EXPORT OF SALT AND ITS VALUE
Sl. Name of the 2011-12 2012-13 2013-14
No. Port Quantity Value Quantity Value Quantity Value('000 tonnes) (Lakh ('000 tonnes) (Lakh ('000 tonnes) (Lakh
Rs.) Rs.) Rs.)
I. West Coast
1 Jakhau 680.68 8654.74 740.71 9461.50 1838.66 25590.20
2 Kandla 2399.11 29410.95 3563.64 46067.96 2722.47 31046.64
3 Mumbai 0.00 0.00 0.03 2.00 24.20 363.00
4 Mundra 199.82 3541.19 96.58 2919.39 480.85 10989.35
5 Navlakhi 182.79 1178.40 149.58 1505.96 566.42 9785.62
6 Porbadar 0.00 0.00 9.60 92.16 0.00 0.00
7 Pipavav 3.14 37.52 4.44 104.07 2.91 91.52
8 Bhavnagar 0.00 0 60.00 445.44 25.72 181.73
II. East Coast
1. Chennai 0.00 0.00 0.00 0.00 0.00 0.00
2. Tuticorin 154.51 3942.42 160.57 3082.86 135.54 3141.05
Total 3620.05 46765.22 4785.15 63681.34 5796.77 81189.11
By Rail 151.70 2460.12 218.51 4262.61 164.21 3250.67
Grand Total 3771.75 49225.34 5003.66 67943.95 5960.98 84439.78
(89)

vuqyXudAnnexure - 13.1
ued dk vk;krIMPORT OF SALT
Year Quantity Value in (in tonnes) (Lakh Rupees)
1978 8312 69.48
1979 6585 64.32
1980 9117 95.55
1981 6578 69.17
1982 7872 90.05
1983 5509 63.27
1984 9648 114.76
1985 5592 66.49
1986 9740 116.24
1987 15528 178.53
1988 11185 135.37
1989 14976 137.26
1990 17304 128.86
1991 15816 115.55
1992 14833 101.98
1993 18888 146.58
1994 15639 119.40
1995 22584 179.50
1996 18348 178.03
1997 22162 223.80
1998 22800 227.91
1999 36348 387.86
2000 14934 138.23
2001 37230 368.79
2002 5763 149.84
2003 12093 206.68
2004 75649 846.09
2005 23584 197.57
2006 26451 370.81
2007 28327 409.17
2008-09 30645 552.00
2009-10 27864 549.78
2010-11 12298 600.00
2011-12 17242.6 422.98
2012-13 18105.6 523.81
2013-14 17273.0 677.61
(90)
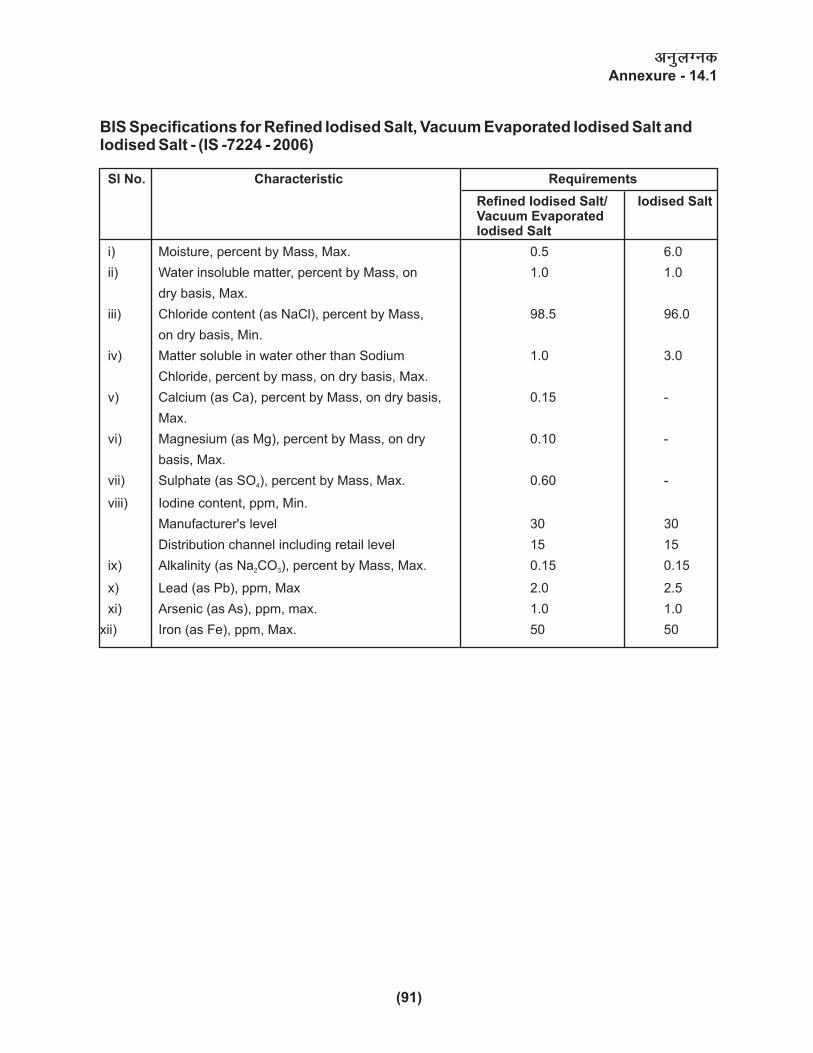
vuqyXudAnnexure - 14.1
BIS Specifications for Refined Iodised Salt, Vacuum Evaporated Iodised Salt andIodised Salt - (IS -7224 - 2006)
Sl No. Characteristic Requirements
Refined Iodised Salt/ Iodised SaltVacuum EvaporatedIodised Salt
i) Moisture, percent by Mass, Max. 0.5 6.0
ii) Water insoluble matter, percent by Mass, on 1.0 1.0
dry basis, Max.
iii) Chloride content (as NaCl), percent by Mass, 98.5 96.0
on dry basis, Min.
iv) Matter soluble in water other than Sodium 1.0 3.0
Chloride, percent by mass, on dry basis, Max.
v) Calcium (as Ca), percent by Mass, on dry basis, 0.15 -
Max.
vi) Magnesium (as Mg), percent by Mass, on dry 0.10 -
basis, Max.
vii) Sulphate (as SO ), percent by Mass, Max. 0.60 -4
viii) Iodine content, ppm, Min.
Manufacturer's level 30 30
Distribution channel including retail level 15 15
ix) Alkalinity (as Na CO ), percent by Mass, Max. 0.15 0.152 3
x) Lead (as Pb), ppm, Max 2.0 2.5
xi) Arsenic (as As), ppm, max. 1.0 1.0
xii) Iron (as Fe), ppm, Max. 50 50
(91)

Specification for Double Fortified Salt prescribed and under Food Safety & Standards Act 2006
"A.15.03: Iron Fortified Iodized Salt (double fortified salt) means a crushed Crystalline Solid, white or pale pink or light grey or light yellow in color, free from contamination with clay and other extraneous adulterants and impurities. Salt used for manufacture of double fortified salt shall have minimum98.5 percent of sodium chloride on dry weight basis and moisture not more than 1.5 percent and it shall conform to the following standards, namely :
1. Moisture : Not more than 1.5 percent by weight
2. Water insoluble matter : Not more than 1.0 percent on dry weight basis
3. Chloride as NaCl : Not more than 97.0 percent on dry weight basis
4. Matter insoluble in dilute HCl : Not more than 0.30 percent on dry weight basis
5. Matter soluble in water other than NaCL : Not more than 2.5 percent on dry weight basis
6. Iron content as Fe : 850-1100 parts per million (ppm)
7. Iodine content
(a) Manufacture level : Not less than 30 ppm
(b) Distribution channel including Retail level : Not less than 15 ppm
8. Phosphorus as P2O5 : 2800-3100 ppm
9. Sulphate as SO4 : Not more than 1.1. percent by weight
10. Magnesium (mg) water soluble : Not more than 0.10 percent by weight
11. pH of 5 percent aqueous solution : 3.5 to 5.5
Provided that double fortified salt may contain Sodium Hexa Meta Phosphate (food grade, 67.70 percent P2O5 content) as stabilizer at concentration not more than 1.0 percent on dry weight basis.
vuqyXudAnnexure - 14.2
(92)

vuqyXudAnnexure - 15.1
dqN egRoiw.kZ mRiknu dsUnzksa ij ued ds 'kqYd eqY;PRICES OF SALT PER TONNE AT SOME IMPORTANT PRODUCING CENTRES
DURING 2012-2013Price Rs./Tonne
State Place/Source Variety Ex-Fy F.O.R.
Gujarat Gandhidham Common Salt (Kurkutch) 550 750Common Salt (Crushed) 650 750Iodised Salt (Kurkutch) 850 950Iodised Salt (Crushed) 1000 1100Powder 1 kg. Pkt. Iod. 1550 1650Powder 50 kg.Pkt. Iod. 1000 1100Refine Salt F.F (50 Kg) 2075 2175Washed Salt 1400 1500
Dhrangadhra Common Salt (Kurkutch) 520-620 650-750Common Salt (Crushed) 550-650 680-780Iodised Salt (Kurkutch) 670-695 800-825Iodised Salt (Crushed) 700-725 830-855Powder 1 kg. Pkt. Iod. 1.34-1.44 pkt 1.47-1.57 pktPowder 50 kg.Pkt. Iod. 730-855 860-885Refine Salt F.F (50 Kg) 1500-2000 1700-2200Washed Salt 950-1150 1100-1300
Bhavnagar Common Salt (Kurkutch) 300-500 660-860Common Salt (Crushed) 350-550 700-900Iodised Salt (Kurkutch) 1060-1110 1210-1260Iodised Salt (Crushed) 1160-1210 1310-1360Powder 1 kg. Pkt. Iod. 1200-1300 1560-1660Powder 50 kg.Pkt. Iod. 1100-1200 1400-1500Refine Salt F.F (50 Kg) - -Washed Salt 910-1010 1060-1160Vacuum Ref. Iod. Salt 5610-5910 5990-6320
Jamnagar Common Salt (Kurkutch)Powder 50 kg.Pkt. Iod.Refine Salt 3100 -Vacuum Ref. Iod. Salt 5120 -
Rajasthan Nawa Crystal Com. Salt 650-1000 950-1300Crushed 750-1100 1050-1410Crystal Iod. Salt 800-1150 1100-1460Crushed 50 kg. pkt. 850-1200 1150-1500Crushed 1 kg. pkt. 1325-1675 1625-1950Powder 1400-1800 1700-2100Ref. Salt 1 kg. pkt. 3000-3400 3350-3750Ref. Salt 50 kg. pkt. 1850-2250 2200-2600Washed Salt 1 kg. pkt. 1550-1900 1850-2200Washed Salt 50 kg. pkt. 1250-1600 1550-1900
Sambhar Crystal Com. Salt 600-950 900-1200Crushed 720-1070 1040-1350Crystal Iod. Salt 750-1190 1150-1450Crushed 50 kg. pkt. 900-1340 1250-1750Crushed 1 kg. pkt. 1500-1950 1800-2100Powder 1600-1700 1700-1900Ref. Salt 1 kg. pkt. 3000-3600 3500-4100Ref. Salt 50 kg. pkt. 1600-1800 1650-2300Washed Salt 1 kg. pkt. 3000-3600 3500-4100Washed Salt 50 kg. pkt. 1250-1550 1600-1800
(93)

State Place/Source Variety Ex-Fy F.O.R.
Phalodi Crystal Com. Salt 350-700 600-+1000Crushed 550-900 800-1200Crystal Iod. Salt 550-900 800-1200Crushed 750-1100 1000-1400Powder 1150-1500 1400-18001 kg. pkt. 1450-2450 2450-345050 kg. pkt. 1050-1575 1250-1675Ref. Salt 1 kg. pkt. 3200-3600 3700-4000Ref. Salt 50 kg. pkt. 1500-1800 1700-1900
Tamil Nadu Tuticorin Crystal Com. Salt 450-1200 600-1500Crushed - -Crystal Iod. Salt 1000-1500 1100-1600Crushed - -Iod. Powder 50*1kg. 800-1300 900-1400Ref. Iod. 50kg pkt. 4400-4800 4500-4900
Vedaranyam Crystal Salt Com. Salt 400-800 450-900Crystal Salt Iod. Salt 700-1100 800-1200
Andhra Pradesh Naupada Crystal Salt 800-1500 900-1600Chinnaganjam Crystal Salt 800-1600 900-1700
Maharashtra Bhayandar Kurkutch 1350-1700 1500-1850Vajani
Karnataka Sanikatta Vajani 2000-2200 -
West Bengal Contai Crystal Salt 1000-2000 1200-2200Crushed Salt 1200-2200 1400-2400
(94)
Exfactory price : Includes cost of Salt up to storage ground, heaping and washing charges if any and excludes cost of gunny bags
F.O.R. price : Includes cess, other levies, cost of packing, loading/ unloading charges and transportation cost up to railhead/ truck.

vuqyXudAnnexure - 15.2
dqN egRoiw.kZ dsUnzks ij ued ds [kqnjk HkkoRETAIL PRICE OF SALT IN SOME IMPORTANT CONSUMING CENTRES
Rs./Kg.
S.No. State Variety of Salt 2011-12 2012-13 2013-14
1 Andhra Pradesh
Loose Non-Iodised
Packed Iodised
Refined free flow Iodised
(FPS)
2 Arunachal Pradesh
Itanagar Packed Iodised - N.A. N.A.(Transport subsidy)
3 AssamGuwahati Packed Iodised - N.A. N.A.
(Govt. fixed price)Loose Non-Iodised
4 BiharPatna Loose Iodised
Packed Iodised - 6.00-13.00 N.A.
6.00-13.005 Chhattisgarh Packed Iodised
for BPL Population N.A. N.A.
6 Delhi Packed Iodised - 16.00 N.A.Refined IodisedRefined Free Flow
7 GoaPanji Packed Iodised - N.A. N.A.
9 JharkhandDumka (Ranchi) Refined Iodised 12.00 N.A. N.A.
Packed Iodised
10 KarnatakaBangalore Poly Pack Iodised (FPS) - N.A. N.A.
11 KeralaThiruvananthapuram Loose Non-Iodised 4.75 4.75-6.00 8.00-10.00
Packed Iodised 8.00 8.00-10.00
12 Lakshadweep Loose Iodised 10.00 N.A. N.A.(Co-op. Soc.)
13 Madhya PradeshDatia Loose Iodised N.A. N.A.
14 PondicherryPacked Refined Iodised 13.00 8.00-15.00 8.00-16.00Packed Iodised 6.00 N.A. N.A.
15 Tamil NaduChennai Packed Refined Iodised 14.00 8.00-16.00 N.A.
Packed Iodised 8.00Tuticorin Packed Iodised
Powder
17 West BengalKolkata Packed Iodised 4.00-14.50 6.00-10.50
18 Rajasthan Packed RefinedIodised Salt N.A. N.A.
(95)

vuqyXudAnnexure - 15.3
tu forj.k iz.kkyh@mfpr nj nqdku ds ek/;e ls vk;ksMhu ;qDr ued dk forj.kIodised Salt Distribution through Public Distribution System (PDS)/ Fair
Price Shop (FPS)
S.No. State Variety
1 Kerala Non-refined
Refined
2 Tamil Nadu Non-refined
Refined
3 Karnataka Non-refined
Refined
4 Gujarat Refined
5 Chhatisgarh Non-refined
6 Madhya Pradesh Refined
7 Rajasthan Refined
8 Tripura Non-refined
9 Himachal Pradesh Refined
10 Sikkim N.A.
11 Jharkhand N.A.
12 Assam Non-refined
Refined
13 Uttar Pradesh Refined
14 Puduchery N.A.
15 Andman & Nicobar N.A.
16 Andhra Pradesh Refined
17 Bihar Refined
18 West Bengal Non-refined
19. Odisha N.A.
20. Arunachal Pradesh N.A.
21. Haryana N.A.
(96)
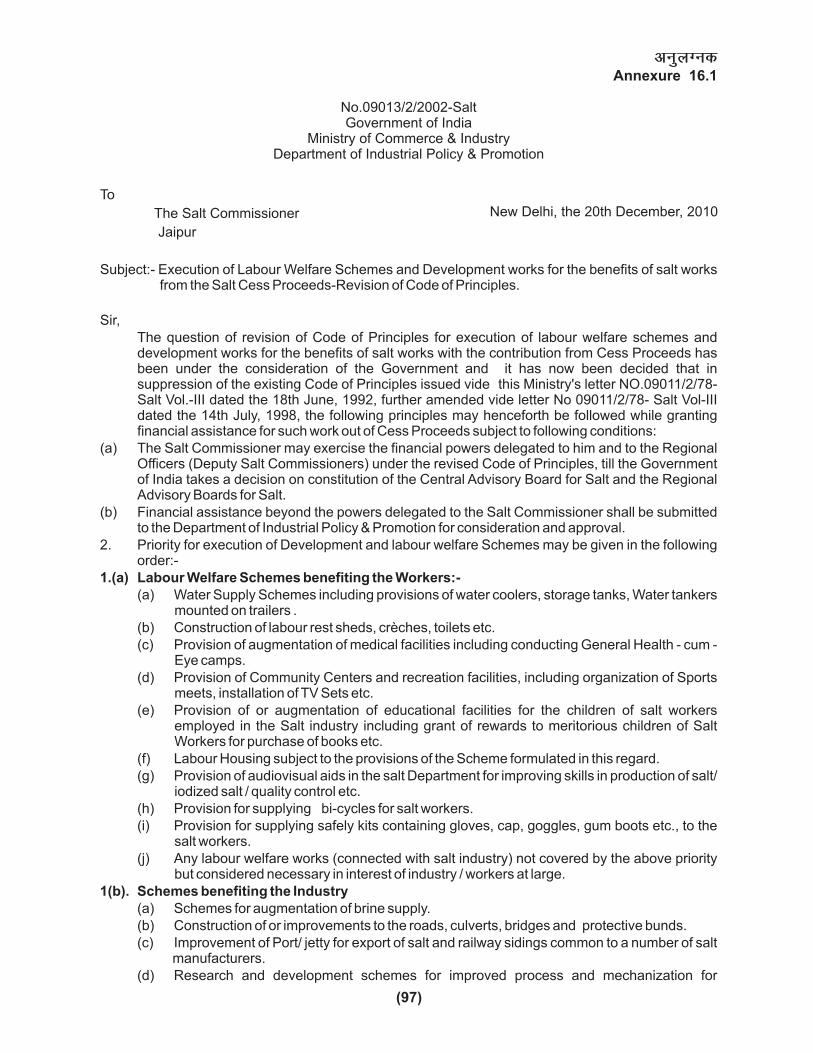
vuqyXudAnnexure 16.1
No.09013/2/2002-SaltGovernment of India
Ministry of Commerce & IndustryDepartment of Industrial Policy & Promotion
To
The Salt Commissioner
Jaipur
Subject:- Execution of Labour Welfare Schemes and Development works for the benefits of salt works from the Salt Cess Proceeds-Revision of Code of Principles.
Sir, The question of revision of Code of Principles for execution of labour welfare schemes and development works for the benefits of salt works with the contribution from Cess Proceeds has been under the consideration of the Government and it has now been decided that in suppression of the existing Code of Principles issued vide this Ministry's letter NO.09011/2/78-Salt Vol.-III dated the 18th June, 1992, further amended vide letter No 09011/2/78- Salt Vol-III dated the 14th July, 1998, the following principles may henceforth be followed while granting financial assistance for such work out of Cess Proceeds subject to following conditions:
(a) The Salt Commissioner may exercise the financial powers delegated to him and to the Regional Officers (Deputy Salt Commissioners) under the revised Code of Principles, till the Government of India takes a decision on constitution of the Central Advisory Board for Salt and the Regional Advisory Boards for Salt.
(b) Financial assistance beyond the powers delegated to the Salt Commissioner shall be submitted to the Department of Industrial Policy & Promotion for consideration and approval.
2. Priority for execution of Development and labour welfare Schemes may be given in the following order:-
1.(a) Labour Welfare Schemes benefiting the Workers:-(a) Water Supply Schemes including provisions of water coolers, storage tanks, Water tankers
mounted on trailers .(b) Construction of labour rest sheds, crèches, toilets etc.(c) Provision of augmentation of medical facilities including conducting General Health - cum -
Eye camps. (d) Provision of Community Centers and recreation facilities, including organization of Sports
meets, installation of TV Sets etc.(e) Provision of or augmentation of educational facilities for the children of salt workers
employed in the Salt industry including grant of rewards to meritorious children of Salt Workers for purchase of books etc.
(f) Labour Housing subject to the provisions of the Scheme formulated in this regard.(g) Provision of audiovisual aids in the salt Department for improving skills in production of salt/
iodized salt / quality control etc.(h) Provision for supplying bi-cycles for salt workers.(i) Provision for supplying safely kits containing gloves, cap, goggles, gum boots etc., to the
salt workers.(j) Any labour welfare works (connected with salt industry) not covered by the above priority
but considered necessary in interest of industry / workers at large.1(b). Schemes benefiting the Industry
(a) Schemes for augmentation of brine supply.(b) Construction of or improvements to the roads, culverts, bridges and protective bunds.(c) Improvement of Port/ jetty for export of salt and railway sidings common to a number of salt
manufacturers. (d) Research and development schemes for improved process and mechanization for
(97)
New Delhi, the 20th December, 2010

harvesting of salt and recovery of byproducts from brine and bitterns (excluding commercial schemes).
(e) Undertaking/sponsoring feasibility studies for improving salt productivity.(f) Any development works (connected with salt industry) not covered by the above priorities
but considered necessary in the interest of the salt industry. 2. Contribution from Salt Cess Proceeds(a) The extent of contribution to be paid for particular schemes may be generally have some relation
to the Cess collection, number of salt works/ labourers benefited. However, the amount of cess collection need not be criteria for extending assistance to the medium, small and co-operative sector salt works. Priority needs to be given for extending assistance to the salt works in backward areas.
(b) The contribution from salt cess proceeds will generally be made in partnership with either the beneficiary and/or the Government/Zilla Parisad/ Panchayat Samity concerned, salt manufacturers Associations/ registered and approved Trust/ Non-Governmental Organizations as the case may be. The extent of financial assistance to be provided for the execution of labour welfare schemes and development works shall, as a rule not exceed 70% of the total cost involved. However, in cases like conducting eye cum Health camps or sports meet or works which are for the common benefit of all salt workers/ manufacturers such as research and development works including Model Salt Farm, 100% assistance could be given from the Salt Cess Proceeds.
(c) Every proposal should be accompanied by an undertaking from the beneficiary / sponsoring agencies that he is/ they are willing to bear the proportionate cost of the scheme. The beneficiary should also submit an estimate duly prepared by the qualified engineers in PWD I, II, III Forms in consultation with the department officers. In respect of the schemes to be executed by the State Government, they have to also send the proposal similarly along with estimate and undertaking.
(d) The benefit of the community development scheme so executed may not be denied to the inhabitants of the locality whether they are salt workers or not.
3. Delegation of financial power(a) Labour welfare schemes, community development and consultancy schemes of common
interest benefiting the salt industry and costing up to Rs. 5 lakhs may be considered for sanction by the Salt Commissioner with 100% assistance from Salt Cess Proceeds on the recommendations of the Regional Advisory Boards for salt or the Central Advisory Board for salt.
(b) Welfare Schemes estimated to cost not more than Rs.15 lakhs each and recommended by the Regional Advisory Board concerned can be sanctioned by the Regional Officer.
(c) Welfare Schemes estimated to cost more than Rs.15 lakhs but not more than 25 lakhs can be sanctioned by the Salt Commissioner on recommendation of the Regional Advisory Boards for salt.
(d) Welfare Schemes costing more than 25 lakhs but not more than 35 lakhs can be considered for sanction by the Salt Commissioner on the recommendation of Central Advisory Board for Salt.
(e) Welfare Schemes costing more than Rs.35 lakhs will be considered for sanction by the Government on recommendation of the Central Advisory Board for Salt.
(f) Welfare Schemes of important and urgent nature estimated to cost not more than Rs.25 lakhs can be considered for sanction by the Salt Commissioner on the recommendation of Works & Loans Sub-committee of the Regional Advisory Boards for Salt and such works shall be placed before the RAB concerned at its next meeting for ratification.
4. Mode of execution of Works(a) Works costing up to Rs.10 lakhs each may be executed by the Salt Commissioner departmentally
or through other agencies as may be considered expedient by the Salt Commissioner as per GFR 132 & GFR 126(2).
(b) Works costing more than Rs.10 lakhs and up to Rs.30 lakhs shall normally be executed by the Central Government/ State Government, PWD or any other Central/ State Government undertaking or by Zilla Parisad/ Municipality/ Panchyat authorities provided where such works can not be entrusted to such agencies/ authorities for sufficient reasons, the Salt Commissioner may with the prior approval of the Central Government, execute such schemes departmentally or through other agencies in terms of GFR 126(2).
(c) Works costing up to Rs.5 lakh and Rs.10 lakhs may however be entrusted by the Regional Officers and Salt Commissioner respectively to the manufacturers/ beneficiary, registered NGO, Trust without taking security deposit for their execution at the estimated cost.
(98)

(d) In respect of deposit works, the advance in full or in installments, as the case may be, may be paid to the executing agency subject to settlement of account by the executing agencies on completion and passing of the works by the competent authority along with the completion report and audited accounts duly signed by the Accounts Officers/ Divisional Accountants, as the case may be, and by the executing agency. The advance should however be paid to the executing agency only as required under CPWD Code/ GFR.
(e) The Government contribution so paid in advance will be recoverable from the executing agency if the executing agency fails to execute the work within the agreed period or if any extension is asked for and granted, within such extended period.
(f) It will be responsibility of the State Government to certify clear title to the land on which the public utility work is executed and of the cess proceeds.
(g) Payment in respect of works entrusted to the contractor will be made as normal procedure prescribed in the CPWD Manual/Code & GFRs.
(h) In respect of labour welfare works, such as purchase of audiovisual aids benefiting multiple salt producers and salt workers, Salt Commissioner will be the custodian of such assets and he will be responsible for their proper maintenance.
5. Advancing beneficiary's share(a) In respect of the execution of any essential work, if the beneficiary salt manufacturers concerned
do not agree to contribute their share of the cost involved, the Salt Commissioner may get such work executed. The share of the beneficiary salt manufacturers in respect of the work will be recovered as mentioned below.
(b) Beneficiary share of cost of works, which may not include Department's supervision charges, is normally to be recovered in advance. In respect of works benefiting major/medium single salt work executed by the beneficiary salt manufacturers themselves, payment will be limited to the Departmental share only. However, in case of works executed by the Department by itself or through other agencies, salt manufacturers who may not be a position to pay their share of the cost in advance, the department may initially meet the expenditure in full and the concerned beneficiary salt manufacturer may be allowed to pay their share in installment: first installment falling due in the month of commencement of the work. The time allowed for payment of the balance amount may not normally exceed the period in which the work is executed.
6. Relaxation in granting financial Assistance (a) The limits of assistance out of cess proceeds to the different categories of works as set out in
Para 2 may be relaxed by the Government in special cases on the recommendations of the Central/Regional Advisory Boards for salt or the Works & Loans Sub-Committee of the concerned Regional Advisory Boards formed for the purpose, if the Salt Commissioner is satisfied that such cases call for a special considerations.
(b) The maintenance of works executed may also be undertaken by the Salt Department provided always that the salt manufacturers concerned undertake to pay the annual expenditure involved on a pro-rata basis either in lump sum or in the form of a special levy on the issues of salt as maybe decided by the Salt Commissioner subject to full recovery being made during the year of maintenance.
7. Validity of Code PrinciplesThe Code of Principles enunciated above will be effective un till further orders or till it is further revised by the Government. This issue with the concurrence of Integrated Finance Wing, Department of Industrial Policy & Promotion, Ministry of Commerce & Industry vide their Dy. No. 1385 /IFW(Fin-II) dated 11-11-2010.
Copy forwarded to :-1. Pay & Accounts Officer, Salt Organization, Jaipur.2. Integrated Finance Wing, DIPP, Udyog Bhawan, New Delhi3. Guard file.
(99)
-Sd-(S.N. Mishra)
Under Secretary to the Govt. of India.

vuqyXudAnnexure - 16.2
ued m|ksx esa fu;ksftr Jfedksa dh vkSlr la[;k dk jkT;okj fooj.kAVERAGE NUMBER OF LABOURERS EMPLOYED IN SALT INDUSTRY
Sl. Name of the State 2011-12 2012-13 2013-14
* Including Daman & Diu
1 Andhra Pradesh 18808 8012 6965
2 Goa 105 99 99
3 Gujarat * 53122 57985 47585
4 Himachal Pradesh 0 0 0
5 Karnataka 170 182 159
6 Maharashtra 2050 1943 4199
7 Orissa 1520 2562 2756
8 Rajasthan 16829 19687 14894
9 Tamil Nadu 18693 17681 8226
10 West Bengal 635 635 520
Total 111932 108786 85403
(100)

(101)
vuqyXudAnnexure - 17.1
ued foHkkx ds vk; vkSj O;; dk fooj.kRECEIPTS & EXPENDITURE ON THE SALT DEPARTMENT
(Figures in lakh rupees)
Year Cess Other Expenditure on Expenditure on LoanCollection Receipts Adminstration Development & Ex-Gratia
Labour Welfare
1970-71 121.8 17.5 47.9 9.6 7.8
1974-75 123.4 18.6 59.2 9.5 2.5
1975-76 116.7 18.3 76.6 14.3 0.6
1976-77 113.2 20.0 71.7 15.1 5.5
1977-78 127.8 23.5 73.0 31.4 4.8
1978-79 133.0 28.2 73.1 45.9 4.6
1979-80 134.0 33.6 78.0 47.2 17.3
1980-81 122.1 37.0 84.6 81.0 11.9
1981-82 135.8 37.7 91.4 50.5 4.5
1982-83 129.0 35.0 110.0 55.4 8.4
1983-84 136.3 31.5 125.5 71.5 5.0
1984-85 157.6 55.2 140.6 70.9 6.9
1985-86 170.4 44.3 155.1 70.0 10.6
1986-87 158.1 47.3 182.8 70.0 10.5
1987-88 169.9 46.6 191.6 87.5 19.8
1988-89 189.9 50.3 207.0 80.2 9.0
1989-90 190.8 54.6 218.0 79.5 11.4
1990-91 195.2 54.3 234.4 30.3 35.2
1991-92 197.5 199.8 258.4 36.6 10.8
1992-93 213.9 127.1 286.4 78.5 2.6
1993-94 227.0 123.8 329.0 69.7 -
1994-95 227.5 87.5 353.9 73.2 10.0
1995-96 246.3 94.1 417.3 94.4 27.0
1996-97 245.2 172.2 464.4 72.7 39.5
1997-98 243.2 138.5 619.5 68.1 36.7
1998-99 233.1 92.8 702.9 94.5 437.9
1999-2000 264.8 629.9 749.5 156.1 79.3
2000-2001 248.4 74.4 770.7 219.7 55.6
2001-2002 268.7 86.8 806.6 115.9 -
2002-2003 297.4 142.4 864.2 148.7 45.4
2003-2004 277.7 127.5 837.1 137.6 -
2004-2005 300.2 167.8 992.5 196.4 27.1
2005-2006 294.6 141.5 1013.0 178.6 243.9
2006-2007 279.7 204.13 1091.1 165.3 509.9
2007-2008 287.3 7727.63* 1178.6 125.8 45.72
2008-2009 294.0 3825.9* 1749.5 79.0 87.10
2009-2010 338.3 237.2 2225.5 105.8 0.3
2010-2011 338.6 268.9 2303.4 108.7 0.0
2011-2012 367.03 230.82 2364.85 148.2 0.0
2012-2013 348.99 274.28 2490.1 121.7 0.0
2013-2014 330.44 289.70 2595.4 122.4 0.0
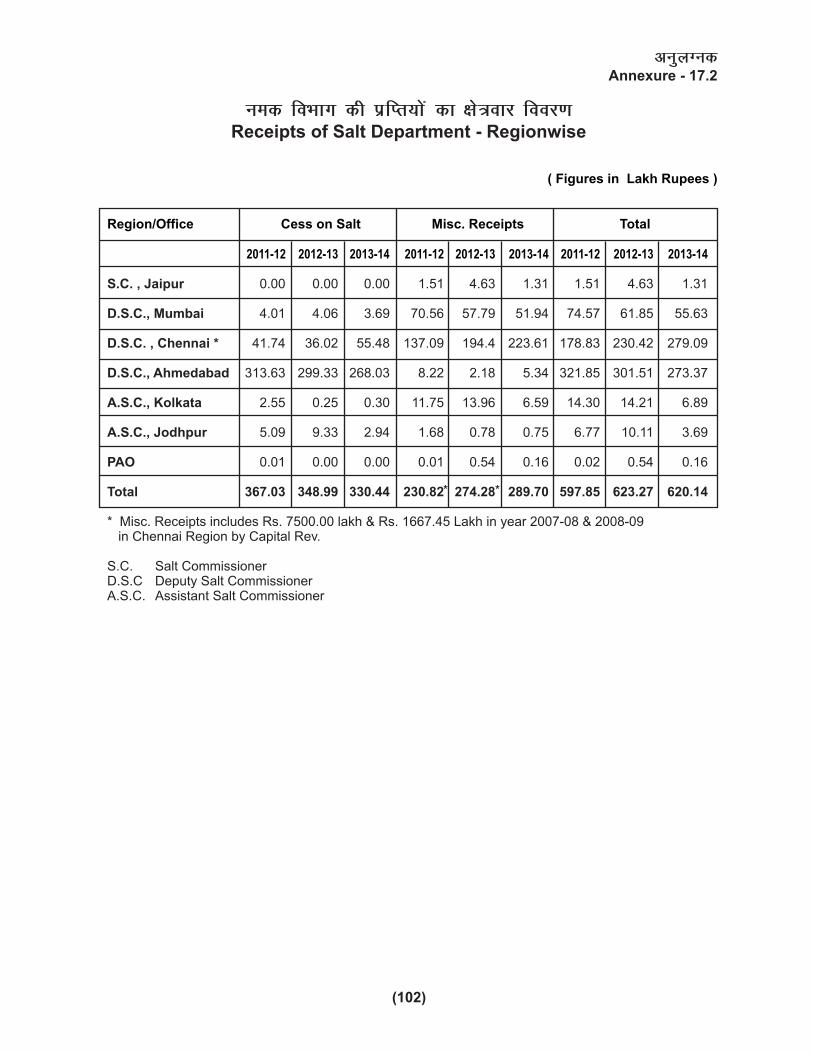
(102)
vuqyXudAnnexure - 17.2
ued foHkkx dh izfIr;ksa dk {ks=okj fooj.kReceipts of Salt Department - Regionwise
( Figures in Lakh Rupees )
Region/Office Cess on Salt Misc. Receipts Total
2011-12 2012-13 2013-14 2011-12 2012-13 2013-14 2011-12 2012-13 2013-14
S.C. , Jaipur 0.00 0.00 0.00 1.51 4.63 1.31 1.51 4.63 1.31
D.S.C., Mumbai 4.01 4.06 3.69 70.56 57.79 51.94 74.57 61.85 55.63
D.S.C. , Chennai * 41.74 36.02 55.48 137.09 194.4 223.61 178.83 230.42 279.09
D.S.C., Ahmedabad 313.63 299.33 268.03 8.22 2.18 5.34 321.85 301.51 273.37
A.S.C., Kolkata 2.55 0.25 0.30 11.75 13.96 6.59 14.30 14.21 6.89
A.S.C., Jodhpur 5.09 9.33 2.94 1.68 0.78 0.75 6.77 10.11 3.69
PAO 0.01 0.00 0.00 0.01 0.54 0.16 0.02 0.54 0.16
Total 367.03 348.99 330.44 230.82 274.28 289.70 597.85 623.27 620.14
* Misc. Receipts includes Rs. 7500.00 lakh & Rs. 1667.45 Lakh in year 2007-08 & 2008-09 in Chennai Region by Capital Rev.
S.C. Salt CommissionerD.S.C Deputy Salt CommissionerA.S.C. Assistant Salt Commissioner

vuqyXudAnnexure - 17.3
o"kZ 2013&14 ds nkSjku ued foHkkx ds xSj ;kstuk en O;; dk {ks=okj fooj.kEXPENDITURE OF SALT DEPARTMENT (NON-PLAN) DURING THE YEAR 2013-14
(Figures in lakh rupees)
S.C., Jaipur 320.05 8.78 7.28 26.17 2.70 1.24 19.55 0.00 3.97 1.66 0.00 391.40
D.S.C., Mumbai 552.50 4.22 9.26 17.43 0.00 1.49 10.86 0.00 2.23 25.09 0.00 623.08
D.S.C., Chennai 795.45 7.85 9.27 17.52 0.75 0.50 48.15 0.00 2.65 3.93 0.00 886.07
D.S.C., Ahmedabad 398.21 0.87 3.24 8.24 15.84 0.10 30.62 0.00 0.86 0.21 0.00 458.19
A.S.C., Kolkata 142.75 0.54 2.46 1.55 1.09 0.17 1.44 0.00 0.22 0.00 0.00 150.22
A.S.C., Jodhpur 123.00 0.73 1.60 1.97 0.54 0.03 11.80 0.00 0.20 0.00 0.00 139.87
P & A. O, Jaipur 63.04 1.28 1.27 1.90 0.00 0.00 0.00 0.00 1.50 0.00 0.00 68.99
Total 2013-14 2395.00 24.27 34.38 74.78 20.92 3.53 122.42 0.00 11.63 30.89 0.00 2717.82
Total 2012-13 2324.90 15.33 31.30 67.95 17.42 4.22 121.73 0.00 9.80 19.15 0.00 2611.80
Total 2011-12 2176.32 25.01 34.90 72.07 15.91 3.73 148.20 0.00 15.09 21.82 0.00 2513.05
S.C. Salt Commissioner
D.S.C. Deputy Salt Commissioner
A.S.C. Assistant Salt Commissioner
P & A.O Pay and Accounts Officer
Region/office Salary Medical TravellingAllow-ance
OfficeExp.
(Misc.)
RRT Publi-cation
Works Ex-gratia
Subsidy/OTA/
Loan/IT
LegalChar-ges
Grantin
Aid
Total
(103)
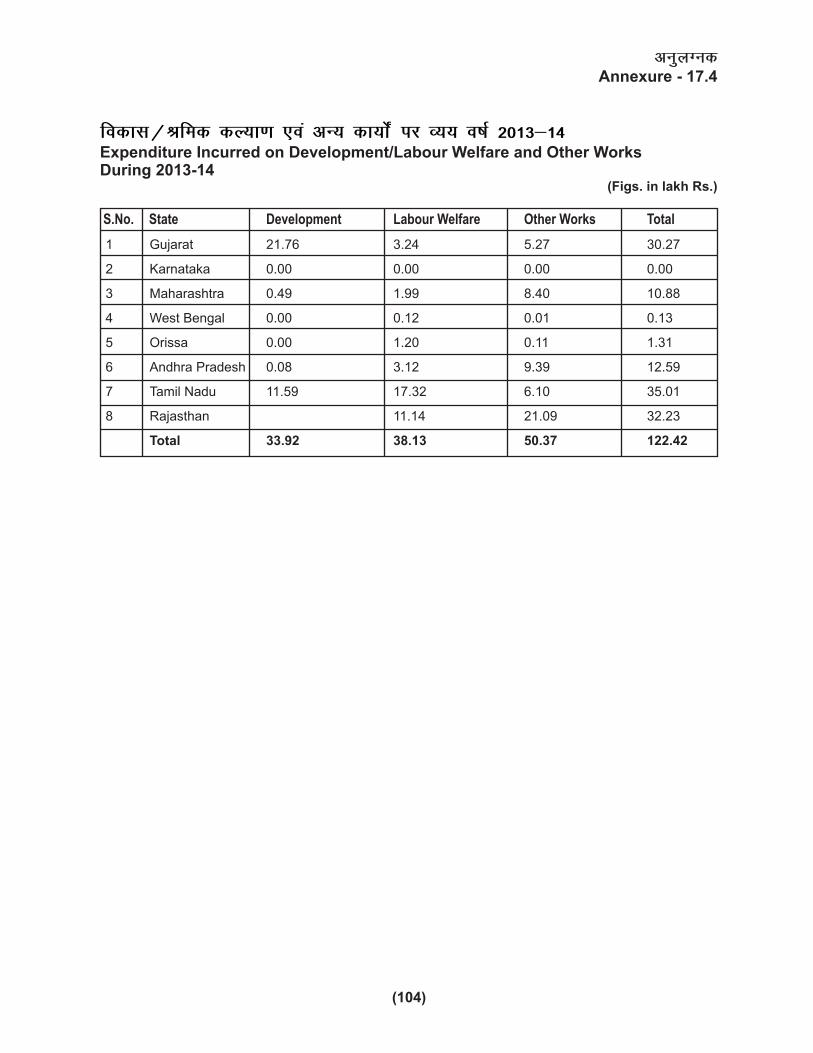
vuqyXudAnnexure - 17.4
Expenditure Incurred on Development/Labour Welfare and Other WorksDuring 2013-14
(Figs. in lakh Rs.)
S.No. State Development Labour Welfare Other Works Total
fodkl@Jfed dY;k.k ,oa vU; dk;ks± ij O;; o"kZ 2013&14
1 Gujarat 21.76 3.24 5.27 30.27
2 Karnataka 0.00 0.00 0.00 0.00
3 Maharashtra 0.49 1.99 8.40 10.88
4 West Bengal 0.00 0.12 0.01 0.13
5 Orissa 0.00 1.20 0.11 1.31
6 Andhra Pradesh 0.08 3.12 9.39 12.59
7 Tamil Nadu 11.59 17.32 6.10 35.01
8 Rajasthan 11.14 21.09 32.23
Total 33.92 38.13 50.37 122.42
(104)

(105)
vuqyXud
No. 05020/1/2009-SaltGovernment of India
Ministry of Commerce & IndustryDepartment of Industrial Policy & Promotion
(Salt Desk)
Udyog Bhawan, New Delhith Dated the 25 May, 2009
O R D E R
Subject : Constitution of Committee to monitor and facilitate the pace of the activities related to Universal Salt Iodisation.
Significant progress has been made in creating adequate salt iodisation capacity, increasing production of iodised salt in the country. The production of iodised salt has increased from 28 lakh tones in 1992 to about 50 lakh tones in 2008. However, there remains gap between requirement, production and supply. There is also a need to strengthen the quality monitoring mechanism.
With a view to monitoring the pace of the progress of the activities related to Universal Salt Iodisation pertaining to the components handled by Salt Commissioner, it has been decided to constitute a Committee of stakeholders. The composition of the Committee will be as under :
Shri S. SundaresanSalt Commissioner Chairman
Shri K.R. VaidheeswaranDeputy Secretary, DIPP Member
Adviser (Nutrition)DGHS, M/O Health & FW Member
Representative from UNICEF Member
Representative from World Health Organization Member
Representative from UN WFP Member
Representative fromGAIN Member
Annexure – 18.1

(106)
Representative from Micronutrient Initiative Member
Dr. C.S. Pandav,ICCIDD, C/o. AIIMS Member
Shri M.A. AnsariDeputy Salt Commissioner(NIDDCP) Member-Secretary
Depending upon the requirement, Members could be co-opted from the State Government or other agencies.
TERMS OF REFERENCE
The Committee will formulate Plan of Action on the following –
i. Achieve universal access of adequately iodised salt i.e. replacing common salt with iodised salt for direct human consumption in the entire country.
ii. Quality monitoring measures especially at the production sources.iii. Facilitation of supply of iodised salt under the PDS.iv. Support to small salt producers to bring them into main stream of iodisation
program.v. Stepping up of information, education and communication compaign.vi. Installing monitoring information system for quantity, quality and supply.
The traveling expenses of the member in connection with the above work would be met by the respective organization.
(Ramchander)Under-Secretary to the Govt. of India.
Copy to all the members of the Committee.Copy to S. Sundaresan, Salt Commissioner, Jaipur.

(107)
S.No. Name & Designation Period Training Particulars
1. Shri S.P. Meena, 21 -10-2013 to 25-10-2013 Record Management fromSuperintendent (M) National Archives fo India,Jaipur Jaipur
2. Shri R. G. Bhave 31.3.2014 Seminar on RTI atSuperintendent of Salt ISTM, DelhiJaipur
vuqyXudAnnexure - 19.1
o"kZ 2013&14 esa ued foHkkx ds dkfeZdksa dk izf'k{k.kSalt Department Officials Training during 2013-14

¼vuqyXud½ Annexure 20.1GOVERNMENT OF INDIA
OFFICE OF THE SALT COMMISSIONERLAVAN BHAWAN, 2-A LAVAN MARG
JAIPUR 302004P R O F O R M A A C C O U N T
RECEIPTS AND EXPENDITURE FROM THE CESS PROCEEDS FOR THE YEAR 2013-14Form ' F '
RECEIPTS(In Rupees)
S.No Particulars Amount
1. Opening Balance -1720272593
2. Amount of collection on account of Cess 33043743
3. Amount realised on account of loans and advances 0
4. Interest realised on account of loans and advances 0
5. Other receipts that may be treated as creditable to the cess collection 28970028
6. Capital Receipt * 0
Grand Total -1658258822
EXPENDITURE
S.No. Particulars Amount
1. Cost of collection of Cess (proportionate share of expenditure -10%) 15585357
2. (i). Salt Commissioner's Office 37185686(ii). Pay & Accounts Office (Salt), Jaipur 6899467(iii). Regional Head Quarter's Office , 59601999
3. EXPENDITURE ON:
(i). Supervisory Estt. and staff employed in Regions 140268217
( i.e. Factory staff)
(ii). Expenditure on Engineering (Work shop) 0
(iii). Estt. Maintenance and extension of factories research station 0
and model farms not declared as commercial concerns
(iv). Development works in Salt Industry 8429410
(v). Welfare of labour employed in Salt factories 3812993
(vi). Loans and advances for remodeling and re-adjustment of 0
Salt Works/ Factories
(vii). Payment to licensees 0
4. Ex-gratia. 0
Total 271783129
Closing Balance -1930041951
Grand Total -1658258822
Certified that the above figures have been re-conciled with those booked in Government Account.
NOTE : Total Receipt Rs. Rs. 6,20,13,771/- Total Expenditure Rs. 27,17,83,129/- is verified including Rs. 22,74,000/- Expenditure by CPWD Letter of Authority issued by CCA Ministry of Industry, New Delhi.
Sd/-(C.S. Shekhawat)Accounts Officer
Jaipur
Sd/-
Pay & Accounts OfficerJaipur
(B.L. Bairwa)Sd/-
Salt CommissionerJaipur
(M.A. Ansari)
(108)


![g]kfn ;/sf/ lgdf{0f ;fdu|L ;xh?kdf /fVg ... - sajhakura.com.np](https://img.pdfslide.us/doc/110x75/5bfc469e09d3f225088bf05c/gkfn-sf-lgdf0f-fdul-xhkdf-fvg-gatepdfpdf-ljrf-dl-.jpg)