Embed Size (px)
Citation preview

DI
SC
US
SI
ON
P
AP
ER
S
ER
IE
S
Forschungsinstitut zur Zukunft der ArbeitInstitute for the Study of Labor
GDP and the Value of Family Caretaking:How Much Does Europe Care?
IZA DP No. 5046
July 2010
Gianna C. GiannelliLucia MangiavacchiLuca Piccoli
GDP and the Value of Family Caretaking:
How Much Does Europe Care?
Gianna C. Giannelli University of Florence, CHILD, PSI and IZA
Lucia Mangiavacchi
Paris School of Economics and University of the Balearic Islands
Luca Piccoli
Paris School of Economics and University of the Balearic Islands
Discussion Paper No. 5046 July 2010
IZA
P.O. Box 7240 53072 Bonn
Germany
Phone: +49-228-3894-0 Fax: +49-228-3894-180
E-mail: [email protected]
Any opinions expressed here are those of the author(s) and not those of IZA. Research published in this series may include views on policy, but the institute itself takes no institutional policy positions. The Institute for the Study of Labor (IZA) in Bonn is a local and virtual international research center and a place of communication between science, politics and business. IZA is an independent nonprofit organization supported by Deutsche Post Foundation. The center is associated with the University of Bonn and offers a stimulating research environment through its international network, workshops and conferences, data service, project support, research visits and doctoral program. IZA engages in (i) original and internationally competitive research in all fields of labor economics, (ii) development of policy concepts, and (iii) dissemination of research results and concepts to the interested public. IZA Discussion Papers often represent preliminary work and are circulated to encourage discussion. Citation of such a paper should account for its provisional character. A revised version may be available directly from the author.
IZA Discussion Paper No. 5046 July 2010
ABSTRACT
GDP and the Value of Family Caretaking: How Much Does Europe Care?
This study estimates the size and value of unpaid family caretaking activities at a European level. While at a country level several studies are available, a comprehensive evaluation for Europe as a whole was missing so far, mainly due to data limitations. This paper fills this gap using a method that merges the information of an EU household survey (EU-SILC) with a time use survey (HETUS). Monetary values of unpaid family domestic work and unpaid family childcare work are obtained applying both the opportunity cost and the market replacement approaches. For Europe as a whole, the total value of these activities ranges between 20.1 per cent and 36.8 per cent of the EU GDP, depending on the applied methodology. The national values of these activities are discussed and an interpretation of the country differentials in the family caretaking gender gaps is given in terms of differences in culture, economic development and welfare state. JEL Classification: D19, J16, R20 Keywords: unpaid domestic work, family care work, gender inequality, opportunity cost,
market replacement approach Corresponding author: Gianna Claudia Giannelli University of Florence Department of Economics Via delle Pandette 9 50127 Firenze Italy E-mail: [email protected]

1 Introduction
Unpaid family caretaking encompasses domestic work and care provided by members of a household to
other members. This work is similar to that supplied in paid domestic and care occupations, such as
those related to the provision of domestic services, childcare, nursing, and care of the elderly, which often
are among the lowest paid occupations in the labour market. The majority of unpaid family workers
are women, and the recipients of domestic and care services are other members of the household, in
particular children, the elderly, and disabled members. Unpaid family caretaking accounts for a large
share of people's e�ort to survive, reproduce and increase their well-being. Many individuals spend a
relevant share of their time in performing these activities, sometimes for their own choice, some other
because they cannot a�ord to buy similar services in the market, or because these services are rationed
or not adequately provided by the State.
Hence, it is important not only to have a quantitative representation of the time spent in family
caretaking activities relative to all other activities performed in a society, but also to attribute monetary
values to these activities, a problem which is relevant under at least three respects. First, knowing the
value of unpaid family domestic and care work allows a comparison with the value of work performed
in market activities. Second, knowing the value of unpaid family caretaking is particularly important to
understand the real contribution of women to the national product and the dimension of gender gaps,
since this type of work is still predominantly provided by women. Third, it helps performing cost bene�t
analysis to decide whether the best strategy for supplying family services is through the market, or
through the State, or through the family itself by means of an adequate public support.
While at a country level several studies on the distribution of time among all types of activities
are available, only a few try to assess the value of unpaid family caretaking. The evaluation of unpaid
family work, in fact, requires detailed information on the use of time and on the value of market work
which is used to impute a value to household work. Any research on this topic faces two problems: i)
such information, when available, is normally contained in di�erent surveys for di�erent years, and ii)
it is often di�cult to compare it across countries. As to the latter, recently EUROSTAT has made an
important e�ort for harmonizing time use surveys (the Harmonised European Time Use Survey, HETUS)
and income surveys (the European Survey of Income and Living Conditions, EU-SILC).
This paper addresses for the �rst time the issue of measurement of unpaid family caretaking at the EU
level, exploiting the harmonised data to combine the information on time use with the information on the
values of hours of work in di�erent occupations in the market (wages). The focus is on two components
of unpaid family caretaking work, namely, unpaid family domestic work (UFDW), which encompasses
household production activities not involving personal caring of other household members, and unpaid
family childcare work (UFCW), which encompasses activities related to personal care of children. Family
care of the elderly is left out of the analysis because of the lack of harmonised data on this aspect. The
analysis yields several results. First, it allows to estimate the overall value of unpaid household work at
the EU level and the contribution to it of each EU member state, so that its dimension over GDP can be
appreciated. Second, it allows to investigate the gender di�erences in the size and value of this work both
at the EU and national levels. Third, it allows to group countries in clusters that show a similar attitude
towards the role of domestic production of goods and services for people's well being and to interpret the
observed di�erences between countries in terms of cultural traditions, economic development and welfare
state regimes.
The paper is organized as follows. Section 2 reviews the literature on unpaid family caretaking
activities. Section 3 describes the data, the matching of HETUS and EU-SILC and deals with the
estimation of the hourly wages used to compute the values of UFDW and UFCW. Section 4 presents the
results and a cross country analysis of the role played by cultural traditions, economic development and
2
welfare state regimes in determining the size of UFDW and UFCW. Section 5 concludes.
2 The literature
The literature related to unpaid family caretaking work has a long tradition. Many scholars, starting
with the pioneering work of Margaret Reid (1934), have attempted to estimate the monetary value of
home production, with the aim of evaluating unpaid domestic and care work and integrating them in the
System of National Accounts with the so called �Satellite Accounts�. These methods have been based
on the experiences of individual researchers, as Gronau (1973), Nordhaus and Tobin (1973), Kendrick
(1972, 1979), Eisner et al. (1982), Ironmonger (1994, 1996, 1997) Goldschmidt-Clermont and Pagnossin-
Aligisakis (1999) and by initiatives of several international institutions1. As a result, in the national
economic accounts, the economic activities are now categorized as (i) System of National Accounts
(SNA) production activities; (ii) non-SNA production activities (food preparation, childcare, adult care,
making and care of textiles, upkeep of dwelling and surroundings, repairs and maintenance of dwelling
and of household equipment, household management and shopping, gardening and pet care) and unpaid
work for the community;(iii) non-economic activities, sometimes called personal activities (physiological
and recreational activities and self-education).
Another strand of related studies focuses on the relationship between domestic, family care and
market work. With regards to domestic work, in order to appreciate the perception of the burden of
domestic work within the couple, Davis and Greenstein (2004) use data from the International Social
Justice Project in which the division of household work was measured by asking each partner who usually
did the housework. They �nd signi�cant national di�erences in the division of domestic work: in nations
where women are more employed in the market, like Russia, women are more likely to report that
husbands perform at least half of the household work. Overall, it seems that the division of domestic
labour does not change much over time. Breen and Cooke (2005) ask why the gendered division of
domestic labour has proved so resistant to change despite the growth in married women's labour-force
participation. Using data for 22 countries from the 1994 International Social Survey Programme they
show that what is required is that there be a greater proportion of economically autonomous women
within the society as a whole, together with a su�ciently large proportion of men who, if faced with
an economically autonomous woman, would rather participate in domestic tasks than endure marital
breakdown.
At the European level, using qualitative data drawn from the European Quality of Life Survey 2003,
Voicu, Voicu, and Strapkova (2007) conduct a comparative analysis on the gender division of domestic
work within the couple. They concentrate on di�erences across countries, �nding various patterns across
Europe. In the Nordic countries, couples spend a relatively restricted amount of time on housework,
sharing it quite equally. In the Southern countries, as well as in Ireland and the United Kingdom, wives
daily spend plenty of time on domestic chores, while men tend to avoid such activities. In most of the
ex-communist countries, both spouses spend many hours, daily, on housework. In the Western-Central
Europe, the daily housework load is higher than in Scandinavia but lower than in the Eastern and
Southern countries. However, most of the Western couples involve men less often in housework than the
Nordic and ex-communist countries, and they display higher gender inequalities.
Anxo et al. (2007) study lifetime gender di�erences in the allocation of time between market work,
domestic work and leisure, conducting a comparative analysis of Italy, France, Sweden and the United
States. Their results show that the time that individuals spend in unpaid work is highly related to the
presence of children, especially the youngest (under 6 years old). Italian women are those whose domestic
1See ILO (1995, 1996); OECD (1992, 1995, 1999); Swiebel (1999); EUROSTAT (2000, 2003); Trewin (2000); SF (1999);SNZ (1999); Holloway, Short, and Tamplin (2002).
3
time increases most in absolute terms when they become mothers (more than 22 hours on average per
week), followed by American women (more than 18 hours on average per week), all other things being
equal. As children grow up, women reduce the time devoted to unpaid work, but when children are
teenagers or young adults (16-25) they still spend from 5 hours more per week (in Sweden) to 13 hours
more (in Italy) in unpaid work than women without children. After the peak of the childcare period,
domestic work tends to decrease for both females and males and starts increasing again slightly after
retirement for both females and males. The positive gender di�erential is always present, showing its
largest value in Italy and its lowest value in Sweden.
A study by Solera (2008) compares Italy and the United Kingdom using event history data (British
Household Panel Survey, BHPS, and Italian Household Longitudinal Survey, ILFI) and methods to
investigate changes across cohorts in the e�ect of family responsibilities on women's transitions in and
out of paid work. The e�ects of marriage and motherhood are stronger in a liberal welfare regime such
as the British one. In Italy, where demand for labour is relatively low and gender role norms are quite
traditional, reconciliation policies are weak but largely compensated by intergenerational and kinship
solidarity, fewer women enter paid work, but when they do so they interrupt less than the British women
on becoming wives or mothers.
Domestic work has also a role in explaining gender wage di�erentials since women interrupt their
careers more frequently than men because of household commitments - evidence on this is available
from the 70s starting with the seminal study by Mincer and Polachek (1974). In this way, household
commitments have an indirect impact on the gender wage gap through di�erential acquisition of skills.
Also a direct impact can be envisaged, in that tiring activities like domestic work reduce the amount of
e�ort available for market work, resulting in lower productivity and wages. Bryan et al. (2008) study
this direct impact of domestic work on wages and �nd a negative e�ect of housework on wages in Britain
using data from the British Household Panel Survey (1992-2004). The di�erential e�ect across gender
and marital status suggests that the factors behind the relationship between housework and wages are the
type and timing of housework activities as much as the actual time devoted to housework. Compared to
single women, married women specialise in routine housework which is done at times that may interfere
with market work. Married men specialise to a lesser extent and their housework is not done on the
margins of the working day. Polavieja (2008), using the second round of the European Social Survey,
shows that the negative e�ect of domestic work on hourly earnings persists even after allowing for sex
di�erences in sex-role attitudes and personal tastes. Bonke et al. (2008) using time budget data for
Denmark, quantify the e�ects of timing and �exibility of housework on earnings of females and males.
They �nd that women are penalised more than men by the in�exibility of domestic work, since the
early closing of shops and day care institutions has a negative e�ect on earnings and careers of females
especially at the top end of the distribution.
As for childcare, the evidence documenting at all level of analysis a positive relation between female
participation and childcare services in Europe is by now very abundant. Among the most recent exam-
ples, Del Boca, Pasqua, and Pronzato (2008, 2009), using data from the European Community Household
Panel (ECHP), explore the impact of social policies and labour market characteristics on women's de-
cisions regarding work and childbearing. The two decisions are modeled jointly and, in addition to
personal characteristics, variables related to the childcare system, parental leave arrangements, family
allowances, and labour market �exibility are included. Their empirical results show that a non-negligible
portion of the di�erences in participation and fertility rates for women from di�erent European countries
can be attributed to the characteristics of these institutions, and that the environmental e�ects vary by
educational level. While labour market arrangements, such as part-time opportunities (when well-paid
and protected) have a larger impact on the outcomes of women with higher educational levels, childcare
and optional parental leaves have a larger impact on the fertility and participation decisions of women
4
at lower educational levels. Lewis, Campbell, and Huerta (2008), using the European Social Survey
2004/5, analyse how parents reconcile employment and childcare in Western European member states,
and how much the EU-level policy on enhancing the formal provision of childcare is consistent with their
preferences. They use information on working patterns and preferences, and on childcare use and pref-
erences regarding the amount of formal provision. They �nd that working hours in formal employment
remain a very important dimension of reconciliation practices, with large di�erences in both patterns and
preferences. There is very little evidence of convergence towards a dual, full-time worker model family
outside the Nordic countries, although the balance between the hours which men and women spend
in paid work is becoming less unequal. Portuguese women express a strong preference for much more
formal childcare; Dutch, German and British women are relatively satis�ed with the amount they have,
despite having much less developed formal provision than the Nordic countries. The authors conclude
that, strong preferences for changes in working hours provide support for the development of policies that
include childcare leaves, entitlements to part-time or �exible patterns of work, as well as formal childcare.
Since countries vary enormously in terms of the nature of the existing policy package and patterns of
adult labour-market participation, respect for parental choices is increasingly an issue with regard to the
gender divisions of unpaid care work and employment. The study by Nicodemo and Waldmann (2009),
focusing on the Mediterranean countries, analyses the connection between the married women's labour
force participation, childcare arrangements and the time that husbands and wives spend taking care of
children. They use the EU-SILC cross-section 2006 and data from the ECHP 2001, because these two
data-sets provide di�erent information about childcare and domestic work. Their results show that while
the Mediterranean countries have advanced in the integration of women into the labour market, in most
of them women still have to bear the total burden of domestic work and care of children. They �nd that
childcare arrangements are a major instrument for women to enter in paid employment.
While at a country level several studies on the distribution of time among all types of activities are
available, only a few try to assess the value of unpaid family work. The paper by Jenkins and O'Leary
(1995), while critically reviewing the micro-econometric evaluation of household production conducted
up to the mid-90s, proposes to use regressions for matching. Since income surveys typically do not
contain detailed time use data, regression estimates derived from time use surveys are used to impute
values of unpaid domestic work time to respondents of the income survey using the variables common
to both surveys.
Unpaid family work has also been evaluated to answer another research question, namely, to what
extent inequality and poverty might be a�ected by including the economic bene�ts of home produc-
tion in the underlying measurement of economic well-being. Addabbo and Caiumi (2003), for example,
conducted a micro-econometric analysis of unpaid work in Italy using ISTAT time budget data (1989)
matched with the Survey of Household Income and Wealth by the Bank of Italy and the ISTAT Con-
sumption Survey, both collected in 1995. They applied both the opportunity cost and replacement cost
(generalist, for a general housekeeper) methods to evaluate extended household income and equivalent
extended income. Their results show the average household extended income at 50 per cent and 23 per
cent greater than the average household money income with, respectively, the opportunity and replace-
ment cost methods. The equivalent extended income comes to 54 per cent and 42 per cent greater than
the average household equivalent income with the opportunity and replacement cost methods respec-
tively. Moreover, all the inequality indicators drop signi�cantly for the extended income measures when
including the value of unpaid work. Frick, Grabka, and Groh-Samberg (2009) updating the classi�cation
by Jenkins and O'Leary, provide an overview of previous studies analysing the distributional impact of
home production. There is wide variation in the type of data used, the restrictions on the kind of home
production activities considered, the populations addressed, and the approaches chosen to derive a mone-
tary value for these activities. Accordingly, the estimated contribution of income from home production,
5
measured as a percentage of the baseline cash income, varies from some 13 per cent to more than 200 per
cent. From their survey, the authors conclude that most of the studies �nd an inequality-reducing e�ect
of home production. The main result of an equalising e�ect of home production can be expected on
the basis of standard economic theory, assuming that households with lower overall working hours will
spend more time on unpaid work, to compensate partly for lower incomes. Frazis and Stewart (2009),
addressing the same problem of the relation between household extended income and inequality on the
evidence of American time use data for 2003, also �nd that extended income is more equally distributed
than money income.
In the light of the abundant literature about the measurement and evaluation of unpaid domestic
and care work, the main objective of the present article is to perform a monetary evaluation of unpaid
family caretaking work for the European Union and for each one of its members. The recent availability
of harmonized European household surveys with information about the use of time (HETUS) and the
working conditions of the household members (EU-SILC) allows performing this task. The following
section provides a detailed description of the data used, the assumptions that had to be made, and the
methodologies applied in this empirical exercise.
3 Empirical strategy
3.1 Data and de�nitions
The problem of evaluating UFDW and UFCW is in large part a problem of missing data. EU-SILC
2006 is a European household survey for 24 EU member States plus Norway and Iceland, which are
not included in this study, since the focus is on the EU. The data set is rich in information on several
household and individual variables, such as work status and characteristics, income, taxes and bene�ts,
family composition, health and education. EU-SILC, however, does not collect information on the use of
time, which is fundamental to properly estimate the values of UFDW and UFCW. On the other hand,
the Harmonized European Time Use Survey2 (HETUS) by EUROSTAT does not contain information
on wages and incomes, but, being a collection of harmonized time use surveys, it provides exactly the
information which is missing in EU-SILC.
The EU-SILC variable that can be exploited to indirectly estimate the value of unpaid family work
is weekly hours of market work. Non-market work time can be obtained subtracting market work time
from daily total time. Clearly, this is not su�cient to determine the time spent in unpaid domestic or
childcare work, since it includes also time spent in sleeping and leisure, which is usually much larger
than time spent in domestic activities3. A value of unpaid family caretaking work estimated using non-
market work time only would largely overestimate its true value, whatever criterion is chosen. Hence, to
implement the analysis, time-use data from HETUS are combined with EU-SILC micro data for 2006.
The main di�culty in using jointly information collected from di�erent surveys is that the interviewed
individuals are not the same. The usual strategy to overcome this problem is to match the two data sets
assigning to each individual in one data set the information of the other data set according to a series
of characteristics which are believed to be relevant to explain (part of) the observed heterogeneity. A
2HETUS is a collection of national time use surveys recorded in di�erent years. Belgium (2005-6), Bulgaria (2001-2002),Estonia (1999-2000), Finland (1999-2000), France (1998-1999), Germany (2001-2002), Italy (2002-2003), Latvia (2003),Lithuania (2003), Norway (2000-2001), Poland (2003-2004), Slovenia (2000-2001), Spain (2002-2003), Sweden (2000-2001),the United Kingdom (2000-2001). For this reason whenever a �gure or a table is based on HETUS, the reference year isnot reported. See http://www.tus.scb.se
3According to HETUS data, the individual average time of market work (part-timers and inactives included) anddomestic work amount to around 200 minutes per day each (see Table 8), while leisure amounts to 321 minutes per dayand other activities, which include sleeping, amount to more than 700 minutes per day (See Table 1 for the distribution ofnon-market work).
6

necessary condition for this to be feasible is the availability in both data set of a common set of individual,
household and environmental characteristics capable of predicting adequately the sought variables.
A variety of techniques could be used in order to perform the matching. In the present case, the only
chance to perform a matching of time use information into EU-SILC was to generate a table of average
times spent into activities by the individuals over the characteristics available in the web application of
HETUS that were found to be the most useful to explain data variability4.
The strategy adopted to maintain the highest degree of individual detail in the data was the following:
i) Use the work time information present in EU-SILC (MWEUi ) to compute non-market work time
(NMWEUi ) for each person i in the sample
NMWEUi = TEU
i −MWEUi ,
where TEUi is total time available for each person i in EU-SILC;
ii) Calculate from HETUS - by country (g), gender (j) and a variable called �lifecycle� (k), which
combines age with the family status of the individual - the average shares (ω) of non-market
work time spent in domestic work (DHETUS), childcare work (CHETUS), leisure (LHETUS)and
other activities (OHETUS). Domestic work and childcare work are the only two family caretaking
activities that can be taken into account in this analysis, since the HETUS source does not allow
to distinguish care of the elderly from the other activities5
ωDHETUSg,j,k =
(DHETUS
NMWHETUS
)g,j,k
ωCHETUSg,j,k =
(CHETUS
NMWHETUS
)g,j,k
ωLHETUSg,j,k =
(LHETUS
NMWHETUS
)g,j,k
ωOHETUSg,j,k =
(OHETUS
NMWHETUS
)g,j,k
;
iii) Impute the non-market work time shares for the countries not present in HETUS. This imputation
is a simple regression imputation, regressing the logarithm of the shares on a series of personal,
household and environmental characteristics for the countries of HETUS, and predicting the shares
for the countries not present in HETUS (ωDEUg,j,k, ωC
EUg,j,k, ωL
EUg,j,k and ωOEU
g,j,k)6;
iv) Use the observed and predicted shares for HETUS and non-HETUS countries respectively7, and
4The choice of the technique to be applied is often related to the kind of information that is matched, but in the presentcase there was not a real option of choice. In fact, direct access to HETUS micro data was not allowed, but only to anon-line application which can generate personalised tables of average time devoted to a broad range of activities. Thereason is that HETUS is a harmonized collection of independent national time-use surveys. To have access to the wholedata set single agreements with each statistical institute involved would have been arranged.
5See Table 2 on types of primary activities included in HETUS6The tables relative to the imputation regressions and the details about the variables used in the regressions are available
upon request.7Footnote 2 lists the countries covered by HETUS. The imputation to non-HETUS countries may seem rather arduous,
but it should be noted that even though it is true that in Europe each country has its own peculiar characteristics, theobserved variability in the share of time spent in domestic and childcare activities is much lower than, for example, thevariability observed for earnings. It follows that the error due to the imputation can be reasonably assumed to be small.Moreover, the choice to impute the shares rather than time use values further reduces the magnitude of the imputationerror because the time use values are recovered using non-labour time information, which is available for all individuals inall EU-SILC countries.
7

multiply them by the non-market work time of each individual i with characteristics (g, j, k) in
EU-SILC, obtaining for each person the time devoted to each activity:
DEUi = ωDEU
g,j,k ·NMWEUi,(g,j,k)
CEUi = ωCEU
g,j,k ·NMWEUi,(g,j,k)
LEUi = ωLEU
g,j,k ·NMWEUi,(g,j,k)
OEUi = ωOEU
g,j,k ·NMWEUi(g,j,k).
The average values of time spent in domestic work, childcare, leisure and other activities before and after
imputation are reported in Table 1.
Resuming, the evaluation strategy consists in assigning to each person observed in EU-SILC an im-
puted amount of time dedicated to UFDW and UFCW derived from HETUS. In what follows, indicators
of the values of UFDW and UFCW based on the opportunity cost approach (Gronau, 1973) and on the
market replacement approach (Goldschmidt-Clermont and Pagnossin-Aligisakis, 1999) are presented. It
is to be noted that di�erent estimated values can be obtained according to the technique used for eval-
uation. For this reason the results deriving from each technique are compared thus providing a range of
values within which it is reasonable to place the �real� values of UFDW and UFCW.
3.2 Estimating wages
The values of UFDW and UFCW can be derived with three methods. First, multiplying the total amount
of hours spent in domestic or caring activities in a year by the market wage rate of each working person
or by an imputed market wage for non-working people. This is the Opportunity Cost (OC) approach.
Second, multiplying the total amount of hours spent in domestic or caring activities in a year by the
average wage of a professional domestic worker/care taker. This is the Generalist Market Replacement
(GMR) approach. Third, multiplying the total amount of hours spent in domestic or caring activities
in a year by the wage of workers performing similar tasks in the market (housekeepers, baby sitters,
teachers, drivers and so on). This is the Specialist Market Replacement (SMR) approach.
Opportunity Cost
The OC approach relies on the assumption that each hour devoted to domestic or caring activities
could be productively employed in the labour market. Such hypothesis implies that these hours should
be evaluated at the hourly wage the individuals would earn if they had spent this time in the labour
market. This implicitly de�nes the set of individuals that should be taken into account, namely, potential
workers (the unemployed persons and housewives in the present case) and actual workers. Instead, unpaid
family work performed by people who are not even potentially part of the labour force and receive a
compensation for their time - like pensioners or some categories of disabled people who receive pensions,
transfers or subsidies - is not taken into account within this approach8.
The evaluation of UFDW and UFCW for actual workers presents no particular di�culties, since wages
are observed in the data. However, some di�culties arise because of the incomplete harmonization of
income data between countries. Some countries record only gross yearly wages, some others only net
wages and some others both of them. Gross wages are chosen whenever available and net wages as a
proxy for gross wages when net wages are not available. This could lead to underestimating the values
of UFDW and UFCW for these countries, but taking into account that the di�erential is usually around
8By the usual de�nition, inactive people include all people that are not searching for a job and are not working (retirees,students, some categories of disabled persons, housewives and so on). In the present study housewives are considered aspart of the group of potential workers.
8
30 per cent and that these countries are only four (Greece, Italy, Latvia and Poland), the overall e�ect
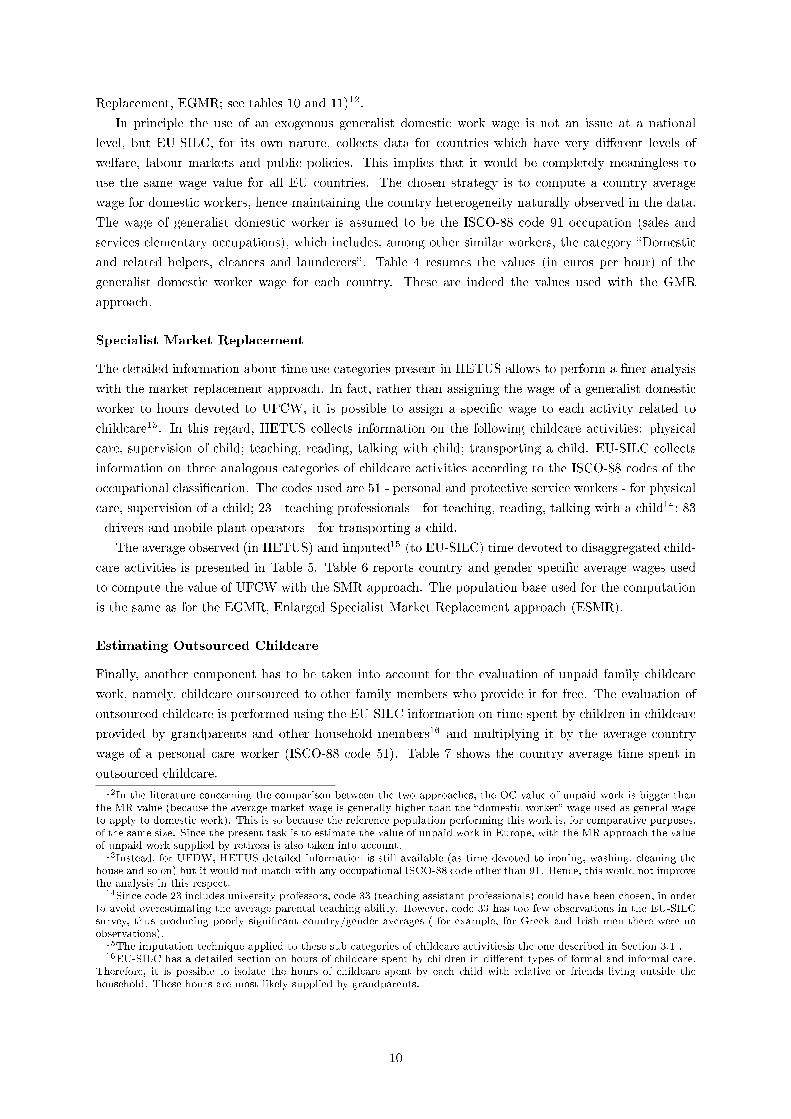
on the European values should be small.
For potential workers two further problems arise, namely, the identi�cation of individuals pertaining
to this category and the estimation of the potential wage to be attributed to each potential worker.
Potential workers are de�ned as all non-working individuals older than 209 and younger than 65 who
have no health limitation, are not in education and self-report as being unemployed or ful�lling domestic
tasks. With this de�nition, potential workers are 30 millions in Europe, while workers for which a salary
is actually observed are 158 millions.
The wage estimation for potential workers is conducted using a Heckman Selection model (Heckman,
1979), separately for men and women. To improve the estimation of potential wages, the procedure
is applied to the natural logarithm of hourly wages. This choice largely improves the �tting power
of the estimates and allows the avoidance of negative predicted wages by construction. The variables
used as predictors include: country and region of residence, birth outside the EU, level of education,
health status, age, family size, marital status, presence of children of di�erent age categories, presence of
parents living in the household, ownership of assets (such as cars or personal computers), some indicators
of economic di�culty (such as arrears on mortgage or rent payments, arrears on utility bills), dwelling
characteristics, living in rural or urban areas, paying a mortgage10. The variables which are more likely
to explain participation are usually di�erent from those which are likely to explain the wage level, and
this is taken into account in the estimation procedure.
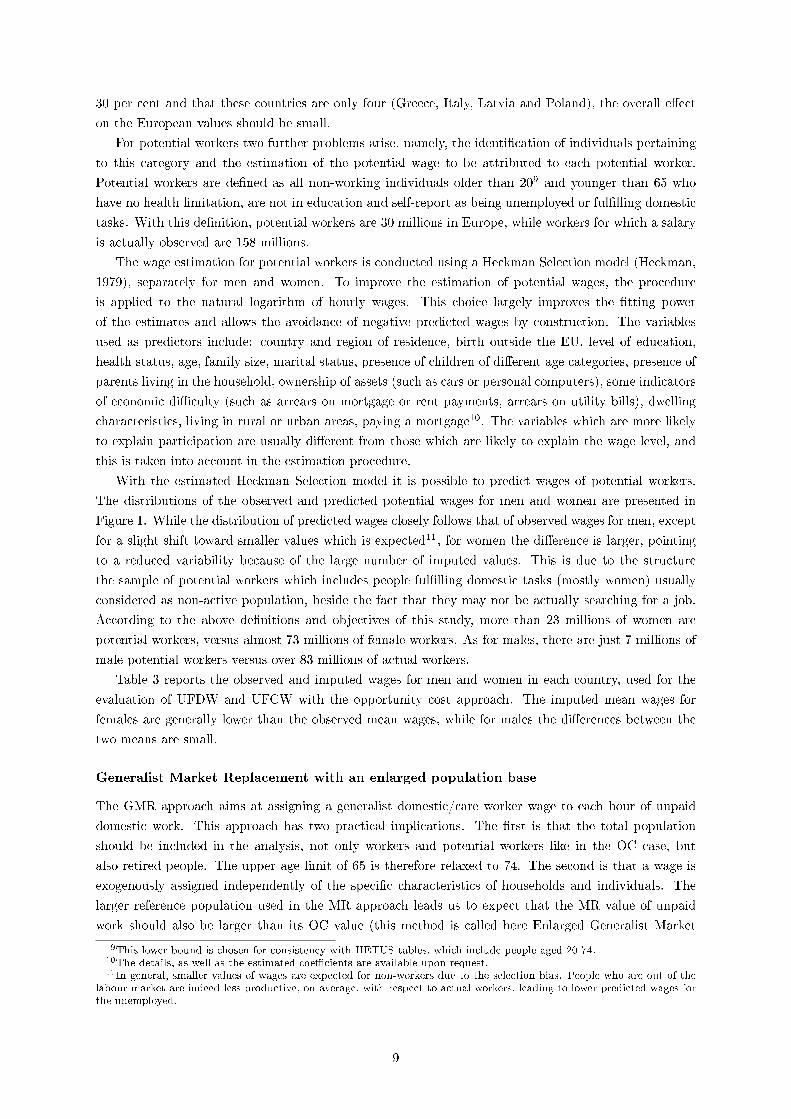
With the estimated Heckman Selection model it is possible to predict wages of potential workers.
The distributions of the observed and predicted potential wages for men and women are presented in
Figure 1. While the distribution of predicted wages closely follows that of observed wages for men, except
for a slight shift toward smaller values which is expected11, for women the di�erence is larger, pointing
to a reduced variability because of the large number of imputed values. This is due to the structure
the sample of potential workers which includes people ful�lling domestic tasks (mostly women) usually
considered as non-active population, beside the fact that they may not be actually searching for a job.
According to the above de�nitions and objectives of this study, more than 23 millions of women are
potential workers, versus almost 73 millions of female workers. As for males, there are just 7 millions of
male potential workers versus over 83 millions of actual workers.
Table 3 reports the observed and imputed wages for men and women in each country, used for the
evaluation of UFDW and UFCW with the opportunity cost approach. The imputed mean wages for
females are generally lower than the observed mean wages, while for males the di�erences between the
two means are small.
Generalist Market Replacement with an enlarged population base
The GMR approach aims at assigning a generalist domestic/care worker wage to each hour of unpaid
domestic work. This approach has two practical implications. The �rst is that the total population
should be included in the analysis, not only workers and potential workers like in the OC case, but
also retired people. The upper age limit of 65 is therefore relaxed to 74. The second is that a wage is
exogenously assigned independently of the speci�c characteristics of households and individuals. The
larger reference population used in the MR approach leads us to expect that the MR value of unpaid
work should also be larger than its OC value (this method is called here Enlarged Generalist Market
9This lower bound is chosen for consistency with HETUS tables, which include people aged 20-74.10The details, as well as the estimated coe�cients are available upon request.11In general, smaller values of wages are expected for non-workers due to the selection bias. People who are out of the
labour market are indeed less productive, on average, with respect to actual workers, leading to lower predicted wages forthe unemployed.
9
Replacement, EGMR; see tables 10 and 11)12.
In principle the use of an exogenous generalist domestic work wage is not an issue at a national
level, but EU-SILC, for its own nature, collects data for countries which have very di�erent levels of
welfare, labour markets and public policies. This implies that it would be completely meaningless to
use the same wage value for all EU countries. The chosen strategy is to compute a country average
wage for domestic workers, hence maintaining the country heterogeneity naturally observed in the data.
The wage of generalist domestic worker is assumed to be the ISCO-88 code 91 occupation (sales and
services elementary occupations), which includes, among other similar workers, the category �Domestic
and related helpers, cleaners and launderers�. Table 4 resumes the values (in euros per hour) of the
generalist domestic worker wage for each country. These are indeed the values used with the GMR
approach.
Specialist Market Replacement
The detailed information about time use categories present in HETUS allows to perform a �ner analysis
with the market replacement approach. In fact, rather than assigning the wage of a generalist domestic
worker to hours devoted to UFCW, it is possible to assign a speci�c wage to each activity related to
childcare13. In this regard, HETUS collects information on the following childcare activities: physical
care, supervision of child; teaching, reading, talking with child; transporting a child. EU-SILC collects
information on three analogous categories of childcare activities according to the ISCO-88 codes of the
occupational classi�cation. The codes used are 51 - personal and protective service workers - for physical
care, supervision of a child; 23 - teaching professionals - for teaching, reading, talking with a child14; 83
- drivers and mobile plant operators - for transporting a child.
The average observed (in HETUS) and imputed15 (to EU-SILC) time devoted to disaggregated child-
care activities is presented in Table 5. Table 6 reports country and gender speci�c average wages used
to compute the value of UFCW with the SMR approach. The population base used for the computation
is the same as for the EGMR, Enlarged Specialist Market Replacement approach (ESMR).
Estimating Outsourced Childcare
Finally, another component has to be taken into account for the evaluation of unpaid family childcare
work, namely, childcare outsourced to other family members who provide it for free. The evaluation of
outsourced childcare is performed using the EU-SILC information on time spent by children in childcare
provided by grandparents and other household members16 and multiplying it by the average country
wage of a personal care worker (ISCO-88 code 51). Table 7 shows the country average time spent in
outsourced childcare.
12In the literature concerning the comparison between the two approaches, the OC value of unpaid work is bigger thanthe MR value (because the average market wage is generally higher than the �domestic worker� wage used as general wageto apply to domestic work). This is so because the reference population performing this work is, for comparative purposes,of the same size. Since the present task is to estimate the value of unpaid work in Europe, with the MR approach the valueof unpaid work supplied by retirees is also taken into account.
13Instead, for UFDW, HETUS detailed information is still available (as time devoted to ironing, washing, cleaning thehouse and so on) but it would not match with any occupational ISCO-88 code other than 91. Hence, this would not improvethe analysis in this respect.
14Since code 23 includes university professors, code 33 (teaching assistant professionals) could have been chosen, in orderto avoid overestimating the average parental teaching ability. However, code 33 has too few observations in the EU-SILCsurvey, thus producing poorly signi�cant country/gender averages ( for example, for Greek and Irish men there were noobservations).
15The imputation technique applied to these sub categories of childcare activitiesis the one described in Section 3.1 .16EU-SILC has a detailed section on hours of childcare spent by children in di�erent types of formal and informal care.
Therefore, it is possible to isolate the hours of childcare spent by each child with relative or friends living outside thehousehold. These hours are most likely supplied by grandparents.
10
Since the EGMR and ESMR approaches already comprise the time spent by individuals not included
in the labour force, as elderly people, the evaluation of outsourced childcare should only be added to the
OC evaluation of UFCW (which is de�ned on a population base restricted to people aged up to 65) to
have a more comprehensive representation of the overall value of family childcare with the OC approach
(see Table 10).
4 Results
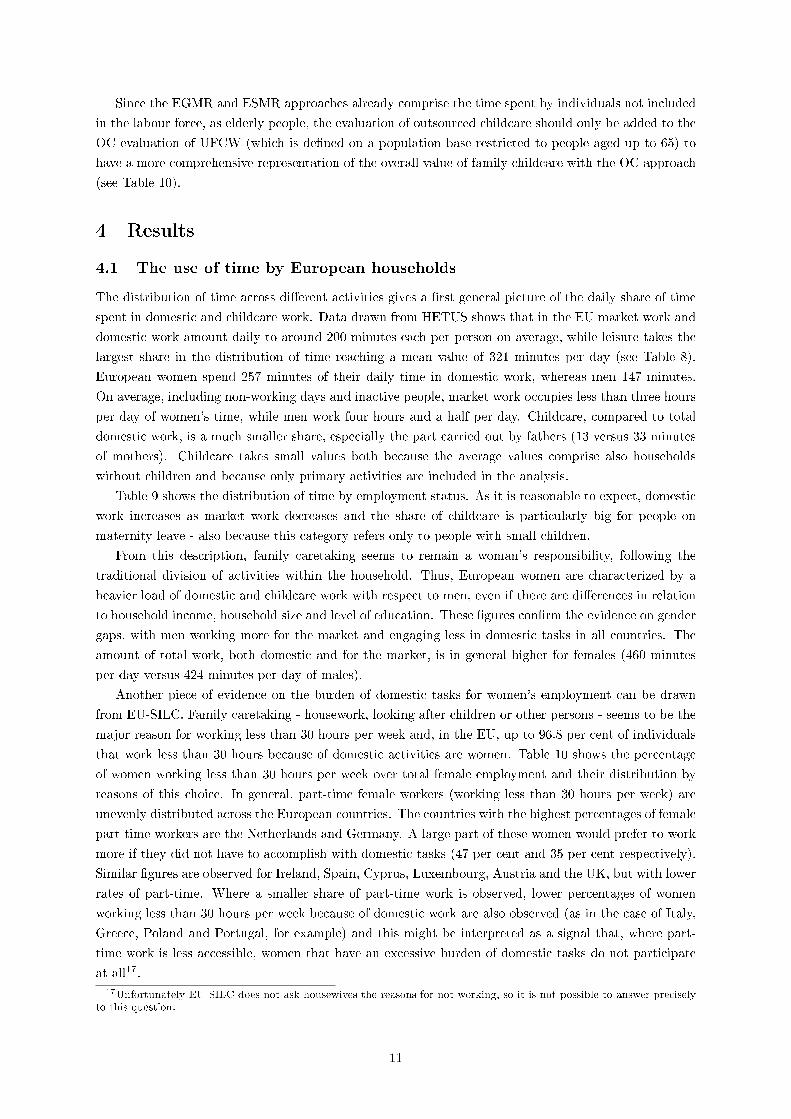
4.1 The use of time by European households
The distribution of time across di�erent activities gives a �rst general picture of the daily share of time
spent in domestic and childcare work. Data drawn from HETUS shows that in the EU market work and
domestic work amount daily to around 200 minutes each per person on average, while leisure takes the
largest share in the distribution of time reaching a mean value of 321 minutes per day (see Table 8).
European women spend 257 minutes of their daily time in domestic work, whereas men 147 minutes.
On average, including non-working days and inactive people, market work occupies less than three hours
per day of women's time, while men work four hours and a half per day. Childcare, compared to total
domestic work, is a much smaller share, especially the part carried out by fathers (13 versus 33 minutes
of mothers). Childcare takes small values both because the average values comprise also households
without children and because only primary activities are included in the analysis.
Table 9 shows the distribution of time by employment status. As it is reasonable to expect, domestic
work increases as market work decreases and the share of childcare is particularly big for people on
maternity leave - also because this category refers only to people with small children.
From this description, family caretaking seems to remain a woman's responsibility, following the
traditional division of activities within the household. Thus, European women are characterized by a
heavier load of domestic and childcare work with respect to men, even if there are di�erences in relation
to household income, household size and level of education. These �gures con�rm the evidence on gender
gaps, with men working more for the market and engaging less in domestic tasks in all countries. The
amount of total work, both domestic and for the market, is in general higher for females (460 minutes
per day versus 424 minutes per day of males).
Another piece of evidence on the burden of domestic tasks for women's employment can be drawn
from EU-SILC. Family caretaking - housework, looking after children or other persons - seems to be the
major reason for working less than 30 hours per week and, in the EU, up to 96.8 per cent of individuals
that work less than 30 hours because of domestic activities are women. Table 10 shows the percentage
of women working less than 30 hours per week over total female employment and their distribution by
reasons of this choice. In general, part-time female workers (working less than 30 hours per week) are
unevenly distributed across the European countries. The countries with the highest percentages of female
part-time workers are the Netherlands and Germany. A large part of these women would prefer to work
more if they did not have to accomplish with domestic tasks (47 per cent and 35 per cent respectively).
Similar �gures are observed for Ireland, Spain, Cyprus, Luxembourg, Austria and the UK, but with lower
rates of part-time. Where a smaller share of part-time work is observed, lower percentages of women
working less than 30 hours per week because of domestic work are also observed (as in the case of Italy,
Greece, Poland and Portugal, for example) and this might be interpreted as a signal that, where part-
time work is less accessible, women that have an excessive burden of domestic tasks do not participate
at all17.
17Unfortunately EU SILC does not ask housewives the reasons for not working, so it is not possible to answer preciselyto this question.
11
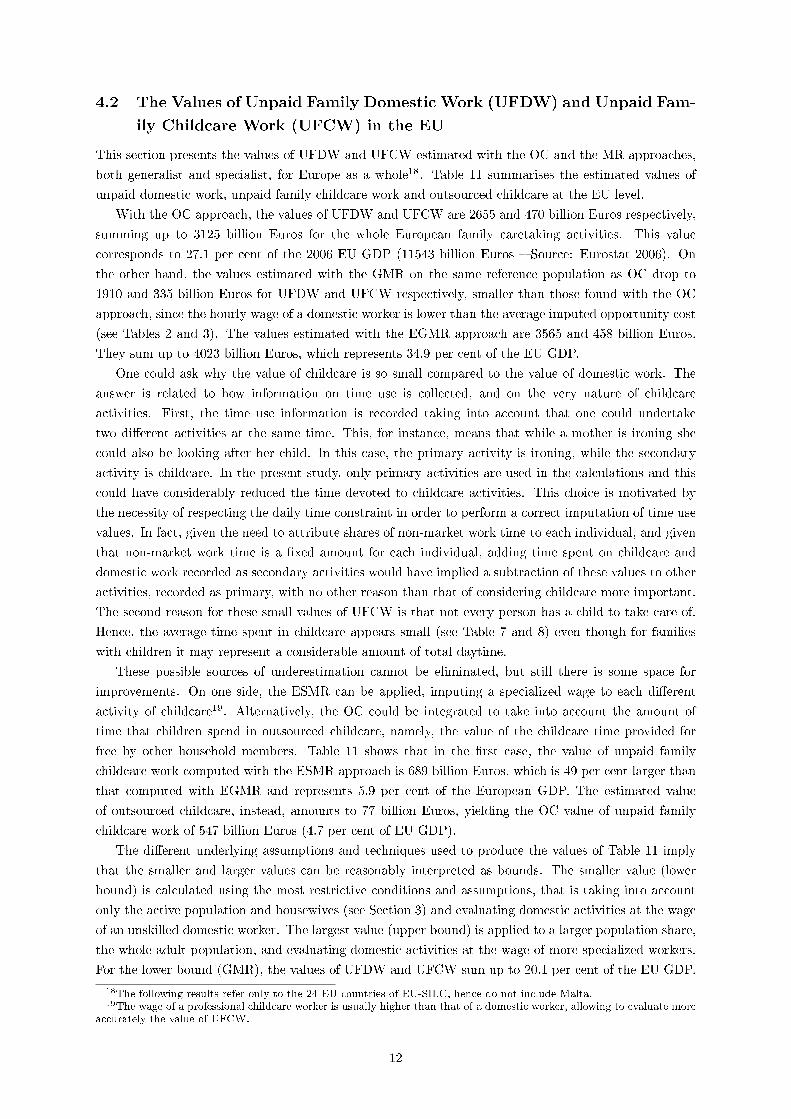
4.2 The Values of Unpaid Family Domestic Work (UFDW) and Unpaid Fam-
ily Childcare Work (UFCW) in the EU
This section presents the values of UFDW and UFCW estimated with the OC and the MR approaches,
both generalist and specialist, for Europe as a whole18. Table 11 summarises the estimated values of
unpaid domestic work, unpaid family childcare work and outsourced childcare at the EU level.
With the OC approach, the values of UFDW and UFCW are 2655 and 470 billion Euros respectively,
summing up to 3125 billion Euros for the whole European family caretaking activities. This value
corresponds to 27.1 per cent of the 2006 EU GDP (11543 billion Euros � Source: Eurostat 2006). On
the other hand, the values estimated with the GMR on the same reference population as OC drop to
1910 and 335 billion Euros for UFDW and UFCW respectively, smaller than those found with the OC
approach, since the hourly wage of a domestic worker is lower than the average imputed opportunity cost
(see Tables 2 and 3). The values estimated with the EGMR approach are 3565 and 458 billion Euros.
They sum up to 4023 billion Euros, which represents 34.9 per cent of the EU GDP.
One could ask why the value of childcare is so small compared to the value of domestic work. The
answer is related to how information on time use is collected, and on the very nature of childcare
activities. First, the time use information is recorded taking into account that one could undertake
two di�erent activities at the same time. This, for instance, means that while a mother is ironing she
could also be looking after her child. In this case, the primary activity is ironing, while the secondary
activity is childcare. In the present study, only primary activities are used in the calculations and this
could have considerably reduced the time devoted to childcare activities. This choice is motivated by
the necessity of respecting the daily time constraint in order to perform a correct imputation of time use
values. In fact, given the need to attribute shares of non-market work time to each individual, and given
that non-market work time is a �xed amount for each individual, adding time spent on childcare and
domestic work recorded as secondary activities would have implied a subtraction of these values to other
activities, recorded as primary, with no other reason than that of considering childcare more important.
The second reason for these small values of UFCW is that not every person has a child to take care of.
Hence, the average time spent in childcare appears small (see Table 7 and 8) even though for families
with children it may represent a considerable amount of total daytime.
These possible sources of underestimation cannot be eliminated, but still there is some space for
improvements. On one side, the ESMR can be applied, imputing a specialized wage to each di�erent
activity of childcare19. Alternatively, the OC could be integrated to take into account the amount of
time that children spend in outsourced childcare, namely, the value of the childcare time provided for
free by other household members. Table 11 shows that in the �rst case, the value of unpaid family
childcare work computed with the ESMR approach is 689 billion Euros, which is 49 per cent larger than
that computed with EGMR and represents 5.9 per cent of the European GDP. The estimated value
of outsourced childcare, instead, amounts to 77 billion Euros, yielding the OC value of unpaid family
childcare work of 547 billion Euros (4.7 per cent of EU GDP).
The di�erent underlying assumptions and techniques used to produce the values of Table 11 imply
that the smaller and larger values can be reasonably interpreted as bounds. The smaller value (lower
bound) is calculated using the most restrictive conditions and assumptions, that is taking into account
only the active population and housewives (see Section 3) and evaluating domestic activities at the wage
of an unskilled domestic worker. The largest value (upper bound) is applied to a larger population share,
the whole adult population, and evaluating domestic activities at the wage of more specialized workers.
For the lower bound (GMR), the values of UFDW and UFCW sum up to 20.1 per cent of the EU GDP.
18The following results refer only to the 24 EU countries of EU-SILC, hence do not include Malta.19The wage of a professional childcare worker is usually higher than that of a domestic worker, allowing to evaluate more
accurately the value of UFCW.
12
On the other hand, for the upper bound (ESMR), the value rises to 36.8 per cent of the EU GDP.
These are huge �gures that, nonetheless, are expected to be so for two reasons: (i) the time devoted to
domestic and childcare activities is on average similar to the time spent in the labour market (see Table
8), and (ii) the time devoted to these activities is evaluated at some market wage. These two conditions
imply that the value of UFDW plus UFCW in terms of percentage of GDP should be expected to be
similar to that of labour income.
4.3 Unpaid Family Domestic Work and Unpaid Family Childcare Work in
the European Countries
This section presents the results concerning the values of UFDW and UFCW for each single country.
For simplicity, the focus is on the values estimated with the OC and ESMR approaches.
The UFDW values presented in Table 12 account for nearly all EU25 Member States except Malta:
if European Satellite Accounts with household productive activities would be constructed, the EU GDP
and its distribution across countries would result quite di�erent from that emerging from the Standard
National Accounts.
As already said, the computed values of UFDW highly depend on the national labour market features
and wage levels. The relation between ESMR and OC estimates is not constant across the EU States.
Overall, the MR values are higher than OC values because of the larger population base over which they
are calculated. For instance, Belgium, Denmark and Germany, show a large gap between the two values.
For some countries, however, this is not the case and the two values are very close (e.g. Croatia and
Lithuania) or, in some case, the OC value is even lower than the ESMR value (e.g. Ireland, Estonia,
Cyprus and Latvia). This happens mostly for former socialist countries where the role of women in the
labour market is traditionally more important. The relatively higher wages of potential workers used for
the OC, in these countries, counterbalance the smaller population base used to compute the OC values.
Looking at the di�erences among Member States (Table 12), Germany and Belgium have the highest
values for UFDW in terms of GDP percentage, whatever the estimation approach. On the contrary,
smaller values are recorded for Latvia, Slovakia, and the Czech Republic. In absolute terms, the main
contributions to the value of European UFDW are given by the largest countries, such as Germany, the
United Kingdom, France and Italy, characterised by relatively high wages and large populations.
Table 13 gives the values of UFCW with both OC and ESMR methods. The results show that UFCW
values are rather close in all countries - at least in GDP percentage terms - showing a smaller variability
with respect to the estimates of UFDW. As shown in Figure 2, few countries contribute in absolute
terms to the most part of the European value of UFCW. The main contribution is again given by the
�old� Member States, while in percentage of GDP Poland has the largest share in the EU, together
with Cyprus, Germany, the Netherlands, Spain and the United Kingdom. The lowest values of family
childcare are in the Baltic States.
Looking at both Table 12 and Table 13 from a gender perspective, it can be noted that gender gaps
in these values are smaller than what might be expected. Even if women devote a share of time to these
activities which is signi�cantly larger than men, nonetheless men contribute to the values of UFDW and
UFCW almost as much as women - at least in some countries. This is mainly due to the gender wage
gap which still persists in Europe20.
To deepen the comparative analysis and understand why these di�erences among countries emerge, it
is useful to look at how the monetary values UFDW and UFCW are composed. The underlying relation
20The gender pay gap (de�ned as the di�erence between men's and women's average gross hourly earnings as a percentageof men's average gross hourly earnings) is estimated in 2007 at 17.4% on average in the EU (Report on Equality betweenWomen and Men 2009, European Commission).
13

which determines the country values can be decomposed as country population times the average time
devoted to unpaid activities times the value of this time (a hourly wage). Given that the size of the
country population can be considered a purely exogenous factor (at least in the short term), the focus on
the relation between unpaid work time and its value allows to identify groups of homogeneous countries
with similar characteristics. The choice of focusing on these aspects is motivated by the fact that time
spent in domestic activities can be associated to cultural traditions and to the provision of public services
by the state, while the average wage can be used as a rough proxy of the level of economic development
of a country. Even though more appropriate measures of economic development are available, it is still
possible to use a simple indicator such as the wage rate, since the majority of countries analysed have
the same currency, the Euro, and the others belong to the European Exchange Rate Mechanism, which
allows only minimal �uctuations of the exchange rates.
The objective, hence, is to study the relation between the average time devoted to UFDW and
UFCW (see Table 14) and the average wage observed in each country under study. A graphical analysis
of UFDW (Figure 3) shows that at least three groups can be identi�ed. A �rst group, characterized
by low wages and small amounts of time devoted to UFDW, is composed by Croatia, Greece, Hungary,
Latvia, Portugal and Slovakia. A second group, characterized by high wages and rather small amounts
of UFDW time, is composed by Austria, Belgium, Denmark, Finland, France, Ireland, Luxembourg,
Sweden and the United Kingdom. Finally a third group, characterized by low wages and large UFDW
time amounts is composed by Estonia, Lithuania, Poland and Slovenia. Comparing the �rst two groups,
it is possible to see that group one and two display similar amounts of time dedicated to domestic work,
while wages are much higher for the second group. This evidence shows that the per-capita value of
UFDW is higher in the second group of nations because of higher wages. On the other hand, group three
has similar wages as the �rst group, but the traditional structure of households implies that more time
is devoted to domestic work. Here, the appearance that economic development reduces the time spent
in domestic activities because people can a�ord to buy these services in the market may be misleading:
a rather large group of countries with high wages spends the same amount of time in domestic work as
the group with low wages. Traditions seem to be more important than economic development in this
respect.
The same analysis for UFCW (Figure 4) reveals that four groups of countries can be identi�ed. A
�rst group, composed by Croatia, Estonia, Greece, Hungary, Latvia, Lithuania, Portugal and Slovakia,
is characterized by low average wages and scarce time devoted to UFCW. A second group, composed
by Ireland, Sweden and the United Kingdom, is characterized by high wages and large amounts of time
devoted to UFCW. A third group, composed by Cyprus, France, Italy and Spain, is characterized by
average wages and average time devoted to UFCW. A fourth group composed by Austria, Belgium,
Denmark, Finland, Germany, Luxembourg and the Netherlands, is characterized by high wages and
small amounts of time devoted to UFCW. Finally, Poland seems to be an outlier, with low wages and a
very large amount of time devoted to UFCW. As a result, the grouping of countries according to childcare
activities is slightly more complex than in the case of UFDW. The �rst and fourth group show similar
childcare attitudes, but the fourth group is economically better o�. The third group has higher wages
and dedicates more time to children with respect to the �rst group. In turn, the second group shows
higher wages and more childcare time than the third. This seems to suggest a positive relation between
economic development and time spent with children, with the exception of a group mostly composed by
relatively higher wage countries with a continental welfare state, in which the services provided by the
state for childcare are widespread and the women's labour force participation has a long tradition.
In this analysis, gender di�erences play a crucial role. Indeed, �gures 5 and 6 emphasize the emblem-
atic cases of Italy and Spain. In these countries, men dedicate the smallest amount of time to UFDW,
while women the largest (together with Slovenia) in the EU. Another interesting group of countries can
14
be identi�ed: Croatia, Greece, Hungary, Portugal, and Slovakia. These low wage countries show the
highest amounts of UFDW time for men and the lowest for women, being the two average values almost
equal (around 180 minutes per day for men and around 190 minutes for women). A similar pattern can
be found for a group of high wage countries, namely, Austria, Denmark, Ireland, Luxembourg and the
Netherlands.
Interestingly, for men a somewhat positive relationship between wages and time devoted to domestic
work is found. This could be explained if higher wages re�ected higher productivity or education. In
the �rst case a higher productivity may leave more non-labour time to help in domestic activities. In
the second case, higher education may imply a deeper social conscience that pushes males to help more
in the house. For women, this positive relation is not observed: whatever the wage the amount of
domestic activities is always high. The observed di�erences between countries probably depend on the
cultural traditions that play an important role in determining the amount and the distribution between
the household members of time devoted to domestic work.
Looking at the gender di�erences emerging from the graphs for childcare (Figures 7 and 8), some
new pieces of evidence emerge. As for domestic work, a positive relation between wages and childcare
time seems to be present for males, while a similar conclusion cannot be drawn for women. Moreover,
males and females in Croatia, Hungary, Portugal and Slovakia perform a similar amount of childcare
work (20-25 minutes per day), which for females ranks among the smallest amounts in the EU, while
for males among the largest. Instead, similarly to what happens for domestic work, in Italy and Spain
males do less than half the childcare work performed by females, an evidence that continues to represent
a stylized fact for these countries.
5 Summary and Conclusions
This paper presents the methodology and the results of a comprehensive evaluation of unpaid family
caretaking activities in Europe, separating unpaid family domestic work (such as cleaning, ironing,
cooking, and so on) from unpaid family childcare work.
The descriptive analysis shows, consistently with the literature, the persistence in Europe of gender
speci�c roles within the family. Men spend more time than women working in the labour market and
much less in domestic work, while women allocate less time than they would like to market work because
of domestic and childcare activities.
The main task of the paper is to devise a methodology to impute monetary values to unpaid family
domestic work (UFDW) and to unpaid family childcare work (UFCW) in the EU. The analysis is con-
ducted for all the EU25 countries (except Malta which was not present in the data), with the objective
of giving some indications about the weight that unpaid family caretaking has in the EU and in each
European economy.
Using both the opportunity cost and the market replacement approaches, the results show that the
comprehensive value of unpaid family caretaking (UFDW plus UFCW) ranges between a minimum of
20.1 per cent and a maximum of 36.8 per cent of the EU GDP. Unpaid family childcare work alone
ranges from a minimum of 2.9 per cent to a maximum of 5.9 per cent of European GDP, depending on
the applied methodology.
The paper also discusses the values of UFDW and UFCW at a country level, pointing out the di�erent
contribution that unpaid family caretaking work would provide to its own economy if included in the
national accounts. This contribution varies from 9.9 per cent of GDP in Latvia to 42 per cent of GDP
in Germany. The disaggregation by gender shows that the di�erence in the value of unpaid family
caretaking between men and women is smaller than expected. This is in part due to the gender pay
15

gap, which is still important in the EU, and in part to the lower wages of potential workers, which are
mostly women. Consequently, one hour of domestic work of men is valued much more than one hour of
domestic work of women.
The cross-country analysis of UFDW and UFCW by their time and wage components reveals two
important facts. First, economic development (in terms of wage levels) is not su�cient to reduce the
amount of time devoted to unpaid family domestic work, and cultural traditions seem to be more impor-
tant for its determination. Second, the higher the average wage of a country, the more time is devoted
to childcare, probably because childcare is considered a valuable activity, similarly to leisure time. This
is not true for a group of countries which belongs to the Bismarckian continental welfare state regime, in
which the childcare services provided by the state are widespread and the culture of female labour force
participation has a long tradition.
16
References
Addabbo, T. and A. Caiumi. 2003. Extended Income Estimation and Income Inequality by Gender, chap.
Ch. 3. London: Routledge.
Anxo, D., L. Flood, L. Mencarini, A. Pailhé, A. Solaz, and M.L. Tanturri. 2007. �Time Allocation
between Work and Family over the Life-Cycle: A Comparative Gender Analysis of Italy, France,
Sweden and the United States.� IZA Discussion Papers .
Bonke, Jens, Mette Deding, Mette Lausten, and Leslie S. Stratton. 2008. �Intra-Household Specialization
in Housework in the United States and Denmark.� Social Science Quarterly 89 (4):1023�1043.
Breen, R. and L.P. Cooke. 2005. �The persistence of the gendered division of domestic labour.� European
Sociological Review 21 (1):43.
Bryan, M. et al. 2008. �Does Housework Lower Wages and Why? Evidence from Britain.� ISER working
papers .
Davis, S.N. and T.N. Greenstein. 2004. �Cross-national variations in the division of household labor.�
Journal of Marriage and Family 66 (5):1260�1271.
Del Boca, D., S. Pasqua, and C. Pronzato. 2008. �An Empirical Analysis of the E�ects of Social Policies on
Fertility, Labour Market Participation and Earnings of European Women.� In Social Policies, Labour
Markets and Motherhood: a Comparative Analysis of European Countries, edited by D. Del Boca and
C. Wetzels. Cambridge University Press.
���. 2009. �Market Work and Motherhood Decisions in Contexts.� Oxford Economic Papers .
Eisner, R. et al. 1982. �Total Incomes in the United States, 1946-1976: A Summary Report.� Review of
Income and Wealth 28 (2):133.
EUROSTAT. 2000. �Guidelines on Harmonised European Time Use Survey.� Tech. rep., Eurostat.
European Commission, Luxembourg: O�ce for O�cial Publications of the European Communities.
���. 2003. �Household Production and Consumption Proposal for a Methodology of Household
Satellite Accounts.� Tech. rep., Eurostat. Working Papers and Studies.
Frazis, H. and J. Stewart. 2009. �How Does Household Production A�ect Measured Income Inequality?�
IZA Discussion Papers .
Frick, J.R., M.M. Grabka, and O. Groh-Samberg. 2009. �The Impact of Home Production on Economic
Inequality in Germany.� IZA Discussion Papers .
Goldschmidt-Clermont, L. and E. Pagnossin-Aligisakis. 1999. �Households' Non-SNA Production:
Labour Time, Value of Labour and of Product, and Contribution to Extended Private Consumption.�
Review of Income and Wealth 45 (4):519�529.
Gronau, R. 1973. �The intrafamily allocation of time: The value of the housewives' time.� The American
Economic Review 63 (4):634�651.
Heckman, J.J. 1979. �Sample selection bias as a speci�cation error.� Econometrica: Journal of the
econometric society :153�161.
Holloway, S., S. Short, and S. Tamplin. 2002. �Household satellite account (experimental) methodology.�
Tech. rep., O�ce of National Statistics UK.
17
ILO. 1995. �Measurement and Valuation of Unpaid Contribution.� Tech. rep., International Labour
O�ce, Santo Domingo. Accounting through Output and Time.
���. 1996. �Valuation of Household Production and the Satellite Accounts.� Tech. rep., International
Labour O�ce, Santo Domingo.
Ironmonger, D. 1997. �National accounts of household productive activities.� In prepared for the Con-
ference on Time Use, Non-Market Work, and Family Well-Being.
Ironmonger, D. S. 1994. �Modelling the Household Economy.� In Economics, Econometrics and the
LINK: Essays in Honor of Lawrence R. Klein, edited by M. J. Dutta. North-Holland.
���. 1996. �Counting outputs, capital Inputs and caring labor: Estimating gross household product.�
Feminist Economics 2 (3):37�64.
Jenkins, S.P. and N.C. O'Leary. 1995. �Modelling domestic work time.� Journal of Population Economics
8 (3):265�279.
Kendrick, J.W. 1972. Economic accounts and their uses. McGraw-Hill Book Company. New York.
���. 1979. �Expanding Imputed Values in the National Income and Product Accounts.� Review of
Income and Wealth 25 (4):349.
Lewis, J., M. Campbell, and C. Huerta. 2008. �Patterns of paid and unpaid work in Western Europe:
gender, commodi�cation, preferences and the implications for policy.� Journal of European Social
Policy 18 (1):21.
Mincer, J. and S. Polachek. 1974. �Family investments in human capital: earnings of women.� The
journal of political economy 82 (2):76�108.
Nicodemo, C. and R. Waldmann. 2009. �Child-Care and Participation in the Labor Market for Married
Women in Mediterranean Countries.� IZA Discussion Papers .
Nordhaus, W. D. and J. Tobin. 1973. �Is growth obsolete?� In The Measurement of Economic and
Social Performance, studies in Income and Wealth, vol. 38, edited by M. Moss. New York: Columbia
University Press, 509�532.
OECD. 1992. �What is households non-market production worth?� Tech. rep., Organization for Economic
Co-operation and Development, Paris. OECD Economic Studies No. 18.
���. 1995. �Household Production in OECD Countries.� Tech. rep., Organization for Economic
Co-operation and Development, Paris. Data Sources and Measurement Methods.
���. 1999. �Proposal for a satellite account of household production.� Tech. rep., Organization for
Economic Co-operation and Development, Paris. OECD meeting of National Accounts Experts.
Reid, M.G. 1934. Economics of household production. J. Wiley & Sons, Inc.
SF. 1999. �Proposal for a satellite account of household production.� Tech. rep., Statistics Finland,
OECD, Paris. OECD meeting of National Accounts Experts.
SNZ. 1999. �Unpaid Work in New Zealand.� Tech. rep., Statistics New Zeland, Wellington, New Zeland.
Solera, C. 2008. �Combining marriage and children with paid work: Changes across cohorts in Italy and
Great Britain.� ISER working papers .
18

Swiebel, J. 1999. �Unpaid work and policy-making: Towards a broader perspective of work and employ-
ment.� United Nations - DESA Discussion Paper Series 10:20�30.
Trewin, D. 2000. �Unpaid work and the Australian economy: 1997.� Australian Bureau of Statistics .
Voicu, B., M. Voicu, and K. Strapkova. 2007. �Engendered housework. A cross-european analysis.� IRISS
Working Paper Series .
19

Figures
Figure 1: Observed and imputed potential wages for men and women (Estimates on EU-SILC 2006,values in logs of ¿/h)
20
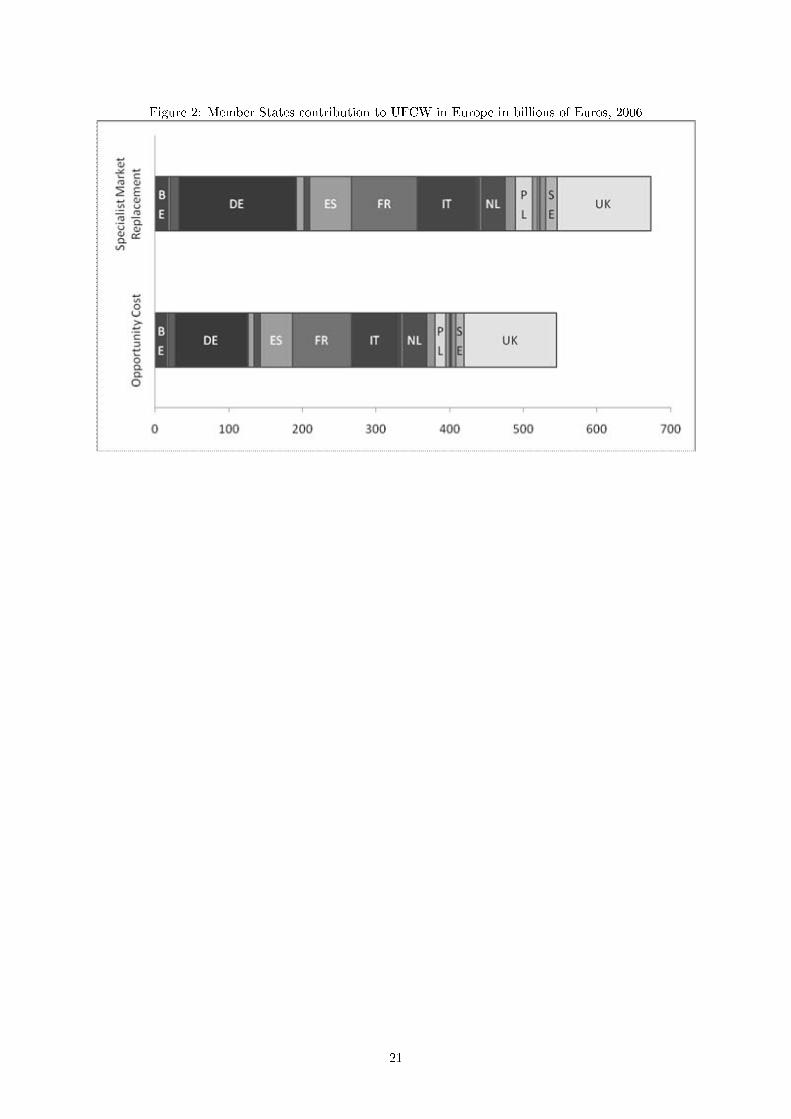
Figure 2: Member States contribution to UFCW in Europe in billions of Euros, 2006
21
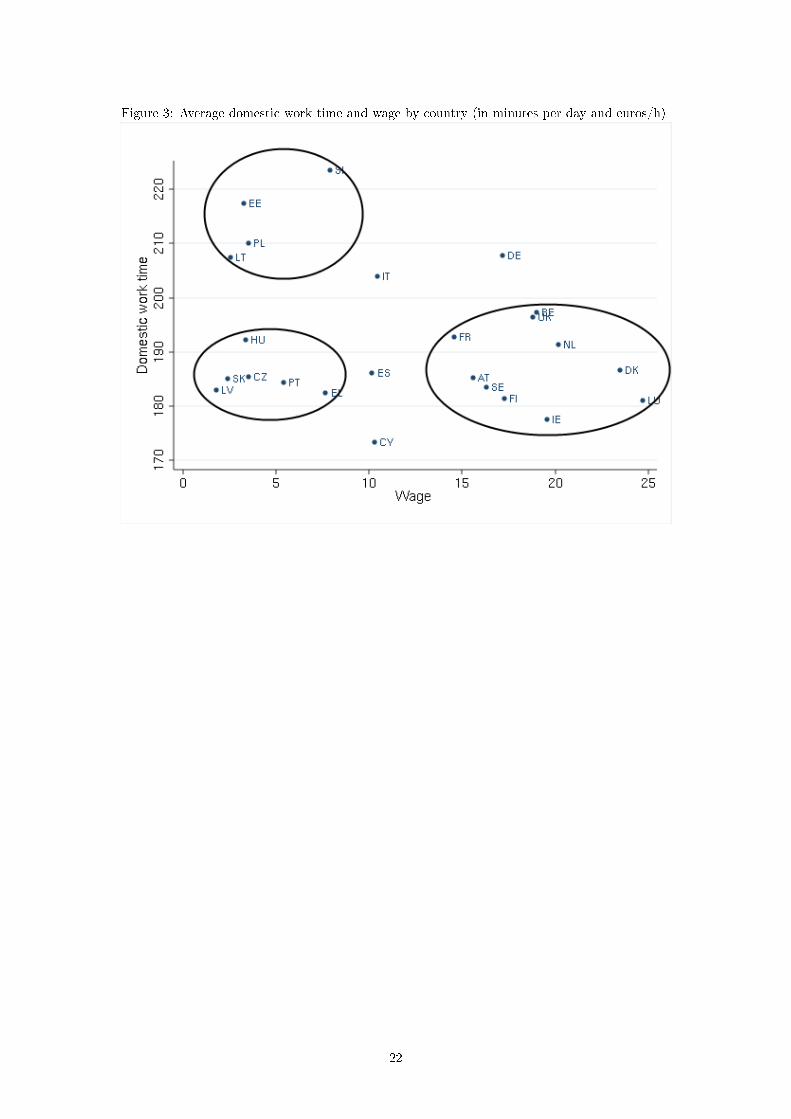
Figure 3: Average domestic work time and wage by country (in minutes per day and euros/h)
22

Figure 4: Average childcare work time and wage by country (in minutes per day and euros/h).
23

Figure 5: Average male domestic work time and wage by country (in minutes per day and euros/h).
24
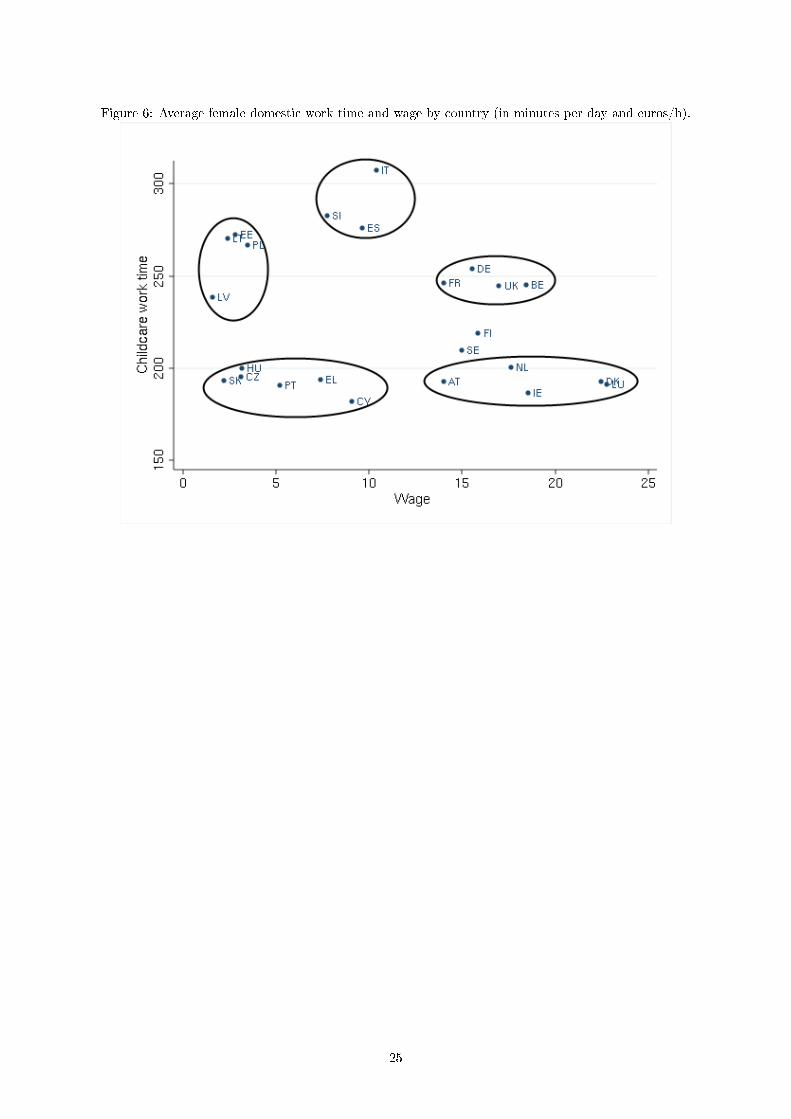
Figure 6: Average female domestic work time and wage by country (in minutes per day and euros/h).
25

Figure 7: Average male childcare work time and wage by country (in minutes per day and euros/h).
26
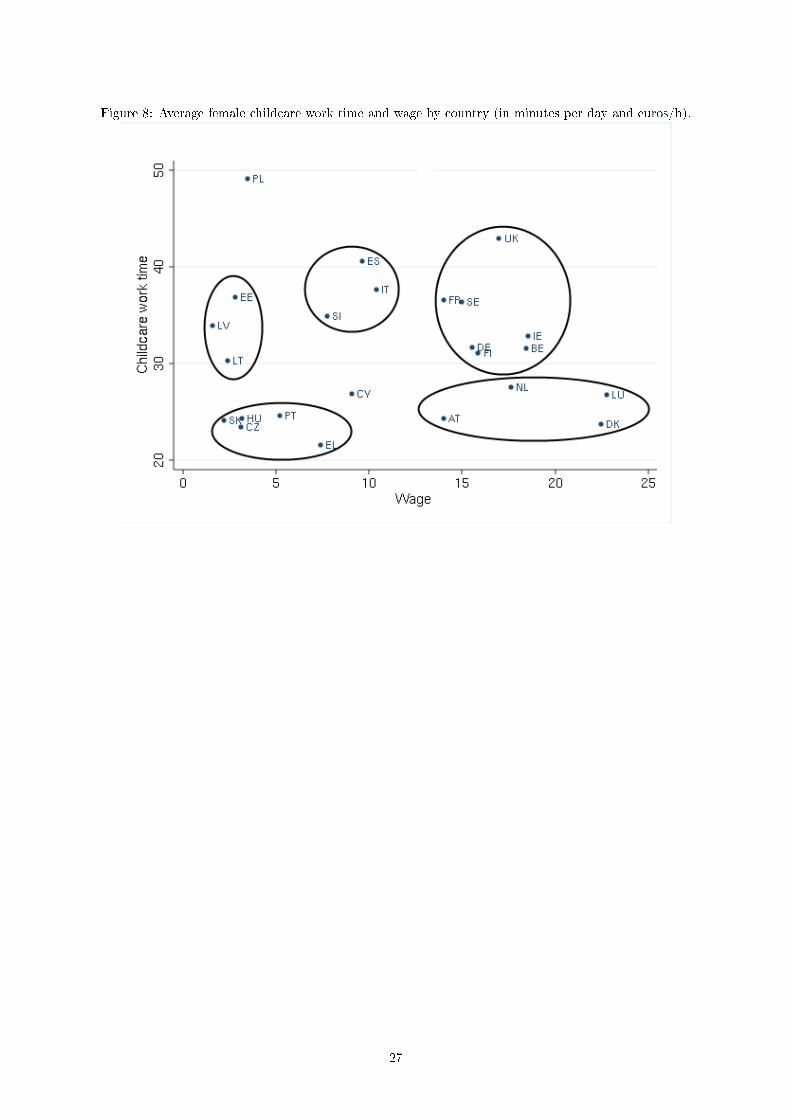
Figure 8: Average female childcare work time and wage by country (in minutes per day and euros/h).
27

Tables
Table 1: Observed and imputed time use categories (minutes per day. Source: HETUS)Time useactivity
Observed Imputed
Domestic work 200.7 198.1Childcare 25.9 26.0Leisure 323.4 322.2
Other activities 714.4 714.4
28
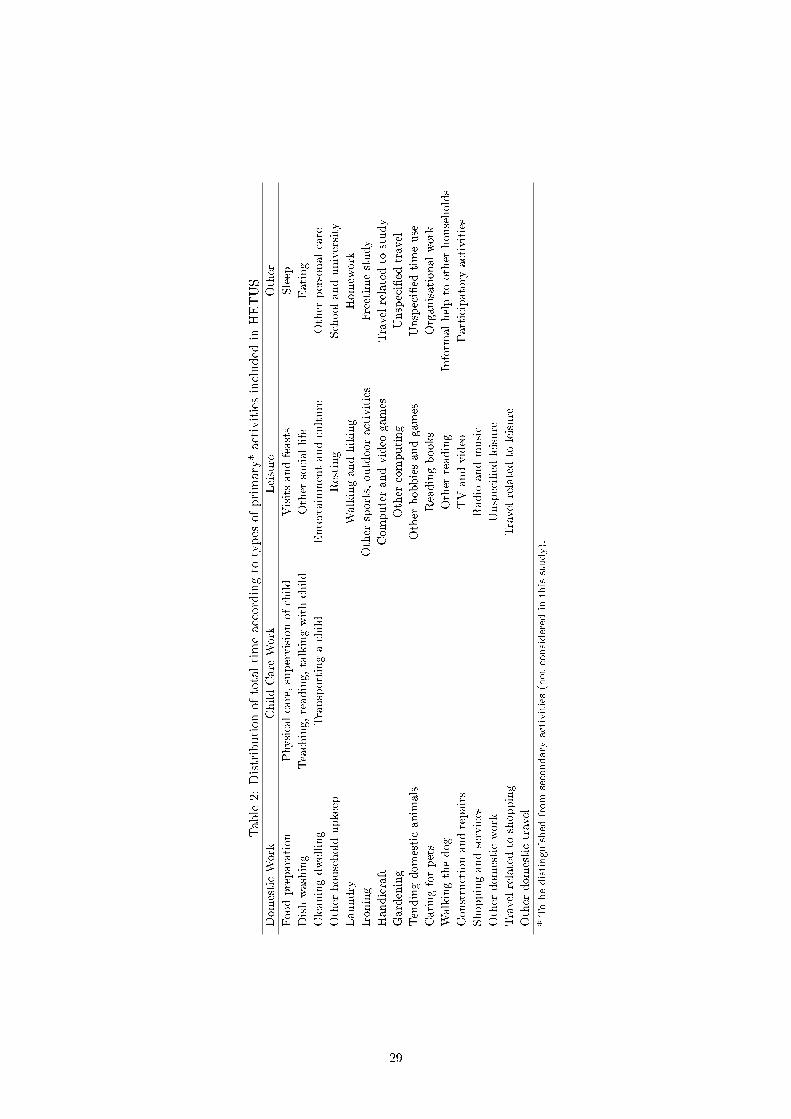
Table2:Distributionoftotaltimeaccordingto
types
ofprimary*activitiesincluded
inHETUS
DomesticWork
ChildCare
Work
Leisure
Other
Foodpreparation
Physicalcare,supervisionofchild
Visitsandfeasts
Sleep
Dishwashing
Teaching,reading,talkingwithchild
Other
sociallife
Eating
Cleaningdwelling
Transportingachild
Entertainmentandculture
Other
personalcare
Other
household
upkeep
Resting
Schoolanduniversity
Laundry
Walkingandhiking
Homew
ork
Ironing
Other
sports,outdooractivities
Freetim
estudy
Handicraft
Computerandvideo
games
Travelrelatedto
study
Gardening
Other
computing
Unspeci�ed
travel
Tendingdomesticanim
als
Other
hobbiesandgames
Unspeci�ed
timeuse
Caringforpets
Readingbooks
Organisationalwork
Walkingthedog
Other
reading
Inform
alhelpto
other
households
Constructionandrepairs
TVandvideo
Participatory
activities
Shoppingandservices
Radio
andmusic
Other
domesticwork
Unspeci�ed
leisure
Travelrelatedto
shopping
Travelrelatedto
leisure
Other
domestictravel
*Tobedistinguished
from
secondary
activities(notconsidered
inthisstudy).
29
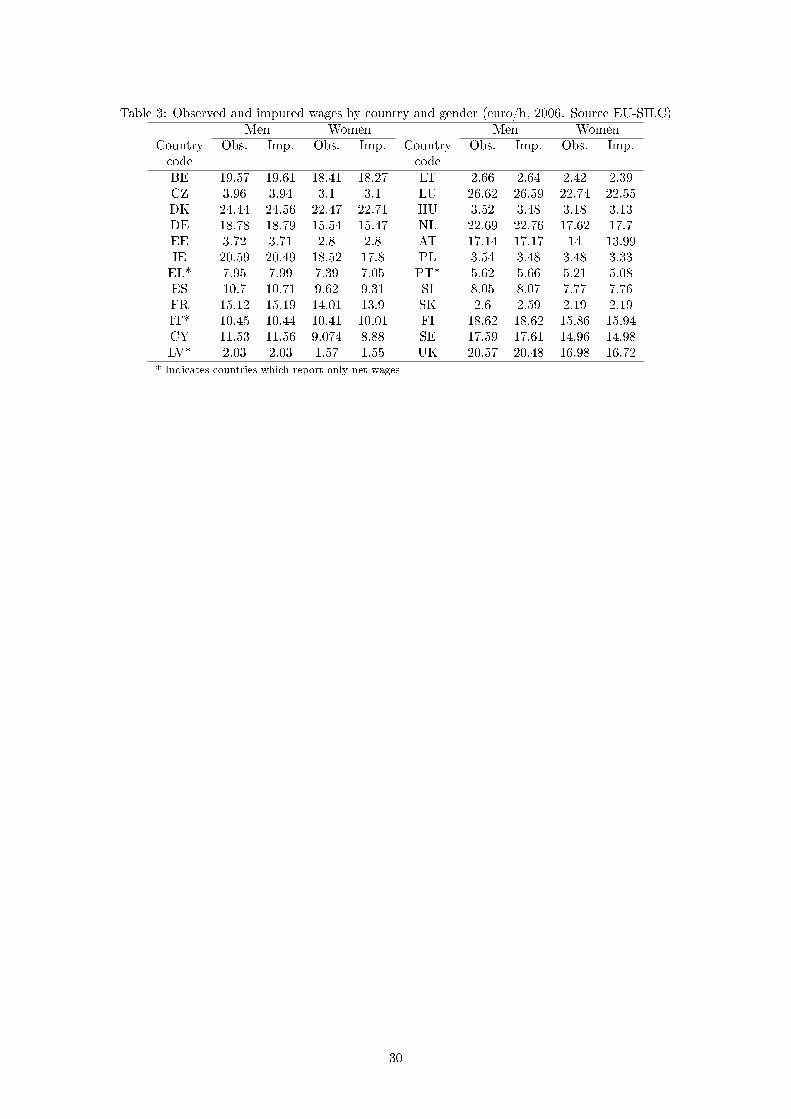
Table 3: Observed and imputed wages by country and gender (euro/h, 2006. Source EU-SILC)Men Women Men Women
Countrycode
Obs. Imp. Obs. Imp. Countrycode
Obs. Imp. Obs. Imp.
BE 19.57 19.61 18.41 18.27 LT 2.66 2.64 2.42 2.39CZ 3.96 3.94 3.1 3.1 LU 26.62 26.59 22.74 22.55DK 24.44 24.56 22.47 22.71 HU 3.52 3.48 3.18 3.13DE 18.78 18.79 15.54 15.47 NL 22.69 22.76 17.62 17.7EE 3.72 3.71 2.8 2.8 AT 17.14 17.17 14 13.99IE 20.59 20.49 18.52 17.8 PL 3.54 3.48 3.48 3.33EL* 7.95 7.99 7.39 7.05 PT* 5.62 5.66 5.21 5.08ES 10.7 10.71 9.62 9.31 SI 8.05 8.07 7.77 7.76FR 15.12 15.19 14.01 13.9 SK 2.6 2.59 2.19 2.19IT* 10.45 10.44 10.41 10.01 FI 18.62 18.62 15.86 15.94CY 11.53 11.56 9.074 8.88 SE 17.59 17.61 14.96 14.98LV* 2.03 2.03 1.57 1.55 UK 20.57 20.48 16.98 16.72
* Indicates countries which report only net wages
30
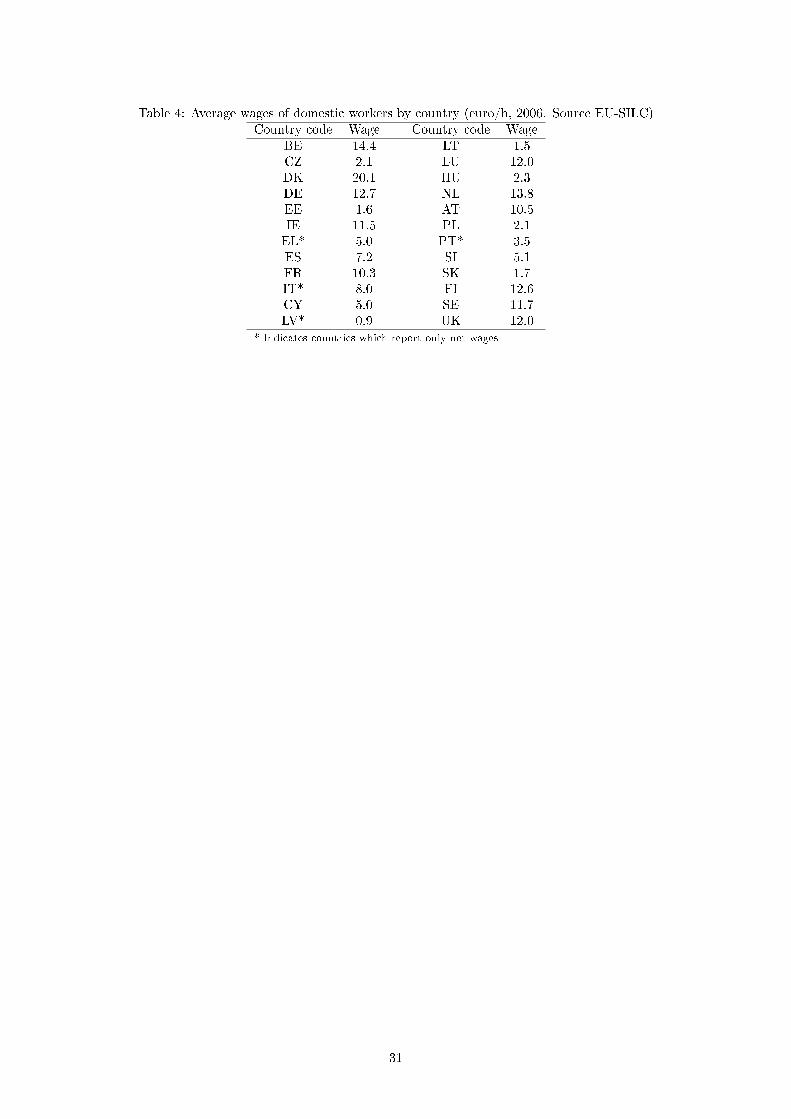
Table 4: Average wages of domestic workers by country (euro/h, 2006. Source EU-SILC)Country code Wage Country code Wage
BE 14.4 LT 1.5CZ 2.1 LU 12.0DK 20.1 HU 2.3DE 12.7 NL 13.8EE 1.6 AT 10.5IE 11.5 PL 2.1EL* 5.0 PT* 3.5ES 7.2 SI 5.1FR 10.3 SK 1.7IT* 8.0 FI 12.6CY 5.0 SE 11.7LV* 0.9 UK 12.0
* Indicates countries which report only net wages
31

Table 5: Observed and imputed childcare categories (average minutes per day: Source: HETUS)Time use activity Observed ImputedPhysical Care 13.74 13.73Teaching 8.11 8.52
Transporting 3.97 4.34
32

Table 6: Hourly wages related to specialized childcare activities (euro/h, 2006. Source: EU-SILC)Country Physical care Teaching TransportBE 16.06 23.10 16.29CZ 2.78 4.41 3.16DK 20.26 26.69 21.03DE 14.31 28.26 16.71EE 2.08 3.59 3.13IE 14.96 35.63 15.53EL* 6.17 13.64 7.26ES 8.60 18.00 9.12FR 12.01 20.80 11.90IT* 8.58 17.04 9.16CY 8.51 20.71 9.44LV* 1.26 2.51 1.59LT 1.84 3.49 2.25LU 14.97 44.50 16.64HU 2.63 4.52 2.77NL 15.95 25.13 17.32AT 14.21 24.55 14.15PL 2.33 6.12 2.70PT* 3.87 12.75 4.19SI 5.71 12.51 5.79SK 1.87 2.78 2.25FI 13.33 20.97 13.43SE 13.15 15.66 14.15UK 13.37 23.81 15.12
* Indicates countries which report only net wages
33
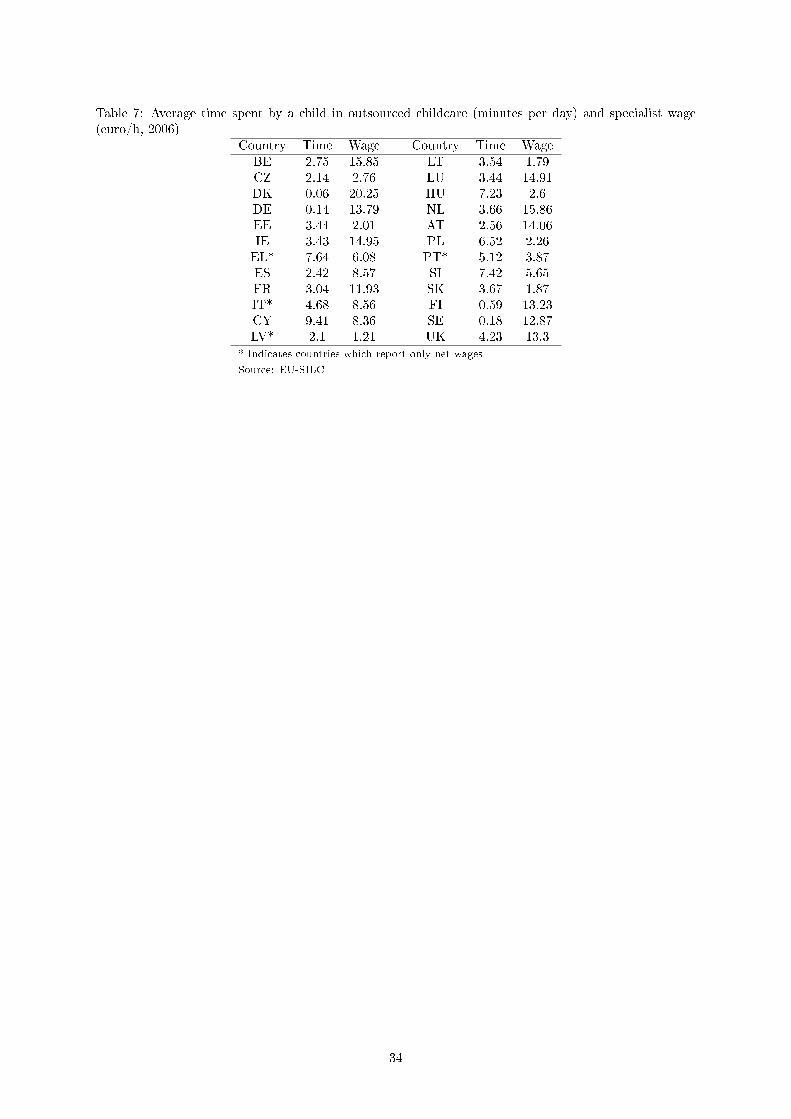
Table 7: Average time spent by a child in outsourced childcare (minutes per day) and specialist wage(euro/h, 2006)
Country Time Wage Country Time WageBE 2.75 15.85 LT 3.54 1.79CZ 2.14 2.76 LU 3.44 14.91DK 0.06 20.25 HU 7.23 2.6DE 0.14 13.79 NL 3.66 15.86EE 3.44 2.01 AT 2.56 14.06IE 3.43 14.95 PL 6.52 2.26EL* 7.64 6.08 PT* 5.12 3.87ES 2.42 8.57 SI 7.42 5.65FR 3.04 11.93 SK 3.67 1.87IT* 4.68 8.56 FI 0.59 13.23CY 9.41 8.36 SE 0.18 12.87LV* 2.1 1.21 UK 4.23 13.3
* Indicates countries which report only net wages
Source: EU-SILC
34
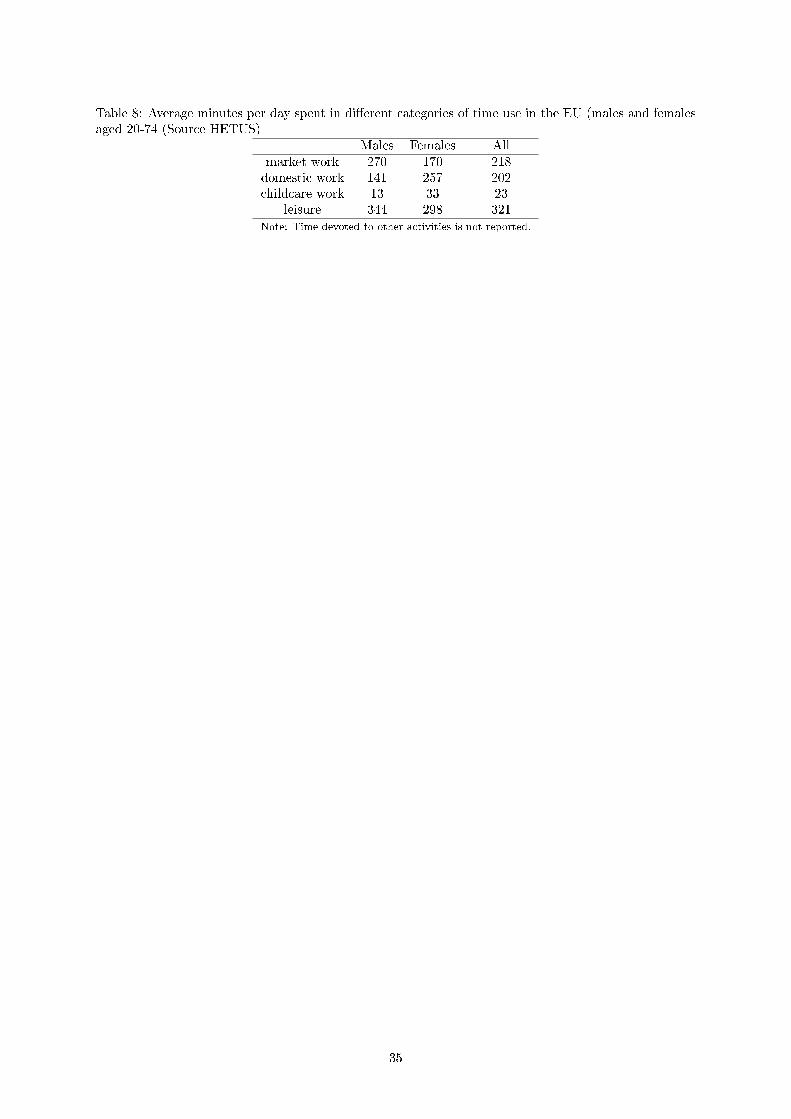
Table 8: Average minutes per day spent in di�erent categories of time use in the EU (males and femalesaged 20-74 (Source HETUS)
Males Females Allmarket work 270 170 218domestic work 141 257 202childcare work 13 33 23
leisure 344 298 321Note: Time devoted to other activities is not reported.
35
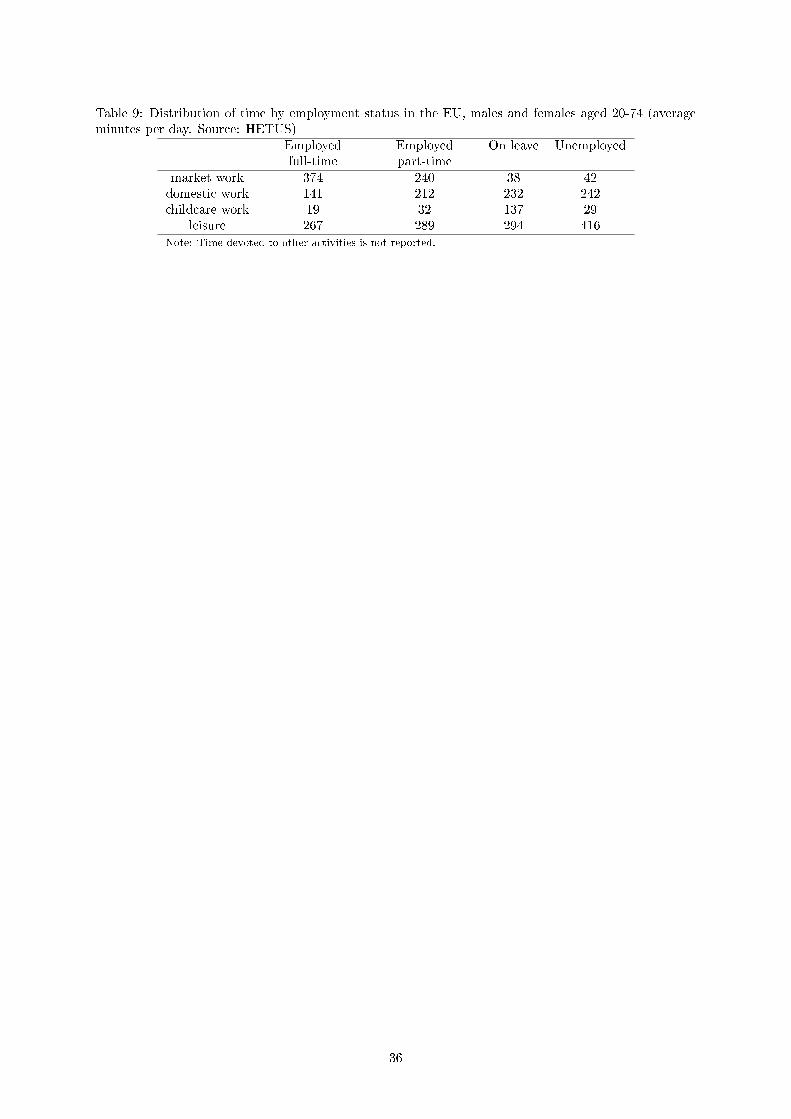
Table 9: Distribution of time by employment status in the EU, males and females aged 20-74 (averageminutes per day. Source: HETUS)
Employedfull-time
Employedpart-time
On leave Unemployed
market work 374 240 38 42domestic work 141 212 232 242childcare work 19 32 137 29
leisure 267 289 294 416Note: Time devoted to other activities is not reported.
36
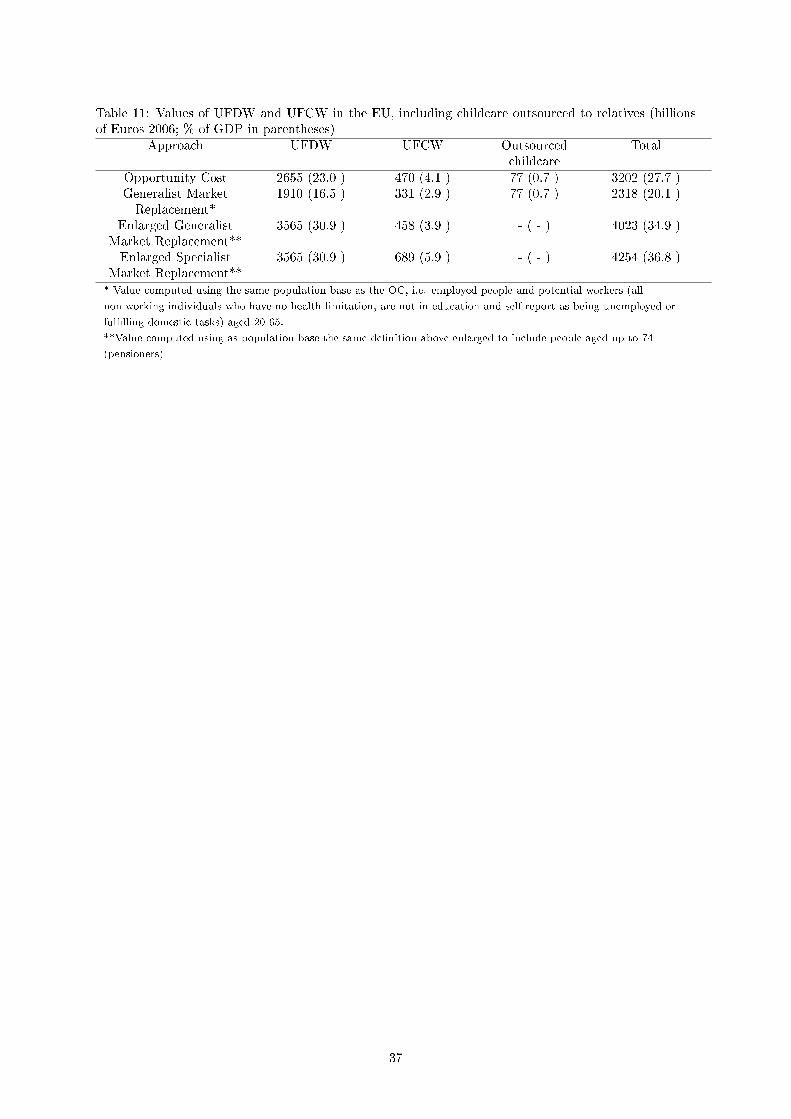
Table 11: Values of UFDW and UFCW in the EU, including childcare outsourced to relatives (billionsof Euros 2006; % of GDP in parentheses)
Approach UFDW UFCW Outsourcedchildcare
Total
Opportunity Cost 2655 (23.0 ) 470 (4.1 ) 77 (0.7 ) 3202 (27.7 )Generalist MarketReplacement*
1910 (16.5 ) 331 (2.9 ) 77 (0.7 ) 2318 (20.1 )
Enlarged GeneralistMarket Replacement**
3565 (30.9 ) 458 (3.9 ) - ( - ) 4023 (34.9 )
Enlarged SpecialistMarket Replacement**
3565 (30.9 ) 689 (5.9 ) - ( - ) 4254 (36.8 )
* Value computed using the same population base as the OC, i.e. employed people and potential workers (all
non-working individuals who have no health limitation, are not in education and self-report as being unemployed or
ful�lling domestic tasks) aged 20-65.
**Value computed using as population base the same de�nition above enlarged to include people aged up to 74
(pensioners)
37
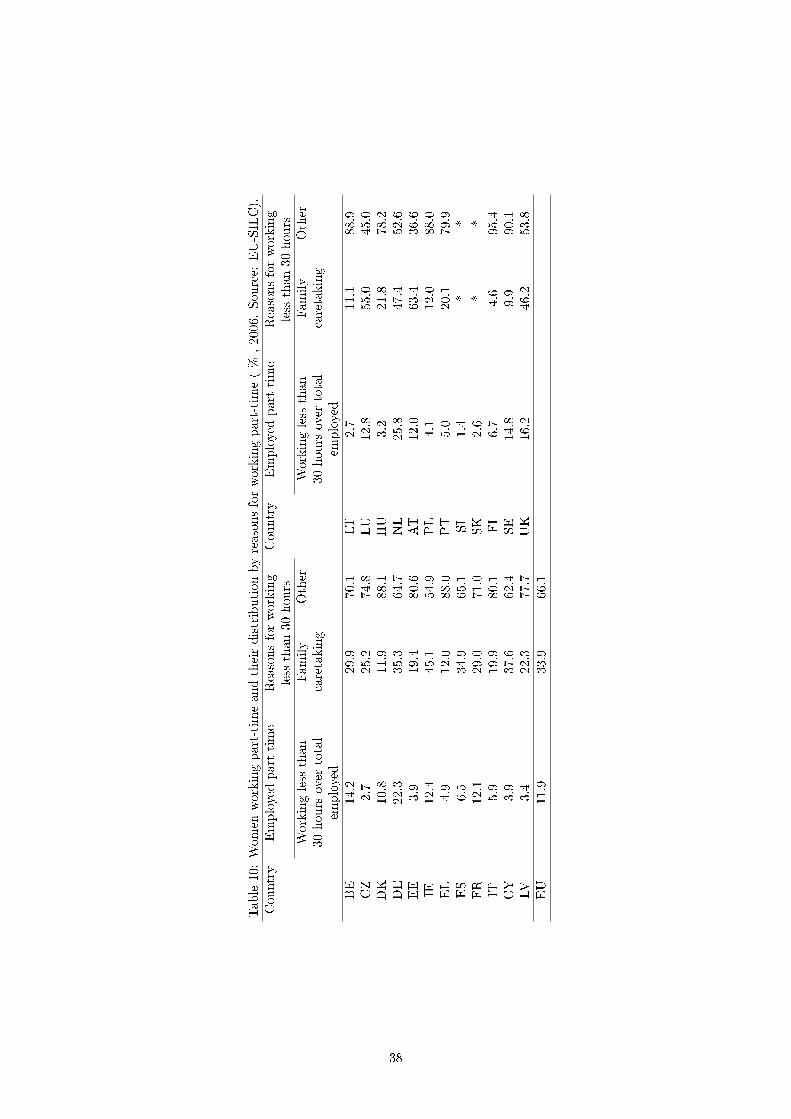
Table10:Women
workingpart-timeandtheirdistributionbyreasonsforworkingpart-time(%
,2006.Source:
EU-SILC).
Country
Employedpart-time
Reasonsforworking
less
than30
hours
Country
Employedpart-time
Reasonsforworking
less
than30hours
Workingless
than
30hours
over
total
employed
Family
caretaking
Other
Workingless
than
30hours
over
total
employed
Family
caretaking
Other
BE
14.2
29.9
70.1
LT
2.7
11.1
88.9
CZ
2.7
25.2
74.8
LU
12.8
55.0
45.0
DK
10.8
11.9
88.1
HU
3.2
21.8
78.2
DE
22.3
35.3
64.7
NL
25.8
47.4
52.6
EE
3.9
19.4
80.6
AT
12.0
63.4
36.6
IE12.4
45.1
54.9
PL
4.1
12.0
88.0
EL
4.9
12.0
88.0
PT
5.0
20.1
79.9
ES
6.5
34.9
65.1
SI
1.4
**
FR
12.1
29.0
71.0
SK
2.6
**
IT5.9
19.9
80.1
FI
6.7
4.6
95.4
CY
3.9
37.6
62.4
SE
14.8
9.9
90.1
LV
3.4
22.3
77.7
UK
16.2
46.2
53.8
EU
11.9
33.9
66.1
38

Table 12: GDP and UFDW in the EU Member States by gender in 2006 (billion Euros and % of countryGDP)
Country GDP UFDW-OC UFDW- MRmale female Total % of GDP male female Total % of GDP
BE 318.2 34.0 56.1 90.1 28.3 46.7 77.9 125.0 39.3CZ 113.4 8.3 7.0 15.3 13.5 8.3 9.7 18.0 15.9DK 218.3 29.2 26.6 55.8 25.6 40.6 43.5 84.1 38.5DE 2321.5 262.0 401.0 663.0 28.6 352.0 623.0 975.0 42.0EE 13.1 0.9 1.4 2.3 17.8 0.7 1.4 2.0 15.5IE 177.2 16.2 18.6 34.8 19.6 15.8 18.0 33.8 19.1EL* 213.2 13.7 16.8 30.5 14.3 20.1 23.7 43.9 20.6ES 982.3 53.5 137.0 190.5 19.4 66.0 190.0 256.0 26.1FR 1807.5 132.0 244.0 376.0 20.8 171.0 320.0 491.0 27.2IT* 1480.0 56.4 216.0 272.4 18.4 101.0 318.0 419.0 28.3CY 14.7 1.9 1.6 3.5 23.8 1.3 1.5 2.8 19.2LV* 16.1 0.7 1.1 1.7 10.9 0.5 1.1 1.6 10.0LT 24.0 1.5 2.6 4.1 17.0 1.4 3.1 4.5 18.7LU 33.9 2.8 2.7 5.5 16.1 2.0 2.3 4.2 12.5HU 90.0 6.7 6.8 13.5 15.0 8.5 10.2 18.7 20.8NL 539.9 83.3 60.4 143.7 26.6 86.4 94.8 181.0 33.5AT 257.3 29.3 26.8 56.1 21.8 32.7 36.5 69.2 26.9PL 272.1 21.4 35.5 56.9 20.9 25.7 47.1 72.8 26.8PT* 155.5 11.9 11.3 23.2 14.9 13.9 15.7 29.6 19.0SI 31.0 3.0 4.3 7.3 23.5 3.7 6.5 10.2 32.9SK 44.6 2.9 2.5 5.4 12.1 3.3 4.1 7.4 16.6FI 167.0 14.8 19.7 34.5 20.7 19.7 30.3 49.9 29.9SE 313.5 28.0 32.9 60.9 19.4 33.3 45.4 78.7 25.1UK 1939.0 203.0 299.0 502.0 25.9 217.0 370.0 587.0 30.3
* Values computed on net wages.
39

Table 13: GDP and UFCW in the EU Member States by gender in 2006 (billion Euros and % of countryGDP)
Country GDP UFCW, OC UFCW, ESMRMale Female Total % GDP Male Female Total % of GDP
BE 318.2 3.6 9.0 12.6 4.0 5.4 12.5 17.8 5.6CZ 113.4 1.3 1.3 2.6 2.2 1.4 1.9 3.3 2.9DK 218.3 4.3 4.2 8.4 3.9 5.0 6.0 10.9 5.0DE 2321.5 31.8 66.1 97.9 4.2 51.0 116.0 167.0 7.2EE 13.1 0.1 0.2 0.4 2.7 0.1 0.3 0.4 2.9IE 177.2 2.9 3.8 6.7 3.8 4.3 5.9 10.2 5.8EL* 213.2 2.2 2.8 5.0 2.4 3.9 4.7 8.6 4.0ES 982.3 12.8 26.0 38.8 3.9 19.6 39.7 59.3 6.0FR 1807.5 18.6 48.1 66.7 3.7 26.2 64.7 90.9 5.0IT* 1480.0 13.8 35.7 49.5 3.3 27.4 54.8 82.1 5.5CY 14.7 0.3 0.3 0.6 4.2 0.5 0.6 1.0 6.9LV* 16.1 0.1 0.2 0.2 1.5 0.1 0.3 0.4 2.2LT 24.0 0.2 0.3 0.5 1.9 0.2 0.6 0.8 3.2LU 33.9 0.5 0.5 0.9 2.8 0.5 0.7 1.2 3.5HU 90.0 1.2 1.3 2.4 2.7 1.4 1.8 3.3 3.6NL 539.9 14.3 12.0 26.3 4.9 14.6 18.0 32.7 6.1AT 257.3 4.4 4.6 9.0 3.5 6.2 7.7 13.9 5.4PL 272.1 3.7 7.7 11.5 4.2 7.5 15.8 23.4 8.6PT* 155.5 2.1 2.1 4.1 2.7 3.6 4.1 7.7 4.9SI 31.0 0.4 0.7 1.0 3.3 0.6 1.3 1.8 5.8SK 44.6 0.5 0.4 0.9 2.0 0.6 0.7 1.3 2.8FI 167.0 2.0 3.3 5.3 3.2 2.6 5.2 7.8 4.7SE 313.5 4.9 6.3 11.2 3.6 5.7 9.4 15.1 4.8UK 1939.0 32.2 72.5 104.7 5.4 37.7 88.1 126.0 6.5
* Values computed on net wages.
Note. This OC does not include the value of outsourced childcare.
40

Table 14: Average (imputed) minutes per day spent in UFDW and UFCW by country and genderCountry UFDW UFCW
Male Female All Male Female AllAT 177 192 185 20 24 22BE 149 245 197 13 32 22CY 164 181 173 23 27 25CZ 175 195 185 19 23 21DE 161 254 208 14 32 23DK 180 192 187 20 24 22EE 162 272 217 12 37 24EL 170 194 182 18 22 20ES 96 275 186 18 41 29FI 143 219 181 15 31 23FR 139 246 193 14 37 25HU 184 199 192 21 24 23IE 168 186 178 24 33 29IT 100 307 204 17 38 27LT 144 270 207 11 30 21LU 170 191 181 22 27 24LV 127 238 183 9 34 22NL 182 200 191 22 28 25PL 153 266 210 21 49 35PT 178 190 184 23 25 24SE 157 209 184 22 36 29SI 164 282 224 14 35 24SK 176 193 185 23 24 23UK 148 244 196 18 43 30
41