Embed Size (px)
Citation preview
Gdansk Meeting June 23-24 2003 1
Scenarios and the Integration of Models
Cascading models
Gdansk Meeting June 23-24 2003 2
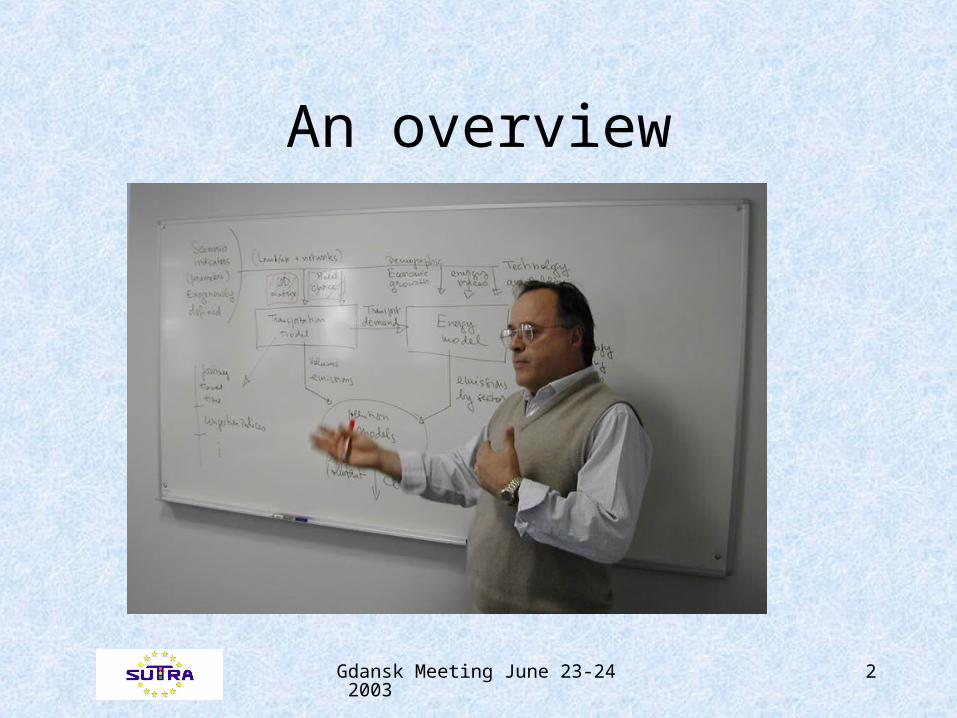
An overview
Gdansk Meeting June 23-24 2003 3
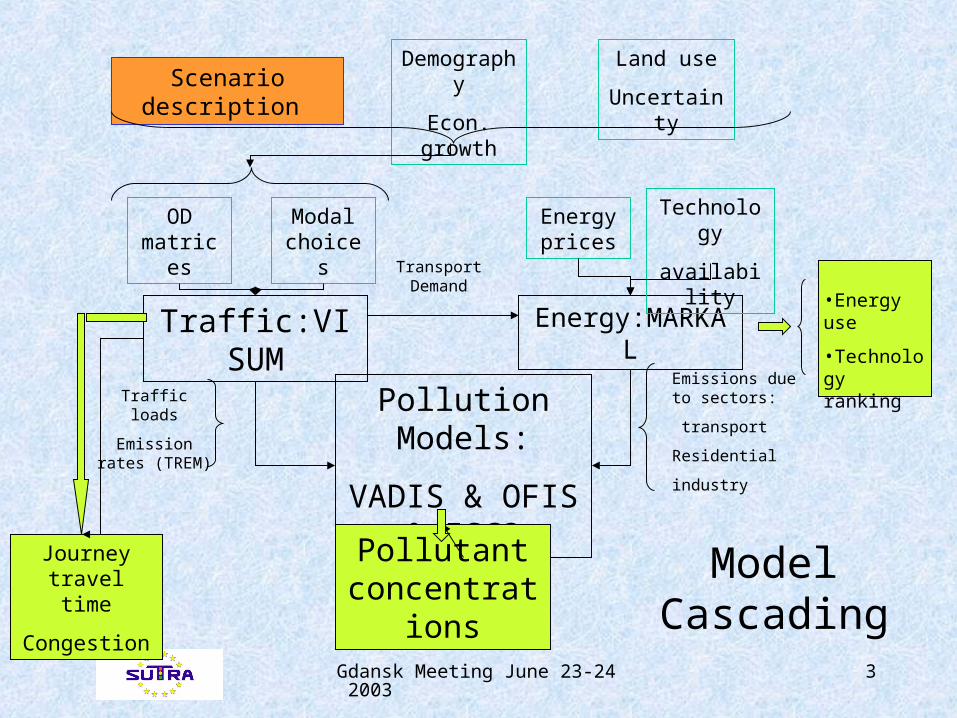
Model Cascading
Traffic loads
Emission rates (TREM)
Emissions due to sectors:
transport
Residential
industry
Pollution Models:
VADIS & OFIS & ISC3
•Energy use
•Technology ranking
Energy:MARKAL
Energy prices
Technology
availability
Pollutant concentrations
Journey travel time
Congestion
Transport Demand
Modal choices
Traffic:VISUM
OD matrices
Land use
Uncertainty
Demography
Econ. growthScenario description
Gdansk Meeting June 23-24 2003 4
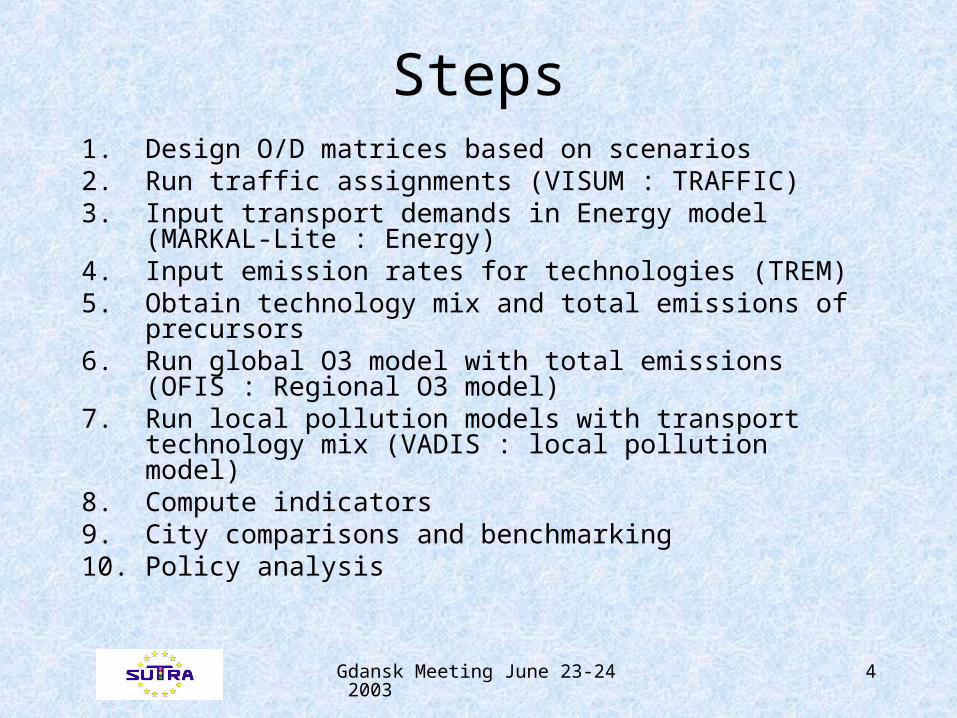
Steps1. Design O/D matrices based on scenarios2. Run traffic assignments (VISUM : TRAFFIC) 3. Input transport demands in Energy model (MARKAL-
Lite : Energy)4. Input emission rates for technologies (TREM)5. Obtain technology mix and total emissions of
precursors6. Run global O3 model with total emissions (OFIS :
Regional O3 model)7. Run local pollution models with transport technology
mix (VADIS : local pollution model)8. Compute indicators 9. City comparisons and benchmarking10. Policy analysis
Gdansk Meeting June 23-24 2003 5
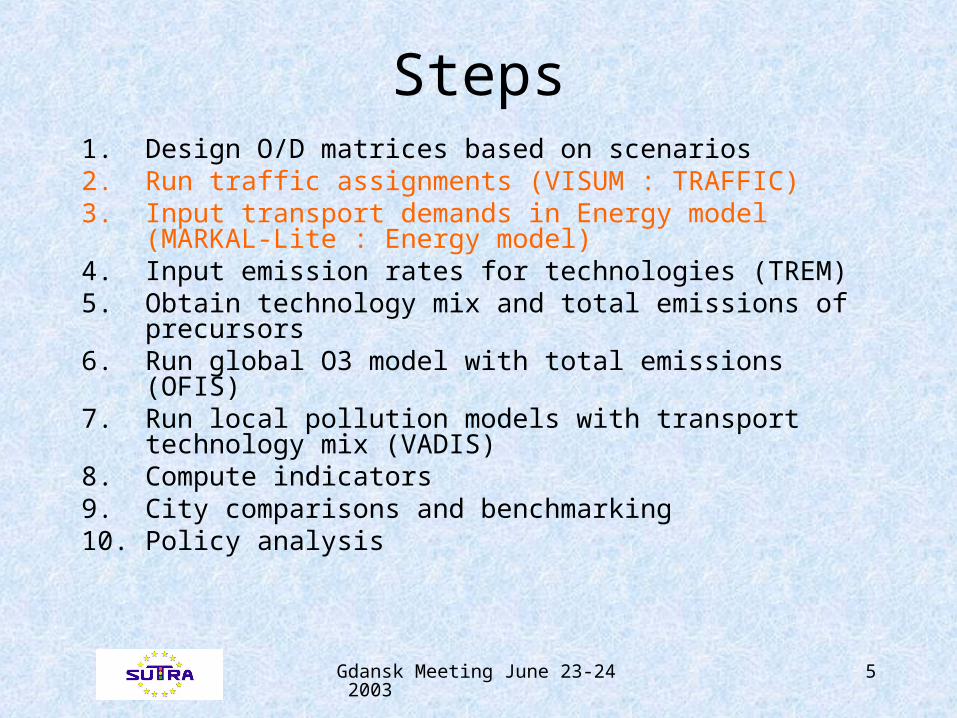
Steps1. Design O/D matrices based on scenarios2. Run traffic assignments (VISUM : TRAFFIC) 3. Input transport demands in Energy model (MARKAL-
Lite : Energy model)4. Input emission rates for technologies (TREM)5. Obtain technology mix and total emissions of
precursors6. Run global O3 model with total emissions (OFIS)7. Run local pollution models with transport technology
mix (VADIS)8. Compute indicators 9. City comparisons and benchmarking10. Policy analysis
Gdansk Meeting June 23-24 2003 6
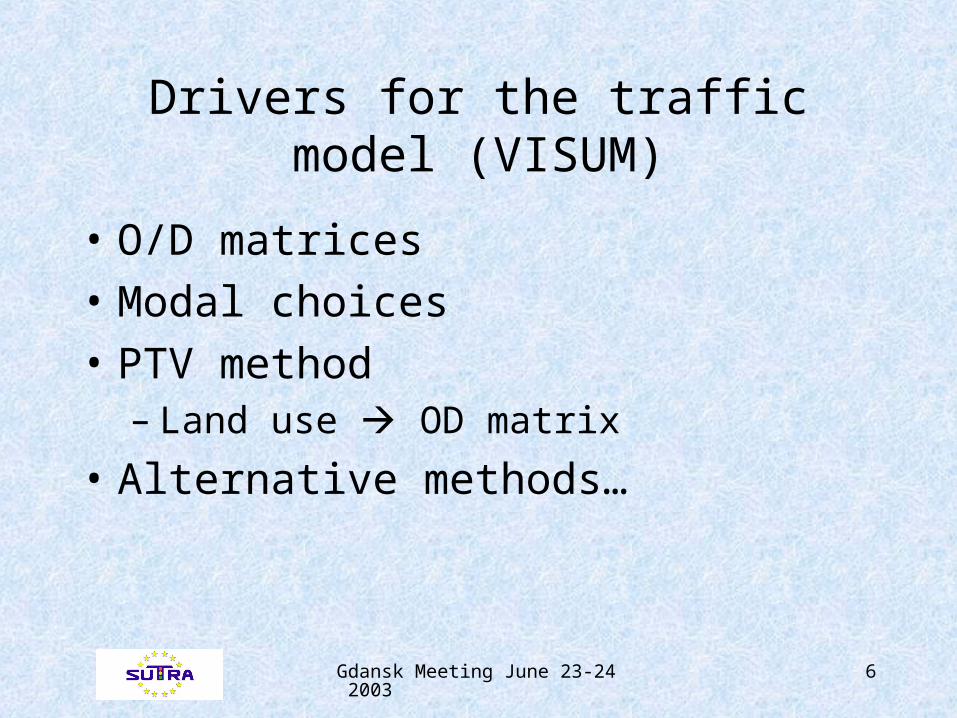
Drivers for the traffic model (VISUM)
• O/D matrices• Modal choices • PTV method
– Land use OD matrix
• Alternative methods…
Gdansk Meeting June 23-24 2003 7
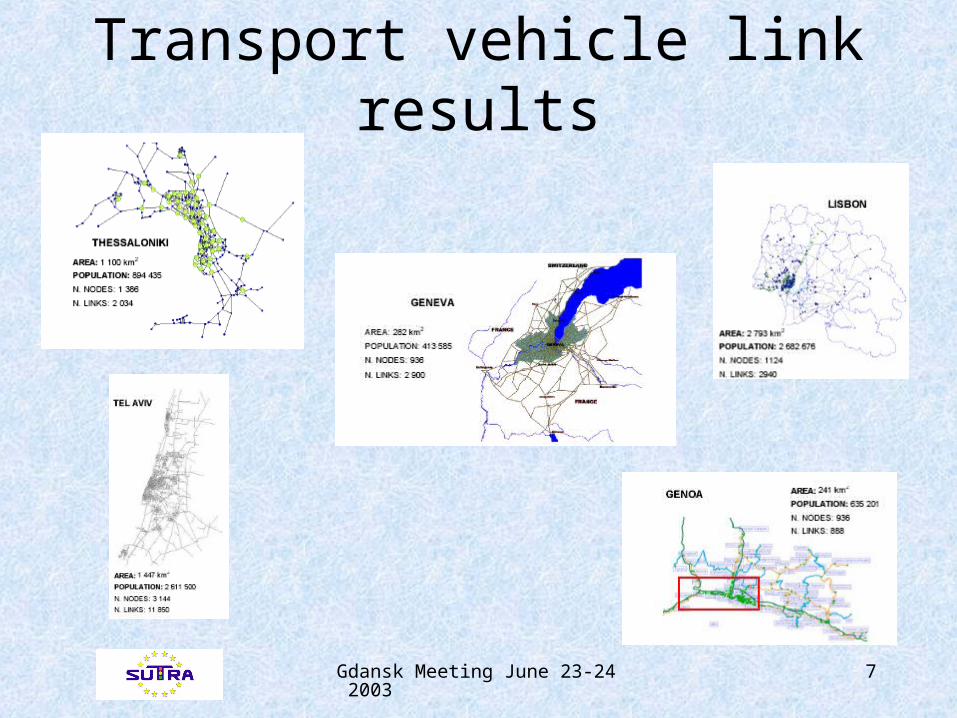
Transport vehicle link results
Gdansk Meeting June 23-24 2003 8
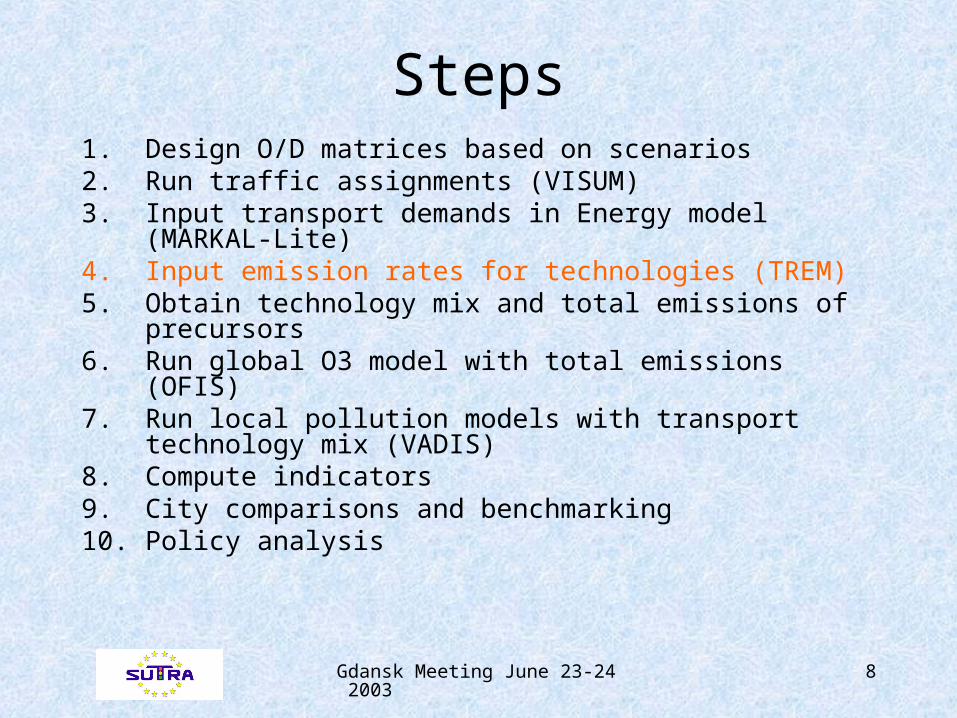
Steps1. Design O/D matrices based on scenarios2. Run traffic assignments (VISUM) 3. Input transport demands in Energy model (MARKAL-
Lite)4. Input emission rates for technologies (TREM)5. Obtain technology mix and total emissions of
precursors6. Run global O3 model with total emissions (OFIS)7. Run local pollution models with transport technology
mix (VADIS)8. Compute indicators 9. City comparisons and benchmarking10. Policy analysis
Gdansk Meeting June 23-24 2003 9
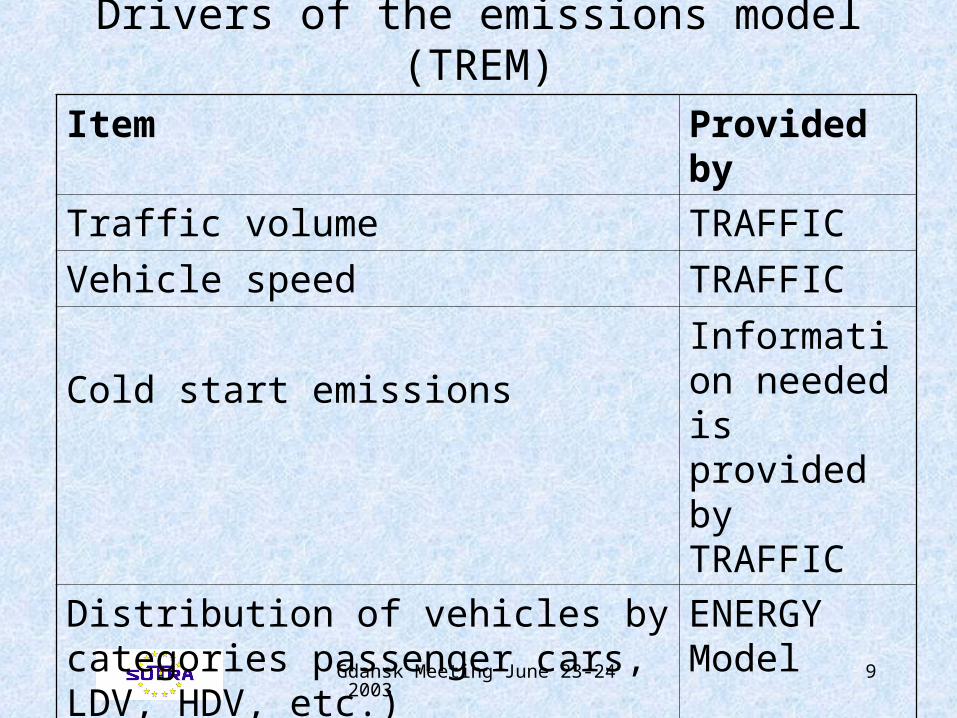
Drivers of the emissions model (TREM)
Item Provided by
Traffic volume TRAFFIC
Vehicle speed TRAFFIC
Cold start emissions
Information needed is provided by TRAFFIC
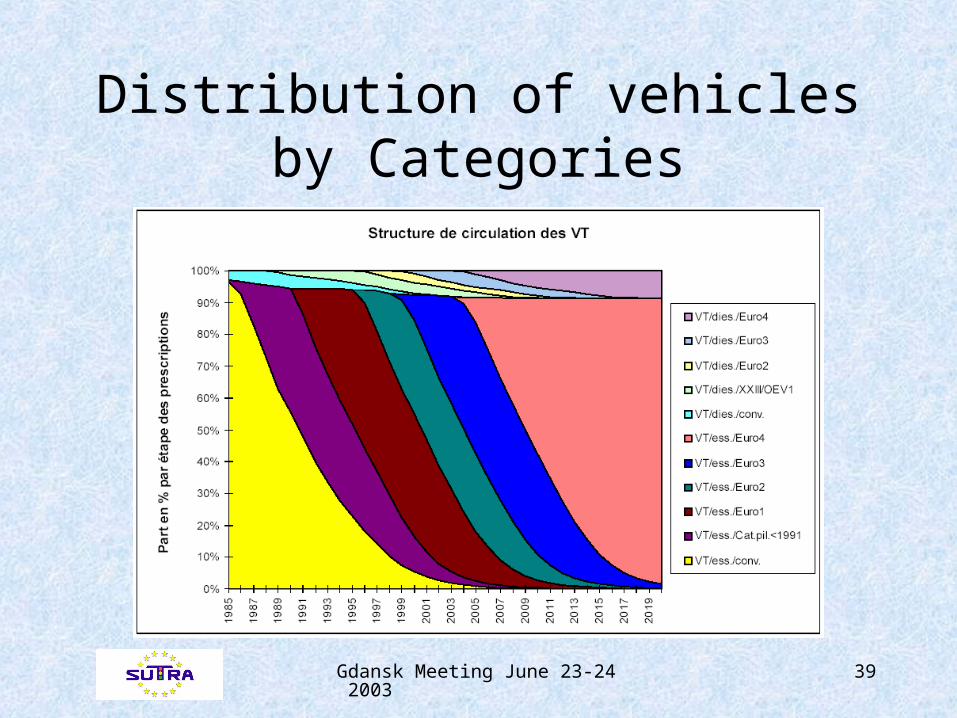
Distribution of vehicles by categories passenger cars, LDV, HDV, etc.)
ENERGY Model
Distribution of vehicles by classes (based on age and technology)
ENERGY Model
Gdansk Meeting June 23-24 2003 10
Steps1. Design O/D matrices based on scenarios2. Run traffic assignments (VISUM) 3. Input transport demands in Energy model (MARKAL-
Lite)4. Input emission rates for technologies (TREM)5. Obtain technology mix and total emissions of
precursors (MARKAL-Lite)6. Run global O3 model with total emissions (OFIS)7. Run local pollution models with transport technology
mix (VADIS)8. Compute indicators 9. City comparisons and benchmarking10. Policy analysis
Gdansk Meeting June 23-24 2003 11
Drivers for the energy model (MARKAL)
• Energy prices – (constant values used for all periods)
• Useful demands • Available technology
– (using the needed energy characteristics parameters)
Gdansk Meeting June 23-24 2003 12
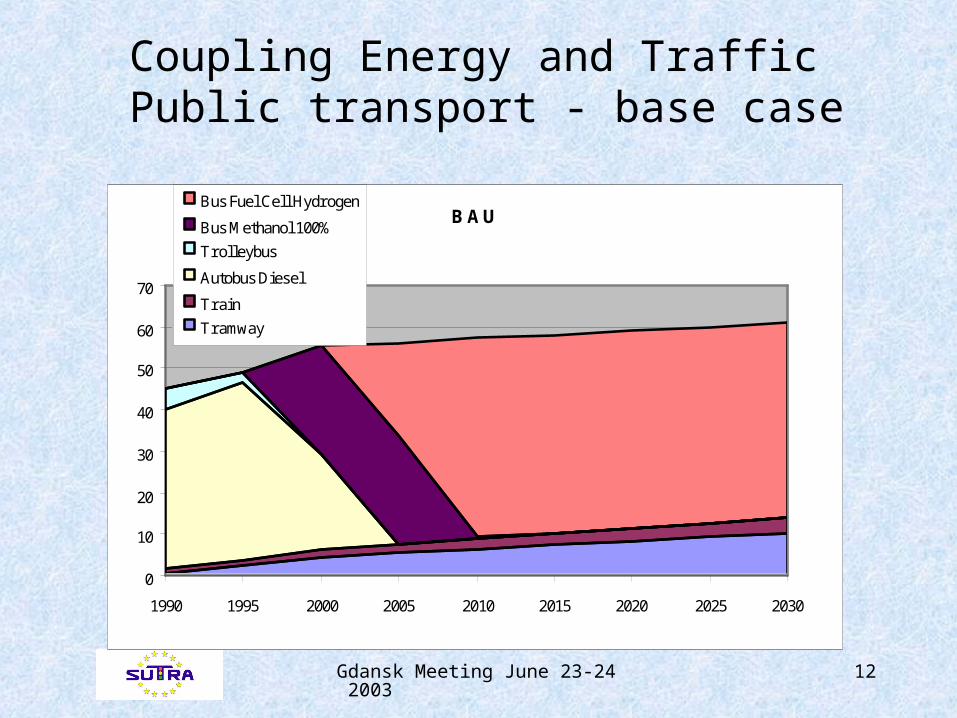
Coupling Energy and Traffic Public transport - base case
BAU
0
10
20
30
40
50
60
70
1990 1995 2000 2005 2010 2015 2020 2025 2030
Bus Fuel Cell Hydrogen
Bus Methanol 100%
Trolleybus
Autobus Diesel
Train
Tramway
Gdansk Meeting June 23-24 2003 13
Steps1. Design O/D matrices based on scenarios2. Run for traffic assignments (VISUM) 3. Input transport demands in Energy model
(MARKAL-Lite)4. Input emission rates for technologies (TREM)5. Obtain technology mix and total emissions of
precursors6. Run global O3 model with total emissions
(REGIONAL O3 model)7. Run local pollution models with transport
technology mix (VADIS)8. Compute indicators 9. City comparisons and benchmarking10. Policy analysis
Gdansk Meeting June 23-24 2003 14
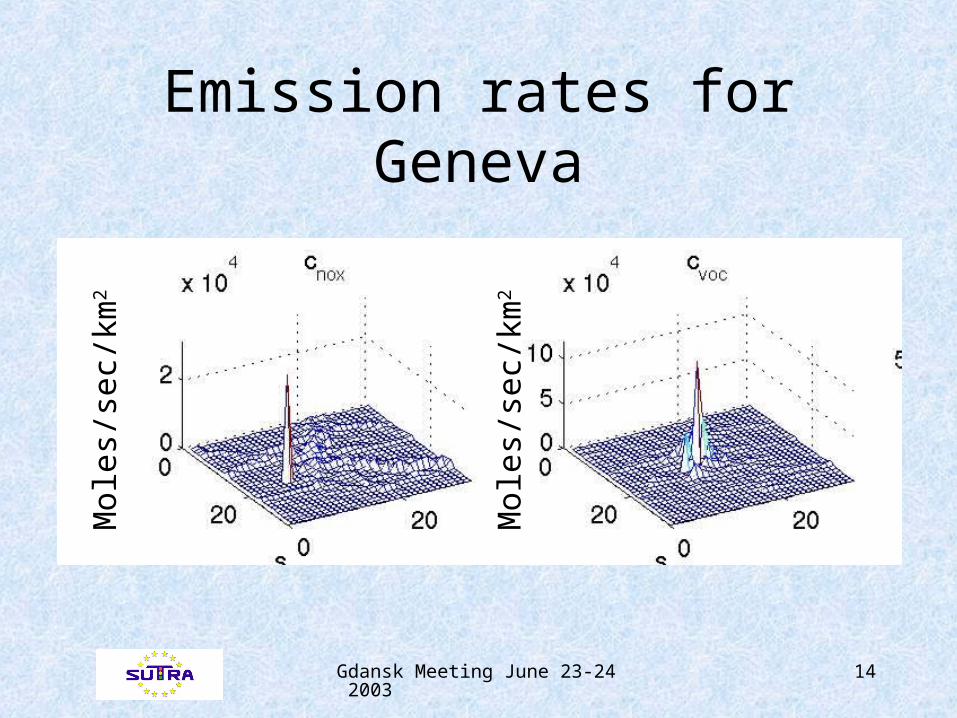
Emission rates for GenevaM
oles
/sec
/km
2
Mol
es/s
ec/k
m2
Gdansk Meeting June 23-24 2003 15
Drivers of the ozone model (OFIS)Geneva example
• Emissions: The emissions are based on the SEDE emissions inventory produced in 1996.
• Meteorology: Wind direction and speed …
• Boundary conditions: The boundary conditions data comes from the measurements station of Chaumont, located on the "Plateau Suisse"
Gdansk Meeting June 23-24 2003 16
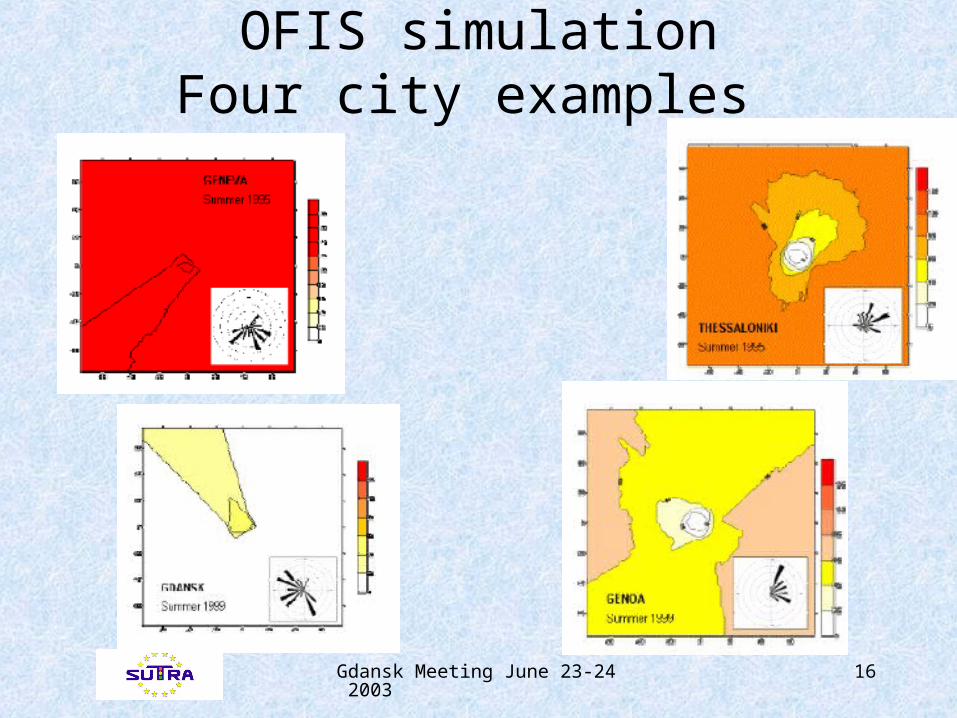
OFIS simulationFour city examples
Gdansk Meeting June 23-24 2003 17
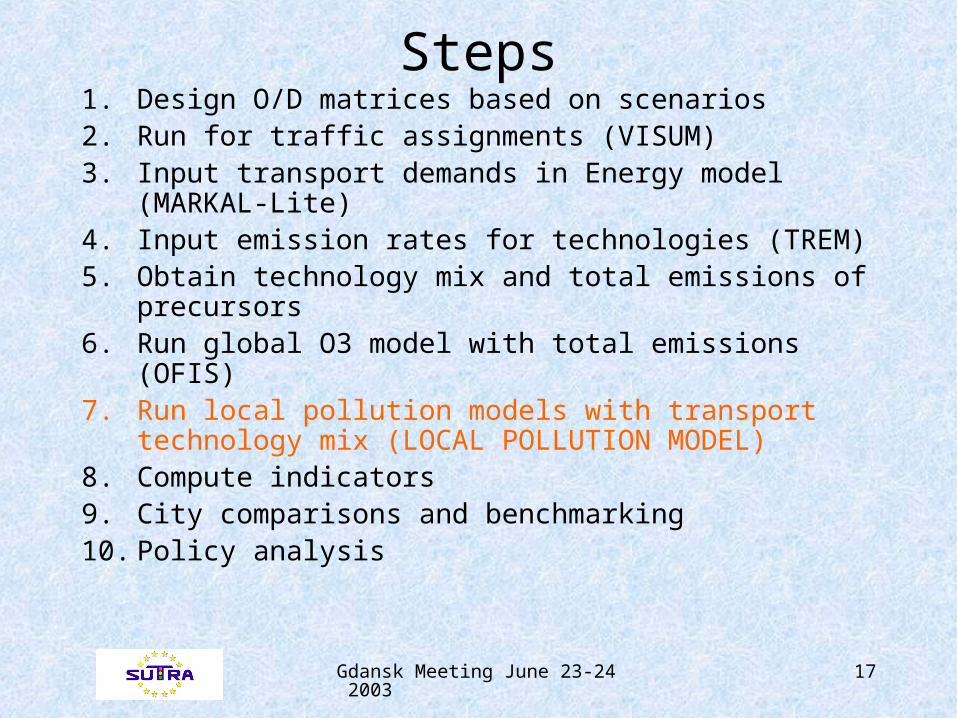
Steps1. Design O/D matrices based on scenarios2. Run for traffic assignments (VISUM) 3. Input transport demands in Energy model
(MARKAL-Lite)4. Input emission rates for technologies (TREM)5. Obtain technology mix and total emissions of
precursors6. Run global O3 model with total emissions (OFIS)7. Run local pollution models with transport
technology mix (LOCAL POLLUTION MODEL)8. Compute indicators 9. City comparisons and benchmarking10. Policy analysis
Gdansk Meeting June 23-24 2003 18
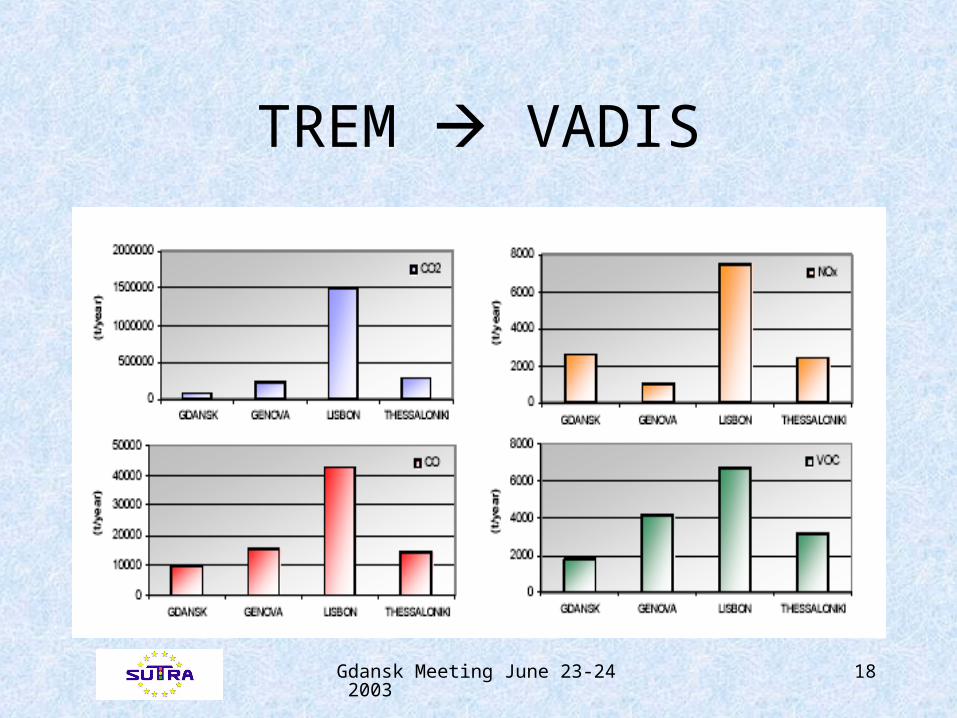
TREM VADIS
Gdansk Meeting June 23-24 2003 19
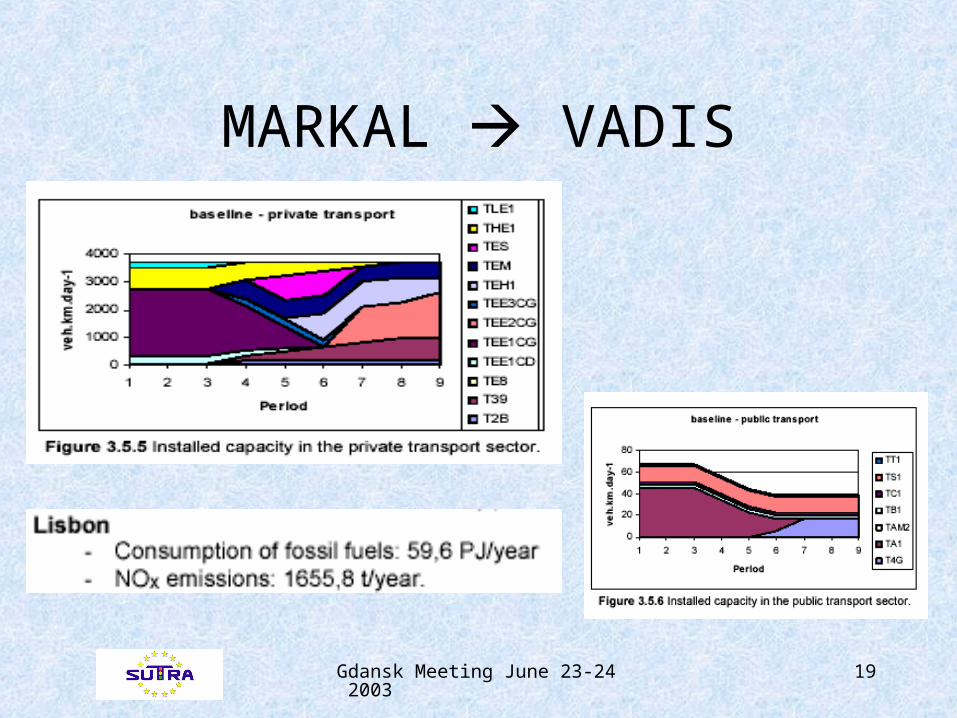
MARKAL VADIS
Gdansk Meeting June 23-24 2003 20
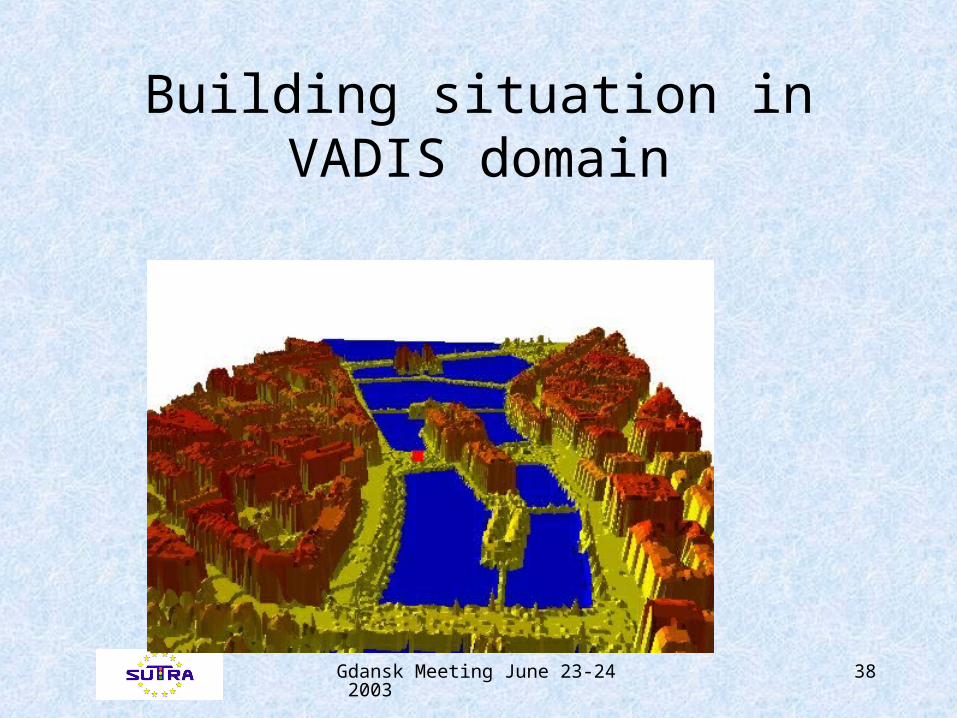
Drivers of the canyon model (VADIS : LOCAL Pollution Model)
• The building situation• Emission sources coordinates
definition • The meteorological conditions • Description and the CO emissions
characterization
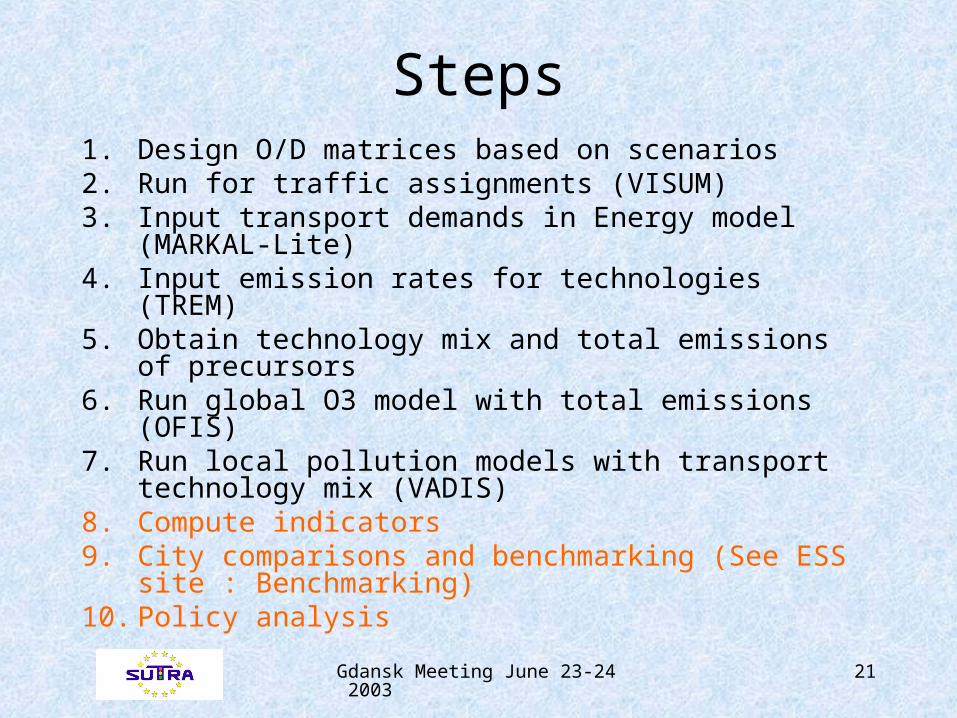
Gdansk Meeting June 23-24 2003 21
Steps1. Design O/D matrices based on scenarios2. Run for traffic assignments (VISUM) 3. Input transport demands in Energy model
(MARKAL-Lite)4. Input emission rates for technologies (TREM)5. Obtain technology mix and total emissions of
precursors6. Run global O3 model with total emissions
(OFIS)7. Run local pollution models with transport
technology mix (VADIS)8. Compute indicators 9. City comparisons and benchmarking (See ESS
site : Benchmarking)10. Policy analysis
Gdansk Meeting June 23-24 2003 22
Publications• Caratti P., Haurie A., Pinelli D., Zachary D.S. Exploring the
fuel cell car future: an integrated energy model at the city level. The Ninth International Conference on Urban Transport and the Environment 2003, Crete, Greece.
• Borrego C., Miranda A.I., Valente J., Lopes M., Couto J.M. , Haurie A. & Drouet L. Studying the impact of urban sustainable transportation on Lisbon air quality. To appear in proceedings of AIR POLLUTION 2003, Eleventh International Conference on Modelling, Monitoring and Management of Air Pollution 17 -19 September 2003 Catania, Italy
Gdansk Meeting June 23-24 2003 23
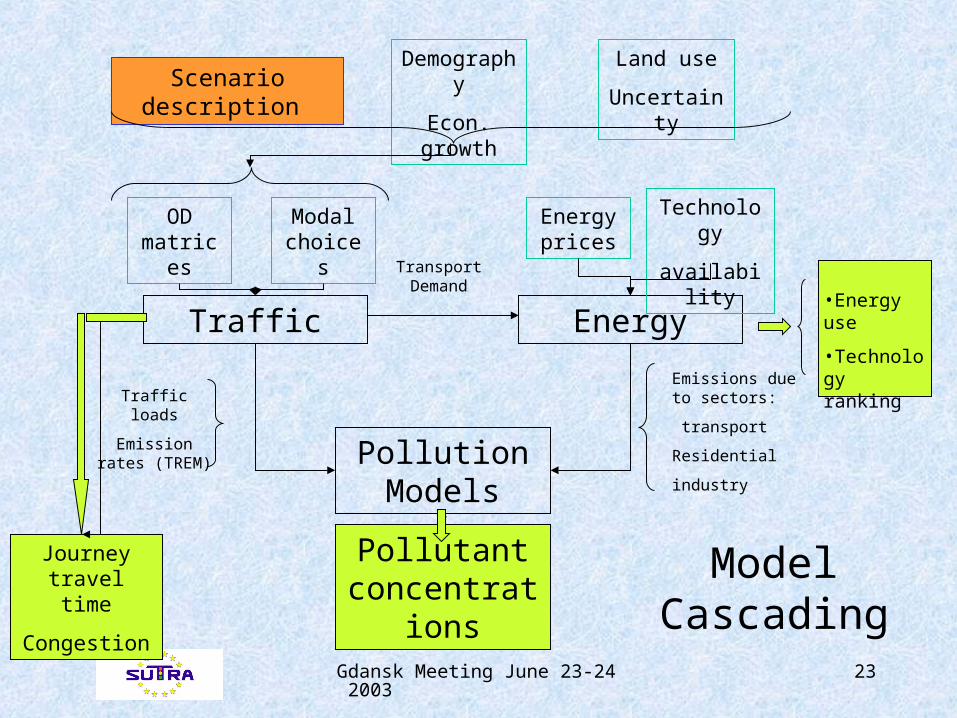
Model Cascading
Traffic loads
Emission rates (TREM) Pollution
Models
Emissions due to sectors:
transport
Residential
industry
•Energy use
•Technology ranking
Energy
Energy prices
Technology
availability
Pollutant concentrations
Journey travel time
Congestion
Transport Demand
Modal choices
Traffic
OD matrices
Land use
Uncertainty
Demography
Econ. growthScenario description

Gdansk Meeting June 23-24 2003 24
Gdansk Meeting June 23-24 2003 25
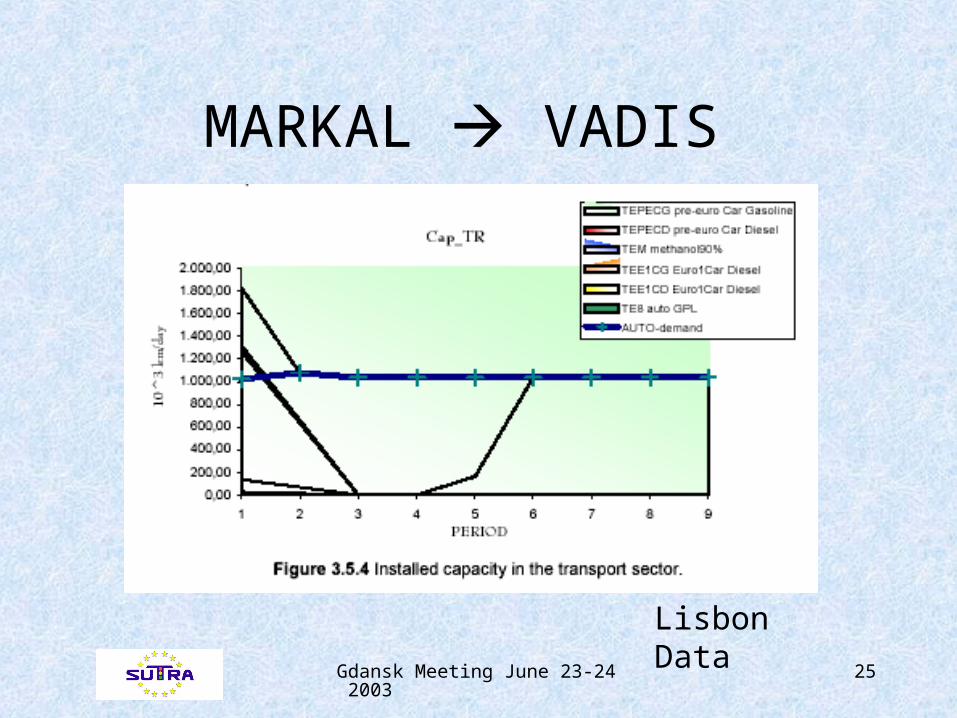
MARKAL VADIS
Lisbon Data
Gdansk Meeting June 23-24 2003 26
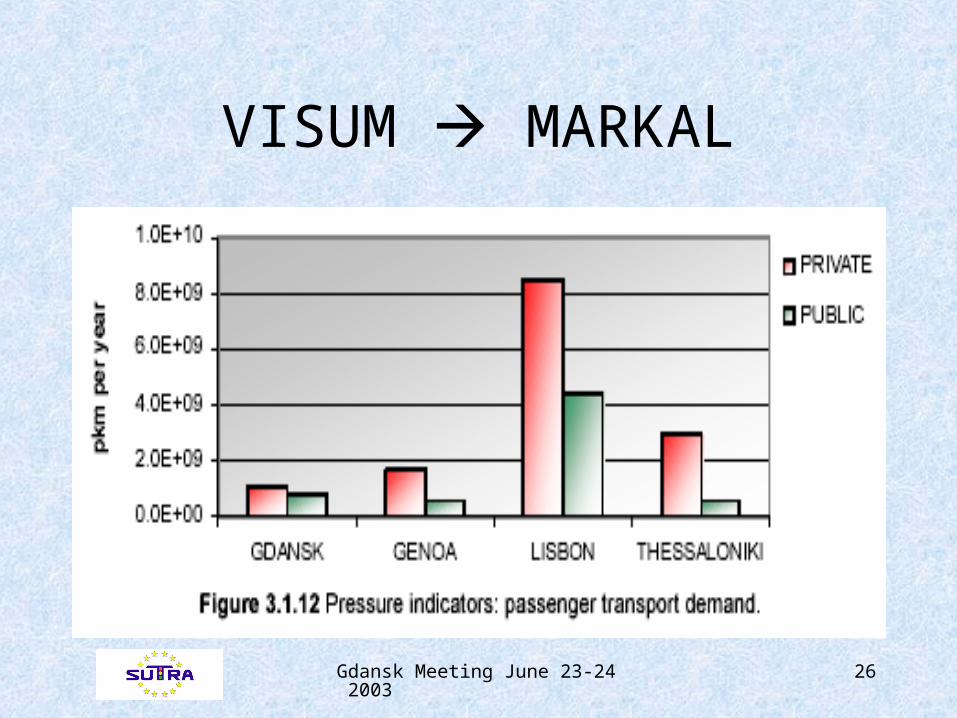
VISUM MARKAL
Gdansk Meeting June 23-24 2003 27
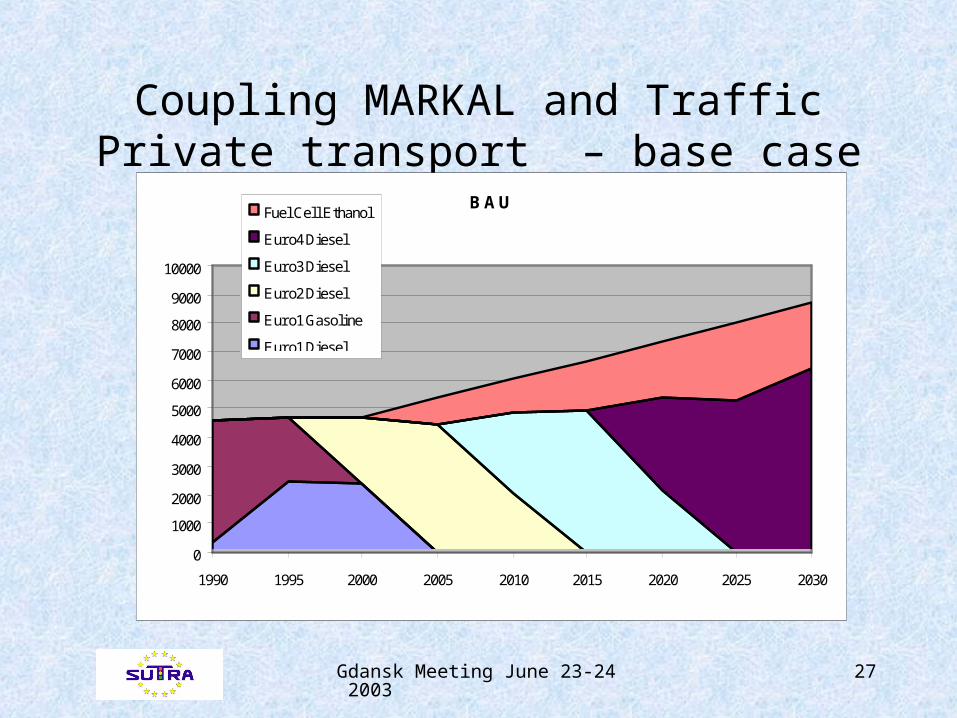
Coupling MARKAL and TrafficPrivate transport – base case
BAU
0
1000
2000
3000
4000
5000
6000
7000
8000
9000
10000
1990 1995 2000 2005 2010 2015 2020 2025 2030
Fuel Cell Ethanol
Euro4 Diesel
Euro3 Diesel
Euro2 Diesel
Euro1 Gasoline
Euro1 Diesel
Gdansk Meeting June 23-24 2003 28
Gdansk Meeting June 23-24 2003 29
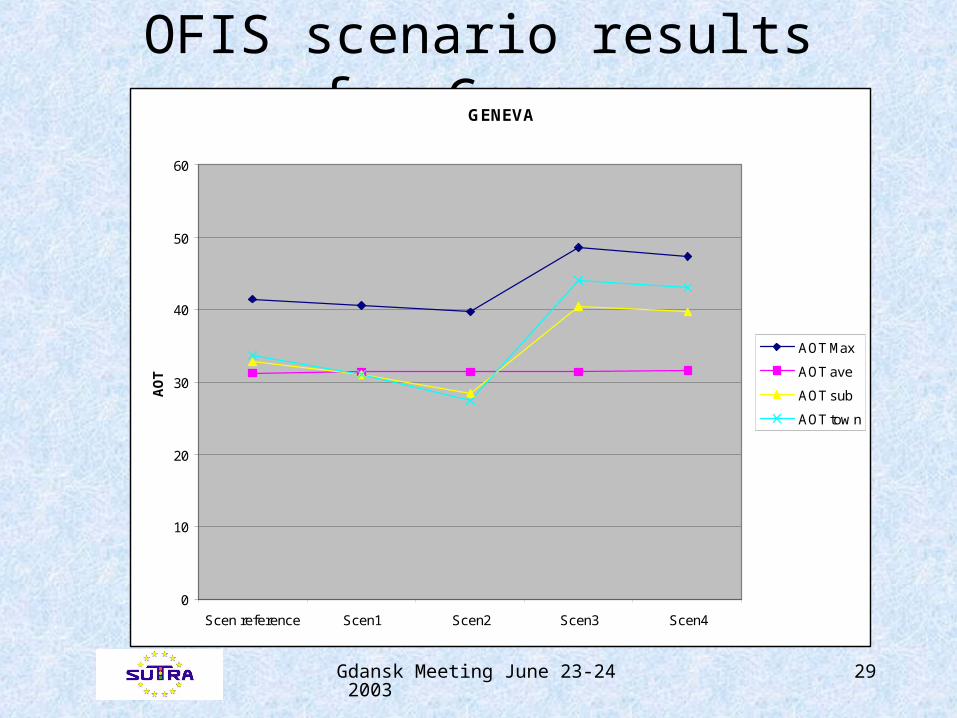
OFIS scenario results for GenevaGENEVA
0
10
20
30
40
50
60
Scen reference Scen1 Scen2 Scen3 Scen4
AO
T
AOT Max
AOT ave
AOT sub
AOT tow n
Gdansk Meeting June 23-24 2003 30
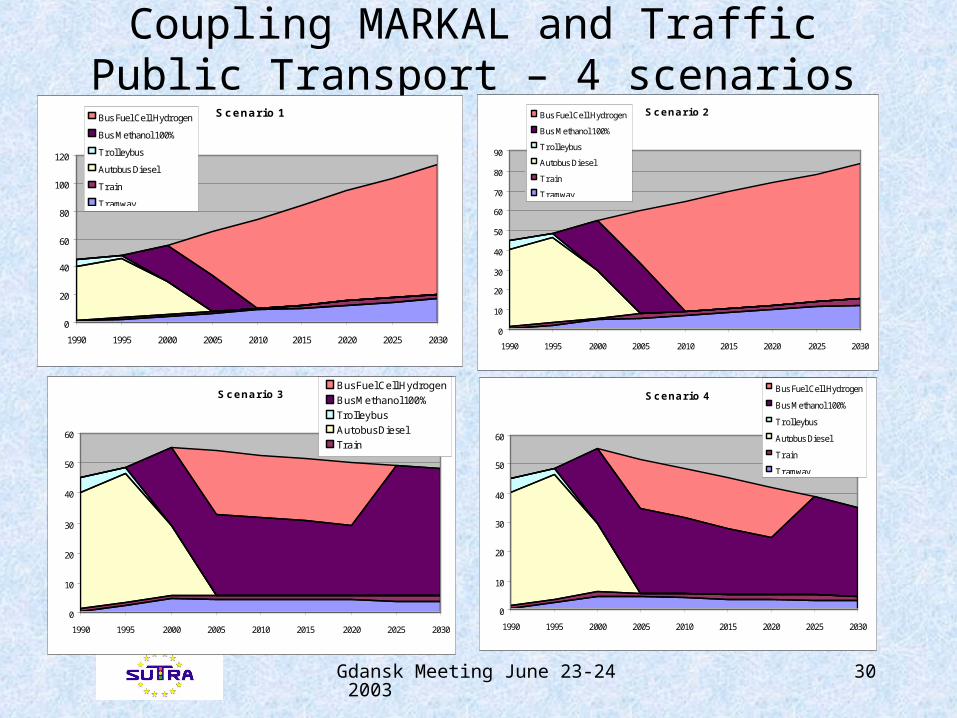
Coupling MARKAL and Traffic Public Transport – 4 scenarios
•
Scenario 1
0
20
40
60
80
100
120
1990 1995 2000 2005 2010 2015 2020 2025 2030
Bus Fuel Cell Hydrogen
Bus Methanol 100%
Trolleybus
Autobus Diesel
Train
Tramway
Scenario 2
0
10
20
30
40
50
60
70
80
90
1990 1995 2000 2005 2010 2015 2020 2025 2030
Bus Fuel Cell Hydrogen
Bus Methanol 100%
Trolleybus
Autobus Diesel
Train
Tramway
Scenario 3
0
10
20
30
40
50
60
1990 1995 2000 2005 2010 2015 2020 2025 2030
Bus Fuel Cell HydrogenBus Methanol 100%TrolleybusAutobus DieselTrainTramway
Scenario 4
0
10
20
30
40
50
60
1990 1995 2000 2005 2010 2015 2020 2025 2030
Bus Fuel Cell Hydrogen
Bus Methanol 100%
Trolleybus
Autobus Diesel
Train
Tramway
Gdansk Meeting June 23-24 2003 31
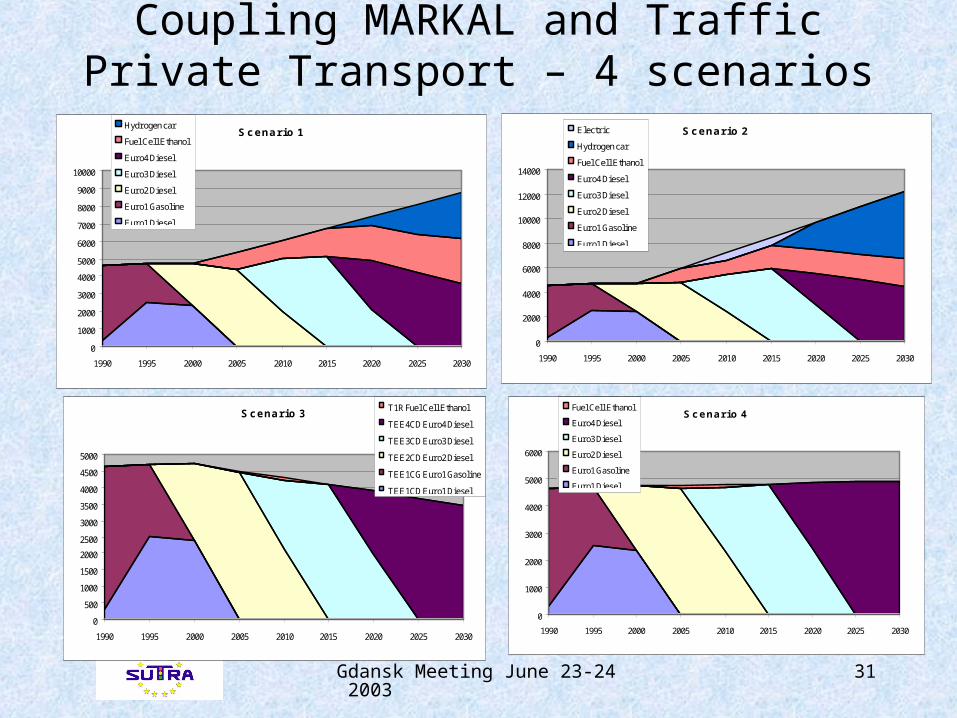
Coupling MARKAL and TrafficPrivate Transport – 4 scenarios
Scenario 1
0
1000
2000
3000
4000
5000
6000
7000
8000
9000
10000
1990 1995 2000 2005 2010 2015 2020 2025 2030
Hydrogen car
Fuel Cell Ethanol
Euro4 Diesel
Euro3 Diesel
Euro2 Diesel
Euro1 Gasoline
Euro1 Diesel
Scenario 2
0
2000
4000
6000
8000
10000
12000
14000
1990 1995 2000 2005 2010 2015 2020 2025 2030
Electric
Hydrogen car
Fuel Cell Ethanol
Euro4 Diesel
Euro3 Diesel
Euro2 Diesel
Euro1 Gasoline
Euro1 Diesel
Scenario 3
0
500
1000
1500
2000
2500
3000
3500
4000
4500
5000
1990 1995 2000 2005 2010 2015 2020 2025 2030
T1R Fuel Cell Ethanol
TEE4CD Euro4 Diesel
TEE3CD Euro3 Diesel
TEE2CD Euro2 Diesel
TEE1CG Euro1 Gasoline
TEE1CD Euro1 Diesel
Scenario 4
0
1000
2000
3000
4000
5000
6000
1990 1995 2000 2005 2010 2015 2020 2025 2030
Fuel Cell Ethanol
Euro4 Diesel
Euro3 Diesel
Euro2 Diesel
Euro1 Gasoline
Euro1 Diesel
Gdansk Meeting June 23-24 2003 32
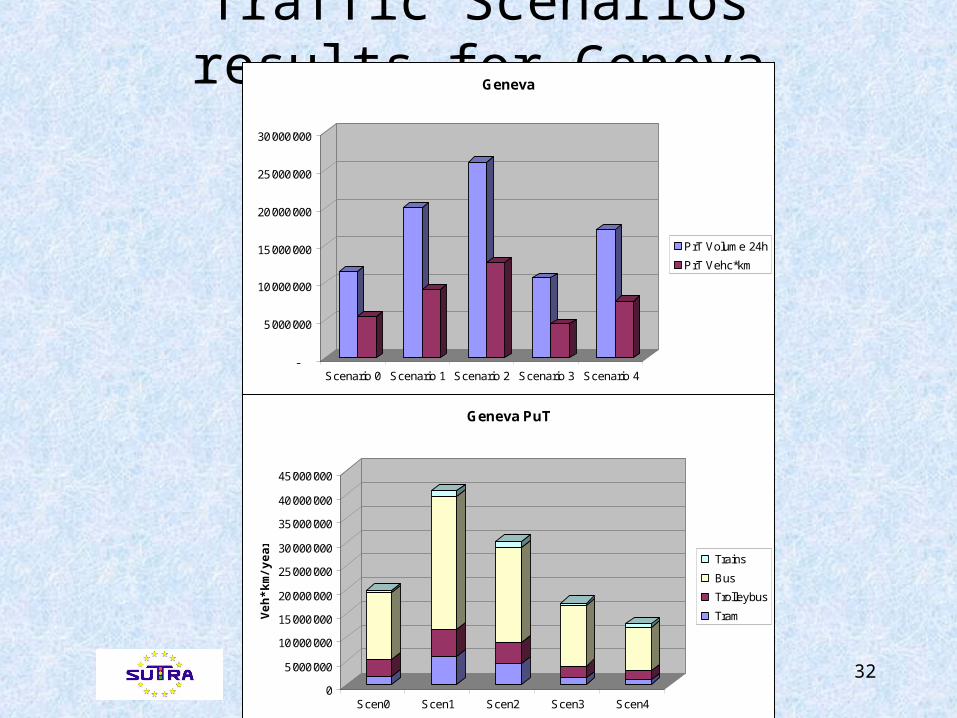
Traffic Scenarios results for Geneva
-
5'000'000
10'000'000
15'000'000
20'000'000
25'000'000
30'000'000
Scenario 0 Scenario 1 Scenario 2 Scenario 3 Scenario 4
Geneva
PrT Volume 24h
PrT Vehc*km
0
5'000'000
10'000'000
15'000'000
20'000'000
25'000'000
30'000'000
35'000'000
40'000'000
45'000'000
Veh
*km
/yea
r
Scen0 Scen1 Scen2 Scen3 Scen4
Geneva PuT
Trains
Bus
Trolleybus
Tram
Gdansk Meeting June 23-24 2003 33
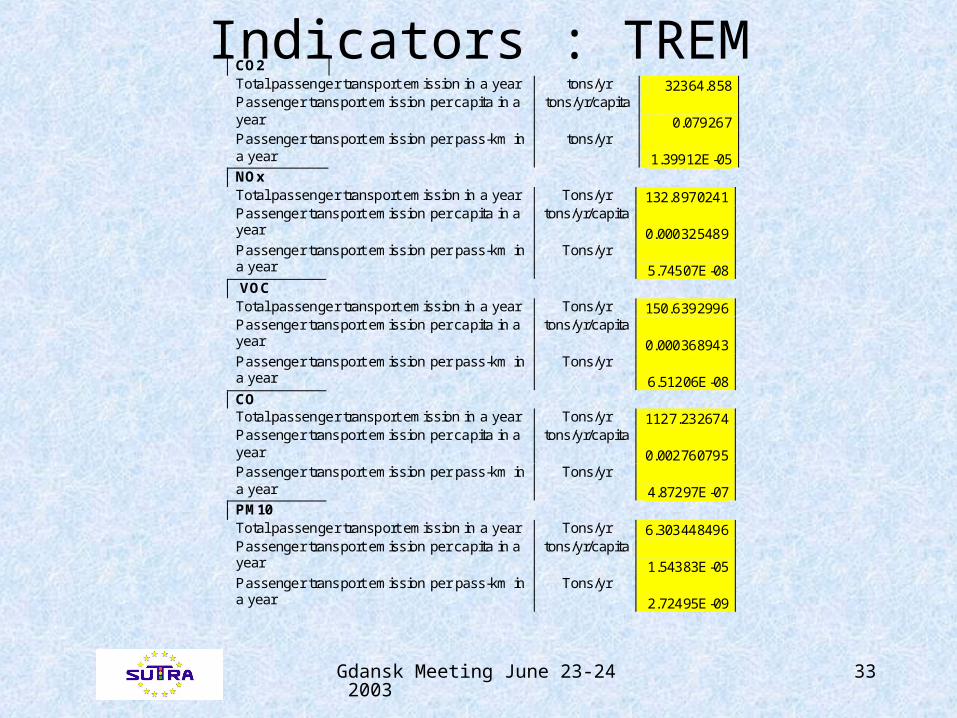
Indicators : TREMCO2 Total passenger transport emission in a year tons/yr 32364.858 Passenger transport emission per capita in a year
tons/yr/capita
0.079267 Passenger transport emission per pass-km in a year
tons/yr
1.39912E-05 NOx Total passenger transport emission in a year Tons/yr 132.8970241 Passenger transport emission per capita in a year
tons/yr/capita
0.000325489 Passenger transport emission per pass-km in a year
Tons/yr
5.74507E-08 VOC Total passenger transport emission in a year Tons/yr 150.6392996 Passenger transport emission per capita in a year
tons/yr/capita
0.000368943 Passenger transport emission per pass-km in a year
Tons/yr
6.51206E-08 CO Total passenger transport emission in a year Tons/yr 1127.232674 Passenger transport emission per capita in a year
tons/yr/capita
0.002760795 Passenger transport emission per pass-km in a year
Tons/yr
4.87297E-07 PM10 Total passenger transport emission in a year Tons/yr 6.303448496 Passenger transport emission per capita in a year
tons/yr/capita
1.54383E-05 Passenger transport emission per pass-km in a year
Tons/yr
2.72495E-09
Gdansk Meeting June 23-24 2003 34
Indicator : VADIS
• State indicators:
• NOx peak concentration (mg/m3): 138,8
• CO peak concentration (mg/m3): 1582,4
Gdansk Meeting June 23-24 2003 35
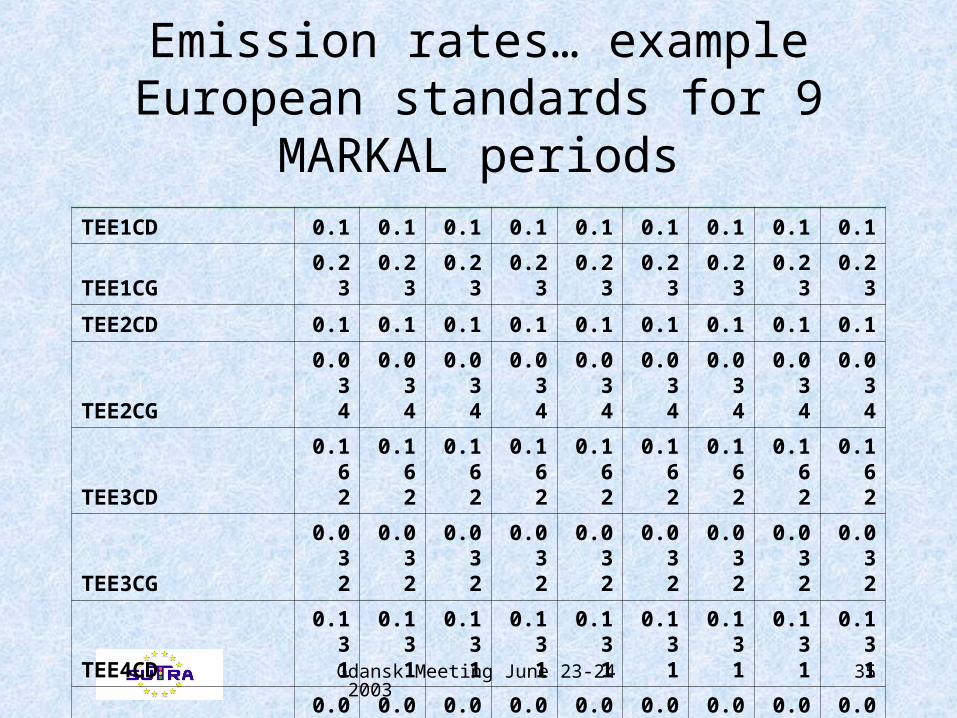
Emission rates… exampleEuropean standards for 9 MARKAL
periodsTEE1CD 0.1 0.1 0.1 0.1 0.1 0.1 0.1 0.1 0.1
TEE1CG 0.23 0.23 0.23 0.23 0.23 0.23 0.23 0.23 0.23
TEE2CD 0.1 0.1 0.1 0.1 0.1 0.1 0.1 0.1 0.1
TEE2CG0.03
40.03
40.03
40.03
40.03
40.03
40.03
40.03
40.03
4
TEE3CD0.16
20.16
20.16
20.16
20.16
20.16
20.16
20.16
20.16
2
TEE3CG0.03
20.03
20.03
20.03
20.03
20.03
20.03
20.03
20.03
2
TEE4CD0.13
10.13
10.13
10.13
10.13
10.13
10.13
10.13
10.13
1
TEE4CG0.03
70.03
70.03
70.03
70.03
70.03
70.03
70.03
70.03
7
Gdansk Meeting June 23-24 2003 36
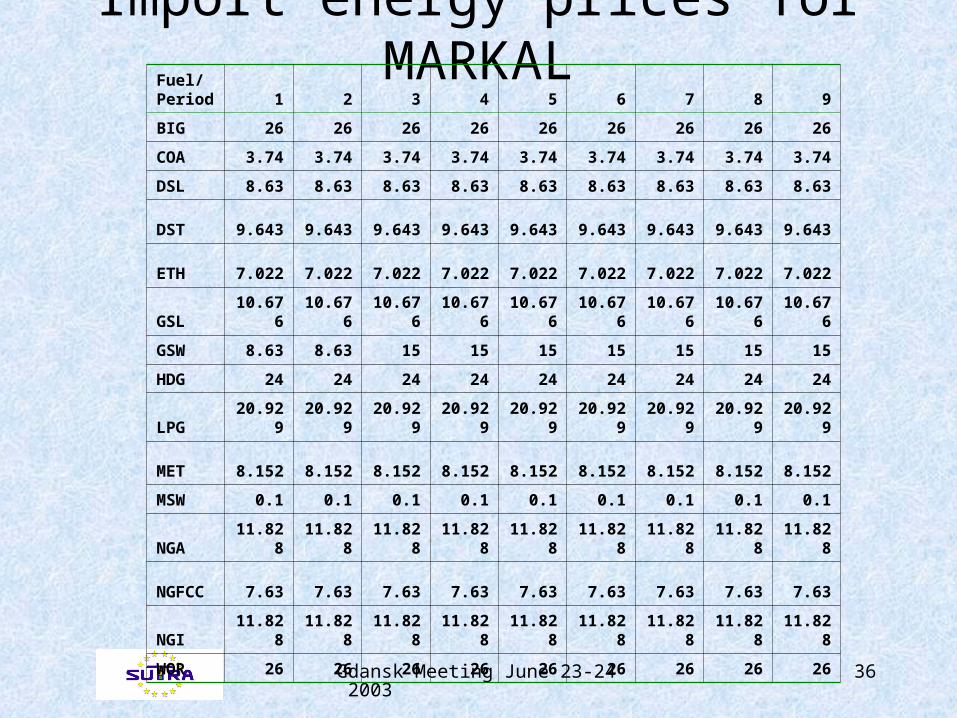
Import energy prices for MARKALFuel/
Period 1 2 3 4 5 6 7 8 9
BIG 26 26 26 26 26 26 26 26 26
COA 3.74 3.74 3.74 3.74 3.74 3.74 3.74 3.74 3.74
DSL 8.63 8.63 8.63 8.63 8.63 8.63 8.63 8.63 8.63
DST 9.643 9.643 9.643 9.643 9.643 9.643 9.643 9.643 9.643
ETH 7.022 7.022 7.022 7.022 7.022 7.022 7.022 7.022 7.022
GSL 10.676 10.676 10.676 10.676 10.676 10.676 10.676 10.676 10.676
GSW 8.63 8.63 15 15 15 15 15 15 15
HDG 24 24 24 24 24 24 24 24 24
LPG 20.929 20.929 20.929 20.929 20.929 20.929 20.929 20.929 20.929
MET 8.152 8.152 8.152 8.152 8.152 8.152 8.152 8.152 8.152
MSW 0.1 0.1 0.1 0.1 0.1 0.1 0.1 0.1 0.1
NGA 11.828 11.828 11.828 11.828 11.828 11.828 11.828 11.828 11.828
NGFCC 7.63 7.63 7.63 7.63 7.63 7.63 7.63 7.63 7.63
NGI 11.828 11.828 11.828 11.828 11.828 11.828 11.828 11.828 11.828
WOR 26 26 26 26 26 26 26 26 26
Gdansk Meeting June 23-24 2003 37
Gdansk Meeting June 23-24 2003 38
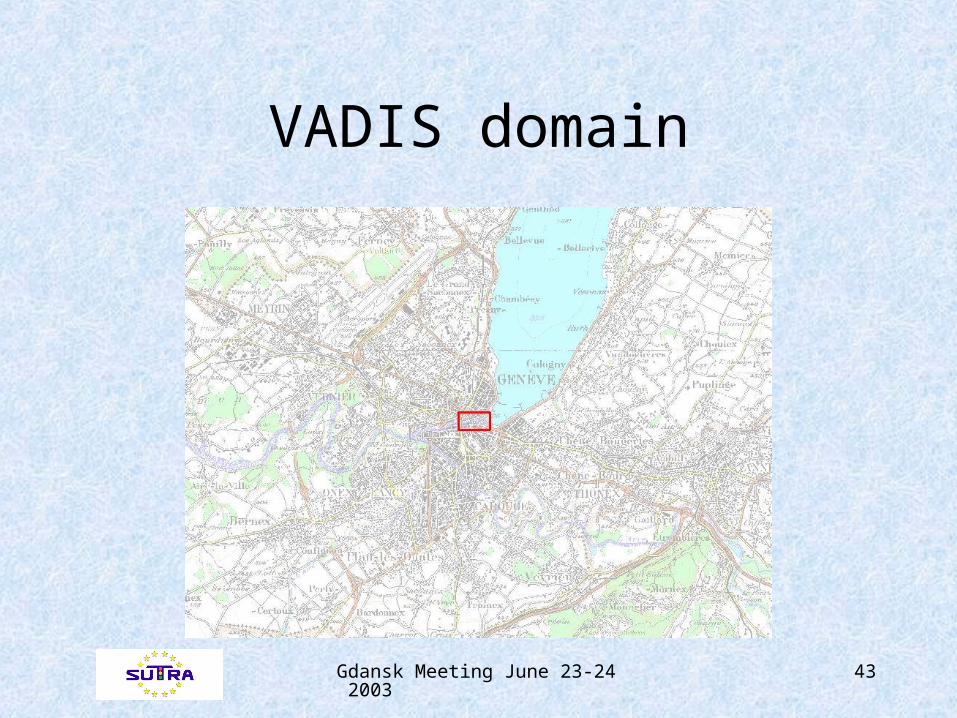
Building situation in VADIS domain
Gdansk Meeting June 23-24 2003 39
Distribution of vehicles by Categories
Gdansk Meeting June 23-24 2003 40
Coupling TREM with the traffic model
Gdansk Meeting June 23-24 2003 41
Coupling Pollution models with Traffic and Energy model
Gdansk Meeting June 23-24 2003 42
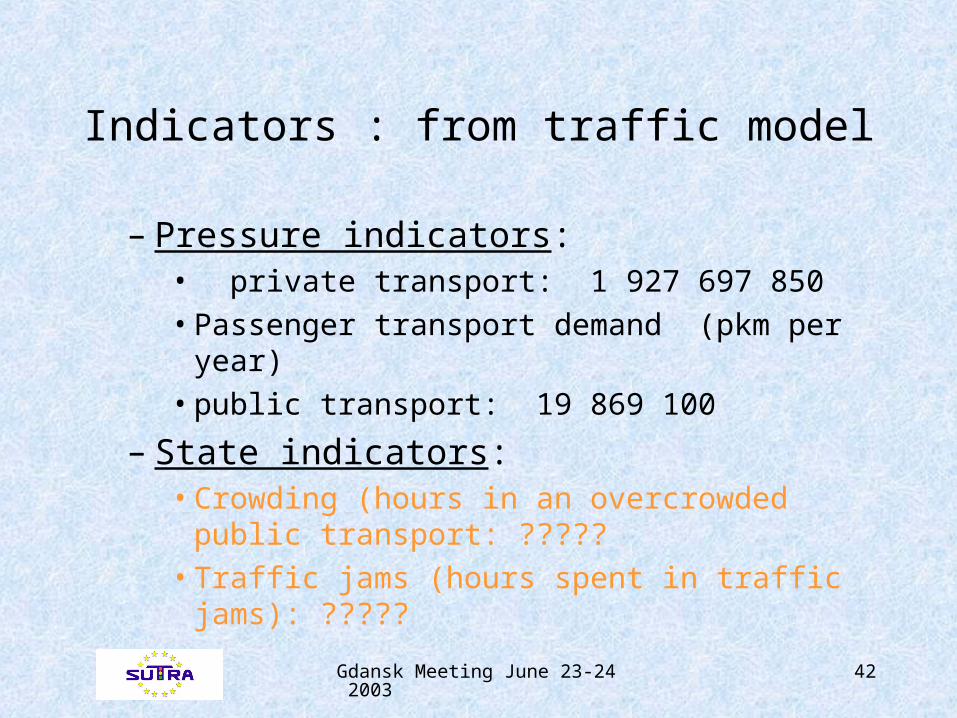
Indicators : from traffic model
– Pressure indicators:• private transport: 1 927 697 850• Passenger transport demand (pkm per
year)• public transport: 19 869 100
– State indicators:• Crowding (hours in an overcrowded public
transport: ?????• Traffic jams (hours spent in traffic
jams): ?????
Gdansk Meeting June 23-24 2003 43
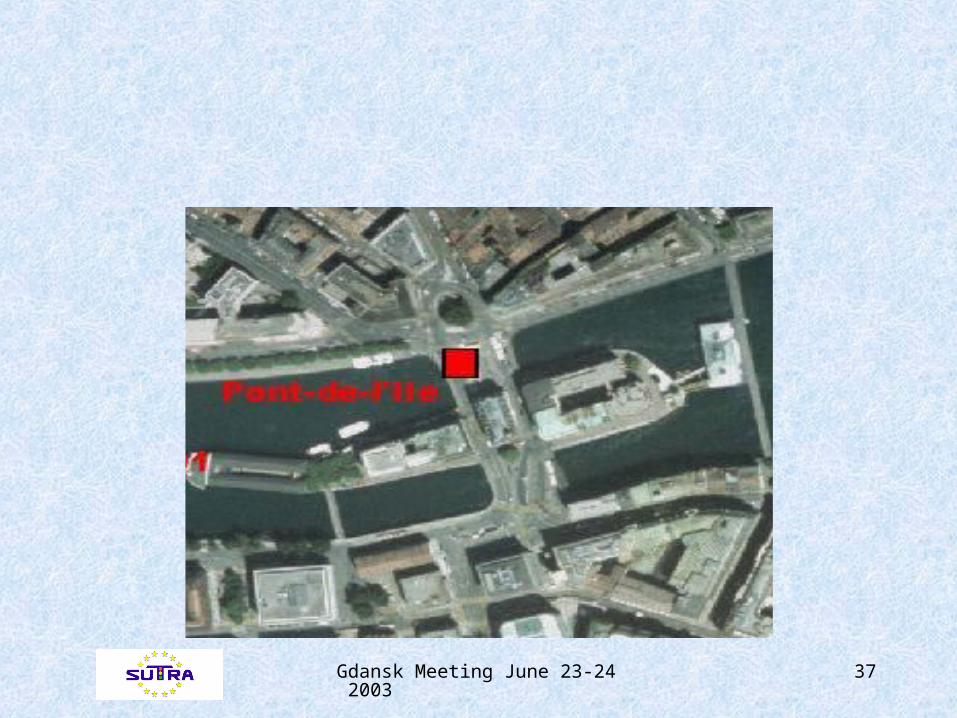
VADIS domain
Gdansk Meeting June 23-24 2003 44
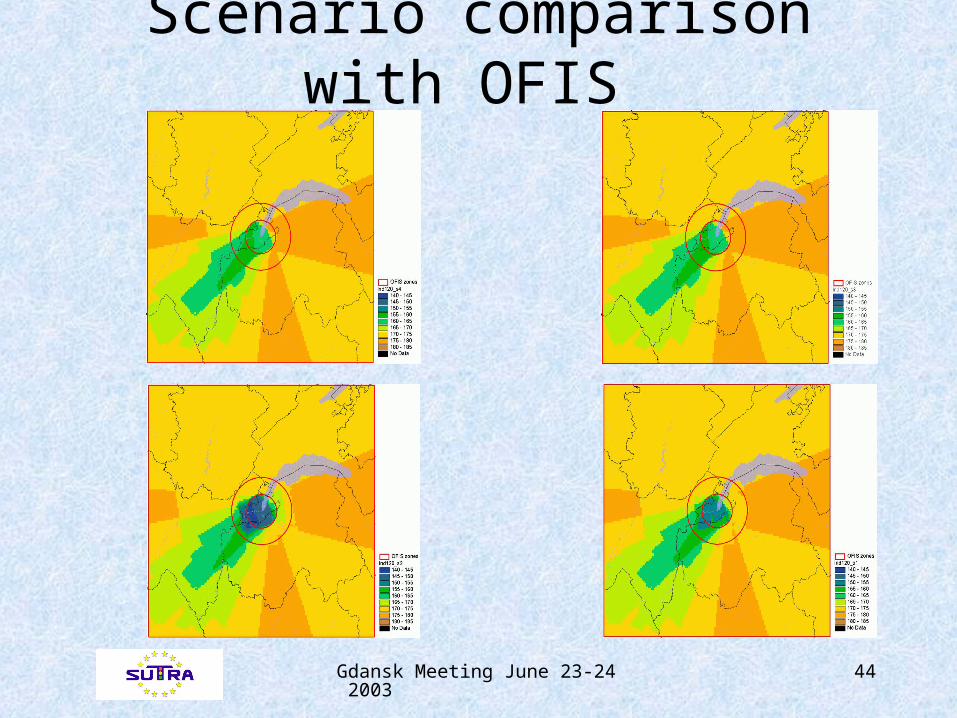
Scenario comparison with OFIS
Gdansk Meeting June 23-24 2003 45
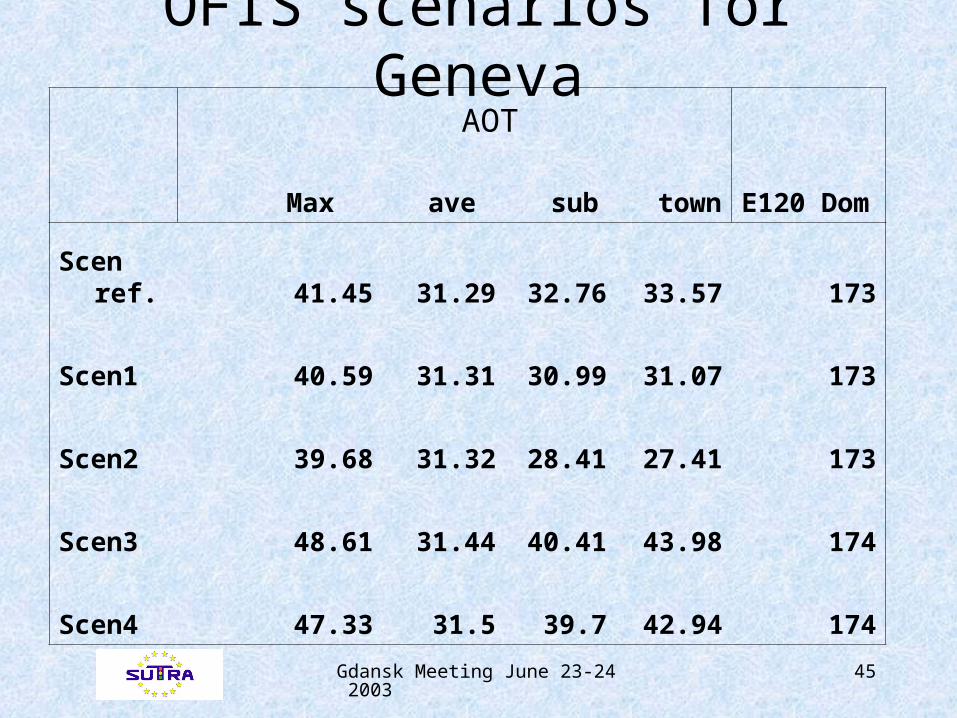
OFIS scenarios for Geneva
Max ave sub town E120 Dom
Scen ref. 41.45 31.29 32.76 33.57 173
Scen1 40.59 31.31 30.99 31.07 173
Scen2 39.68 31.32 28.41 27.41 173
Scen3 48.61 31.44 40.41 43.98 174
Scen4 47.33 31.5 39.7 42.94 174
AOT
Gdansk Meeting June 23-24 2003 46
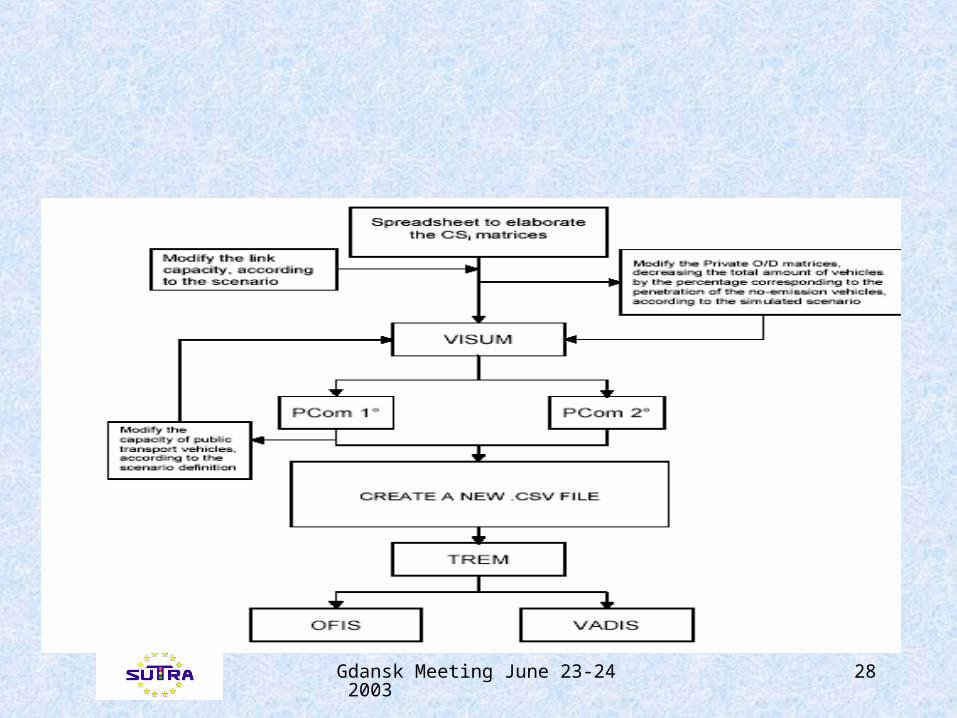
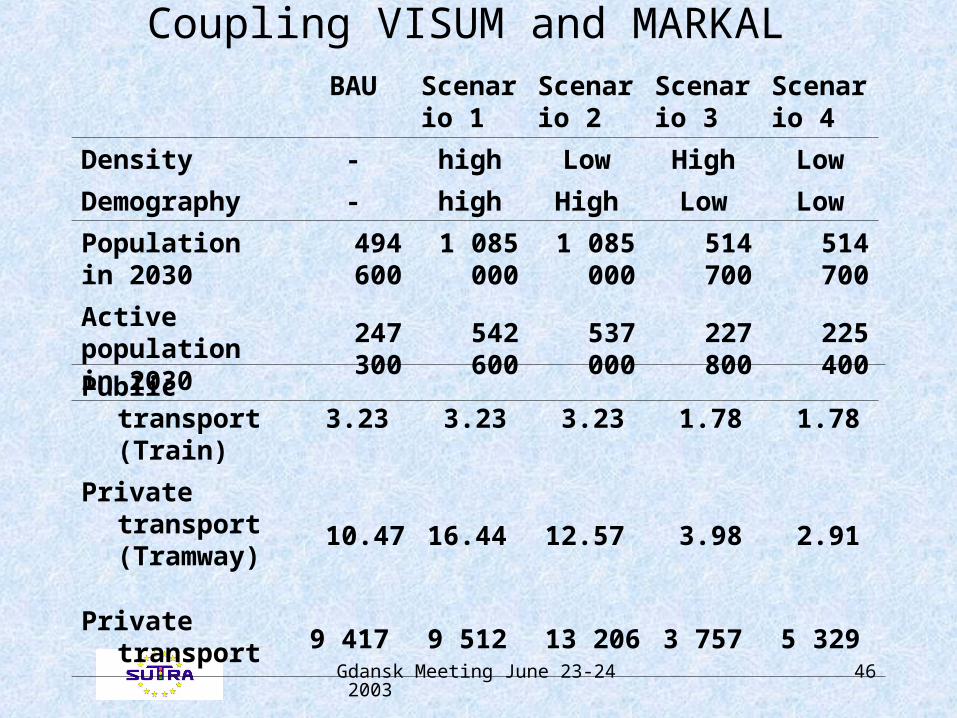
Coupling VISUM and MARKAL
Public transport (Train) 3.23 3.23 3.23 1.78 1.78
Private transport (Tramway) 10.47 16.44 12.57 3.98 2.91
Private transport9 417 9 512 13 206 3 757 5 329
BAU Scenario 1
Scenario 2
Scenario 3
Scenario 4
Density - high Low High Low
Demography - high High Low Low
Population in 2030 494 600 1 085 000
1 085 000
514 700 514 700
Active population in 2030
247 300 542 600 537 000 227 800 225 400