Embed Size (px)
Citation preview

Instructions! Use black ink or black ball-point pen. Draw diagrams in pencil.! Answer all questions.! You must answer the questions in the spaces provided.! If your calculator does not have a π button, take the value of π to be 3.14 unless another
value is given in the question.
Information! The marks for questions are shown in brackets.! The quality of your written communication is specifically assessed in questions that are
indicated with an asterisk (*).
Advice! Read each question carefully before you start to answer it.! In all calculations, show clearly how you work out your answer.! Use the number of marks for the question as a guide to the amount of time you need to
spend.! Look at previous parts of the question, e.g. a), b), c) i) as there may be information there
you need to answer later parts.! Check your answer is realistic and appropriate.! For calculator decimal numbers always write your full calculator display in the working
out area and then, if you need to, round the answer on the answer line.
GCSE MATHEMATICS
Speed/Time Graphs
These questions have been taken or modified fromprevious AQA GCSE Mathematics Papers.
This booklet was curated and modified using AQA examination papers between 2010-2016, for thecalculatorguide.com , where you can find many more booklets on further topics. All questions used are reproduced for educational purposes only.
www.thecalculatorguide.com

1 A plane accelerates along a runway for 30 seconds. The graph shows the speed-time graph for the plane.
1 (a) The plane takes off after 30 seconds.
What is the speed of the plane when it takes off?
Answer ................................................................ m/s (1 mark)
Speed (m/s)
00 105 2015 3025
Time (seconds)
30
15
60
45
90
75
1 (b) Work out the distance the plane travels on the runway.
Give your answer in kilometres.
............................................................................................................................................
............................................................................................................................................
Answer ................................................................. km (3 marks)
1 (c) Work out the acceleration of the plane.
State the units of your answer.
............................................................................................................................................
............................................................................................................................................
Answer ....................................................................... (3 marks)

2 Meera runs for 12 seconds.Her speed, in metres per second, is shown on the graph.
2 (a) For how many seconds does she run at a constant speed?
Answer ........................................................ seconds (1 mark)
2 (b) Work out the total distance she runs.
............................................................................................................................................
............................................................................................................................................
............................................................................................................................................
Answer .......................................................... metres (3 marks)
Speed(m/s)
00 2 4 6
Time (seconds)
81 3 5 7 9 10 11 12
2
4
1
3
5
2 (c) Work out the gradient of the graph during the first 5 seconds.
Answer .............................................................. m/s2 (1 mark)
2 (d) What does the gradient in part (c) represent?
Circle your answer.
time speed distance acceleration
(1 mark)

3 (a) The diagram shows the speed-time graph of a car for 60 seconds.
Which two points on the graph show when the car has an acceleration of zero?
Circle your answers below.[1 mark]
A B C D E
00 10 20 30 40 50 60
10
20
30
Speed(m/s)
Time (s)
A
B
C
DAE

3 (b) This diagram shows the speed-time graph of a lorry for 30 seconds.
After 30 seconds the speed of the lorry is V m/s
The lorry travels a distance of 270 metres in these 30 seconds.
Work out V.[2 marks]
............................................................................................................................................
............................................................................................................................................
............................................................................................................................................
Answer ................................................................ m/s
00 30
Time (s)
(30, V )
Speed(m/s)
V

4 The distance around a cycle track is 400 metres.
Robin cycles on the track.Here is his speed-time graph.
4 (a) Show that Robin cycles exactly once around the track in 110 seconds.[2 marks]
............................................................................................................................................
............................................................................................................................................
............................................................................................................................................
............................................................................................................................................
............................................................................................................................................
............................................................................................................................................
00 20 40 60 80 100 110 12010 30 50 70 90
2
4
6
1
3
5
Speed(metres persecond)
Time (seconds)

4 (b) Sanjay cycles on the same track.
Here is his speed-time graph.
Does Sanjay cycle the first 400 metres in a quicker time than Robin?You must show your working.
[3 marks]
............................................................................................................................................
............................................................................................................................................
............................................................................................................................................
............................................................................................................................................
............................................................................................................................................
............................................................................................................................................
............................................................................................................................................
............................................................................................................................................
............................................................................................................................................
00 20 40 60 80 100 110 12010 30 50 70 90
2
4
6
1
3
5
Speed(metres persecond)
Time (seconds)

5 Chloe is training for a marathon.These speed-time graphs model her training runs on Monday and Wednesday.
00 10 155 20 25 30 35 40 45 50 55 60
100
200
50
150
250
Speed(metres/min)
Time (min)
Monday
00 10 155 20 25 30 35 40 45 50 55 60
100
200
50
150
250
Speed(metres/min)
Time (min)
Wednesday

On which day did Chloe run further?You must show your working.
[4 marks]
............................................................................................................................................
............................................................................................................................................
............................................................................................................................................
............................................................................................................................................
............................................................................................................................................
............................................................................................................................................
............................................................................................................................................
............................................................................................................................................
............................................................................................................................................
............................................................................................................................................
............................................................................................................................................
............................................................................................................................................
............................................................................................................................................
............................................................................................................................................
............................................................................................................................................
............................................................................................................................................
Answer ......................................................................

6 The graph shows the speed of a snowboarder for 2 minutes.
00 60
Time (seconds)
12030 90
2
4
6
8
9
10
Speed(m/s)
1
3
5
7

6 (a) Estimate the distance travelled by the snowboarder.State the units of your answer.
............................................................................................................................................
............................................................................................................................................
............................................................................................................................................
............................................................................................................................................
............................................................................................................................................
............................................................................................................................................
............................................................................................................................................
............................................................................................................................................
............................................................................................................................................
Answer ..................................................................... (4 marks)
6 (b) Work out the gradient of the graph at 70 seconds.
............................................................................................................................................
............................................................................................................................................
............................................................................................................................................
Answer ............................................................. m/s2 (3 marks)
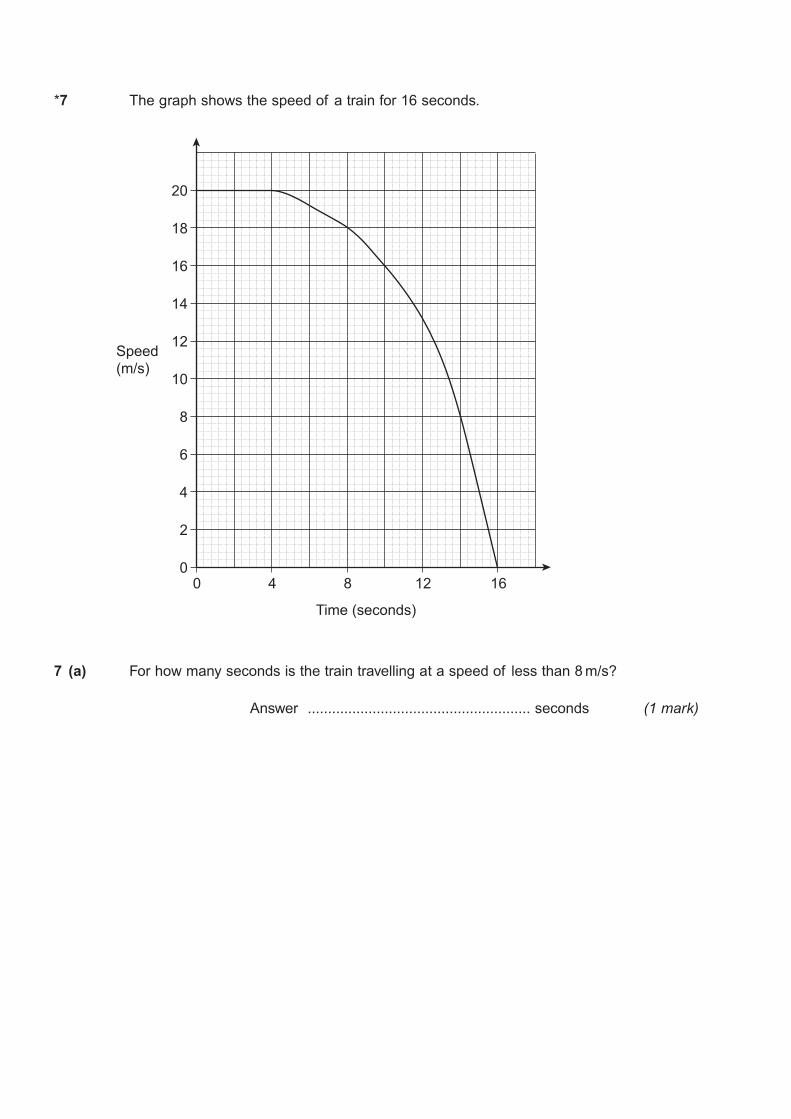
*7 The graph shows the speed of a train for 16 seconds.
7 (a) For how many seconds is the train travelling at a speed of less than 8 m/s?
Answer ....................................................... seconds (1 mark)
00 4 8 12
Time (seconds)
16
4
8
12
16
18
20
Speed(m/s)
2
6
10
14

7 (b) Work out an estimate of the average speed of the train during the 16 seconds.
............................................................................................................................................
............................................................................................................................................
............................................................................................................................................
............................................................................................................................................
............................................................................................................................................
............................................................................................................................................
............................................................................................................................................
............................................................................................................................................
............................................................................................................................................
Answer ................................................................ m/s (6 marks)
7 (c) (i) Work out an estimate for the gradient of the graph after 8 seconds.
............................................................................................................................................
............................................................................................................................................
............................................................................................................................................
............................................................................................................................................
Answer ....................................................................... (3 marks)
7 (c) (ii) What does this gradient represent?
Answer ....................................................................... (1 mark)

8 Amy and Sue run a race.The race is won in exactly 12 seconds.
The graph shows Amy’s speed in metres per second.
This graph shows Sue’s speed in metres per second.
00 2 4 6
Time (s)8 10 11 121 3 5 7 9
2
4
Speed(m/s)
1
3
5
00 2 4 6
Time (s)8 10 11 121 3 5 7 9
2
4
Speed(m/s)
1
3
5

Who won the race?You must show your working and give reasons for your answer.
............................................................................................................................................
............................................................................................................................................
............................................................................................................................................
............................................................................................................................................
............................................................................................................................................
............................................................................................................................................
............................................................................................................................................
............................................................................................................................................
Answer ...................................................................... (5 marks)

9 Suzy and Joe cycle round a track. One lap of the track measures 400 metres.
They both start from the same place.Joe starts 20 seconds after Suzy starts.
Here are the speed-time graphs for their journeys.
0
2
1
4
6
8
3
5
7
0 40 80 120 16020 60 100 140 180 200 220 240 260 280
Joe
Suzy
Speed(m/s)
Time (s)

*9 (a) Show that Joe overtakes Suzy when they are on their third lap of the track.[4 marks]
______________________________________________________________________________
______________________________________________________________________________
______________________________________________________________________________
______________________________________________________________________________
______________________________________________________________________________
______________________________________________________________________________
______________________________________________________________________________
______________________________________________________________________________
______________________________________________________________________________
______________________________________________________________________________
______________________________________________________________________________
______________________________________________________________________________
______________________________________________________________________________
______________________________________________________________________________
9 (b) Work out Suzy’s acceleration during the first 40 seconds.State the units of your answer.
[2 marks]
______________________________________________________________________________
______________________________________________________________________________
Answer _______________________________________

10 This speed-time graph shows the journey of a bus as it travels between two bus stops.
After how many seconds does the bus pass the halfway point between the bus stops?
............................................................................................................................................
............................................................................................................................................
............................................................................................................................................
............................................................................................................................................
............................................................................................................................................
............................................................................................................................................
............................................................................................................................................
............................................................................................................................................
............................................................................................................................................
............................................................................................................................................
Answer ....................................................... seconds (5 marks)
00 10 20 30
Time (seconds)
40 50 60
10
20
Speed (metresper second)
5
15

11 Ed and Finn both run along the same track.
Ed runs for 12 seconds.
Finn runs for 10 seconds.
The graphs show their runs.
*11 (a)
00 2 31 4
Time (s)
Speed(m/s)
5 6 7 8 9 10 11 12
4
8
2
6
Finn
Ed
Who runs the further distance?You must show your working.
............................................................................................................................................
............................................................................................................................................
............................................................................................................................................
Answer .......................................................... metres
[3 marks]
11 (b) Work out Finn’s acceleration.State the units of your answer.
[3 marks]
______________________________________________________________________________
______________________________________________________________________________
______________________________________________________________________________
Answer _______________________________________
............................................................................................................................................

12 The graph shows the velocity-time graph for the first 90 seconds of a car journey.
00 10 20 30 40 50 60 70 80 90
4
6
2
8
10
Velocity(m/s)
Time (s)
12
14
16
18
22
20
24
26
28
12 (a) Here is a statement about the first 40 seconds of the car journey.
When decelerating, the car travelled over 100 metres further than when accelerating.
Is the statement correct?You must show your working.
[3 marks]
............................................................................................................................................
............................................................................................................................................
............................................................................................................................................
............................................................................................................................................
............................................................................................................................................
............................................................................................................................................
12 (b) Estimate the acceleration of the car at 65 seconds.You must show your working.
[3 marks]
............................................................................................................................................
............................................................................................................................................
............................................................................................................................................
............................................................................................................................................
Answer .............................................................. m/s2