Embed Size (px)
Citation preview
GCSE Geography Fieldwork 2019
Welcome to your Geography fieldwork
Geographers like to conduct geographical fieldwork. This allows geographers to see how well the theory in the
textbook links to the real world.
Fieldwork is the bit geographers enjoy the most! Today we are going to conduct a piece of fieldwork on the
changes in cross profile and long profile of a river (study of the physical environment).
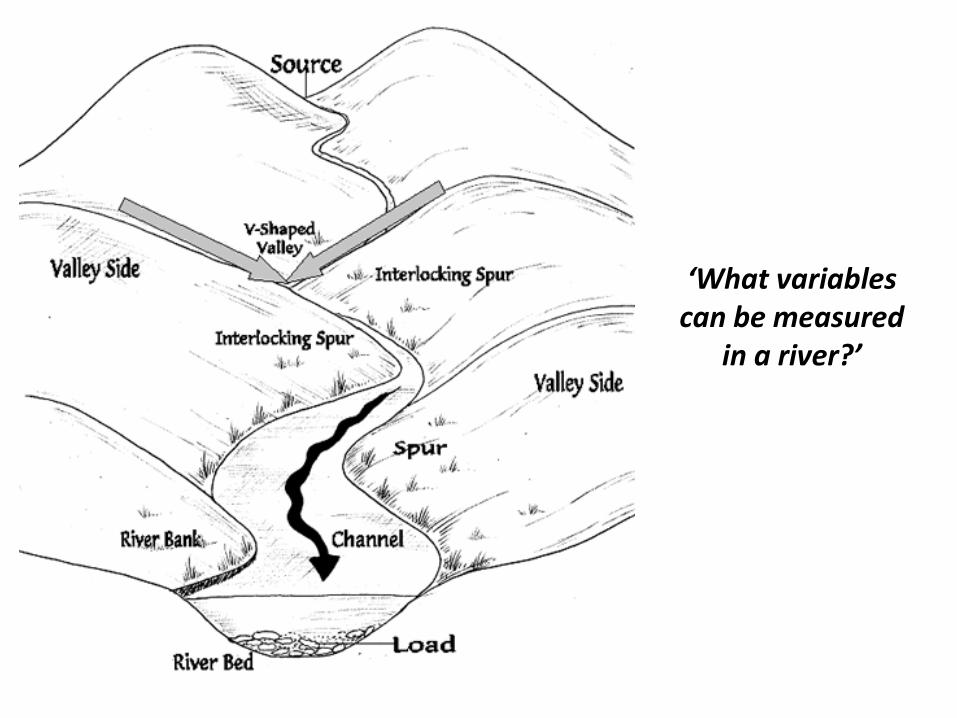
‘What variables can be measured
in a river?’
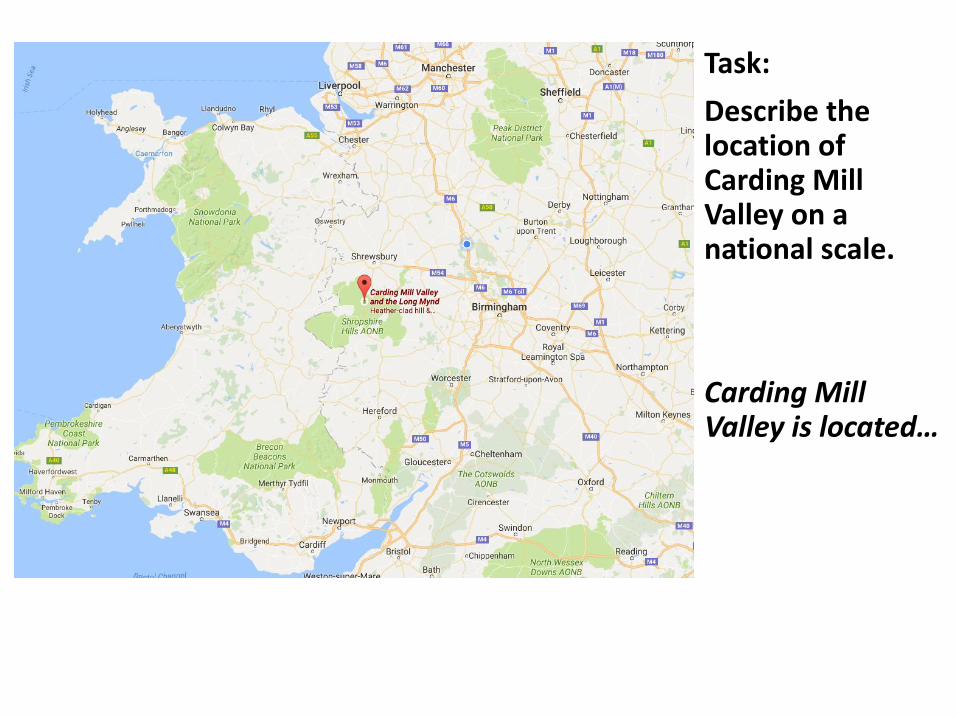
Task:
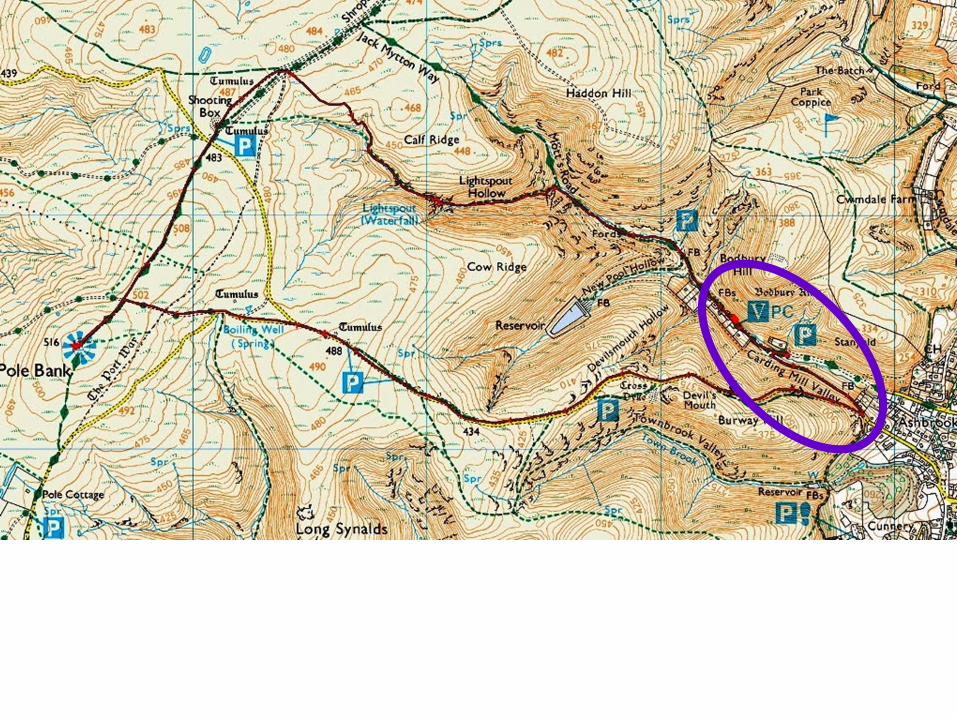
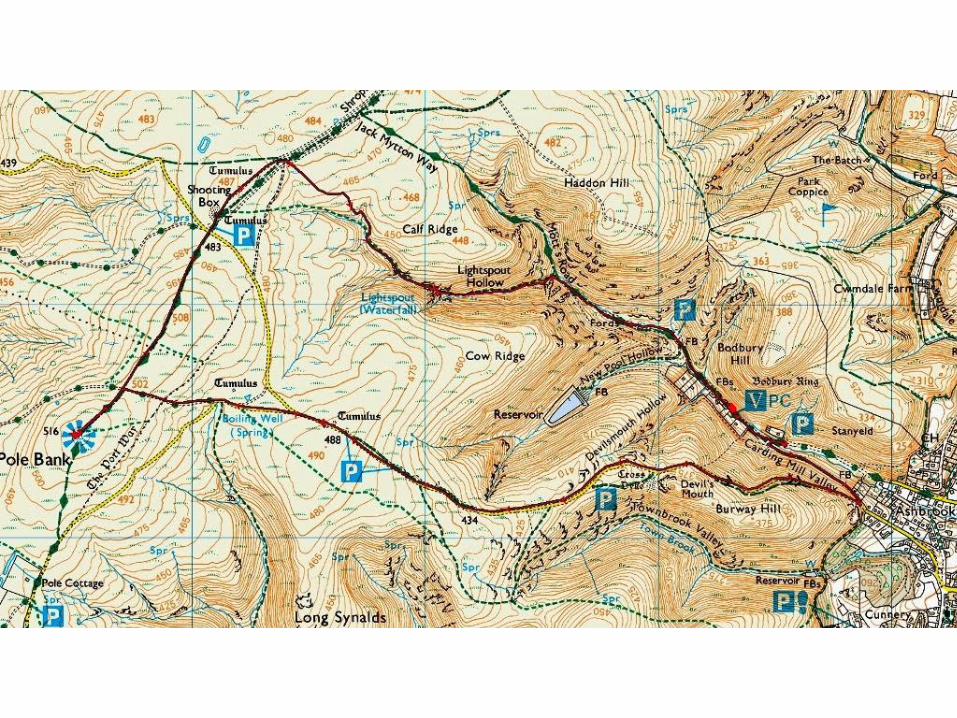
Describe the location of Carding Mill Valley on a national scale.
Carding Mill Valley is located…
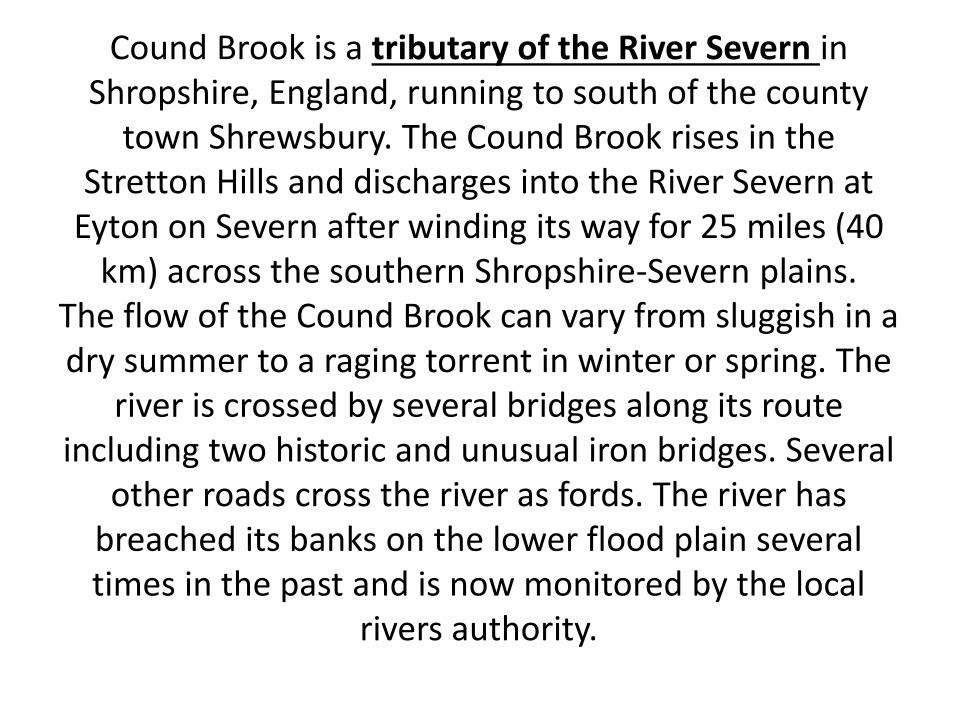
Cound Brook is a tributary of the River Severn in Shropshire, England, running to south of the county
town Shrewsbury. The Cound Brook rises in the Stretton Hills and discharges into the River Severn at
Eyton on Severn after winding its way for 25 miles (40 km) across the southern Shropshire-Severn plains.
The flow of the Cound Brook can vary from sluggish in a dry summer to a raging torrent in winter or spring. The
river is crossed by several bridges along its route including two historic and unusual iron bridges. Several
other roads cross the river as fords. The river has breached its banks on the lower flood plain several times in the past and is now monitored by the local
rivers authority.
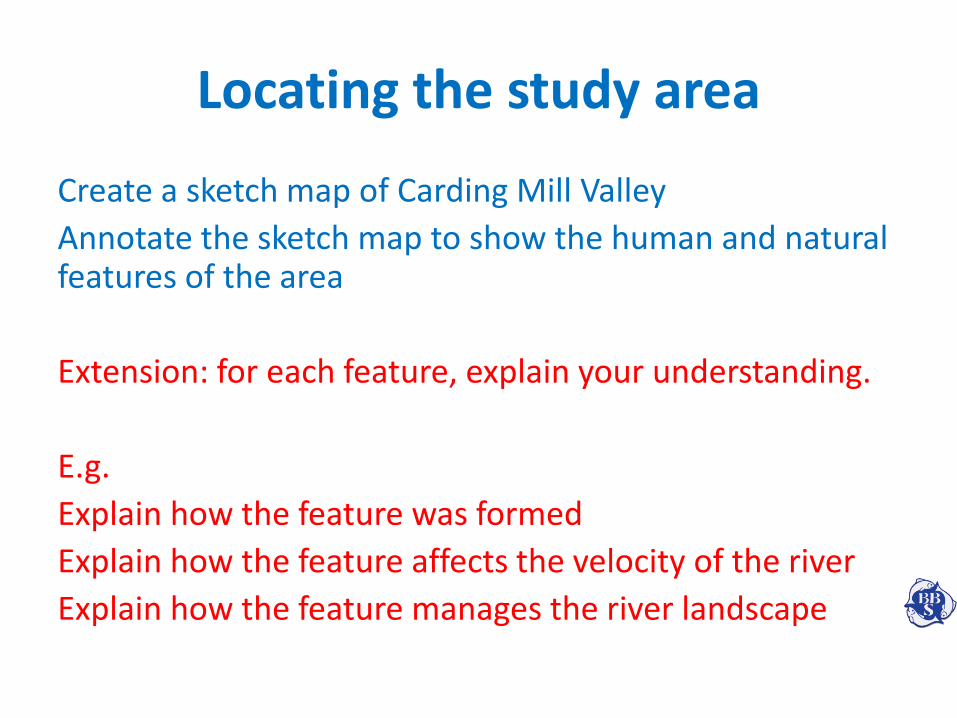
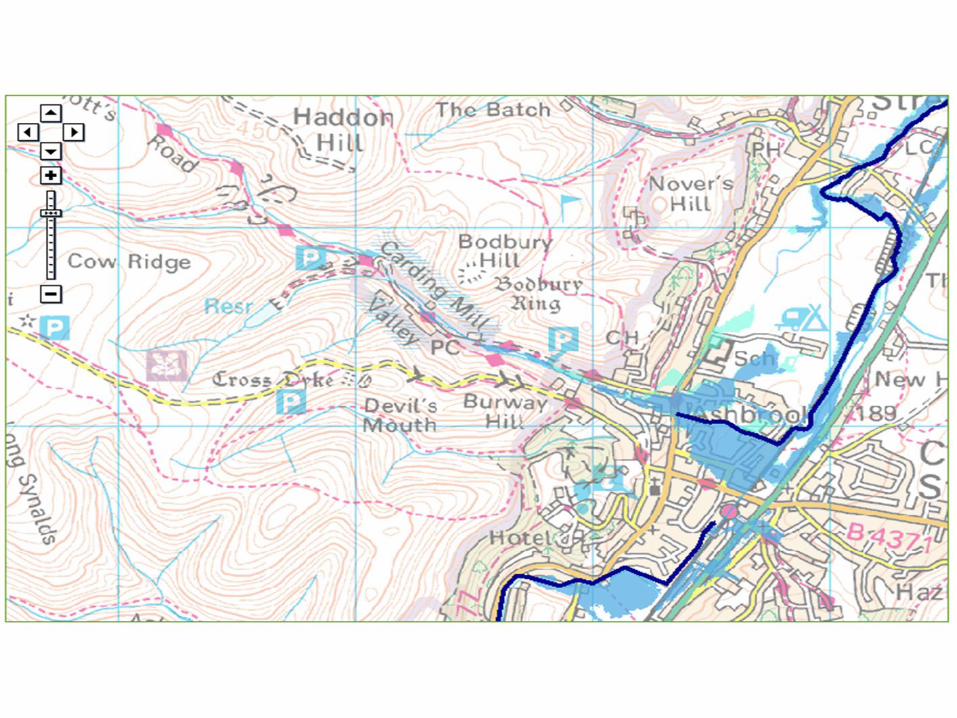
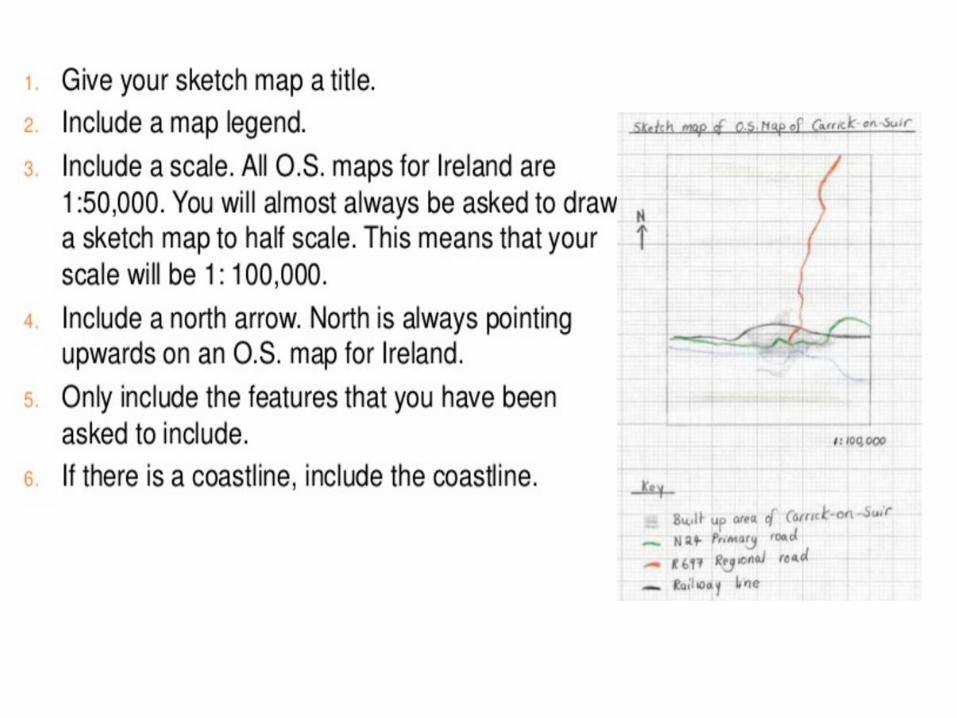
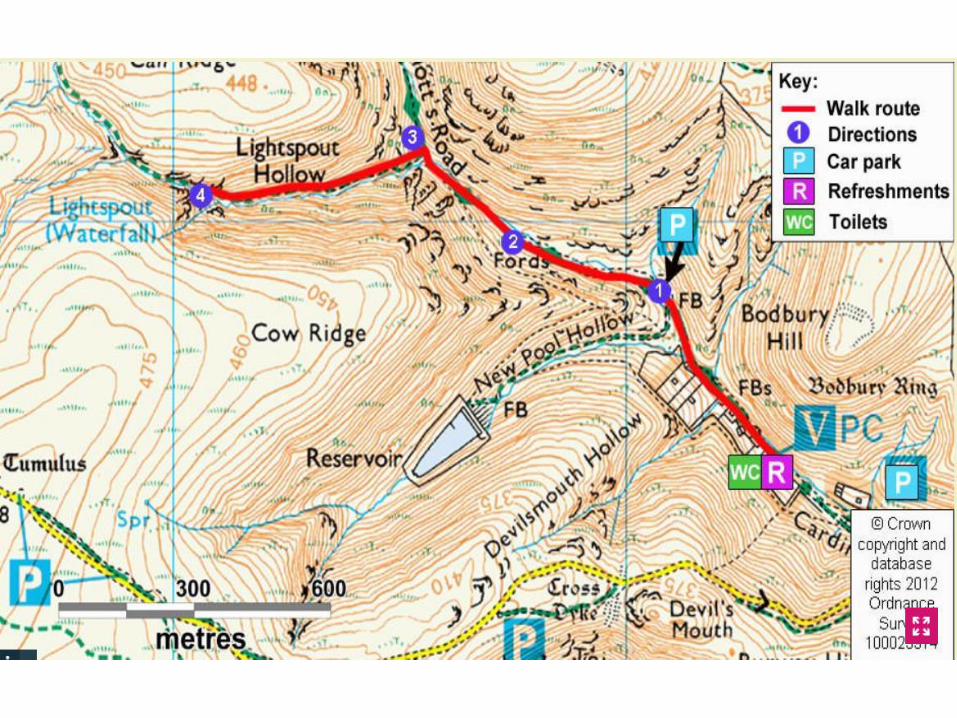
Locating the study area
Create a sketch map of Carding Mill Valley
Annotate the sketch map to show the human and natural features of the area
Extension: for each feature, explain your understanding.
E.g.
Explain how the feature was formed
Explain how the feature affects the velocity of the river
Explain how the feature manages the river landscape
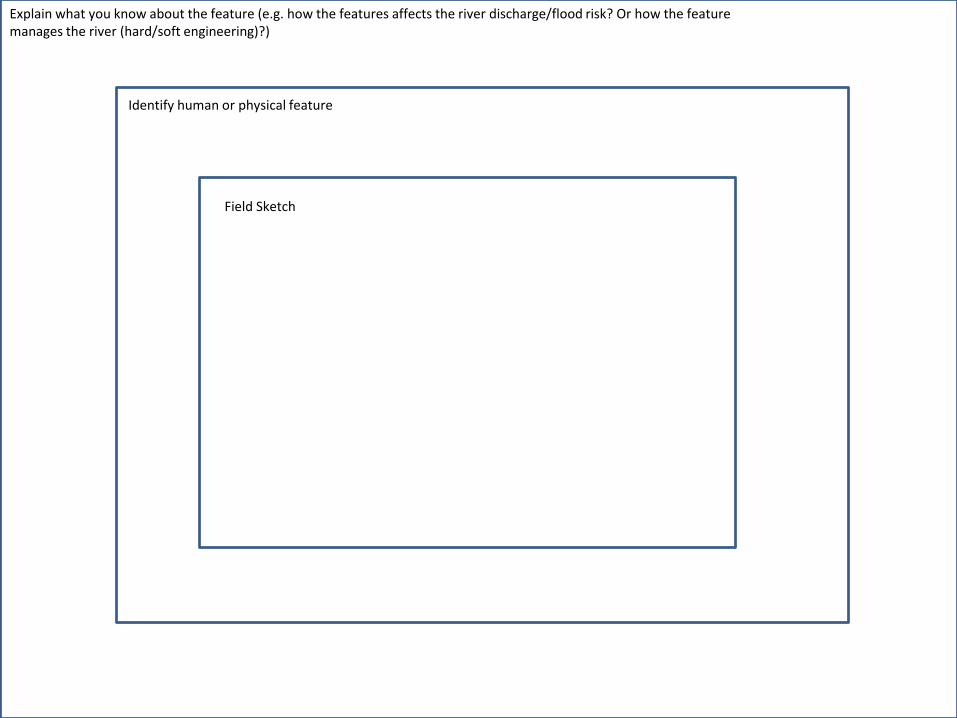
Field Sketch
Identify human or physical feature
Explain what you know about the feature (e.g. how the features affects the river discharge/flood risk? Or how the feature manages the river (hard/soft engineering)?)
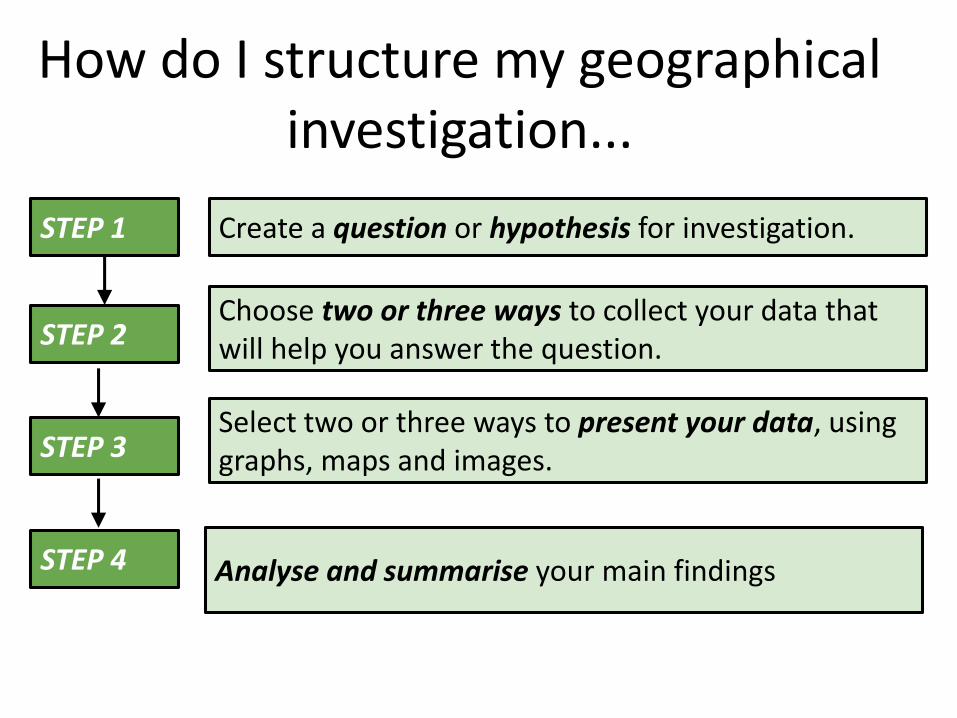
How do I structure my geographical investigation...
STEP 1
STEP 2
STEP 3
Create a question or hypothesis for investigation.
Choose two or three ways to collect your data that will help you answer the question.
STEP 4
Select two or three ways to present your data, using graphs, maps and images.
Analyse and summarise your main findings
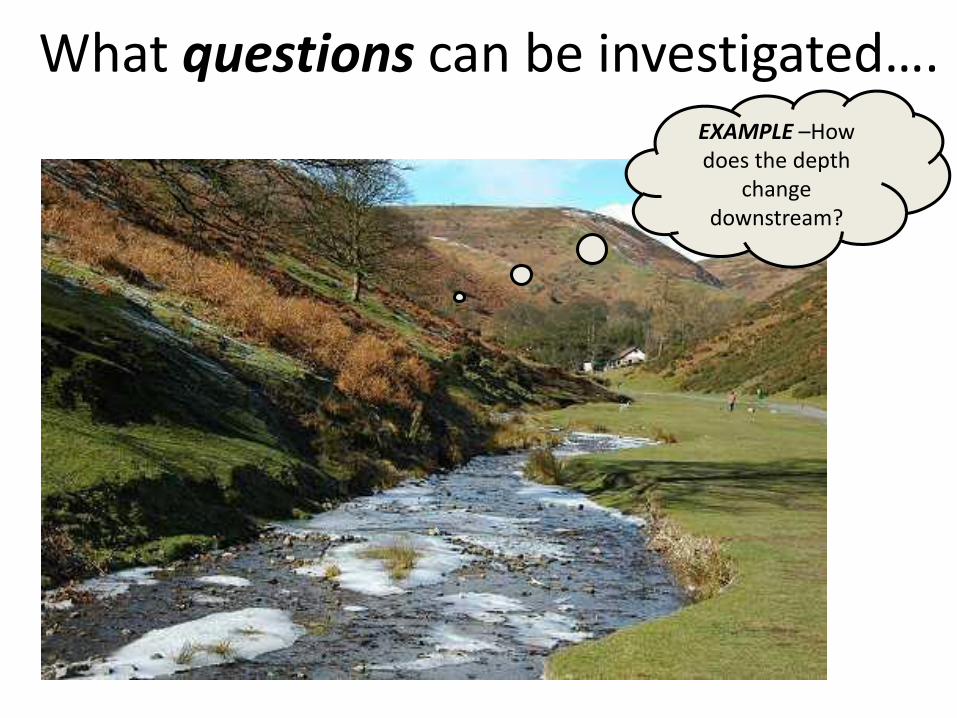
What questions can be investigated….EXAMPLE –How does the depth
change downstream?
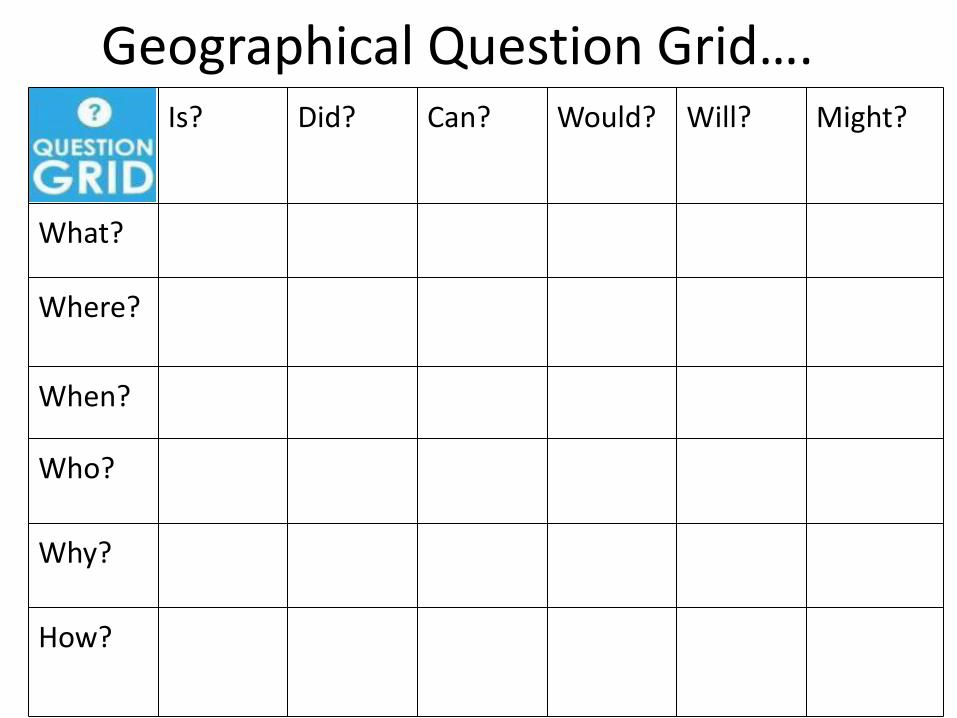
Is? Did? Can? Would? Will? Might?
What?
Where?
When?
Who?
Why?
How?
Geographical Question Grid….
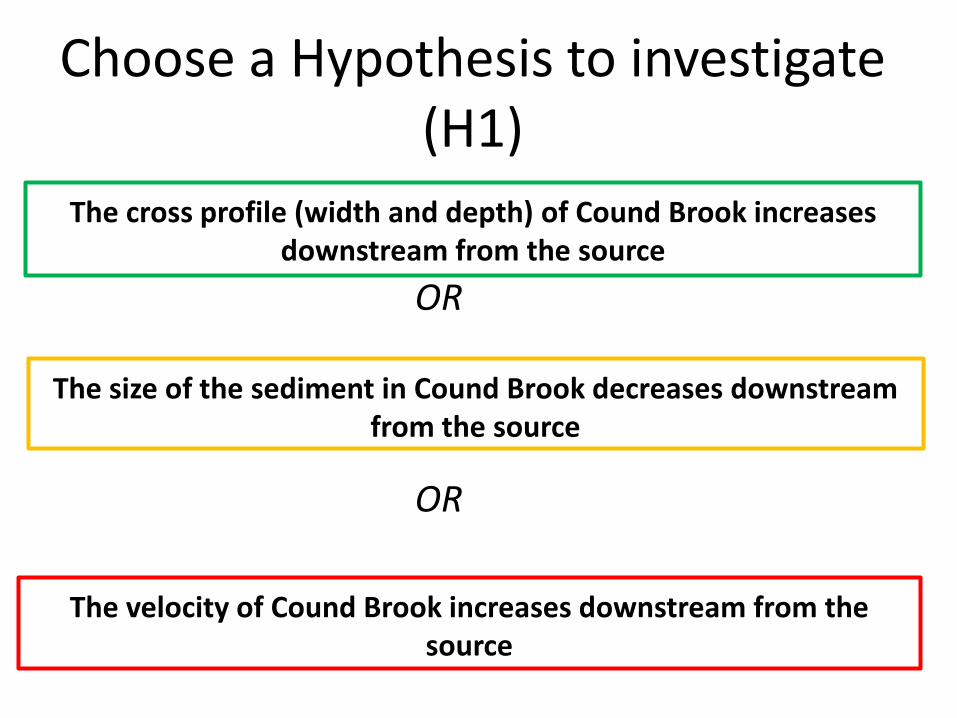
Choose a Hypothesis to investigate (H1)
The cross profile (width and depth) of Cound Brook increases downstream from the source
The velocity of Cound Brook increases downstream from the source
The size of the sediment in Cound Brook decreases downstream from the source
OR
OR
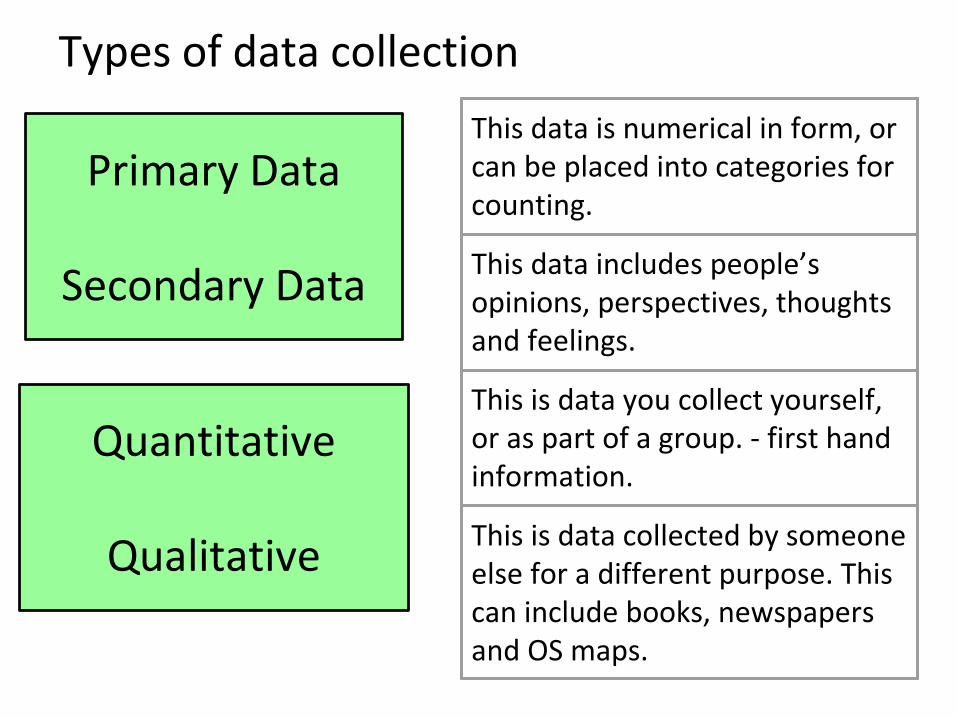
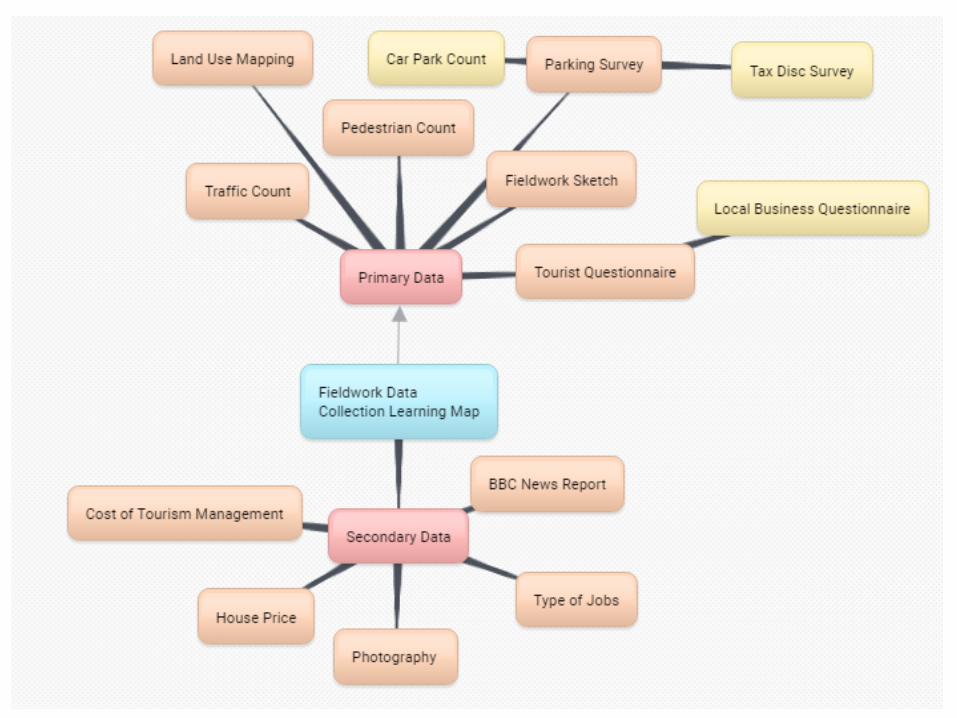
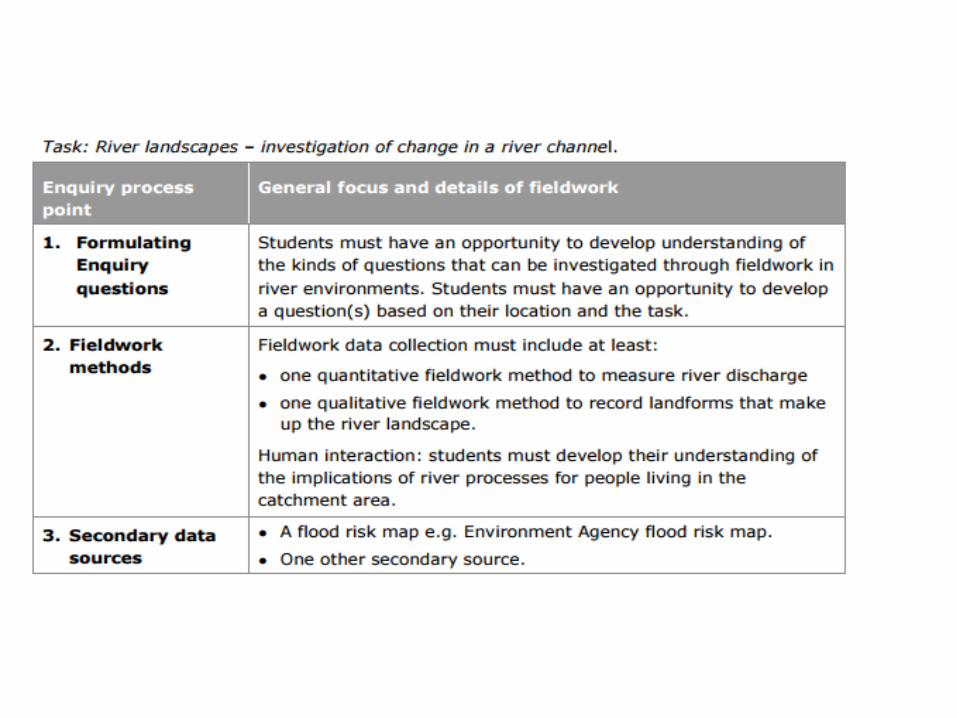
Types of data collection
Primary Data
Secondary Data
Quantitative
Qualitative
This data is numerical in form, or can be placed into categories for counting.
This data includes people’s opinions, perspectives, thoughts and feelings.
This is data you collect yourself, or as part of a group. - first hand information.
This is data collected by someone else for a different purpose. This can include books, newspapers and OS maps.
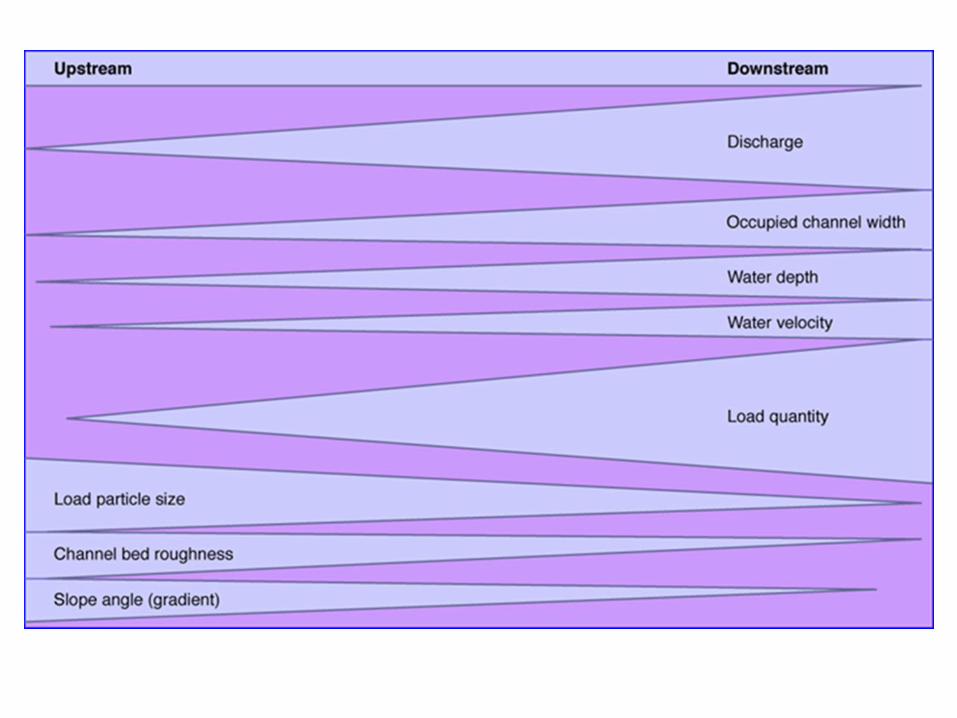
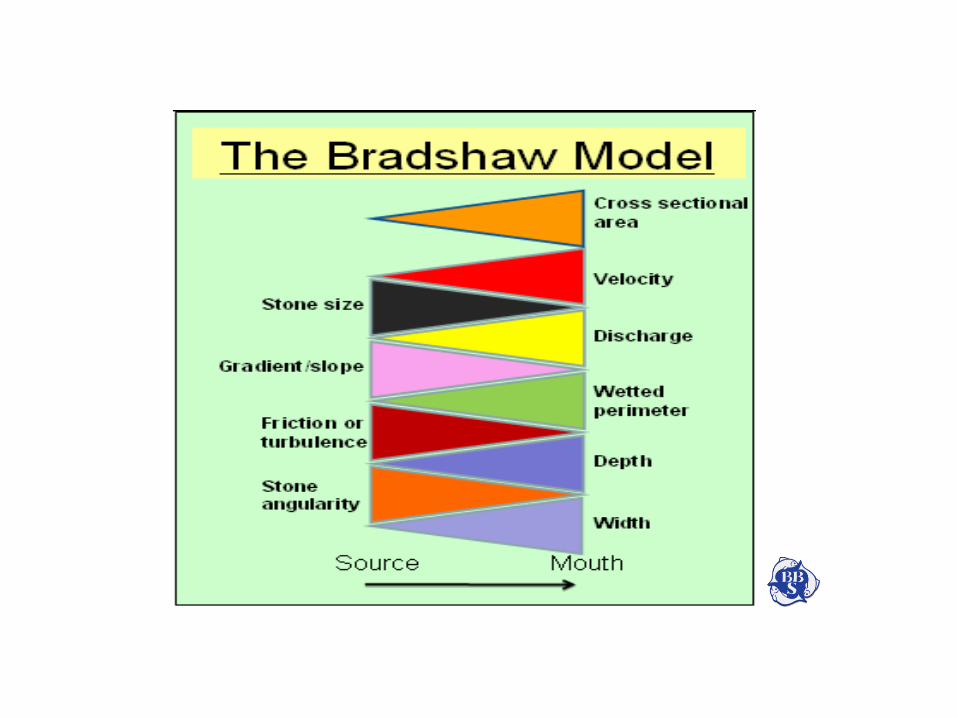
The Bradshaw ModelThe Bradshaw model is a theoretical model that helps describe the
changes we would expect as a river travels from its source regions in its upper course, downstream, through the middle course and into
the lower course towards its mouth. It is shown below as a series of triangles. If the triangle gets wider towards the downstream section it
means that on average that variable increases with increasing distance downstream from the source. If the triangle decreases in
size it means that on average the variable decreases with increasing distance towards the mouth. However, due to the nature of rivers and
the ever-changing environment in which we live not all rivers fit the model perfectly; therefore the model is usually used in order to
compare natural rivers to concepts laid down by the model. We can compare what we find during out fieldwork to the Bradshaw Model
below.
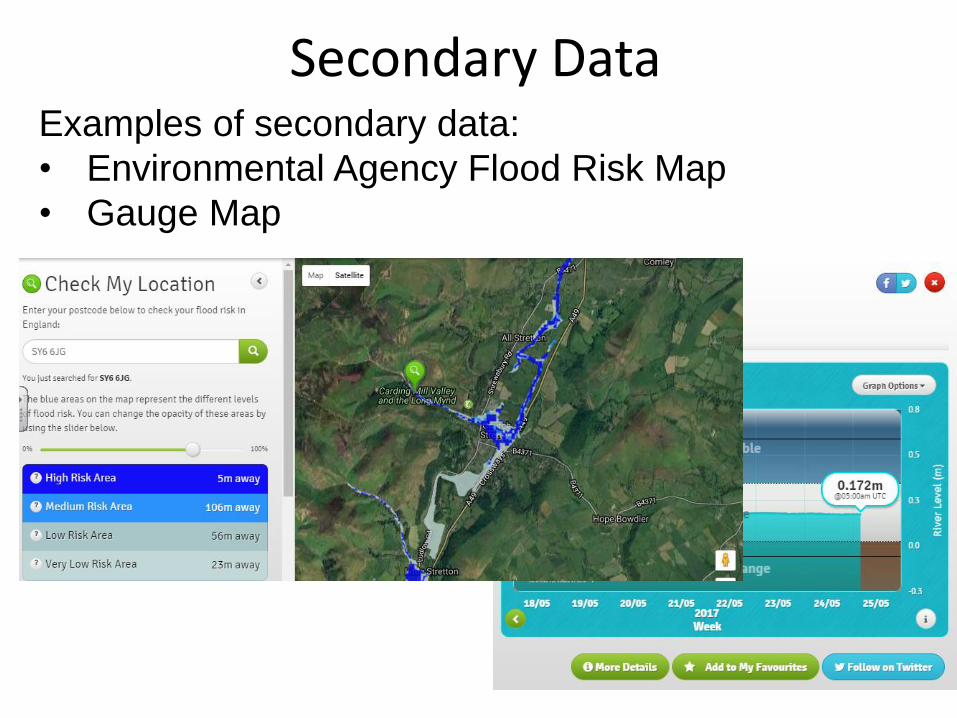
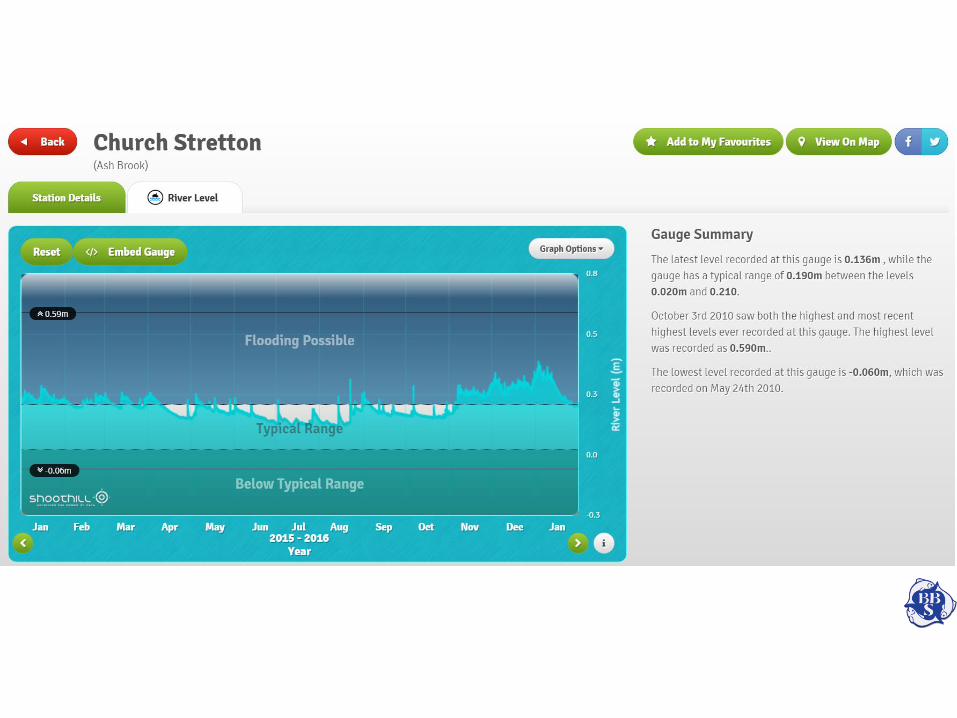
Secondary DataExamples of secondary data:
• Environmental Agency Flood Risk Map
• Gauge Map
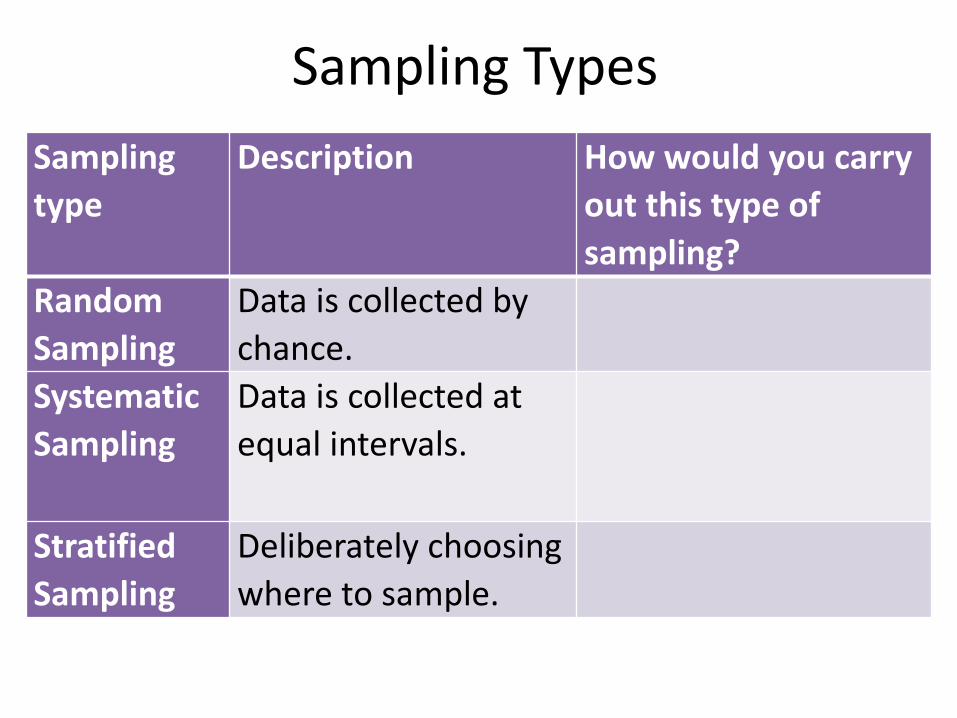
Sampling Types
Sampling
type
Description How would you carry
out this type of
sampling?
Random
Sampling
Data is collected by
chance.
Systematic
Sampling
Data is collected at
equal intervals.
Stratified
Sampling
Deliberately choosing
where to sample.
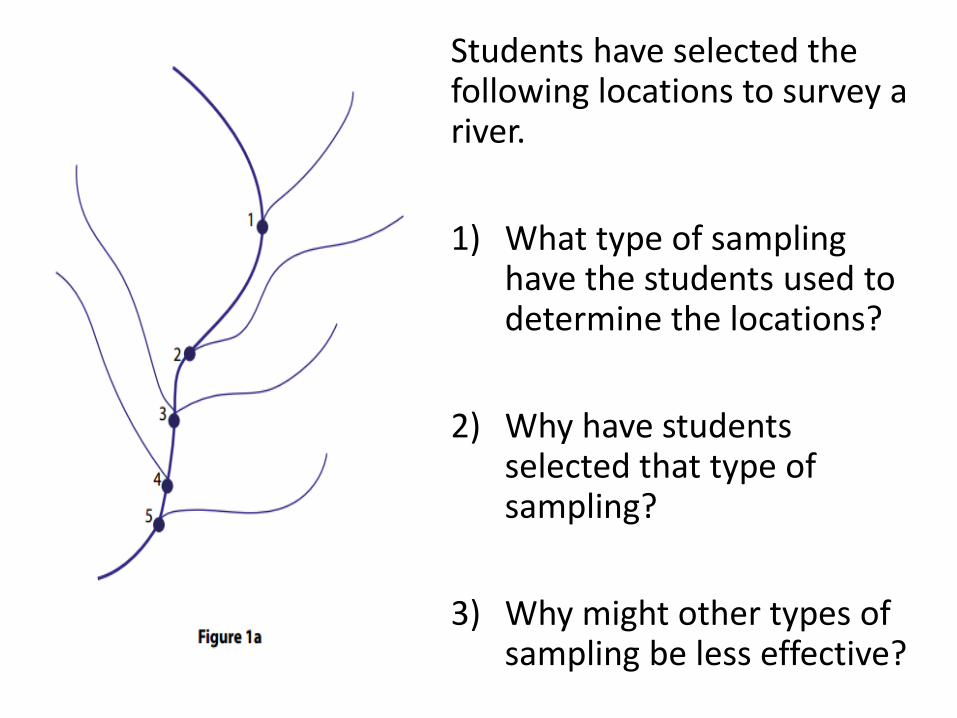
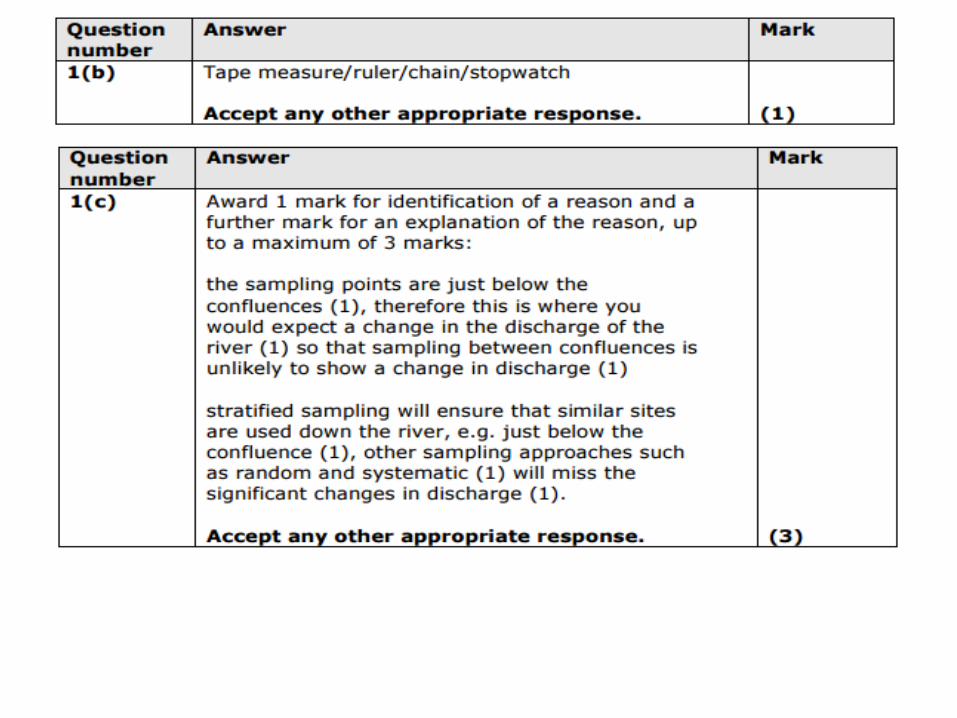
Students have selected the following locations to survey a river.
1) What type of sampling have the students used to determine the locations?
2) Why have students selected that type of sampling?
3) Why might other types of sampling be less effective?
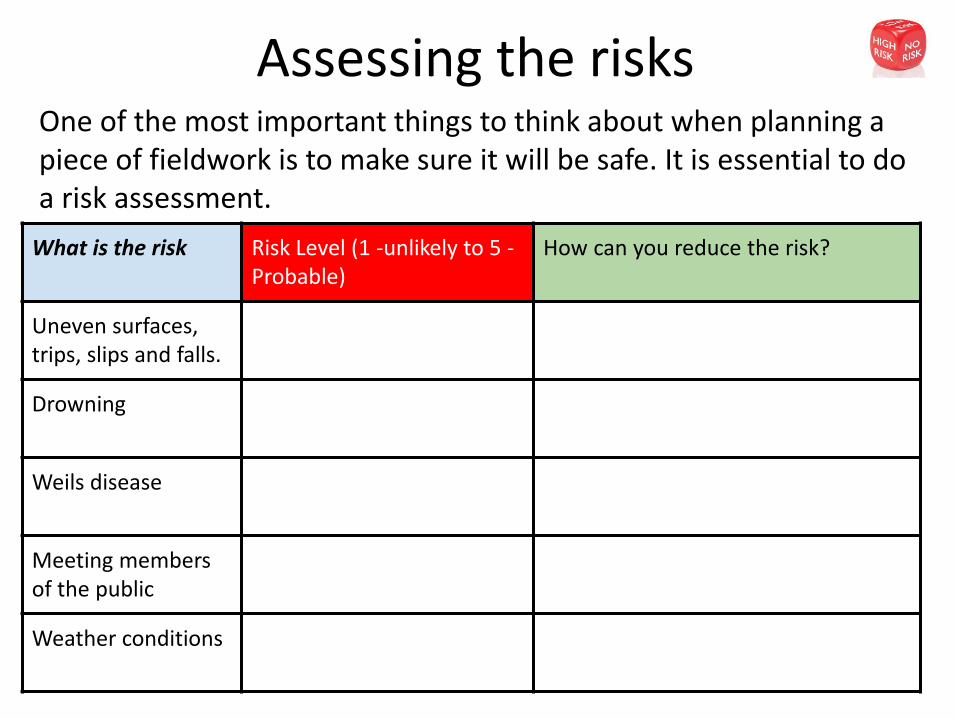
Assessing the risks
What is the risk Risk Level (1 -unlikely to 5 -Probable)
How can you reduce the risk?
Uneven surfaces, trips, slips and falls.
Drowning
Weils disease
Meeting members of the public
Weather conditions
One of the most important things to think about when planning a piece of fieldwork is to make sure it will be safe. It is essential to do a risk assessment.
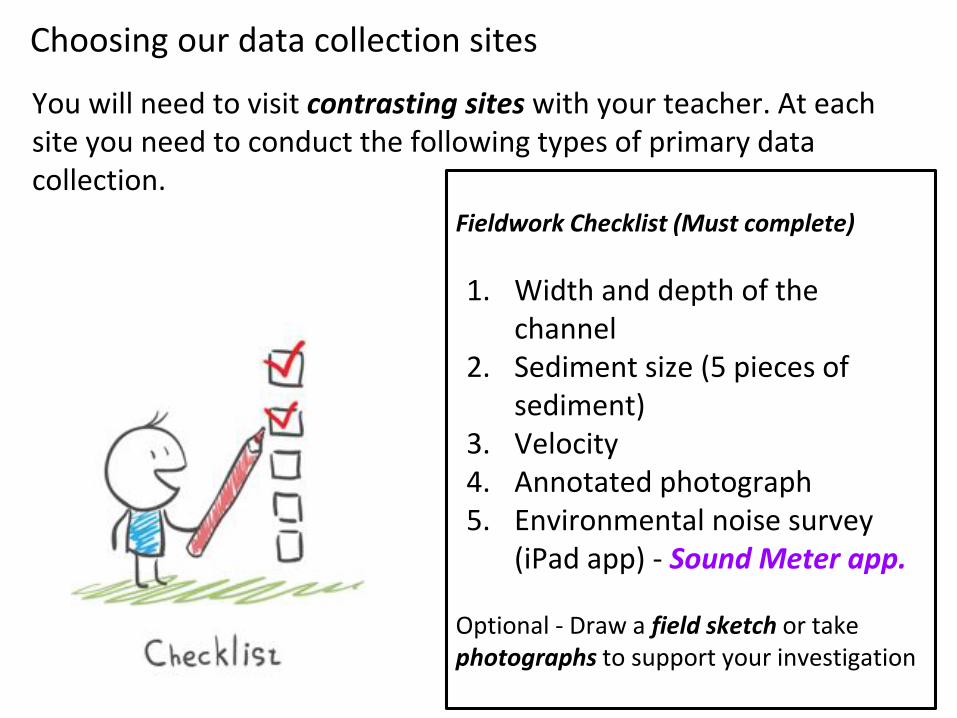
Choosing our data collection sites
You will need to visit contrasting sites with your teacher. At each site you need to conduct the following types of primary data collection.
Fieldwork Checklist (Must complete)
1. Width and depth of the channel
2. Sediment size (5 pieces of sediment)
3. Velocity4. Annotated photograph5. Environmental noise survey
(iPad app) - Sound Meter app.
Optional - Draw a field sketch or take photographs to support your investigation
Fieldwork Safety Message Your safety is our priority!
1. Exemplary behaviour when walking around the local community (Courteous, polite and respectful)
2. Give way to members of the public
3. Listen carefully to your teacher's instructions
4. Stay with your group at all times.
5. Walk on the pavements and pay particular attention when crossing roads.
6. Inform your teacher immediately of any problems.
Any concerns regarding the safety of a student will lead to removal from the fieldwork section
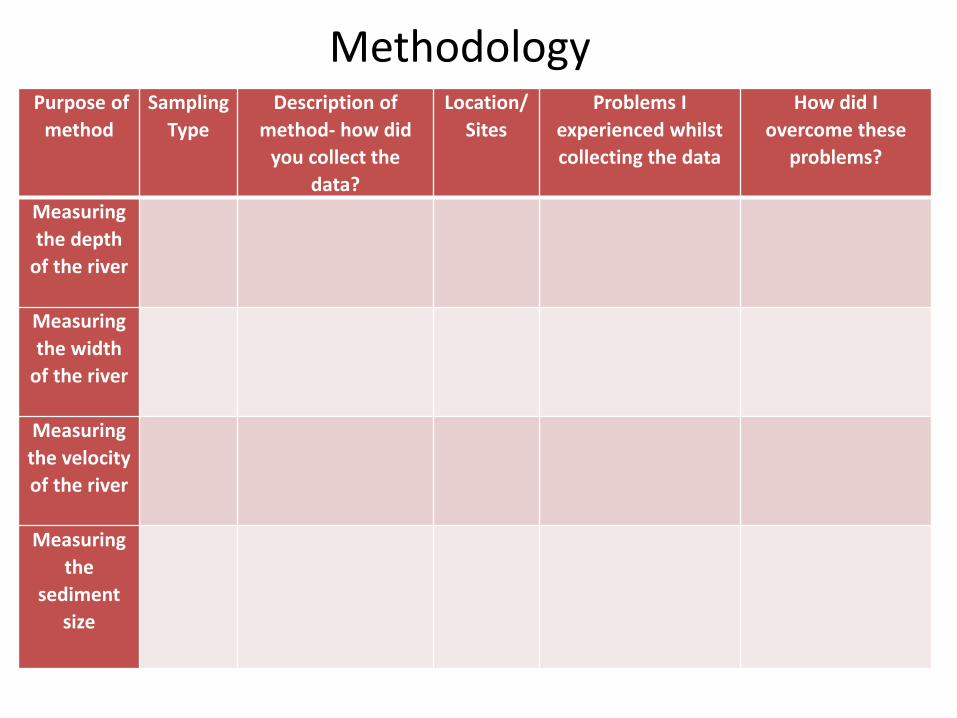
Purpose of
method
Sampling
Type
Description of
method- how did
you collect the
data?
Location/
Sites
Problems I
experienced whilst
collecting the data
How did I
overcome these
problems?
Measuring
the depth
of the river
Measuring
the width
of the river
Measuring
the velocity
of the river
Measuring
the
sediment
size
Methodology
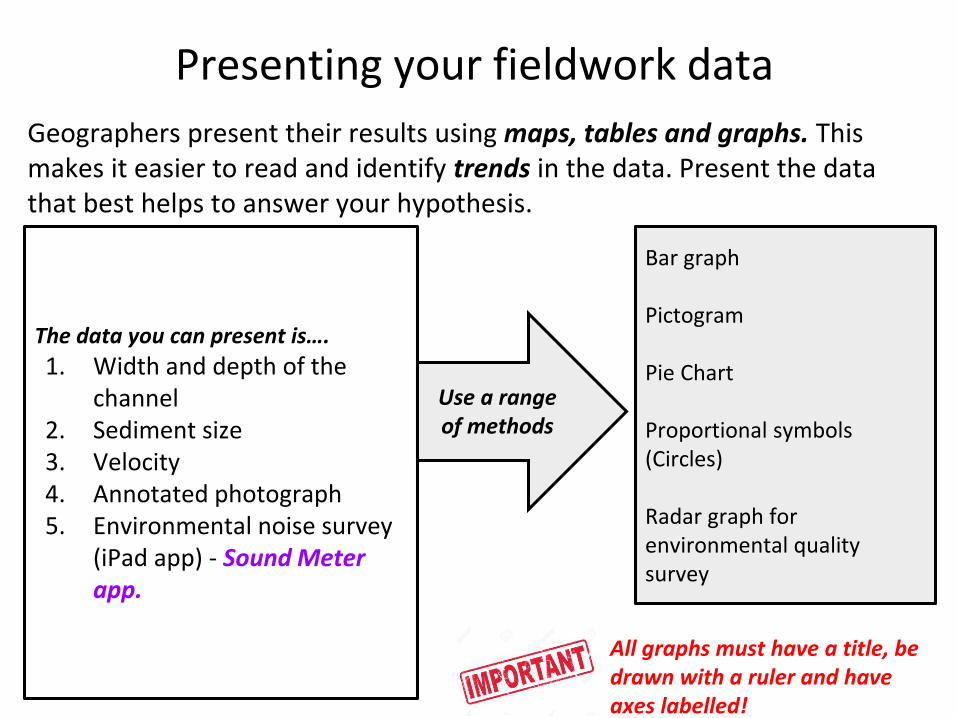
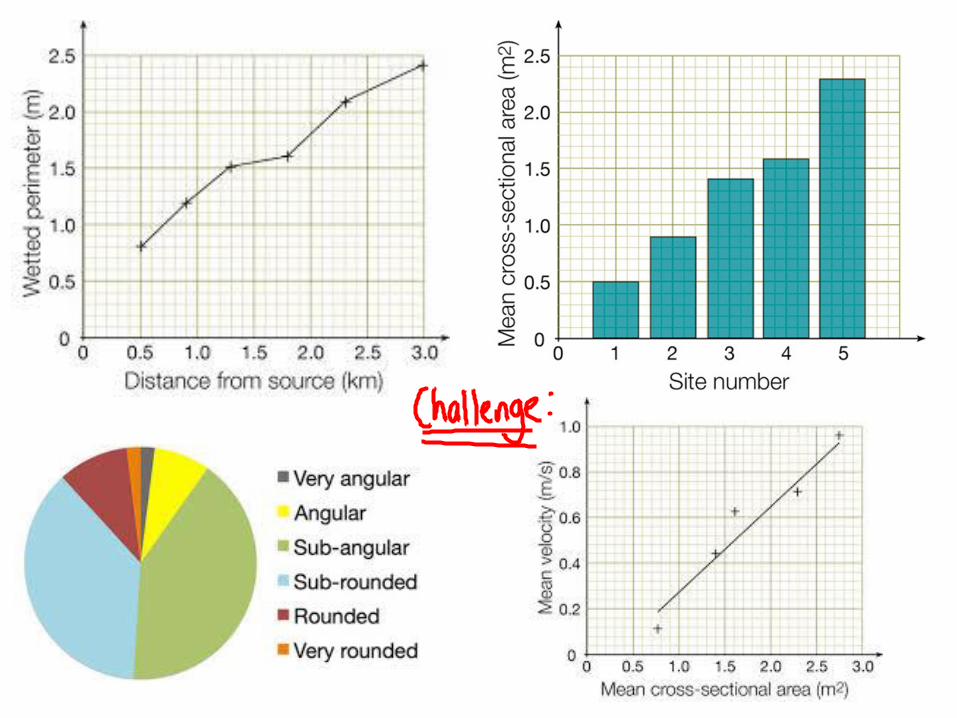
Presenting your fieldwork data
Geographers present their results using maps, tables and graphs. This makes it easier to read and identify trends in the data. Present the data that best helps to answer your hypothesis.
The data you can present is….
1. Width and depth of the channel
2. Sediment size 3. Velocity4. Annotated photograph5. Environmental noise survey
(iPad app) - Sound Meter app.
Use a range of methods
Bar graph
Pictogram
Pie Chart
Proportional symbols (Circles)
Radar graph for environmental quality survey
All graphs must have a title, be drawn with a ruler and have axes labelled!
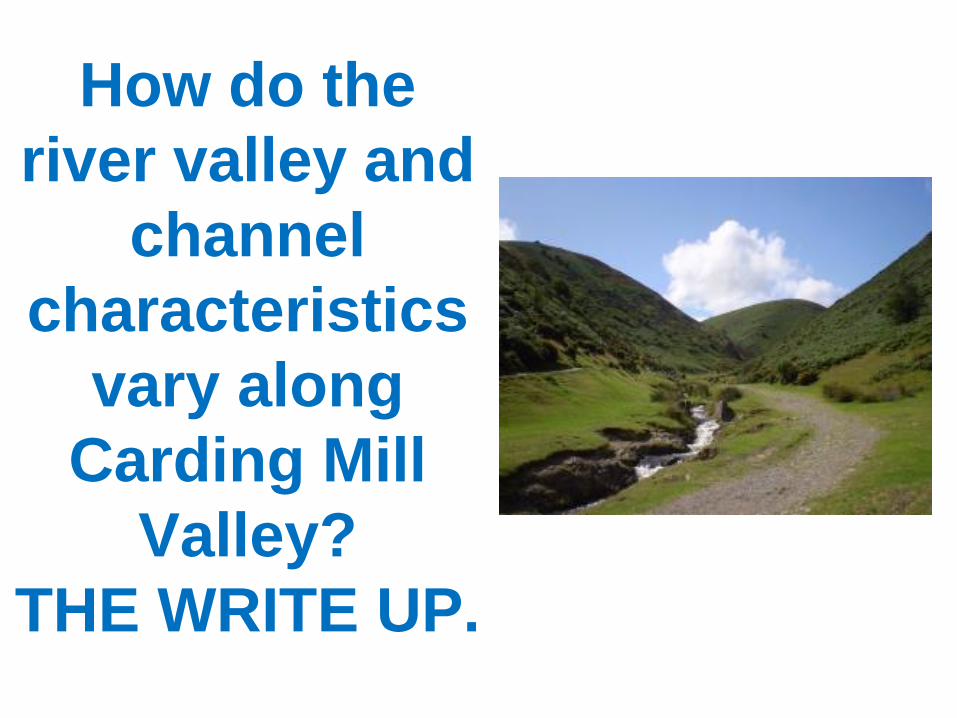
How do the
river valley and
channel
characteristics
vary along
Carding Mill
Valley?
THE WRITE UP.
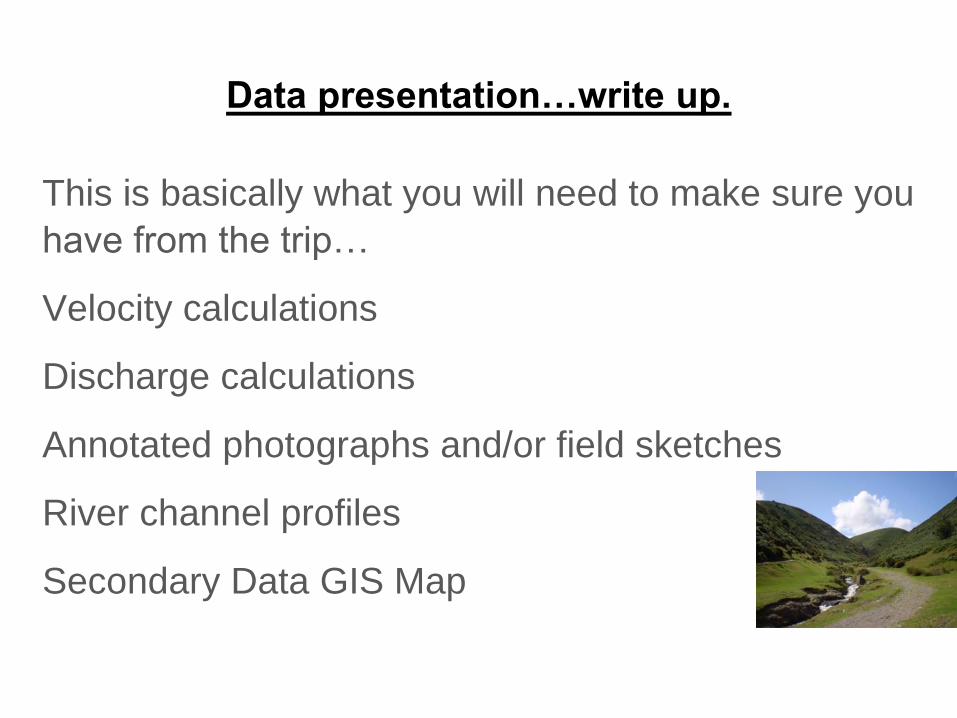
Data presentation…write up.
This is basically what you will need to make sure you
have from the trip…
Velocity calculations
Discharge calculations
Annotated photographs and/or field sketches
River channel profiles
Secondary Data GIS Map
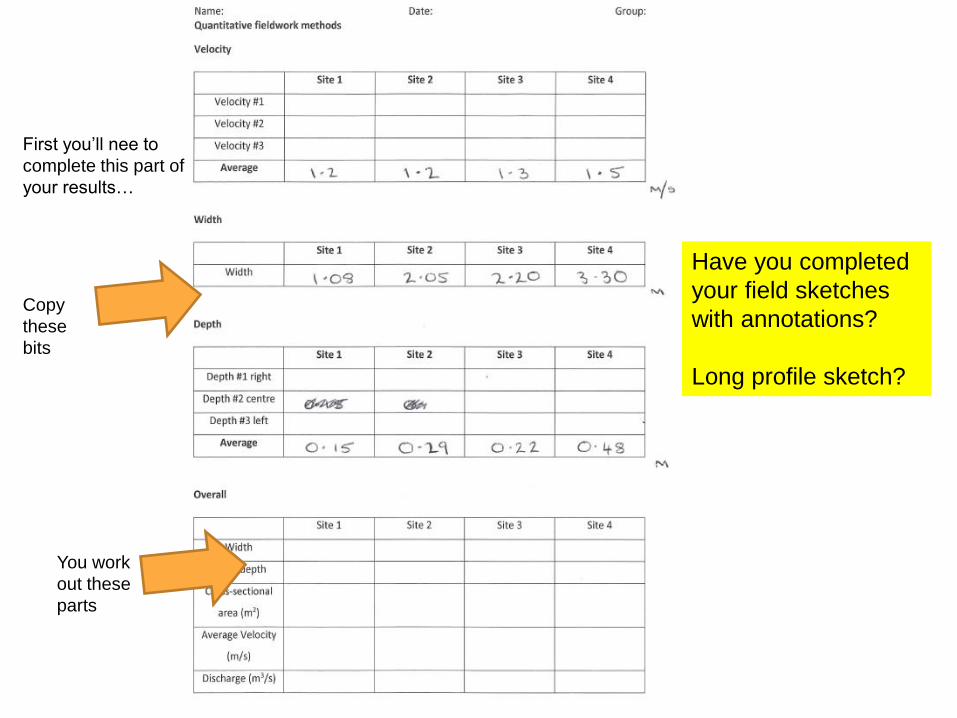
First you’ll nee to
complete this part of
your results…
You work
out these
parts
Have you completed
your field sketches
with annotations?
Long profile sketch?
Copy
these
bits
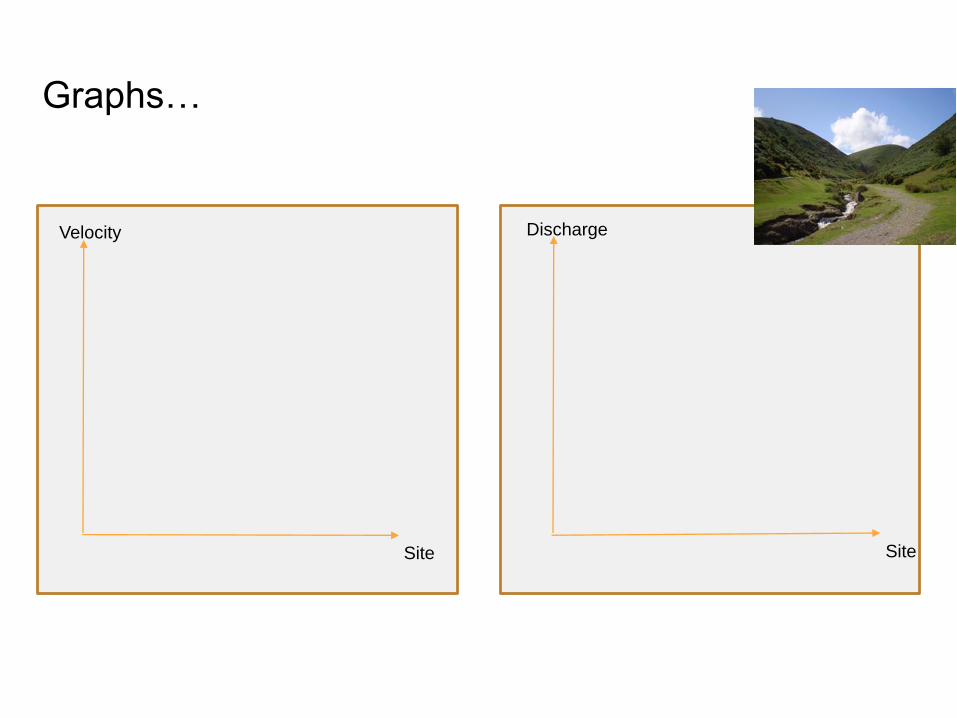
Graphs…
Velocity Discharge
Site Site
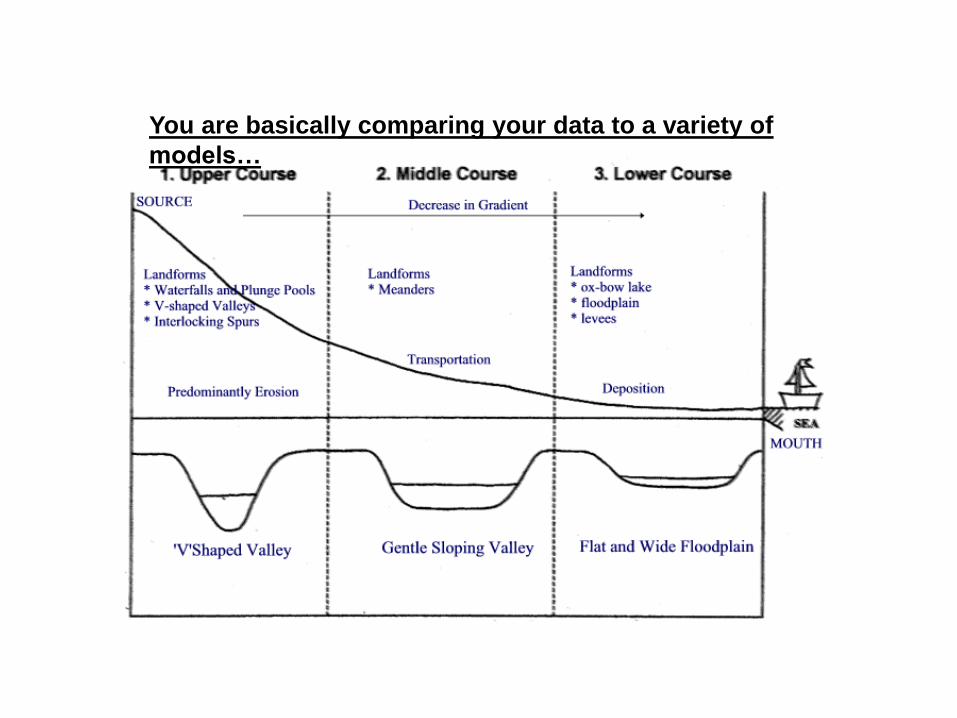
You are basically comparing your data to a variety of
models…
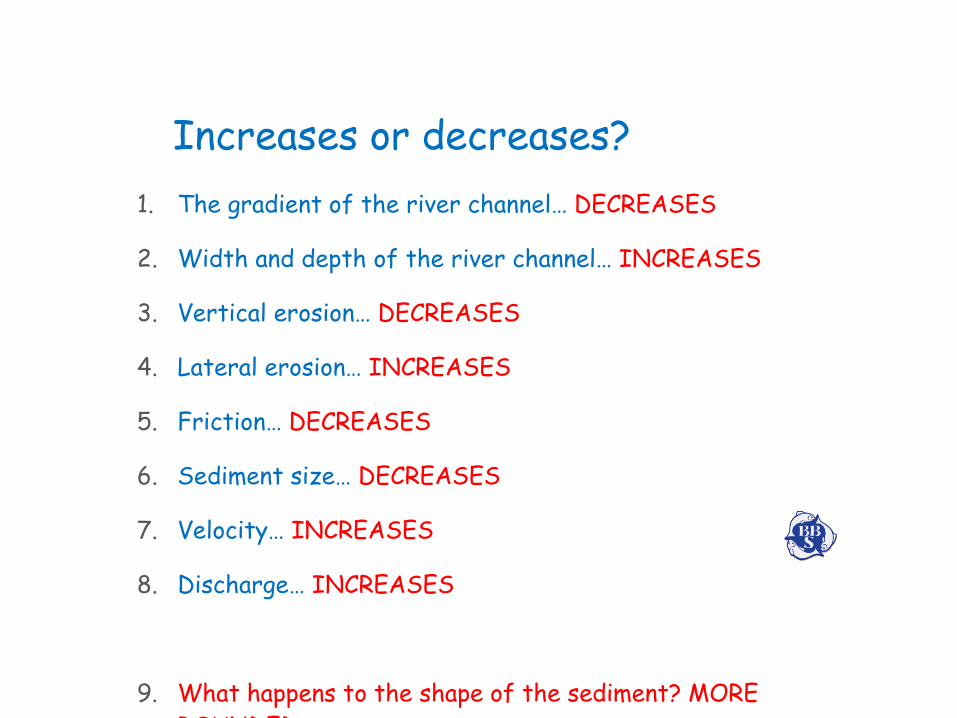
Increases or decreases?
1. The gradient of the river channel… DECREASES
2. Width and depth of the river channel… INCREASES
3. Vertical erosion… DECREASES
4. Lateral erosion… INCREASES
5. Friction… DECREASES
6. Sediment size… DECREASES
7. Velocity… INCREASES
8. Discharge… INCREASES
9. What happens to the shape of the sediment? MORE
ROUNDED
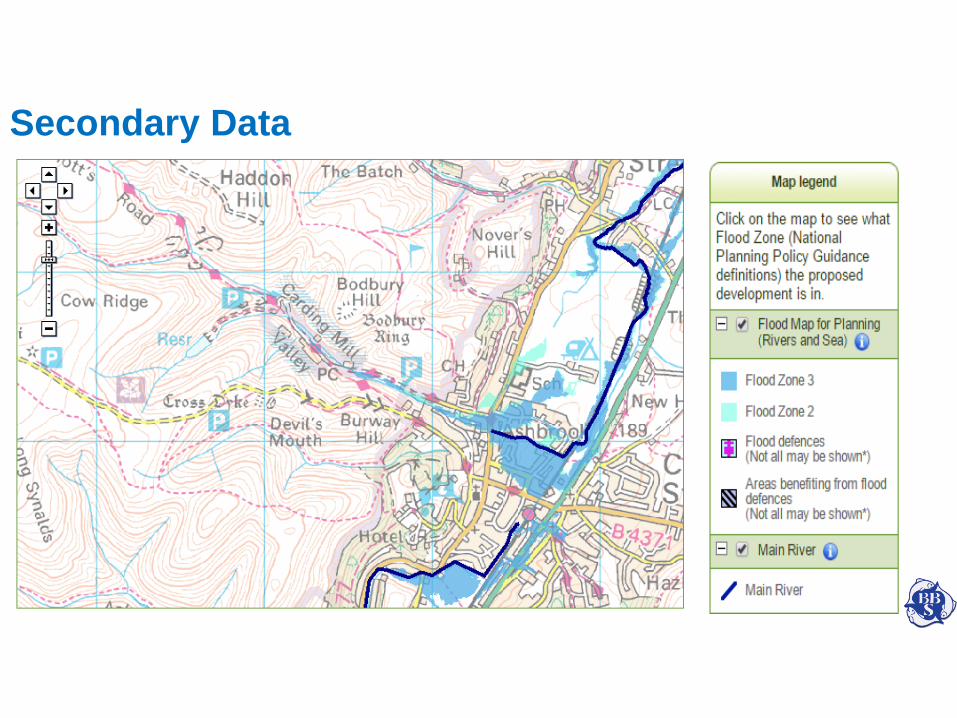
Secondary Data
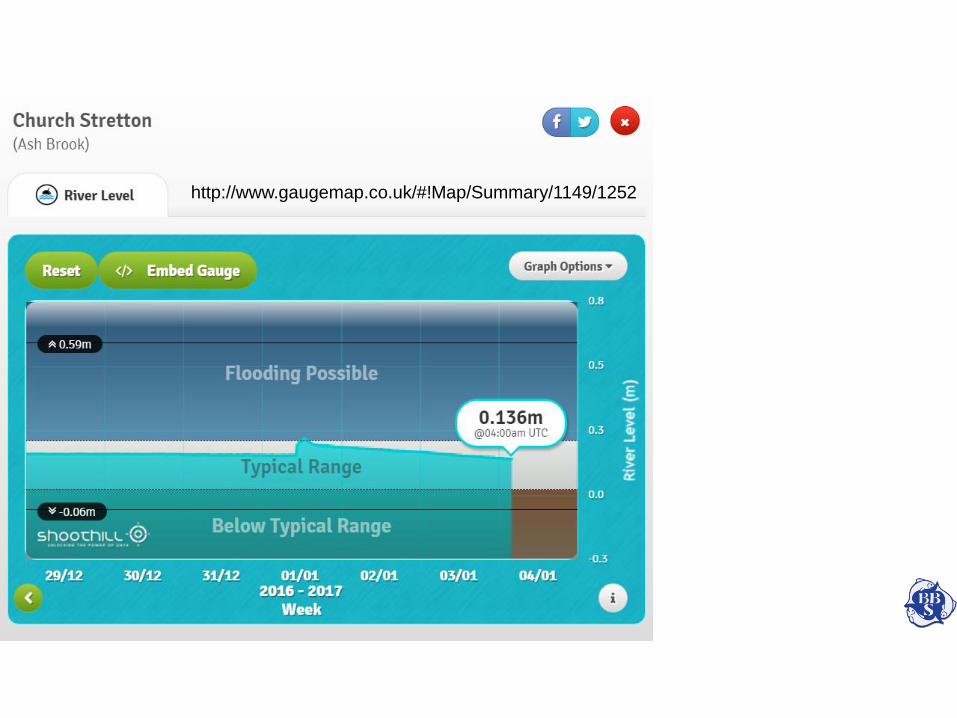
http://www.gaugemap.co.uk/#!Map/Summary/1149/1252
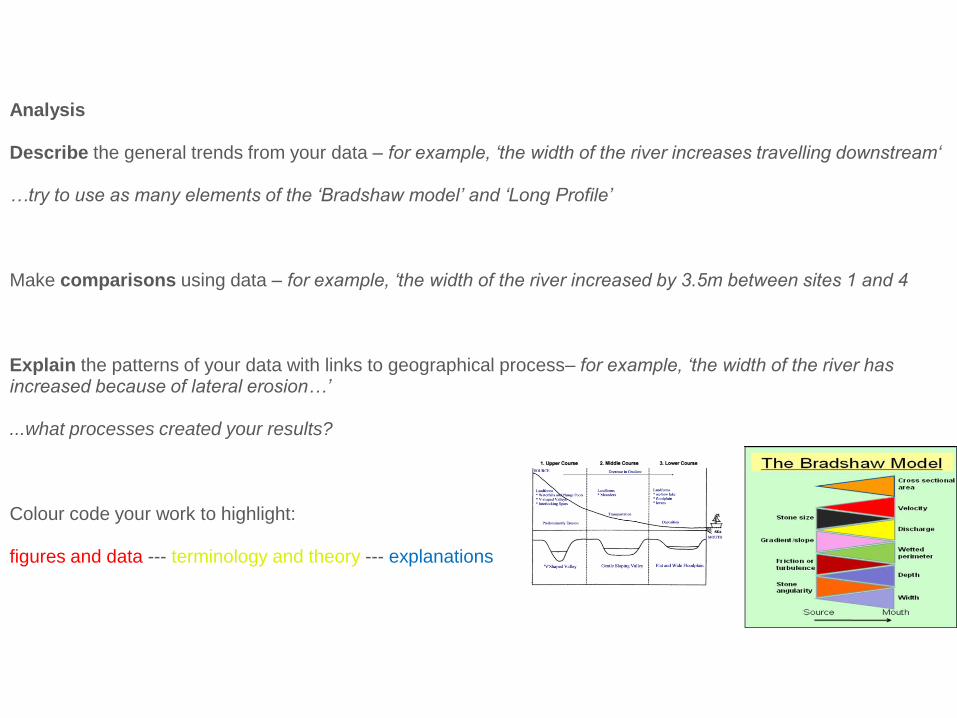
Analysis
Describe the general trends from your data – for example, ‘the width of the river increases travelling downstream‘
…try to use as many elements of the ‘Bradshaw model’ and ‘Long Profile’
Make comparisons using data – for example, ‘the width of the river increased by 3.5m between sites 1 and 4
Explain the patterns of your data with links to geographical process– for example, ‘the width of the river has increased because of lateral erosion…’
...what processes created your results?
Colour code your work to highlight:
figures and data --- terminology and theory --- explanations
Conclusion
What did your investigation find out?
Summarise your findings and link each to the evidence
Point out any anomalies in your data – the results that are different
from what you expected
How closely does the Carding Mill Valley River follow the Bradshaw
Model and Long Profile?
Secondary data evidence? Does it match yours?
Evaluation
How successful and useful were your methods for
sampling and collecting data? How could they be
improved?
How accurate were your results? Did your data collection
methods affect the results?
Did missing or inaccurate data make the study unreliable
or affect the results?
Did missing or inaccurate data make the study unreliable
or affect your conclusions?
How could the investigation be extended?
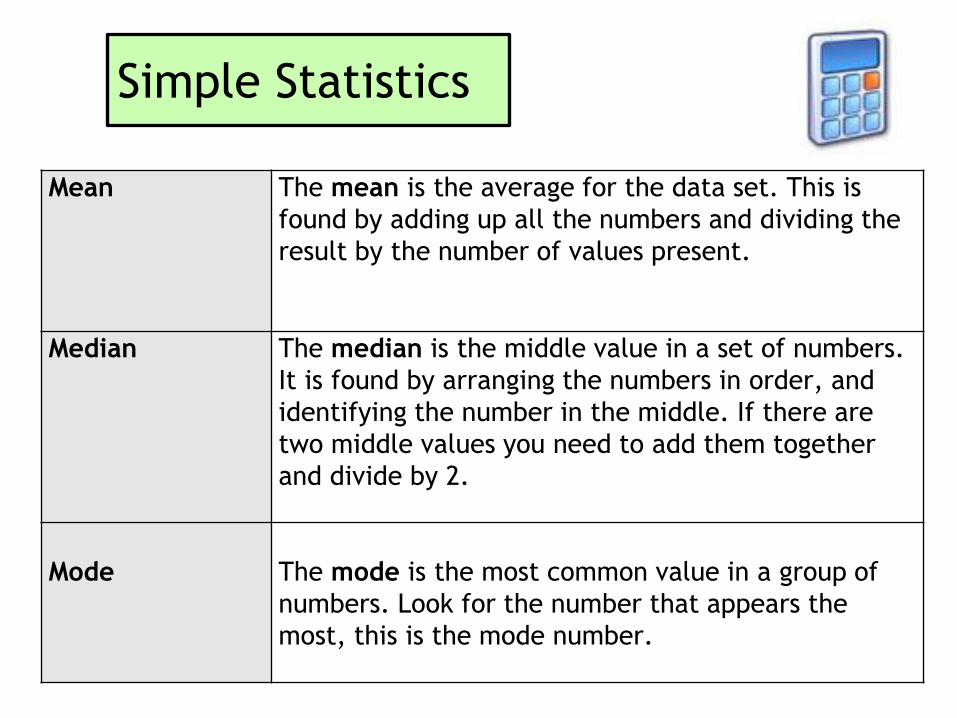
Simple Statistics
Mean The mean is the average for the data set. This is
found by adding up all the numbers and dividing the
result by the number of values present.
Median The median is the middle value in a set of numbers.
It is found by arranging the numbers in order, and
identifying the number in the middle. If there are
two middle values you need to add them together
and divide by 2.
Mode The mode is the most common value in a group of
numbers. Look for the number that appears the
most, this is the mode number.
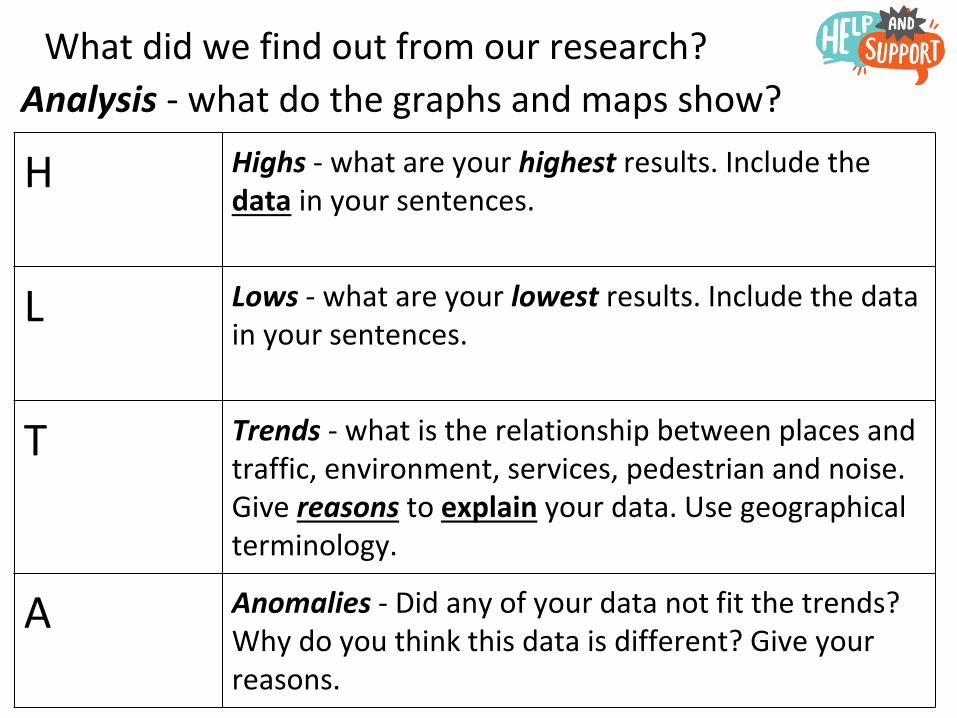
What did we find out from our research?
Analysis - what do the graphs and maps show?
H Highs - what are your highest results. Include the data in your sentences.
L Lows - what are your lowest results. Include the data in your sentences.
T Trends - what is the relationship between places and traffic, environment, services, pedestrian and noise. Give reasons to explain your data. Use geographical terminology.
A Anomalies - Did any of your data not fit the trends? Why do you think this data is different? Give your reasons.
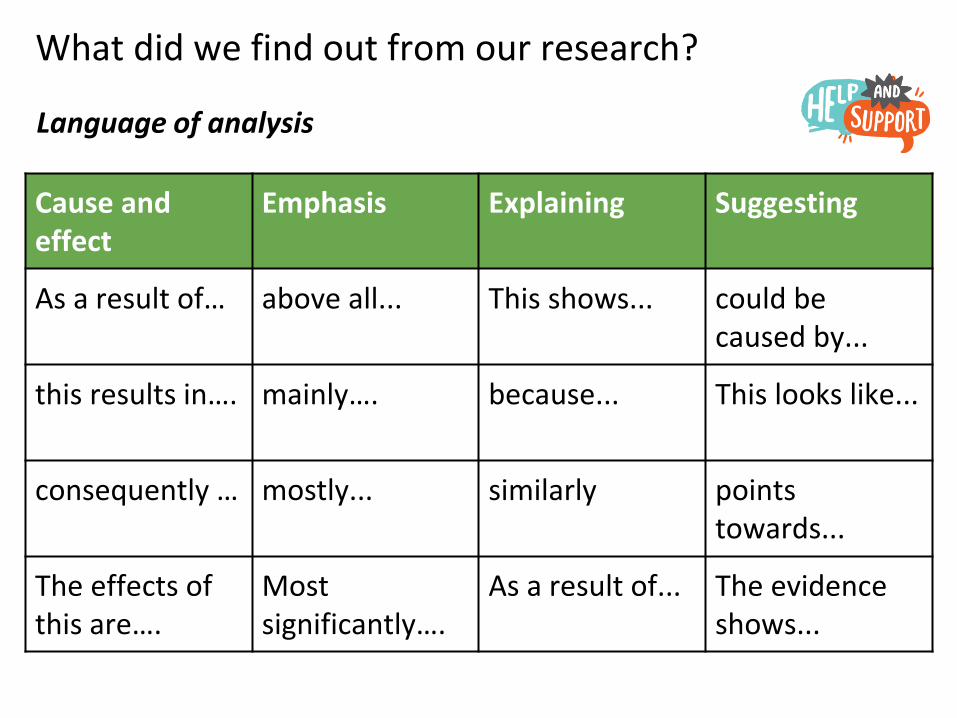
What did we find out from our research?
Language of analysis
Cause and effect
Emphasis Explaining Suggesting
As a result of… above all... This shows... could be caused by...
this results in…. mainly…. because... This looks like...
consequently … mostly... similarly points towards...
The effects of this are….
Most significantly….
As a result of... The evidence shows...

Our research is coming to an end….
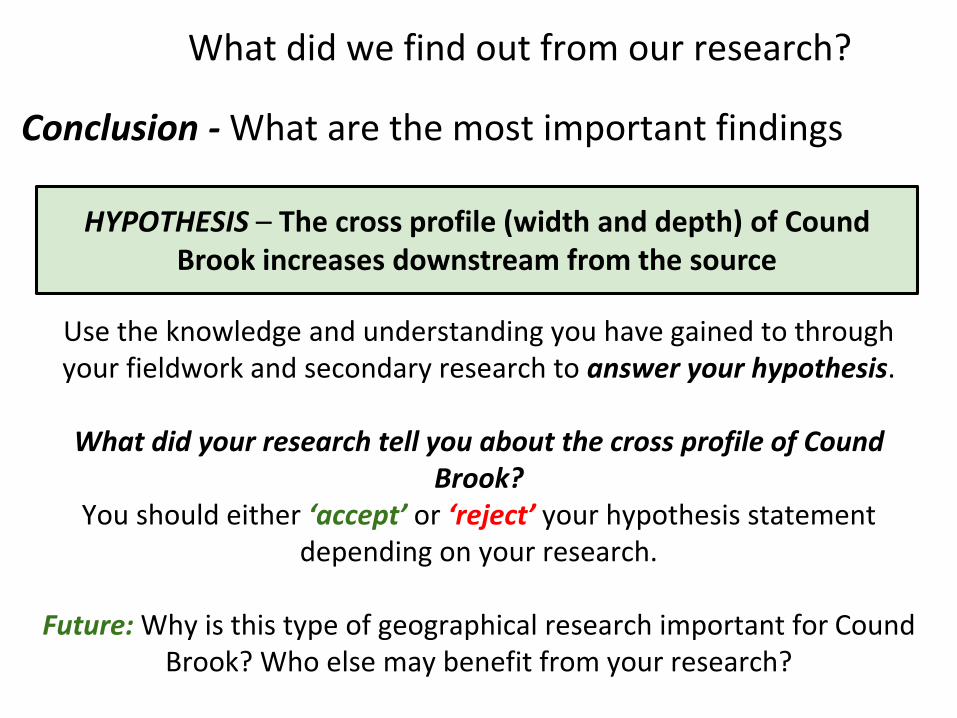
What did we find out from our research?
Conclusion - What are the most important findings
Use the knowledge and understanding you have gained to through your fieldwork and secondary research to answer your hypothesis.
What did your research tell you about the cross profile of CoundBrook?
You should either ‘accept’ or ‘reject’ your hypothesis statement depending on your research.
Future: Why is this type of geographical research important for CoundBrook? Who else may benefit from your research?
HYPOTHESIS – The cross profile (width and depth) of CoundBrook increases downstream from the source