Embed Size (px)
Citation preview
1
GCC Fixed Income Chart Book: Q1-Q3 2016 Review
06 October, 2016
Chavan Bhogaita / Rakesh Sahu
Market Insights & Strategy
NBAD Global Markets
22
To the fullest extent allowed by applicable laws and regulations, National Bank of Abu Dhabi PJSC (the “Bank”) and any otheraffiliate or subsidiary of the Bank, expressly disclaim all warranties and representations in respect of this communication. Thecontent is confidential and is provided for your information purposes only on an “as is” and “as available” basis and noliability is accepted for or representation is made by the Bank in respect of the quality, completeness or accuracy of theinformation and the Bank has undertaken no independent verification in relation thereto nor is it under any duty to do sowhether prepared in part or in full by the Bank or any third party. Furthermore, the Bank shall be under no obligation toprovide you with any change or update in relation to said content. It is not intended for distribution to private investors orprivate clients and is not intended to be relied upon as advice; whether financial, legal, tax or otherwise. To the extent thatyou deem necessary to obtain such advice, you should consult with your independent advisors. Any content has beenprepared by personnel of the Global Markets at the Bank and does not reflect the views of the Bank as a whole or otherpersonnel of the Bank.
Disclaimer
33
Welcome to our 9M 2016 chart book for the GCC fixed income market. The idea is very simple – to give those of you who follow this market a quick snapshot of some of the key points in terms of the following:
Overview of spread performance in this market during the first nine months of FY 2016
Primary Market issuance (and performance of these deals since they were printed)
Secondary Market performance of key instruments (snapshot from 31st December 2015 to 30th September 2016)
We have deliberately made the report text-light in an attempt to make it easier to digest. Hopefully you will find it both interesting and useful.
If you have any feedback on the report, or indeed would like to discuss any of the points highlighted, please do contact me.
Regards,
Chavan BhogaitaManaging Director & Head of Market Insights & StrategyGlobal [email protected]+971 2 6110 127
Foreword
44
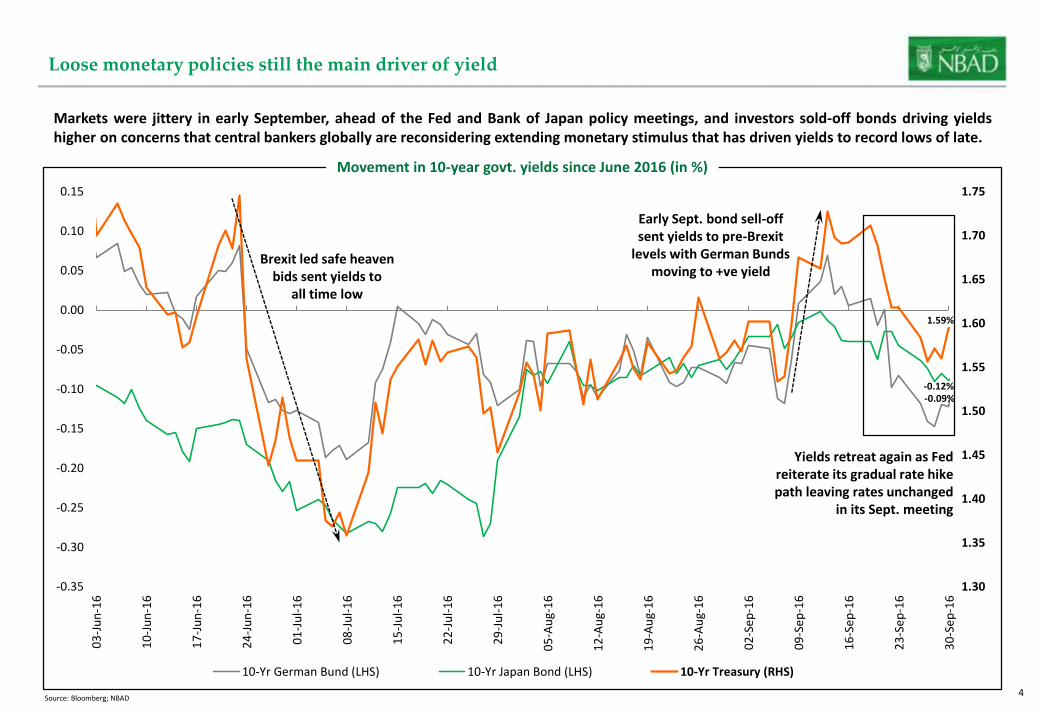
Loose monetary policies still the main driver of yield
Markets were jittery in early September, ahead of the Fed and Bank of Japan policy meetings, and investors sold-off bonds driving yieldshigher on concerns that central bankers globally are reconsidering extending monetary stimulus that has driven yields to record lows of late.
1.30
1.35
1.40
1.45
1.50
1.55
1.60
1.65
1.70
1.75
-0.35
-0.30
-0.25
-0.20
-0.15
-0.10
-0.05
0.00
0.05
0.10
0.15
03
-Ju
n-1
6
10
-Ju
n-1
6
17
-Ju
n-1
6
24
-Ju
n-1
6
01
-Ju
l-1
6
08
-Ju
l-1
6
15
-Ju
l-1
6
22
-Ju
l-1
6
29
-Ju
l-1
6
05
-Au
g-1
6
12
-Au
g-1
6
19
-Au
g-1
6
26
-Au
g-1
6
02
-Se
p-1
6
09
-Se
p-1
6
16
-Se
p-1
6
23
-Se
p-1
6
30
-Se
p-1
6
10-Yr German Bund (LHS) 10-Yr Japan Bond (LHS) 10-Yr Treasury (RHS)
Movement in 10-year govt. yields since June 2016 (in %)
Source: Bloomberg; NBAD
Early Sept. bond sell-off sent yields to pre-Brexit
levels with German Bunds moving to +ve yield
Brexit led safe heaven bids sent yields to
all time low
Yields retreat again as Fed reiterate its gradual rate hike path leaving rates unchanged
in its Sept. meeting
-0.12% -0.09%
1.59%
55
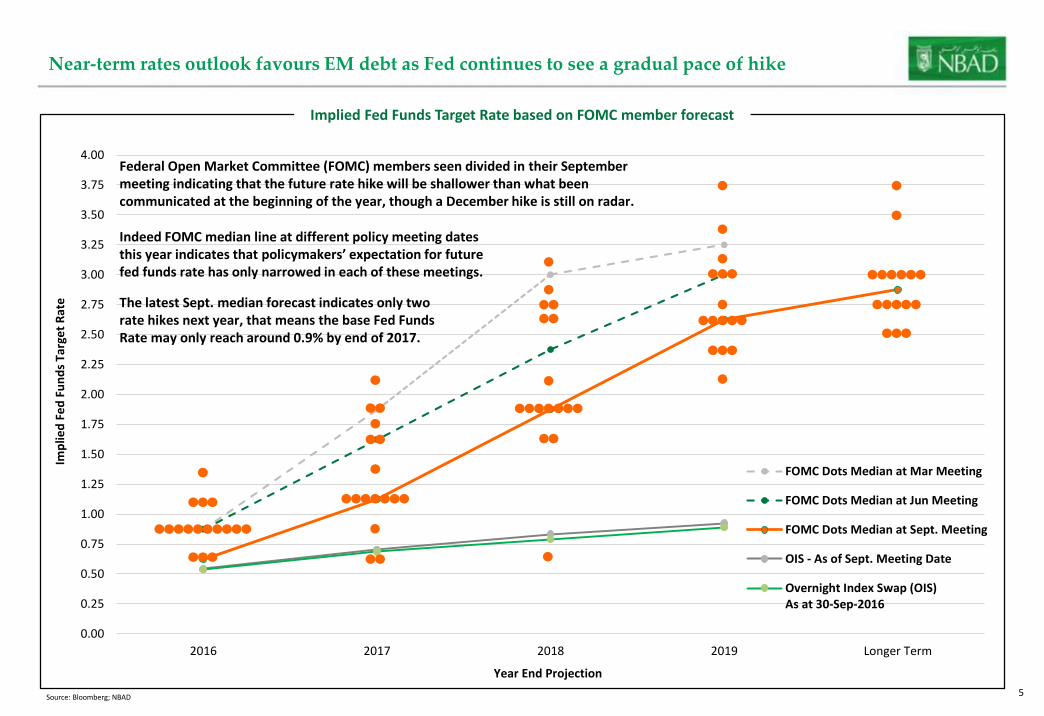
Near-term rates outlook favours EM debt as Fed continues to see a gradual pace of hike
0.00
0.25
0.50
0.75
1.00
1.25
1.50
1.75
2.00
2.25
2.50
2.75
3.00
3.25
3.50
3.75
4.00
2016 2017 2018 2019 Longer Term
Imp
lied
Fe
d F
un
ds
Targ
et
Rat
e
Year End Projection
FOMC Dots Median at Mar Meeting
FOMC Dots Median at Jun Meeting
FOMC Dots Median at Sept. Meeting
OIS - As of Sept. Meeting Date
Overnight Index Swap (OIS)As at 30-Sep-2016
Implied Fed Funds Target Rate based on FOMC member forecast
Source: Bloomberg; NBAD
Federal Open Market Committee (FOMC) members seen divided in their September meeting indicating that the future rate hike will be shallower than what been communicated at the beginning of the year, though a December hike is still on radar.
Indeed FOMC median line at different policy meeting dates this year indicates that policymakers’ expectation for future fed funds rate has only narrowed in each of these meetings.
The latest Sept. median forecast indicates only two rate hikes next year, that means the base Fed Funds Rate may only reach around 0.9% by end of 2017.
66
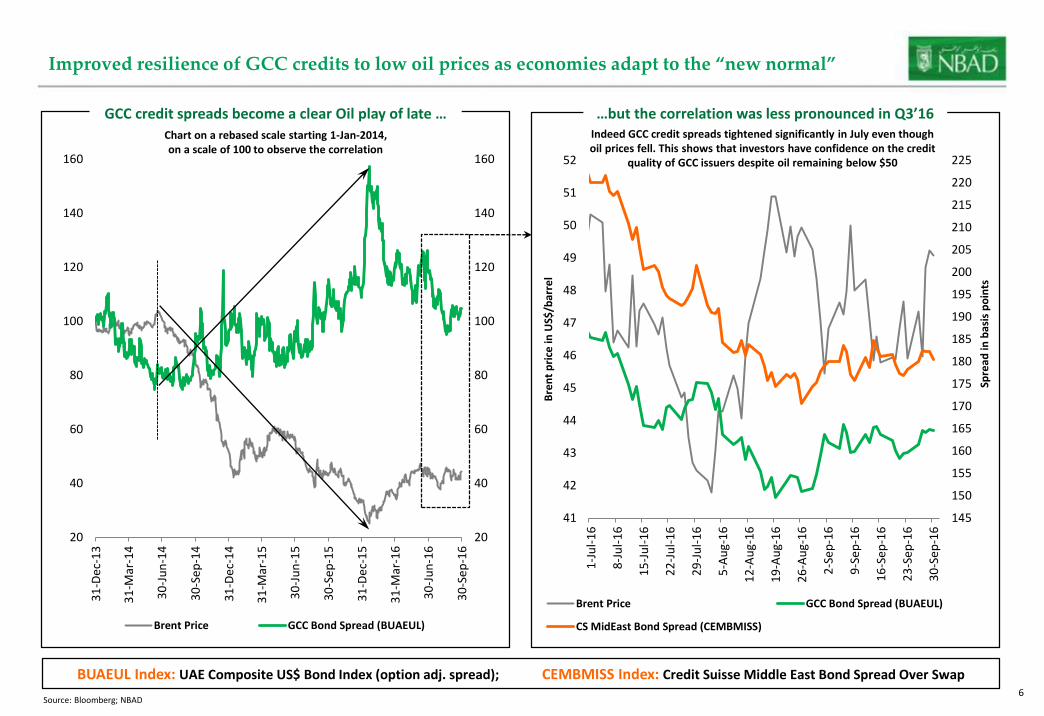
Improved resilience of GCC credits to low oil prices as economies adapt to the “new normal”
BUAEUL Index: UAE Composite US$ Bond Index (option adj. spread); CEMBMISS Index: Credit Suisse Middle East Bond Spread Over Swap
145
150
155
160
165
170
175
180
185
190
195
200
205
210
215
220
225
41
42
43
44
45
46
47
48
49
50
51
52
1-J
ul-
16
8-J
ul-
16
15
-Ju
l-1
6
22
-Ju
l-1
6
29
-Ju
l-1
6
5-A
ug-
16
12
-Au
g-1
6
19
-Au
g-1
6
26
-Au
g-1
6
2-S
ep
-16
9-S
ep
-16
16
-Se
p-1
6
23
-Se
p-1
6
30
-Se
p-1
6
Spre
ad in
bas
is p
oin
ts
Bre
nt
pri
ce in
US$
/bar
rel
Brent Price GCC Bond Spread (BUAEUL)
CS MidEast Bond Spread (CEMBMISS)
…but the correlation was less pronounced in Q3’16
Source: Bloomberg; NBAD
20
40
60
80
100
120
140
160
20
40
60
80
100
120
140
160
31
-De
c-1
3
31
-Mar
-14
30
-Ju
n-1
4
30
-Se
p-1
4
31
-De
c-1
4
31
-Mar
-15
30
-Ju
n-1
5
30
-Se
p-1
5
31
-De
c-1
5
31
-Mar
-16
30
-Ju
n-1
6
30
-Se
p-1
6
Brent Price GCC Bond Spread (BUAEUL)
GCC credit spreads become a clear Oil play of late …
Chart on a rebased scale starting 1-Jan-2014,on a scale of 100 to observe the correlation
Indeed GCC credit spreads tightened significantly in July even though oil prices fell. This shows that investors have confidence on the credit
quality of GCC issuers despite oil remaining below $50
77
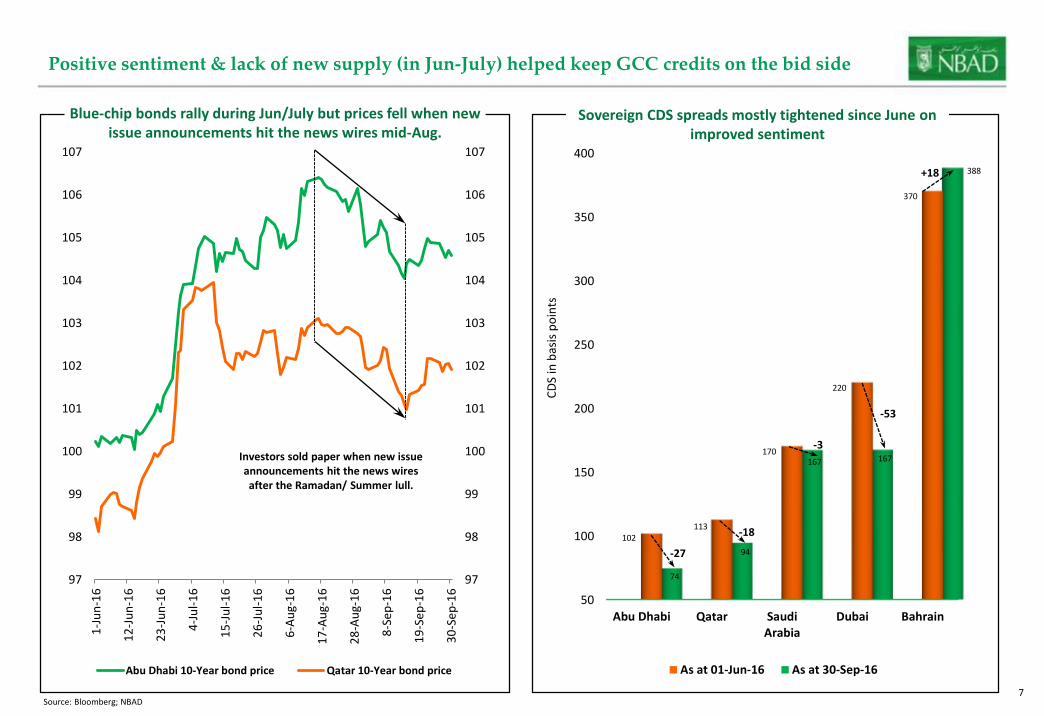
Positive sentiment & lack of new supply (in Jun-July) helped keep GCC credits on the bid side
Source: Bloomberg; NBAD
97
98
99
100
101
102
103
104
105
106
107
97
98
99
100
101
102
103
104
105
106
107
1-J
un
-16
12
-Ju
n-1
6
23
-Ju
n-1
6
4-J
ul-
16
15
-Ju
l-1
6
26
-Ju
l-1
6
6-A
ug-
16
17
-Au
g-1
6
28
-Au
g-1
6
8-S
ep
-16
19
-Se
p-1
6
30
-Se
p-1
6
Abu Dhabi 10-Year bond price Qatar 10-Year bond price
Blue-chip bonds rally during Jun/July but prices fell when new issue announcements hit the news wires mid-Aug.
Investors sold paper when new issue announcements hit the news wires after the Ramadan/ Summer lull.
50
100
150
200
250
300
350
400
Abu Dhabi Qatar SaudiArabia
Dubai Bahrain
CD
S in
bas
is p
oin
ts
As at 01-Jun-16 As at 30-Sep-16
Sovereign CDS spreads mostly tightened since June on improved sentiment
102113
170
220
370
74
94
167 167
388
-27
-18
-3
-53
+18
88
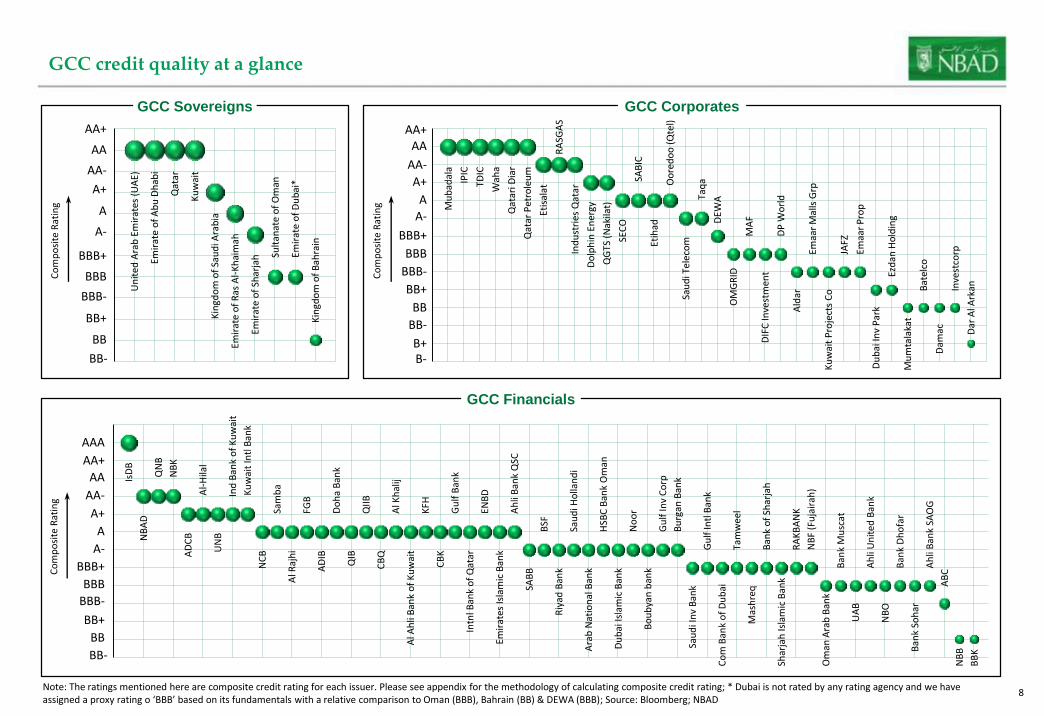
GCC credit quality at a glance
Note: The ratings mentioned here are composite credit rating for each issuer. Please see appendix for the methodology of calculating composite credit rating; * Dubai is not rated by any rating agency and we have assigned a proxy rating o ‘BBB’ based on its fundamentals with a relative comparison to Oman (BBB), Bahrain (BB) & DEWA (BBB); Source: Bloomberg; NBAD
Un
ited
Ara
b E
mir
ates
(U
AE)
Emir
ate
of
Ab
u D
hab
i
Qat
ar
Ku
wai
t
Kin
gdo
m o
f Sa
ud
i Ara
bia
Emir
ate
of
Ras
Al-
Kh
aim
ah
Emir
ate
of
Shar
jah Su
ltan
ate
of
Om
an
Emir
ate
of
Du
bai
*
Kin
gdo
m o
f B
ahra
in
4
5
6
7
8
9
10
11
12
13
14
15
Co
mp
osi
te R
atin
g
AA+
AA
AA-
A+
A
A-
BBB+
BBB
BBB-
BB+
BB
Mu
bad
ala
IPIC
TDIC
Wah
a
Qat
ari D
iar
Qat
ar P
etro
leu
m
Etis
alat
RA
SGA
S
Ind
ust
ries
Qat
ar
Do
lph
in E
ner
gy
QG
TS (
Nak
ilat)
SEC
O
SAB
IC
Etih
ad
Oo
red
oo
(Q
tel)
Sau
di T
elec
om
Taq
a
DEW
A
OM
GR
ID
MA
F
DIF
C In
vest
men
t
DP
Wo
rld
Ald
ar
Emaa
r M
alls
Grp
Ku
wai
t P
roje
cts
Co
JAFZ
Emaa
r P
rop
Du
bai
Inv
Par
k
Ezd
an H
old
ing
Mu
mta
laka
t
Bat
elco
Dam
ac
Inve
stco
rp
Dar
Al A
rkan
2
3
4
5
6
7
8
9
10
11
12
13
14
15
Co
mp
osi
te R
atin
g
AA
AA-
A+
A
A-
BBB+
BBB
BBB-
BB+
BB
BB-
B+
AA+
B-
IsD
B
NB
AD
QN
B
NB
K
AD
CB
Al-
Hila
l
UN
B
Ind
Ban
k o
f K
uw
ait
Ku
wai
t In
tl B
ank
NC
B
Sam
ba
Al R
ajh
i
FGB
AD
IB
Do
ha
Ban
k
QIB
QII
B
CB
Q
Al K
hal
ij
Al A
hli
Ban
k o
f K
uw
ait
KFH
CB
K
Gu
lf B
ank
Intn
l Ban
k o
f Q
atar
ENB
D
Emir
ates
Isla
mic
Ban
k
Ah
li B
ank
QSC
SAB
B
BSF
Riy
ad B
ank
Sau
di H
olla
nd
i
Ara
b N
atio
nal
Ban
k
HSB
C B
ank
Om
an
Du
bai
Isla
mic
Ban
k
No
or
Bo
ub
yan
ban
k
Gu
lf In
v C
orp
Bu
rgan
Ban
k
Sau
di I
nv
Ban
k
Gu
lf In
tl B
ank
Co
m B
ank
of
Du
bai
Tam
wee
l
Mas
hre
q
Ban
k o
f Sh
arja
h
Shar
jah
Isla
mic
Ban
k
RA
KB
AN
K
NB
F (F
uja
irah
)
Om
an A
rab
Ban
k
Ban
k M
usc
at
UA
B
Ah
li U
nit
ed B
ank
NB
O
Ban
k D
ho
far
Ban
k So
har
Ah
li B
ank
SAO
G
AB
C
NB
B
BB
K4
5
6
7
8
9
10
11
12
13
14
15
16
17
Co
mp
osi
te R
atin
g
AAA
AA+
AA
AA-
A+
A
A-
BBB+
BBB
BBB-
BB+
BB
GCC Sovereigns GCC Corporates
GCC Financials
BB-
BB-
99
GCC sovereign credit ratings and CDS spreads versus peers
Bahrain
Turkey
Russia
Indonesia
India
Dubai*
Spain
Malaysia
Italy
Poland
Kingdom of Saudi Arabia (KSA)
China
Japan
South Korea
Abu Dhabi
Qatar
UKFrance
Austria
Belgium
Hong Kong
0
25
50
75
100
125
150
175
200
225
250
275
300
325
350
375
400
CD
S (b
ps)
AA+ AA AA- A+ A A-AAA BBB BBB-BBB+ BB+ BB
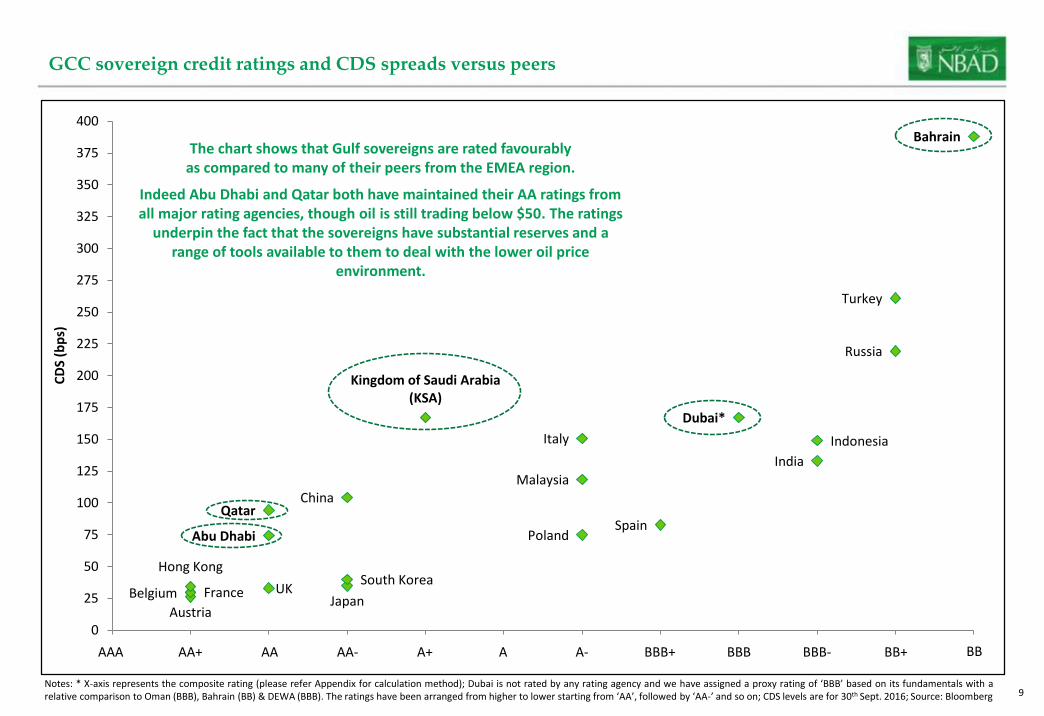
The chart shows that Gulf sovereigns are rated favourably as compared to many of their peers from the EMEA region.
Notes: * X-axis represents the composite rating (please refer Appendix for calculation method); Dubai is not rated by any rating agency and we have assigned a proxy rating of ‘BBB’ based on its fundamentals with arelative comparison to Oman (BBB), Bahrain (BB) & DEWA (BBB). The ratings have been arranged from higher to lower starting from ‘AA’, followed by ‘AA-’ and so on; CDS levels are for 30th Sept. 2016; Source: Bloomberg
Indeed Abu Dhabi and Qatar both have maintained their AA ratings from all major rating agencies, though oil is still trading below $50. The ratings
underpin the fact that the sovereigns have substantial reserves and a range of tools available to them to deal with the lower oil price
environment.
1010
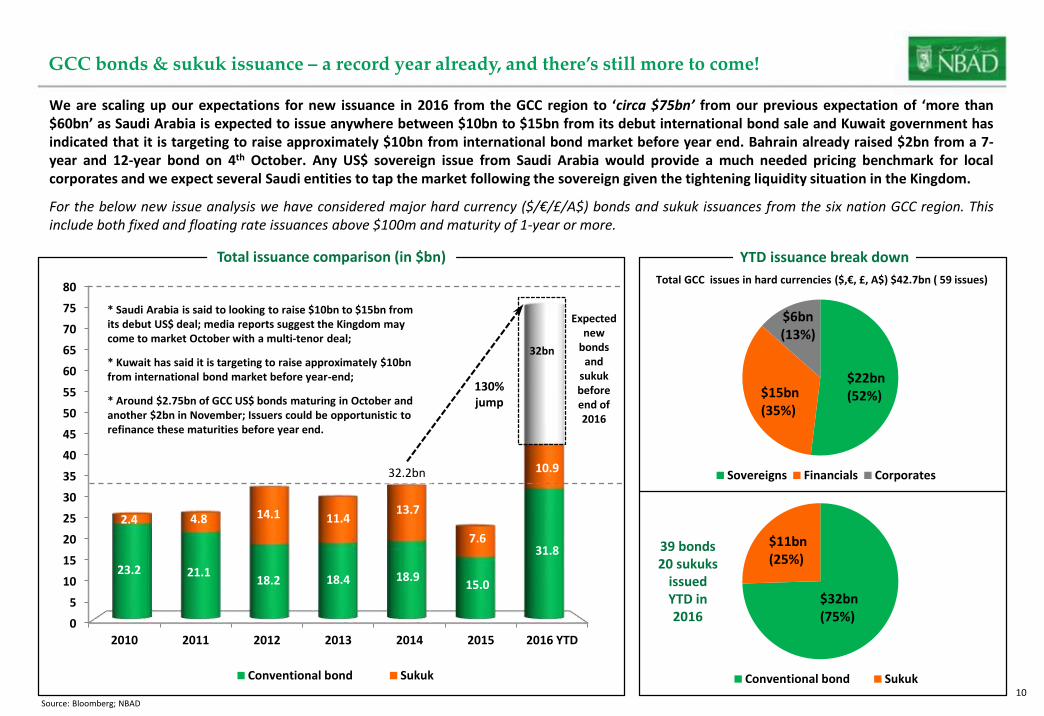
GCC bonds & sukuk issuance – a record year already, and there’s still more to come!
Source: Bloomberg; NBAD
We are scaling up our expectations for new issuance in 2016 from the GCC region to ‘circa $75bn’ from our previous expectation of ‘more than$60bn’ as Saudi Arabia is expected to issue anywhere between $10bn to $15bn from its debut international bond sale and Kuwait government hasindicated that it is targeting to raise approximately $10bn from international bond market before year end. Bahrain already raised $2bn from a 7-year and 12-year bond on 4th October. Any US$ sovereign issue from Saudi Arabia would provide a much needed pricing benchmark for localcorporates and we expect several Saudi entities to tap the market following the sovereign given the tightening liquidity situation in the Kingdom.
For the below new issue analysis we have considered major hard currency ($/€/£/A$) bonds and sukuk issuances from the six nation GCC region. Thisinclude both fixed and floating rate issuances above $100m and maturity of 1-year or more.
0
5
10
15
20
25
30
35
40
45
50
55
60
65
70
75
80
2010 2011 2012 2013 2014 2015 2016 YTD
23.2 21.118.2 18.4 18.9
15.0
31.8
2.4 4.8 14.1 11.413.7
7.6
10.9
Conventional bond Sukuk
Total issuance comparison (in $bn)
32bn
130%jump
32.2bn
Expected new
bonds and
sukuk before end of 2016
* Saudi Arabia is said to looking to raise $10bn to $15bn from its debut US$ deal; media reports suggest the Kingdom may come to market October with a multi-tenor deal;
* Kuwait has said it is targeting to raise approximately $10bn from international bond market before year-end;
* Around $2.75bn of GCC US$ bonds maturing in October and another $2bn in November; Issuers could be opportunistic to refinance these maturities before year end.
$22bn(52%)$15bn
(35%)
$6bn(13%)
Sovereigns Financials Corporates
Total GCC issues in hard currencies ($,€, £, A$) $42.7bn ( 59 issues)
YTD issuance break down
$32bn(75%)
$11bn(25%)
Conventional bond Sukuk
39 bonds20 sukuks
issuedYTD in2016
1111
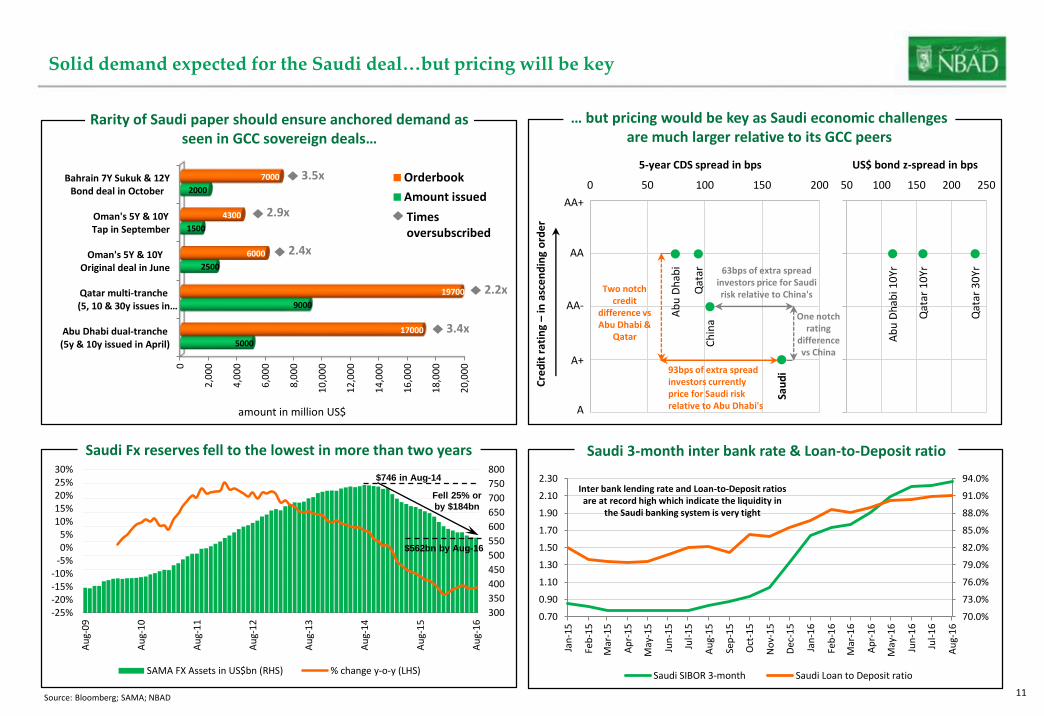
Solid demand expected for the Saudi deal…but pricing will be key
Ab
u D
hab
i
Qat
arC
hin
a
Sau
di
0
1
2
3
4
0 50 100 150 200
Ab
u D
hab
i 10
Yr
Qat
ar 1
0Yr
Qat
ar 3
0Yr
50 100 150 200 250
AA+
AA
AA-
A+
A
… but pricing would be key as Saudi economic challenges are much larger relative to its GCC peers
Cre
dit
rat
ing
–in
asc
en
din
g o
rde
r
5-year CDS spread in bps US$ bond z-spread in bps
Two notch credit
difference vs Abu Dhabi &
Qatar
One notch rating
difference vs China
93bps of extra spreadinvestors currentlyprice for Saudi riskrelative to Abu Dhabi's
63bps of extra spread investors price for Saudi risk relative to China's
0
2,0
00
4,0
00
6,0
00
8,0
00
10
,00
0
12
,00
0
14
,00
0
16
,00
0
18
,00
0
20
,00
0
Abu Dhabi dual-tranche(5y & 10y issued in April)
Qatar multi-tranche(5, 10 & 30y issues in…
Oman's 5Y & 10YOriginal deal in June
Oman's 5Y & 10YTap in September
Bahrain 7Y Sukuk & 12YBond deal in October
5000
9000
2500
1500
2000
17000
19700
6000
4300
7000
amount in million US$
Orderbook
Amount issued
Rarity of Saudi paper should ensure anchored demand as seen in GCC sovereign deals…
Timesoversubscribed
2.9x
2.4x
2.2x
3.4x
3.5x
Saudi Fx reserves fell to the lowest in more than two years
-25%-20%-15%-10%
-5%0%5%
10%15%20%25%30%
300
350
400
450
500
550
600
650
700
750
800A
ug-
16
Au
g-1
5
Au
g-1
4
Au
g-1
3
Au
g-1
2
Au
g-1
1
Au
g-1
0
Au
g-0
9
SAMA FX Assets in US$bn (RHS) % change y-o-y (LHS)
$746 in Aug-14
$562bn by Aug-16
Fell 25% or
by $184bn
70.0%
73.0%
76.0%
79.0%
82.0%
85.0%
88.0%
91.0%
94.0%
0.70
0.90
1.10
1.30
1.50
1.70
1.90
2.10
2.30
Jan
-15
Feb
-15
Mar
-15
Ap
r-1
5
May
-15
Jun
-15
Jul-
15
Au
g-1
5
Sep
-15
Oct
-15
No
v-1
5
Dec
-15
Jan
-16
Feb
-16
Mar
-16
Ap
r-1
6
May
-16
Jun
-16
Jul-
16
Au
g-1
6
Saudi SIBOR 3-month Saudi Loan to Deposit ratio
Saudi 3-month inter bank rate & Loan-to-Deposit ratio
Inter bank lending rate and Loan-to-Deposit ratios are at record high which indicate the liquidity in
the Saudi banking system is very tight
Source: Bloomberg; SAMA; NBAD
1212
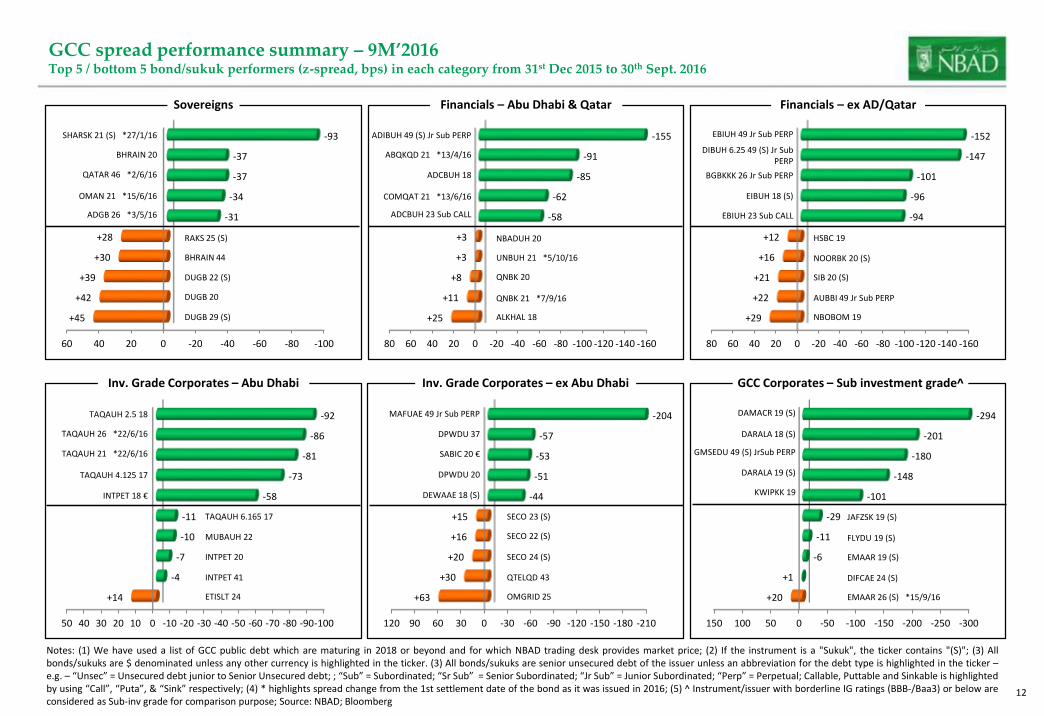
GCC spread performance summary – 9M’2016Top 5 / bottom 5 bond/sukuk performers (z-spread, bps) in each category from 31st Dec 2015 to 30th Sept. 2016
Notes: (1) We have used a list of GCC public debt which are maturing in 2018 or beyond and for which NBAD trading desk provides market price; (2) If the instrument is a "Sukuk", the ticker contains "(S)"; (3) Allbonds/sukuks are $ denominated unless any other currency is highlighted in the ticker. (3) All bonds/sukuks are senior unsecured debt of the issuer unless an abbreviation for the debt type is highlighted in the ticker –e.g. – “Unsec” = Unsecured debt junior to Senior Unsecured debt; ; “Sub” = Subordinated; “Sr Sub” = Senior Subordinated; “Jr Sub” = Junior Subordinated; “Perp” = Perpetual; Callable, Puttable and Sinkable is highlightedby using “Call”, “Puta”, & “Sink” respectively; (4) * highlights spread change from the 1st settlement date of the bond as it was issued in 2016; (5) ^ Instrument/issuer with borderline IG ratings (BBB-/Baa3) or below areconsidered as Sub-inv grade for comparison purpose; Source: NBAD; Bloomberg
-100-80-60-40-200204060
+45
+42
+39
+30
+28
-31
-34
-37
-37
-93
Sovereigns
SHARSK 21 (S) *27/1/16
BHRAIN 20
QATAR 46 *2/6/16
OMAN 21 *15/6/16
ADGB 26 *3/5/16
RAKS 25 (S)
BHRAIN 44
DUGB 22 (S)
DUGB 20
DUGB 29 (S)
-160-140-120-100-80-60-40-20020406080
+25
+11
+8
+3
+3
-58
-62
-85
-91
-155
Financials – Abu Dhabi & Qatar
ADIBUH 49 (S) Jr Sub PERP
ABQKQD 21 *13/4/16
ADCBUH 18
COMQAT 21 *13/6/16
ADCBUH 23 Sub CALL
NBADUH 20
UNBUH 21 *5/10/16
QNBK 20
QNBK 21 *7/9/16
ALKHAL 18
-160-140-120-100-80-60-40-20020406080
+29
+22
+21
+16
+12
-94
-96
-101
-147
-152
Financials – ex AD/Qatar
EBIUH 49 Jr Sub PERP
DIBUH 6.25 49 (S) Jr Sub PERP
BGBKKK 26 Jr Sub PERP
EIBUH 18 (S)
EBIUH 23 Sub CALL
HSBC 19
NOORBK 20 (S)
SIB 20 (S)
AUBBI 49 Jr Sub PERP
NBOBOM 19
-100-90-80-70-60-50-40-30-20-1001020304050
+14
-4
-7
-10
-11
-58
-73
-81
-86
-92
Inv. Grade Corporates – Abu Dhabi
TAQAUH 2.5 18
TAQAUH 26 *22/6/16
TAQAUH 21 *22/6/16
TAQAUH 4.125 17
INTPET 18 €
TAQAUH 6.165 17
MUBAUH 22
INTPET 20
INTPET 41
ETISLT 24
-210-180-150-120-90-60-300306090120
+63
+30
+20
+16
+15
-44
-51
-53
-57
-204
Inv. Grade Corporates – ex Abu Dhabi
MAFUAE 49 Jr Sub PERP
DPWDU 37
SABIC 20 €
DPWDU 20
DEWAAE 18 (S)
SECO 23 (S)
SECO 22 (S)
SECO 24 (S)
QTELQD 43
OMGRID 25
-300-250-200-150-100-50050100150
+20
+1
-6
-11
-29
-101
-148
-180
-201
-294
GCC Corporates – Sub investment grade^
DAMACR 19 (S)
DARALA 18 (S)
GMSEDU 49 (S) JrSub PERP
DARALA 19 (S)
KWIPKK 19
JAFZSK 19 (S)
FLYDU 19 (S)
DIFCAE 24 (S)
EMAAR 26 (S) *15/9/16
EMAAR 19 (S)
1313
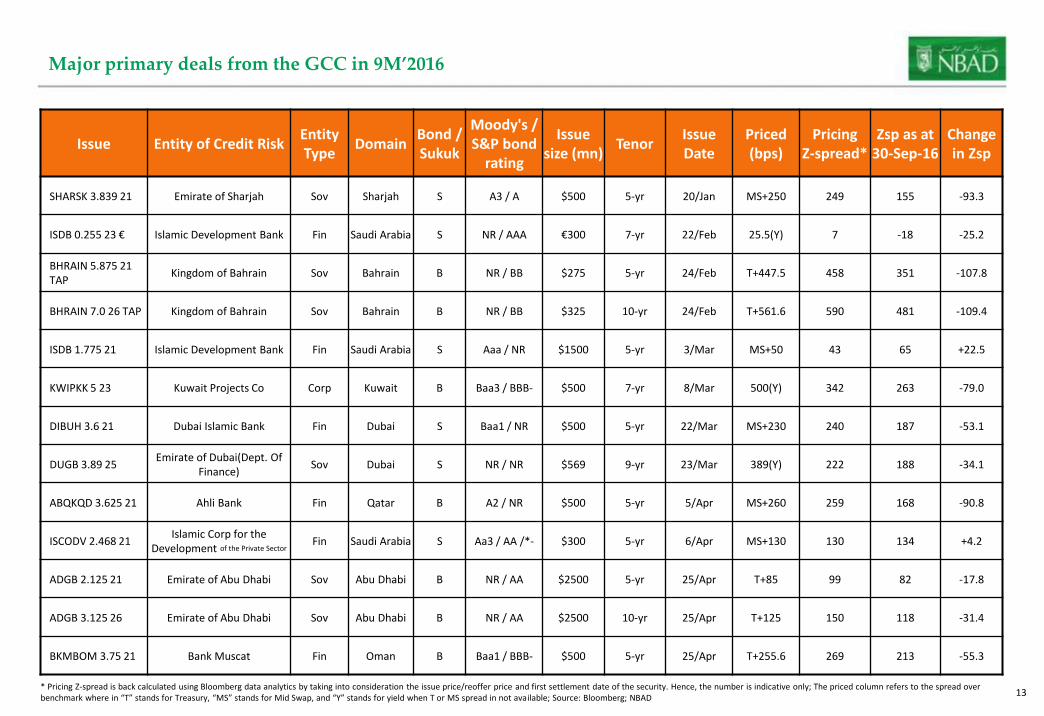
Major primary deals from the GCC in 9M’2016
Issue Entity of Credit RiskEntityType
DomainBond / Sukuk
Moody's / S&P bond
rating
Issuesize (mn)
TenorIssue Date
Priced (bps)
PricingZ-spread*
Zsp as at30-Sep-16
Change in Zsp
SHARSK 3.839 21 Emirate of Sharjah Sov Sharjah S A3 / A $500 5-yr 20/Jan MS+250 249 155 -93.3
ISDB 0.255 23 € Islamic Development Bank Fin Saudi Arabia S NR / AAA €300 7-yr 22/Feb 25.5(Y) 7 -18 -25.2
BHRAIN 5.875 21 TAP
Kingdom of Bahrain Sov Bahrain B NR / BB $275 5-yr 24/Feb T+447.5 458 351 -107.8
BHRAIN 7.0 26 TAP Kingdom of Bahrain Sov Bahrain B NR / BB $325 10-yr 24/Feb T+561.6 590 481 -109.4
ISDB 1.775 21 Islamic Development Bank Fin Saudi Arabia S Aaa / NR $1500 5-yr 3/Mar MS+50 43 65 +22.5
KWIPKK 5 23 Kuwait Projects Co Corp Kuwait B Baa3 / BBB- $500 7-yr 8/Mar 500(Y) 342 263 -79.0
DIBUH 3.6 21 Dubai Islamic Bank Fin Dubai S Baa1 / NR $500 5-yr 22/Mar MS+230 240 187 -53.1
DUGB 3.89 25Emirate of Dubai(Dept. Of
Finance)Sov Dubai S NR / NR $569 9-yr 23/Mar 389(Y) 222 188 -34.1
ABQKQD 3.625 21 Ahli Bank Fin Qatar B A2 / NR $500 5-yr 5/Apr MS+260 259 168 -90.8
ISCODV 2.468 21Islamic Corp for the
Development of the Private SectorFin Saudi Arabia S Aa3 / AA /*- $300 5-yr 6/Apr MS+130 130 134 +4.2
ADGB 2.125 21 Emirate of Abu Dhabi Sov Abu Dhabi B NR / AA $2500 5-yr 25/Apr T+85 99 82 -17.8
ADGB 3.125 26 Emirate of Abu Dhabi Sov Abu Dhabi B NR / AA $2500 10-yr 25/Apr T+125 150 118 -31.4
BKMBOM 3.75 21 Bank Muscat Fin Oman B Baa1 / BBB- $500 5-yr 25/Apr T+255.6 269 213 -55.3
* Pricing Z-spread is back calculated using Bloomberg data analytics by taking into consideration the issue price/reoffer price and first settlement date of the security. Hence, the number is indicative only; The priced column refers to the spread over benchmark where in “T” stands for Treasury, “MS” stands for Mid Swap, and “Y” stands for yield when T or MS spread in not available; Source: Bloomberg; NBAD
1414
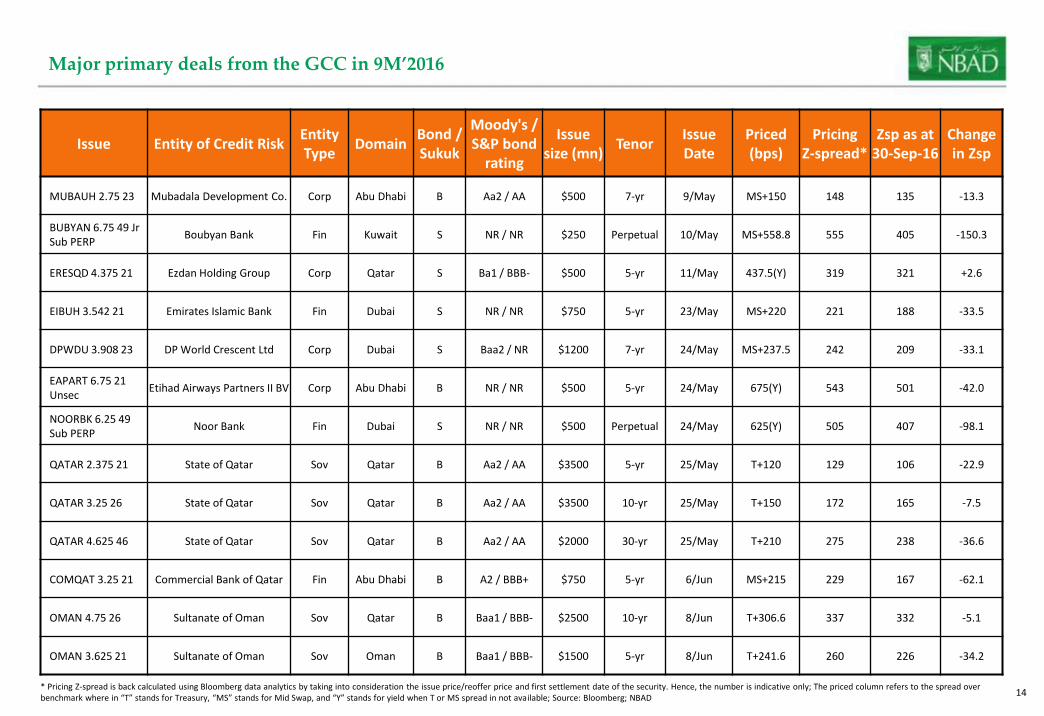
Major primary deals from the GCC in 9M’2016
Issue Entity of Credit RiskEntityType
DomainBond / Sukuk
Moody's / S&P bond
rating
Issuesize (mn)
TenorIssue Date
Priced (bps)
PricingZ-spread*
Zsp as at30-Sep-16
Change in Zsp
MUBAUH 2.75 23 Mubadala Development Co. Corp Abu Dhabi B Aa2 / AA $500 7-yr 9/May MS+150 148 135 -13.3
BUBYAN 6.75 49 Jr Sub PERP
Boubyan Bank Fin Kuwait S NR / NR $250 Perpetual 10/May MS+558.8 555 405 -150.3
ERESQD 4.375 21 Ezdan Holding Group Corp Qatar S Ba1 / BBB- $500 5-yr 11/May 437.5(Y) 319 321 +2.6
EIBUH 3.542 21 Emirates Islamic Bank Fin Dubai S NR / NR $750 5-yr 23/May MS+220 221 188 -33.5
DPWDU 3.908 23 DP World Crescent Ltd Corp Dubai S Baa2 / NR $1200 7-yr 24/May MS+237.5 242 209 -33.1
EAPART 6.75 21 Unsec
Etihad Airways Partners II BV Corp Abu Dhabi B NR / NR $500 5-yr 24/May 675(Y) 543 501 -42.0
NOORBK 6.25 49Sub PERP
Noor Bank Fin Dubai S NR / NR $500 Perpetual 24/May 625(Y) 505 407 -98.1
QATAR 2.375 21 State of Qatar Sov Qatar B Aa2 / AA $3500 5-yr 25/May T+120 129 106 -22.9
QATAR 3.25 26 State of Qatar Sov Qatar B Aa2 / AA $3500 10-yr 25/May T+150 172 165 -7.5
QATAR 4.625 46 State of Qatar Sov Qatar B Aa2 / AA $2000 30-yr 25/May T+210 275 238 -36.6
COMQAT 3.25 21 Commercial Bank of Qatar Fin Abu Dhabi B A2 / BBB+ $750 5-yr 6/Jun MS+215 229 167 -62.1
OMAN 4.75 26 Sultanate of Oman Sov Qatar B Baa1 / BBB- $2500 10-yr 8/Jun T+306.6 337 332 -5.1
OMAN 3.625 21 Sultanate of Oman Sov Oman B Baa1 / BBB- $1500 5-yr 8/Jun T+241.6 260 226 -34.2
* Pricing Z-spread is back calculated using Bloomberg data analytics by taking into consideration the issue price/reoffer price and first settlement date of the security. Hence, the number is indicative only; The priced column refers to the spread over benchmark where in “T” stands for Treasury, “MS” stands for Mid Swap, and “Y” stands for yield when T or MS spread in not available; Source: Bloomberg; NBAD
1515
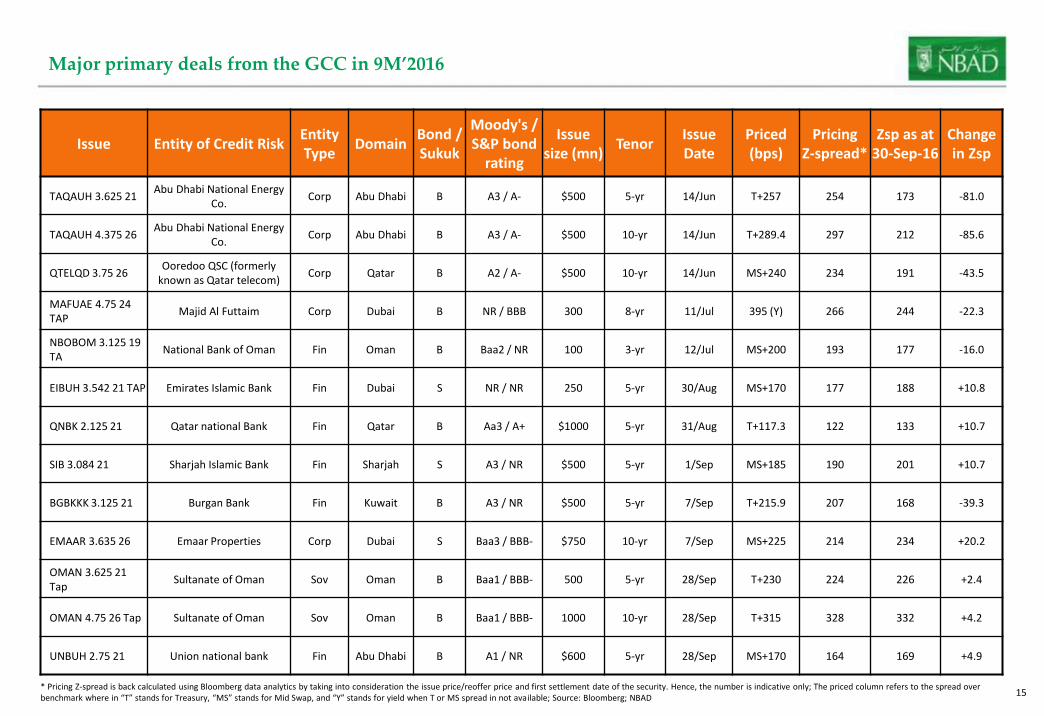
Major primary deals from the GCC in 9M’2016
Issue Entity of Credit RiskEntityType
DomainBond / Sukuk
Moody's / S&P bond
rating
Issuesize (mn)
TenorIssue Date
Priced (bps)
PricingZ-spread*
Zsp as at30-Sep-16
Change in Zsp
TAQAUH 3.625 21Abu Dhabi National Energy
Co.Corp Abu Dhabi B A3 / A- $500 5-yr 14/Jun T+257 254 173 -81.0
TAQAUH 4.375 26Abu Dhabi National Energy
Co.Corp Abu Dhabi B A3 / A- $500 10-yr 14/Jun T+289.4 297 212 -85.6
QTELQD 3.75 26Ooredoo QSC (formerly
known as Qatar telecom)Corp Qatar B A2 / A- $500 10-yr 14/Jun MS+240 234 191 -43.5
MAFUAE 4.75 24 TAP
Majid Al Futtaim Corp Dubai B NR / BBB 300 8-yr 11/Jul 395 (Y) 266 244 -22.3
NBOBOM 3.125 19 TA
National Bank of Oman Fin Oman B Baa2 / NR 100 3-yr 12/Jul MS+200 193 177 -16.0
EIBUH 3.542 21 TAP Emirates Islamic Bank Fin Dubai S NR / NR 250 5-yr 30/Aug MS+170 177 188 +10.8
QNBK 2.125 21 Qatar national Bank Fin Qatar B Aa3 / A+ $1000 5-yr 31/Aug T+117.3 122 133 +10.7
SIB 3.084 21 Sharjah Islamic Bank Fin Sharjah S A3 / NR $500 5-yr 1/Sep MS+185 190 201 +10.7
BGBKKK 3.125 21 Burgan Bank Fin Kuwait B A3 / NR $500 5-yr 7/Sep T+215.9 207 168 -39.3
EMAAR 3.635 26 Emaar Properties Corp Dubai S Baa3 / BBB- $750 10-yr 7/Sep MS+225 214 234 +20.2
OMAN 3.625 21 Tap
Sultanate of Oman Sov Oman B Baa1 / BBB- 500 5-yr 28/Sep T+230 224 226 +2.4
OMAN 4.75 26 Tap Sultanate of Oman Sov Oman B Baa1 / BBB- 1000 10-yr 28/Sep T+315 328 332 +4.2
UNBUH 2.75 21 Union national bank Fin Abu Dhabi B A1 / NR $600 5-yr 28/Sep MS+170 164 169 +4.9
* Pricing Z-spread is back calculated using Bloomberg data analytics by taking into consideration the issue price/reoffer price and first settlement date of the security. Hence, the number is indicative only; The priced column refers to the spread over benchmark where in “T” stands for Treasury, “MS” stands for Mid Swap, and “Y” stands for yield when T or MS spread in not available; Source: Bloomberg; NBAD
1616
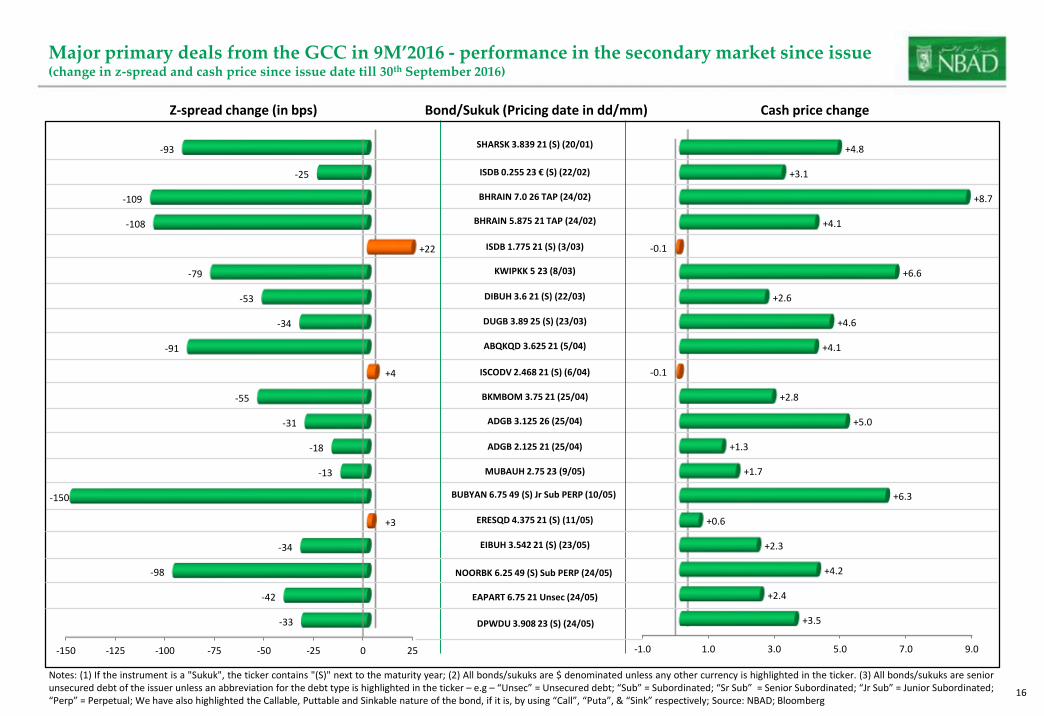
Major primary deals from the GCC in 9M’2016 - performance in the secondary market since issue(change in z-spread and cash price since issue date till 30th September 2016)
-1.0 1.0 3.0 5.0 7.0 9.0
+3.5
+2.4
+4.2
+2.3
+0.6
+6.3
+1.7
+1.3
+5.0
+2.8
-0.1
+4.1
+4.6
+2.6
+6.6
-0.1
+4.1
+8.7
+3.1
+4.8
Notes: (1) If the instrument is a "Sukuk", the ticker contains "(S)" next to the maturity year; (2) All bonds/sukuks are $ denominated unless any other currency is highlighted in the ticker. (3) All bonds/sukuks are seniorunsecured debt of the issuer unless an abbreviation for the debt type is highlighted in the ticker – e.g – “Unsec” = Unsecured debt; “Sub” = Subordinated; “Sr Sub” = Senior Subordinated; “Jr Sub” = Junior Subordinated;“Perp” = Perpetual; We have also highlighted the Callable, Puttable and Sinkable nature of the bond, if it is, by using “Call”, “Puta”, & “Sink” respectively; Source: NBAD; Bloomberg
Z-spread change (in bps) Cash price change
-150 -125 -100 -75 -50 -25 0 25
-33
-42
-98
-34
+3
-150
-13
-18
-31
-55
+4
-91
-34
-53
-79
+22
-108
-109
-25
-93
Bond/Sukuk (Pricing date in dd/mm)
SHARSK 3.839 21 (S) (20/01)
ISDB 0.255 23 € (S) (22/02)
BHRAIN 7.0 26 TAP (24/02)
BHRAIN 5.875 21 TAP (24/02)
KWIPKK 5 23 (8/03)
DIBUH 3.6 21 (S) (22/03)
ABQKQD 3.625 21 (5/04)
DUGB 3.89 25 (S) (23/03)
ISCODV 2.468 21 (S) (6/04)
ADGB 3.125 26 (25/04)
BKMBOM 3.75 21 (25/04)
ERESQD 4.375 21 (S) (11/05)
ADGB 2.125 21 (25/04)
MUBAUH 2.75 23 (9/05)
BUBYAN 6.75 49 (S) Jr Sub PERP (10/05)
NOORBK 6.25 49 (S) Sub PERP (24/05)
EIBUH 3.542 21 (S) (23/05)
ISDB 1.775 21 (S) (3/03)
EAPART 6.75 21 Unsec (24/05)
DPWDU 3.908 23 (S) (24/05)
1717
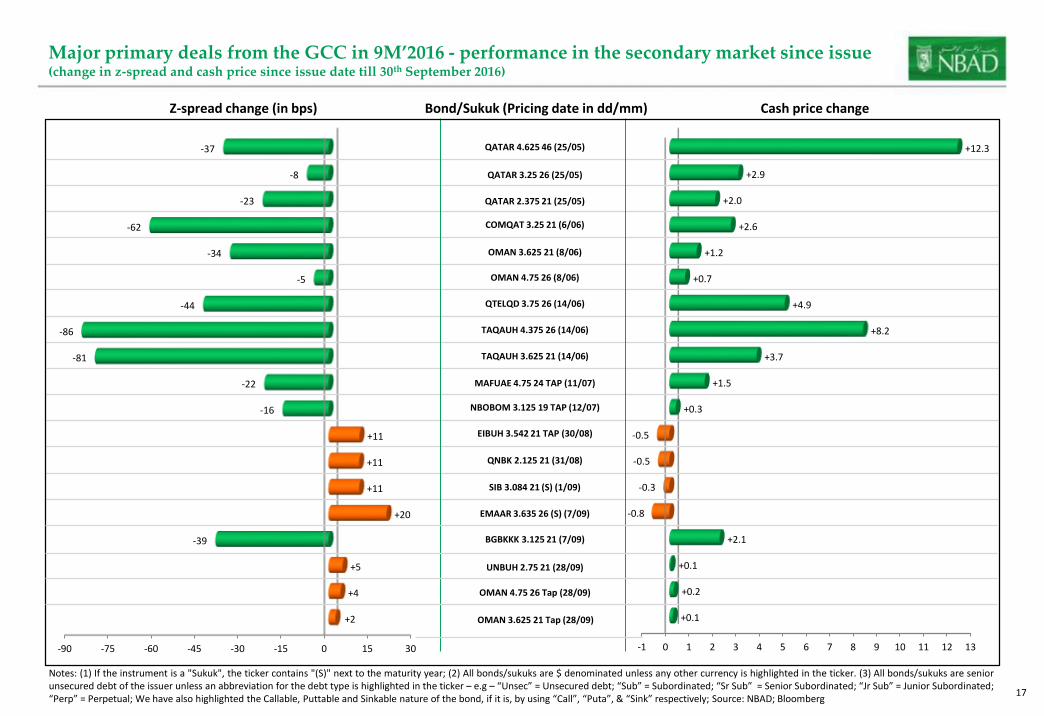
Major primary deals from the GCC in 9M’2016 - performance in the secondary market since issue(change in z-spread and cash price since issue date till 30th September 2016)
-1 0 1 2 3 4 5 6 7 8 9 10 11 12 13
+0.1
+0.2
+0.1
+2.1
-0.8
-0.3
-0.5
-0.5
+0.3
+1.5
+3.7
+8.2
+4.9
+0.7
+1.2
+2.6
+2.0
+2.9
+12.3
Notes: (1) If the instrument is a "Sukuk", the ticker contains "(S)" next to the maturity year; (2) All bonds/sukuks are $ denominated unless any other currency is highlighted in the ticker. (3) All bonds/sukuks are seniorunsecured debt of the issuer unless an abbreviation for the debt type is highlighted in the ticker – e.g – “Unsec” = Unsecured debt; “Sub” = Subordinated; “Sr Sub” = Senior Subordinated; “Jr Sub” = Junior Subordinated;“Perp” = Perpetual; We have also highlighted the Callable, Puttable and Sinkable nature of the bond, if it is, by using “Call”, “Puta”, & “Sink” respectively; Source: NBAD; Bloomberg
Z-spread change (in bps) Cash price change
-90 -75 -60 -45 -30 -15 0 15 30
+2
+4
+5
-39
+20
+11
+11
+11
-16
-22
-81
-86
-44
-5
-34
-62
-23
-8
-37
Bond/Sukuk (Pricing date in dd/mm)
QATAR 4.625 46 (25/05)
QATAR 3.25 26 (25/05)
QATAR 2.375 21 (25/05)
COMQAT 3.25 21 (6/06)
OMAN 4.75 26 (8/06)
QTELQD 3.75 26 (14/06)
TAQAUH 4.375 26 (14/06)
TAQAUH 3.625 21 (14/06)
NBOBOM 3.125 19 TAP (12/07)
MAFUAE 4.75 24 TAP (11/07)
EMAAR 3.635 26 (S) (7/09)
EIBUH 3.542 21 TAP (30/08)
QNBK 2.125 21 (31/08)
SIB 3.084 21 (S) (1/09)
UNBUH 2.75 21 (28/09)
BGBKKK 3.125 21 (7/09)
OMAN 3.625 21 (8/06)
OMAN 4.75 26 Tap (28/09)
OMAN 3.625 21 Tap (28/09)
1818
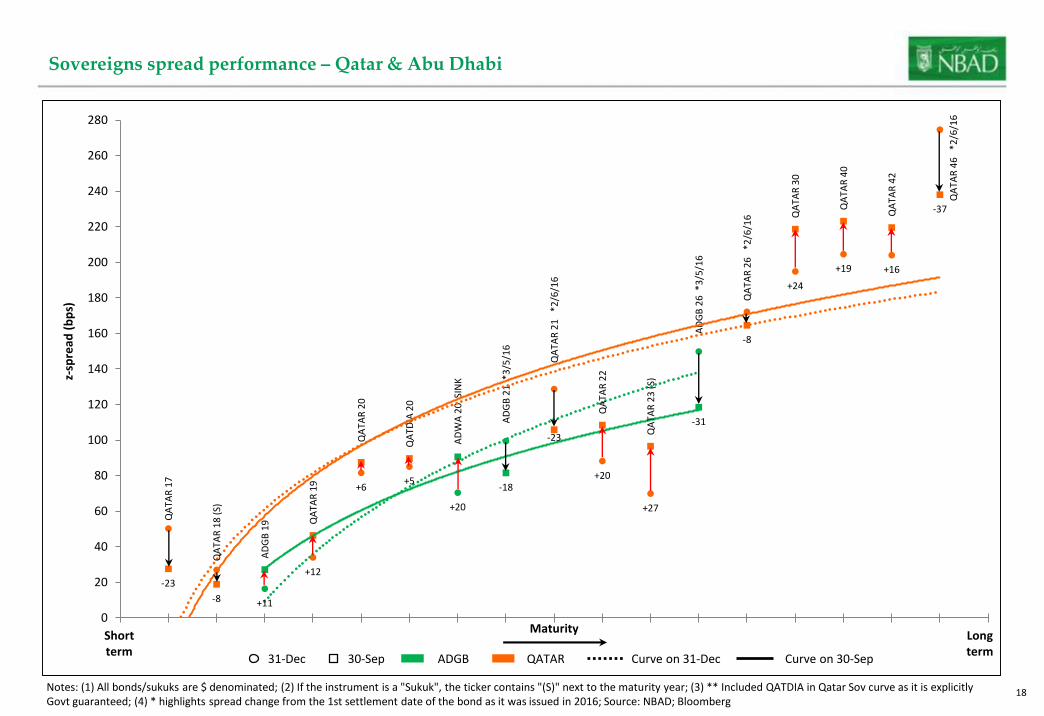
Sovereigns spread performance – Qatar & Abu Dhabi
AD
GB
19
AD
WA
20
SIN
K
AD
GB
21
*3
/5/1
6
AD
GB
26
*3
/5/1
6
QA
TAR
17
QA
TAR
18
(S)
QA
TAR
19
QA
TAR
20
QA
TDIA
20
QA
TAR
22
QA
TAR
23
(S)
QA
TAR
30
QA
TAR
40
QA
TAR
42
QA
TAR
21
*2
/6/1
6
QA
TAR
26
*2
/6/1
6
QA
TAR
46
*2
/6/1
6
+11
+20
-18
-31
-23
-8
+12
+6+5
+20
+27
+24
+19 +16
-23
-8
-37
0
20
40
60
80
100
120
140
160
180
200
220
240
260
280
z-sp
read
(b
ps)
Maturity
30-Sep31-Dec ADGB QATAR
Longterm
Shortterm
Notes: (1) All bonds/sukuks are $ denominated; (2) If the instrument is a "Sukuk", the ticker contains "(S)" next to the maturity year; (3) ** Included QATDIA in Qatar Sov curve as it is explicitly Govt guaranteed; (4) * highlights spread change from the 1st settlement date of the bond as it was issued in 2016; Source: NBAD; Bloomberg
Curve on 31-Dec Curve on 30-Sep
1919
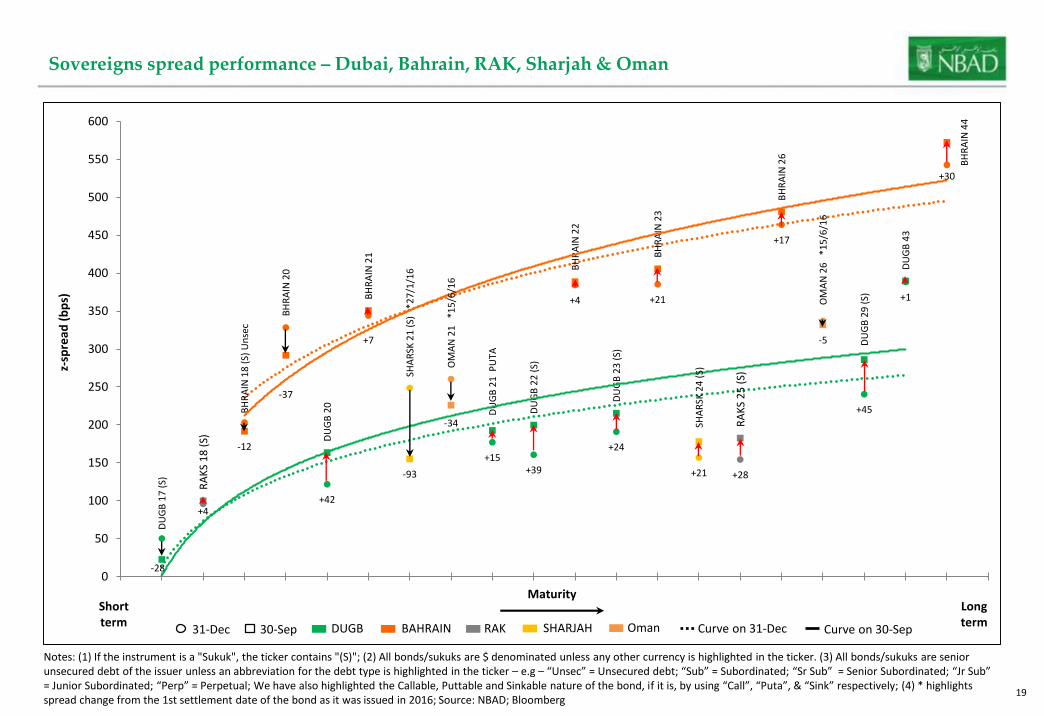
Sovereigns spread performance – Dubai, Bahrain, RAK, Sharjah & Oman
DU
GB
17
(S)
DU
GB
20
DU
GB
21
PU
TA
DU
GB
22
(S)
DU
GB
23
(S)
DU
GB
29
(S)
DU
GB
43
BH
RA
IN 1
8 (
S) U
nse
c
BH
RA
IN 2
0
BH
RA
IN 2
1
BH
RA
IN 2
2
BH
RA
IN 2
3
BH
RA
IN 2
6
BH
RA
IN 4
4
RA
KS
18
(S)
RA
KS
25
(S)
SHA
RSK
21
(S)
*2
7/1
/16
SHA
RSK
24
(S)
OM
AN
21
*1
5/6
/16
OM
AN
26
*1
5/6
/16
-28
+42
+15+39
+24
+45
+1
-12
-37
+7
+4 +21
+17
+30
+4
+28-93 +21
-34
-5
0
50
100
150
200
250
300
350
400
450
500
550
600
z-sp
read
(b
ps)
MaturityLongterm
Shortterm
Notes: (1) If the instrument is a "Sukuk", the ticker contains "(S)"; (2) All bonds/sukuks are $ denominated unless any other currency is highlighted in the ticker. (3) All bonds/sukuks are senior unsecured debt of the issuer unless an abbreviation for the debt type is highlighted in the ticker – e.g – “Unsec” = Unsecured debt; “Sub” = Subordinated; “Sr Sub” = Senior Subordinated; “Jr Sub” = Junior Subordinated; “Perp” = Perpetual; We have also highlighted the Callable, Puttable and Sinkable nature of the bond, if it is, by using “Call”, “Puta”, & “Sink” respectively; (4) * highlights spread change from the 1st settlement date of the bond as it was issued in 2016; Source: NBAD; Bloomberg
30-Sep31-Dec DUGB BAHRAIN Curve on 31-Dec Curve on 30-SepRAK SHARJAH Oman
2020
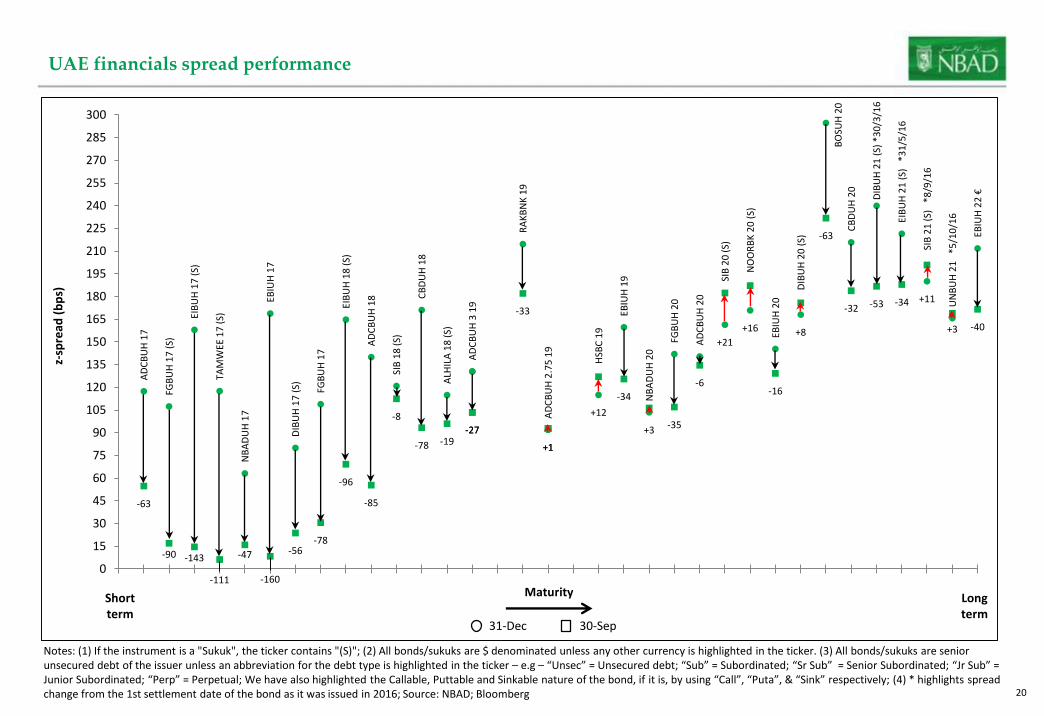
UAE financials spread performance
Notes: (1) If the instrument is a "Sukuk", the ticker contains "(S)"; (2) All bonds/sukuks are $ denominated unless any other currency is highlighted in the ticker. (3) All bonds/sukuks are senior unsecured debt of the issuer unless an abbreviation for the debt type is highlighted in the ticker – e.g – “Unsec” = Unsecured debt; “Sub” = Subordinated; “Sr Sub” = Senior Subordinated; “Jr Sub” = Junior Subordinated; “Perp” = Perpetual; We have also highlighted the Callable, Puttable and Sinkable nature of the bond, if it is, by using “Call”, “Puta”, & “Sink” respectively; (4) * highlights spread change from the 1st settlement date of the bond as it was issued in 2016; Source: NBAD; Bloomberg
AD
CB
UH
17
FGB
UH
17
(S)
EIB
UH
17
(S)
TAM
WEE
17
(S)
NB
AD
UH
17
EBIU
H 1
7
DIB
UH
17
(S)
FGB
UH
17
EIB
UH
18
(S)
AD
CB
UH
18
SIB
18
(S)
CB
DU
H 1
8
ALH
ILA
18
(S)
AD
CB
UH
3 1
9
RA
KB
NK
19
AD
CB
UH
2.7
5 1
9
HSB
C 1
9
EBIU
H 1
9
NB
AD
UH
20
FGB
UH
20
AD
CB
UH
20
SIB
20
(S)
NO
OR
BK
20
(S)
EBIU
H 2
0
DIB
UH
20
(S)
BO
SUH
20
C
BD
UH
20
DIB
UH
21
(S)
*3
0/3
/16
EIB
UH
21
(S)
*3
1/5
/16
SIB
21
(S)
*8
/9/1
6
UN
BU
H 2
1
*5/1
0/1
6
EBIU
H 2
2 €
-63
-90 -143
-111
-47
-160
-56-78
-96
-85
-8
-78 -19-27-27
-33
+1+1
+12
-34
+3 -35
-6
+21
+16
-16
+8
-63
-32 -53 -34 +11
+3 -40
0
15
30
45
60
75
90
105
120
135
150
165
180
195
210
225
240
255
270
285
300
z-sp
read
(b
ps)
Maturity Longterm
Shortterm
30-Sep31-Dec
2121
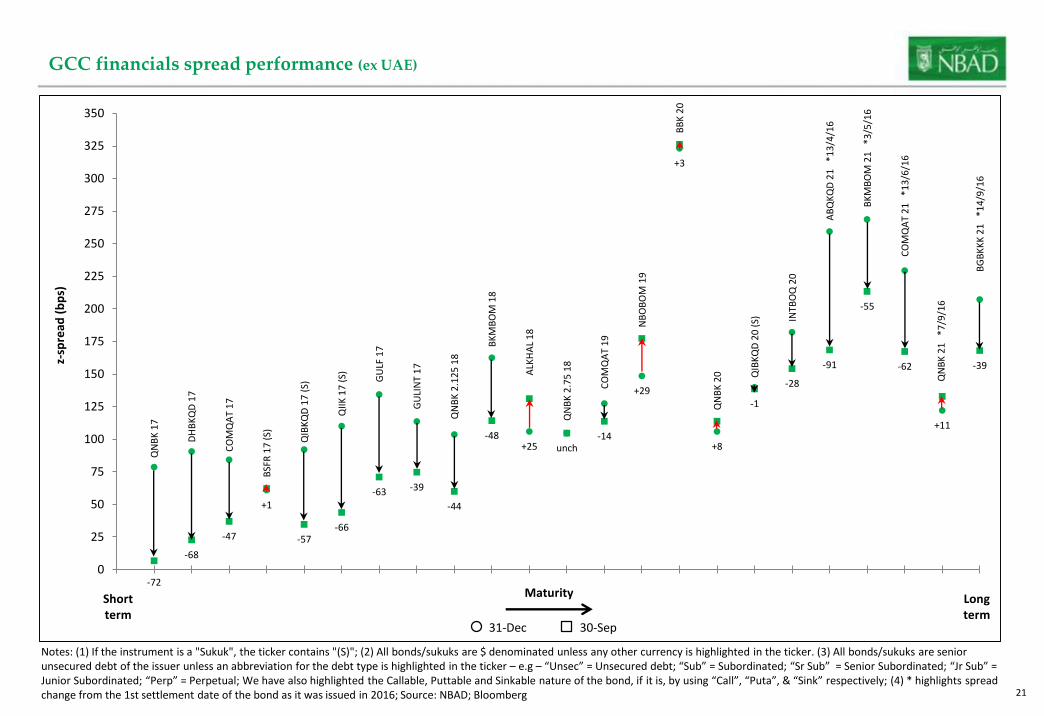
GCC financials spread performance (ex UAE)
Notes: (1) If the instrument is a "Sukuk", the ticker contains "(S)"; (2) All bonds/sukuks are $ denominated unless any other currency is highlighted in the ticker. (3) All bonds/sukuks are senior unsecured debt of the issuer unless an abbreviation for the debt type is highlighted in the ticker – e.g – “Unsec” = Unsecured debt; “Sub” = Subordinated; “Sr Sub” = Senior Subordinated; “Jr Sub” = Junior Subordinated; “Perp” = Perpetual; We have also highlighted the Callable, Puttable and Sinkable nature of the bond, if it is, by using “Call”, “Puta”, & “Sink” respectively; (4) * highlights spread change from the 1st settlement date of the bond as it was issued in 2016; Source: NBAD; Bloomberg
QN
BK
17
DH
BK
QD
17
CO
MQ
AT
17
BSF
R 1
7 (
S)
QIB
KQ
D 1
7 (
S)
QII
K 1
7 (
S)
GU
LF 1
7
GU
LIN
T 1
7
QN
BK
2.1
25
18
BK
MB
OM
18
ALK
HA
L 1
8
QN
BK
2.7
5 1
8
CO
MQ
AT
19
NB
OB
OM
19
BB
K 2
0
QN
BK
20
QIB
KQ
D 2
0 (
S)
INTB
OQ
20
AB
QK
QD
21
*1
3/4
/16
BK
MB
OM
21
*3
/5/1
6
CO
MQ
AT
21
*1
3/6
/16
QN
BK
21
*7
/9/1
6
BG
BK
KK
21
*1
4/9
/16
-72
-68
-47
+1
-57-66
-63 -39
-44
-48+25 unch
-14
+29
+3
+8
-1
-28
-91
-55
-62
+11
-39
0
25
50
75
100
125
150
175
200
225
250
275
300
325
350
z-sp
read
(b
ps)
Maturity Longterm
Shortterm
30-Sep31-Dec
2222
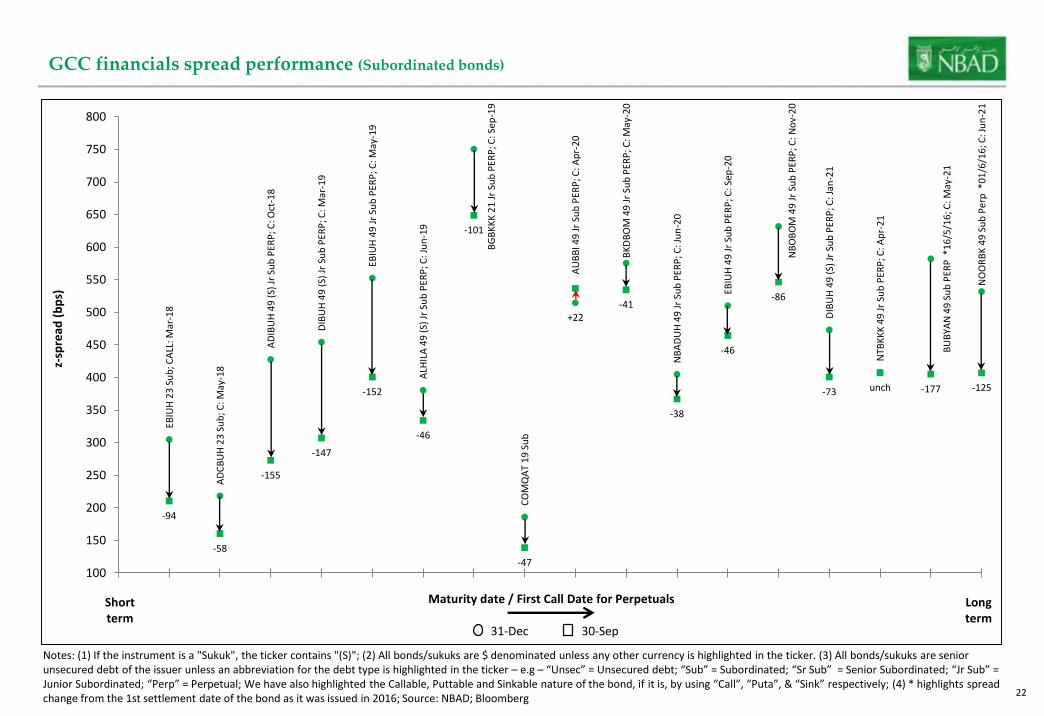
GCC financials spread performance (Subordinated bonds)
Notes: (1) If the instrument is a "Sukuk", the ticker contains "(S)"; (2) All bonds/sukuks are $ denominated unless any other currency is highlighted in the ticker. (3) All bonds/sukuks are senior unsecured debt of the issuer unless an abbreviation for the debt type is highlighted in the ticker – e.g – “Unsec” = Unsecured debt; “Sub” = Subordinated; “Sr Sub” = Senior Subordinated; “Jr Sub” = Junior Subordinated; “Perp” = Perpetual; We have also highlighted the Callable, Puttable and Sinkable nature of the bond, if it is, by using “Call”, “Puta”, & “Sink” respectively; (4) * highlights spread change from the 1st settlement date of the bond as it was issued in 2016; Source: NBAD; Bloomberg
EBIU
H 2
3 S
ub
; CA
LL: M
ar-1
8
AD
CB
UH
23
Su
b; C
: May
-18
AD
IBU
H 4
9 (
S) J
r Su
b P
ERP
; C: O
ct-1
8
DIB
UH
49
(S)
Jr
Sub
PER
P; C
: Mar
-19
EBIU
H 4
9 J
r Su
b P
ERP
; C: M
ay-1
9
ALH
ILA
49
(S)
Jr
Sub
PER
P; C
: Ju
n-1
9
BG
BK
KK
21
Jr
Sub
PER
P; C
: Sep
-19
CO
MQ
AT
19
Su
b
AU
BB
I 49
Jr
Sub
PER
P; C
: Ap
r-2
0
BK
DB
OM
49
Jr
Sub
PER
P; C
: May
-20
NB
AD
UH
49
Jr
Sub
PER
P; C
: Ju
n-2
0
EBIU
H 4
9 J
r Su
b P
ERP
; C: S
ep-2
0
NB
OB
OM
49
Jr
Sub
PER
P; C
: No
v-2
0
DIB
UH
49
(S)
Jr
Sub
PER
P; C
: Jan
-21
NTB
KK
K 4
9 J
r Su
b P
ERP
; C: A
pr-
21
BU
BYA
N 4
9 S
ub
PER
P *
16
/5/1
6; C
: May
-21
NO
OR
BK
49
Su
b P
erp
*0
1/6
/16
; C: J
un
-21
-94
-58
-155
-147
-152
-46
-101
-47
+22-41
-38
-46
-86
-73 unch -177 -125
100
150
200
250
300
350
400
450
500
550
600
650
700
750
800
z-sp
read
(b
ps)
Maturity date / First Call Date for Perpetuals Longterm
Shortterm
30-Sep31-Dec
2323
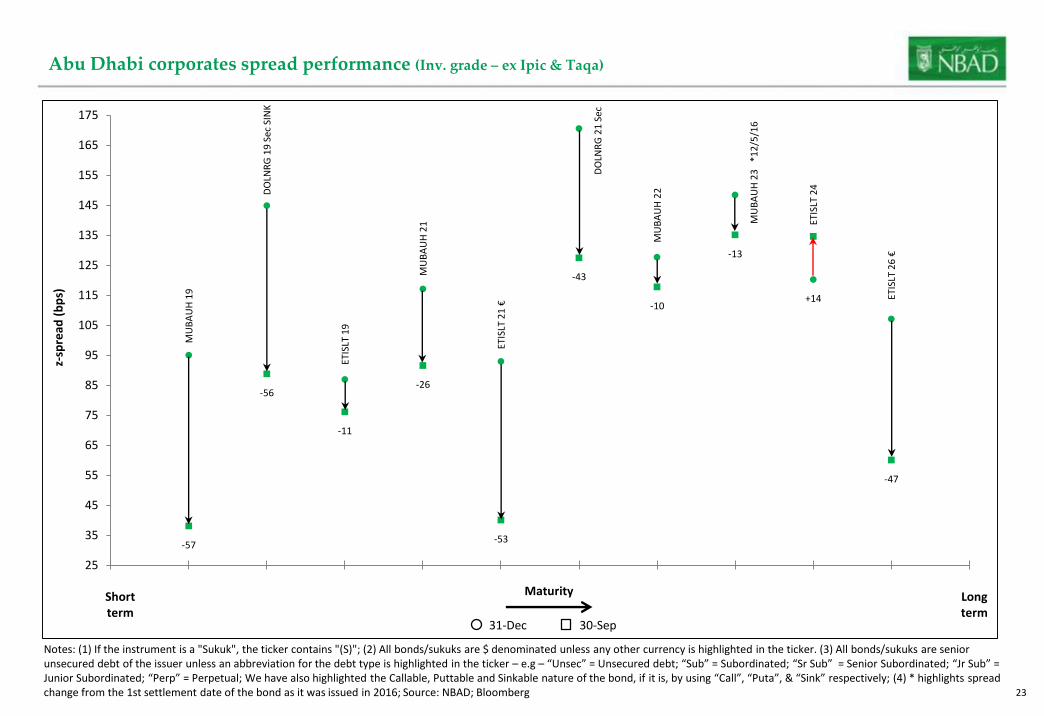
Abu Dhabi corporates spread performance (Inv. grade – ex Ipic & Taqa)
Notes: (1) If the instrument is a "Sukuk", the ticker contains "(S)"; (2) All bonds/sukuks are $ denominated unless any other currency is highlighted in the ticker. (3) All bonds/sukuks are senior unsecured debt of the issuer unless an abbreviation for the debt type is highlighted in the ticker – e.g – “Unsec” = Unsecured debt; “Sub” = Subordinated; “Sr Sub” = Senior Subordinated; “Jr Sub” = Junior Subordinated; “Perp” = Perpetual; We have also highlighted the Callable, Puttable and Sinkable nature of the bond, if it is, by using “Call”, “Puta”, & “Sink” respectively; (4) * highlights spread change from the 1st settlement date of the bond as it was issued in 2016; Source: NBAD; Bloomberg
MU
BA
UH
19
DO
LNR
G 1
9 S
ec S
INK
ETIS
LT 1
9
MU
BA
UH
21
ETIS
LT 2
1 €
DO
LNR
G 2
1 S
ec
MU
BA
UH
22
MU
BA
UH
23
*1
2/5
/16
ETIS
LT 2
4
ETIS
LT 2
6 €
-57
-56
-11
-26
-53
-43
-10
-13
+14
-47
25
35
45
55
65
75
85
95
105
115
125
135
145
155
165
175
z-sp
read
(b
ps)
Maturity Longterm
Shortterm
30-Sep31-Dec
2424
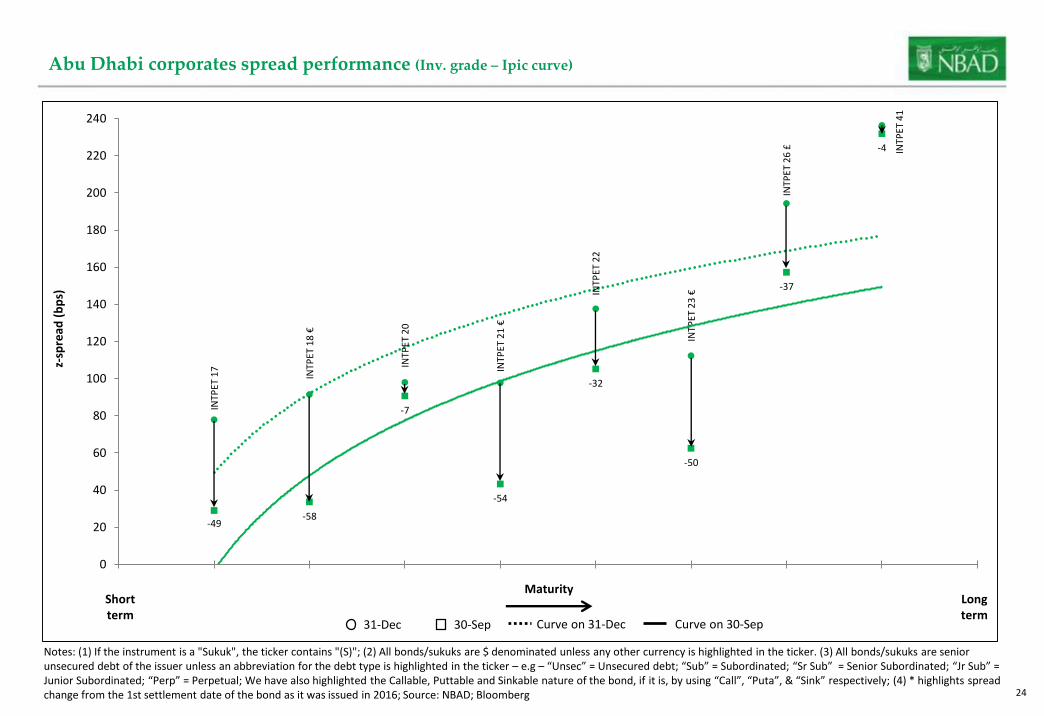
Abu Dhabi corporates spread performance (Inv. grade – Ipic curve)
Notes: (1) If the instrument is a "Sukuk", the ticker contains "(S)"; (2) All bonds/sukuks are $ denominated unless any other currency is highlighted in the ticker. (3) All bonds/sukuks are senior unsecured debt of the issuer unless an abbreviation for the debt type is highlighted in the ticker – e.g – “Unsec” = Unsecured debt; “Sub” = Subordinated; “Sr Sub” = Senior Subordinated; “Jr Sub” = Junior Subordinated; “Perp” = Perpetual; We have also highlighted the Callable, Puttable and Sinkable nature of the bond, if it is, by using “Call”, “Puta”, & “Sink” respectively; (4) * highlights spread change from the 1st settlement date of the bond as it was issued in 2016; Source: NBAD; Bloomberg
INTP
ET 1
7
INTP
ET 1
8 €
INTP
ET 2
0
INTP
ET 2
1 €
INTP
ET 2
2
INTP
ET 2
3 €
INTP
ET 2
6 £
INTP
ET 4
1
-49-58
-7
-54
-32
-50
-37
-4
0
20
40
60
80
100
120
140
160
180
200
220
240
z-sp
read
(b
ps)
MaturityLongterm
Shortterm
30-Sep31-Dec Curve on 31-Dec Curve on 30-Sep
2525
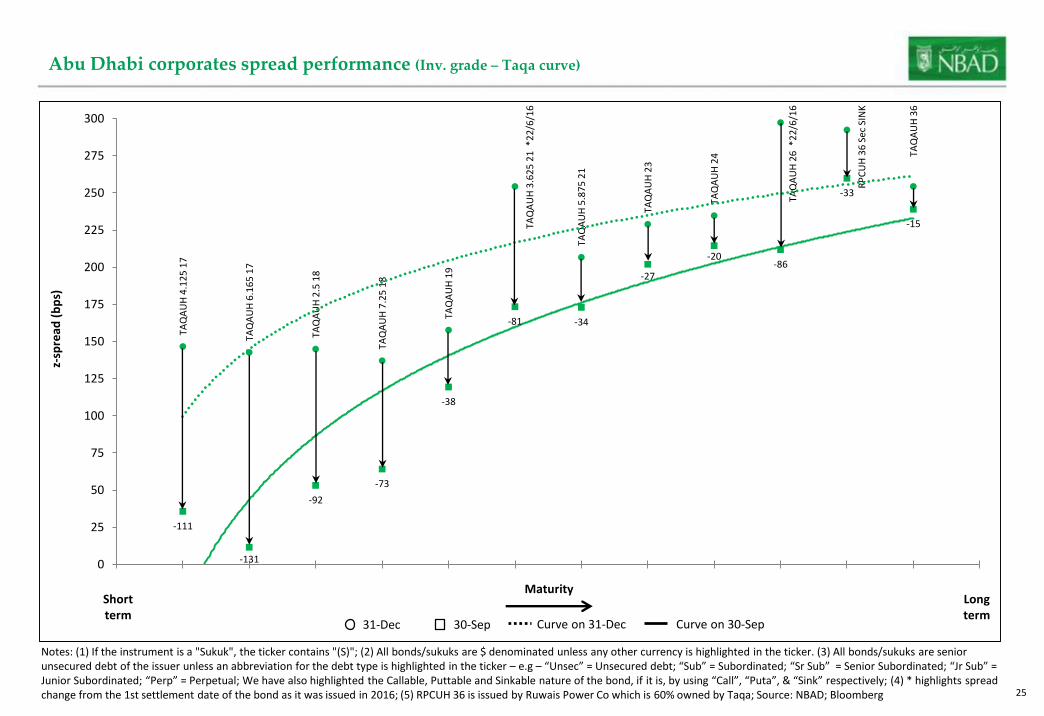
Abu Dhabi corporates spread performance (Inv. grade – Taqa curve)
TAQ
AU
H 4
.12
5 1
7
TAQ
AU
H 6
.16
5 1
7
TAQ
AU
H 2
.5 1
8
TAQ
AU
H 7
.25
18
TAQ
AU
H 1
9
TAQ
AU
H 3
.62
5 2
1 *
22
/6/1
6
TAQ
AU
H 5
.87
5 2
1
TAQ
AU
H 2
3
TAQ
AU
H 2
4
TAQ
AU
H 2
6 *
22
/6/1
6
RP
CU
H 3
6 S
ec S
INK
TAQ
AU
H 3
6
-111
-131
-92
-73
-38
-81 -34
-27
-20-86
-33
-15
0
25
50
75
100
125
150
175
200
225
250
275
300
z-sp
read
(b
ps)
Maturity
Notes: (1) If the instrument is a "Sukuk", the ticker contains "(S)"; (2) All bonds/sukuks are $ denominated unless any other currency is highlighted in the ticker. (3) All bonds/sukuks are senior unsecured debt of the issuer unless an abbreviation for the debt type is highlighted in the ticker – e.g – “Unsec” = Unsecured debt; “Sub” = Subordinated; “Sr Sub” = Senior Subordinated; “Jr Sub” = Junior Subordinated; “Perp” = Perpetual; We have also highlighted the Callable, Puttable and Sinkable nature of the bond, if it is, by using “Call”, “Puta”, & “Sink” respectively; (4) * highlights spread change from the 1st settlement date of the bond as it was issued in 2016; (5) RPCUH 36 is issued by Ruwais Power Co which is 60% owned by Taqa; Source: NBAD; Bloomberg
Longterm
Shortterm
30-Sep31-Dec Curve on 31-Dec Curve on 30-Sep
2626
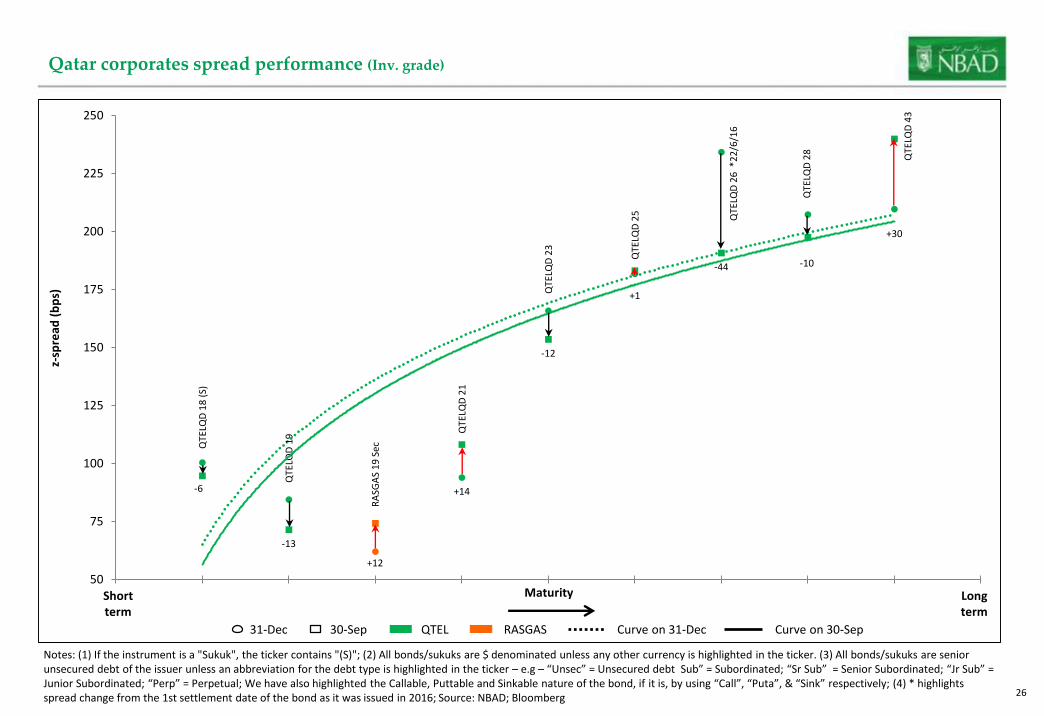
Qatar corporates spread performance (Inv. grade)
RA
SGA
S 1
9 S
ec
QTE
LQD
18
(S)
QTE
LQD
19
QTE
LQD
21
QTE
LQD
23
QTE
LQD
25
QTE
LQD
26
*2
2/6
/16
QTE
LQD
28
QTE
LQD
43
+12
-6
-13
+14
-12
+1
-44 -10
+30
50
75
100
125
150
175
200
225
250
z-sp
read
(b
ps)
Maturity
Notes: (1) If the instrument is a "Sukuk", the ticker contains "(S)"; (2) All bonds/sukuks are $ denominated unless any other currency is highlighted in the ticker. (3) All bonds/sukuks are senior unsecured debt of the issuer unless an abbreviation for the debt type is highlighted in the ticker – e.g – “Unsec” = Unsecured debt Sub” = Subordinated; “Sr Sub” = Senior Subordinated; “Jr Sub” = Junior Subordinated; “Perp” = Perpetual; We have also highlighted the Callable, Puttable and Sinkable nature of the bond, if it is, by using “Call”, “Puta”, & “Sink” respectively; (4) * highlights spread change from the 1st settlement date of the bond as it was issued in 2016; Source: NBAD; Bloomberg
Longterm
Shortterm
30-Sep31-Dec RASGASQTEL Curve on 31-Dec Curve on 30-Sep
2727
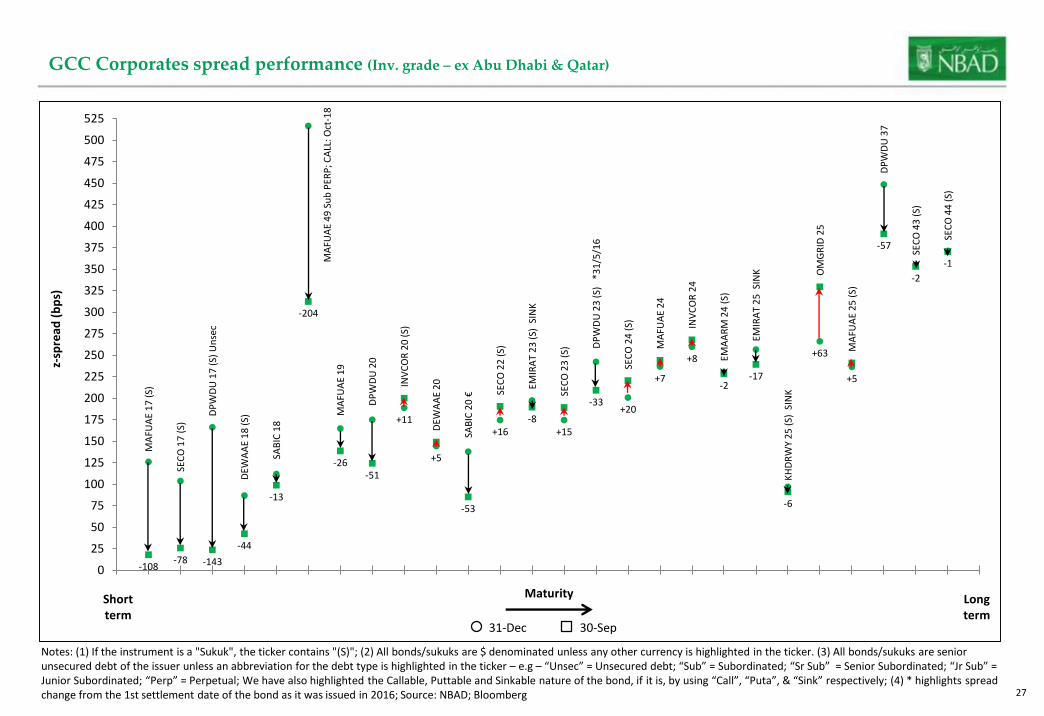
GCC Corporates spread performance (Inv. grade – ex Abu Dhabi & Qatar)
Notes: (1) If the instrument is a "Sukuk", the ticker contains "(S)"; (2) All bonds/sukuks are $ denominated unless any other currency is highlighted in the ticker. (3) All bonds/sukuks are senior unsecured debt of the issuer unless an abbreviation for the debt type is highlighted in the ticker – e.g – “Unsec” = Unsecured debt; “Sub” = Subordinated; “Sr Sub” = Senior Subordinated; “Jr Sub” = Junior Subordinated; “Perp” = Perpetual; We have also highlighted the Callable, Puttable and Sinkable nature of the bond, if it is, by using “Call”, “Puta”, & “Sink” respectively; (4) * highlights spread change from the 1st settlement date of the bond as it was issued in 2016; Source: NBAD; Bloomberg
MA
FUA
E 1
7 (
S)
SEC
O 1
7 (
S)
DP
WD
U 1
7 (
S) U
nse
c
DEW
AA
E 1
8 (
S)
SAB
IC 1
8
MA
FUA
E 4
9 S
ub
PER
P; C
ALL
: Oct
-18
MA
FUA
E 1
9
DP
WD
U 2
0
INV
CO
R 2
0 (
S)
DEW
AA
E 2
0
SAB
IC 2
0 € SE
CO
22
(S)
EMIR
AT
23
(S)
SIN
K
SEC
O 2
3 (
S) DP
WD
U 2
3 (
S)
*31
/5/1
6
SEC
O 2
4 (
S)
MA
FUA
E 2
4
INV
CO
R 2
4
EMA
AR
M 2
4 (
S)
EMIR
AT
25
SIN
K
KH
DR
WY
25
(S)
SIN
K
OM
GR
ID 2
5
MA
FUA
E 2
5 (
S)
DP
WD
U 3
7
SEC
O 4
3 (
S)
SEC
O 4
4 (
S)
-108-78 -143
-44
-13
-204
-26-51
+11
+5
-53
+16-8
+15
-33+20
+7
+8
-2-17
-6
+63
+5
-57
-2
-1
0
25
50
75
100
125
150
175
200
225
250
275
300
325
350
375
400
425
450
475
500
525
z-sp
read
(b
ps)
Maturity Longterm
Shortterm
30-Sep31-Dec
2828
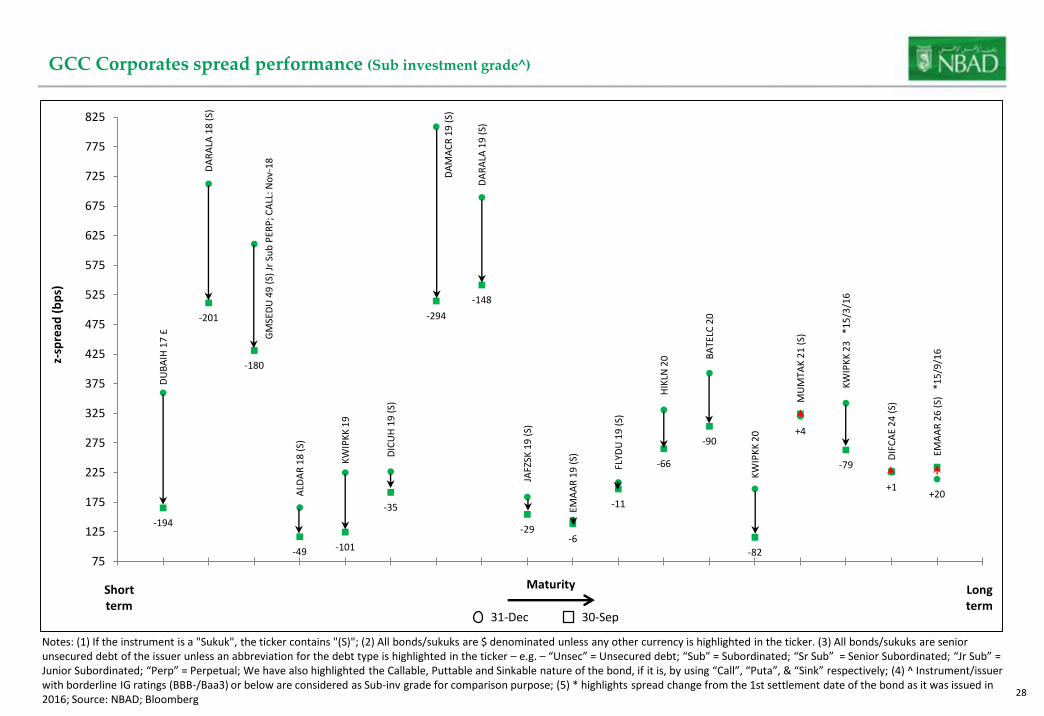
GCC Corporates spread performance (Sub investment grade^)
Notes: (1) If the instrument is a "Sukuk", the ticker contains "(S)"; (2) All bonds/sukuks are $ denominated unless any other currency is highlighted in the ticker. (3) All bonds/sukuks are senior unsecured debt of the issuer unless an abbreviation for the debt type is highlighted in the ticker – e.g. – “Unsec” = Unsecured debt; “Sub” = Subordinated; “Sr Sub” = Senior Subordinated; “Jr Sub” = Junior Subordinated; “Perp” = Perpetual; We have also highlighted the Callable, Puttable and Sinkable nature of the bond, if it is, by using “Call”, “Puta”, & “Sink” respectively; (4) ^ Instrument/issuer with borderline IG ratings (BBB-/Baa3) or below are considered as Sub-inv grade for comparison purpose; (5) * highlights spread change from the 1st settlement date of the bond as it was issued in 2016; Source: NBAD; Bloomberg
DU
BA
IH 1
7 £
DA
RA
LA 1
8 (
S)
GM
SED
U 4
9 (
S) J
r Su
b P
ERP
; CA
LL: N
ov-
18
ALD
AR
18
(S)
KW
IPK
K 1
9
DIC
UH
19
(S)
DA
MA
CR
19
(S)
DA
RA
LA 1
9 (
S)
JAFZ
SK 1
9 (
S)
EMA
AR
19
(S)
FLYD
U 1
9 (
S)
HIK
LN 2
0 BA
TELC
20
KW
IPK
K 2
0
MU
MTA
K 2
1 (
S)
KW
IPK
K 2
3
*15
/3/1
6
DIF
CA
E 2
4 (
S)
EMA
AR
26
(S)
*1
5/9
/16
-194
-201
-180
-49 -101
-35
-294
-148
-29-6
-11
-66
-90
-82
+4
-79
+1+20
75
125
175
225
275
325
375
425
475
525
575
625
675
725
775
825
z-sp
read
(b
ps)
Maturity Longterm
Shortterm
30-Sep31-Dec
2929
As mentioned in slide # 7 & 8, we have used “composite ratings” for the credit quality analysis – i.e. the average of the ratings assigned by three leading rating agencies Moody’s, S&P and Fitch – in order to provide a more representative view of the credit strength of each bank.
The composite rating is calculated as follows:
A score is assigned to the rating from each rating agency: AAA or equivalent being the best with a score of “1”, followed by AA+ or equivalent as “2”, AA or equivalent as “3”, AA- or equivalent as “4” and so on;
For example NBAD is rated Aa3/AA-/AA- by Moody’s/S&P/Fitch. So the scores are 4/4/4;
Hence the average of the scores is “4” which indicates a composite rating of “AA-” for NBAD;
In case the average score is not an absolute number – e.g. 4.33 (average of 4, 5, & 4 ) – the final score is derived by rounding off the average score to the nearest whole number. In this case “4”.
Appendix
3030
Rakesh Sahu / Chavan BhogaitaMarket Insights & StrategyGlobal MarketsNational Bank of Abu DhabiTel: +971 2 6110 [email protected]
Contact