Embed Size (px)
Citation preview

Hardy Oil and Gas plc. Copy No. E2291
GCA GAFFNEY, CLINE & ASSOCIATES
COMPETENT PERSON’S REPORT
Prepared for
HARDY OIL AND GAS PLC
APRIL, 2010
The Americas Europe, Africa, FSU Asia Pacific and the Middle East 1360 Post Oak Blvd., Bentley Hall, Blacknest 80 Anson Road Suite 2500 Alton, Hampshire 31-01C IBM Towers Houston, Texas 77056 United Kingdom GU34 4PU Singapore 079907 Tel: +1 713 850 9955 Tel: +44 1420 525366 Tel: +65 225 6951 Fax: +1 713 850-9966 Fax: +44 1420 525367 Fax: +65 224 0842 email: [email protected] email: [email protected] email: [email protected] and at Caracas – Rio de Janeiro – Buenos Aires – Sydney www.gaffney-cline.com
Hardy Oil and Gas plc. E2291
GCA GAFFNEY, CLINE & ASSOCIATES
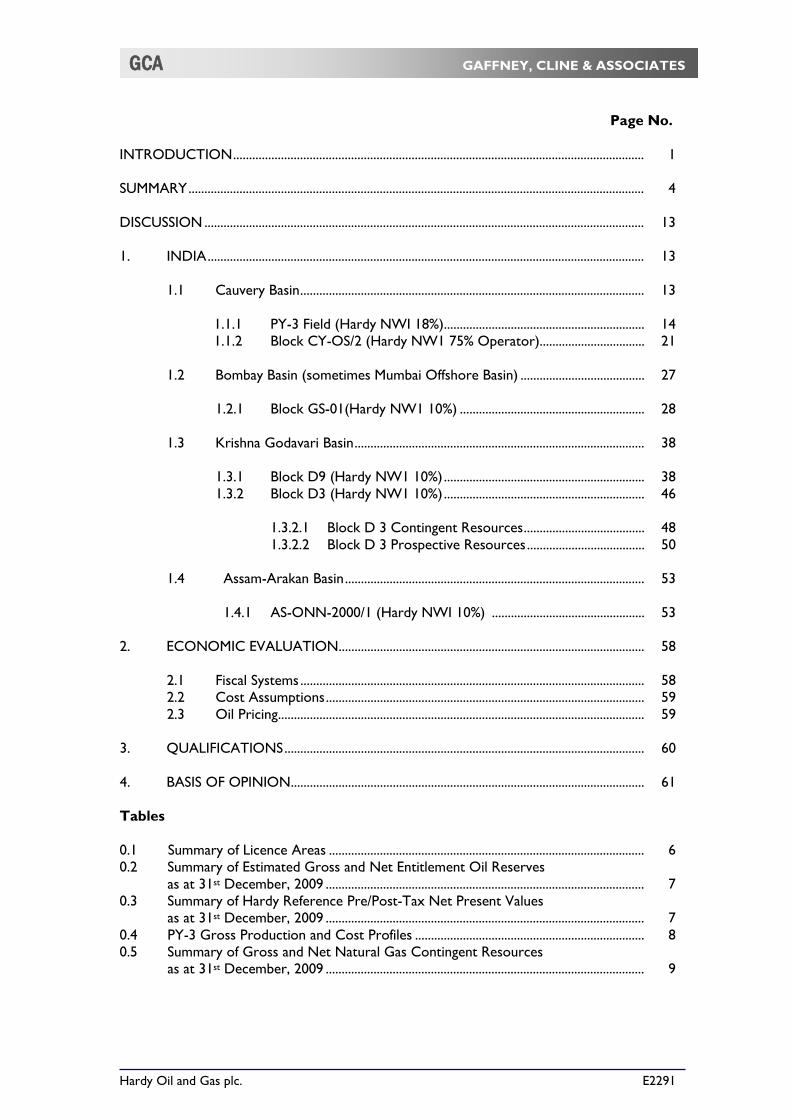
Page No. INTRODUCTION ................................................................................................................................. 1 SUMMARY ............................................................................................................................................... 4 DISCUSSION .......................................................................................................................................... 13 1. INDIA ......................................................................................................................................... 13 1.1 Cauvery Basin ............................................................................................................ 13
1.1.1 PY-3 Field (Hardy NWI 18%)............................................................... 14 1.1.2 Block CY-OS/2 (Hardy NW1 75% Operator)................................. 21
1.2 Bombay Basin (sometimes Mumbai Offshore Basin) ....................................... 27 1.2.1 Block GS-01(Hardy NW1 10%) .......................................................... 28 1.3 Krishna Godavari Basin ........................................................................................... 38 1.3.1 Block D9 (Hardy NW1 10%) ............................................................... 38 1.3.2 Block D3 (Hardy NW1 10%) ............................................................... 46 1.3.2.1 Block D 3 Contingent Resources ...................................... 48 1.3.2.2 Block D 3 Prospective Resources ..................................... 50
1.4 Assam-Arakan Basin .............................................................................................. 53
1.4.1 AS-ONN-2000/1 (Hardy NWI 10%) ................................................ 53 2. ECONOMIC EVALUATION ................................................................................................ 58 2.1 Fiscal Systems ............................................................................................................ 58 2.2 Cost Assumptions .................................................................................................... 59 2.3 Oil Pricing ................................................................................................................... 59 3. QUALIFICATIONS ................................................................................................................. 60 4. BASIS OF OPINION ............................................................................................................... 61 Tables 0.1 Summary of Licence Areas ................................................................................................... 6 0.2 Summary of Estimated Gross and Net Entitlement Oil Reserves as at 31st December, 2009 .................................................................................................... 7 0.3 Summary of Hardy Reference Pre/Post-Tax Net Present Values as at 31st December, 2009 .................................................................................................... 7 0.4 PY-3 Gross Production and Cost Profiles ........................................................................ 8 0.5 Summary of Gross and Net Natural Gas Contingent Resources as at 31st December, 2009 .................................................................................................... 9

Hardy Oil and Gas plc. E2291
GCA TABLE OF CONTENTS
Page No. 0.6 Summary of Gross and Net Gas Prospective Resources for Prospects as at 31st December, 2009 .................................................................................................... 10 0.7 Summary of Gross and Net Oil Prospective Resources for Prospects as at 31st December, 2009 .................................................................................................... 13 Figures 0.1 Location Map of Hardy’s Interests in India ....................................................................... 2 1.1 Location of PY-3 Field and Block CY-OS/2, Offshore Cauvery Basin, India ........... 15 1.2 Cauvery Basin Lithostratigraphic Column ....................................................................... 16 1.3 PY-3 Pay Top Structure Map with OWC @3,505 m SS ............................................... 17 1.4 PY-3 Pay Top Structure Map _Volumetric Polygons ...................................................... 19 1.5 PY-3 Field Production Performance and Forecast .......................................................... 20 1.6 CY-OS/2 Prospect Location Map ........................................................................................ 26 1.7 Bombay Basin Lithostratigraphic Column ......................................................................... 29 1.8 GS-01 Block Location ............................................................................................................. 30 1.9 GS-01 3D Area Depth Structure Map At Top Bassein Formation ............................. 32 1.10 GS-OSN-1 Map ........................................................................................................................ 33 1.11 Block GS-01 Seismic Line Through the B-1 and A-1 Locations ................................... 37 1.12 Blocks D9/D3 Post-Mesozoic Stratigraphy ....................................................................... 39 1.13 Location Map Showing D3 and D9 Licences .................................................................... 40 1.14 D9 Prospect and Lead Location Map ................................................................................. 41 1.15 D3 Prospect Map..................................................................................................................... 47 1.16 Oil Fields South Of Brahmaputra River AS-ONN-2000/1 ............................................ 54 1.17 Stratigraphic Column Assam-Arakan Basin ....................................................................... 55 1.18 Seismic Line As-17-08 In Assam Block ............................................................................... 56 1.19 AS-ONN-2000/1 Prospect and Lead Location Map Sylhet Formation Time Structure Map .......................................................................................................................... 57 Appendices I. Glossary II. SPE/WPC/AAPG/SPEE, Petroleum Resources Management System Definitions and
Guidelines

Bentley Hall Blacknest, Alton Hampshire GU34 4PU United Kingdom
Telephone: +44 (0) 1420 525366 Facsimile: +44 (0) 1420 525367
email: [email protected] www.gaffney-cline.com
Gaffney, Cline & Associates Ltd
Technical and Management Advisers to the Petroleum Industry Internationally Since 1962
Registered London No. 1122740
UNITED KINGDOM UNITED STATES SINGAPORE AUSTRALIA ARGENTINA UAE RUSSIA KAZAKHSTAN
MIH/E2291/ngk/0418 9th April, 2010 The Directors, Hardy Oil & Gas Plc, Lincoln House, 37-143 Hammersmith Road, London, W14 0QL. Dear Sirs,
COMPETENT PERSON’S REPORT (CPR) INTRODUCTION
In accordance with the instruction letter of Hardy Oil & Gas Plc (Hardy) dated 29th January, 2010 Gaffney, Cline & Associates Ltd (GCA) has reviewed the petroleum interests owned by Hardy in India (Figure 0.1). These assets include producing properties, potential developments, discoveries and duly licensed exploration interests. Hardy has made available to GCA a data-set of technical information, including geological, geophysical, and engineering data and reports, together with financial data and the fiscal terms applicable to each of the assets. GCA has also had meetings and discussions with Hardy technical and managerial personnel. In carrying out this review GCA has relied on the accuracy and completeness of the information received from Hardy.
GCA has not been requested to perform a site visit, nor has GCA considered this necessary for the purposes of this CPR.
Industry Standard abbreviations are contained in the attached Appendix I Glossary, some or all of which may have been used in this report. GCA uses the Petroleum Resources Management System (SPE PRMS) published by the Society of Petroleum Engineers/World Petroleum Congresses/ American Association of Petroleum Geologists/Society of Petroleum Evaluation Engineers (SPE/WPC/AAPG/SPEE) in March, 2007 as the basis for its classification and categorization of hydrocarbon volumes. An abbreviated form of the SPE PRMS is appended as Appendix II.

Hardy Oil and Gas plc. 2 E2291
GCA GAFFNEY, CLINE & ASSOCIATES
FIGURE 0.1
LOCATION MAP OF HARDY’S INTERESTS IN INDIA
MaduraiMaduraiMaduraiMaduraiMaduraiMaduraiMaduraiMaduraiMadurai
MangaluruMangaluruMangaluruMangaluruMangaluruMangaluruMangaluruMangaluruMangaluru BengaluruBengaluruBengaluruBengaluruBengaluruBengaluruBengaluruBengaluruBengaluru
CochinCochinCochinCochinCochinCochinCochinCochinCochin
ChennaiChennaiChennaiChennaiChennaiChennaiChennaiChennaiChennai
MumbaiMumbaiMumbaiMumbaiMumbaiMumbaiMumbaiMumbaiMumbai
PunePunePunePunePunePunePunePunePune
PanajiPanajiPanajiPanajiPanajiPanajiPanajiPanajiPanaji
HyderabadHyderabadHyderabadHyderabadHyderabadHyderabadHyderabadHyderabadHyderabadVishakhapatnamVishakhapatnamVishakhapatnamVishakhapatnamVishakhapatnamVishakhapatnamVishakhapatnamVishakhapatnamVishakhapatnam
achiachiachiachiachirachirachirachiachi
AhmadabadAhmadabadAhmadabadAhmadabadAhmadabadAhmadabadAhmadabadAhmadabadAhmadabad
DamanDamanDamanDamanDamanDamanDamanDamanDaman
NagpurNagpurNagpurNagpurNagpurNagpurNagpurNagpurNagpur
BhopalBhopalBhopalBhopalBhopalBhopalBhopalBhopalBhopal RanchiRanchiRanchiRanchiRanchiRanchiRanchiRanchiRanchi
KhulnaKhulnaKhulnaKhulnaKhulnaKhulnaKhulnaKhulnaKhulna
BhubaneshwarBhubaneshwarBhubaneshwarBhubaneshwarBhubaneshwarBhubaneshwarBhubaneshwarBhubaneshwarBhubaneshwar
ImphalImphalImphalImphalImphalImphalImphalImphalImphal
AgartalaAgartalaAgartalaAgartalaAgartalaAgartalaAgartalaAgartalaAgartala
ChittagongChittagongChittagongChittagongChittagongChittagongChittagongChittagongChittagong
JaipurJaipurJaipurJaipurJaipurJaipurJaipurJaipurJaipur LucknowLucknowLucknowLucknowLucknowLucknowLucknowLucknowLucknow
VaranasiVaranasiVaranasiVaranasiVaranasiVaranasiVaranasiVaranasiVaranasi
GangtokGangtokGangtokGangtokGangtokGangtokGangtokGangtokGangtok
SaidpurSaidpurSaidpurSaidpurSaidpurSaidpurSaidpurSaidpurSaidpurPatnaPatnaPatnaPatnaPatnaPatnaPatnaPatnaPatna
ItanagarItanagarItanagarItanagarItanagarItanagarItanagarItanagarItanagar
KohimaKohimaKohimaKohimaKohimaKohimaKohimaKohimaKohimaShillongShillongShillongShillongShillongShillongShillongShillongShillong
ColomboColomboColomboColomboColomboColomboColomboColomboColombo
New DelhiNew DelhiNew DelhiNew DelhiNew DelhiNew DelhiNew DelhiNew DelhiNew Delhi
KathmanduKathmanduKathmanduKathmanduKathmanduKathmanduKathmanduKathmanduKathmandu
I N D I A
D9
D3
CY-OS/2PY-3 Field
GS-01
Sri Lanka
nnn
IndiaIndiaIndiaIndiaIndiaIndiaIndiaIndiaIndia
NepalakistanakistanakistanPakistanPakistanPakistanPakistanPakistanPakistan
B a yB a yB a yB a yB a yB a yB a yB a yB a yo fo fo fo fo fo fo fo fo f
B e n g a lB e n g a lB e n g a lB e n g a lB e n g a lB e n g a lB e n g a lB e n g a lB e n g a l
Bhutan
Myanmar
AndamanAndamanAndamanAndamanAndamanAndamanAndamanAndamanAndamanSeaSeaSeaSeaSeaSeaSeaSeaSea
BangladeshBangladeshBangladeshBangladeshBangladeshBangladeshBangladeshBangladeshBangladesh
0 500 km
Hardy Block Interests
Source: GCA/Petroview
Bay of Bengal
AS-ONN-2000/1

Hardy Oil and Gas plc. 3 E2291
GCA GAFFNEY, CLINE & ASSOCIATES
It must be clearly understood that any determination of reserves volumes,
particularly involving continuing field development, will be subject to significant variations over short periods of time as new information becomes available and perceptions change.
Reserves are those quantities of petroleum that are anticipated to be commercially
recoverable by application of development projects to known accumulations from a given date forward under defined conditions. Reserves must further satisfy four criteria: they must be discovered, recoverable, commercial and remaining (as of the evaluation date) based on the development project(s) applied. Reserves are further categorized in accordance with the level of certainty associated with the estimates and may be sub-classified based on project maturity and/or characterized by development and production status. All categories of Reserve volumes quoted herein have been determined within the context of an economic limit test (pre-tax and exclusive of accumulated depreciation amounts) assessment prior to any Net Present Value analysis.
Contingent Resources are those quantities of petroleum estimated, as of a given
date, to be potentially recoverable from known accumulations, but the applied project(s) are not yet considered mature enough for commercial development due to one or more contingencies. Contingent Resources may include, for example, projects for which there are currently no evident viable markets, or where commercial recovery is dependent on technology under development, or where evaluation of the accumulation is insufficient to clearly assess commerciality. Contingent Resources are further categorized in accordance with the level of certainty associated with the estimates and may be sub-classified based on project maturity and/or characterized by their economic status.
It must be appreciated that the Contingent Resources reported herein are unrisked
in terms of economic uncertainty and commerciality. Prospective Resources are those quantities of petroleum that are estimated, as of a
given date, to be potentially recoverable from undiscovered accumulations by application of future development projects. Prospective Resources have both an associated chance of discovery and a chance of development. Prospective Resources are further subdivided in accordance with the level of certainty associated with recoverable estimates assuming their discovery and development and may be sub-classified based on project maturity. Prospective Resources include Prospects and Leads. Prospects are features that have been sufficiently well defined, on the basis of geological and geophysical data, to the point that they are considered drillable. Leads, on the other hand, are not sufficiently well defined to be drillable, and need further work and/or data. In general, leads are significantly more risky than prospects and therefore are not suitable for explicit quantification.
Prospective Resource volumes are presented as unrisked. It must be appreciated that Prospective Resources are risk assessed only in the context of applying the stated 'Geological Chance of Success', a percentage which pertains to the percentage probability of achieving the status of a Contingent Resource (where the Geological Chance of Success is unity). This dimension of risk assessment does not incorporate the considerations of economic uncertainty and commerciality.
Proved, Proved plus Probable and Proved plus Probable plus Possible Reserves net
to Hardy are quoted as Net Entitlement Reserves reflecting the terms of the applicable Production Sharing Contracts (PSCs). Contingent Resources are presented at a gross field level and a net working interest level, as it is not possible to estimate net entitlements under the relevant PSCs.

Hardy Oil and Gas plc. 4 E2291
GCA GAFFNEY, CLINE & ASSOCIATES
It must be clearly understood that any determination of resources volumes,
particularly involving continuing field development, will be subject to significant variations over short periods of time as new information becomes available and perceptions change. Not only are such estimates of Reserves and Contingent and Prospective Resources based on that information which is currently available, but such estimates are also subject to uncertainties inherent in the application of judgmental factors in interpreting such information. Contingent and Prospective Resources quantities should not be confused with those quantities that are associated with Reserves due to the additional risks involved. Those quantities that might actually be recovered may differ significantly from the estimates presented herein. A possibility exists that the accumulations and prospects will not result in successful discovery and development, in which case there could be no positive potential present worth. It should be clearly noted that the reference Net Present Values (NPVs) of future revenue potential of a petroleum property, such as those discussed in this report, do not represent GCA’s perception of the market value of that property, or any interest in it. In assessing a likely market value, it would be necessary to take into account a number of additional factors including: reserves risk (i.e. that Proved and or Probable Reserves may not be realised within the anticipated timeframe for their exploitation); perceptions of economic and sovereign risk; potential upside, such as in this case exploitation of reserves beyond the Proved and the Probable level; other benefits, encumbrances or charges that may pertain to a particular interest and the competitive state of the market at the time. GCA has explicitly not taken such factors into account in deriving the reference NPVs presented herein. GCA is an energy consultancy specialising in independent petroleum advice on resource evaluation and economic analysis. In the preparation of this report, GCA has maintained, and continues to maintain, a strict consultant-client relationship with Hardy. The management and employees of GCA have been, and continue to be, independent of Hardy in the services they provide to the company including the provision of the opinion expressed in this review. Furthermore, the management and employees of GCA have no interest in any assets or share capital of Hardy, or in the promotion of the company. This report must only be used for the purpose for which it was intended. SUMMARY Hardy has interests in a number of assets in India that comprise production, potential development, discoveries and exploration. Hardy’s Indian assets and the pertinent Net Working Interest (NWI) fractions are comprised of the following: PY-3 producing oil asset, located in the CY-OS-90/1 Production Licence sub-block of
CY-OS/2 in the Cauvery Basin, offshore Tamil Nadu in south-western India (Hardy NWI 18%);
Block CY-OS/2, located in the Cauvery Basin, offshore Tamil Nadu (Hardy NWI 75%);
Block GS-OSN-2000/1 (NELP II), located in the Bombay offshore Basin, to the West and Northwest of the ONGC operated Bombay High field (Hardy NWI 10%);
Block KG-DWN-2001/1(or D9) (NELP III) in the offshore Krishna-Godavari Basin (Hardy NWI 10%), located immediately to the east of Reliance's 2003 gas discoveries in Block KG-DWN-98/3;

Hardy Oil and Gas plc. 5 E2291
GCA GAFFNEY, CLINE & ASSOCIATES
Block KG-DWN-2003/1 (or D3) (NELP V), in the offshore Krishna-Godavari Basin due west and some 50 km inshore of the Reliance concession mentioned above (Hardy NWI 10%); and
Assam block (AS-ONN-2000/1), located onshore in the northeast part of India in the Assam-Arakan Basin, immediately north of the Brahmaputra River and south of the Eastern Himalaya (Hardy NWI 10%).
These concession areas are all shown on the regional location maps, Figure 0.1. A
summary of licence areas and water depth ranges (where appropriate) is given in Table 0.1. GCA has reviewed various data and technical studies presented by Hardy, including
seismic interpretations and dynamic reservoir simulation studies, as well as studies performed by independent third parties and other information available from the public domain. GCA has visited the office of Hardy in Chennai in India February, 2010 for discussions with technical and managerial staff. Based on the information made available, GCA has considered the assessments performed by the operators and other third parties and, in some cases, has derived its own estimates of Reserves, Contingent Resources and Prospective Resources where appropriate.
GCA has not visited the PY-3 field production facilities and cannot, therefore, attests
to the reliability or integrity of these facilities.
The technical and economic conclusions presented herein are based on the technical and commercial information provided and represent GCA’s opinions as of the effective date of 31st December, 2009. The conclusions are estimates based upon professional geoscience and engineering judgment and they will be subject to future revisions as additional information becomes available. Reserves Summary
The "Proved", "Proved plus Probable" and "Proved plus Probable plus Possible" Reserves attributed to Hardy's interests in India as at 31st December, 2009 are for the producing field PY-3 as summarised in Table 0.2. All categories of Reserve volumes quoted herein have been determined within the context of an economic limit test. Net Present Value Summary Net Present Values (NPVs) have been attributed to the ‘Proved’, the ‘Proved plus Probable’ and the ‘Proved plus Probable plus Possible’ Reserves. These references Pre/Post-Tax NPVs are summarised in Table 0.3 based on GCA’s 1Q 2010 Brent price scenario. All NPVs quoted are those exclusively attributable to Hardy's net entitlement interests in the property reviewed. Production Forecasts Forecasts of gross oil production and costs are summarised in Table 0.4. Resource Summary
Apart from the producing assets, Hardy holds licences with discoveries and a
number of exploration areas. GCA audited the estimates of Contingent Resources as of 31st December, 2009 and these are discussed in Section 1.1.2 (CY-OS/2), Section 1.2.1 (GS-01/B1 area) and Section 1.3.2 (block D3) of this report. See Table 0.5.

Hardy Oil and Gas plc. 6 E2291
GCA GAFFNEY, CLINE & ASSOCIATES
In addition, a determination has been made as to the Prospective Resources that may be attributed to a number of undrilled Prospects, together with the associated geological chance of success (GCoS) that they may be found to contain hydrocarbons, and thereafter be at least regarded as a candidate for inclusion in the Contingent Resource category. A significant number of Leads have been identified in Block D-9 in the emerging petroleum province of the continental slope off India’s eastern coast. The materiality of this potential will evolve through identification and subsequent maturation of Leads into “drillable prospects”. The estimates of Hardy’s Prospective Resources as of 31st December, 2009 are shown in Tables 0.6 and 0.7. Exploration Potential Hardy recognizes that the exploration of D3 and D9 merits sequence stratigraphic analysis to better define the plays. This play analysis approach is being used to determine depositional systems and consequently the distribution of lithofacies within a chronostratigraphic envelope to give a better understanding of reservoir distribution and allow a more effective evaluation of existing prospectivity. Placing leads in a play context will facilitate ranking in terms of GCoS. GCA endorses this approach and postulates that additional leads to those currently identified by Hardy may be generated. This work is already in progress in Block D3 and over the past year has resulted in the successful test of a Miocene play. In summary, the overall resource potential in BlockD3 has therefore improved relative to GCA’s evaluation of 2009.
TABLE 0.1
SUMMARY OF LICENCE AREAS
Field/Block Contract Operator Hardy NWI
%
Permit/PSC Granted
Date
Permit/PSC Expiry Date
Block Area (km2)
Water Depth
(m)
PY-3 CY-OS 90/1
Hardy 18 Dec, 1994 Dec, 2019 81 40 - 450
CY-OS/2 CY-OS/2 Hardy 75 Nov, 1996 Mar, 2007 859 50 - 900
GS-01 GS-OSN-
2000/1 Reliance 10 Jul, 2001 May, 2010 8,841 80 - 150
D9 KG-DWN-
2001/1 Reliance 10 Feb, 2003 Feb, 2011 11,850 2,300-3,100
D3 KG-DWN-
2003/1 Reliance 10 Sep, 2005 Sep, 2013 3,288 400-2,100
Assam AS-ONN-2000/1
Reliance 10 Jan, 2008 Jan, 2015 5,754 onshore
Notes: 1. GS-01 in appraisal phase to finish in May, 2010. 2. CY-OS/2 permit extension is pending with the Minstry of Petroleum and Natural Gas, Government of
India (MOPNG, GOI) regarding the discovery type. 3. In the event of a commercial development of a discovery, ONGC has the option to back-into the CY-
OS/2 licence at an interest of 30%.

Hardy Oil and Gas plc. 7 E2291
GCA GAFFNEY, CLINE & ASSOCIATES
TABLE 0.2
SUMMARY OF ESTIMATED GROSS AND NET ENTITLEMENT OIL
RESERVES AS AT 31ST DECEMBER, 2009
Area
Gross Oil Reserves
Hardy Interest
Net Entitlement Reserves MMBbl MMBbl
Proved Proved
plus Probable
Proved plus
Probable plus
Possible
Proved Proved
plus Probable
Proved plus
Probable plus
Possible PY-3 3.7 16.3 21.0 18% 0.6 2.5 3.4 Notes: 1. Net Entitlements are Reserves based on Hardy’s entitlement to Cost Oil plus share of Profit Oil.
TABLE 0.3
SUMMARY OF HARDY REFERENCE PRE / POST-TAX NET PRESENT VALUES AS AT 31ST DECEMBER, 2009
Notes: 1. Post-Tax values assume no prior tax position as at 31st December, 2009. 2. The above NPVs are Hardy’s Net Entitlement.
Asset Reserves Category
Pre-Tax NPVs Net to Hardy (U.S.$ MM)
Post-Tax NPVs Net to Hardy (U.S.$ MM)
7.5% 10.0% 12.5% 7.5% 10.0% 12.5%
PY-3
Proved 18.91 18.35 17.82 11.00 10.67 10.37
Proved plus Probable
85.77 78.62 72.31 45.00 40.48 36.52
Proved plus Probable plus Possible
107.04 96.03 86.39 52.51 45.43 39.29

Hardy Oil and Gas plc. 8 E2291
GCA GAFFNEY, CLINE & ASSOCIATES
TABLE 0.4
PY-3 GROSS PRODUCTION AND COST PROFILES
Year
Proved Proved plus Probable Proved plus Probable plus Possible
Oil Production
MBbl
CAPEX U.S.$ MM
OPEX U.S.$ MM
Oil Production
MBbl
CAPEX U.S.$ MM
OPEX U.S.$ MM
Oil Production
MBbl
CAPEX U.S.$ MM
OPEX U.S.$ MM
2010 1,136.0 - 35 1,136.0 85 35 1,136.0 115 35
2011 1,151.0 - 35 2,488.0 107 37 2,488.0 268 40
2012 807.0 - 35 3,208.0 - 37 4,138.0 - 40
2013 589.0 - 35 2,644.0 - 37 4,059.0 - 40
2014 - - - 1,831.0 - 37 2,646.0 - 37
2015 - - - 1,336.0 - 37 1,894.0 - 37
2016 - - - 1,096.0 - 37 1,512.0 - 37
2017 - - - 954.0 - 37 1,262.0 - 37
2018 - - - 861.0 - 37 1,025.0 - 37
2019 - - - 779.0 - 37 832.0 - 37
2020 - - - - - - - - -
2021 - - - - - - - - -
Total MBbl
3,682.0 - 140 16,334.0 192 368 20,991.0 383 377
Note: 1. Costs are in U.S.$ 2010. 2. Production is reported in annual quantities.
Hardy Oil and Gas plc. 9 E2291
GCA GAFFNEY, CLINE & ASSOCIATES
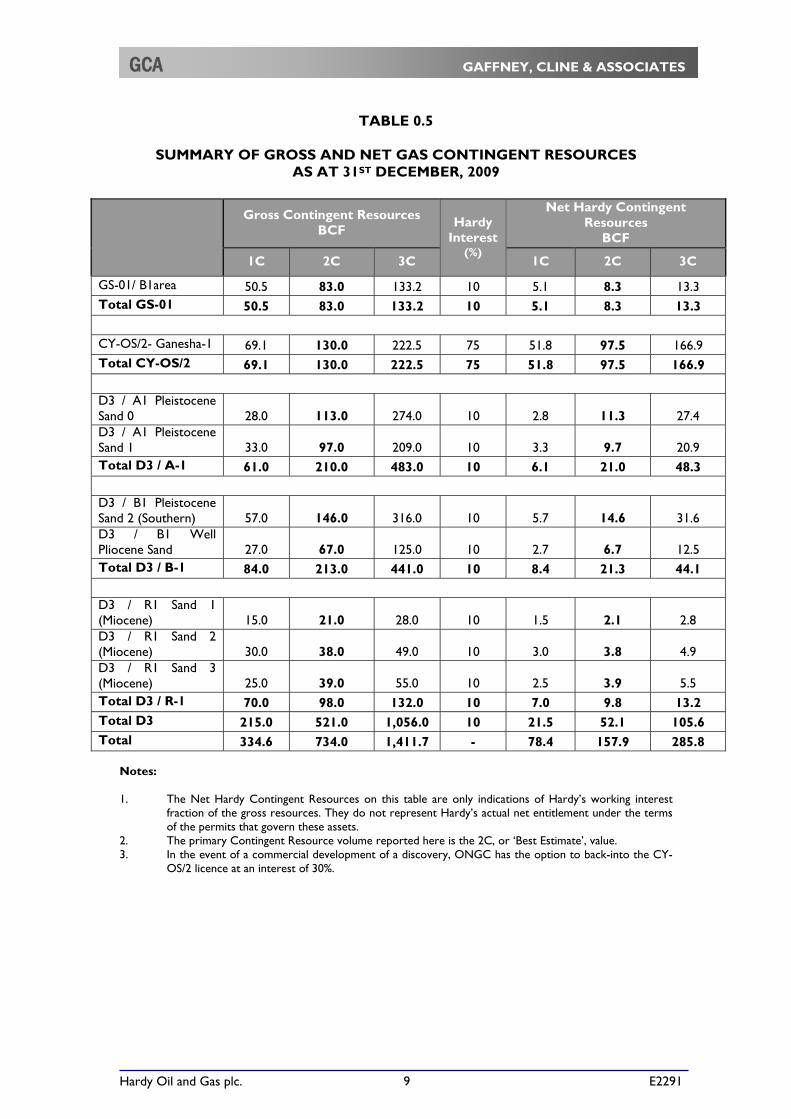
TABLE 0.5
SUMMARY OF GROSS AND NET GAS CONTINGENT RESOURCES AS AT 31ST DECEMBER, 2009
Gross Contingent Resources BCF
Hardy Interest
(%)
Net Hardy Contingent Resources
BCF
1C 2C 3C 1C 2C 3C
GS-01/ B1area 50.5 83.0 133.2 10 5.1 8.3 13.3 Total GS-01 50.5 83.0 133.2 10 5.1 8.3 13.3
CY-OS/2- Ganesha-1 69.1 130.0 222.5 75 51.8 97.5 166.9 Total CY-OS/2 69.1 130.0 222.5 75 51.8 97.5 166.9
D3 / A1 Pleistocene Sand 0 28.0 113.0 274.0 10 2.8 11.3 27.4 D3 / A1 Pleistocene Sand 1 33.0 97.0 209.0 10 3.3 9.7 20.9 Total D3 / A-1 61.0 210.0 483.0 10 6.1 21.0 48.3
D3 / B1 Pleistocene Sand 2 (Southern) 57.0 146.0 316.0 10 5.7 14.6 31.6 D3 / B1 Well Pliocene Sand 27.0 67.0 125.0 10 2.7 6.7 12.5 Total D3 / B-1 84.0 213.0 441.0 10 8.4 21.3 44.1
D3 / R1 Sand 1 (Miocene) 15.0 21.0 28.0 10 1.5 2.1 2.8 D3 / R1 Sand 2 (Miocene) 30.0 38.0 49.0 10 3.0 3.8 4.9 D3 / R1 Sand 3 (Miocene) 25.0 39.0 55.0 10 2.5 3.9 5.5 Total D3 / R-1 70.0 98.0 132.0 10 7.0 9.8 13.2 Total D3 215.0 521.0 1,056.0 10 21.5 52.1 105.6 Total 334.6 734.0 1,411.7 - 78.4 157.9 285.8
Notes: 1. The Net Hardy Contingent Resources on this table are only indications of Hardy’s working interest
fraction of the gross resources. They do not represent Hardy’s actual net entitlement under the terms of the permits that govern these assets.
2. The primary Contingent Resource volume reported here is the 2C, or ‘Best Estimate’, value. 3. In the event of a commercial development of a discovery, ONGC has the option to back-into the CY-
OS/2 licence at an interest of 30%.
Hardy Oil and Gas plc. 10 E2291
GCA GAFFNEY, CLINE & ASSOCIATES
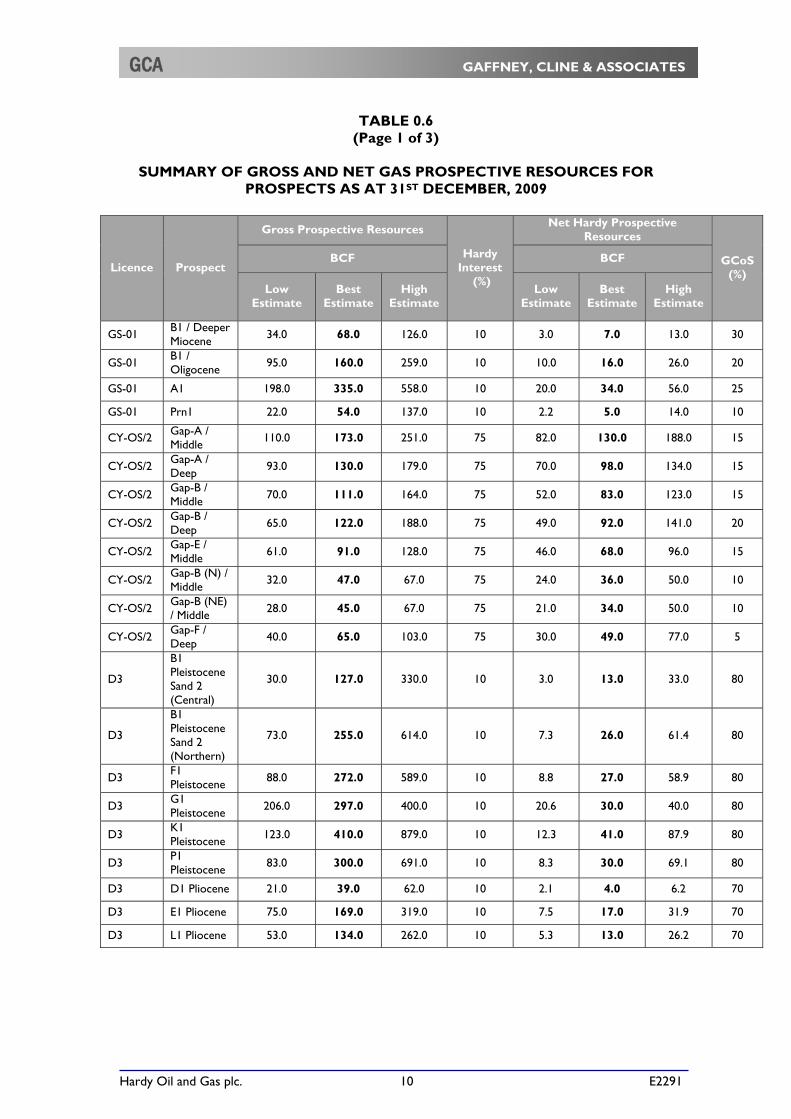
TABLE 0.6 (Page 1 of 3)
SUMMARY OF GROSS AND NET GAS PROSPECTIVE RESOURCES FOR
PROSPECTS AS AT 31ST DECEMBER, 2009
Licence Prospect
Gross Prospective Resources
Hardy Interest
(%)
Net Hardy Prospective Resources
GCoS (%)
BCF BCF
Low Estimate
Best Estimate
High Estimate
Low Estimate
Best Estimate
High Estimate
GS-01 B1 / Deeper Miocene
34.0 68.0 126.0 10 3.0 7.0 13.0 30
GS-01 B1 / Oligocene
95.0 160.0 259.0 10 10.0 16.0 26.0 20
GS-01 A1 198.0 335.0 558.0 10 20.0 34.0 56.0 25
GS-01 Prn1 22.0 54.0 137.0 10 2.2 5.0 14.0 10
CY-OS/2 Gap-A / Middle
110.0 173.0 251.0 75 82.0 130.0 188.0 15
CY-OS/2 Gap-A / Deep
93.0 130.0 179.0 75 70.0 98.0 134.0 15
CY-OS/2 Gap-B / Middle
70.0 111.0 164.0 75 52.0 83.0 123.0 15
CY-OS/2 Gap-B / Deep
65.0 122.0 188.0 75 49.0 92.0 141.0 20
CY-OS/2 Gap-E / Middle
61.0 91.0 128.0 75 46.0 68.0 96.0 15
CY-OS/2 Gap-B (N) / Middle
32.0 47.0 67.0 75 24.0 36.0 50.0 10
CY-OS/2 Gap-B (NE) / Middle
28.0 45.0 67.0 75 21.0 34.0 50.0 10
CY-OS/2 Gap-F / Deep
40.0 65.0 103.0 75 30.0 49.0 77.0 5
D3
B1 Pleistocene Sand 2 (Central)
30.0 127.0 330.0 10 3.0 13.0 33.0 80
D3
B1 Pleistocene Sand 2 (Northern)
73.0 255.0 614.0 10 7.3 26.0 61.4 80
D3 F1 Pleistocene
88.0 272.0 589.0 10 8.8 27.0 58.9 80
D3 G1 Pleistocene
206.0 297.0 400.0 10 20.6 30.0 40.0 80
D3 K1 Pleistocene
123.0 410.0 879.0 10 12.3 41.0 87.9 80
D3 P1 Pleistocene
83.0 300.0 691.0 10 8.3 30.0 69.1 80
D3 D1 Pliocene 21.0 39.0 62.0 10 2.1 4.0 6.2 70
D3 E1 Pliocene 75.0 169.0 319.0 10 7.5 17.0 31.9 70
D3 L1 Pliocene 53.0 134.0 262.0 10 5.3 13.0 26.2 70

Hardy Oil and Gas plc. 11 E2291
GCA GAFFNEY, CLINE & ASSOCIATES
TABLE 0.6 (Page 2 of 3)
SUMMARY OF GROSS AND NET GAS PROSPECTIVE RESOURCES FOR
PROSPECTS AS AT 31ST DECEMBER, 2009
Licence Prospect
Gross Prospective Resources
Hardy Interest
(%)
Net Hardy Prospective Resources
GCoS (%)
BCF BCF
Low Estimate
Best Estimate
High Estimate
Low Estimate
Best Estimate
High Estimate
D3 U1 Sand 1 Pliocene
52.0 134.0 291.0 10 5.0 13.0 29.0 70
D3 U1 Sand 2 Pliocene
74.0 161.0 306.0 10 7.0 16.0 31.0 70
D3 QA1 Sand 1 Pliocene
98.0 168.0 270.0 10 9.8 16.8 27.0 70
D3 U2 Sand Pliocene
72.0 166.0 318.0 10 7.0 16.0 32.0 70
D3 S1 Sand 1 Pliocene
39.0 68.0 104.0 10 3.9 7.0 10.0 70
D3 S1 Sand2 Pliocene
50.0 70.0 100.0 10 5.0 7.0 10.0 70
D3 T1
Pliocene 52.0 75.0 105.0 10 5.0 7.5 11.0 70
D3 W1 Sand 1 Pliocene
90.0 153.0 248.0 10 9.0 15.3 24.8 70
D3 W1 Sand 2 Pliocene
176.0 293.0 438.0 10 17.6 29.3 43.8 70
D3 G1
Miocene 112.0 328.0 675.0 10 11.0 33.0 68.0 70
D3 J1 Miocene 135.0 281.0 524.0 10 14.0 28.0 52.0 70
D3 M1
Miocene 175.0 464.0 904.0 10 18.0 46.0 90.4 70
D3 QA1 Sand 2 Miocene
204.0 308.0 455.0 10 20.4 30.8 45.5 70
D3 R1 Sand Miocene
23.0 38.0 58.0 10 2.0 4.0 6.0 70
D3 W1 Sand 3 Miocene
117.0 190.0 282.0 10 12.0 19.0 28.0 70
D3 H1
Oligocene 334.0 840.0 1,641.0 10 33.0 84.0 164.0 24
D3 Z1
Oligocene 89.0 300.0 703.0 10 9.0 30.0 70.3 24
D9
Northern Anticline
(NW Flank B1) / U. Miocene
800.0 2,500.0 5,600.0 10 80.0 250.0 560.0 20
Hardy Oil and Gas plc. 12 E2291
GCA GAFFNEY, CLINE & ASSOCIATES
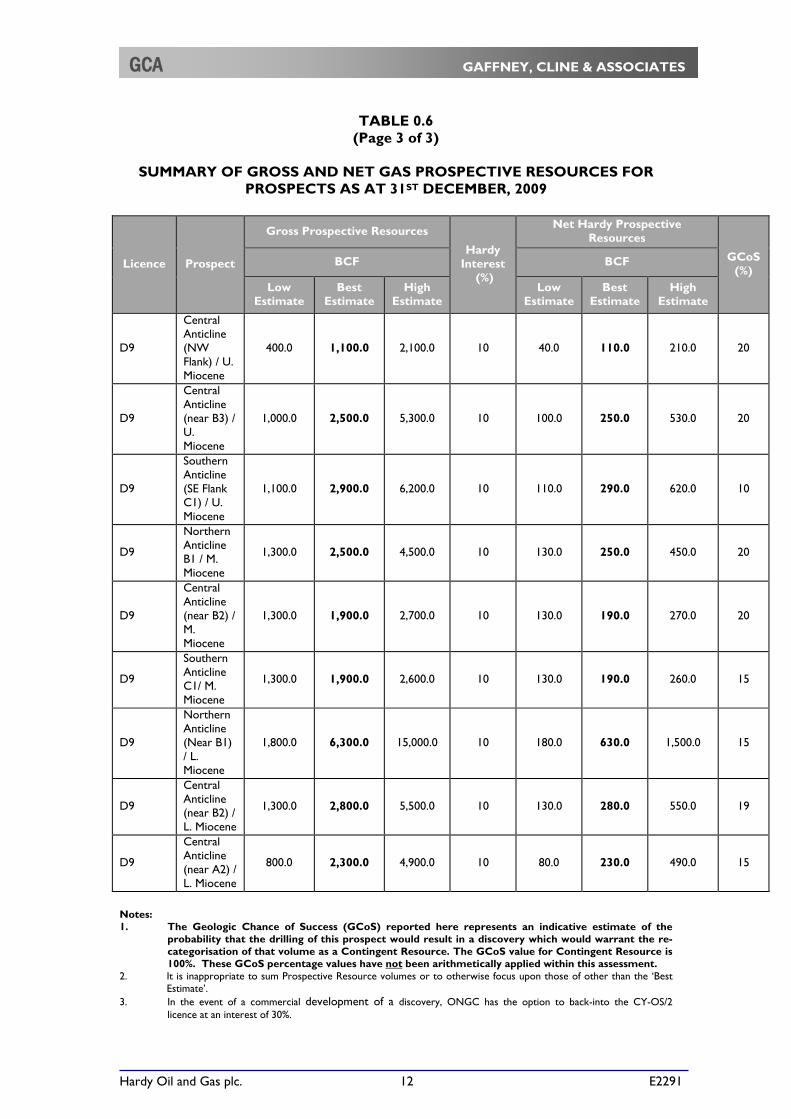
TABLE 0.6 (Page 3 of 3)
SUMMARY OF GROSS AND NET GAS PROSPECTIVE RESOURCES FOR
PROSPECTS AS AT 31ST DECEMBER, 2009
Licence Prospect
Gross Prospective Resources
Hardy Interest
(%)
Net Hardy Prospective Resources
GCoS (%)
BCF BCF
Low Estimate
Best Estimate
High Estimate
Low Estimate
Best Estimate
High Estimate
D9
Central Anticline (NW Flank) / U. Miocene
400.0 1,100.0 2,100.0 10 40.0 110.0 210.0 20
D9
Central Anticline (near B3) / U. Miocene
1,000.0 2,500.0 5,300.0 10 100.0 250.0 530.0 20
D9
Southern Anticline (SE Flank C1) / U. Miocene
1,100.0 2,900.0 6,200.0 10 110.0 290.0 620.0 10
D9
Northern Anticline B1 / M. Miocene
1,300.0 2,500.0 4,500.0 10 130.0 250.0 450.0 20
D9
Central Anticline (near B2) / M. Miocene
1,300.0 1,900.0 2,700.0 10 130.0 190.0 270.0 20
D9
Southern Anticline C1/ M. Miocene
1,300.0 1,900.0 2,600.0 10 130.0 190.0 260.0 15
D9
Northern Anticline (Near B1) / L. Miocene
1,800.0 6,300.0 15,000.0 10 180.0 630.0 1,500.0 15
D9
Central Anticline (near B2) / L. Miocene
1,300.0 2,800.0 5,500.0 10 130.0 280.0 550.0 19
D9
Central Anticline (near A2) / L. Miocene
800.0 2,300.0 4,900.0 10 80.0 230.0 490.0 15
Notes: 1. The Geologic Chance of Success (GCoS) reported here represents an indicative estimate of the
probability that the drilling of this prospect would result in a discovery which would warrant the re-categorisation of that volume as a Contingent Resource. The GCoS value for Contingent Resource is 100%. These GCoS percentage values have not been arithmetically applied within this assessment.
2. It is inappropriate to sum Prospective Resource volumes or to otherwise focus upon those of other than the ‘Best Estimate’.
3. In the event of a commercial development of a discovery, ONGC has the option to back-into the CY-OS/2 licence at an interest of 30%.

Hardy Oil and Gas plc. 13 E2291
GCA GAFFNEY, CLINE & ASSOCIATES
TABLE 0.7
SUMMARY OF GROSS AND NET OIL PROSPECTIVE RESOURCES FOR PROSPECTS AS AT 31ST DECEMBER, 2009
Notes: 1. The Geologic Chance of Success (GCoS) reported here represents an indicative estimate of the
probability that the drilling of this prospect would result in a discovery which would warrant the re-categorisation of that volume as a Contingent Resource. The GCoS value for Contingent Resource is 100%. These GCoS percentage values have not been arithmetically applied within this assessment.
2. It is inappropriate to sum Prospective Resource volumes or to otherwise focus upon those of other than the ‘Best Estimate’.
DISCUSSION 1. INDIA
Hardy has five assets offshore India as shown in Figure 0.1. Most of these lie in the Bay of Bengal on the eastern side of the sub-continent. In and beyond the Krishna-Godavari Basin, are the deepwater exploration blocks KG-DWN-2003/1 (or KG D3) (NELP V) and KG-DWN-2001/1(or KG D9) (NELP III), while further south, in the Cauvery Basin is exploration licence CY-OS/2, within the geographical limits of which lies the producing field PY-3. On the western margin, in the Arabian Sea, lies licence GS-OSN-2000/1 (NELP II in the Bombay Basin. In addition, Hardy has the onshore Assam block (AS-ONN-2000/1) exploration licence within the Assam-Arakan Basin, north-east India. 1.1 Cauvery Basin The Cauvery Basin is the sedimentary basin located on and offshore Tamil Nadu State, south-east India. It is the most southerly basin on the east coast and encloses an area of more than 50,000 km2, of which about half is onshore. The rift basin was formed during Late Jurassic/Early Cretaceous as a result of the break-up of eastern Gondwanaland. NE-SW trending horst and graben structures formed during this period and dominated the structural grain of the basin, following which these features were buried to form a single passive margin setting. The dominant structure was formed by a north/south dextral strike-slip movement between the main Indian sub-continent and Sri Lanka. The basement is Pre-cambrian
Licence Prospect
Gross Prospective Resources
Hardy W.I. (%)
Net Hardy Prospective Resources
GCoS (%)
MMBbl MMBbl
Low Estimate
Best Estimate
High Estimate
Low Estimate
Best Estimate
High Estimate
D9
Central Anticline (4 way fault
closure B2) / Palaeocene
142.0 420.0 961.0 10 14.2 42.0 96.1 18
D9
Central Anticline
(Fault Closure B2) /
Cretaceous
44.0 122.0 260.0 10 4.4 12.2 26.0 18

Hardy Oil and Gas plc. 14 E2291
GCA GAFFNEY, CLINE & ASSOCIATES
(Archean), and sediment fill, which in places reaches a thickness of 7 km, ranges from Permo-Carboniferous to Recent. The NE-SW-orientated sub-basins characterising the Cauvery Basin are an en-echelon array of rift basins offset by basement highs. In the Hardy acreage lie the Ariyalur-Pondicherry and Tranquebar sub-basins, separated by the Porto Novo High (on which lies the gasfield PY-1) as shown in Figure 1.1. Rifting in the Barremian-Aptian started with fluvio-lacustrine deposition in half-grabens followed in the early Albian by a marine transgression. The main extensional phase occurred in the mid-Albian, when faulting led to uplift and erosion. Material reworked at the basin edges flowed into the low sub-basinal areas as fault-scarp conglomerates. The existence of turbidite sand bodies downdip of organic marine shales constituted a viable petroleum exploration play. Rifting ceased in the Cenomanian or Turonian after which thermal subsidence predominated. The post-rift stratigraphy consists of packages of mainly shallow marine and fluvial sandstones and sand-rich carbonates, separated by unconformities (see the lithostratigraphic column Figure 1.2). The source rocks in the basin are organic-rich marine black shales of the Karai Clay Formation deposited in Albian/Aptian to Turonian times. These organic shales can be 100 m thick. They are overlain by major reservoir sand bodies such as the Bhuvanagiri, Nannilam (the reservoir in the PY-3 Field), and Kamalapuram ranging in age from Cenomanian to Eocene (Figure 1.2). The reservoir units are sealed by shales and limestones in a cyclic sequence. Exploration targets have progressed from the structural graben-horst features, to deepwater sands and stratigraphic traps such as those drilled by Hardy in wells Fan E-1 and Fan A-1 (subsequently known as Ganesha-1) in 2006. 1.1.1 PY-3 Field (Hardy NWI 18%)
The PY-3 field is located in the Cauvery offshore basin. It commenced production in July, 1997, and is presently the only producing oil field in Production Licence CY-OS-90/1 (Figure 1.1). The Licence covers some 81 km2 and the water depth ranges from 40 m to about 450 m. The field is operated by Hardy, which holds an 18% Net Working Interest under a Production Sharing Contract (PSC) with The Government of India. The other licensees are ONGC (40%), Tata Petrodyne (21%) and HOEC (21%). The PSC expires in December, 2019, but can be extended by mutual agreement for a further five years. Hardy has made available to GCA a dataset of technical information that included the Hardy PY-3 PETREL Project and seismic data, velocity cube, petrophysical summary, ECLIPSE model, artificial lift selection study, well test analysis plus all available production and injection data together with financial data, including the PSC and cost data.

Hardy Oil and Gas plc. 15 E2291
GCA GAFFNEY, CLINE & ASSOCIATES
FIGURE 1.1
LOCATION OF PY-3 FIELD AND BLOCK CY-OS/2,
OFFSHORE CAUVERY BASIN, INDIA
CY-DWN2001/2CY-DWN2001/2CY-DWN2001/2CY-DWN2001/2CY-DWN2001/2CY-DWN2001/2CY-DWN2001/2CY-DWN2001/2CY-DWN2001/2
BHUVANAGI.02BHUVANAGI.02BHUVANAGI.02BHUVANAGI.02BHUVANAGI.02BHUVANAGI.02BHUVANAGI.02BHUVANAGI.02BHUVANAGI.02
CY-ONN2002/1CY-ONN2002/1CY-ONN2002/1CY-ONN2002/1CY-ONN2002/1CY-ONN2002/1CY-ONN2002/1CY-ONN2002/1CY-ONN2002/1
CY-ONN2002/2CY-ONN2002/2CY-ONN2002/2CY-ONN2002/2CY-ONN2002/2CY-ONN2002/2CY-ONN2002/2CY-ONN2002/2CY-ONN2002/2
CY-ONN2004/1CY-ONN2004/1CY-ONN2004/1CY-ONN2004/1CY-ONN2004/1CY-ONN2004/1CY-ONN2004/1CY-ONN2004/1CY-ONN2004/1
CY-ONN2004/2CY-ONN2004/2CY-ONN2004/2CY-ONN2004/2CY-ONN2004/2CY-ONN2004/2CY-ONN2004/2CY-ONN2004/2CY-ONN2004/2 KALIKALIKALIKALIKALIKALIKALIKALIKALI
KUTHALAMKUTHALAMKUTHALAMKUTHALAMKUTHALAMKUTHALAMKUTHALAMKUTHALAMKUTHALAM
L-IL-IL-IL-IL-IL-IL-IL-IL-I
L-I (EXTN.)L-I (EXTN.)L-I (EXTN.)L-I (EXTN.)L-I (EXTN.)L-I (EXTN.)L-I (EXTN.)L-I (EXTN.)L-I (EXTN.)
L-XIL-XIL-XIL-XIL-XIL-XIL-XIL-XIL-XI
MADANAM
MYILADUTHURAI
NEYVELI
Sri Lanka
nnnnnnnnn
IndiaIndiaIndiaIndiaIndiaIndiaIndiaIndiaIndia
NepalPakistanPakistanPakistanPakistanPakistanPakistanPakistanPakistanPakistan
B a yB a yB a yB a yB a yB a yB a yB a yB a yo fo fo fo fo fo fo fo fo f
B e n g a lB e n g a lB e n g a lB e n g a lB e n g a lB e n g a lB e n g a lB e n g a lB e n g a l
Bhutan
Myanmar
AndamanAndamanAndamanAndamanAndamanAndamanAndamanAndamanAndamanSeaSeaSeaSeaSeaSeaSeaSeaSea
BangladeshBangladeshBangladeshBangladeshBangladeshBangladeshBangladeshBangladeshBangladesh
0 30 Km
CY-OS-2
PY-3 Field
Ganesha-1 Well
Hardy Block Interests
Oil Field
LEGEND
Gas FieldGas Condensate Field
Karaikal High
MadanamHigh
Porto NovoHigh
Indian Craton
T r a n q u e b a r S u b b a s I n
High Areas
Source: GCA/Petroview
CY-OS-90/1
PY-1 Field
Fan E-1 Well
CY-OS-2
Porto NovoHigh

Hardy Oil and Gas plc. 16 E2291
GCA GAFFNEY, CLINE & ASSOCIATES
FIGURE 1.2
CAUVERY BASIN LITHOSTRATIGRAPHIC COLUMN
Age LithostratigraphyRegional / BasinalTectonic Events U
nit Play /
Play Fairways
Res
ervo
ir
So
urc
e
Sea
l
Post Mid-Miocene
Eocene to Mid-Miocene
Paleocene to Eocene
Coniacian to Maastrichtian
Uni
t 6U
nit 5
Uni
t 4U
nit 3
Uni
t 2U
nit 1
Bas
emen
t
Albian/Cenomanian/
Turonian
Pre-Albian
Pre-Cambrian
Rif ting of EastGondwanaland
Madagascarseparated f rom
India/Reactivationof Basement Highs
S Y
N R
I F
TP
O
S
T
-R
I
F
T
Deccan trapvolcanism/basin tilt SE
Indian platecollided withTibetan plate
Indian platecollided with
Eurasian plate/basin tilt E
Niravi Play
Kamalapuram
Nannilam(PY-3 Reservoir)
Bhuvanagiri
Syn Rif t
FracturedBasement
(PY-1 Reservoir)
UNCONFORMITY
UNCONFORMITY
UNCONFORMITY
UNCONFORMITY
UNCONFORMITY
UNCONFORMITY
+
Source: Hardy
Hardy Oil and Gas plc. 17 E2291
GCA GAFFNEY, CLINE & ASSOCIATES
Geology & Geophysics
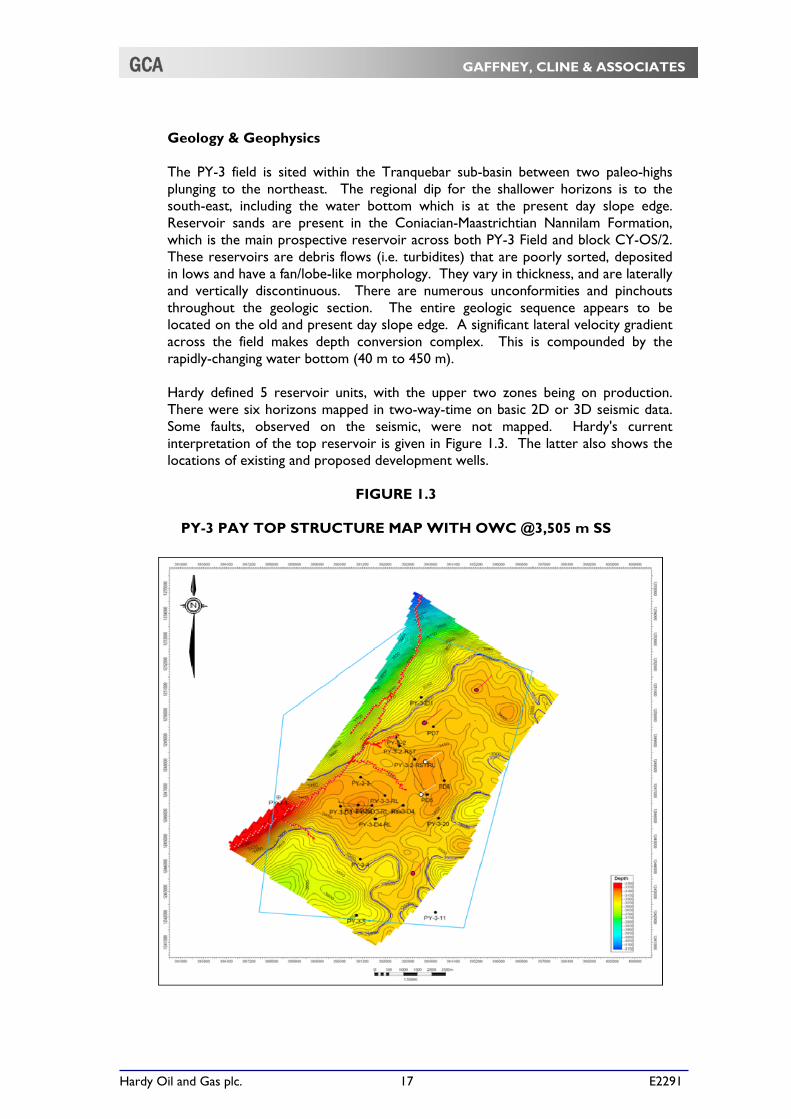
The PY-3 field is sited within the Tranquebar sub-basin between two paleo-highs plunging to the northeast. The regional dip for the shallower horizons is to the south-east, including the water bottom which is at the present day slope edge. Reservoir sands are present in the Coniacian-Maastrichtian Nannilam Formation, which is the main prospective reservoir across both PY-3 Field and block CY-OS/2. These reservoirs are debris flows (i.e. turbidites) that are poorly sorted, deposited in lows and have a fan/lobe-like morphology. They vary in thickness, and are laterally and vertically discontinuous. There are numerous unconformities and pinchouts throughout the geologic section. The entire geologic sequence appears to be located on the old and present day slope edge. A significant lateral velocity gradient across the field makes depth conversion complex. This is compounded by the rapidly-changing water bottom (40 m to 450 m).
Hardy defined 5 reservoir units, with the upper two zones being on production. There were six horizons mapped in two-way-time on basic 2D or 3D seismic data. Some faults, observed on the seismic, were not mapped. Hardy's current interpretation of the top reservoir is given in Figure 1.3. The latter also shows the locations of existing and proposed development wells.
FIGURE 1.3
PY-3 PAY TOP STRUCTURE MAP WITH OWC @3,505 m SS
Hardy Oil and Gas plc. 18 E2291
GCA GAFFNEY, CLINE & ASSOCIATES
Following Hardy’s 2006 3D interpretation, additional volumes were attributed to the field in the south-east, north-east and core area. The core area comprises the main producing area, which had increased in volume as a result of raising the structure and incorporating two deeper reservoir zones within closure.
The 3D seismic dataset proved to be of fair to good quality and the new mapping resulted in substantially revised geological and reservoir models affecting STOIIP and resource estimates. There is a significant water-bottom change in the north/north-east part of the concession which materially influences the depth structure maps as a result of the depth conversion. A major contribution to the STOIIP increases derives from the time to depth conversion. A detailed examination of this depth conversion was undertaken by GCA. The general work flow for the two-way-time conversion to depth followed standard industry practices, using stacking velocities to compute smoothed average velocities which were tied to the wells to provide an average velocity cube with which to convert time mapping to depth.
The seismic, wells, velocity field and top and base of the PY-3 reservoir were validated. It is GCA's opinion that there exists some uncertainty under and around the rapid water-bottom change in the north-east. Several seismic, velocity and depth profiles showed that there is a significant velocity gradient laterally from shallow to deep water within the two-way time interval of about 1,200 ms to 3,300 ms, which clearly impacts on the conversion to the depth structure map. The average velocity map to the top of the PY-3 reservoir revealed a change in average velocity from 2,020 m/sec (450 m WD) in the north-east to 2,330 m/sec (80 m WD) in the south-east. This factor affects the STOIIP estimation to the north and north-east.
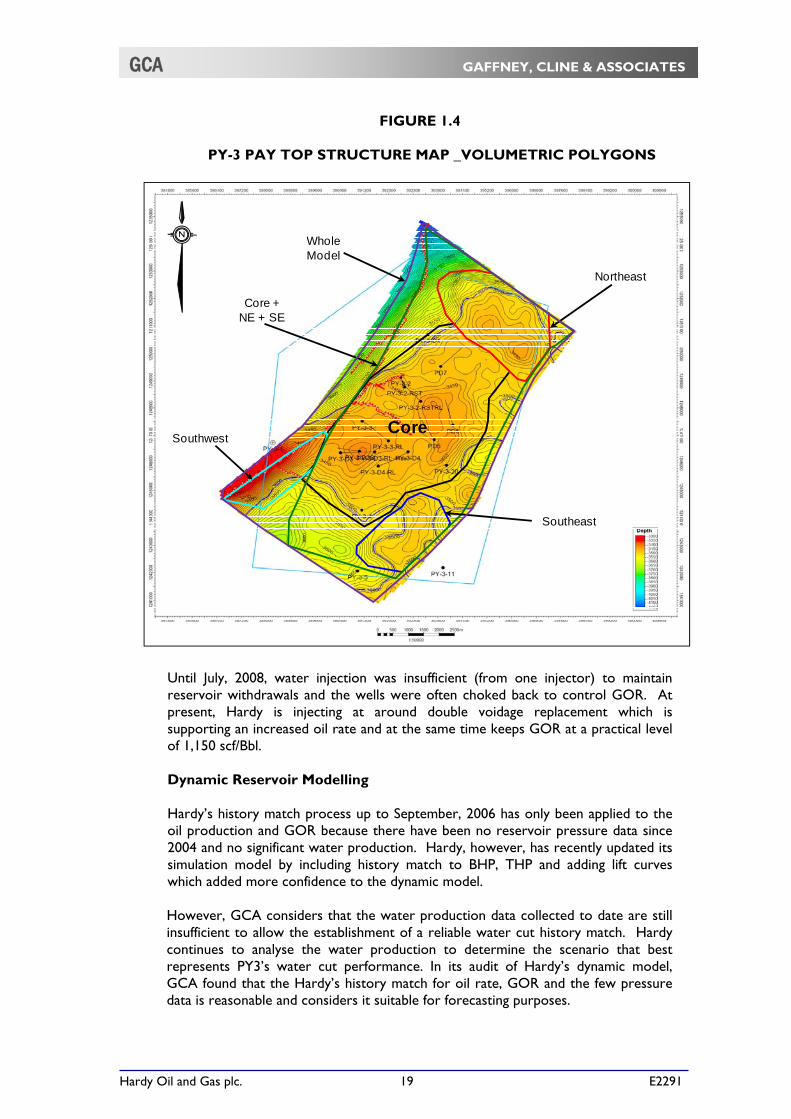
It is GCA's opinion that there remains uncertainty in the presence of debris flows in the west and southwest and questionable structural closure to the northeast. However, Hardy’s recent work through field re-mapping, revised geological modelling and additional petrophysical analysis increased the level of confidence in the Hardy’s volumetric estimations. An updated STOIIP was reported by Hardy in November, 2009 based on this recent work. These estimates were 127, 145 and 157 MMBbl at the Low, Best and High levels considering core area, core- south-east, north-east and whole model respectively (Figure 1.4). GCA accepted Hardy’s STOIIP figures.
Production Performance
The PY-3 field has been producing since July, 1997. Production wells are tied back to a floating production facility and oil is exported by shuttle tanker. Water injection started in September 2003 (FDP phase II). GCA review of wells and field performance up to end of December, 2009 indicated a cumulative production of 22.9 MMBbl. After its start, PY3 production peaked to around 10,000 bopd in 1998, and declined gradually afterward mainly because of water breakthrough and eventually the shutdown of wells. Currently, the field is producing from well PD3S at around 3,500 bopd, with water injection into the reservoir via wells 3-2RST-RL and 3-3-3RL at around 6,820 bwpd. Since commencement of production PY3 has averaged about 1,120 scf/Bbl (GOR), about 3.2% (WC) and 3,700 psi (PDHG) reservoir pressure.
Hardy Oil and Gas plc. 19 E2291
GCA GAFFNEY, CLINE & ASSOCIATES
FIGURE 1.4
PY-3 PAY TOP STRUCTURE MAP _VOLUMETRIC POLYGONS
Until July, 2008, water injection was insufficient (from one injector) to maintain reservoir withdrawals and the wells were often choked back to control GOR. At present, Hardy is injecting at around double voidage replacement which is supporting an increased oil rate and at the same time keeps GOR at a practical level of 1,150 scf/Bbl.
Dynamic Reservoir Modelling
Hardy’s history match process up to September, 2006 has only been applied to the oil production and GOR because there have been no reservoir pressure data since 2004 and no significant water production. Hardy, however, has recently updated its simulation model by including history match to BHP, THP and adding lift curves which added more confidence to the dynamic model. However, GCA considers that the water production data collected to date are still insufficient to allow the establishment of a reliable water cut history match. Hardy continues to analyse the water production to determine the scenario that best represents PY3’s water cut performance. In its audit of Hardy’s dynamic model, GCA found that the Hardy’s history match for oil rate, GOR and the few pressure data is reasonable and considers it suitable for forecasting purposes.
Northeast
Southeast
Southwest
Core + NE + SE
Core
Whole Model
Hardy Oil and Gas plc. 20 E2291
GCA GAFFNEY, CLINE & ASSOCIATES
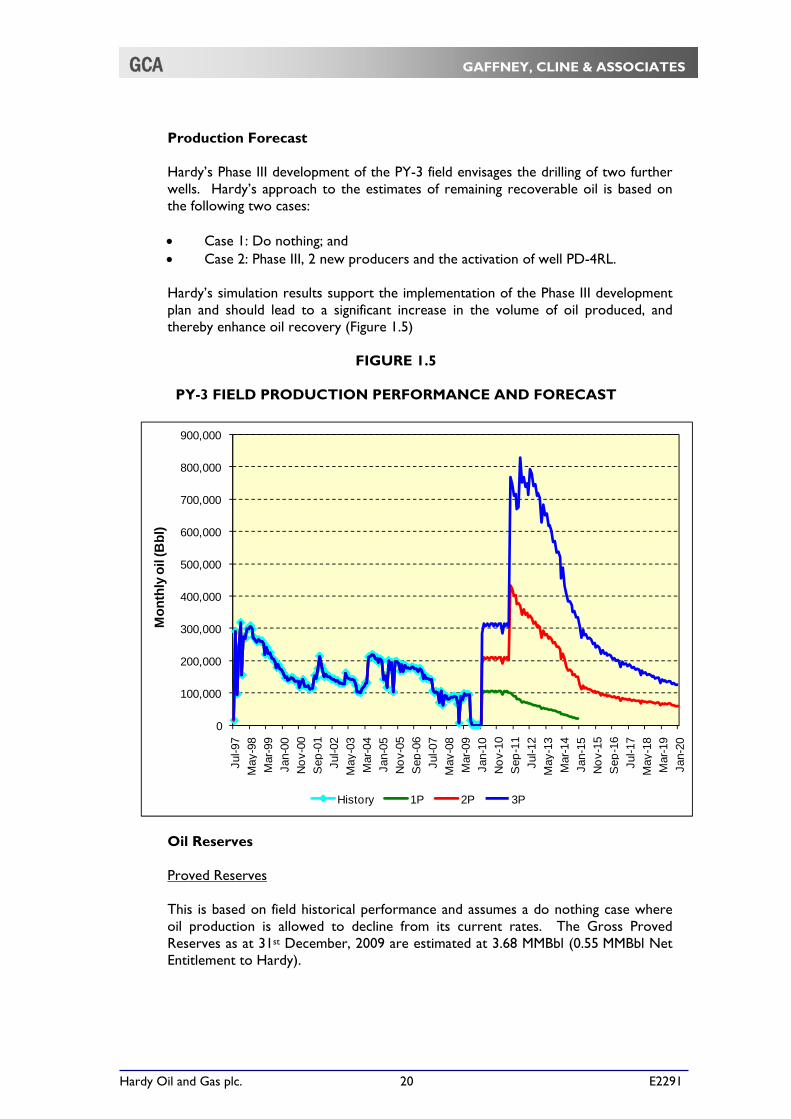
Production Forecast
Hardy’s Phase III development of the PY-3 field envisages the drilling of two further wells. Hardy’s approach to the estimates of remaining recoverable oil is based on the following two cases:
Case 1: Do nothing; and Case 2: Phase III, 2 new producers and the activation of well PD-4RL. Hardy’s simulation results support the implementation of the Phase III development plan and should lead to a significant increase in the volume of oil produced, and thereby enhance oil recovery (Figure 1.5)
FIGURE 1.5
PY-3 FIELD PRODUCTION PERFORMANCE AND FORECAST
Oil Reserves
Proved Reserves This is based on field historical performance and assumes a do nothing case where oil production is allowed to decline from its current rates. The Gross Proved Reserves as at 31st December, 2009 are estimated at 3.68 MMBbl (0.55 MMBbl Net Entitlement to Hardy).
0
100,000
200,000
300,000
400,000
500,000
600,000
700,000
800,000
900,000
Jul-9
7
May
-98
Mar
-99
Jan-
00
No
v-00
Se p
-01
Jul-0
2
Ma y
-03
Mar
-04
Jan-
05
No
v-05
Se p
-06
Jul-0
7
Ma y
-08
Mar
-09
Jan-
10
No
v-10
Se p
-11
Jul-1
2
Ma y
-13
Mar
-14
Jan-
15
No
v-15
Se p
-16
Jul-1
7
Ma y
-18
Mar
-19
Jan-
20
Mo
nth
ly o
il (B
bl)
History 1P 2P 3P
Hardy Oil and Gas plc. 21 E2291
GCA GAFFNEY, CLINE & ASSOCIATES
Proved plus Probable Reserves
For the Proved plus Probable Reserves case, GCA incorporated Hardy’s Phase III field development plan by including two further producers to be drilled in January, 2011 and the activation of well PD-4RL. The resulting estimated Gross Proved plus Probable Reserves as at 31st December, 2009 are 16.33 MMBbl (2.53 MMBbl Net Entitlement to Hardy). Proved plus Probable plus Possible Reserves
This is based on PY-3 field performance, Hardy’s Phase III activities, and three further producers in the north, north-east & south-east parts of the field that are to come on stream end 2011. For this case, however, Hardy assumed that all five wells (of the probable and the possible cases) will be drilled in one campaign as reflected by the forecast profile for the Proved plus Probable plus Possible case in Figure 1.5. GCA estimated Gross Proved plus Probable plus Possible Reserves are at 20.99 MMBbl (3.37 MMBbl Net Entitlement to Hardy as at 31st December, 2009).
1.1.2 Block CY-OS/2 (Hardy NWI 75%, Operator)
The CY-OS/2 Block is located in the Cauvery Basin and encompasses an area of 859 km2. The CY-OS/2 block which after various relinquishments is now split into northern and southern sectors, (Figure 1.1), is operated by Hardy. Hardy has a 75% WI, and remaining 25% is held by GAIL. Water depths over the retained areas range from a few tens of metres at points where the acreage is 2 km from the shore, to almost 500 m at its remotest point (Figure 1.1).
The Block was awarded in 1996 under a PSC, the terms of which provided for three exploration phases, the last of which expired, with all commitments fulfilled, on 23rd March, 2007. The PSC provides for 100% Cost Recovery and Profit Oil sharing. As the PSC pre-dates the NELP, in the event of a commercial discovery, ONGC has the option to back-into the block at an interest of 30%. At the time of this report, a proposed appraisal programme (approved by the operating committee) is being reviewed by the Directorate General of Hydrocarbons (DGH). Hardy is involved in a debate on the nature of fluid in well Fan-A-I (aka Ganesha-1) discovery with the DGH. Hardy maintains the discovery as gas based on the test results and the results of DST-2 where it flowed around 10.7 MMscfd of gas with some condensate. DST-1 was inconclusive because the tubing became plugged while testing and the well flowed small quantity of fluids but was predominantly gas with condensate. The DGH has restricted the appraisal period to 24 months from discovery date interpreting the discovery as oil. Hardy has submitted all the relevant documents to the MOPNG and the DGH supporting the nature of the discovery as gas. The documents provided to the DGH, included the DST reports by Schlumberger, the CPCL (Chennai Petroleum Corporation Limited) laboratory reports on the liquid samples collected from DST#1 & #2 and the ISM University report. Hardy has submitted to the DGH the legal opinions from an independent lawyer and from the Attorney General of India, which opines that Hardy should get 60 months extension under the PSC. The significance of this is that if it is only oil, then there is a twenty four month appraisal period from January, 2007; if it is oil and gas where gas predominates, then there is a five year appraisal period from January, 2007. Hardy is currently awaiting the decision of the MOPNG, GOI.

Hardy Oil and Gas plc. 22 E2291
GCA GAFFNEY, CLINE & ASSOCIATES
In the preparation of this CPR, GCA has accepted Hardy’s explanation but acknowledges that the decision of the MOPNG, GOI could have a significant impact on the CY-OS/2 license. The CY-OS/2 block contains 12,000 line km of 2D seismic, 1,381 km of which have been re-processed. Four 3D seismic surveyshave been shot totaling almost 830 km2.
Two relinquishments have been made, one at the end of each of the first two exploration phases. In the final exploration phase, from May, 2005 to March, 2007, Hardy has acquired 653 km2 of the above 3D (617 km on-block) and drilled two wells; Fan E-1, which was dry (the main Eocene reservoir was absent), and Fan A-1, as described earlier. This well is now renamed Ganesha-1. Well Fan E-1 is in the Tranquebar sub-basin, and well Ganesha-1 is in the Araiyalur-Pondicherry sub-basin to the north (Figure 1.1). Subsequent to the publication of GCA’s CPR of 2008, several studies have been undertaken including a Pre-Stack Depth Migration (PSDM), Hardy/CGG report of reservoir characterization through the analysis of the seismic inversion volumes and the conducting a pore pressure study.
Well Fan A-1 (now Ganesha-1)
The Ganesha-1 well was spudded on 26th September, 2006, and drilled as a vertical hole to a depth of 4,089 m MD where it terminated in Turonian Sattapadi shales, having intersected all prognosed targets. Hydrocarbon shows were logged in the Nannilam (Campanian) and Bhuvanagiri (Turonian) Formations, and between these a thin sand flow-tested gas. The prospective intervals were seismically identified fans that relied upon updip pinchout of the re-worked shelfal sands against shale-prone deepwater slope sediments. Top seal was provided by transgressive deepwater shale. The dual nature of the potential targets – Campanian sands of the Nannilam Formation underlain by Turonian sands of the Bhuvangiri Formation – is seen very clearly, partly because of anomalous seismic amplitude response, particularly at the shallower level.
The well encountered both the Campanian sands (Top Fan sand), a Middle Fan sand, consisting of Santonian and Coniacian sands developed as thin intervals within the Kudavasal Shale Formation and the Turonian sands (Deep Fan sand). Shows were observed in the cuttings while drilling through each sand. Flow tests were run on the Deep Fan sand and the Middle Fan sand. According to the Final Geological Report for the well, the Top Fan sand, in which 50 m of net sand were intersected, was not tested because of heavy mud losses experienced while drilling. Two MDT samples in this sand provided no representative formation fluid (though they revealed the presence of gas). Hydrocarbon shows were encountered during drilling, at three (possibly four) zones in the Top Fan sand.

Hardy Oil and Gas plc. 23 E2291
GCA GAFFNEY, CLINE & ASSOCIATES
The Deep Fan sand, occurred at 3,759 m MD as two sand bodies each about 20 m thick separated by 15 m of shale: net sand was about 35 m, with log-derived porosity 14-17%. The zone from 3,800 m to 3,809 m was tested, producing a weak flow of gas and condensate, and anomalously ‘fresh’ water (all test results are summarised below). DST-1, in the Deep Fan sand, is considered unreliable due to the reported heavy mud losses. This may have been contributed to poor casing cementation, so the well was sidetracked a horizontal distance of about 250 m at the target level. This time the Bhuvanagiri sandstone occurred as a single 45 m sand. Two tests were run, opening perforations from 3,775-3,795 m (DST-4), and then 3,779-3,785 m plus 3,805-3,812 m (DST-4A). The results essentially replicated those of DST-1; as before, the cement bond log indicated poor cementation.
Well Ganesha-1: Summary of DST Results
Interval Test Depth (m MD)
Results
Deep Fan Sand DST-1 3,800 – 3,809 Max gas 0.47 MMscfd, Max cond. 2.4 bcpd, Freshwater c. 120 bpd
Middle Fan Sand DST-2 3,565 – 3,569 Max gas 10.7 MMscfd, Max gas 10.7 MMscfd falling to 1.47 MMscfd
Middle Fan Sand DST-3 3,336 – 3,341 Intermittent gas 0.1 MMscfd
Deep Fan Sand DST-4 (in ST) 3,775 – 3,795 100 bpd freshwater with weak gas flow
Deep Fan Sand DST-4A (in ST) 3,779 -3,785 & 3,805 – 3,812
Gas flow 0.47 MMscfd plus freshwater
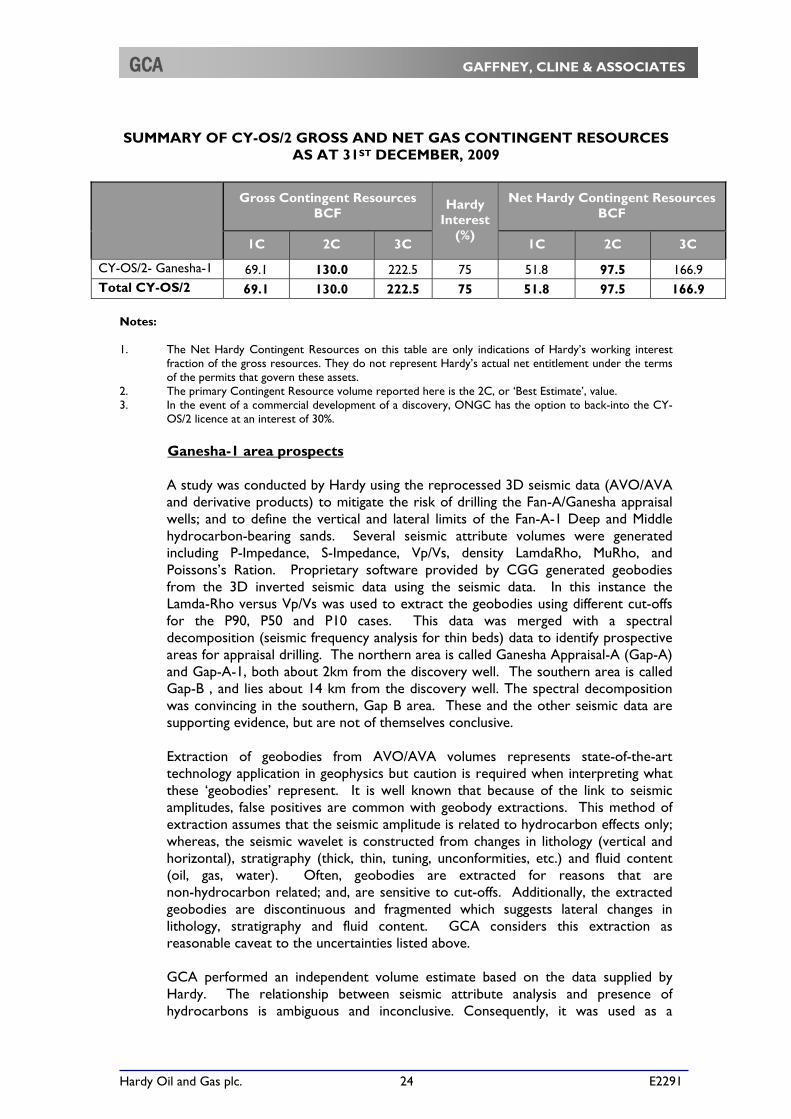
The water produced in DST’s 1, 4 and 4A was typically of salinity 2,500 – 2,800 mg/litre. GCA petrophysical analysis has shown that this does not correspond to the formation water. The Middle Fan sand was encountered between 3,565 to 3,569 m. The zone flowed gas (DST-2) at rates which declined from a maximum of 10.7 MMscfd to 1.47 MMscfd showing that a small permeable reservoir was tested and depleted on production. The reservoir had a channel-like morphology: long (119 m) and narrow (37 to 58 m) and thin (1 m). This tight reservoir may recharge from surrounding low permeable sandstones but the stable flow rate would be less than 1.14 MMscfd based on a reservoir engineering study. A further 5 m section, at 3,336-3,341 m was tested by DST3, but also yielded disappointing results. GCA agrees with Hardy’s interpretation of hydrocarbon presence in both the Deep Fan sand and in the Middle Fan sand. GCA also supports Hardy’s gas case based upon well test results. GCA’s analysis confirms 217 BCF as Best Estimate GIIP figure for the accumulation. GCA’s estimated Contingent Resources for the Genesha-1discovery is shown in the Table below
Hardy Oil and Gas plc. 24 E2291
GCA GAFFNEY, CLINE & ASSOCIATES
SUMMARY OF CY-OS/2 GROSS AND NET GAS CONTINGENT RESOURCES
AS AT 31ST DECEMBER, 2009
Gross Contingent Resources BCF
Hardy Interest
(%)
Net Hardy Contingent Resources BCF
1C 2C 3C 1C 2C 3C
CY-OS/2- Ganesha-1 69.1 130.0 222.5 75 51.8 97.5 166.9 Total CY-OS/2 69.1 130.0 222.5 75 51.8 97.5 166.9
Notes: 1. The Net Hardy Contingent Resources on this table are only indications of Hardy’s working interest
fraction of the gross resources. They do not represent Hardy’s actual net entitlement under the terms of the permits that govern these assets.
2. The primary Contingent Resource volume reported here is the 2C, or ‘Best Estimate’, value. 3. In the event of a commercial development of a discovery, ONGC has the option to back-into the CY-
OS/2 licence at an interest of 30%.
Ganesha-1 area prospects A study was conducted by Hardy using the reprocessed 3D seismic data (AVO/AVA and derivative products) to mitigate the risk of drilling the Fan-A/Ganesha appraisal wells; and to define the vertical and lateral limits of the Fan-A-1 Deep and Middle hydrocarbon-bearing sands. Several seismic attribute volumes were generated including P-Impedance, S-Impedance, Vp/Vs, density LamdaRho, MuRho, and Poissons’s Ration. Proprietary software provided by CGG generated geobodies from the 3D inverted seismic data using the seismic data. In this instance the Lamda-Rho versus Vp/Vs was used to extract the geobodies using different cut-offs for the P90, P50 and P10 cases. This data was merged with a spectral decomposition (seismic frequency analysis for thin beds) data to identify prospective areas for appraisal drilling. The northern area is called Ganesha Appraisal-A (Gap-A) and Gap-A-1, both about 2km from the discovery well. The southern area is called Gap-B , and lies about 14 km from the discovery well. The spectral decomposition was convincing in the southern, Gap B area. These and the other seismic data are supporting evidence, but are not of themselves conclusive.
Extraction of geobodies from AVO/AVA volumes represents state-of-the-art technology application in geophysics but caution is required when interpreting what these ‘geobodies’ represent. It is well known that because of the link to seismic amplitudes, false positives are common with geobody extractions. This method of extraction assumes that the seismic amplitude is related to hydrocarbon effects only; whereas, the seismic wavelet is constructed from changes in lithology (vertical and horizontal), stratigraphy (thick, thin, tuning, unconformities, etc.) and fluid content (oil, gas, water). Often, geobodies are extracted for reasons that are non-hydrocarbon related; and, are sensitive to cut-offs. Additionally, the extracted geobodies are discontinuous and fragmented which suggests lateral changes in lithology, stratigraphy and fluid content. GCA considers this extraction as reasonable caveat to the uncertainties listed above. GCA performed an independent volume estimate based on the data supplied by Hardy. The relationship between seismic attribute analysis and presence of hydrocarbons is ambiguous and inconclusive. Consequently, it was used as a

Hardy Oil and Gas plc. 25 E2291
GCA GAFFNEY, CLINE & ASSOCIATES
guideline for the GCA area estimates. Gross/Net thickness, porosity and water saturation were obtained from logs where available. Thickness estimates used by GCA to compute volumetrics are lower than those used by Hardy to reflect the broken distribution of the strong attributes and indeed areas of no seismic response, the lack of supporting evidence for fluid trapping mechanism within potential reservoir imaged, and the limited confidence that can be placed on the calibration via a single control point. It should be noted that in the various Ganesha area probabilistic cases, the extracted geobodies did not always intersect the discovery well so extrapolating lithology and fluid content is risky. It should also be mentioned that not all the geobodies seemed geological in form, nor to be associated with an obvious structural trap. The amplitude derived geobodies in some cases parallel structural contours in a way more usual with tuning, than with stratigraphic or structural traps therefore GCA have lowered the GCOS for these prospects compared to the GCOS originally proposed by Hardy.
Prospective Resources can be attributed to Block CY-OS/2 based on the results of Fan-A-1 well and geobody analysis discussed above (Figure 1.6). These are considered as prospects. There are 4 locations, Gap-A, Gap-B, Gap-E and Gap-F that are related to appraising the Ganesha discovery. GCA audited Hardy’s volume estimates for these prospects and made changes where appropriate. GCA’s GIIP estimates – at this stage of evaluation - are as listed below:
GENESHA-1 : SUMMARY PROSPECTS GROSS GIIP (BCF)
Prospect Horizon GIIP
Low Estimate
Best Estimate
High Estimate
Gap-A Middle Sand 183 288 418 Gap-A Deep Sand 155 217 298 Gap-B Middle Sand 116 185 273 Gap-B Deep Sand 115 209 320 Gap-E Middle Sand 102 152 214 Gap-B (N) Middle Sand 53 79 111 Gap-B (NE) Middle Sand 47 75 111 Gap-F Deep Sand 67 109 171
Notes: 1. It is inappropriate to focus on any of these volume postulations other than the ‘Best Estimate’. 2. The aggregation of Prospective Resources is not appropriate due to mathematical dependency.
.

Hardy Oil and Gas plc. 26 E2291
GCA GAFFNEY, CLINE & ASSOCIATES
FIGURE 1.6
CY-OS/2 PROSPECT LOCATION MAP
Deep Fan
Middle Fan
Source: Hardy
Hardy Oil and Gas plc. 27 E2291
GCA GAFFNEY, CLINE & ASSOCIATES
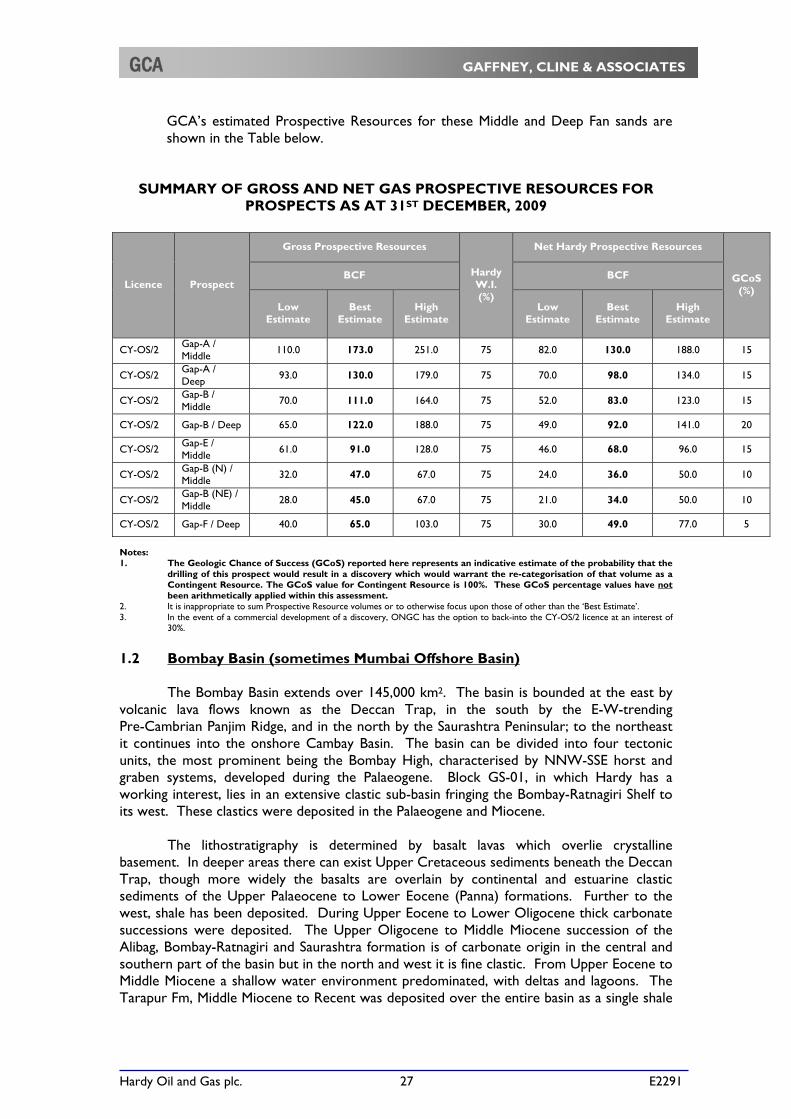
GCA’s estimated Prospective Resources for these Middle and Deep Fan sands are shown in the Table below.
SUMMARY OF GROSS AND NET GAS PROSPECTIVE RESOURCES FOR PROSPECTS AS AT 31ST DECEMBER, 2009
Licence Prospect
Gross Prospective Resources
Hardy W.I. (%)
Net Hardy Prospective Resources
GCoS (%)
BCF BCF
Low Estimate
Best Estimate
High Estimate
Low Estimate
Best Estimate
High Estimate
CY-OS/2 Gap-A / Middle 110.0 173.0 251.0 75 82.0 130.0 188.0 15
CY-OS/2 Gap-A / Deep 93.0 130.0 179.0 75 70.0 98.0 134.0 15
CY-OS/2 Gap-B / Middle
70.0 111.0 164.0 75 52.0 83.0 123.0 15
CY-OS/2 Gap-B / Deep 65.0 122.0 188.0 75 49.0 92.0 141.0 20
CY-OS/2 Gap-E / Middle 61.0 91.0 128.0 75 46.0 68.0 96.0 15
CY-OS/2 Gap-B (N) / Middle 32.0 47.0 67.0 75 24.0 36.0 50.0 10
CY-OS/2 Gap-B (NE) / Middle 28.0 45.0 67.0 75 21.0 34.0 50.0 10
CY-OS/2 Gap-F / Deep 40.0 65.0 103.0 75 30.0 49.0 77.0 5
Notes: 1. The Geologic Chance of Success (GCoS) reported here represents an indicative estimate of the probability that the
drilling of this prospect would result in a discovery which would warrant the re-categorisation of that volume as a Contingent Resource. The GCoS value for Contingent Resource is 100%. These GCoS percentage values have not been arithmetically applied within this assessment.
2. It is inappropriate to sum Prospective Resource volumes or to otherwise focus upon those of other than the ‘Best Estimate’. 3. In the event of a commercial development of a discovery, ONGC has the option to back-into the CY-OS/2 licence at an interest of
30%.
1.2 Bombay Basin (sometimes Mumbai Offshore Basin) The Bombay Basin extends over 145,000 km2. The basin is bounded at the east by volcanic lava flows known as the Deccan Trap, in the south by the E-W-trending Pre-Cambrian Panjim Ridge, and in the north by the Saurashtra Peninsular; to the northeast it continues into the onshore Cambay Basin. The basin can be divided into four tectonic units, the most prominent being the Bombay High, characterised by NNW-SSE horst and graben systems, developed during the Palaeogene. Block GS-01, in which Hardy has a working interest, lies in an extensive clastic sub-basin fringing the Bombay-Ratnagiri Shelf to its west. These clastics were deposited in the Palaeogene and Miocene. The lithostratigraphy is determined by basalt lavas which overlie crystalline basement. In deeper areas there can exist Upper Cretaceous sediments beneath the Deccan Trap, though more widely the basalts are overlain by continental and estuarine clastic sediments of the Upper Palaeocene to Lower Eocene (Panna) formations. Further to the west, shale has been deposited. During Upper Eocene to Lower Oligocene thick carbonate successions were deposited. The Upper Oligocene to Middle Miocene succession of the Alibag, Bombay-Ratnagiri and Saurashtra formation is of carbonate origin in the central and southern part of the basin but in the north and west it is fine clastic. From Upper Eocene to Middle Miocene a shallow water environment predominated, with deltas and lagoons. The Tarapur Fm, Middle Miocene to Recent was deposited over the entire basin as a single shale
Hardy Oil and Gas plc. 28 E2291
GCA GAFFNEY, CLINE & ASSOCIATES
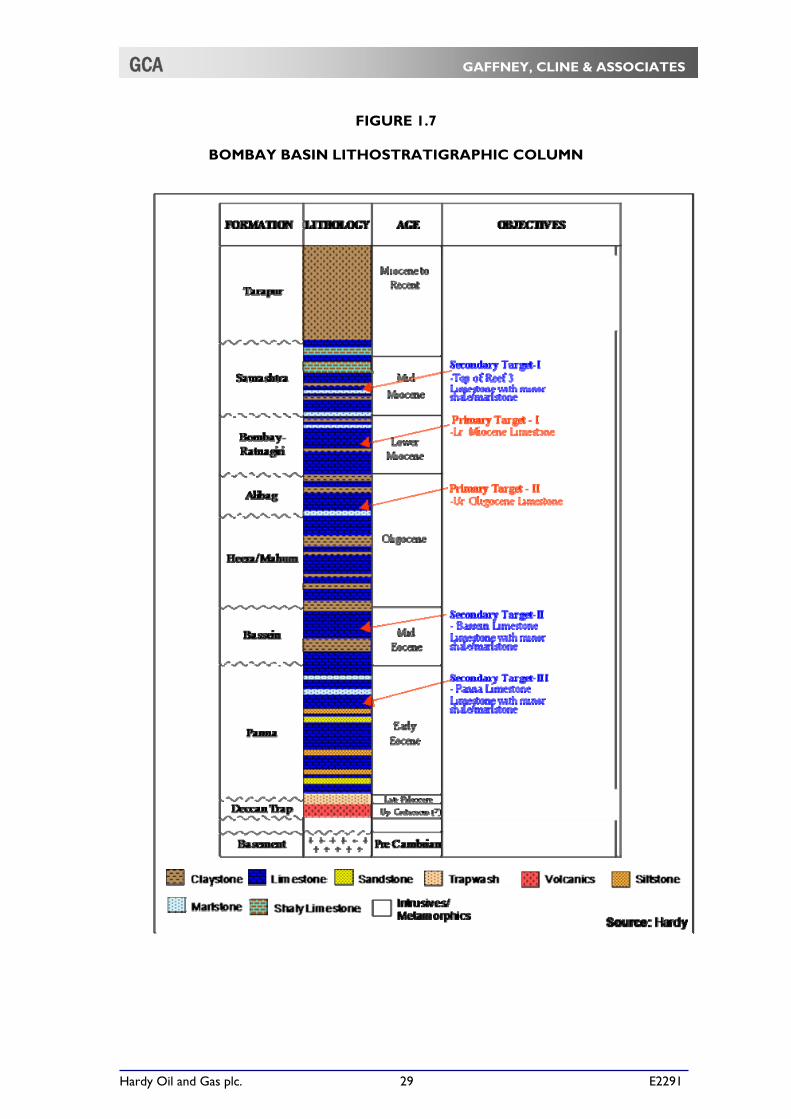
interval (see lithostratigraphic section, Figure 1.7). The thickness of basin fill can exceed 8,000 m. Major oilfields such as Bombay High, Mukta, Heera, Ratna and others produce from Lower and Middle Miocene limestones. These are wackestones, deposited in a lagoonal setting. The main source rocks are the Palaeogene and Miocene pro-delta muds deposited in major low areas in the basin, the main such ‘kitchen’ being the Dahanu Depression, extending for around 500 km parallel to the present-day coastline east of the Bombay High. There is also a source area west of the Bombay High, underlying the Hardy block. Here the source horizons below 3,500 m are overmature and mainly gas-prone. There are no carrier beds, and the (proximal) source needs to be connected to the reservoirs by either faulting or juxtaposition. Migration began in early Miocene into Palaeogene reservoirs, and continued in a second phase into lower and middle Miocene reservoirs during the Pliocene, when traps were already formed. Typical trap types are rollover anticlines, fault-bounded monoclines and stratigraphic carbonate traps (including reefal structures). 1.2.1 Block GS-01 (Hardy NWI 10%)
Block GS-01 is located in both Bombay and Saurashtra Basins off the west coast of India: it lies 220 km west of Bombay and 60 km south of the Saurashtra Peninsular. The Bombay High oilfield lies 40 km east of the eastern boundary of the block (see Figure 1.8). This was the first discovery in the basin, made in 1974, in Miocene carbonates. Since then the basin has experienced continuous exploration, which has resulted in the discovery of many other oilfields, including Ratna, Heera, Panna, Mukta, and Neelam, and the gasfields of Bassein, South Bassein, Mid Tapti and South Tapti. The majority of the 600 exploration and appraisal wells that have been drilled in the Basin have tested the section down to the Deccan Trap or Precambrian granitic basement (Figure 1.7).
Hardy Oil and Gas plc. 29 E2291
GCA GAFFNEY, CLINE & ASSOCIATES
FIGURE 1.7
BOMBAY BASIN LITHOSTRATIGRAPHIC COLUMN

Hardy Oil and Gas plc. 30 E2291
GCA GAFFNEY, CLINE & ASSOCIATES
FIGURE 1.8
GS-01 BLOCK LOCATION
Sub-sea Oil Pipeline (Existing)
Oil FieldLEGEND
Sub-sea Gas Pipeline (Existing)
BOMBAY HIGH
C24
MID. TAPTI
S. TAPTI
PANNA
BASSEIN
HEERA
RATNA
Arabian Sea
DIU
MUKTA
UranTerminal
Mumbai
To Hazira
36" 42"
26"
26"
0 25 50 75 100 Km
30"
Gas Field
C23
Bombay Basin
Gujarat-SaurashtraBasin
Basin Limits
Sri Lanka
nnnnnnnnn
IndiaIndiaIndiaIndiaIndiaIndiaIndiaIndiaIndia
NepalPakistanPakistanPakistanPakistanPakistanPakistanPakistanPakistanPakistan
B a yB a yB a yB a yB a yB a yB a yB a yB a yo fo fo fo fo fo fo fo fo f
B e n g a lB e n g a lB e n g a lB e n g a lB e n g a lB e n g a lB e n g a lB e n g a lB e n g a l
Bhutan
Myanmar
AndamanAndamanAndamanAndamanAndamanAndamanAndamanAndamanAndamanSeaSeaSeaSeaSeaSeaSeaSeaSea
BangladeshBangladeshBangladeshBangladeshBangladeshBangladeshBangladeshBangladeshBangladesh
GS-01
BASSEIN S.
Source: GCA/Petroview

Hardy Oil and Gas plc. 31 E2291
GCA GAFFNEY, CLINE & ASSOCIATES
The block is operated by Reliance (Reliance International Limited) whose working interest is 90%. It encompasses 8,841 km2, and water depths vary from 50 m to 90 m. The Block is under appraisal until 13th May, 2010, therefore Hardy and RIL are committed to drilling a well to declare commerciality by this date. The exploration concession (PEL) was awarded on 16th August, 2001 under NELP II terms, comprising: Three exploration phases, each not exceeding three years, for a total period
of seven years; A Phase-1 work programme of:
a) Seismic data acquisition (1,200 km 2D plus 1,020 km2 3D), processing, re-processing (4,291 km 2D) and interpretation. This commitment has been completed, with the acquisition of 2,363 km 2D, 1,711 km2 3D, and reprocessing of 4,391 km 2D; and
b) A drilling programme of 5 exploration wells; to-date, four wells have been drilled, and one remains.
A PSC allowing for Cost Recovery and Profit Oil sharing
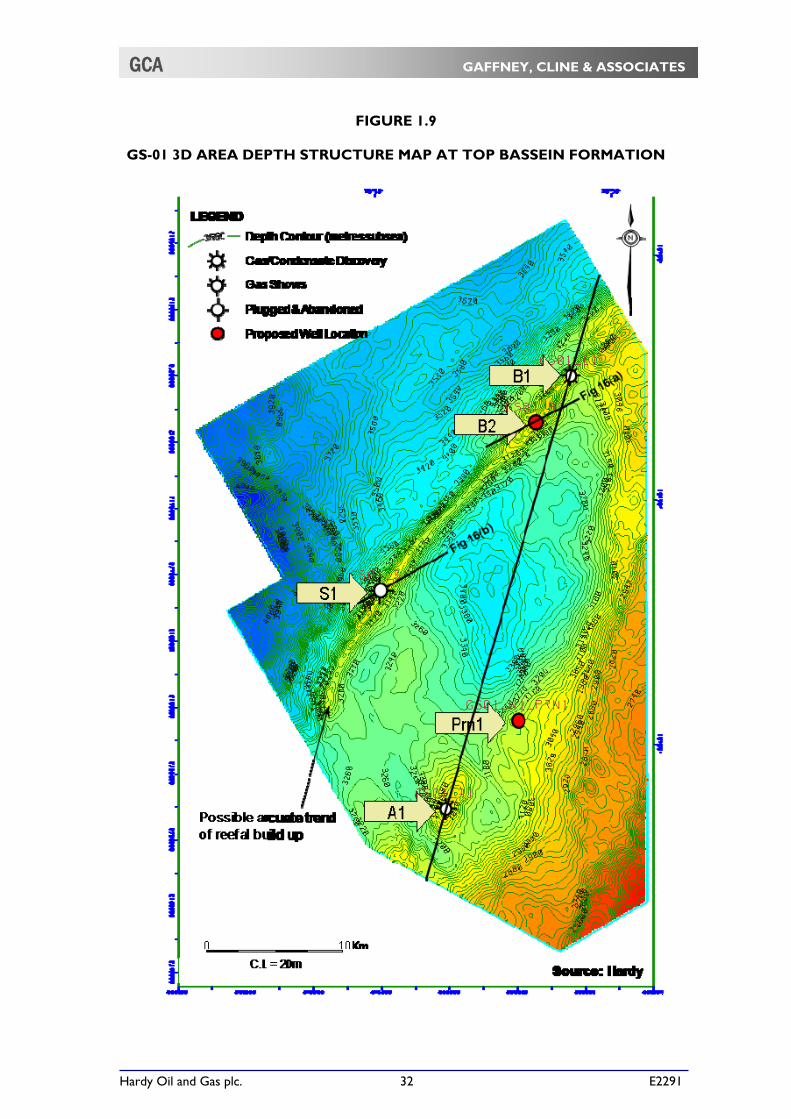
(signed 17th July, 2001). The block has been extensively covered by gravity, magnetic and seismic surveys. Approximately 12,000 km of 2D seismic (over 600 lines, of which 50, totalling 2,363 km, by Reliance/Hardy) have been acquired, processed and interpreted (Figure 1.9). A 3D survey of 1,216 km2 was gathered over the east-central part of the block in 2005. A further 3D survey of 1,000 km2 is scheduled for later in 2007.
Prior to Hardy’s involvement in the licence, six exploration wells had been drilled in the northern half of the block. None of these wells encountered commercial hydrocarbons. However, B-107-1 well, drilled by ONGC in 1990, is reported to have oil shows. Of the original Phase-1 work programme part a) has been completed, and four of the five commitment wells have been drilled. Phase-1 was initially extended two years to August, 2006, and a further extension of 22 months was granted, extending to July, 2008. At present the Block is under appraisal phase until 13th May, 2010.
Figure 1.10 shows the locations of prospective wells GS-01-A1, GS-01-B1, as well as the recent dry holes S1 and M1, which have been plugged and abandoned.
Hardy Oil and Gas plc. 32 E2291
GCA GAFFNEY, CLINE & ASSOCIATES
FIGURE 1.9
GS-01 3D AREA DEPTH STRUCTURE MAP AT TOP BASSEIN FORMATION

Hardy Oil and Gas plc. 33 E2291
GCA GAFFNEY, CLINE & ASSOCIATES
FIGURE 1.10
GS-OSN-1 MAP

Hardy Oil and Gas plc. 34 E2291
GCA GAFFNEY, CLINE & ASSOCIATES
Discovery Well GS-01-B1
The B1 well spudded on 2nd March, 2007, 240 km northwest of Mumbai in 79 m of water. It terminated in Lower Miocene reefal carbonates at a depth of 2,282 m MD (2,256 m TVDSS). The well had multiple limestone targets, including Middle and Lower Miocene, Upper Oligocene, Middle Eocene (Bassein Fm) and Lower Eocene (Panna Fm). The location is shown on the map of Figure 1.10. The well terminated prematurely in the Lower Miocene because of mud losses/lost circulation, having encountered gas and condensate in Lower Miocene limestones before entering reefal material of high vuggy porosity and permeability. 24 m of perforations were opened within the Lower Miocene limestone above the reef, and following acidisation the well flowed gas at 18.6 MMscfd and condensate at 415 bcpd through a 56/64” choke with a FTHP of 1,346 psi. A recent Paleontological study confirmed that the B1discovery is of Lower Miocene age (previously thought to be Middle Miocene). The operator officially notified the government of a discovery named Dhirubai 33, on 14th May, 2007. It is the most westerly discovery in India to date and is currently under appraisal.
Levels of hydrogen sulphide between 1,700 ppm and 3,800 ppm, and CO2 up to 7% were noted in the produced gas. An estimate of Contingent Resources for the tested zone is presented in the Table below. The structure at the H1A level (Top Middle Miocene) is a four-way dip-closed anticline. Hardy’s 1C, 2C and 3C estimates of GIIP, 72, 111 and 167 BCF respectively, seem reasonable based on the data provided to GCA. Recovery factory of 70%, 75% & 80% were accepted based on analogue cases.
GS-01 SUMMARY OF GROSS AND NET GAS CONTINGENT RESOURCES
AS AT 31ST DECEMBER, 2009
Gross Contingent Resources BCF
Hardy Interest
(%)
Net Hardy Contingent Resources BCF
1C 2C 3C 1C 2C 3C
GS-01/ B1area 50.5 83.0 133.2 10 5.1 8.3 13.3 Total GS-01 50.5 83.0 133.2 10 5.1 8.3 13.3
Notes: 1. The Net Hardy Contingent Resources on this table are only indications of Hardy’s working interest
fraction of the gross resources. They do not represent Hardy’s actual net entitlement under the terms of the permits that govern these assets.
2. The primary Contingent Resource volume reported here is the 2C, or ‘Best Estimate’, value.

Hardy Oil and Gas plc. 35 E2291
GCA GAFFNEY, CLINE & ASSOCIATES
Future Prospectivity – B1, Prn1 and A1 B1 Prospect The reef penetrated in the bottom of well B1 was a predicted primary target. As stated above, on entering the reef, mud losses were recorded. A test was attempted within the reef, but this failed, possibly because of earlier efforts to stem the mud losses with cement. The deeper Miocene prospect, lies below the previously mentioned pay level at approximately 1990m MD to TD. This fractured dolomitic reservoir produced gas during DST. The reservoir is trapped by a stratigraphic pinch out and has a top seal of a 50m thick shale sequence. A second target with similar entrapment conditions as the deeper Miocene is the Upper Oligocene carbonate build-up. This reefal facies prospect was never reached by the B1 well, but its reservoir parameters were derived from PSDM, inversion and bandwidth extension data, as well as a nearby analogue of the B-192 field. Low, Best and High estimates of GIIP for these B1 prospects are 48, 90 and 157 BCF for the deeper Miocene, and 136, 213 and 324 BCF respectively for the Oligocene limestone reservoir. GCA has verified Hardy’s GCoS estimates and accepts them as 30% for the deeper Miocene, and 20% for the Oligocene prospect. The estimated Prospective Resources are shown in the Table below. Prn1 Prospect At Prn1 a little over 10 km northeast of well A1, the seismic expression of the Oligocene carbonates appeared similar to A1, with a high-amplitude reflector down-dip of a minor drape, or perhaps shelf margin feature. In the light of the result at well A1, where all the targets proved barren, this is seen as a less attractive prospect and GCoS is assessed as no more than 10%. The accepted estimates of GIIP for the Prn1Oligocene prospect are 18, 33 and 76 BCF for the Low, Best and High estimates respectively . The estimated Prospective Resources are shown in the Table below. Well GS-01-A1 Prospect All the five main targets of GS-01-A1 well proved tight (low permeability). High gas saturations occurred in a basal sandstone of <15 m net thickness, but flow testing was not possible due to limitations of the drilling rig.
Well GS-01-A1 spudded on 9th February, 2006 in 83 m of water. It terminated in Deccan Trap volcanics, at a depth of 4,374 m. The well had five targets at Middle and Early Miocene (reef), Oligocene (reef) and Middle and Early Eocene – see Figure 1.7. At two points in the Mid Eocene Bassein limestone, 3,622 m MD and 3,723 m MD, gas shows were recorded, but all the main targets proved tight. At 4,298 m MD formation gas increased to 35%. This was beneath the Early Eocene Panna limestone, in a basal sandstone of up to 15 m net thickness (not a designated target when the well spudded) overlying the basement. At this point the well was about 305 m deep to prognosis because of a higher overburden velocity than expected, so that at total depth the well was within HP/HT conditions and close to the limits of the capacity of the rig. Thus testing of the gas sand was not possible, and the well was suspended.
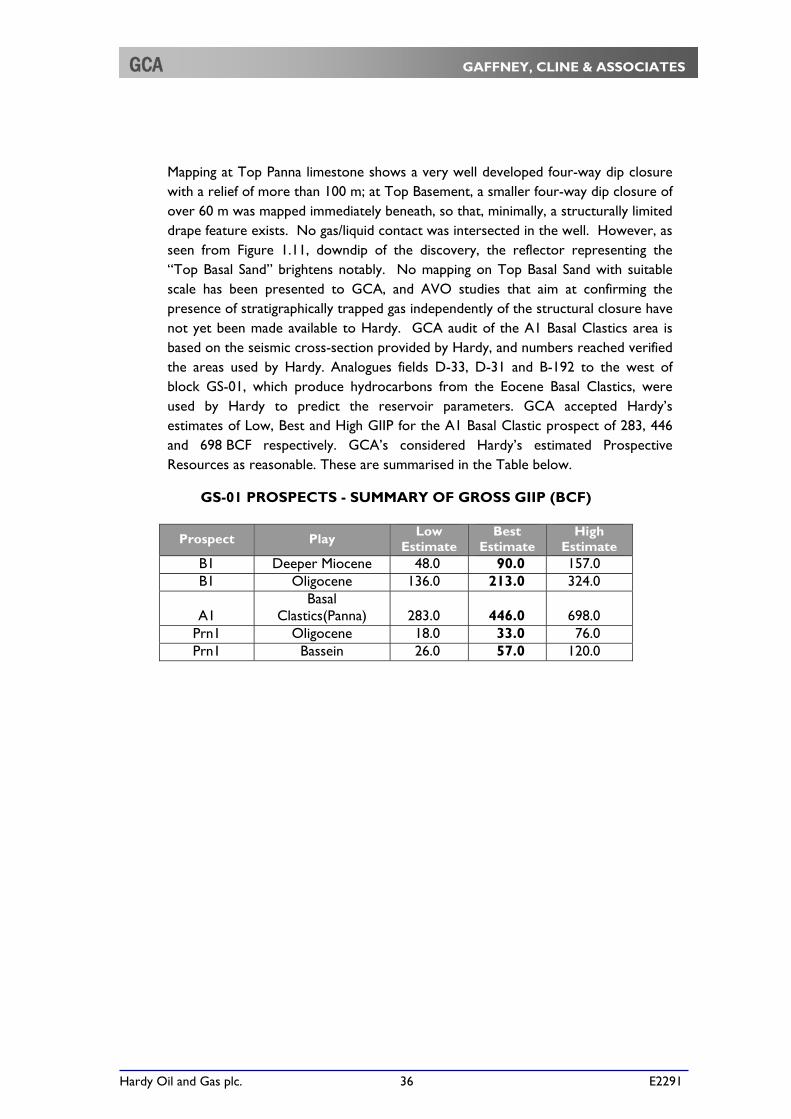
Hardy Oil and Gas plc. 36 E2291
GCA GAFFNEY, CLINE & ASSOCIATES
Mapping at Top Panna limestone shows a very well developed four-way dip closure with a relief of more than 100 m; at Top Basement, a smaller four-way dip closure of over 60 m was mapped immediately beneath, so that, minimally, a structurally limited drape feature exists. No gas/liquid contact was intersected in the well. However, as seen from Figure 1.11, downdip of the discovery, the reflector representing the “Top Basal Sand” brightens notably. No mapping on Top Basal Sand with suitable scale has been presented to GCA, and AVO studies that aim at confirming the presence of stratigraphically trapped gas independently of the structural closure have not yet been made available to Hardy. GCA audit of the A1 Basal Clastics area is based on the seismic cross-section provided by Hardy, and numbers reached verified the areas used by Hardy. Analogues fields D-33, D-31 and B-192 to the west of block GS-01, which produce hydrocarbons from the Eocene Basal Clastics, were used by Hardy to predict the reservoir parameters. GCA accepted Hardy’s estimates of Low, Best and High GIIP for the A1 Basal Clastic prospect of 283, 446 and 698 BCF respectively. GCA’s considered Hardy’s estimated Prospective Resources as reasonable. These are summarised in the Table below.
GS-01 PROSPECTS - SUMMARY OF GROSS GIIP (BCF)
Prospect Play Low
Estimate Best
Estimate High
Estimate B1 Deeper Miocene 48.0 90.0 157.0 B1 Oligocene 136.0 213.0 324.0
A1 Basal
Clastics(Panna) 283.0 446.0 698.0 Prn1 Oligocene 18.0 33.0 76.0 Prn1 Bassein 26.0 57.0 120.0
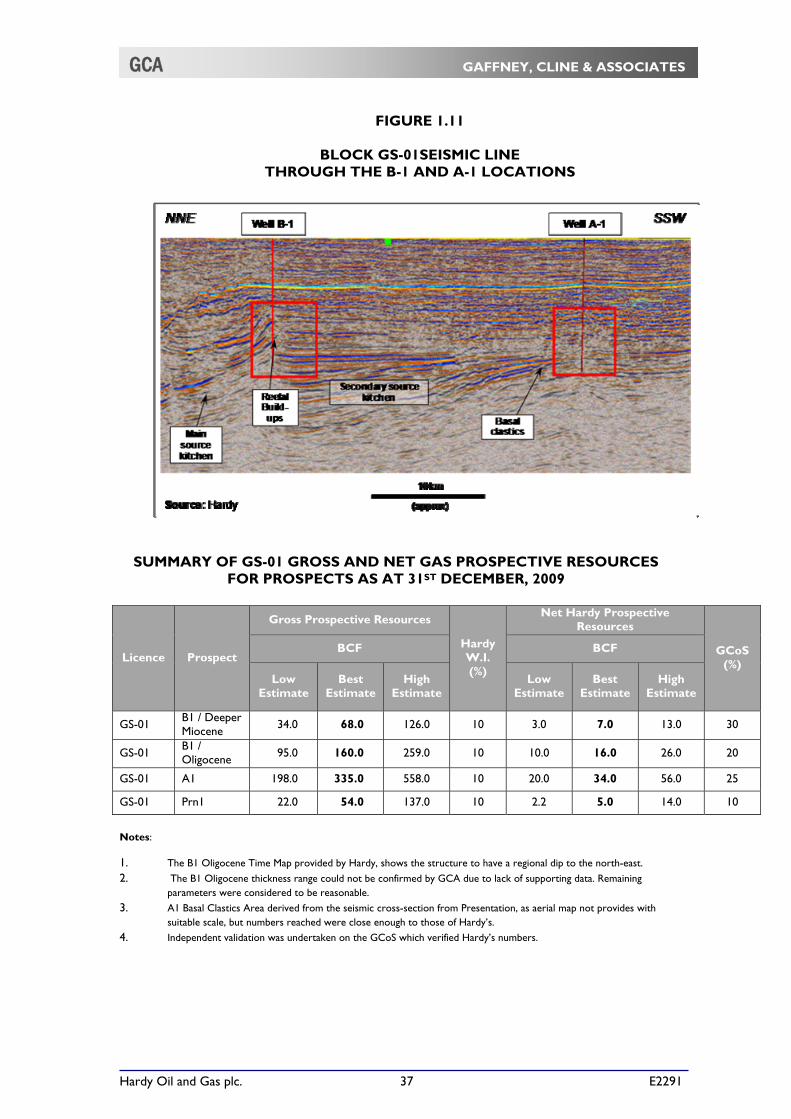
Hardy Oil and Gas plc. 37 E2291
GCA GAFFNEY, CLINE & ASSOCIATES
FIGURE 1.11
BLOCK GS-01SEISMIC LINE THROUGH THE B-1 AND A-1 LOCATIONS
SUMMARY OF GS-01 GROSS AND NET GAS PROSPECTIVE RESOURCES FOR PROSPECTS AS AT 31ST DECEMBER, 2009
Licence Prospect
Gross Prospective Resources
Hardy W.I. (%)
Net Hardy Prospective Resources
GCoS (%)
BCF BCF
Low Estimate
Best Estimate
High Estimate
Low Estimate
Best Estimate
High Estimate
GS-01 B1 / Deeper Miocene
34.0 68.0 126.0 10 3.0 7.0 13.0 30
GS-01 B1 / Oligocene 95.0 160.0 259.0 10 10.0 16.0 26.0 20
GS-01 A1 198.0 335.0 558.0 10 20.0 34.0 56.0 25
GS-01 Prn1 22.0 54.0 137.0 10 2.2 5.0 14.0 10
Notes:
1. The B1 Oligocene Time Map provided by Hardy, shows the structure to have a regional dip to the north-east.
2. The B1 Oligocene thickness range could not be confirmed by GCA due to lack of supporting data. Remaining parameters were considered to be reasonable.
3. A1 Basal Clastics Area derived from the seismic cross-section from Presentation, as aerial map not provides with suitable scale, but numbers reached were close enough to those of Hardy’s.
4. Independent validation was undertaken on the GCoS which verified Hardy’s numbers.
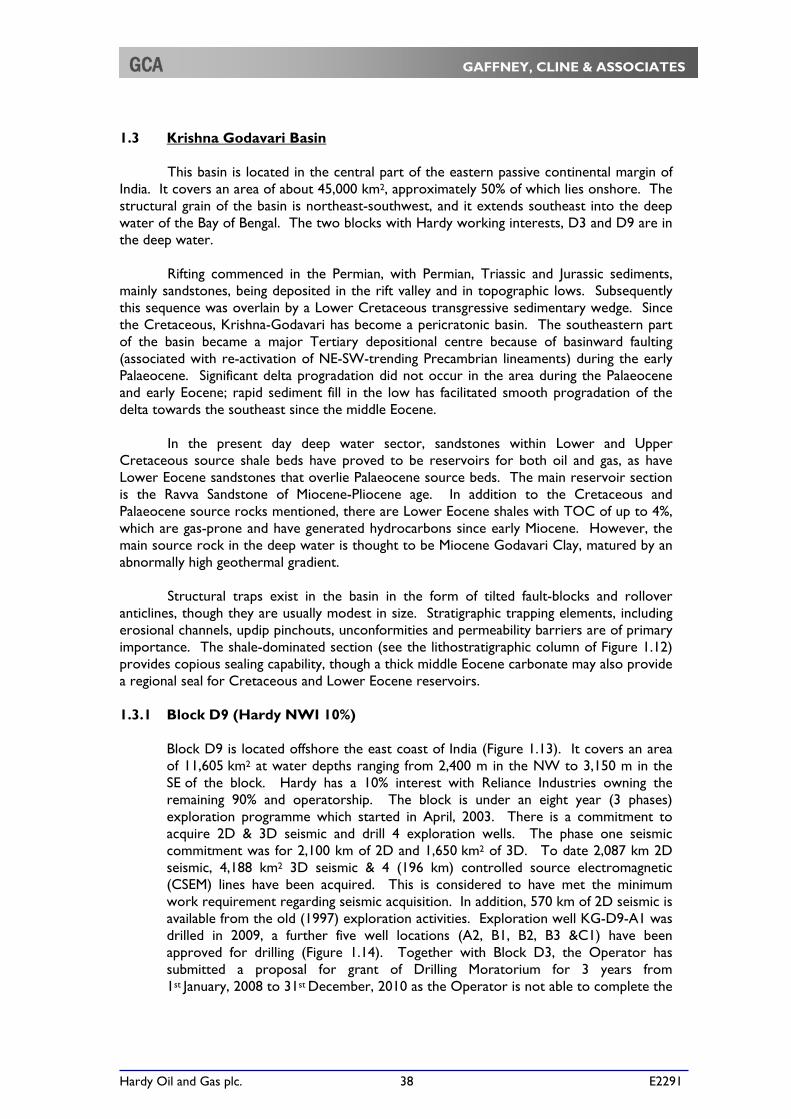
Hardy Oil and Gas plc. 38 E2291
GCA GAFFNEY, CLINE & ASSOCIATES
1.3 Krishna Godavari Basin This basin is located in the central part of the eastern passive continental margin of India. It covers an area of about 45,000 km2, approximately 50% of which lies onshore. The structural grain of the basin is northeast-southwest, and it extends southeast into the deep water of the Bay of Bengal. The two blocks with Hardy working interests, D3 and D9 are in the deep water. Rifting commenced in the Permian, with Permian, Triassic and Jurassic sediments, mainly sandstones, being deposited in the rift valley and in topographic lows. Subsequently this sequence was overlain by a Lower Cretaceous transgressive sedimentary wedge. Since the Cretaceous, Krishna-Godavari has become a pericratonic basin. The southeastern part of the basin became a major Tertiary depositional centre because of basinward faulting (associated with re-activation of NE-SW-trending Precambrian lineaments) during the early Palaeocene. Significant delta progradation did not occur in the area during the Palaeocene and early Eocene; rapid sediment fill in the low has facilitated smooth progradation of the delta towards the southeast since the middle Eocene. In the present day deep water sector, sandstones within Lower and Upper Cretaceous source shale beds have proved to be reservoirs for both oil and gas, as have Lower Eocene sandstones that overlie Palaeocene source beds. The main reservoir section is the Ravva Sandstone of Miocene-Pliocene age. In addition to the Cretaceous and Palaeocene source rocks mentioned, there are Lower Eocene shales with TOC of up to 4%, which are gas-prone and have generated hydrocarbons since early Miocene. However, the main source rock in the deep water is thought to be Miocene Godavari Clay, matured by an abnormally high geothermal gradient.
Structural traps exist in the basin in the form of tilted fault-blocks and rollover
anticlines, though they are usually modest in size. Stratigraphic trapping elements, including erosional channels, updip pinchouts, unconformities and permeability barriers are of primary importance. The shale-dominated section (see the lithostratigraphic column of Figure 1.12) provides copious sealing capability, though a thick middle Eocene carbonate may also provide a regional seal for Cretaceous and Lower Eocene reservoirs. 1.3.1 Block D9 (Hardy NWI 10%)
Block D9 is located offshore the east coast of India (Figure 1.13). It covers an area of 11,605 km2 at water depths ranging from 2,400 m in the NW to 3,150 m in the SE of the block. Hardy has a 10% interest with Reliance Industries owning the remaining 90% and operatorship. The block is under an eight year (3 phases) exploration programme which started in April, 2003. There is a commitment to acquire 2D & 3D seismic and drill 4 exploration wells. The phase one seismic commitment was for 2,100 km of 2D and 1,650 km2 of 3D. To date 2,087 km 2D seismic, 4,188 km2 3D seismic & 4 (196 km) controlled source electromagnetic (CSEM) lines have been acquired. This is considered to have met the minimum work requirement regarding seismic acquisition. In addition, 570 km of 2D seismic is available from the old (1997) exploration activities. Exploration well KG-D9-A1 was drilled in 2009, a further five well locations (A2, B1, B2, B3 &C1) have been approved for drilling (Figure 1.14). Together with Block D3, the Operator has submitted a proposal for grant of Drilling Moratorium for 3 years from 1st January, 2008 to 31st December, 2010 as the Operator is not able to complete the

Hardy Oil and Gas plc. 39 E2291
GCA GAFFNEY, CLINE & ASSOCIATES
minimum work obligations of exploratory drilling in view of non-availability of suitable deep water rigs in the international market.
FIGURE 1.12
BLOCKS D9/D3 POST-MESOZOIC STRATIGRAPHY
VadaparuShale
(Source & Seal) > 2500
> 1200
> 2000
Thickness (m)
GodavariClay
(Seal)
PrincipalSedimentary
Cycle
Regional tectonic events
Age Formation Lithology
Palaeocene
Eocene
Oligocene
Miocene
Pliocene
Holocene
Pleistocene Regression
Transgression
Transgression
Transgression
Regression
Regression
Collision of
Indian and
Eurasian Plates
Collision of
Indian and
Tibetan Plates
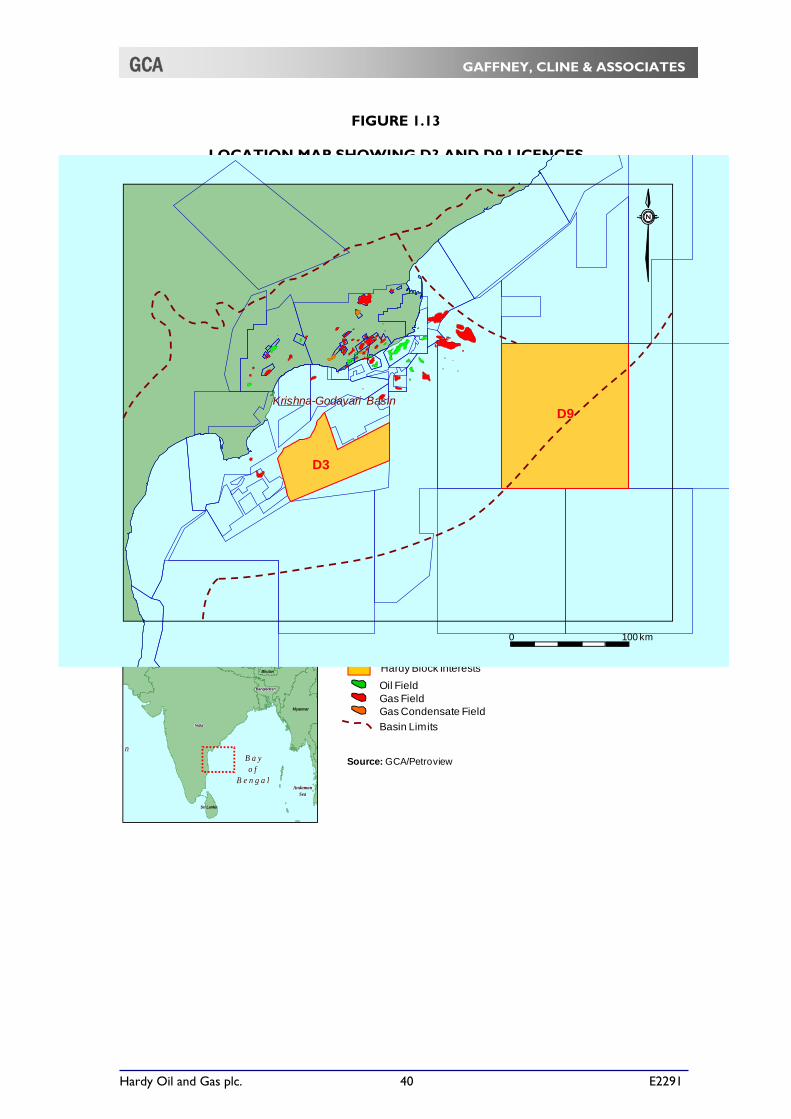
Hardy Oil and Gas plc. 40 E2291
GCA GAFFNEY, CLINE & ASSOCIATES
FIGURE 1.13
LOCATION MAP SHOWING D3 AND D9 LICENCES
Hardy Block Interests
Sri Lanka
nnnnnnnnn
IndiaIndiaIndiaIndiaIndiaIndiaIndiaIndiaIndia
NepalPakistanPakistanPakistanPakistanPakistanPakistanPakistanPakistanPakistan
B a yB a yB a yB a yB a yB a yB a yB a yB a yo fo fo fo fo fo fo fo fo f
B e n g a lB e n g a lB e n g a lB e n g a lB e n g a lB e n g a lB e n g a lB e n g a lB e n g a l
Bhutan
Myanmar
AndamanAndamanAndamanAndamanAndamanAndamanAndamanAndamanAndamanSeaSeaSeaSeaSeaSeaSeaSeaSea
BangladeshBangladeshBangladeshBangladeshBangladeshBangladeshBangladeshBangladeshBangladesh Oil Field
LEGEND
Gas Field
Basin Limits
Gas Condensate Field
Source: GCA/Petroview
0 100 km
D9
D3
Krishna-Godavari Basin
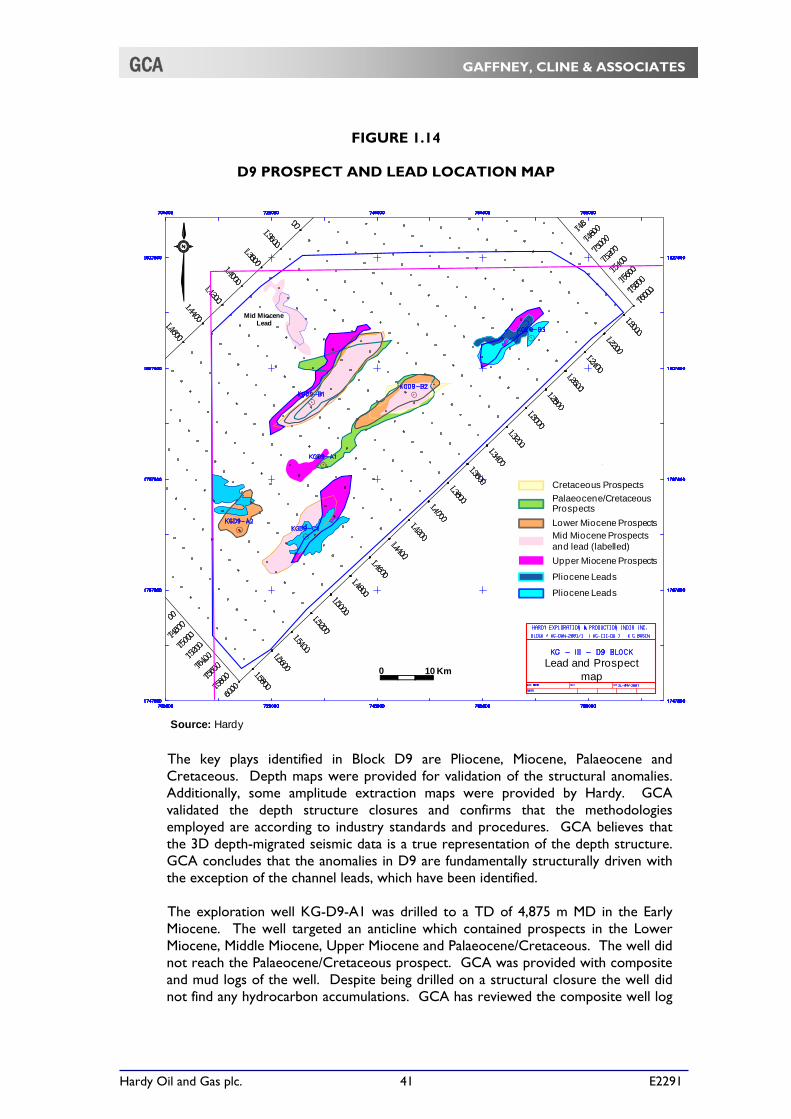
Hardy Oil and Gas plc. 41 E2291
GCA GAFFNEY, CLINE & ASSOCIATES
FIGURE 1.14
D9 PROSPECT AND LEAD LOCATION MAP
The key plays identified in Block D9 are Pliocene, Miocene, Palaeocene and Cretaceous. Depth maps were provided for validation of the structural anomalies. Additionally, some amplitude extraction maps were provided by Hardy. GCA validated the depth structure closures and confirms that the methodologies employed are according to industry standards and procedures. GCA believes that the 3D depth-migrated seismic data is a true representation of the depth structure. GCA concludes that the anomalies in D9 are fundamentally structurally driven with the exception of the channel leads, which have been identified. The exploration well KG-D9-A1 was drilled to a TD of 4,875 m MD in the Early Miocene. The well targeted an anticline which contained prospects in the Lower Miocene, Middle Miocene, Upper Miocene and Palaeocene/Cretaceous. The well did not reach the Palaeocene/Cretaceous prospect. GCA was provided with composite and mud logs of the well. Despite being drilled on a structural closure the well did not find any hydrocarbon accumulations. GCA has reviewed the composite well log
Cretaceous
Paleocene / Cretaceous
Lr. Miocene
Mid. Miocene
Up. Miocene
Pliocene
Pliocene
0 10 Km
Source: Hardy
Lead and Prospect map
Mid Miocene Lead
Cretaceous Prospects
Palaeocene/Cretaceous Prospects
Lower Miocene ProspectsMid Miocene Prospects and lead (labelled)
Upper Miocene Prospects
Pliocene Leads
Pliocene Leads

Hardy Oil and Gas plc. 42 E2291
GCA GAFFNEY, CLINE & ASSOCIATES
and concludes this largely due to a lack of reservoir. The well encountered ‘limestone’ formations at the Lower Miocene reservoir depths. These are interpreted as calc-lucite deposits in a turbiditic depositional environment. In addition, GCA notes that while there is significant dip closure on the target structure, closure in a strike direction is of shallow relief. Minor gas shows in the well confirms the presence of a possible biogenic gas source. As a result of the well, Hardy has removed four prospects from its portfolio and reduced the size of a further two. In addition, Hardy has reviewed its estimates of GCoS. Hardy has added three new prospects/leads to those previously reviewed by GCA which have been identified by amplitude anomalies. GCA has reviewed both the new targets and those previously identified in light of the results of the KG-D9-A1 well. All volumes in Block D9 have been classified as Prospective Resources. GCA has undertaken an independent volumetric assessment of block D9. The Prospects and Leads in Block D9 are shown in Figure 1.14. Volumetric input parameters were determined using well KG-D9-A1 results and regional knowledge. For the majority of Prospects and Leads, no new data are available from GCA’s previous audit and in these cases GCA’s volumes remain unchanged. To take into account the learnings from well KG-D9-A1, GCA has reviewed the areas used in some of its volumetric estimates to allow for the possible limited extent of the prospects in the strike direction. In reviewing the new targets identified by Hardy, GCA has calculated its own areas using the amplitude anomaly maps provided by Hardy. GCA has undertaken independent GCoS estimates for each of the Prospects and Leads. Hardy has used CSEM data which detects resistivity anomalies attributed to hydrocarbons and tight limestone. CSEM anomalies were recorded for the A1 prospect and have also been detected at B2 and B3. Additionally, AVO/AVA has been applied throughout the block and has been detected B1, B2 and B3 prospects. Both these technologies are applied to mitigate the risk in drilling prospects. The Low Estimate, Best Estimate and High Estimate GIIP and STOIIP for prospects and the Best estimate for leads are listed in the summary tables below. This is followed by a summary of the Gross and Net gas Prospective Resources for prospects as Low, Best, and High Estimates and a summary of the Gross and Net oil Prospective Resources for prospects as Low, Best, and High Estimates is given.

Hardy Oil and Gas plc. 43 E2291
GCA GAFFNEY, CLINE & ASSOCIATES
BLOCK D9: SUMMARY OF GROSS GIIP FOR PROSPECTS/LEADS
AS AT 31ST DECEMBER, 2009
Prospect Play Prospect/Lead
Gross GIIP (TCF) Low
Estimate Best
Estimate High
Estimate Northern Anticline (NW Flank B1)
U. Miocene
Prospect 1.1 3.6 8.1
Central Anticline (NW Flank)
U. Miocene
Prospect 0.6 1.5 3.0
Central Anticline (near B3) U.
Miocene Prospect 1.4 3.6 7.6
Southern Anticline (SE Flank C1)
U. Miocene
Prospect 1.5 4.2 8.8
Northern Anticline B1 M.
Miocene Prospect 1.9 3.7 6.4
Central Anticline (near B2) M. Miocene
Prospect 1.8 2.7 3.8
Southern Anticline C1 M.
Miocene Prospect 1.9 2.7 3.7
Northern Anticline (near B1) L. Miocene Prospect 2.6 9.0 21.2
Central Anticline (near B2) L. Miocene Prospect 1.8 4.1 7.8 Central Anticline (near A2) L. Miocene Prospect 1.2 3.3 6.9 Channel 2 (near B3) Pliocene Lead - 1.3 - Channel 1 (near B3) Pliocene Lead - 1.0 - Channel Complex (C1) Pliocene Lead - 1.3 - Channel Complex (A2) Pliocene Lead - 0.1 -
Middle Miocene Channel M.
Miocene Lead - 0.3 -
Notes:
1. It is inappropriate to focus on any of these volume postulations other than the ‘Best Estimate’. 2. The aggregation of Prospective Resources is not appropriate due to mathematical dependency.
BLOCK D9: SUMMARY OF UNRISKED GROSS STOIIP FOR PROSPECTS/LEADS AS AT 31st DECEMBER, 2009
Prospect / Leads Age Prospect/Lead
Gross STOIIP (MMBbl) Low
Estimate Best
Estimate High
Estimate Central Anticline (4 way fault closure B2) Palaeocene Prospect 460.0 1,320.0 2,930.0
Central Anticline (Fault Closure B2)
Cretaceous Prospect 140.0 390.0 800.0
Wedge Palaeocene Lead - 1,460.0 - Notes:
1. It is inappropriate to focus on any of these volume postulations other than the ‘Best Estimate’. 2. The aggregation of Prospective Resources is not appropriate due to mathematical dependency.

Hardy Oil and Gas plc. 44 E2291
GCA GAFFNEY, CLINE & ASSOCIATES
BLOCK D9: SUMMARY OF GROSS AND NET GAS PROSPECTIVE RESOURCES FOR PROSPECTS AS AT 31ST DECEMBER, 2009
Licence Prospect
Gross Prospective Resources
Hardy W.I. (%)
Net Hardy Prospective Resources
GCoS (%)
BCF BCF
Low Estimate
Best Estimate
High Estimate
Low Estimate
Best Estimate
High Estimate
D9
Northern Anticline
(NW Flank B1) / U. Miocene
800.0 2,500.0 5,600.0 10 80.0 250.0 560.0 20
D9
Central Anticline (NW Flank) / U. Miocene
400.0 1,100.0 2,100.0 10 40.0 110.0 210.0 20
D9
Central Anticline (near B3) / U. Miocene
1,000.0 2,500.0 5,300.0 10 100.0 250.0 530.0 20
D9
Southern Anticline (SE Flank C1) / U. Miocene
1,100.0 2,900.0 6,200.0 10 110.0 290.0 620.0 10
D9
Northern Anticline B1 / M. Miocene
1,300.0 2,500.0 4,500.0 10 130.0 250.0 450.0 20
D9
Central Anticline (near B2) / M. Miocene
1,300.0 1,900.0 2,700.0 10 130.0 190.0 270.0 20
D9
Southern Anticline C1/ M. Miocene
1,300.0 1,900.0 2,600.0 10 130.0 190.0 260.0 15
D9
Northern Anticline (Near B1) / L. Miocene
1,800.0 6,300.0 15,000.0 10 180.0 630.0 1500.0 15
D9
Central Anticline (near B2) / L. Miocene
1,300.0 2,800.0 5,500.0 10 130.0 280.0 550.0 19
D9
Central Anticline (near A2) / L. Miocene
800.0 2,300.0 4,900.0 10 80.0 230.0 490.0 15
Notes: 1. The Geologic Chance of Success (GCoS) reported here represents an indicative estimate of the
probability that the drilling of this prospect would result in a discovery which would warrant the re-categorisation of that volume as a Contingent Resource. The GCoS value for Contingent Resource is 100%. These GCoS percentage values have not been arithmetically applied within this assessment.
2. It is inappropriate to sum Prospective Resource volumes or to otherwise focus upon those of other than the ‘Best Estimate’.
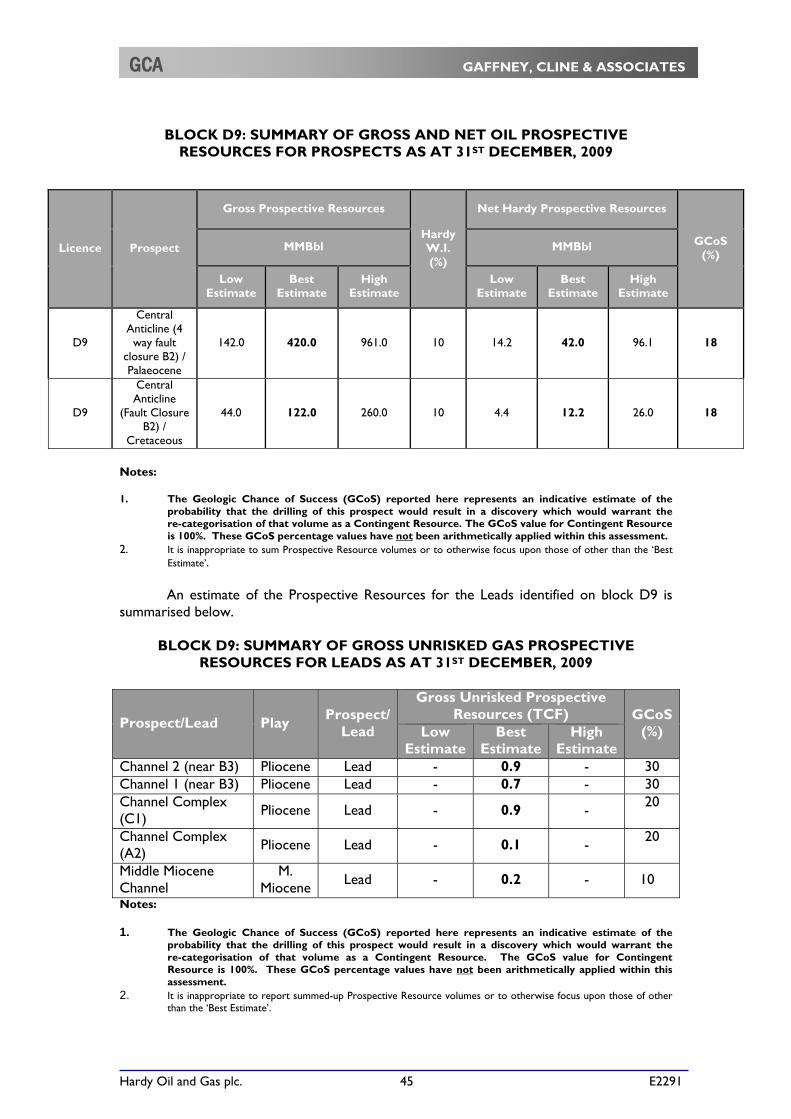
Hardy Oil and Gas plc. 45 E2291
GCA GAFFNEY, CLINE & ASSOCIATES
BLOCK D9: SUMMARY OF GROSS AND NET OIL PROSPECTIVE
RESOURCES FOR PROSPECTS AS AT 31ST DECEMBER, 2009
Notes: 1. The Geologic Chance of Success (GCoS) reported here represents an indicative estimate of the
probability that the drilling of this prospect would result in a discovery which would warrant the re-categorisation of that volume as a Contingent Resource. The GCoS value for Contingent Resource is 100%. These GCoS percentage values have not been arithmetically applied within this assessment.
2. It is inappropriate to sum Prospective Resource volumes or to otherwise focus upon those of other than the ‘Best Estimate’.
An estimate of the Prospective Resources for the Leads identified on block D9 is
summarised below.
BLOCK D9: SUMMARY OF GROSS UNRISKED GAS PROSPECTIVE RESOURCES FOR LEADS AS AT 31ST DECEMBER, 2009
Prospect/Lead Play Prospect/ Lead
Gross Unrisked Prospective Resources (TCF) GCoS
(%) Low Estimate
Best Estimate
High Estimate
Channel 2 (near B3) Pliocene Lead - 0.9 - 30 Channel 1 (near B3) Pliocene Lead - 0.7 - 30 Channel Complex (C1)
Pliocene Lead - 0.9 - 20
Channel Complex (A2) Pliocene Lead - 0.1 - 20
Middle Miocene Channel
M. Miocene Lead - 0.2 - 10
Notes: 1. The Geologic Chance of Success (GCoS) reported here represents an indicative estimate of the
probability that the drilling of this prospect would result in a discovery which would warrant the re-categorisation of that volume as a Contingent Resource. The GCoS value for Contingent Resource is 100%. These GCoS percentage values have not been arithmetically applied within this assessment.
2. It is inappropriate to report summed-up Prospective Resource volumes or to otherwise focus upon those of other than the ‘Best Estimate’.
Licence Prospect
Gross Prospective Resources
Hardy W.I. (%)
Net Hardy Prospective Resources
GCoS (%)
MMBbl MMBbl
Low Estimate
Best Estimate
High Estimate
Low Estimate
Best Estimate
High Estimate
D9
Central Anticline (4 way fault
closure B2) / Palaeocene
142.0 420.0 961.0 10 14.2 42.0 96.1 18
D9
Central Anticline
(Fault Closure B2) /
Cretaceous
44.0 122.0 260.0 10 4.4 12.2 26.0 18

Hardy Oil and Gas plc. 46 E2291
GCA GAFFNEY, CLINE & ASSOCIATES
BLOCK D9: SUMMARY OF GROSS UNRISKED OIL PROSPECTIVE
RESOURCES FOR LEADS AS AT 31ST DECEMBER, 2009
Target Play Prospect/Lead
Prospective Resources (MMBbl) GCoS
(%) Low Estimate
Best Estimate
High Estimate
Wedge Palaeocene Lead - 456.0 - 18
Notes: 1 The Geologic Chance of Success (GCoS) reported here represents an indicative estimate of the
probability that the drilling of this prospect would result in a discovery which would warrant the re-categorisation of that volume as a Contingent Resource. The GCoS value for Contingent Resource is 100%. These GCoS percentage values have not been arithmetically applied within this assessment.
2 It is inappropriate to report summed-up Prospective Resource volumes or to otherwise focus upon those of other than the ‘Best Estimate’.
1.3.2 Block D3 (Hardy NWI 10%)
The block measures 3,288 km2 in area, with water-depths varying from northwest to southeast between 400 m and 2,200 m. The block was under a 4 year work programme which ended in December, 2009 with a commitment to acquire 2,100 km2 3D seismic and drill 6 exploration wells. An extension to June 2010 was granted by the GOI pursuant to various delays. At the Effective Date of this report 2,811 km2 3D seismic has been acquired and three wells (A1, B1 and R1) drilled (Figure 1.15). A further 3 wells are planned to be drilled in 2010. Due to the non-availability of suitable deep water rigs in the international market, the Operator was unable to complete the minimum Work Obligations and has submitted a proposal for grant of Drilling Moratorium for 3 years from 1st January, 2008 to 31st December, 2010.
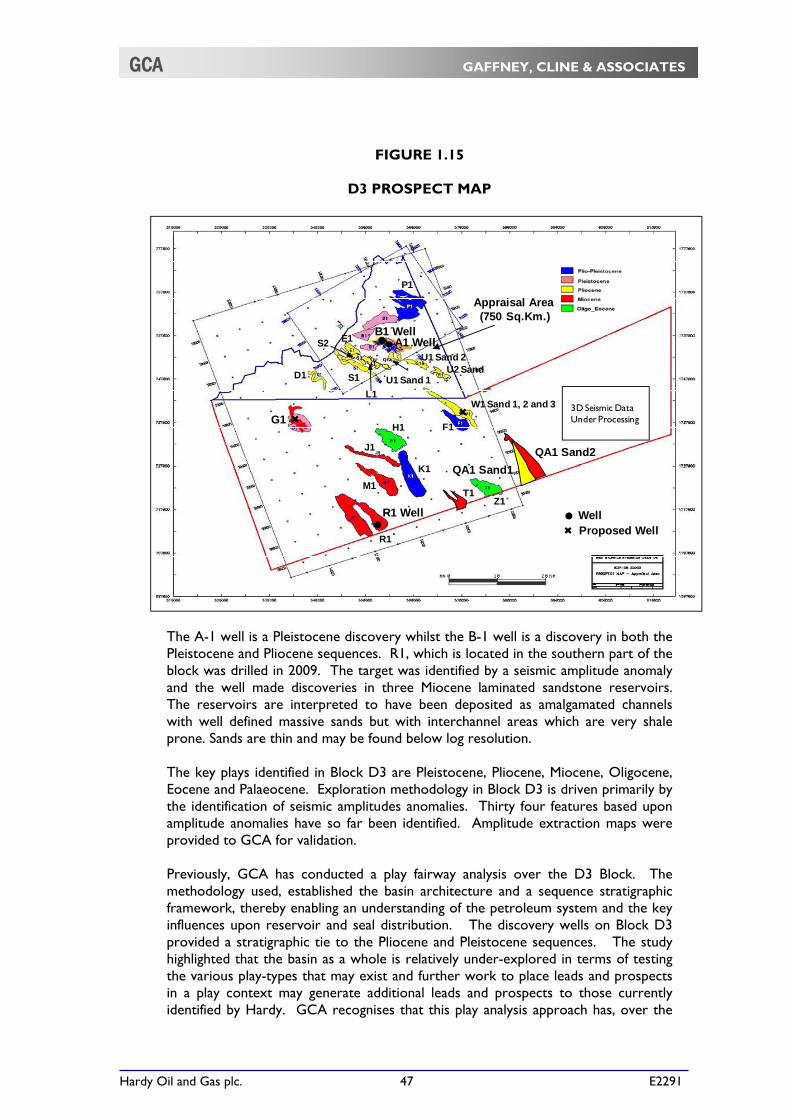
Hardy Oil and Gas plc. 47 E2291
GCA GAFFNEY, CLINE & ASSOCIATES
FIGURE 1.15
D3 PROSPECT MAP
The A-1 well is a Pleistocene discovery whilst the B-1 well is a discovery in both the Pleistocene and Pliocene sequences. R1, which is located in the southern part of the block was drilled in 2009. The target was identified by a seismic amplitude anomaly and the well made discoveries in three Miocene laminated sandstone reservoirs. The reservoirs are interpreted to have been deposited as amalgamated channels with well defined massive sands but with interchannel areas which are very shale prone. Sands are thin and may be found below log resolution. The key plays identified in Block D3 are Pleistocene, Pliocene, Miocene, Oligocene, Eocene and Palaeocene. Exploration methodology in Block D3 is driven primarily by the identification of seismic amplitudes anomalies. Thirty four features based upon amplitude anomalies have so far been identified. Amplitude extraction maps were provided to GCA for validation. Previously, GCA has conducted a play fairway analysis over the D3 Block. The methodology used, established the basin architecture and a sequence stratigraphic framework, thereby enabling an understanding of the petroleum system and the key influences upon reservoir and seal distribution. The discovery wells on Block D3 provided a stratigraphic tie to the Pliocene and Pleistocene sequences. The study highlighted that the basin as a whole is relatively under-explored in terms of testing the various play-types that may exist and further work to place leads and prospects in a play context may generate additional leads and prospects to those currently identified by Hardy. GCA recognises that this play analysis approach has, over the
Appraisal Area(750 Sq.Km.)
B1 WellA1 Well
R1 Well
W1 Sand 1, 2 and 3
G1
QA1 Sand1
T1
QA1 Sand2
WellProposed Well
Z1
D1
P1
K1
H1
M1
J1
F1
U1 Sand 2
U1 Sand 1S1
S2
L1
E1
U2 Sand
R1
3D Seismic DataUnder Processing

Hardy Oil and Gas plc. 48 E2291
GCA GAFFNEY, CLINE & ASSOCIATES
past year, resulted in the successful test of the Miocene play in the R1 well. In addition, Hardy’s evaluation of the Mesozoic potential of the block, using RIL’s MA and GSPC’s Deendal discoveries as possible analogues, provide new insight regarding deeper prospectivity. In summary, the overall resource potential in BlockD3 has therefore improved relative to GCA’s evaluation of 2009.
1.3.2.1 Block D 3 Contingent Resources
The Contingent Resources of Block D3 are discoveries made in the Pleistocene, Pliocene and Miocene by wells A1, B1 and R1 as discussed above and as can be seen on Figure 1.15. Well A1 was located in water depth of 715 m. On the basis of MDT results and petrophysical analysis, A1 encountered two gas zones designated as Pleistocene Sands 0 and 1. The DST test of sand 1 produced gas at a maximum rate of 38.05 MMscfd in the interval 1,565 – 1,585 mBRT. The produced gas was dry with a gravity of 0.57 at standard conditions. Results of the pressure transient analysis indicate a permeability range from 2,700 mD to 3,800 mD and an estimated static reservoir pressure of 2,554.3 psi (at gauge depth of 1,509.2 mBRT) and reservoir temperature of 114 deg F. GCA’s review verifies the results of well A1 DST and supports its transient pressure analysis procedure.
Well B1 was located at a water depth of 711 m, and was drilled to a total depth of 2,730 mBRT. It encountered gas in two intervals in the Pleistocene (Pleistocene Sand 2 – Southern) and one interval in the Pliocene (Pliocene Sand). No DST was performed in this well. Well R1 is located at water depth of 1,982.5 m, and was drilled as a directional well with a total depth of 4,113 m TVDss. A Formation testing tool (Reservoir Characterization Instrument RCI) was run. Three gas samples and one water sample were collected. A gas gradient of 0.12 psi/ft was established in the upper zone (3,832-3,853 m TVDss) and a water gradient of 0.44psi/ft was established in the lower zone (3,939.9-3,966.7 m TVDss). Gas composition showed C1 of 98.33 – 99.4 mole% and a gas gravity of around 0.56. GCA independently reviewed the seismic data and amplitude extract maps and estimated the in-place volumes related to the A1, B1 and R1 discoveries. GCA calculated its own P90, P50 and P10 area outlines for each of the discoveries using the amplitude extract maps provided by Hardy. The result of GCA’s volumetric Contingent Resources GIIP evaluation is summarised in the summary table below. GCA based its estimation of the recovery efficiency from the A1 and B1 sands on the MDT measurement of the pressure and the gas properties that were integrated with some assumed abandonment pressures between 500 and 1,000 psi.
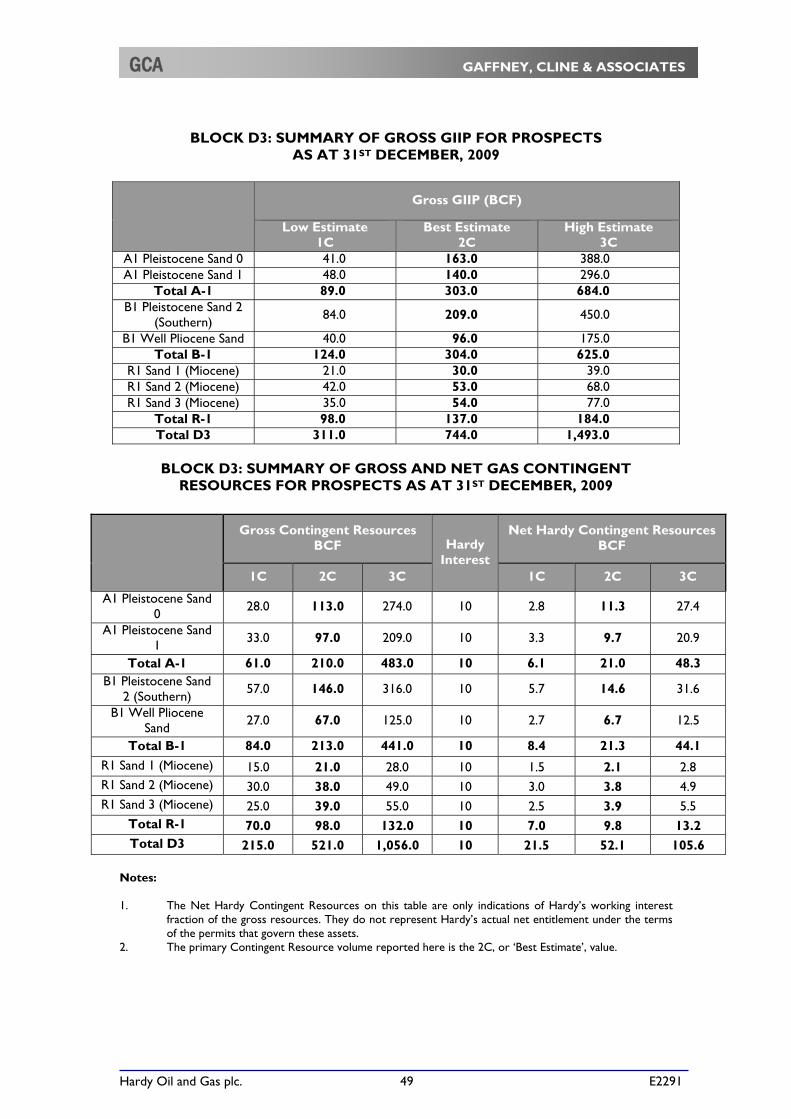
Hardy Oil and Gas plc. 49 E2291
GCA GAFFNEY, CLINE & ASSOCIATES
BLOCK D3: SUMMARY OF GROSS GIIP FOR PROSPECTS
AS AT 31ST DECEMBER, 2009
Gross GIIP (BCF)
Low Estimate 1C
Best Estimate 2C
High Estimate 3C
A1 Pleistocene Sand 0 41.0 163.0 388.0 A1 Pleistocene Sand 1 48.0 140.0 296.0
Total A-1 89.0 303.0 684.0 B1 Pleistocene Sand 2
(Southern) 84.0 209.0 450.0
B1 Well Pliocene Sand 40.0 96.0 175.0 Total B-1 124.0 304.0 625.0
R1 Sand 1 (Miocene) 21.0 30.0 39.0 R1 Sand 2 (Miocene) 42.0 53.0 68.0 R1 Sand 3 (Miocene) 35.0 54.0 77.0
Total R-1 98.0 137.0 184.0 Total D3 311.0 744.0 1,493.0
BLOCK D3: SUMMARY OF GROSS AND NET GAS CONTINGENT
RESOURCES FOR PROSPECTS AS AT 31ST DECEMBER, 2009
Gross Contingent Resources BCF Hardy
Interest
Net Hardy Contingent Resources BCF
1C 2C 3C 1C 2C 3C
A1 Pleistocene Sand 0 28.0 113.0 274.0 10 2.8 11.3 27.4
A1 Pleistocene Sand 1 33.0 97.0 209.0 10 3.3 9.7 20.9
Total A-1 61.0 210.0 483.0 10 6.1 21.0 48.3 B1 Pleistocene Sand
2 (Southern) 57.0 146.0 316.0 10 5.7 14.6 31.6
B1 Well Pliocene Sand
27.0 67.0 125.0 10 2.7 6.7 12.5
Total B-1 84.0 213.0 441.0 10 8.4 21.3 44.1
R1 Sand 1 (Miocene) 15.0 21.0 28.0 10 1.5 2.1 2.8 R1 Sand 2 (Miocene) 30.0 38.0 49.0 10 3.0 3.8 4.9 R1 Sand 3 (Miocene) 25.0 39.0 55.0 10 2.5 3.9 5.5
Total R-1 70.0 98.0 132.0 10 7.0 9.8 13.2 Total D3 215.0 521.0 1,056.0 10 21.5 52.1 105.6
Notes: 1. The Net Hardy Contingent Resources on this table are only indications of Hardy’s working interest
fraction of the gross resources. They do not represent Hardy’s actual net entitlement under the terms of the permits that govern these assets.
2. The primary Contingent Resource volume reported here is the 2C, or ‘Best Estimate’, value.

Hardy Oil and Gas plc. 50 E2291
GCA GAFFNEY, CLINE & ASSOCIATES
1.3.2.2 Block D 3 Prospective Resources
GCA has sufficient data to validate the resource volumes of the Prospects in the 3D seismic area. GCA reviewed the 3D seismic data and the relevant well data for the A1, B1 and R1 wells and calculated the probabilistic volumetric resource estimates. The criteria used by GCA for amplitude extraction and subsequent identification of the probability areas (P90, P50 and P10) used in the volumetrics are:
Absolute magnitude of seismic amplitude, relative to well calibrations; Consistency of seismic amplitude magnitude across the areas to define the Low
(P90); Best Estimate (P50) and High Estimate (P10) probability range; and Morphology of seismic amplitudes as related to environment of deposition. This approach was consistently applied throughout validation of each amplitude event in D3.
The anomalies reviewed by GCA in Block D3 are associated with high seismic amplitudes in the Plio-Pleistocene geologic section. In general, the relative size of the individual horizon amplitude identified Prospects are small, averaging some 9 km2 and ranging between 4 to 16.4 km2. The Pleistocene and Pliocene gas sand responses as defined by petrophysics in the A1, B1 and R1 wells are calibrated to their respective seismic amplitude responses at the well locations. These calibrated seismic amplitude responses are extrapolated away from the well bore to identify areas of similar gas sand occurrence. Results from recent technical evaluations that includes reprocessing of 3D seismic data (work in progress), will modify the seismic amplitude methodology and the assumptions used. Hardy provided an AVO analysis performed including fluid factor analysis, fluid substitution models generated and seismic inversion. This was used, in conjunction with other seismic attributes to guide volumetric estimates. According to the report, the Pleistocene Sands 1 and 2 exhibit a polarity reversal, increase amplitude with offset, and is a Class III anomaly. The Pliocene gas sand exhibits a polarity reversal and was designated as a Class III anomaly. GCA independently validated these conclusions using the data provided by Hardy. GCA performed probabilistic volumetric calculations using Crystal Ball and applying the Low-Best-High Estimates range of reservoir parameter values in a triangular distribution. The Prospective Resources attributed to D3 are shown in Table 0.6 of the Summary section and in the table below. A summary of the Low Estimate (P90), Best Estimate (P50), and High Estimate (P10) GIIP values are listed in the summary table below. GCA has previously reviewed the GCoS for the prospects identified by Hardy in Block D3. These estimates have largely remained unchanged in this evaluation with the exception of prospects associated with the Miocene play. To reflect the success of the R1 well, the GCoS for the Miocene prospects has been changed from 48 % to 70 %.

Hardy Oil and Gas plc. 51 E2291
GCA GAFFNEY, CLINE & ASSOCIATES
BLOCK D3: SUMMARY OF GROSS GIIP FOR PROSPECTS AS AT 31ST DECEMBER, 2009
Prospect Play
Gross GIIP (BCF)
Low Estimate
Best Estimate
High Estimate
B1 Pleistocene Sand 2 (Central) Pleistocene 43.0 184.0 472.0 B1Pleistocene Sand 2 (Northern) Pleistocene 107.0 367.0 867.0 F1 Pleistocene 130.0 391.0 834.0 G1 Pleistocene 298.0 426.0 568.0 K1 Pleistocene 177.0 592.0 1,249.0 P1 Pleistocene 119.0 431.0 992.0 D1 Pliocene 30.0 56.0 89.0 E1 Pliocene 107.0 244.0 450.0 L1 Pliocene 78.0 193.0 370.0 U1 Sand 1 Pliocene 76.0 191.0 404.0 U1 Sand 2 Pliocene 107.0 231.0 431.0 QA1 Sand 1 Pliocene 143.0 241.0 385.0 U2 Sand Pliocene 103.0 240.0 453.0 S1 Sand 1 Pliocene 57.0 98.0 152.0 S1 Sand2 Pliocene 73.0 100.0 141.0 T1 Pliocene 75.0 107.0 148.0 W1 Sand 1 Pliocene 124.0 218.0 357.0 W1 Sand 2 Pliocene 262.0 427.0 622.0 G1 Miocene 157.0 459.0 939.0 J1 Miocene 189.0 390.0 722.0 M1 Miocene 247.0 646.0 1,259.0 QA1 Sand 2 Miocene 289.0 444.0 659.0 R1 Sand Miocene 32.0 54.0 80.0 W1 Sand 3 Miocene 165.0 265.0 398.0 H1 Oligocene 468.0 1,170.0 2,274.0 Z1 Oligocene 125.0 415.0 966.0 Notes: 1. It is inappropriate to focus on any of these volume postulations other than the ‘Best Estimate’. 2. The aggregation of Prospective Resources is not appropriate due to mathematical dependency.
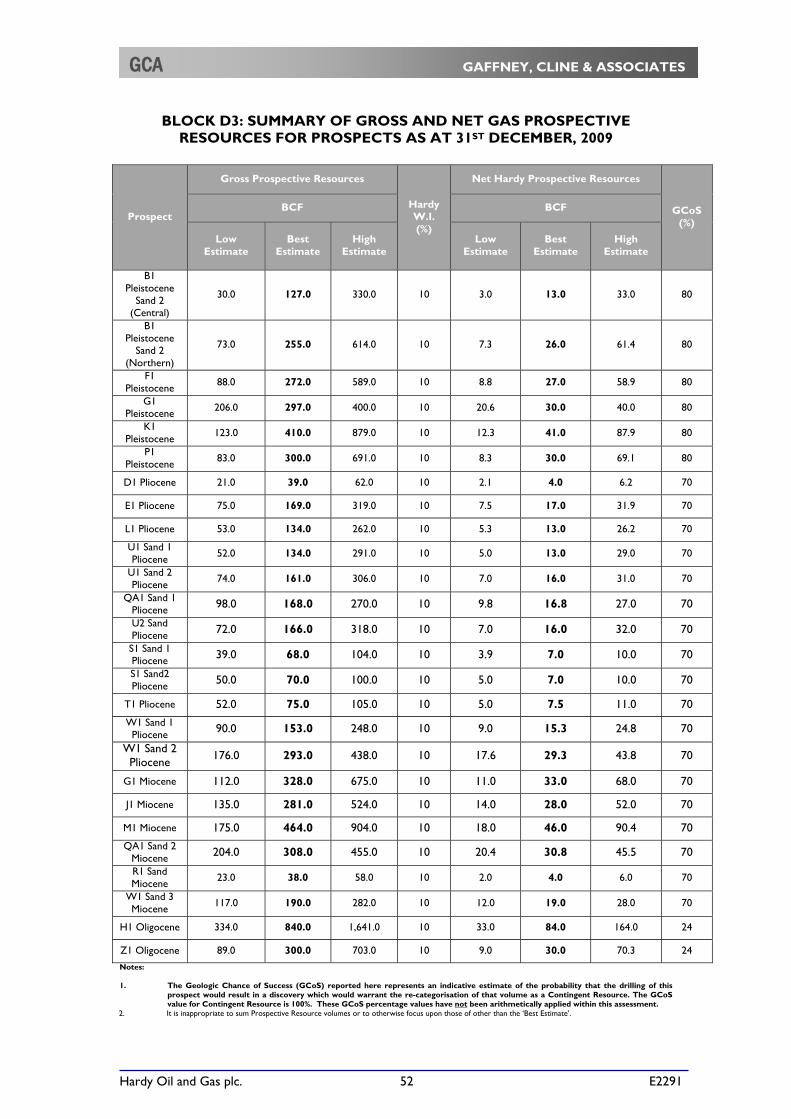
Hardy Oil and Gas plc. 52 E2291
GCA GAFFNEY, CLINE & ASSOCIATES
BLOCK D3: SUMMARY OF GROSS AND NET GAS PROSPECTIVE RESOURCES FOR PROSPECTS AS AT 31ST DECEMBER, 2009
Prospect
Gross Prospective Resources
Hardy W.I. (%)
Net Hardy Prospective Resources
GCoS (%)
BCF BCF
Low Estimate
Best Estimate
High Estimate
Low Estimate
Best Estimate
High Estimate
B1 Pleistocene
Sand 2 (Central)
30.0 127.0 330.0 10 3.0 13.0 33.0 80
B1 Pleistocene
Sand 2 (Northern)
73.0 255.0 614.0 10 7.3 26.0 61.4 80
F1 Pleistocene
88.0 272.0 589.0 10 8.8 27.0 58.9 80
G1 Pleistocene 206.0 297.0 400.0 10 20.6 30.0 40.0 80
K1 Pleistocene 123.0 410.0 879.0 10 12.3 41.0 87.9 80
P1 Pleistocene 83.0 300.0 691.0 10 8.3 30.0 69.1 80
D1 Pliocene 21.0 39.0 62.0 10 2.1 4.0 6.2 70
E1 Pliocene 75.0 169.0 319.0 10 7.5 17.0 31.9 70
L1 Pliocene 53.0 134.0 262.0 10 5.3 13.0 26.2 70
U1 Sand 1 Pliocene 52.0 134.0 291.0 10 5.0 13.0 29.0 70
U1 Sand 2 Pliocene
74.0 161.0 306.0 10 7.0 16.0 31.0 70
QA1 Sand 1 Pliocene 98.0 168.0 270.0 10 9.8 16.8 27.0 70
U2 Sand Pliocene 72.0 166.0 318.0 10 7.0 16.0 32.0 70
S1 Sand 1 Pliocene 39.0 68.0 104.0 10 3.9 7.0 10.0 70
S1 Sand2 Pliocene 50.0 70.0 100.0 10 5.0 7.0 10.0 70
T1 Pliocene 52.0 75.0 105.0 10 5.0 7.5 11.0 70
W1 Sand 1 Pliocene 90.0 153.0 248.0 10 9.0 15.3 24.8 70
W1 Sand 2 Pliocene
176.0 293.0 438.0 10 17.6 29.3 43.8 70
G1 Miocene 112.0 328.0 675.0 10 11.0 33.0 68.0 70
J1 Miocene 135.0 281.0 524.0 10 14.0 28.0 52.0 70
M1 Miocene 175.0 464.0 904.0 10 18.0 46.0 90.4 70
QA1 Sand 2 Miocene 204.0 308.0 455.0 10 20.4 30.8 45.5 70
R1 Sand Miocene
23.0 38.0 58.0 10 2.0 4.0 6.0 70
W1 Sand 3 Miocene 117.0 190.0 282.0 10 12.0 19.0 28.0 70
H1 Oligocene 334.0 840.0 1,641.0 10 33.0 84.0 164.0 24
Z1 Oligocene 89.0 300.0 703.0 10 9.0 30.0 70.3 24
Notes: 1. The Geologic Chance of Success (GCoS) reported here represents an indicative estimate of the probability that the drilling of this
prospect would result in a discovery which would warrant the re-categorisation of that volume as a Contingent Resource. The GCoS value for Contingent Resource is 100%. These GCoS percentage values have not been arithmetically applied within this assessment.
2. It is inappropriate to sum Prospective Resource volumes or to otherwise focus upon those of other than the ‘Best Estimate’.

Hardy Oil and Gas plc. 53 E2291
GCA GAFFNEY, CLINE & ASSOCIATES
1.4 Assam-Arakan Basin
The Assam-Arakan Basin is located in the NE India and covers about 115,000 km2. Several oil and gas fields have been discovered in thrust sheets of the Assam-Arakan fold belt. This part of India also has numerous oil and gas seepages. The first commercial oil field was discovered in 1889. ONGC began to explore actively in 1955, which resulted in discovery of large oil fields such as Rudrasagar, Lakwa, Lakhmani, Geleki and Borholla Changpang. The Assam-Arakan Basin is a folded mountain system in the north and alluvium to the south. The Assam shelf (basin) contains about 7,000 m of sediments. The basement is crystalline and metamorphic rocks. Above this are alluvium and clastics that range from Cretaceous to Recent. There is an Eocene age limestone and some coal beds of Oligocene age. The major oil accumulations occur in the Oligocene and Miocene clastics and are related to the trend of basement ridges. These reservoirs were deposited in environments ranging from delta front, distributary channels / point bar to fluvial deposits of a braided channel system. Source rocks are present throughout the geologic section. The known petroleum systems that exist in the area are the Sylhet-Kopili and Barail-Tipam Formations as seen in the Formation, Source, Res, Seal and O&G columns of Figure 1.17. Both regional and local cap rocks are present. The discovered oil fields are mainly anticlinal structures associated with ENE-WSW and NNE-SSW trends. The play types anticipated on the block consist of: Anticlines and faulted anticlines; Fault closures; Pinchouts; Fractured basement; and Stratigraphic lens traps.
1.4.1 AS-ONN-2000/1 (Hardy NWI 10%)
The AS_ONN-2000/1 block is located onshore in the northeast part of India, immediately north of the Brahmaputra River and south of the Eastern Himalaya (Figure 0.2). It is a frontier exploration block. It measures 5,754 km2. The block is 150 km west and northwest of a series of oil fields south of the Brahmaputra River (Figure 1.16). The most nearby oil discovery is to the south, Golaghat, in Eocene sandstones made by ONGC in 2008. The reservoir rocks in this Block are expected to be fractured granite basement, and sandstones throughout the geologic section (Figure 1.17). The objective levels are the Kopili, Sylhet, Tura and Bokabil Formations and the Middle Eocene Sylhet formation that consists of interbedded limestone and siltstone.

Hardy Oil and Gas plc. 54 E2291
GCA GAFFNEY, CLINE & ASSOCIATES
FIGURE 1.16
OIL FIELDS SOUTH OF BRAHMAPUTRA RIVER AS-ONN-2000/1
Source: Hardy
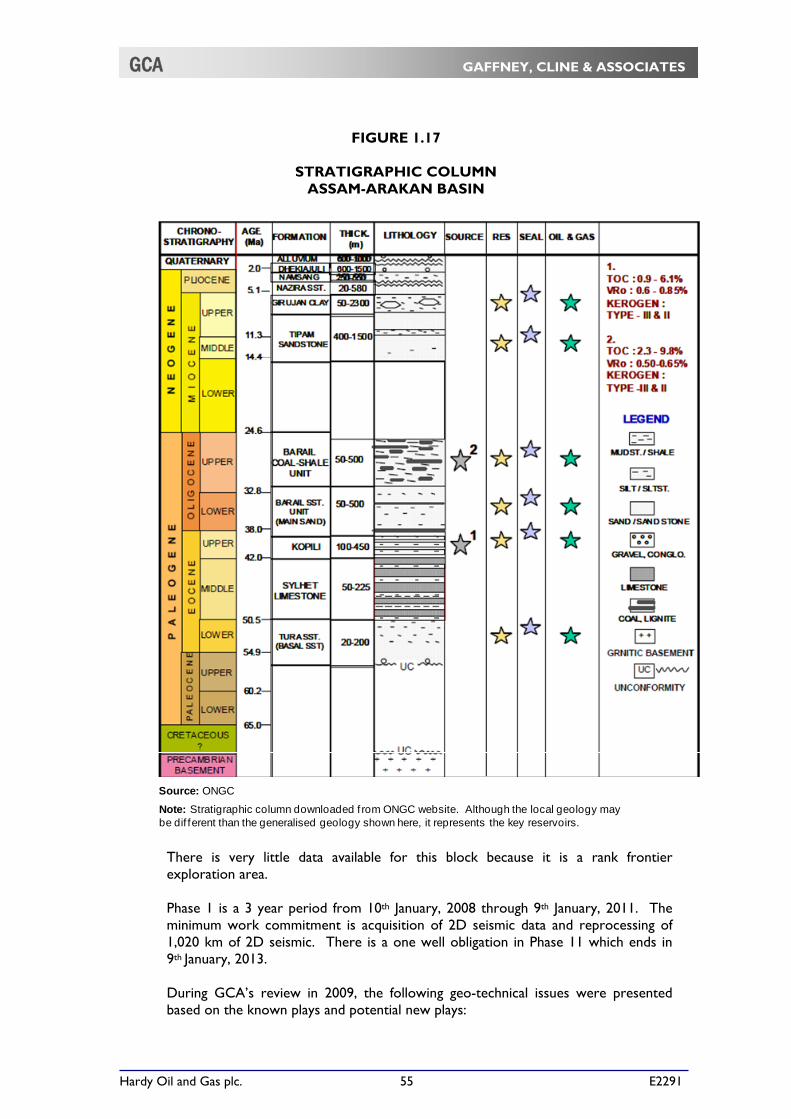
Hardy Oil and Gas plc. 55 E2291
GCA GAFFNEY, CLINE & ASSOCIATES
FIGURE 1.17
STRATIGRAPHIC COLUMN
ASSAM-ARAKAN BASIN
There is very little data available for this block because it is a rank frontier exploration area. Phase 1 is a 3 year period from 10th January, 2008 through 9th January, 2011. The minimum work commitment is acquisition of 2D seismic data and reprocessing of 1,020 km of 2D seismic. There is a one well obligation in Phase 11 which ends in 9th January, 2013. During GCA’s review in 2009, the following geo-technical issues were presented based on the known plays and potential new plays:
Source: ONGC
Note: Stratigraphic column downloaded f rom ONGC website. Although the local geology may be dif ferent than the generalised geology shown here, it represents the key reservoirs.

Hardy Oil and Gas plc. 56 E2291
GCA GAFFNEY, CLINE & ASSOCIATES
Complex structures in the block will require 3D seismic for proper imaging; Reservoir compartmentalization can be expected; and Relatively small to medium field size per analogue trends. To mitigate these challenges, GCA proposed: Construction of regional X-sections that integrate Gravity/Magnetic modelling;
regional structural lineaments from satellite data; surface geology; seismic; analogue and literature search; perform structural balancing and palinspastic reconstructions;
Implement geochemical sampling programme in conjunction with Bharelli River field reconnaissance; analyze for fluid inclusions volatiles (FIV); and
Establish regional tectono-stratigraphic framework, including environment of deposition and plate tectonic evolution as a basis for play analysis.
This block is virtually unexplored and has very little technical data. There is some 2D (old 124 km; new 391 km) seismic of poor to locally fair quality in the shallow geologic section (Figure 1.18); regional gravity data; geochemical survey (work in progress); and environmental studies for well locations.
FIGURE 1.18
SEISMIC LINE AS-17-08 IN ASSAM BLOCK
Source: Hardy
Namsang
Tipam
Sylhet
Basement
Gondwana?
0 10 km

Hardy Oil and Gas plc. 57 E2291
GCA GAFFNEY, CLINE & ASSOCIATES
There are two leads defined with the existing 2D seismic data; Gohpur is a faulted anticline and Rajabari is a horst block (Figure1.19). GCA has reviewed the seismic in Hardy’s PowerPoint presentation. The seismic data quality is fair and the grid density is coarse (3 km to 5 km by 3 km). Gohpur and Rajabari are each defined by 3 seismic lines. GCA is confident that prospects are anticipated when defined with sufficient seismic control.
FIGURE 1.19
AS-ONN-2000/1 PROSPECT AND LEAD LOCATION MAP SYLHET FORMATION TIME STRUCTURE MAP
GCA reviewed the volumetric data supplied by Hardy and validated the parameters as needed. It is the opinion of GCA that these leads are high risk with moderate to large potential. Furthermore, finding reservoir quality rocks and a working petroleum system are the major geologic risks. GCA estimates the GCoS is 5%, typical for a frontier exploration play. A summary of the estimated STOIIP and the Prospective Resources for Assam Leads is shown below:
ASSAM BLOCK: SUMMARY OF GROSS STOIIP FOR LEADS AS AT 31st
DECEMBER, 2009
License
Lead
STOIIP (MMBbl) Low
Estimate Best
Estimate High
Estimate
Assam Gophur - 67.0 - Assam Rajabari - 15.0 -
GOHPUR
RAJABARI
Source: Hardy 0 5 km

Hardy Oil and Gas plc. 58 E2291
GCA GAFFNEY, CLINE & ASSOCIATES
ASSAM BLOCK: SUMMARY OF GROSS AND NET OIL PROSPECTIVE RESOURCES FOR LEADS AS AT 31ST DECEMBER, 2009
License
Lead
Gross Prospective Resources (MMbbl)
Hardy W.I. (%)
Net Prospective Resources (MMbbl) GCoS
(%) Low Estimate
Best Estimate
High Estimate
Low Estimate
Best Estimate
High Estimate
Assam Gophur - 20.0 - 10 - 2.0 - 10 Assam Rajabari - 5.0 - 10 - 0.5 - 10
2. ECONOMIC EVALUATION NPVs have been calculated for the ‘Proved’, ‘Proved plus Probable’ and ‘Proved plus Probable plus Possible’ Reserve categories, at nominal discount rates of 7.5%, 10% and 12.5%, these being discount rates considered by GCA to be typical of the Cost of Capital rates used in the petroleum industry for the appraisal of assets such as PY-3. GCA's assessment is based upon GCA’s understanding of the fiscal and contractual terms governing the assets. The values of physical assets, i.e. plant and equipment, have not been considered separately as such values have been implicitly included in the assessment of the NPVs as part of the petroleum property rights and facilities relating to the project. The NPVs of estimated after-tax cash flows (as at 31st December, 2009) attributable to a net economic interest in Hardy’s PY-3 field, have been derived using the pricing and inflation assumptions as described herein. No adjustments have been made for cash balances, inventories, indebtedness or other balance sheet effects, other than those stated herein. It should be clearly understood that the NPV of future revenue potential of a petroleum property such as those discussed in this report, do not represent a GCA postulation of the market value of that property, nor an interest in it. In assessing a likely market value, it would be necessary to take into account a number of additional factors including: reserve risk (i.e. that Proved and/or Probable and/or Possible reserves may not be realised); perceptions of economic and sovereign risk; potential upside, such as in this case exploitation of oil reserves beyond the Proved and Probable and Possible level; other benefits, encumbrances or charges that may pertain to a particular interest and the competitive state of the market at the time. GCA has explicitly not taken such factors into account in deriving the NPVs presented herein. 2.1 Fiscal Systems The Production Sharing Contract pertaining to the PY-3 asset is summarised below: Cost Recovery Limit: 100.0%

Hardy Oil and Gas plc. 59 E2291
GCA GAFFNEY, CLINE & ASSOCIATES
Profit Share Basis: Investment Multiple (IM), rates as shown below:
IM GOI Share (%) <1.5 10.0
1.5-2.0 25.0 2.0-2.5 40.0 2.5-3.0 55.0 3.0-3.5 60.0 >3.5 70.0
Investment Multiple (IM) is defined as the ratio of accumulated net cash income from the contract area to accumulated investment in the contract area, earned by the companies, as determined in the PSC. Hardy has advised that taxation of Hardy’s Indian assets is conducted at a Corporate rather than an asset/ contract level. However, in order to arrive at post-tax NPVs, GCA has assumed that the following Petroleum Income Tax and Minimum Alternative Tax rates are applicable. Hardy has represented that a carried forward loss of US$21.8 MM is available to the company to offset future taxes payable on PY-3. This carried forward loss was not considered in the post-tax analysis.
Petroleum Income Tax: 42.23% Royalty: 0.0% Minimum Alternative Tax (MAT): 18.6%
2.2 Cost Assumptions GCA has based its assessment of forward capital and operating costs on the information provided by Hardy in the course of its audit. These have been benchmarked against GCA’s cost database for operations offshore India and found to be acceptable. 2.3 Oil Pricing Hardy has advised that a quality discount of U.S.$0.35/Bbl to Brent is currently achieved for production from PY-3. GCA has used its 2010 Q1 Brent scenario for its NPV calculation. The GCA Brent 1Q 2010 is detailed below:
(U.S.$/Bbl)
2010 80.94 2011 85.76 2012 88.02 2013 87.21 2014 86.59 2015 88.33
Thereafter +2.0% p.a. Some additional assumptions used for the assessment are: 1. The NPVs are net to Hardy’s Entitlement in its 18% working interest in PY-3;

Hardy Oil and Gas plc. 60 E2291
GCA GAFFNEY, CLINE & ASSOCIATES
2. The NPVs are effective from 31st December, 2009; 3. All cash flows are discounted on a mid-year basis; 4. Costs are inflated at 2.0% per annum from 1st January, 2011; and 5. A gross unrecovered cost position of U.S.$18.12 MM, as advised by the client.
SUMMARY OF HARDY REFERENCE PRE / POST-TAX NET PRESENT
VALUES AS AT 31ST DECEMBER, 2009
Notes: 1. Post-Tax values assume no prior tax position as at 31st December, 2009. 2. The above NPVs are Hardy’s Net Entitlement. 3. QUALIFICATIONS
GCA is an independent international energy advisory group of 50 years’ standing, whose expertise includes petroleum reservoir evaluation and economic analysis. The report is based on information compiled by professional staff members who are full time employees of GCA. Staff who participated in the compilation of this report includes Mr. Brian Rhodes, Dr. S. Hattingh, Dr. P.F. Worthington, Dr. B. Vining, Dr M.I. Hussain, Mr. Michael Ring and Mr R. Duque. All hold degrees in geoscience, petroleum engineering or related discipline. Mr. Rhodes holds a B.Sc. (Hons) Geology, is a member of the Energy Institute, the Petroleum Exploration Society of Great Britain, the Society of Petroleum Engineers and the European Association of Geoscientists and Engineers, and has more than 35 years industry experience. Dr. Hattingh is a senior petroleum engineer with 22 years industry and research experience. He has a Ph.D. in Applied Mathematics, MSc in Solar-Terrestrial Physics and B.Sc (Hons) in Geophysics. Dr. Worthington has a B.Sc (Hons) in Pure Maths and Physics, M.Sc in Geophysics, Ph.D. in Engineering Geophysics, D.Sc in Geology and D.Eng in Geoengineering, is a senior geoscientist with over 33 years international experience. Dr. Vining is a senior geoscientist with 31 years international exploration and production experience. He has a B.Sc and Ph.D. in Geology and is a fellow of the Geological Society. Dr. Hussain is a senior reservoir engineer with 25 years industry experience. She has a Ph.D. and M.Sc in Petroleum Engineering and is a member of the Society of Petroleum Engineers and is a member of the Energy Institute. Mr. Ring holds a Bachelor of Science in Geology and a Masters of Arts in Geophysics; he is a member of the Society of Exploration Geophysicists and has over 34 years of industry experience. Mr. Duque has 13 years experience in the industry, he has a B.Sc in Process Control Engineering and a MBA in Oil and Gas Management; he is also a member of the Society of Petroleum Engineers.
Asset Reserves Category
Pre-Tax NPVs Net to Hardy (U.S.$ MM)
Post-Tax NPVs Net to Hardy (U.S.$ MM)
7.5% 10.0% 12.5% 7.5% 10.0% 12.5%
PY-3
Proved 18.91 18.35 17.82 11.00 10.67 10.37
Proved plus Probable
85.77 78.62 72.31 45.00 40.48 36.52
Proved plus Probable plus Possible
107.04 96.03 86.39 52.51 45.43 39.29

Hardy Oil and Gas plc. 61 E2291
GCA GAFFNEY, CLINE & ASSOCIATES
4. BASIS OF OPINION This assessment has been conducted within the context of GCA’s understanding of the effects of petroleum legislation, taxation, and other regulations that currently apply to these properties. However, GCA is not in a position to attest to property title, financial interest relationships or encumbrances thereon for any part of the appraised properties.
It should be understood that any determination of reserve volumes and corresponding NPVs, particularly involving petroleum developments, would be subject to significant variations over short periods of time as new information becomes available and perceptions change.
Yours sincerely, GAFFNEY, CLINE & ASSOCIATES LTD.
Brian Rhodes

Hardy Oil and Gas plc. E2291
GCA GAFFNEY, CLINE & ASSOCIATES
APPENDIX I
Glossary

Hardy Oil and Gas plc. E2291
GCA GAFFNEY, CLINE & ASSOCIATES
GLOSSARY List of key abbreviations used in this report oAPI Degrees API (American Petroleum Institute) AVO Amplitude versus Offset AVA Amplitude versus offset Analysis B Billion (109) Bbl Barrels BCF Billion cubic feet BCM Billion cubic metres bcpd Barrels of condensate per day BHP Bottom hole pressure bpd Barrels per day boe Barrels of oil equivalent @ xxx mcf/bbl bopd Barrels oil per day BS&W Basic sediment and water BTU British Thermal Units bwpd Barrels water per day CO2 Carbon Dioxide CAPEX Capital Expenditure cm centimetres CT Corporation Tax Deg C Degrees Celsius DST Drill Stem Test E&A Exploration & Appraisal EMV Expected Monetary Value EUR Estimated Ultimate Recovery ft3 Cubic feet Fx Foreign Exchange Rate G&A General and Administrative costs GIIP Gas initially in place GOR Gas Oil Ratio GOI Government of India H2S Hydrogen Sulphide HP High pressure HT High temperature kl Kilolitres km Kilometers km2 Square kilometres LNG Liquefied Natural Gas LoF Life of Field LPG Liquefied Petroleum Gas m Metres m3 Cubic metres mD Permeability in millidarcies mg Milligram M Thousand MM Million ms milliseconds mya Million years ago NGL Natural Gas Liquids N Nitrogen
Hardy Oil and Gas plc. E2291
GCA GAFFNEY, CLINE & ASSOCIATES
GLOSSARY (Cont'd.) NELP New Exploration Licensing Policy NPV Net Present Value NWI Net Working Interest/Net Participating Interest OCM Operating Committee Meeting OPEX Operating Expenditure p.a. Per annum psi Pounds per square inch psig Pounds per square inch gauge PVT Pressure volume temperature PDHG Downhole pressure gauge RFT Repeat Formation Tester scf Standard Cubic Feet scfd Standard Cubic Feet per day SL Straight line (for depreciation) SS Subsea stb Stock tank barrel STOIIP Stock tank oil initially in place Te Tonnes equivalent TCM Technical Committee Meeting THP Tubing head pressure TOC Total Organic Carbon Tpd Tonnes per day TVDSS True Vertical Depth Subsea WD Water depth WI Working Interest 2D Two dimensional 3D Three dimensional % Percentage U.S.$ United States Dollar
Hardy Oil and Gas plc. E2291
GCA GAFFNEY, CLINE & ASSOCIATES
APPENDIX II
Society of Petroleum Engineers, World Petroleum Council, American Association of Petroleum Geologists and Society of Petroleum Evaluation
Engineers, Petroleum Resources Management System Definitions and Guidelines

Gaffney, Cline & Associates
Hardy
Society of Petroleum Engineers, World Petroleum Council, American Association of Petroleum Geologists and Society of Petroleum Evaluation Engineers
Petroleum Resources Management System
Definitions and Guidelines (1)
March 2007
Preamble Petroleum resources are the estimated quantities of hydrocarbons naturally occurring on or within the Earth’s crust. Resource assessments estimate total quantities in known and yet-to-be-discovered accumulations; resources evaluations are focused on those quantities that can potentially be recovered and marketed by commercial projects. A petroleum resources management system provides a consistent approach to estimating petroleum quantities, evaluating development projects, and presenting results within a comprehensive classification framework. International efforts to standardize the definition of petroleum resources and how they are estimated began in the 1930s. Early guidance focused on Proved Reserves. Building on work initiated by the Society of Petroleum Evaluation Engineers (SPEE), SPE published definitions for all Reserves categories in 1987. In the same year, the World Petroleum Council (WPC, then known as the World Petroleum Congress), working independently, published Reserves definitions that were strikingly similar. In 1997, the two organizations jointly released a single set of definitions for Reserves that could be used worldwide. In 2000, the American Association of Petroleum Geologists (AAPG), SPE and WPC jointly developed a classification system for all petroleum resources. This was followed by additional supporting documents: supplemental application evaluation guidelines (2001) and a glossary of terms utilized in Resources definitions (2005). SPE also published standards for estimating and auditing reserves information (revised 2007). These definitions and the related classification system are now in common use internationally within the petroleum industry. They provide a measure of comparability and reduce the subjective nature of resources estimation. However, the technologies employed in petroleum exploration, development, production and processing continue to evolve and improve. The SPE Oil and Gas Reserves Committee works closely with other organizations to maintain the definitions and issues periodic revisions to keep current with evolving technologies and changing commercial opportunities. The SPE PRMS document consolidates, builds on, and replaces guidance previously contained in the 1997 Petroleum Reserves Definitions, the 2000 Petroleum Resources Classification and Definitions publications, and the 2001 “Guidelines for the Evaluation of Petroleum Reserves and Resources”; the latter document remains a valuable source of more detailed background information. These definitions and guidelines are designed to provide a common reference for the international petroleum industry, including national reporting and regulatory disclosure agencies, and to support petroleum project and portfolio management requirements. They are intended to improve clarity in global communications regarding petroleum resources. It is expected that SPE PRMS will be supplemented with industry education programs and application guides addressing their implementation in a wide spectrum of technical and/or commercial settings. It is understood that these definitions and guidelines allow flexibility for users and agencies to tailor application for their particular needs; however, any modifications to the guidance contained herein should be clearly identified. The definitions and guidelines contained in this document must not be construed as modifying the interpretation or application of any existing regulatory reporting requirements. The full text of the SPE PRMS Definitions and Guidelines can be viewed at: www.spe.org/specma/binary/files/6859916Petroleum_Resources_Management_System_2007.pdf
1 These Definitions and Guidelines are extracted from the Society of Petroleum Engineers / World Petroleum Council /
American Association of Petroleum Geologists / Society of Petroleum Evaluation Engineers (SPE/WPC/AAPG/SPEE) Petroleum Resources Management System document (“SPE PRMS”), approved in March 2007.

Gaffney, Cline & Associates
Hardy
RESERVES
Reserves are those quantities of petroleum anticipated to be commercially recoverable by application of development projects to known accumulations from a given date forward under defined conditions.
Reserves must satisfy four criteria: they must be discovered, recoverable, commercial, and remaining based on the development project(s) applied. Reserves are further subdivided in accordance with the level of certainty associated with the estimates and may be sub-classified based on project maturity and/or characterized by their development and production status. To be included in the Reserves class, a project must be sufficiently defined to establish its commercial viability. There must be a reasonable expectation that all required internal and external approvals will be forthcoming, and there is evidence of firm intention to proceed with development within a reasonable time frame. A reasonable time frame for the initiation of development depends on the specific circumstances and varies according to the scope of the project. While 5 years is recommended as a benchmark, a longer time frame could be applied where, for example, development of economic projects are deferred at the option of the producer for, among other things, market-related reasons, or to meet contractual or strategic objectives. In all cases, the justification for classification as Reserves should be clearly documented. To be included in the Reserves class, there must be a high confidence in the commercial producibility of the reservoir as supported by actual production or formation tests. In certain cases, Reserves may be assigned on the basis of well logs and/or core analysis that indicate that the subject reservoir is hydrocarbon-bearing and is analogous to reservoirs in the same area that are producing or have demonstrated the ability to produce on formation tests.
On Production
The development project is currently producing and selling petroleum to market.
The key criterion is that the project is receiving income from sales, rather than the approved development project necessarily being complete. This is the point at which the project “chance of commerciality” can be said to be 100%. The project “decision gate” is the decision to initiate commercial production from the project.
Approved for Development
A discovered accumulation where project activities are ongoing to justify commercial development in the foreseeable future.
The key criterion is that the project is receiving income from sales, rather than the approved development project necessarily being complete. This is the point at which the project “chance of commerciality” can be said to be 100%. The project “decision gate” is the decision to initiate commercial production from the project.
Justified for Development
Implementation of the development project is justified on the basis of reasonable forecast commercial conditions at the time of reporting, and there are reasonable expectations that all necessary approvals/contracts will be obtained.
In order to move to this level of project maturity, and hence have reserves associated with it, the development project must be commercially viable at the time of reporting, based on the reporting entity’s assumptions of future prices, costs, etc. (“forecast case”) and the specific circumstances of the project. Evidence of a firm intention to proceed with development within a reasonable time frame will be sufficient to demonstrate commerciality. There should be a development plan in sufficient detail to support the assessment of commerciality and a reasonable expectation that any regulatory approvals or sales contracts required prior to project implementation will be forthcoming. Other than such approvals/contracts, there should be no known contingencies that could preclude the development from proceeding within a reasonable timeframe (see Reserves class). The project “decision gate” is the decision by the reporting entity and its partners, if any, that the project has reached a level of technical and commercial maturity sufficient to justify proceeding with development at that point in time.
Proved Reserves
Proved Reserves are those quantities of petroleum, which by analysis of geoscience and engineering data, can be estimated with reasonable certainty to be commercially recoverable, from a given date forward, from known reservoirs and under defined economic conditions, operating methods, and government regulations.
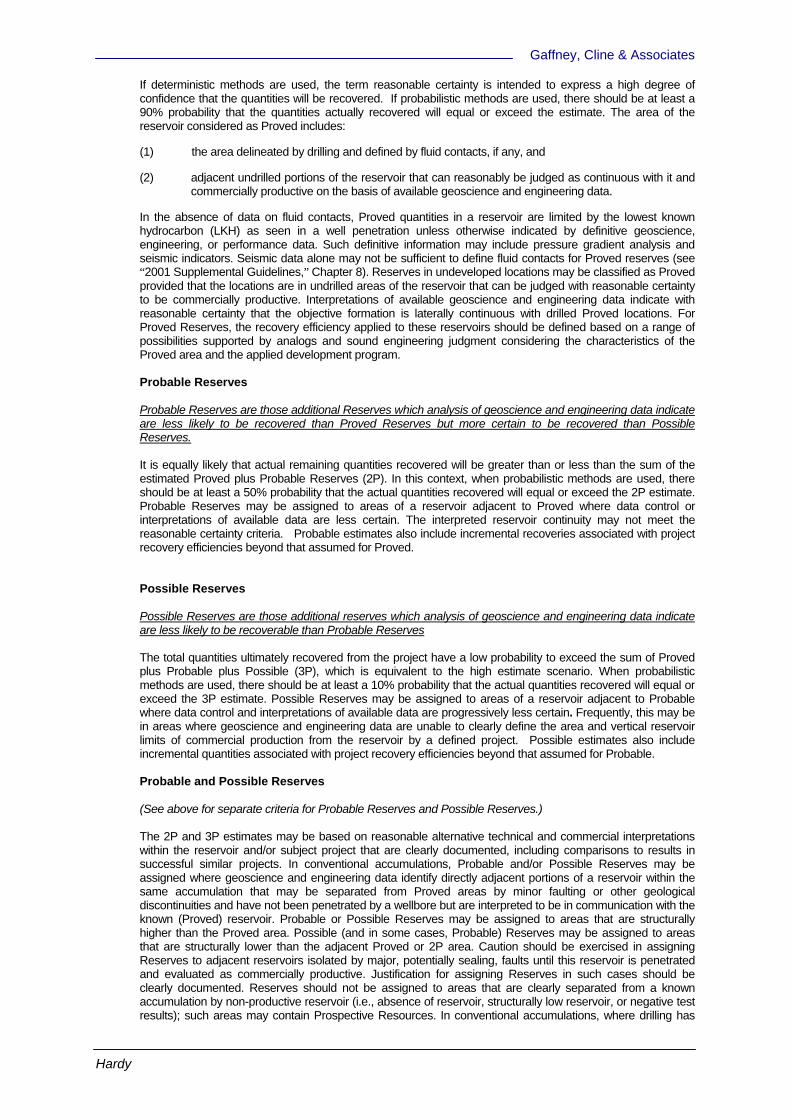
Gaffney, Cline & Associates
Hardy
If deterministic methods are used, the term reasonable certainty is intended to express a high degree of confidence that the quantities will be recovered. If probabilistic methods are used, there should be at least a 90% probability that the quantities actually recovered will equal or exceed the estimate. The area of the reservoir considered as Proved includes:
(1) the area delineated by drilling and defined by fluid contacts, if any, and
(2) adjacent undrilled portions of the reservoir that can reasonably be judged as continuous with it and commercially productive on the basis of available geoscience and engineering data.
In the absence of data on fluid contacts, Proved quantities in a reservoir are limited by the lowest known hydrocarbon (LKH) as seen in a well penetration unless otherwise indicated by definitive geoscience, engineering, or performance data. Such definitive information may include pressure gradient analysis and seismic indicators. Seismic data alone may not be sufficient to define fluid contacts for Proved reserves (see “2001 Supplemental Guidelines,” Chapter 8). Reserves in undeveloped locations may be classified as Proved provided that the locations are in undrilled areas of the reservoir that can be judged with reasonable certainty to be commercially productive. Interpretations of available geoscience and engineering data indicate with reasonable certainty that the objective formation is laterally continuous with drilled Proved locations. For Proved Reserves, the recovery efficiency applied to these reservoirs should be defined based on a range of possibilities supported by analogs and sound engineering judgment considering the characteristics of the Proved area and the applied development program.
Probable Reserves
Probable Reserves are those additional Reserves which analysis of geoscience and engineering data indicate are less likely to be recovered than Proved Reserves but more certain to be recovered than Possible Reserves.
It is equally likely that actual remaining quantities recovered will be greater than or less than the sum of the estimated Proved plus Probable Reserves (2P). In this context, when probabilistic methods are used, there should be at least a 50% probability that the actual quantities recovered will equal or exceed the 2P estimate. Probable Reserves may be assigned to areas of a reservoir adjacent to Proved where data control or interpretations of available data are less certain. The interpreted reservoir continuity may not meet the reasonable certainty criteria. Probable estimates also include incremental recoveries associated with project recovery efficiencies beyond that assumed for Proved.
Possible Reserves
Possible Reserves are those additional reserves which analysis of geoscience and engineering data indicate are less likely to be recoverable than Probable Reserves
The total quantities ultimately recovered from the project have a low probability to exceed the sum of Proved plus Probable plus Possible (3P), which is equivalent to the high estimate scenario. When probabilistic methods are used, there should be at least a 10% probability that the actual quantities recovered will equal or exceed the 3P estimate. Possible Reserves may be assigned to areas of a reservoir adjacent to Probable where data control and interpretations of available data are progressively less certain. Frequently, this may be in areas where geoscience and engineering data are unable to clearly define the area and vertical reservoir limits of commercial production from the reservoir by a defined project. Possible estimates also include incremental quantities associated with project recovery efficiencies beyond that assumed for Probable.
Probable and Possible Reserves
(See above for separate criteria for Probable Reserves and Possible Reserves.)
The 2P and 3P estimates may be based on reasonable alternative technical and commercial interpretations within the reservoir and/or subject project that are clearly documented, including comparisons to results in successful similar projects. In conventional accumulations, Probable and/or Possible Reserves may be assigned where geoscience and engineering data identify directly adjacent portions of a reservoir within the same accumulation that may be separated from Proved areas by minor faulting or other geological discontinuities and have not been penetrated by a wellbore but are interpreted to be in communication with the known (Proved) reservoir. Probable or Possible Reserves may be assigned to areas that are structurally higher than the Proved area. Possible (and in some cases, Probable) Reserves may be assigned to areas that are structurally lower than the adjacent Proved or 2P area. Caution should be exercised in assigning Reserves to adjacent reservoirs isolated by major, potentially sealing, faults until this reservoir is penetrated and evaluated as commercially productive. Justification for assigning Reserves in such cases should be clearly documented. Reserves should not be assigned to areas that are clearly separated from a known accumulation by non-productive reservoir (i.e., absence of reservoir, structurally low reservoir, or negative test results); such areas may contain Prospective Resources. In conventional accumulations, where drilling has

Gaffney, Cline & Associates
Hardy
defined a highest known oil (HKO) elevation and there exists the potential for an associated gas cap, Proved oil Reserves should only be assigned in the structurally higher portions of the reservoir if there is reasonable certainty that such portions are initially above bubble point pressure based on documented engineering analyses. Reservoir portions that do not meet this certainty may be assigned as Probable and Possible oil and/or gas based on reservoir fluid properties and pressure gradient interpretations.
Developed Reserves Developed Reserves are expected quantities to be recovered from existing wells and facilities. Reserves are considered developed only after the necessary equipment has been installed, or when the costs to do so are relatively minor compared to the cost of a well. Where required facilities become unavailable, it may be necessary to reclassify Developed Reserves as Undeveloped. Developed Reserves may be further sub-classified as Producing or Non-Producing.
Developed Producing Reserves Developed Producing Reserves are expected to be recovered from completion intervals that are open and producing at the time of the estimate.
Improved recovery reserves are considered producing only after the improved recovery project is in operation.
Developed Non-Producing Reserves
Developed Non-Producing Reserves include shut-in and behind-pipe Reserves
Shut-in Reserves are expected to be recovered from:
(1) completion intervals which are open at the time of the estimate but which have not yet started producing,
(2) wells which were shut-in for market conditions or pipeline connections, or
(3) wells not capable of production for mechanical reasons.
Behind-pipe Reserves are expected to be recovered from zones in existing wells which will require additional completion work or future re-completion prior to start of production. In all cases, production can be initiated or restored with relatively low expenditure compared to the cost of drilling a new well.
Undeveloped Reserves
Undeveloped Reserves are quantities expected to be recovered through future investments:
(1) from new wells on undrilled acreage in known accumulations,
(2) from deepening existing wells to a different (but known) reservoir,
(3) from infill wells that will increase recovery, or
(4) where a relatively large expenditure (e.g. when compared to the cost of drilling a new well) is required to
(a) recomplete an existing well or
(b) install production or transportation facilities for primary or improved recovery projects.

Gaffney, Cline & Associates
Hardy
CONTINGENT RESOURCES
Those quantities of petroleum estimated, as of a given date, to be potentially recoverable from known accumulations by application of development projects, but which are not currently considered to be commercially recoverable due to one or more contingencies.
Contingent Resources may include, for example, projects for which there are currently no viable markets, or where commercial recovery is dependent on technology under development, or where evaluation of the accumulation is insufficient to clearly assess commerciality. Contingent Resources are further categorized in accordance with the level of certainty associated with the estimates and may be sub-classified based on project maturity and/or characterized by their economic status.
Development Pending
A discovered accumulation where project activities are ongoing to justify commercial development in the foreseeable future.
The project is seen to have reasonable potential for eventual commercial development, to the extent that further data acquisition (e.g. drilling, seismic data) and/or evaluations are currently ongoing with a view to confirming that the project is commercially viable and providing the basis for selection of an appropriate development plan. The critical contingencies have been identified and are reasonably expected to be resolved within a reasonable time frame. Note that disappointing appraisal/evaluation results could lead to a re-classification of the project to “On Hold” or “Not Viable” status. The project “decision gate” is the decision to undertake further data acquisition and/or studies designed to move the project to a level of technical and commercial maturity at which a decision can be made to proceed with development and production.
Development Unclarified or on Hold
A discovered accumulation where project activities are on hold and/or where justification as a commercial development may be subject to significant delay.
The project is seen to have potential for eventual commercial development, but further appraisal/evaluation activities are on hold pending the removal of significant contingencies external to the project, or substantial further appraisal/evaluation activities are required to clarify the potential for eventual commercial development. Development may be subject to a significant time delay. Note that a change in circumstances, such that there is no longer a reasonable expectation that a critical contingency can be removed in the foreseeable future, for example, could lead to a reclassification of the project to “Not Viable” status. The project “decision gate” is the decision to either proceed with additional evaluation designed to clarify the potential for eventual commercial development or to temporarily suspend or delay further activities pending resolution of external contingencies.
Development Not Viable
A discovered accumulation for which there are no current plans to develop or to acquire additional data at the time due to limited production potential.
The project is not seen to have potential for eventual commercial development at the time of reporting, but the theoretically recoverable quantities are recorded so that the potential opportunity will be recognized in the event of a major change in technology or commercial conditions. The project “decision gate” is the decision not to undertake any further data acquisition or studies on the project for the foreseeable future.

Gaffney, Cline & Associates
Hardy
PROSPECTIVE RESOURCES Those quantities of petroleum which are estimated, as of a given date, to be potentially recoverable from undiscovered accumulations. Potential accumulations are evaluated according to their chance of discovery and, assuming a discovery, the estimated quantities that would be recoverable under defined development projects. It is recognized that the development programs will be of significantly less detail and depend more heavily on analog developments in the earlier phases of exploration. Prospect
A project associated with a potential accumulation that is sufficiently well defined to represent a viable drilling target. Project activities are focused on assessing the chance of discovery and, assuming discovery, the range of potential recoverable quantities under a commercial development program. Lead A project associated with a potential accumulation that is currently poorly defined and requires more data acquisition and/or evaluation in order to be classified as a prospect. Project activities are focused on acquiring additional data and/or undertaking further evaluation designed to confirm whether or not the lead can be matured into a prospect. Such evaluation includes the assessment of the chance of discovery and, assuming discovery, the range of potential recovery under feasible development scenarios. Play A project associated with a prospective trend of potential prospects, but which requires more data acquisition and/or evaluation in order to define specific leads or prospects. Project activities are focused on acquiring additional data and/or undertaking further evaluation designed to define specific leads or prospects for more detailed analysis of their chance of discovery and, assuming discovery, the range of potential recovery under hypothetical development scenarios.

Gaffney, Cline & Associates
Hardy
RESOURCES CLASSIFICATION
PROJECT MATURITY