Embed Size (px)
Citation preview

© Fraunhofer IPK
Global Sustainability Challenges
and GBN Sustainability Tool
Fraunhofer-Institute for Production Systems
and Design Technology (IPK) Berlin
Prof. Dr.-Ing. Holger Kohl
Director Division Corporate Management
GBN’s 9th International Benchmarking Conference
Innovation & Benchmarking for Sustainability
17th December 2015 - Dubai
Le Meridian Hotel Dubai

© Fraunhofer IPK
Fraunhofer – An international innovation driver
Fraunhofer at a glance
Approx. 24 000
employees
More than 72%
revenue from
industrial and
contract research
28% base funding
from Bund and Länder
(2013)
66 institutes and
Research units
Bu
dg
et
2 Bn
2013
Applie
d r
esearc
h
1.7 Bn
Goal: Promoting and conducting applied research for the benefit of
private and public enterprises and society as a whole.
Infrastructure and
defense research

© Fraunhofer
>10 Mio €
8-10 Mio €
4-8 Mio €
1-4 Mio €
107 Mio €
Boston Plymouth
East
Lansing San José Newark
College Park
Londo
n
Vancouver
Santiago de Chile
Salvador
São Paulo
Campinas
Dubai
Bangalore
Jakarta
Kuala Lumpur
Singapur
Peking Seoul
Tokio Sendai
Kairo Jerusalem
Brüssel
Porto
Wien
Bozen Graz
Budapest
Wrocław
Göteborg Glasgow
Paris
Southampton
Niederlassung
Center
Project Center
ICON / Strategische Kooperation
Repräsentanz- / Marketingbüro
Senior Advisor
Fraunhofer International Engagement
Stellenbosch
Dublin
Osaka
Pretoria
Hamilton
Zur Lavon

© Fraunhofer
Social challenge: eradicating global
poverty
Two major sustainability challenges for the 21st century…
Source: Rockström et al. 2009
Source: Worldbank 2009
30th November – 11th December 2015:
United Nations Framework Convention on
Climate Change, Paris, France
25th September – 27th September 2015:
United Nations Summit to adopt the post-2015
development agenda, New York, USA
Environmental challenge: staying
within planetary boundaries
Ocean
acidificati
on
Stratospheri
c ozon
depletion
Climate
change Chemical
pollution
Atmospheric
aerosol
loading
Biodiversity
loss
Change in
land use Global
freshwater
use
Nitrogen
cycle
Phosphoru
s cycle

© Fraunhofer
Economical, environmental and social challenge
Nation sizes to
greenhouse gas
emissions ratio
Nation sizes to
population ratio
Nation sizes to
GDP ratio in
USD
ww
w.w
orldm
app
er.
org
w
ww
.wo
rldm
app
er.
org
ww
w.w
orldm
app
er.
org

© Fraunhofer
Quality of life and consumption of resources
Source: [Seliger, 2010]
Industrialised
countries
Emerging
countries
Responsible consumption of resources
Accep
tab
le liv
ing
sta
nd
ard
Irresponsible development
path: Wealth for all people
relying on present
technologies
Quality of life
Co
nsu
mp
tio
n o
f re
so
urc
es
Acceptable living standard with responsible
consumption of resources

© Fraunhofer
Prosperity for everybody? How to design and manufacture products and services
► opening up hungry markets,
► avoiding bad investments in saturated markets,
► increasing human wealth on global level within
conditions of ecological resource availability
Change in existing process
paradigms
► from economies of scale to
economies of scope,
► to more benefit for more
people with less resources.

Triple Bottom Line of Sustainability
Sustainable Development
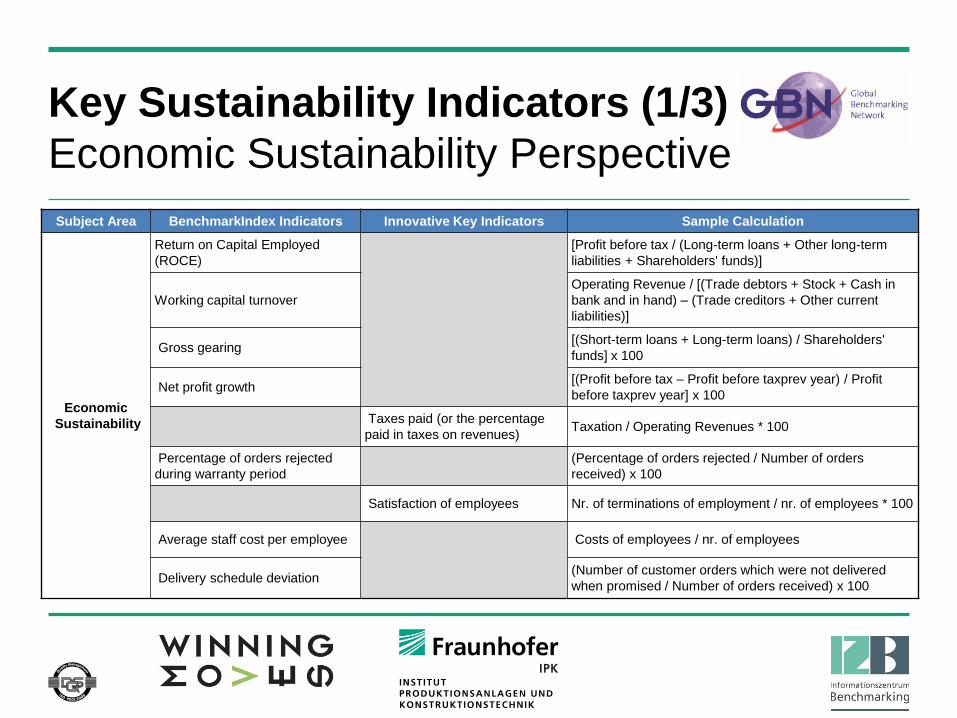
Key Sustainability Indicators (1/3)
Economic Sustainability Perspective
Subject Area BenchmarkIndex Indicators Innovative Key Indicators Sample Calculation
Economic
Sustainability
Return on Capital Employed
(ROCE)
[Profit before tax / (Long-term loans + Other long-term
liabilities + Shareholders' funds)]
Working capital turnover
Operating Revenue / [(Trade debtors + Stock + Cash in
bank and in hand) – (Trade creditors + Other current
liabilities)]
Gross gearing [(Short-term loans + Long-term loans) / Shareholders'
funds] x 100
Net profit growth [(Profit before tax – Profit before taxprev year) / Profit
before taxprev year] x 100
Taxes paid (or the percentage
paid in taxes on revenues) Taxation / Operating Revenues * 100
Percentage of orders rejected
during warranty period
(Percentage of orders rejected / Number of orders
received) x 100
Satisfaction of employees Nr. of terminations of employment / nr. of employees * 100
Average staff cost per employee
Costs of employees / nr. of employees
Delivery schedule deviation (Number of customer orders which were not delivered
when promised / Number of orders received) x 100

Key Sustainability Indicators (2/3)
Ecological Sustainability Perspective
Subject Area BenchmarkIndex Figures Innovative Key Figures Sample Calculation
Ecological
Sustainability
Number of new products with
sustainability features per year
Nr. of new products with sustainability features / nr.
of new products * 100
Locations with eco-balances Locations with eco-balances / nr. of locations * 100
Sales generated per square meter
Operating Revenues / Square Meters of Premises
Floor Space
Pollution (air) Pollution (km3)
Pollution (water) Pollution (l)
Waste Waste (t)
Recycling rate Recyclable waste / waste (t) * 100
Consumption of resources (water) Consumption (l)
Consumption of resources (energy) Consumption (MWh)

Key Sustainability Indicators (3/3)
Social Sustainability Perspective
Subject Area BenchmarkIndex Figures Innovative Key Figures Sample Calculation
Social
Sustainability
Staff costs as a percentage of
sales (Staff costs / Operating Revenue) x 100
Employees with formal work-
related qualifications per FTE
employee
Number of FTE employees with formal work-related
qualifications / Number of FTE employees x 100
New employees per FTE
employee
(Number of new FTE employees / Number of FTE
employees) x 100
Proportion of women executives Nr. of female executives / nr. of executives * 100
Earnings ratio men / women Costs of male employees / costs of female
employees * 100
Percentage of employees over 50
years Nr. of employees (50+) / nr. of employees * 100
Share trainee Nr. of trainees / nr. of employees * 100
Number of jobs created Nr. of employees (act. year) - nr. of employees (last
year)
Expenses for health care and safety
precaution Expenses for health care and safety precaution

Screenshots from the Tool (1/3)
Welcome Page

Screenshots from the Tool (2/3)
Start Interface

Screenshots from the Tool (3/3)
Data Input

Output (1/2)
Benchmark Report

Output (2/2)
Benchmark Results

© Fraunhofer IPK
Dubai Institute of Technology (DIT)
DIT was founded in 2008 to support Dubai in becoming a leading place in the world for R&D
activities. Fraunhofer IPK supported DIT in creating an Ecosystem that supports Science,
Technology & Innovation to lead the region towards a value-based sustainable knowledge
economy.
Research Area Major Topics
W
H
E
E
L
Water
Health
Energy
Engineering
Logistics / Mobility
Water Desalination
Water Treatment
Integrated Water Management
Medical Technologies
Biotechnology
Health Management
Renewable Sources of Energy
Sustainable Fossil Fuels
Energy Efficient Management
Production Technology
Sustainable Manufacturing
Engineering Management
Intelligent Transport Systems
Global Logistics
Logistics Management
Researc
h In
sti
tute
s
Un
ivers
itie
s

© Fraunhofer IPK
American University of Sharjah Plan for the development and implementation of the American University of Sharjah project for
a RTI Park (Research, Technology and Innovation)
Duration: 6 Monate
Area: 1.7 sqkm
Planning of the RTI Park in Sharjah
04.11.2014

© Fraunhofer IPK
© B
ild:
Fra
unhofe
r IP
K/K
onsta
ntin H
eß
Thank you for your kind attention.
Prof. Dr.-Ing. Holger Kohl
Director Division Corporate Management