Embed Size (px)
Citation preview

GB Wholesale Market SummaryOctober 2021Published November 2021

2Source: Aurora Energy Research
Aurora offers power market forecasts and market intelligence spanning Europe’s key markets, the US and Australia
Bespoke forecasts
Aurora can provide power market forecasts upon request
Comprehensive Power Market Services
✓ ✓
✓
✓
✓
✓
✓
✓
Market forecast reports
Forecast data in Excel
Global energy market forecast reports
Strategic insight reports
Regular subscriber group meetings
Policy updates
Bilateral workshops
Analyst support✓
Power MarketForecast Reports
Power market forecast reports
Forecast data in Excel
Analyst support
✓
✓
✓

3
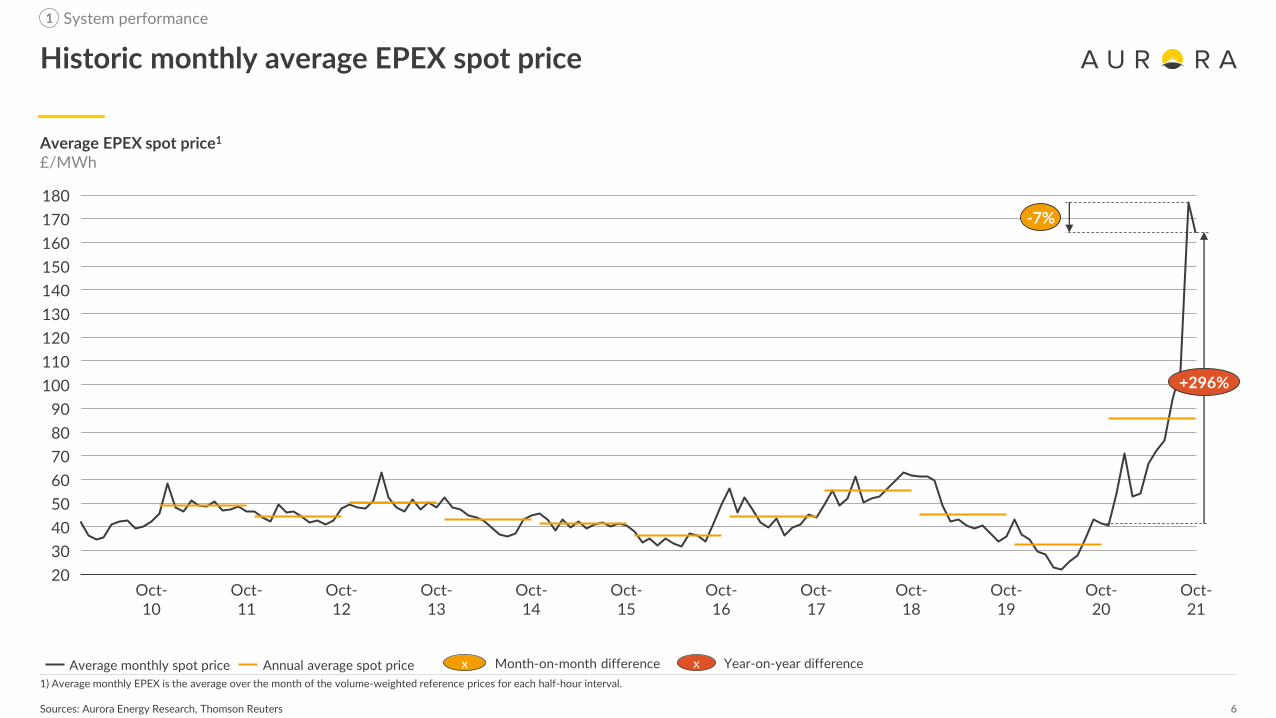
E x e c u t i v e S u m m a r y▪ The average power price in October was
£164.4/MWh, a 7% decrease since September
▪ Despite higher average gas and carbon prices, power prices fell in October due to increased wind production which contributed 36% of the month’s domestic output, compared to just 19% in September
▪ The UK-ETS traded at an average of £61/tCO2 in October, a £3/tCO2increase relative to September
▪ Average CCGT load factors decreased from 38% in September to 28% in October, and those for offshore wind doubled from 27% to 53%
▪ Consequently, domestic power sector emissions totalled 3.1 MtCO2e, a 23% decrease relative to September
Sources: Aurora Energy Research, Thomson Reuters, National Grid, Ofgem, Elexon
1) Values averaged over the calendar month. 2) Includes CPS and EU-ETS, the UK-ETS auctions will commence form May 2021. 3) Includes renewables and nuclear generation 4) Includes CCGTs, coal and other fossil plants. 5) Onshore wind only
Monthly value1 Month-on-month change
Year-on-year change
Slide reference(s)
Power prices£/MWh 164.4
-12.7(7%)
+122.9(296%) 5, 6
Gas prices£/MWh 68.5 +15.3
(29%)+55.4
(425%)7
Carbon2 prices£/tCO2
79.2 +3.4(4%)
+38.3(94%) 7
Transmission demandTWh 21.2 +1.7
(9%)-1.0(4%) 10
Low carbon3 generationTWh 13.3 +3.7
(39%)-0.4(3%)
11, 12
Thermal4 generationTWh 7.1 -2.1
(23%)-0.7
(10%) 11, 12
Carbon emissionsMtCO2e 3.1
-0.9(23%)
-0.3(8%) 14
Grid carbon intensitygCO2e/kWh 172.9 -73.3
(30%)-1.6
(0.9%) 14
Wind load factors5
% 43.9 +20.4(91%)
+2.4(6%) 25
Wind capture prices5
£/MWh 156.7 +0.6(0.4%)
+117.5(299%) 27

4
Agenda
I. System performance
II. Company performance
III. Plant performance

5
EPEX spot price1
£/MWh
Sources: Aurora Energy Research, Thomson Reuters
Half-hourly EPEX spot price for October
1) Half-hourly EPEX is the volume-weighted reference price over that half-hour interval, as provided by EPEX Spot
System performance1
400
08-Oct
200
24-Oct04-Oct 28-Oct20-Oct12-Oct 16-Oct 01-Nov-50
0
50100150
450
250300350
500550600650700750
Monthly average price in October 2021:164.36 £/MWh
6
Average EPEX spot price1
£/MWh
Sources: Aurora Energy Research, Thomson Reuters
Historic monthly average EPEX spot price
1) Average monthly EPEX is the average over the month of the volume-weighted reference prices for each half-hour interval.
System performance1
60
20
180
30
50
80
150
40
160
70
170
90100110120130140
Oct-13
Oct-21
Oct-12
Oct-15
Oct-10
Oct-11
Oct-17
Oct-14
Oct-18
Oct-19
Oct-20
Oct-16
+296%
-7%
Average monthly spot price Annual average spot price x Month-on-month difference x Year-on-year difference

7
Gas/Coal price£/MWh
Sources: Aurora Energy Research, Thomson Reuters
Historic fuel pricesGas, Coal and Carbon daily prices
System performance1
May-21Dec-20
95
Oct-20 Feb-21
8590
25
0Nov-20 Jan-21
6560
Mar-21 Apr-21 Jun-21
75
Jul-21
40
Aug-21
80
Sep-21 Oct-21 Nov-21
10
20
70
30
50
70
60
90
100
05
35
101520
30
80
40455055
UK Carbon price£/Tonne
+29%
+4%
Gas Coal CO2 Monthly averages x Month-on-month difference

8Sources: Aurora Energy Research, ICE Futures, Bank of England
Historic UK ETS and EU ETS Prices
30354045505560657075
31-May 12-Jul03-May 17-May 14-Jun 28-Jun 06-Sep26-Jul 09-Aug 23-Aug 20-Sep 04-Oct 18-Oct
EU ETS UK ETS Monthly UK ETS averageWeekly average EU and UK ETS prices £/tCO2
-10
0
10
20
30
40
31-May03-May 17-May 14-Jun 09-Aug26-Jul28-Jun 12-Jul 23-Aug 06-Sep 20-Sep 04-Oct 18-Oct
Relative difference between UK and EU ETS prices %
On the first day of trading, UK ETS prices traded at 5% above the EU ETS
Week commencing
Week commencing
UK ETS began trading on the 19th of May at a price of £45/tCO2
System performance1
The UK ETS traded at an average of £61.0/tCO2 in October

9Sources: Elexon, National Grid, Thomson Reuters, Aurora Energy Research
Half-hourly spot prices against half-hourly system margins for October
1) Half-hourly EPEX is the volume-weighted reference price over that half-hour interval, as provided by EPEX Spot. 2) Margins are calculated as the difference between MEL and Demand for each half-hour period. Demand data presented here is Initial Transmission System Demand Out-Turn, and does not include embedded demand. MEL is calculated as the sum of all transmission BM units reporting MEL values in each half-hour. Where a BMU gives multiple values in a half-hour, only the least is taken.
System performance1
EPEX spot price1
£/MWh
-500
50100150200250300350400450500550600650700750
15,0000 10,0005,000 20,000 25,000 30,000 35,000
Margins2
MW

10
15
50
0
5
35
25
40
20
10
30
45
55
Tu FWMF Sa Su Th Sa Su SuM Tu W Th F Sa Su M TuTu W Th F Sa Su M FW Th Sa
Sources: National Grid, Aurora Energy Research
Daily October max and min demandRelative to historic October max and min demand since 20101
1) Data from previous years is matched to the nearest weekday within the current month, to maintain the weekly demand pattern. 2) Demand data presented here is Initial Transmission System Demand Out-Turn, and does not include embedded demand.
System performance1
Demand2
GW
Daily range Historic maximum/minimum

11Sources: National Grid, Aurora Energy Research
Monthly historical demand on the transmission system
1) Demand data presented here is Initial Transmission System Demand Out-Turn, and includes station transformer load, pumped storage demand and interconnector demand, but does not include embedded demand.
System performance1
Total demand1
TWh
26
16
18
22
20
30
24
28
32
34
Oct-10
Oct-11
Oct-20
Oct-17
Oct-12
Oct-18
Oct-13
Oct-14
Oct-15
Oct-16
Oct-19
Oct-21
+9%
-4%
Total monthly demand Annual average demand x Month-on-month difference x Year-on-year difference
12
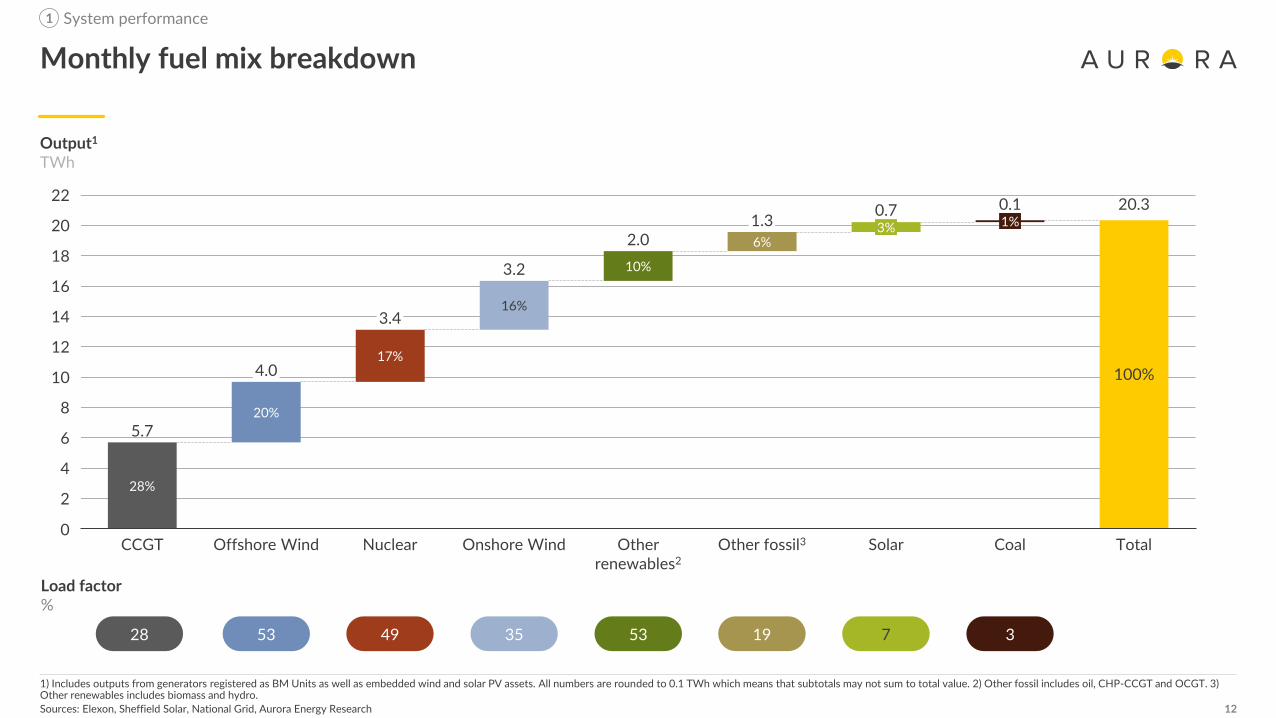
Output1
TWh
Sources: Elexon, Sheffield Solar, National Grid, Aurora Energy Research
Monthly fuel mix breakdown
0
14
8
2
10
16
4
6
12
18
20
22
Onshore Wind
28%
CCGT
20%
Offshore Wind Nuclear
0.7
Other renewables2
16%
17%
10%
Other fossil3
3%
Solar
4.0
Coal
100%
Total
1%0.1
6%2.0
5.7
3.4
3.2
1.320.3
Load factor%
System performance
1) Includes outputs from generators registered as BM Units as well as embedded wind and solar PV assets. All numbers are rounded to 0.1 TWh which means that subtotals may not sum to total value. 2) Other fossil includes oil, CHP-CCGT and OCGT. 3) Other renewables includes biomass and hydro.
1
28 53 49 35 53 19 7 3

13
Output1
% of total
Sources: Elexon, Sheffield Solar, National Grid, Aurora Energy Research
Historical fuel mix breakdown
System performance
21% 17% 19% 23%17%
24% 23% 24%19% 22% 22%
17%
32%33%
50% 42%
34%29%
36%34%
18%
16%
23%25%
42%
34%
31% 33%27%
28%
20%
0%
10%
20%
30%
40%
50%
60%
70%
80%
90%
100%
4%
Oct-13
Oct-18
Oct-10
Oct-11
Oct-12
Oct-14
Oct-15
4%
Oct-16
Oct-17
Oct-20
Oct-19
Oct-21
1%
3%
2%
6%
1%
8%
16%
10%
CCGTNuclear Onshore WindOther renewables3Coal ImportsOther fossil2 Offshore Wind Solar1) Includes outputs from generators registered as BM Units as well as embedded wind and solar PV. 2) Other fossil includes oil, CHP-CCGT and OCGT. 3) Other renewables includes biomass and hydro.
1

14
Flow1
MW
Sources: Elexon, National Grid, Aurora Energy Research
Monthly interconnector flow duration curveFlow in each half-hour for GB interconnectors
1) Positive flow is imports into GB, negative flow is exports.
System performance
200
-1,200
-1,000
-400
-800-600
-200
1,600
0
400600800
1,0001,2001,400
1,800
2,000
I/C Rep. IrelandI/C France
I/C France 2
I/C Netherlands
I/C N. Ireland I/C Belgium
I/C Norway
1
TimeHalf-hours

15
Emissions1
MtCO2e
Sources: Elexon, Ofgem, Aurora Energy Research
Monthly emissions by technology
1) Please refer to Appendix for details of methodology employed to calculate emission amounts. Includes all Balancing Mechanism plants. 2) Other fossil includes oil, OCGT and gas CHP-CCGT.
System performance
0
1
2
3
4
5
6
200
300
50
0
100
150
250
4.1
Oct-20 Nov-20 Dec-20 Jan-21 Feb-21 Sep-21Mar-21
4.2
Apr-21 May-21 Jun-21 Jul-21 Aug-21 Oct-21
3.4
4.1
4.6
5.8
3.7
4.5
3.9
3.3 3.43.1
3.7
-8% -23%
CoalBiomass Other fossil2 CCGT System carbon intensity
1
Carbon intensitygCO2e/kWh
x Month-on-month difference x Year-on-year difference

16
Agenda
I. System performance
II. Company performance (Subscriber only)
III. Plant performance

17
Agenda
I. System performance
II. Company performance
III. Plant performance

18
Load factor1
%
Sources: Aurora Energy Research, Elexon, BEIS
Plant utilisation – load factors by plant
1) Represents 60 plants with highest capacity according to the Balancing Mechanism (BM) database, as well as aggregated data for wind and solar. Capacity of each plant represents the sum of capacities of all its generators that have been active at least once in the last three months. Please refer to Appendix for a detailed description of the data used and categories presented
Plant Performance
Capacity GW
3
Column width reflects capacity
28 36 5038
20
30
90
50
746856
40
86 340 222 104 12 14 32 6616 18
100
20 24
60
64 7262
80
580
545230 764644
10
4226
70
40 706048
Ø 34
Pumped Storage
Biomass Hydro
Gas CHP-CCGTCCGT Oil
Coal Nuclear
Interconnector OCGT
Offshore Wind Onshore Wind Solar

19
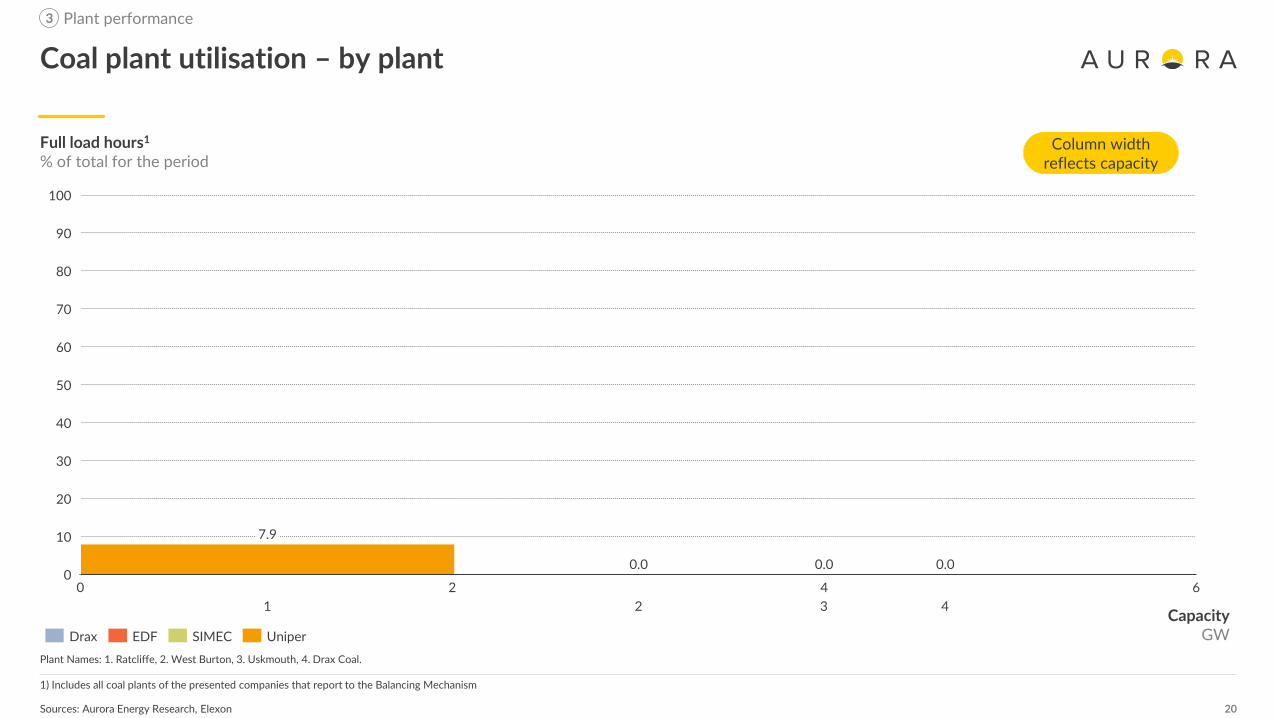
Full load hours1
% of total for the period
Sources: Aurora Energy Research, Elexon
CCGT plant utilisation – by plant
1) Includes all CCGT plants of the presented companies that report to the Balancing Mechanism
Plant Performance
CapacityGW
3
Column width reflects capacity
Plant Names: 1. Pembroke, 2. West Burton B, 3. Great Yarmouth, 4. Didcot B, 5. Carrington, 6. Langage, 7. Marchwood, 8. Staythorpe, 9. Kings Lynn, 10. Cottam Dvpt Centre, 11. Spalding, 12.Enfield Energy, 13. Shoreham, 14. Seabank 2, 15. Seabank 1, 16. Rocksavage, 17. South Humber Bank, 18. Damhead Creek, 19. Connahs Quay, 20. Keadby, 21. Little Barford, 22. Coryton, 23.Medway, 24. Rye House, 25. Peterhead, 26. Corby, 27. Killingholme 2, 28. Killingholme 1, 29. Glanford Brigg, 30. Sutton Bridge, 31. Peterborough, 32. Severn, 33. Baglan Bay.
50
80
50
40
70
30
20
10
0
60
90
30
100
20 25151023
0.3
3 26 271029
30 31 32 33
65.5
52.7
12.1
52.3
51.8
16
51.6
51.4
47.0
34.3
26.3
24.5
24.3
23.5
0.0
23.3
16.7
16.5
16.1
11.6
8.3
5.6
9
2.2
0.3
0.0
0.0
7
0.0
0.0
0.0
11
46.5
4 5 241328
251 182 126
36.4
178 14 15
17.7
19 20 21 22
3.7
Calon DraxCentrica EDF EPH ESB Munich ReIntergen RWE SSE Uniper
20
Full load hours1
% of total for the period
Sources: Aurora Energy Research, Elexon
Coal plant utilisation – by plant
1) Includes all coal plants of the presented companies that report to the Balancing Mechanism
Plant performance
Capacity GW
3
Column width reflects capacity
Plant Names: 1. Ratcliffe, 2. West Burton, 3. Uskmouth, 4. Drax Coal.
50
6
40
4
100
0 20
10
20
30
60
70
80
90
1
7.9
0.0
2 3 4
0.0 0.0
EDFDrax UniperSIMEC

21
Average load factor1
%
Sources: Aurora Energy Research, Elexon, Crown Estate
Monthly load factors by technology
1) Includes outputs from generators registered as BM Units as well as embedded wind and solar PV
Plant performance
40 42 41 3650
3923 26 21 15 23 22
43
0
60
20
40
Aug-21Oct-20 Nov-20 Dec-20 Jan-21 Apr-21Feb-21 Mar-21 May-21 Jun-21 Jul-21 Sep-21 Oct-21
56 52 52 4859
4528 31 23 21 31 27
5320
40
0
60
Aug-21Oct-20 Nov-20 Dec-20 Jan-21 Jun-21Feb-21 Mar-21 Apr-21 May-21 Jul-21 Sep-21 Oct-21
6 4 2 3 6 915 16 16
12 117
0
5
20
10
15
Oct-20 Nov-20 Dec-20 Jan-21 Feb-21 Mar-21
17
Apr-21 May-21 Jun-21 Jul-21 Aug-21 Sep-21 Oct-21
Solar Solar AverageOffshore Wind Offshore AverageOnshore Wind Average
3

22
Load factor1
%
Sources: Aurora Energy Research, Elexon, Crown Estate
Wind farm utilisation – load factor by wind farm
1) Represents UK wind farms reporting Balancing Mechanism Unit data. Figures presented reflect Final Physical Notification (FPN) expectations reported to the grid, which are not always representative of actual production
Plant performance
80
10
100
50
40
90
70
30
60
0
20
1101 90 1071002010 111
10830 40 706050
109
80
Offshore Wind Onshore Wind
3
Plant Names: 1. Whiteside Hill, 2. Moray East, 3. Halsary Windfarm, 4. Hornsea 1 , 5. Galloper, 6. Aikengall 2, 7. Crystal Rig, 8. East Anglia One, 9. Dudgeon, 10. Beinn an Tuirc III , 11. West of Duddon Sands, 12. Beatrice, 13. Walney Extension, 14.Westermost Rough, 15. Blackcraig, 16. Humber, 17. Brockloch Rig 2, 18. Race Bank, 19. Fallago Rig, 20. Lincs, 21. Kilgallioch, 22. Walney, 23. Sanquhar Community, 24. Greater Gabbard, 25. Dunmaglass, 26. Robin Rigg, 27. Stronelairg, 28. Corriegarth, 29.Dorenell, 30. Andershaw, 31. Rampion, 32. Burbo Extension, 33. Cour, 34. Hywind Scotland, 35. Carraig Gheal, 36. Bad a Cheo, 37. Gwynt y Mor, 38. Gordonstown, 39. Clyde, 40. Camster, 41. Assel Valley, 42. London Array, 43. Aberdeen, 44. Afton, 45.Farr, 46. Barrow, 47. Kilbraur, 48. Minsca, 49. Gunfleet Sands, 50. Thanet, 51. Gordonbush, 52. Freasdail, 53. Baillie, 54. Beinneun, 55. Rothes Extension, 56. Harburnhead, 57. Strathy North, 58. Millennium, 59. A Chruach, 60. Hare Hill Extension, 61. EweHill, 62. Burbo Bank, 63. Sheringham Shoals, 64. Ormonde, 65. Mid Hill, 66. Berry Burn, 67. Glen App, 68. Pen y Cymoedd, 69. Bhlaraidh, 70. Edinbane, 71. Clashindarroch, 72. Toddleburn, 73. Minnygap, 74. Dersalloch, 75. Braes of Doune, 76. Burn of Whilk,77. Goole Fields, 78. Coire Na Cloiche, 79. Hill of Glaschyle, 80. Glens of Foudland, 81. Beinn Tharsuinn, 82. Dalswinton, 83. Griffin, 84. Tullymurdoch, 85. Embedded Wind, 86. Beinn An Tuirc , 87. Tullo, 88. An Suidhe, 89. Whitelee, 90. Hill of Towie, 91.Tullo Extension, 92. Corriemoillie, 93. Arecleoch, 94. Harestanes, 95. Dun Law Extension, 96. Hadyard Hill, 97. Mark Hill, 98. Kype Muir, 99. Craig, 100. Lochluichart, 101. Auchrobert, 102. Galawhistle, 103. Moy, 104. Glenchamber, 105. Black Law, 106.Middle Muir, 107. Clachan Flats, 108. Airies, 109. Brownieleys, 110. Kincardine, 111. Keith Hill.

23
Baseload and capture price1,2
£/MWh
RES capture price versus baseload price
1) Baseload price is the average monthly EPEX price; 2) Wind capture price is the load-weighted monthly average EPEX price across all wind Balancing Mechanism plants for all half-hourly periods. 3) Negative values represent capture prices above the baseload price while positive values represent capture prices below the baseload price
Plant performance
Sources: Aurora Energy Research, Elexon, Thomson Reuters
3
Apr-21Feb-21Dec-20Nov-20-10
Oct-20 Jan-21 Mar-21 May-21 Jun-21 Jul-21
-5
Aug-21 Sep-21 Oct-21
0
5
10
15
Technology capture discount2,3 to baseload%
May-21Jan-21Oct-20
150
Nov-20 Aug-21Dec-20 Mar-21Feb-21 Apr-21 Jun-21 Jul-21 Sep-21 Oct-210
50
100
200+299%
-1%
Baseload Offshore Wind Average windOnshore Wind x Month-on-month difference (average wind) x Year-on-year difference (average wind)

24
▪ Output values used in this summary reflect the sum of Final Physical Notifications (FPN) submitted by all BM Units of a given plant that have been active over the last three months.
▪ Capacity values used in this summary reflect the sum of capacities of individual BM Units, as reported to the Balancing Mechanism, that have been active over the last three months. They reflect long-term capacities and exclude temporary fluctuations due e.g. to plant failures or scheduled maintenance.
▪ Prices used in this summary are the EPEX half-hourly Reference Prices for half-hourly, two-hourly and four-hourly spot products.
Data used
▪ Full-load hours represent the plants’ load factors, calculated as the ratio of the output produced in a given month to the maximum possible output given the plants’ capacity.
▪ Running hours represent the proportion of time in a given month when a plant has been active, i.e. when at least one of its BM Units produced output greater than zero.
▪ Capture prices (or average output-weighted prices) are calculated as an average of EPEX half-hourly prices per MWh weighted by the plants’ corresponding half-hourly outputs for all periods.
▪ Average gross margins are calculated as a sum of the uplift and inframarginal rent. Uplift is calculated as the difference between the EPEX price and the system marginal cost (SMC). SMC is the maximum marginal cost of all the plants with at least one generator producing above 80% of its installed capacity in a given half-hour.
▪ Emissions are calculated as plant output divided by electrical efficiency, multiplied by theoretical carbon content of the fuel input. The carbon content of fuel inputs is sourced from BEIS’s Greenhouse gas reporting – Conversion factors 2016. System carbon intensity is calculated as the total emission divided by total electricity generated.
Categories presented
Source: Aurora Energy Research
Appendix

25CONFIDENTIAL
General DisclaimerThis document is provided "as is" for your information only and no representation or warranty, express or implied, is given by Aurora Energy Research Limited and itssubsidiaries Aurora Energy Research GmbH and Aurora Energy Research Pty Ltd (together, "Aurora"), their directors, employees agents or affiliates (together, Aurora’s"Associates") as to its accuracy, reliability or completeness. Aurora and its Associates assume no responsibility, and accept no liability for, any loss arising out of your useof this document. This document is not to be relied upon for any purpose or used in substitution for your own independent investigations and sound judgment. Theinformation contained in this document reflects our beliefs, assumptions, intentions and expectations as of the date of this document and is subject to change. Auroraassumes no obligation, and does not intend, to update this information.
Forward-looking statementsThis document contains forward-looking statements and information, which reflect Aurora’s current view with respect to future events and financial performance. Whenused in this document, the words "believes", "expects", "plans", "may", "will", "would", "could", "should", "anticipates", "estimates", "project", "intend" or "outlook" or othervariations of these words or other similar expressions are intended to identify forward-looking statements and information. Actual results may differ materially from theexpectations expressed or implied in the forward-looking statements as a result of known and unknown risks and uncertainties. Known risks and uncertainties include butare not limited to: risks associated with political events in Europe and elsewhere, contractual risks, creditworthiness of customers, performance of suppliers andmanagement of plant and personnel; risk associated with financial factors such as volatility in exchange rates, increases in interest rates, restrictions on access to capital,and swings in global financial markets; risks associated with domestic and foreign government regulation, including export controls and economic sanctions; and otherrisks, including litigation. The foregoing list of important factors is not exhaustive.
CopyrightThis document and its content (including, but not limited to, the text, images, graphics and illustrations) is the copyright material of Aurora, unless otherwise stated.This document is confidential and it may not be copied, reproduced, distributed or in any way used for commercial purposes without the prior written consent of Aurora.
Disclaimer and Copyright