Embed Size (px)
Citation preview
GAZPROM INVESTOR DAY 2017
26; 124;195
150; 150; 150
68; 103; 124
69; 165; 187
245; 190; 50
100; 190; 235
90; 90; 90
140; 200; 40
1; 70; 122
GAZPROM NEFT
GAZPROM INVESTOR DAY 2017
26; 124;195
150; 150; 150
68; 103; 124
69; 165; 187
245; 190; 50
100; 190; 235
90; 90; 90
140; 200; 40
1; 70; 122
DISCLAIMER
This presentation contains forward-looking statements concerning the financial condition, results of operations and businesses
of Gazprom Neft and its consolidated subsidiaries
All statements other than statements of historical fact
are, or may be deemed to be, forward-looking
statements. Forward-looking statements are statements
of future expectations that are based on management’s
current expectations and assumptions and involve
known and unknown risks and uncertainties that could
cause actual results, performance or events to differ
materially from those expressed or implied in these
statements.
Forward-looking statements include, among other
things, statements concerning the potential exposure of
Gazprom Neft to market risks and statements
expressing management’s expectations, beliefs,
estimates, forecasts, projections and assumptions.
These forward-looking statements are identified by their
use of terms and phrases such as ‘‘anticipate’’,
‘‘believe’’, ‘‘could’’, ‘‘estimate’’, ‘‘expect’’, ‘‘intend’’,
‘‘may’’, ‘‘plan’’, ‘‘objectives’’, ‘‘outlook’’, ‘‘probably’’,
‘‘project’’, ‘‘will’’, ‘‘seek’’, ‘‘target’’, ‘‘risks’’, ‘‘goals’’,
‘‘should’’ and similar terms and phrases.
There are a number of factors that could affect the
future operations of Gazprom Neft and could cause
those results to differ materially from those expressed
in the forward-looking statements included in this
presentation, inclusively (without limitation):
(a) price fluctuations in crude oil and oil products;
(b) changes in demand for the Company’s products;
(c) currency fluctuations;
(d) drilling and production results;
(e) reserve estimates;
(f) loss of market and industry competition;
(g) environmental and physical risks;
(h) risks associated with the identification
of suitable potential acquisition properties
and targets, and successful negotiation
and completion of such transactions;
(i) economic and financial market conditions
in various countries and regions;
(j) political risks, project delay or advancement,
approvals and cost estimates; and
(k) changes in trading conditions.
All forward-looking statements contained in this
presentation are expressly qualified in their entirety by
the cautionary statements contained or referred to in
this section. Readers should not place undue reliance
on these forward-looking statements. Each forward-
looking statement speaks only as of the date of this
presentation. Neither Gazprom Neft nor any of its
subsidiaries undertake any obligation to publicly
update or revise any forward-looking statement as a
result of new information, future events or other
information.
GAZPROM INVESTOR DAY 2017
26; 124;195
150; 150; 150
68; 103; 124
69; 165; 187
245; 190; 50
100; 190; 235
90; 90; 90
140; 200; 40
1; 70; 122
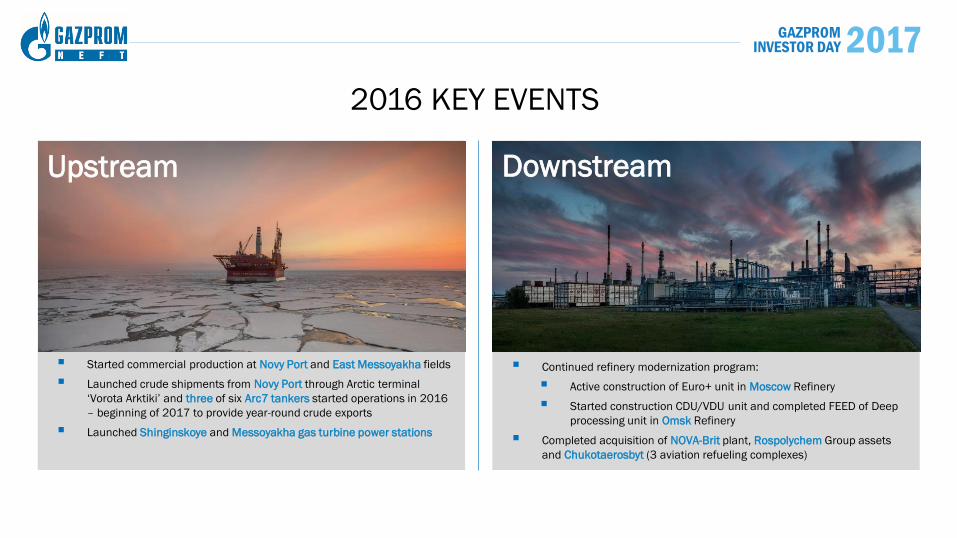
2016 KEY EVENTS
Upstream Downstream
Started commercial production at Novy Port and East Messoyakha fields
Launched crude shipments from Novy Port through Arctic terminal
‘Vorota Arktiki’ and three of six Arc7 tankers started operations in 2016
– beginning of 2017 to provide year-round crude exports
Launched Shinginskoye and Messoyakha gas turbine power stations
Continued refinery modernization program:
Active construction of Euro+ unit in Moscow Refinery
Started construction CDU/VDU unit and completed FEED of Deep
processing unit in Omsk Refinery
Completed acquisition of NOVA-Brit plant, Rospolychem Group assets
and Chukotaerosbyt (3 aviation refueling complexes)
GAZPROM INVESTOR DAY 2017
26; 124;195
150; 150; 150
68; 103; 124
69; 165; 187
245; 190; 50
100; 190; 235
90; 90; 90
140; 200; 40
1; 70; 122
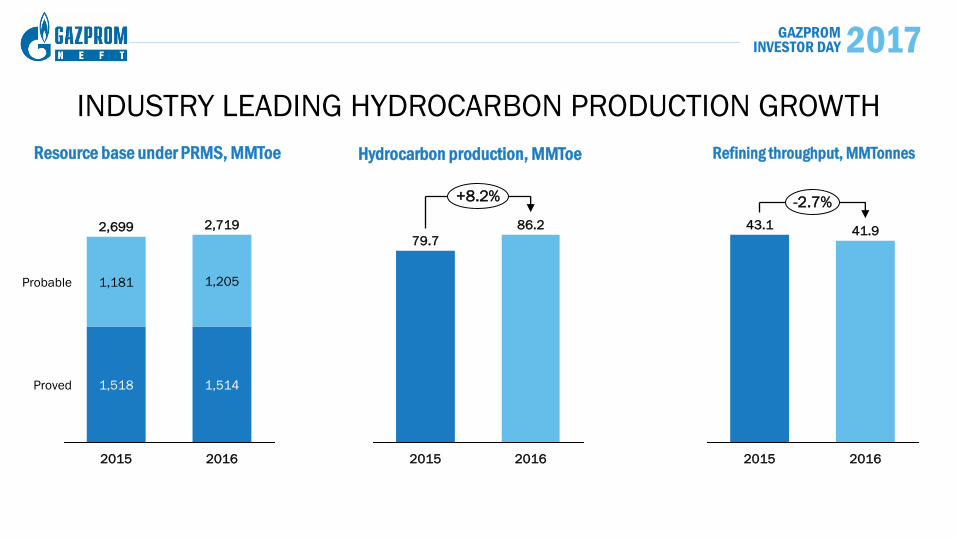
Resource base under PRMS, MMToe Hydrocarbon production, MMToe
INDUSTRY LEADING HYDROCARBON PRODUCTION GROWTH
Proved
Probable
2016
2,719
1,514
1,205
2015
2,699
1,518
1,181
2016
86.2
2015
79.7
+8.2%
2016
41.9
2015
43.1
-2.7%
Refining throughput, MMTonnes
GAZPROM INVESTOR DAY 2017
26; 124;195
150; 150; 150
68; 103; 124
69; 165; 187
245; 190; 50
100; 190; 235
90; 90; 90
140; 200; 40
1; 70; 122
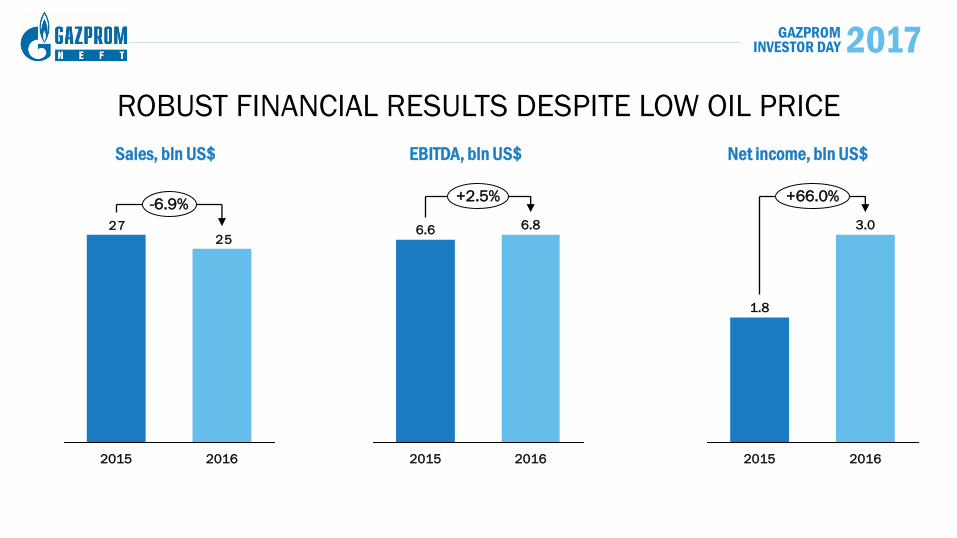
ROBUST FINANCIAL RESULTS DESPITE LOW OIL PRICE
2527
2016 2015
-6.9%
2016
6.8
2015
6.6
+2.5%
2016
3.0
2015
1.8
+66.0%
Net income, bln US$ EBITDA, bln US$ Sales, bln US$
GAZPROM INVESTOR DAY 2017
26; 124;195
150; 150; 150
68; 103; 124
69; 165; 187
245; 190; 50
100; 190; 235
90; 90; 90
140; 200; 40
1; 70; 122
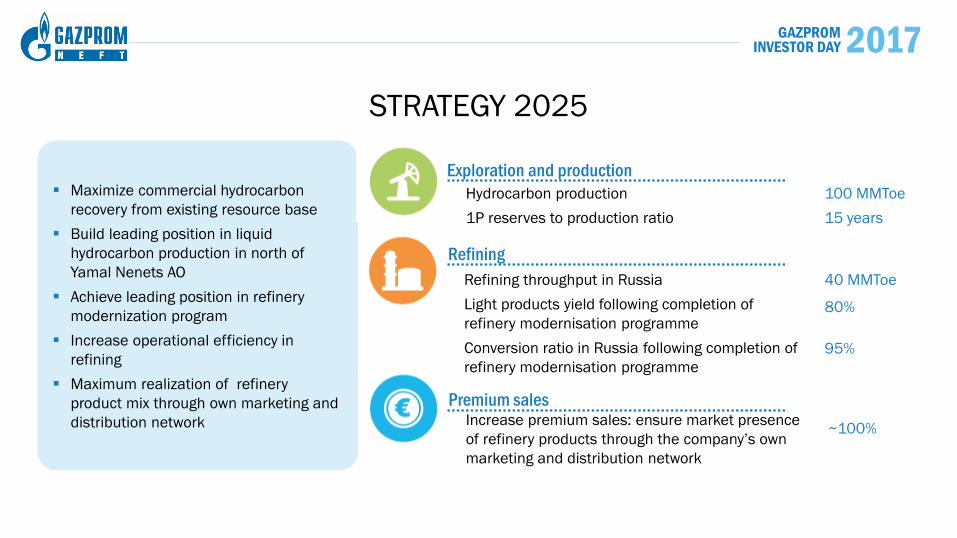
STRATEGY 2025
Maximize commercial hydrocarbon
recovery from existing resource base
Build leading position in liquid
hydrocarbon production in north of
Yamal Nenets AO
Achieve leading position in refinery
modernization program
Increase operational efficiency in
refining
Maximum realization of refinery
product mix through own marketing and
distribution network
Hydrocarbon production
1P reserves to production ratio
100 MMToe
15 years
Refining throughput in Russia
Light products yield following completion of
refinery modernisation programme
Conversion ratio in Russia following completion of
refinery modernisation programme
40 MMToe
80%
95%
Increase premium sales: ensure market presence
of refinery products through the company’s own
marketing and distribution network
~100%
Exploration and production
Refining
Premium sales
GAZPROM INVESTOR DAY 2017
26; 124;195
150; 150; 150
68; 103; 124
69; 165; 187
245; 190; 50
100; 190; 235
90; 90; 90
140; 200; 40
1; 70; 122
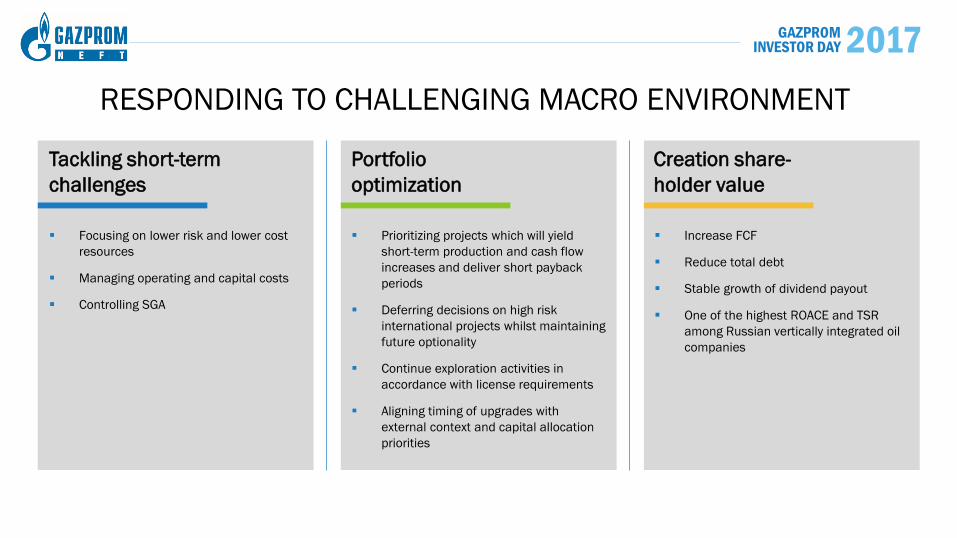
RESPONDING TO CHALLENGING MACRO ENVIRONMENT
Tackling short-term
challenges
Portfolio
optimization
Creation share-
holder value
Focusing on lower risk and lower cost
resources
Managing operating and capital costs
Controlling SGA
Prioritizing projects which will yield
short-term production and cash flow
increases and deliver short payback
periods
Deferring decisions on high risk
international projects whilst maintaining
future optionality
Continue exploration activities in
accordance with license requirements
Aligning timing of upgrades with
external context and capital allocation
priorities
Increase FCF
Reduce total debt
Stable growth of dividend payout
One of the highest ROACE and TSR
among Russian vertically integrated oil
companies
GAZPROM INVESTOR DAY 2017
26; 124;195
150; 150; 150
68; 103; 124
69; 165; 187
245; 190; 50
100; 190; 235
90; 90; 90
140; 200; 40
1; 70; 122
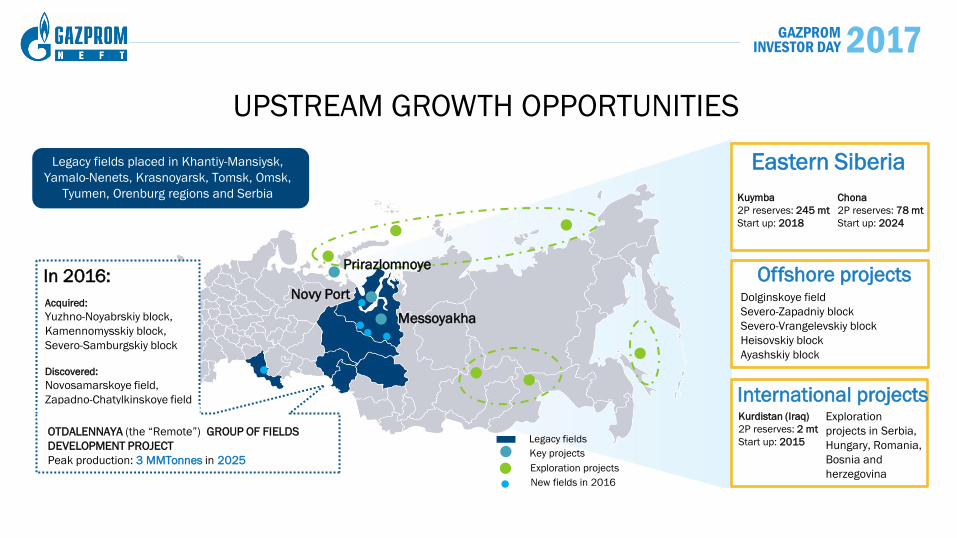
UPSTREAM GROWTH OPPORTUNITIES
Eastern Siberia
Offshore projects
International projects
Legacy fields placed in Khantiy-Mansiysk,
Yamalo-Nenets, Krasnoyarsk, Tomsk, Omsk,
Tyumen, Orenburg regions and Serbia Kuymba
2P reserves: 245 mt
Start up: 2018
Chona
2P reserves: 78 mt
Start up: 2024
Dolginskoye field
Severo-Zapadniy block
Severo-Vrangelevskiy block
Heisovskiy block
Ayashskiy block
Exploration
projects in Serbia,
Hungary, Romania,
Bosnia and
herzegovina
Kurdistan (Iraq)
2P reserves: 2 mt
Start up: 2015
Prirazlomnoye
Messoyakha
Novy Port
Legacy fields
Exploration projects
Key projects
In 2016:
New fields in 2016
OTDALENNAYA (the “Remote”) GROUP OF FIELDS
DEVELOPMENT PROJECT
Peak production: 3 MMTonnes in 2025
Acquired:
Yuzhno-Noyabrskiy block,
Kamennomysskiy block,
Severo-Samburgskiy block
Discovered:
Novosamarskoye field,
Zapadno-Chatylkinskoye field
GAZPROM INVESTOR DAY 2017
26; 124;195
150; 150; 150
68; 103; 124
69; 165; 187
245; 190; 50
100; 190; 235
90; 90; 90
140; 200; 40
1; 70; 122
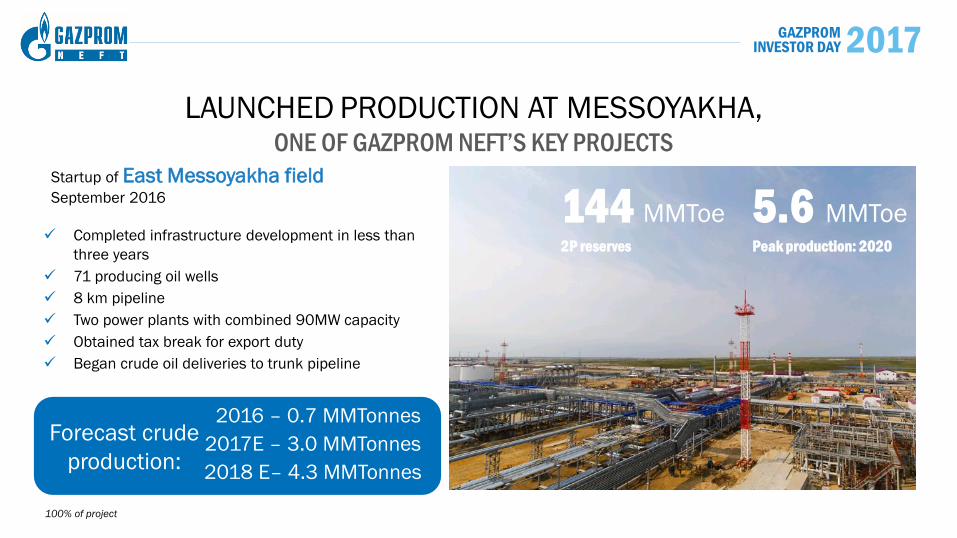
Startup of East Messoyakha field September 2016
Completed infrastructure development in less than
three years
71 producing oil wells
8 km pipeline
Two power plants with combined 90MW capacity
Obtained tax break for export duty
Began crude oil deliveries to trunk pipeline
LAUNCHED PRODUCTION AT MESSOYAKHA, ONE OF GAZPROM NEFT’S KEY PROJECTS
144 MMToe 2P reserves
5.6 MMToe Peak production: 2020
Forecast crude
production:
2016 – 0.7 MMTonnes
2017E – 3.0 MMTonnes
2018 E– 4.3 MMTonnes
100% of project
GAZPROM INVESTOR DAY 2017
26; 124;195
150; 150; 150
68; 103; 124
69; 165; 187
245; 190; 50
100; 190; 235
90; 90; 90
140; 200; 40
1; 70; 122
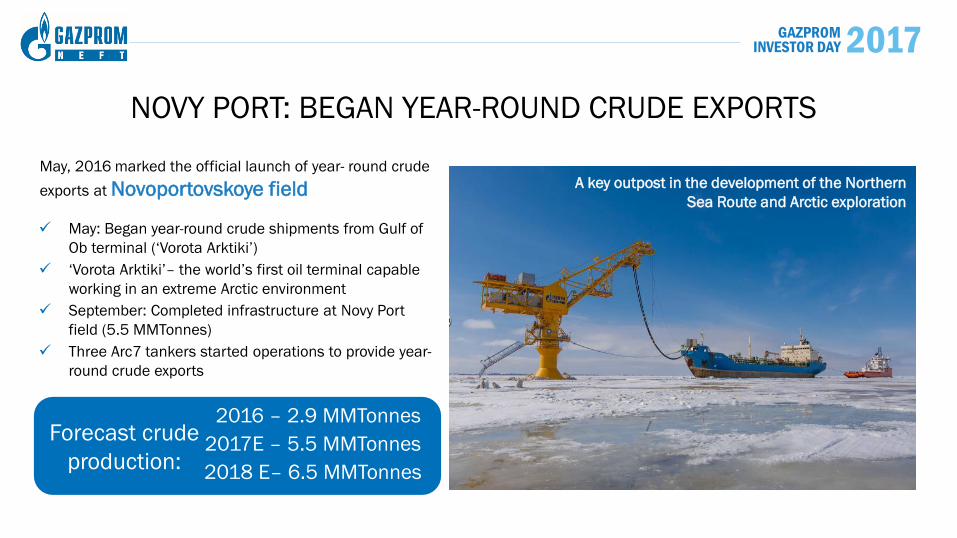
May, 2016 marked the official launch of year- round crude
exports at Novoportovskoye field
NOVY PORT: BEGAN YEAR-ROUND CRUDE EXPORTS
A key outpost in the development of the Northern
Sea Route and Arctic exploration
May: Began year-round crude shipments from Gulf of
Ob terminal (‘Vorota Arktiki’)
‘Vorota Arktiki’– the world’s first oil terminal capable
working in an extreme Arctic environment
September: Completed infrastructure at Novy Port
field (5.5 MMTonnes)
Three Arc7 tankers started operations to provide year-
round crude exports
Forecast crude
production:
2016 – 2.9 MMTonnes
2017E – 5.5 MMTonnes
2018 E– 6.5 MMTonnes
GAZPROM INVESTOR DAY 2017
26; 124;195
150; 150; 150
68; 103; 124
69; 165; 187
245; 190; 50
100; 190; 235
90; 90; 90
140; 200; 40
1; 70; 122
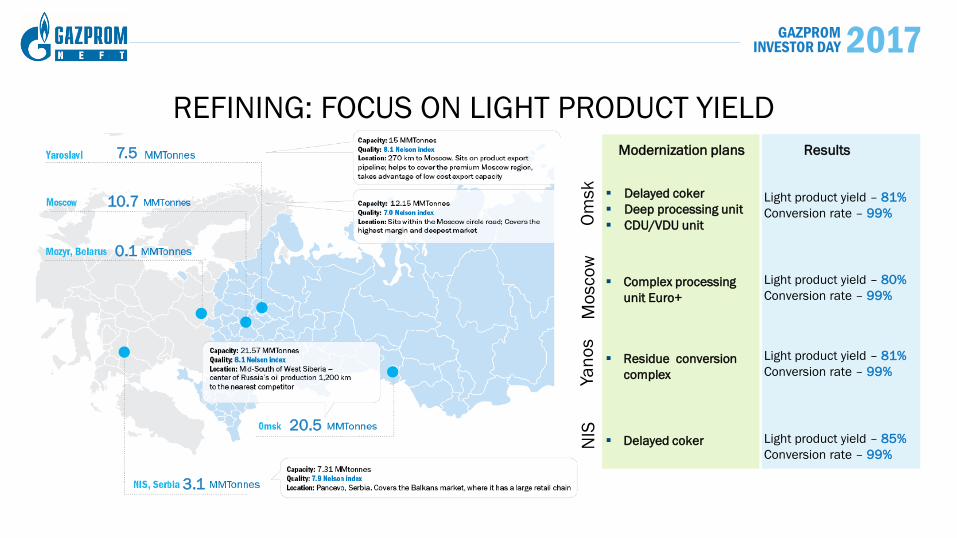
Delayed coker 20.5
3.1
0.1
10.7
7.5
Om
sk
Delayed coker
Deep processing unit
CDU/VDU unit
Mo
sco
w
Complex processing
unit Euro+
Ya
no
s
NIS
Residue conversion
complex
Light product yield – 81%
Conversion rate – 99%
Modernization plans Results
Light product yield – 80%
Conversion rate – 99%
Light product yield – 81%
Conversion rate – 99%
Light product yield – 85%
Conversion rate – 99%
REFINING: FOCUS ON LIGHT PRODUCT YIELD
GAZPROM INVESTOR DAY 2017
26; 124;195
150; 150; 150
68; 103; 124
69; 165; 187
245; 190; 50
100; 190; 235
90; 90; 90
140; 200; 40
1; 70; 122
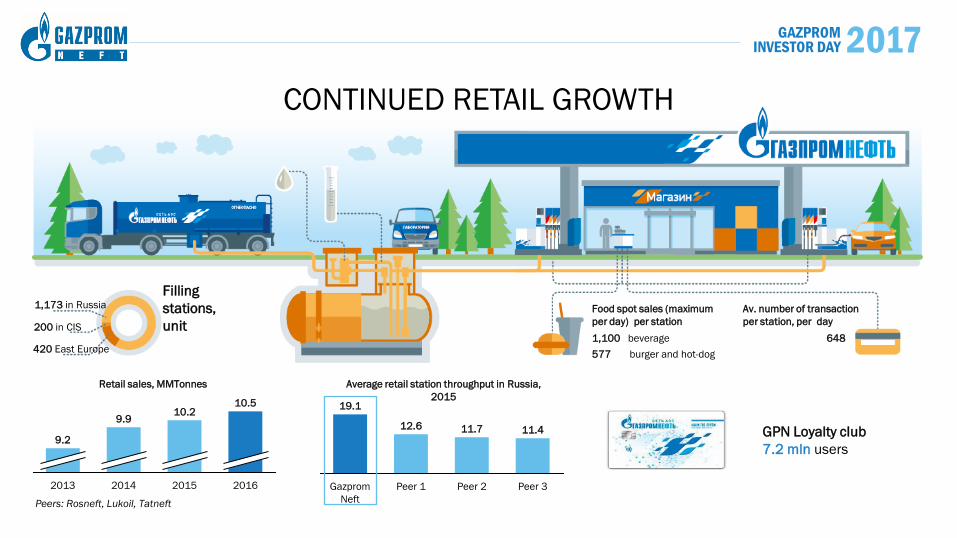
CONTINUED RETAIL GROWTH
1,173 in Russia
200 in CIS
420 East Europe
GPN Loyalty club
7.2 mln users
Food spot sales (maximum
per day) per station
1,100 beverage
577 burger and hot-dog
648
Av. number of transaction
per station, per day
Filling
stations,
unit
2014 2015 2016 2013
9.2
9.9 10.2
10.5 19.1
Gazprom
Neft
12.6
Peer 1 Peer 3
11.4
Peer 2
11.7
Retail sales, MMTonnes Average retail station throughput in Russia,
2015
Peers: Rosneft, Lukoil, Tatneft
GAZPROM INVESTOR DAY 2017
26; 124;195
150; 150; 150
68; 103; 124
69; 165; 187
245; 190; 50
100; 190; 235
90; 90; 90
140; 200; 40
1; 70; 122
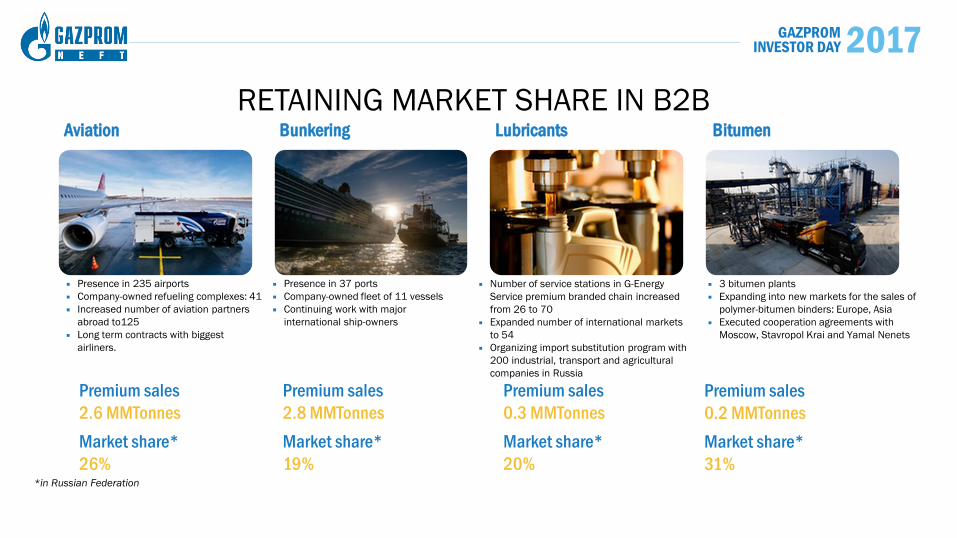
Presence in 235 airports
Company-owned refueling complexes: 41
Increased number of aviation partners
abroad to125
Long term contracts with biggest
airliners.
Aviation Bunkering Lubricants Bitumen
Presence in 37 ports
Company-owned fleet of 11 vessels
Continuing work with major
international ship-owners
Number of service stations in G-Energy
Service premium branded chain increased
from 26 to 70
Expanded number of international markets
to 54
Organizing import substitution program with
200 industrial, transport and agricultural
companies in Russia
3 bitumen plants
Expanding into new markets for the sales of
polymer-bitumen binders: Europe, Asia
Executed сooperation agreements with
Moscow, Stavropol Krai and Yamal Nenets
Premium sales
2.6 MMTonnes
Market share*
26% *in Russian Federation
Premium sales
2.8 MMTonnes
Market share*
19%
Premium sales
0.3 MMTonnes
Market share*
20%
Premium sales
0.2 MMTonnes
Market share*
31%
RETAINING MARKET SHARE IN B2B

GAZPROM INVESTOR DAY 2017
26; 124;195
150; 150; 150
68; 103; 124
69; 165; 187
245; 190; 50
100; 190; 235
90; 90; 90
140; 200; 40
1; 70; 122
CAPITAL DISCIPLINE INVESTING SELECTIVELY FOR FUTURE SUCCESS
Drilling and technological
development at legacy assets
Ongoing investment in major
upstream projects
Start of refinery complexity
modernization
Continued exploration projects
Investments outlook, US$ mln 2017E Investments breakdown, US$ mln Investment peak 2017E
2.1
1.7
1.4
0.3
0.6
Brownfields
Greenfields
Refining
Marketing and
distribution
Other
6.2
2017F* 2016
6.2 6.0
GAZPROM INVESTOR DAY 2017
26; 124;195
150; 150; 150
68; 103; 124
69; 165; 187
245; 190; 50
100; 190; 235
90; 90; 90
140; 200; 40
1; 70; 122
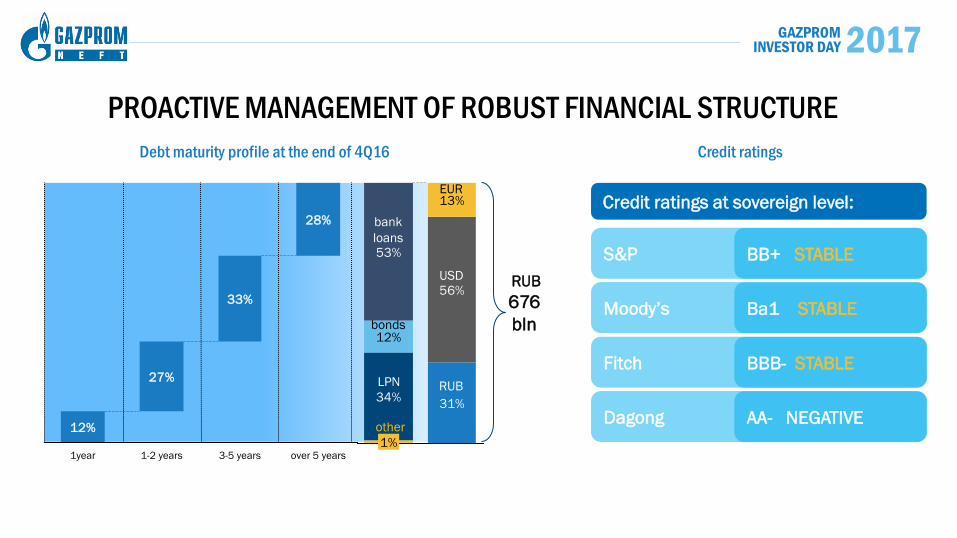
1-2 years
27%
33%
3-5 years 1year
12%
28%
over 5 years
Credit ratings at sovereign level:
S&P
Moody’s
Fitch
Dagong
BB+ STABLE
Ba1 STABLE
BBB- STABLE
AA- NEGATIVE
1%
34%
53%
12%
13%
31%
56% RUB
676
bln
LPN
bonds
bank
loans
other
USD
RUB
EUR
PROACTIVE MANAGEMENT OF ROBUST FINANCIAL STRUCTURE
Debt maturity profile at the end of 4Q16 Credit ratings
GAZPROM INVESTOR DAY 2017
26; 124;195
150; 150; 150
68; 103; 124
69; 165; 187
245; 190; 50
100; 190; 235
90; 90; 90
140; 200; 40
1; 70; 122
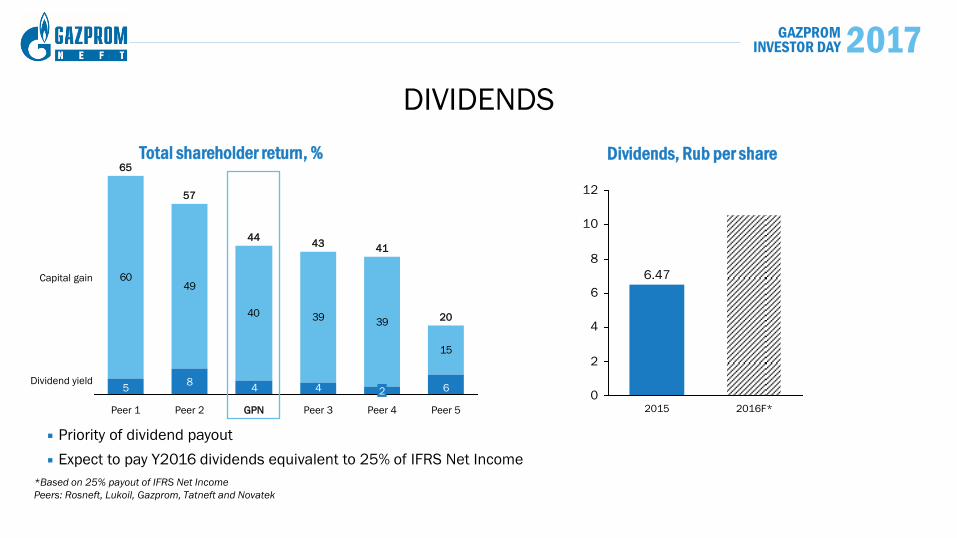
Priority of dividend payout
Expect to pay Y2016 dividends equivalent to 25% of IFRS Net Income
DIVIDENDS
Dividends, Rub per share Total shareholder return, %
*Based on 25% payout of IFRS Net Income
Peers: Rosneft, Lukoil, Gazprom, Tatneft and Novatek
0
2
4
6
8
10
12
2016F* 2015
6.47
84
6049
40 3939
15
645
57
Peer 2 Peer 1
65
41
Peer 4 Peer 5
20
Capital gain
Dividend yield 2
GPN
44 43
Peer 3