Embed Size (px)
Citation preview
GAZPROM NEFT
INVESTOR DAY
December 17, 2012, Moscow
GAZPROM NEFT INVESTOR DAY 2
Disclaimer
This presentation contains forward-looking statements concerning the financial condition, results of operations and businesses of Gazprom Neft and its consolidated subsidiaries. All statements other than statements of historical fact are, or may be deemed to be, forward-looking statements. Forward-looking statements are statements of future expectations that are based on management’s current expectations and assumptions and involve known and unknown risks and uncertainties that could cause actual results, performance or events to differ materially from those expressed or implied in these statements.
Forward-looking statements include, among other things, statements concerning the potential exposure of Gazprom Neft to market risks and statements expressing management’s expectations, beliefs, estimates, forecasts, projections and assumptions. These forward-looking statements are identified by their use of terms and phrases such as ‘‘anticipate’’, ‘‘believe’’, ‘‘could’’, ‘‘estimate’’, ‘‘expect’’, ‘‘intend’’, ‘‘may’’, ‘‘plan’’, ‘‘objectives’’, ‘‘outlook’’, ‘‘probably’’, ‘‘project’’, ‘‘will’’, ‘‘seek’’, ‘‘target’’, ‘‘risks’’, ‘‘goals’’, ‘‘should’’ and similar terms and phrases. There are a number of factors that could affect the future operations of Gazprom Neft and could cause those results to differ materially from those expressed in the forward-looking statements included in this presentation, inclusively (without limitation): (a) price fluctuations in crude oil and oil products; (b) changes in demand for the Company’s products; (c) currency fluctuations; (d) drilling and production results; (e) reserve estimates; (f) loss of market and industry competition; (g) environmental and physical risks; (h) risks associated with the identification of suitable potential acquisition properties and targets, and successful negotiation and completion of such transactions; (i) economic and financial market conditions in various countries and regions; (j) political risks, project delay or advancement, approvals and cost estimates; and (k) changes in trading conditions.
All forward-looking statements contained in this presentation are expressly qualified in their entirety by the cautionary statements contained or referred to in this section. Readers should not place undue reliance on these forward-looking statements. Each forward-looking statement speaks only as of the date of this presentation. Neither Gazprom Neft nor any of its subsidiaries undertake any obligation to publicly update or revise any forward-looking statement as a result of new information, future events or other information.
GAZPROM NEFT INVESTOR DAY 3
INTRODUCTION
1. Operational and financial results
and 2012 outlook
2. Strategy
3. Operations – Upstream
4. Operations – Downstream
5. Financial outlook
Alexey Yankevich Member of the Management
Committee, Deputy General Director
for Economics and Finance
Sergey Vakulenko Head of Strategic Planning
Department
Vadim Yakovlev Deputy Chairman of the Management
Committee, First Deputy General
Director for Exploration, Production,
Strategic Planning and M&A
Anatoly Cherner Deputy Chairman of the Management
Committee, Deputy General Director
for Logistics, Processing and Sales
Table of content Speakers
GAZPROM NEFT INVESTOR DAY 4
Operational and Financial Results and
2012 Outlook
Alexey Yankevich
GAZPROM NEFT INVESTOR DAY 5
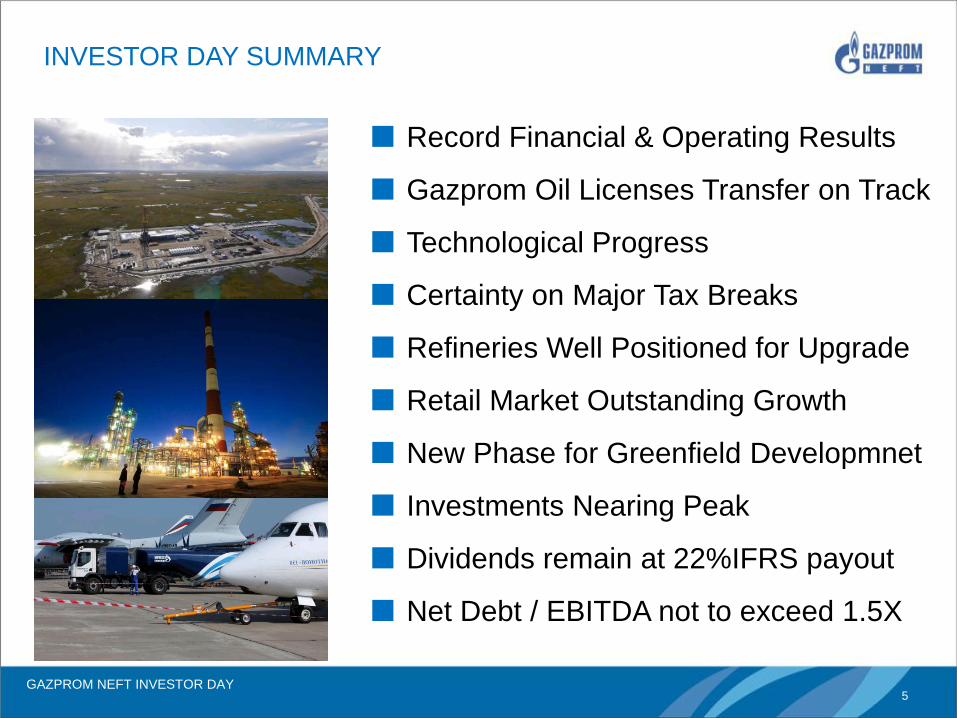
Record Financial & Operating Results
Gazprom Oil Licenses Transfer on Track
Technological Progress
Certainty on Major Tax Breaks
Refineries Well Positioned for Upgrade
Retail Market Outstanding Growth
New Phase for Greenfield Developmnet
Investments Nearing Peak
Dividends remain at 22%IFRS payout
Net Debt / EBITDA not to exceed 1.5X
INVESTOR DAY SUMMARY
GAZPROM NEFT INVESTOR DAY 6
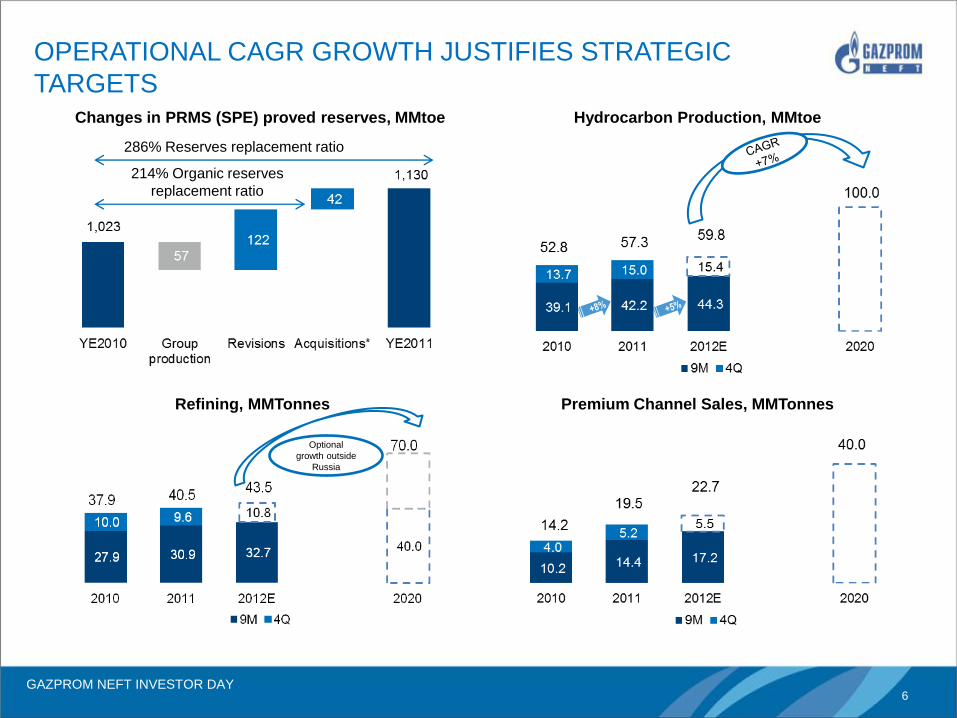
Changes in PRMS (SPE) proved reserves, MMtoe
OPERATIONAL CAGR GROWTH JUSTIFIES STRATEGIC
TARGETS
286% Reserves replacement ratio
214% Organic reserves
replacement ratio
Hydrocarbon Production, MMtoe
Refining, MMTonnes
Optional
growth outside
Russia
Premium Channel Sales, MMTonnes
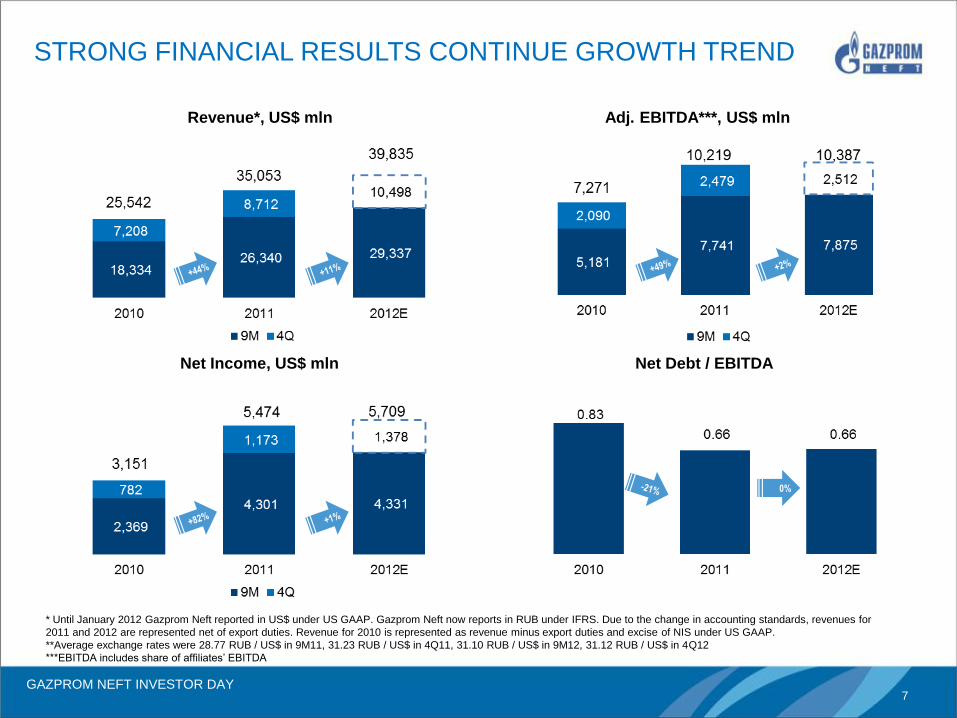
GAZPROM NEFT INVESTOR DAY 7
Revenue*, US$ mln
STRONG FINANCIAL RESULTS CONTINUE GROWTH TREND
Adj. EBITDA***, US$ mln
Net Income, US$ mln Net Debt / EBITDA
* Until January 2012 Gazprom Neft reported in US$ under US GAAP. Gazprom Neft now reports in RUB under IFRS. Due to the change in accounting standards, revenues for
2011 and 2012 are represented net of export duties. Revenue for 2010 is represented as revenue minus export duties and excise of NIS under US GAAP.
**Average exchange rates were 28.77 RUB / US$ in 9M11, 31.23 RUB / US$ in 4Q11, 31.10 RUB / US$ in 9M12, 31.12 RUB / US$ in 4Q12
***EBITDA includes share of affiliates’ EBITDA
0%
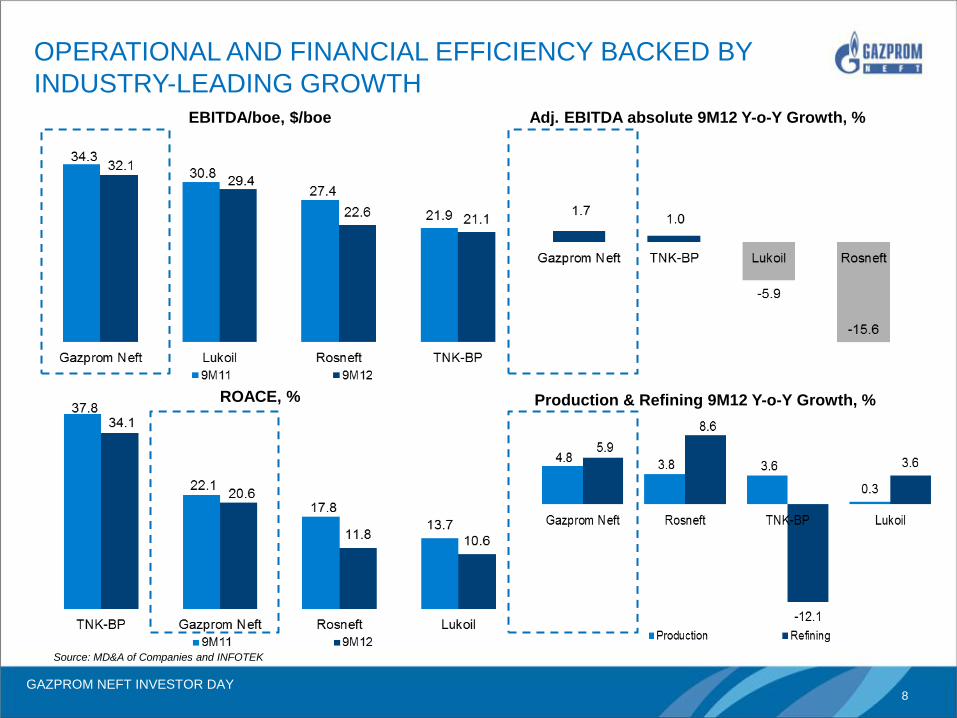
GAZPROM NEFT INVESTOR DAY 8
EBITDA/boe, $/boe
OPERATIONAL AND FINANCIAL EFFICIENCY BACKED BY
INDUSTRY-LEADING GROWTH Adj. EBITDA absolute 9M12 Y-o-Y Growth, %
ROACE, % Production & Refining 9M12 Y-o-Y Growth, %
Source: MD&A of Companies and INFOTEK
GAZPROM NEFT INVESTOR DAY 9
Strategy
Sergey Vakulenko
GAZPROM NEFT INVESTOR DAY 10
2020
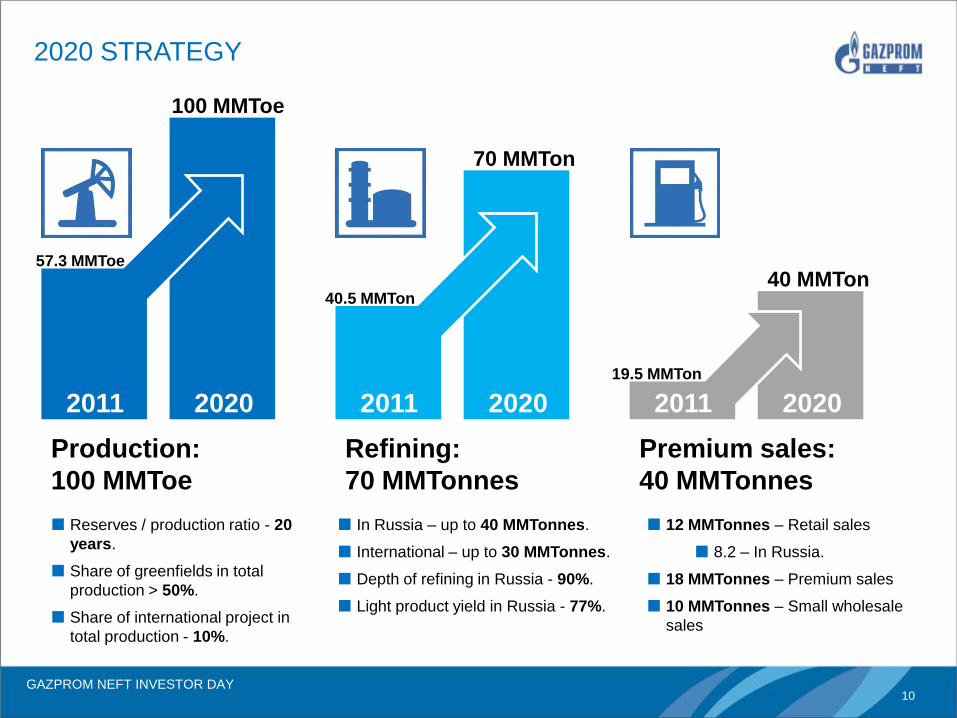
19.5 MMTon
40 MMTon
Premium sales:
40 MMTonnes
2020
40.5 MMTon
70 MMTon
Refining:
70 MMTonnes
57.3 MMToe
100 MMToe
Production:
100 MMToe
Reserves / production ratio - 20
years.
Share of greenfields in total
production > 50%.
Share of international project in
total production - 10%.
2011 2020 2011 2011
In Russia – up to 40 MMTonnes.
International – up to 30 MMTonnes.
Depth of refining in Russia - 90%.
Light product yield in Russia - 77%.
12 MMTonnes – Retail sales
8.2 – In Russia.
18 MMTonnes – Premium sales
10 MMTonnes – Small wholesale
sales
2020 STRATEGY
GAZPROM NEFT INVESTOR DAY 11
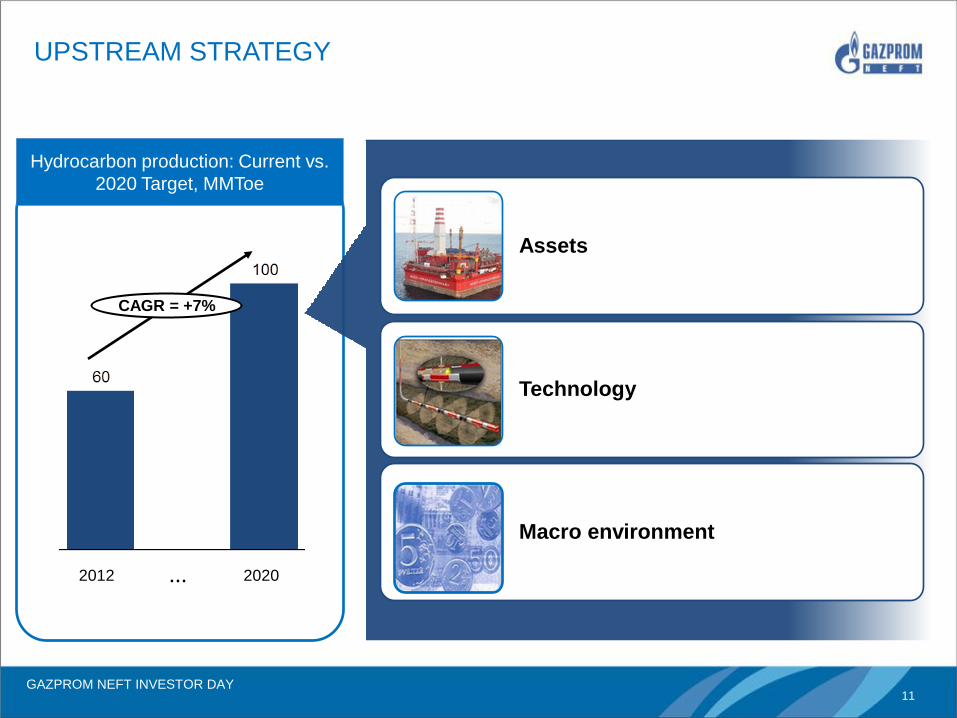
UPSTREAM STRATEGY
Hydrocarbon production: Current vs.
2020 Target, MMToe
Technology
Assets
Macro environment
...
CAGR = +7%
2020 2012
GAZPROM NEFT INVESTOR DAY 12
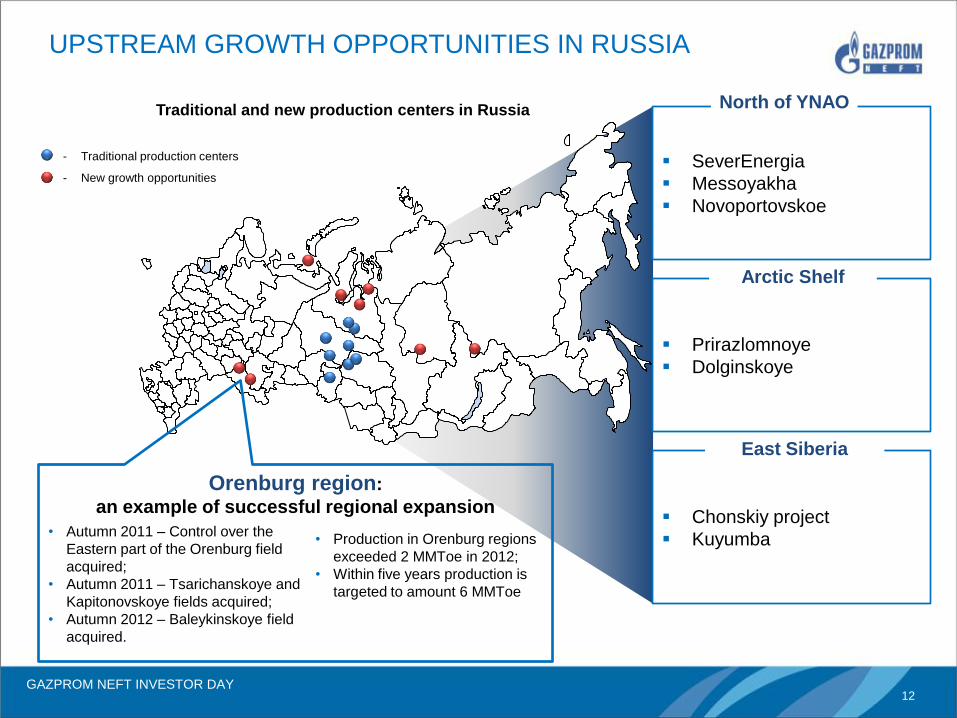
UPSTREAM GROWTH OPPORTUNITIES IN RUSSIA
Traditional and new production centers in Russia
- Traditional production centers
- New growth opportunities
Orenburg region:
an example of successful regional expansion
SeverEnergia
Messoyakha
Novoportovskoe
Prirazlomnoye
Dolginskoye
Chonskiy project
Kuyumba
North of YNAO
Arctic Shelf
East Siberia
• Autumn 2011 – Control over the
Eastern part of the Orenburg field
acquired;
• Autumn 2011 – Tsarichanskoye and
Kapitonovskoye fields acquired;
• Autumn 2012 – Baleykinskoye field
acquired.
• Production in Orenburg regions
exceeded 2 MMToe in 2012;
• Within five years production is
targeted to amount 6 MMToe
GAZPROM NEFT INVESTOR DAY 13
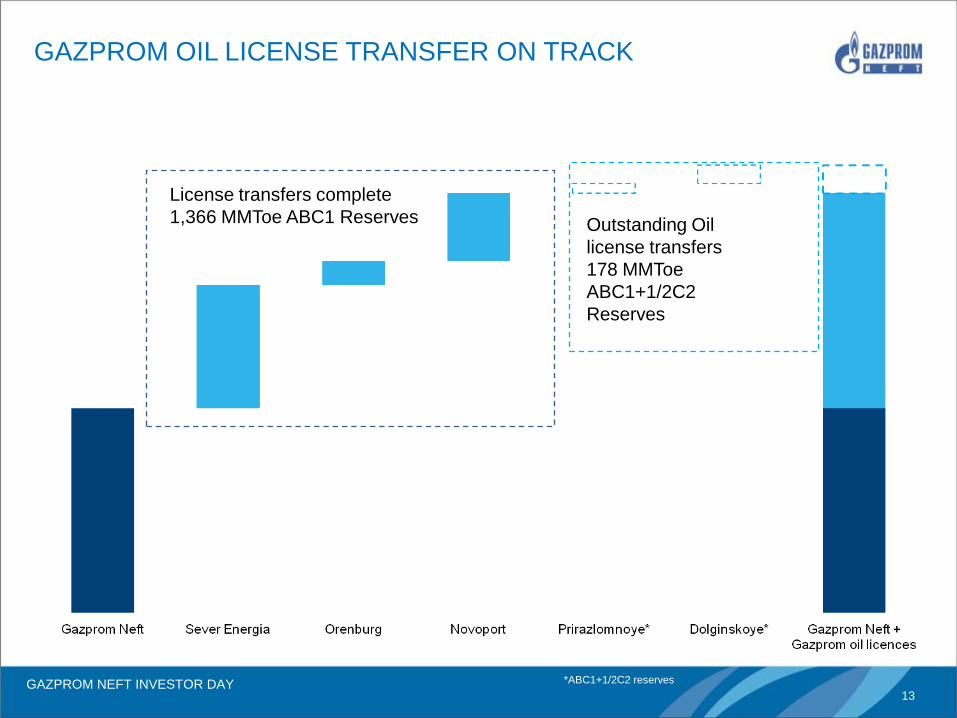
GAZPROM OIL LICENSE TRANSFER ON TRACK
Outstanding Oil
license transfers
178 MMToe
ABC1+1/2C2
Reserves
License transfers complete
1,366 MMToe ABC1 Reserves
*ABC1+1/2C2 reserves
GAZPROM NEFT INVESTOR DAY 14
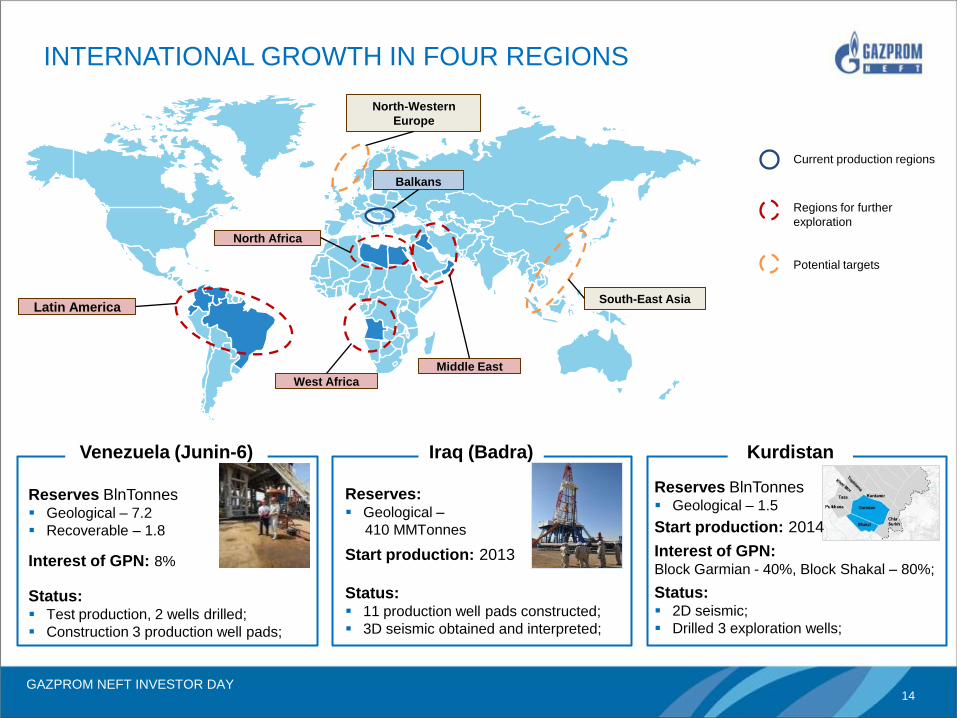
Balkans
Latin America
West Africa
North Africa
Middle East
South-East Asia
North-Western
Europe
Current production regions
Regions for further
exploration
Potential targets
Venezuela (Junin-6) Iraq (Badra) Kurdistan
Reserves: Geological –
410 MMTonnes
Start production: 2013
Status: 11 production well pads constructed;
3D seismic obtained and interpreted;
Reserves BlnTonnes Geological – 7.2
Recoverable – 1.8
Interest of GPN: 8%
Status: Test production, 2 wells drilled;
Construction 3 production well pads;
Reserves BlnTonnes Geological – 1.5
Start production: 2014
Interest of GPN: Block Garmian - 40%, Block Shakal – 80%;
Status: 2D seismic;
Drilled 3 exploration wells;
INTERNATIONAL GROWTH IN FOUR REGIONS
GAZPROM NEFT INVESTOR DAY 15
СОДЕРЖАНИЕ
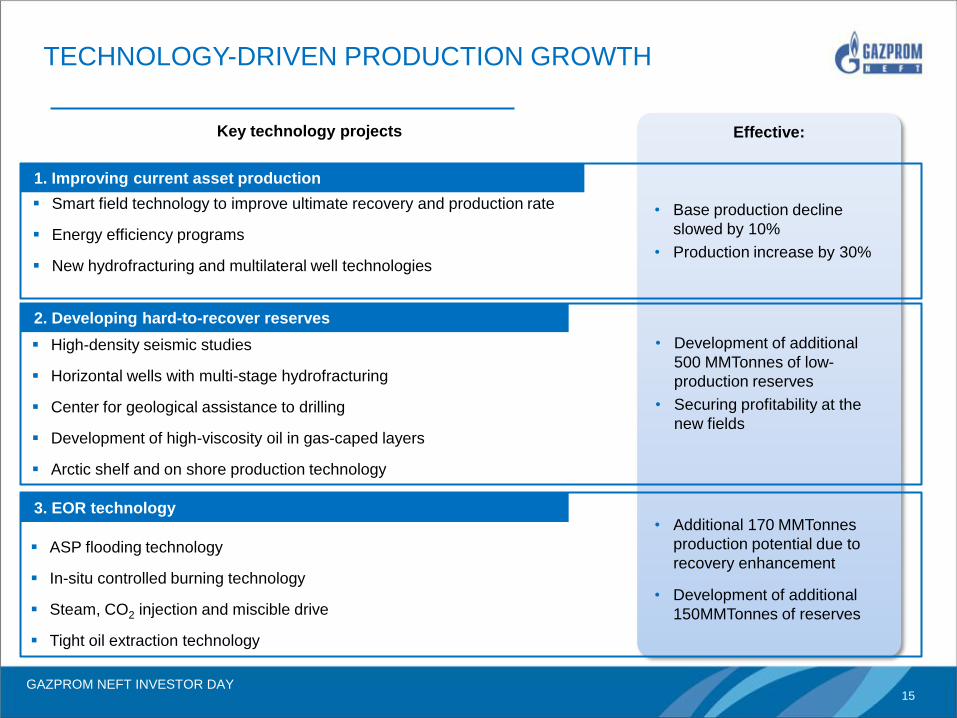
Effective:
1. Improving current asset production
2. Developing hard-to-recover reserves
3. EOR technology
Smart field technology to improve ultimate recovery and production rate
Energy efficiency programs
New hydrofracturing and multilateral well technologies
High-density seismic studies
Horizontal wells with multi-stage hydrofracturing
Center for geological assistance to drilling
Development of high-viscosity oil in gas-caped layers
Arctic shelf and on shore production technology
ASP flooding technology
In-situ controlled burning technology
Steam, CO2 injection and miscible drive
Tight oil extraction technology
• Base production decline
slowed by 10%
• Production increase by 30%
• Development of additional
500 MMTonnes of low-
production reserves
• Securing profitability at the
new fields
• Development of additional
150MMTonnes of reserves
• Additional 170 MMTonnes
production potential due to
recovery enhancement
Key technology projects
TECHNOLOGY-DRIVEN PRODUCTION GROWTH
GAZPROM NEFT INVESTOR DAY 16
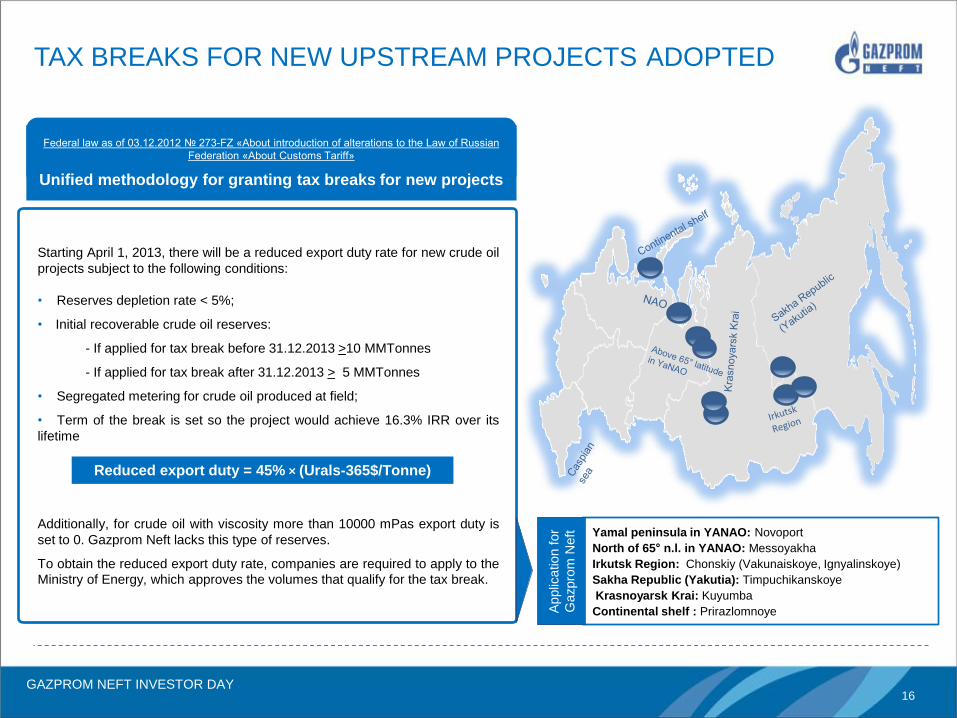
TAX BREAKS FOR NEW UPSTREAM PROJECTS ADOPTED
Формула пониженной ЭП: 45% × (Ц-365$/т), где
Starting April 1, 2013, there will be a reduced export duty rate for new crude oil
projects subject to the following conditions:
• Reserves depletion rate < 5%;
• Initial recoverable crude oil reserves:
- If applied for tax break before 31.12.2013 >10 MMTonnes
- If applied for tax break after 31.12.2013 > 5 MMTonnes
• Segregated metering for crude oil produced at field;
• Term of the break is set so the project would achieve 16.3% IRR over its
lifetime
Additionally, for crude oil with viscosity more than 10000 mPas export duty is
set to 0. Gazprom Neft lacks this type of reserves.
To obtain the reduced export duty rate, companies are required to apply to the
Ministry of Energy, which approves the volumes that qualify for the tax break.
Reduced export duty = 45% × (Urals-365$/Tonne)
Yamal peninsula in YANAO: Novoport
North of 65° n.l. in YANAO: Messoyakha
Irkutsk Region: Chonskiy (Vakunaiskoye, Ignyalinskoye)
Sakha Republic (Yakutia): Timpuchikanskoye
Krasnoyarsk Krai: Kuyumba
Continental shelf : Prirazlomnoye
Applic
ation f
or
Gazpro
m N
eft
Federal law as of 03.12.2012 № 273-FZ «About introduction of alterations to the Law of Russian
Federation «About Customs Tariff»
Unified methodology for granting tax breaks for new projects
GAZPROM NEFT INVESTOR DAY 17
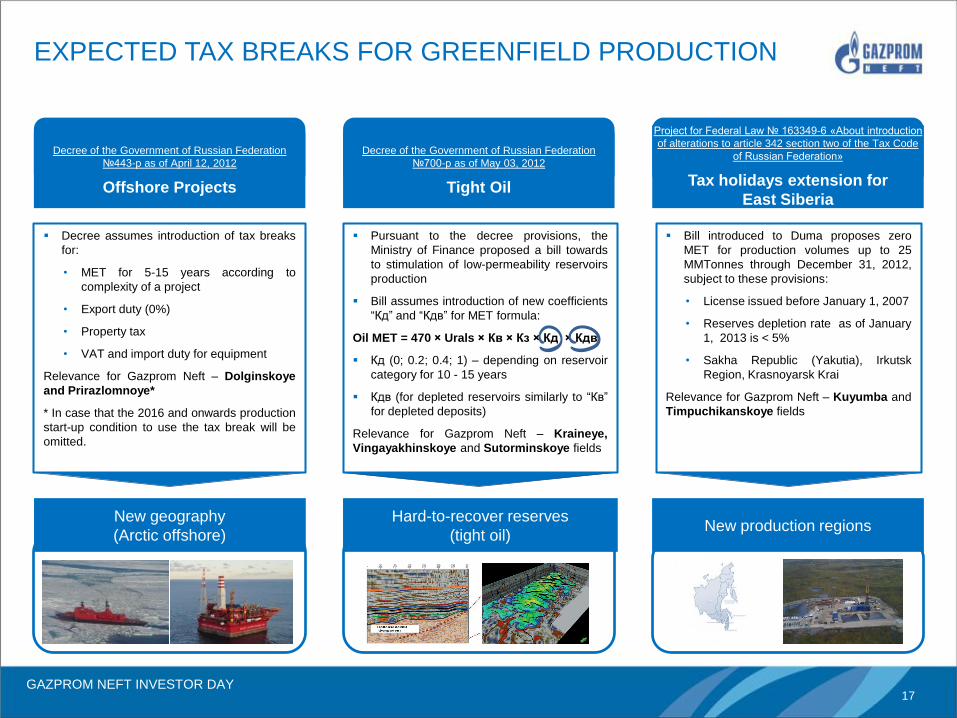
New production regions
EXPECTED TAX BREAKS FOR GREENFIELD PRODUCTION
Decree of the Government of Russian Federation
№443-р as of April 12, 2012
Offshore Projects
Decree assumes introduction of tax breaks
for:
• MET for 5-15 years according to
complexity of a project
• Export duty (0%)
• Property tax
• VAT and import duty for equipment
Relevance for Gazprom Neft – Dolginskoye
and Prirazlomnoye*
* In case that the 2016 and onwards production
start-up condition to use the tax break will be
omitted.
Pursuant to the decree provisions, the
Ministry of Finance proposed a bill towards
to stimulation of low-permeability reservoirs
production
Bill assumes introduction of new coefficients
―Кд‖ and ―Кдв‖ for MET formula:
Oil MET = 470 × Urals × Кв × Кз × Кд × Кдв
Кд (0; 0.2; 0.4; 1) – depending on reservoir
category for 10 - 15 years
Кдв (for depleted reservoirs similarly to ―Кв‖
for depleted deposits)
Relevance for Gazprom Neft – Kraineye,
Vingayakhinskoye and Sutorminskoye fields
Bill introduced to Duma proposes zero
MET for production volumes up to 25
MMTonnes through December 31, 2012,
subject to these provisions:
• License issued before January 1, 2007
• Reserves depletion rate as of January
1, 2013 is < 5%
• Sakha Republic (Yakutia), Irkutsk
Region, Krasnoyarsk Krai
Relevance for Gazprom Neft – Kuyumba and
Timpuchikanskoye fields
Hard-to-recover reserves
(tight oil)
New geography
(Arctic offshore)
Decree of the Government of Russian Federation
№700-р as of May 03, 2012
Tight Oil
Project for Federal Law № 163349-6 «About introduction
of alterations to article 342 section two of the Tax Code
of Russian Federation»
Tax holidays extension for
East Siberia
GAZPROM NEFT INVESTOR DAY 18
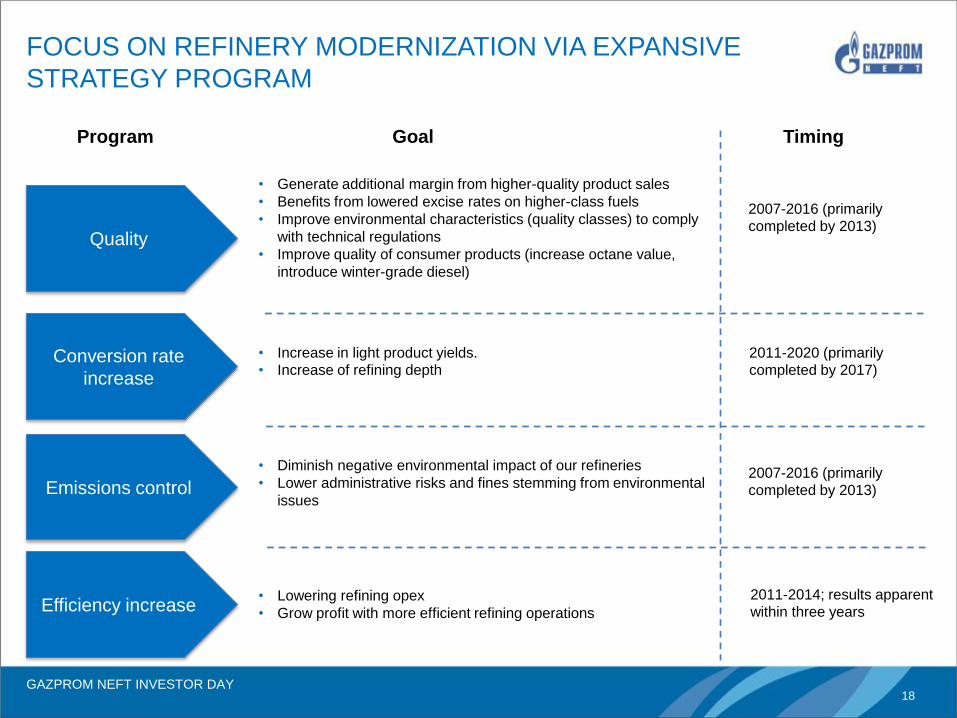
FOCUS ON REFINERY MODERNIZATION VIA EXPANSIVE
STRATEGY PROGRAM
Quality
Conversion rate
increase
Emissions control
Program Goal Timing
• Generate additional margin from higher-quality product sales
• Benefits from lowered excise rates on higher-class fuels
• Improve environmental characteristics (quality classes) to comply
with technical regulations
• Improve quality of consumer products (increase octane value,
introduce winter-grade diesel)
• Increase in light product yields.
• Increase of refining depth
• Diminish negative environmental impact of our refineries
• Lower administrative risks and fines stemming from environmental
issues
2007-2016 (primarily
completed by 2013)
2011-2020 (primarily
completed by 2017)
2007-2016 (primarily
completed by 2013)
Efficiency increase • Lowering refining opex
• Grow profit with more efficient refining operations
2011-2014; results apparent
within three years
GAZPROM NEFT INVESTOR DAY 19
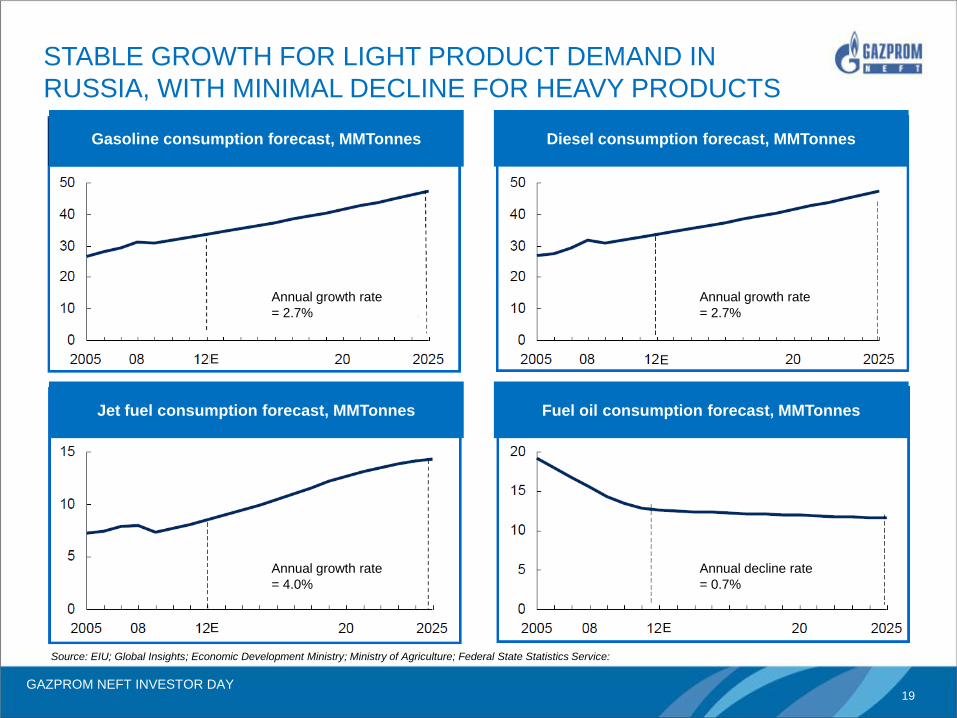
STABLE GROWTH FOR LIGHT PRODUCT DEMAND IN
RUSSIA, WITH MINIMAL DECLINE FOR HEAVY PRODUCTS
Gasoline consumption forecast, MMTonnes Diesel consumption forecast, MMTonnes
Jet fuel consumption forecast, MMTonnes Fuel oil consumption forecast, MMTonnes
Annual growth rate
= 2.7%
Annual growth rate
= 2.7%
Annual growth rate
= 4.0%
Annual decline rate
= 0.7%
E E
E E
Source: EIU; Global Insights; Economic Development Ministry; Ministry of Agriculture; Federal State Statistics Service:
GAZPROM NEFT INVESTOR DAY 20
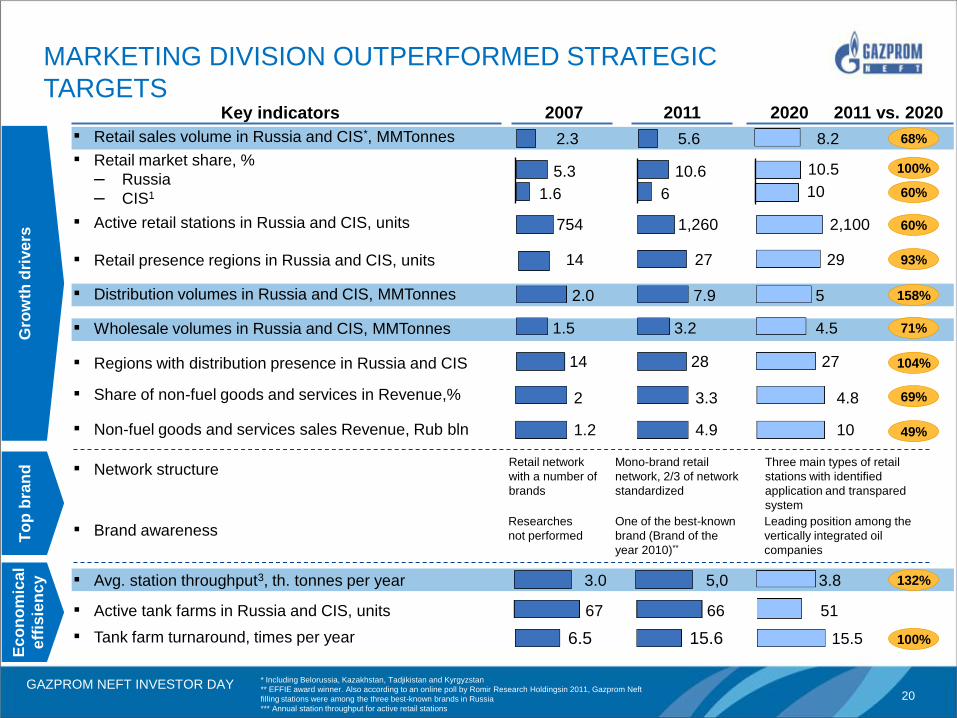
3.0
Key indicators
▪ Retail sales volume in Russia and CIS*, MMTonnes
▪ Retail market share, %
– Russia
– CIS1
▪ Active retail stations in Russia and CIS, units
▪ Distribution volumes in Russia and CIS, MMTonnes
2011
▪ Regions with distribution presence in Russia and CIS
▪ Tank farm turnaround, times per year
2.3
5.3
14
▪ Wholesale volumes in Russia and CIS, MMTonnes
▪ Active tank farms in Russia and CIS, units
▪ Avg. station throughput3, th. tonnes per year
▪ Share of non-fuel goods and services in Revenue,%
▪ Retail presence regions in Russia and CIS, units
Gro
wth
dri
ve
rs
To
p b
ran
d
Ec
on
om
ica
l
eff
isie
ncy
1.6
2.0
1.5
67
2
6.5
14
754
* Including Belorussia, Kazakhstan, Tadjikistan and Kyrgyzstan
** EFFIE award winner. Also according to an online poll by Romir Research Holdingsin 2011, Gazprom Neft
filling stations were among the three best-known brands in Russia
*** Annual station throughput for active retail stations
2020
68%
60%
93%
158%
71%
104%
132%
69%
100%
2007
51
8.2
10.5
2,100
29
10
5
4.5
3.8
15.5
4.8
27
5,0
5.6
10.6
27
6
7.9
3.2
66
3.3
15.6
28
1,260
2011 vs. 2020
▪ Brand awareness Researches
not performed
Leading position among the
vertically integrated oil
companies
One of the best-known
brand (Brand of the
year 2010)**
▪ Non-fuel goods and services sales Revenue, Rub bln 1.2 49% 10 4.9
▪ Network structure Retail network
with a number of
brands
Mono-brand retail
network, 2/3 of network
standardized
100%
60%
Three main types of retail
stations with identified
application and transpared
system
MARKETING DIVISION OUTPERFORMED STRATEGIC
TARGETS
GAZPROM NEFT INVESTOR DAY 21
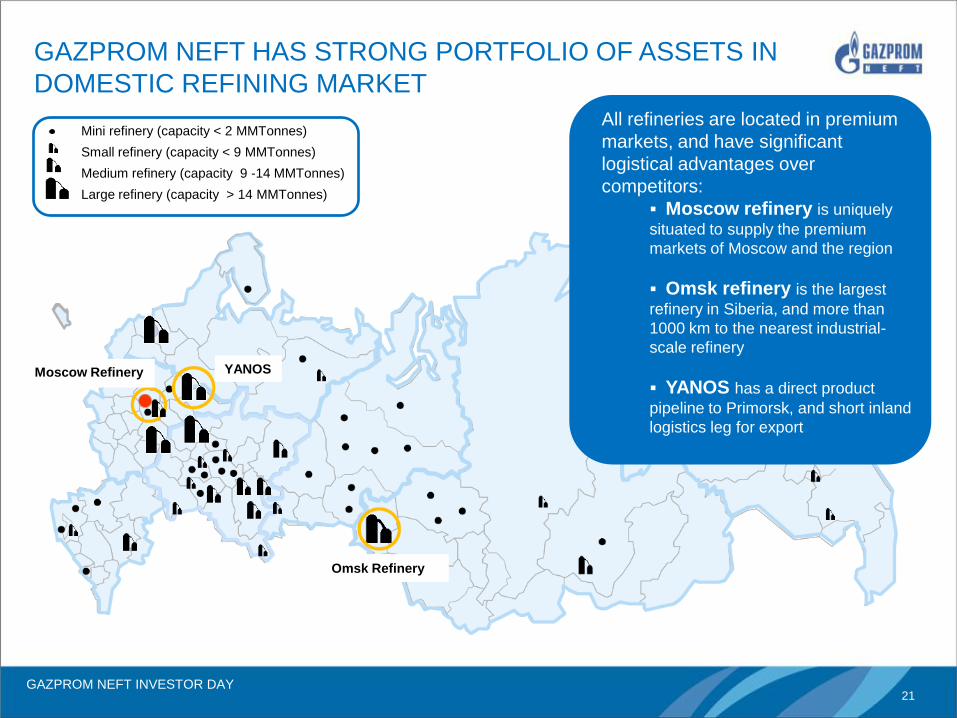
GAZPROM NEFT HAS STRONG PORTFOLIO OF ASSETS IN
DOMESTIC REFINING MARKET
Mini refinery (capacity < 2 MMTonnes)
Small refinery (capacity < 9 MMTonnes)
Medium refinery (capacity 9 -14 MMTonnes)
Large refinery (capacity > 14 MMTonnes)
Moscow Refinery YANOS
Omsk Refinery
All refineries are located in premium
markets, and have significant
logistical advantages over
competitors:
Moscow refinery is uniquely
situated to supply the premium
markets of Moscow and the region
Omsk refinery is the largest
refinery in Siberia, and more than
1000 km to the nearest industrial-
scale refinery
YANOS has a direct product
pipeline to Primorsk, and short inland
logistics leg for export
GAZPROM NEFT INVESTOR DAY 22
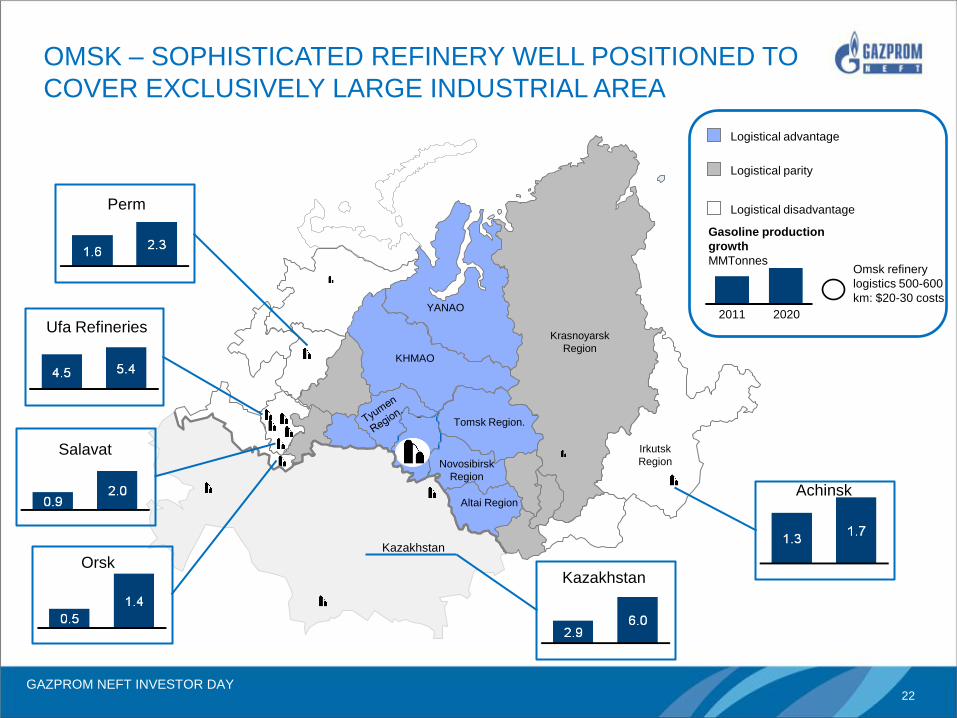
5,7 4,7
Krasnoyarsk
Region
Irkutsk
Region
YANAO
KHMAO
Tomsk Region.
Altai Region
Novosibirsk
Region
Kazakhstan
2020 2011
Gasoline production
growth
MMTonnes
Logistical advantage
Logistical parity
Logistical disadvantage
Omsk refinery
logistics 500-600
km: $20-30 costs
Perm
Ufa Refineries
Salavat
Orsk Kazakhstan
Achinsk
OMSK – SOPHISTICATED REFINERY WELL POSITIONED TO
COVER EXCLUSIVELY LARGE INDUSTRIAL AREA
GAZPROM NEFT INVESTOR DAY 23
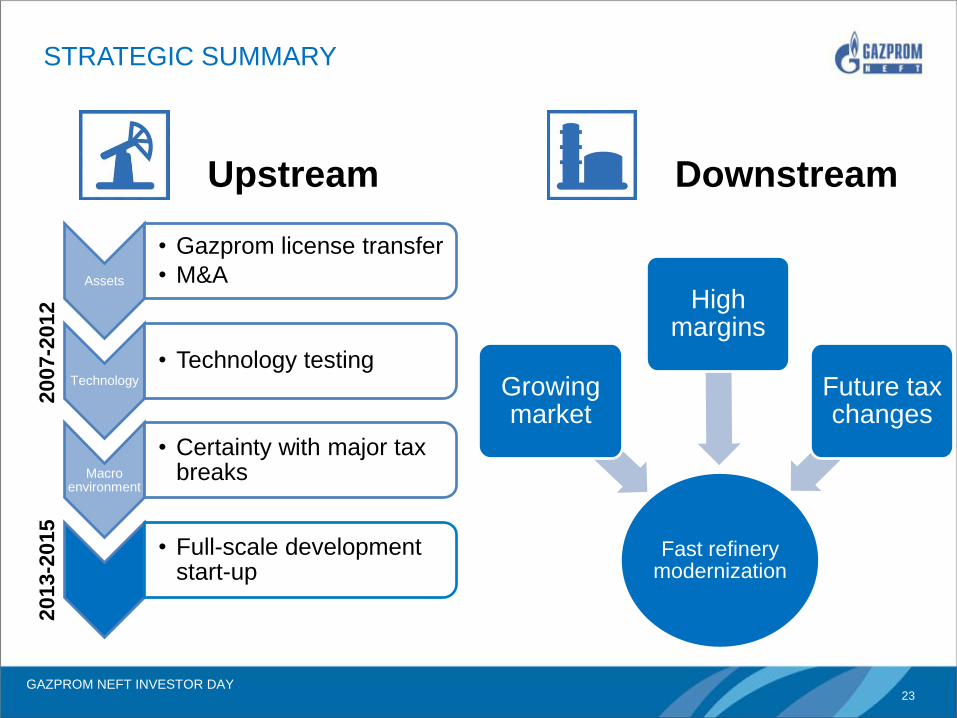
Upstream Downstream
Assets
• Gazprom license transfer
• M&A
Technology
• Technology testing
Macro environment
• Certainty with major tax breaks
• Full-scale development start-up
20
07-2
01
2
20
13
-20
15
Fast refinery modernization
Growing market
High margins
Future tax changes
STRATEGIC SUMMARY
GAZPROM NEFT INVESTOR DAY 24
Upstream
Vadim Yakovlev
GAZPROM NEFT INVESTOR DAY 25
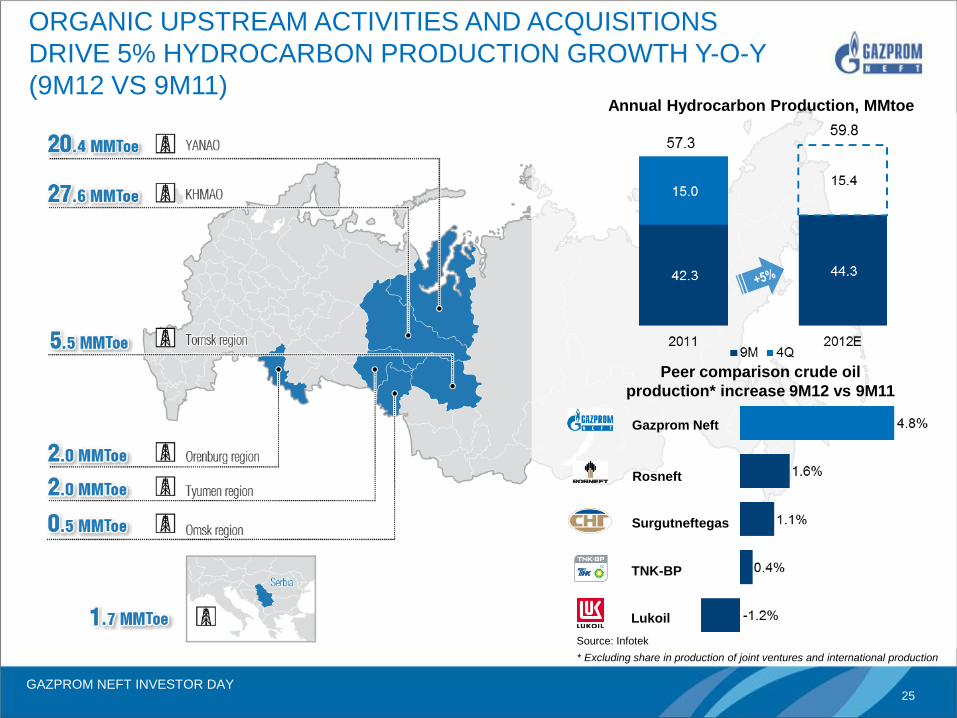
Annual Hydrocarbon Production, MMtoe
Peer comparison crude oil
production* increase 9M12 vs 9M11
Lukoil
ORGANIC UPSTREAM ACTIVITIES AND ACQUISITIONS
DRIVE 5% HYDROCARBON PRODUCTION GROWTH Y-O-Y
(9M12 VS 9M11)
* Excluding share in production of joint ventures and international production
Gazprom Neft
Lukoil
Rosneft
Surgutneftegas
TNK-BP
Source: Infotek
GAZPROM NEFT INVESTOR DAY 26
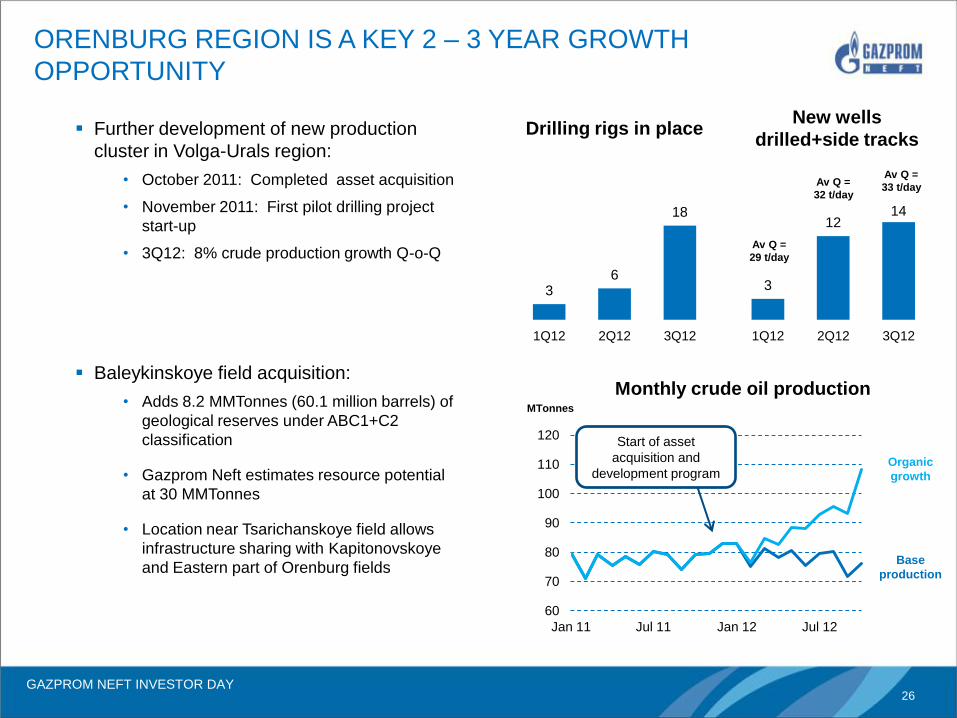
Further development of new production
cluster in Volga-Urals region:
• October 2011: Completed asset acquisition
• November 2011: First pilot drilling project
start-up
• 3Q12: 8% crude production growth Q-o-Q
Baleykinskoye field acquisition:
• Adds 8.2 MMTonnes (60.1 million barrels) of
geological reserves under ABC1+C2
classification
• Gazprom Neft estimates resource potential
at 30 MMTonnes
• Location near Tsarichanskoye field allows
infrastructure sharing with Kapitonovskoye
and Eastern part of Orenburg fields
ORENBURG REGION IS A KEY 2 – 3 YEAR GROWTH
OPPORTUNITY
60
70
80
90
100
110
120
Jan 11 Jul 11 Jan 12 Jul 12
3 6
18
1Q12 2Q12 3Q12
3
12 14
1Q12 2Q12 3Q12
Drilling rigs in place New wells
drilled+side tracks
Start of asset
acquisition and
development program
Monthly crude oil production MTonnes
Av Q =
29 t/day
Av Q =
32 t/day
Av Q =
33 t/day
Organic
growth
Base
production
GAZPROM NEFT INVESTOR DAY 27
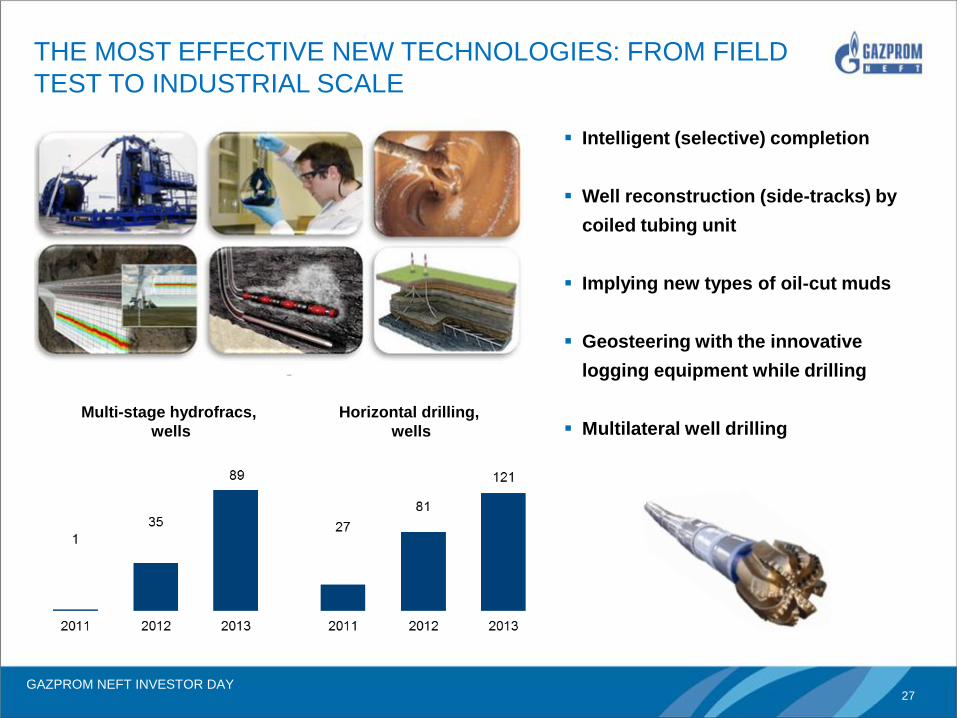
THE MOST EFFECTIVE NEW TECHNOLOGIES: FROM FIELD
TEST TO INDUSTRIAL SCALE
Intelligent (selective) completion
Well reconstruction (side-tracks) by
coiled tubing unit
Implying new types of oil-cut muds
Geosteering with the innovative
logging equipment while drilling
Multilateral well drilling
Multi-stage hydrofracs,
wells
Horizontal drilling,
wells
GAZPROM NEFT INVESTOR DAY 28
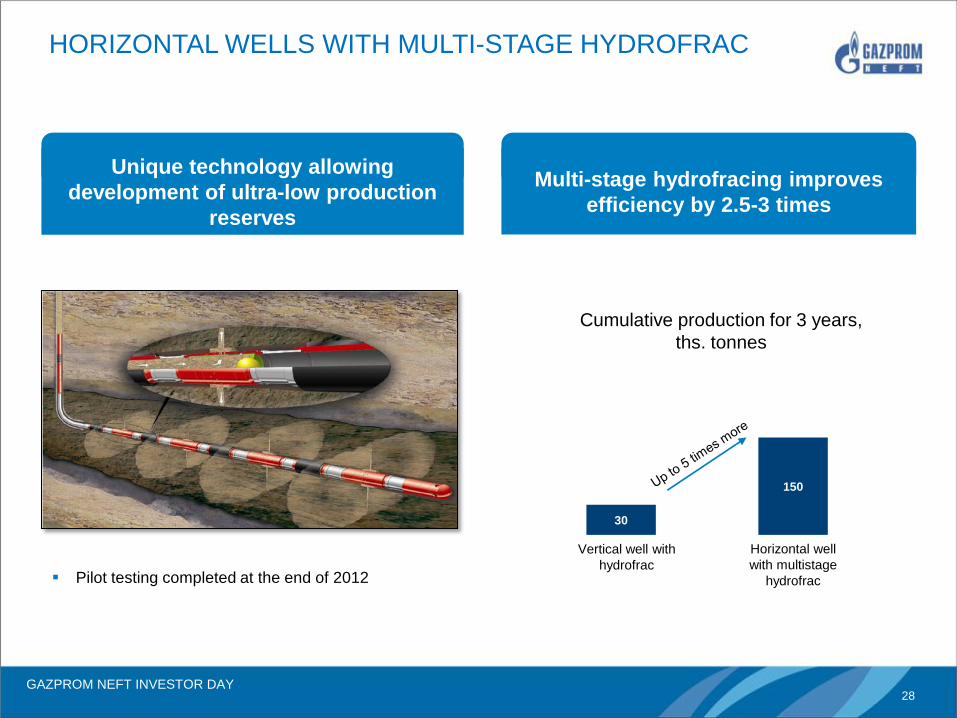
Pilot testing completed at the end of 2012
HORIZONTAL WELLS WITH MULTI-STAGE HYDROFRAC
30
150
Vertical well with
hydrofrac
Horizontal well
with multistage
hydrofrac
Unique technology allowing
development of ultra-low production
reserves
Multi-stage hydrofracing improves
efficiency by 2.5-3 times
Cumulative production for 3 years,
ths. tonnes
GAZPROM NEFT INVESTOR DAY 29
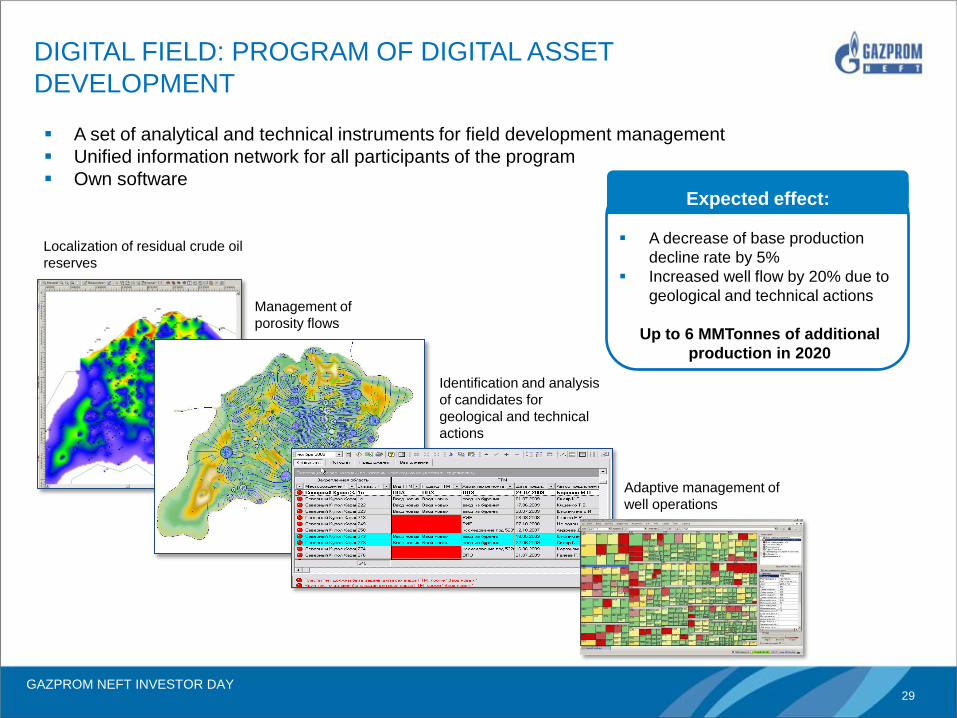
DIGITAL FIELD: PROGRAM OF DIGITAL ASSET
DEVELOPMENT
Localization of residual crude oil
reserves
Management of
porosity flows
Identification and analysis
of candidates for
geological and technical
actions
Adaptive management of
well operations
A set of analytical and technical instruments for field development management
Unified information network for all participants of the program
Own software
Expected effect:
A decrease of base production
decline rate by 5%
Increased well flow by 20% due to
geological and technical actions
Up to 6 MMTonnes of additional
production in 2020
GAZPROM NEFT INVESTOR DAY 30
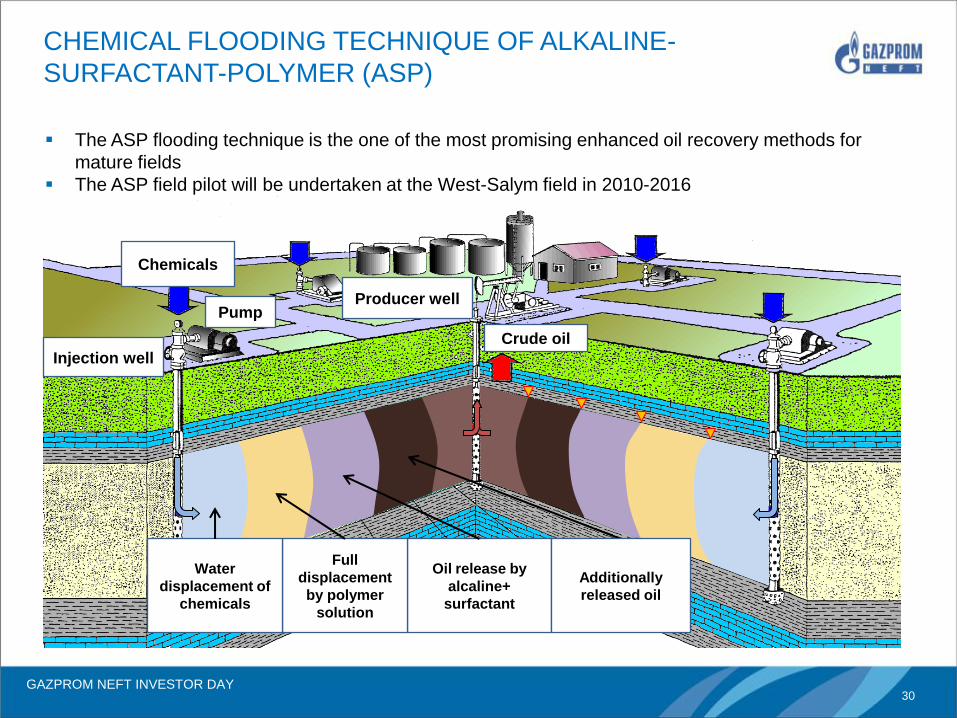
CHEMICAL FLOODING TECHNIQUE OF ALKALINE-
SURFACTANT-POLYMER (ASP)
Producer well
Crude oil
Chemicals
Injection well
Pump
Oil release by
alcaline+
surfactant
Full
displacement
by polymer
solution
Water
displacement of
chemicals
Additionally
released oil
The ASP flooding technique is the one of the most promising enhanced oil recovery methods for
mature fields
The ASP field pilot will be undertaken at the West-Salym field in 2010-2016
GAZPROM NEFT INVESTOR DAY 31
Resource potential, production profile (Kapiton-oe)
Resource potential, production profile (Tsarich-oe)
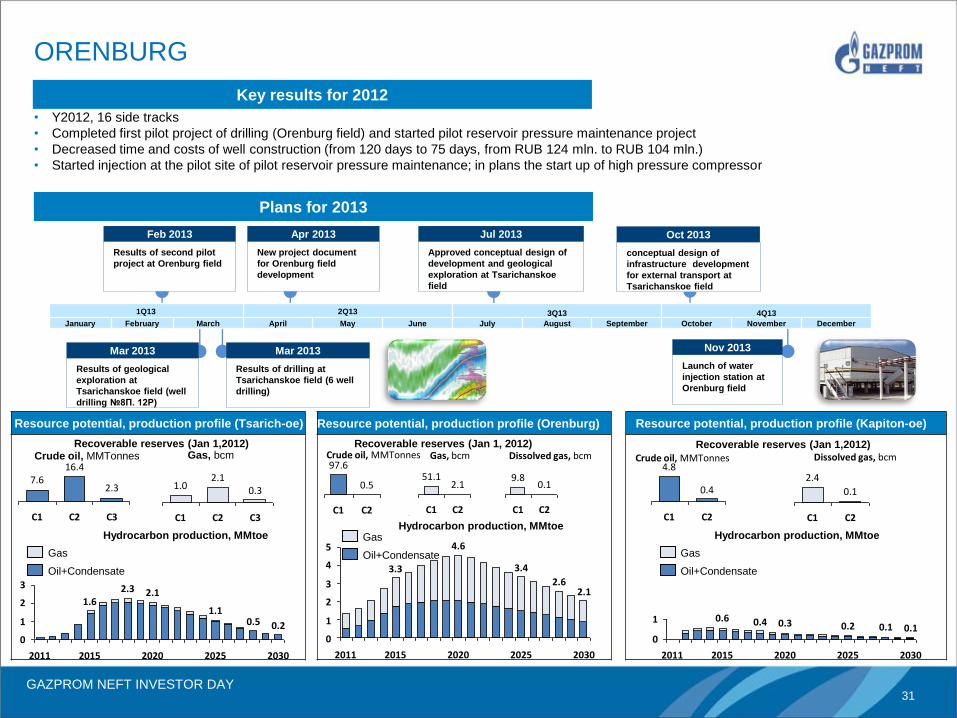
ORENBURG
1.6
2011
3
2
1
0
2030
0.2 0.5
2025
1.1
2020
2.1 2.3
2015
Oil+Condensate
Gas
Добыча УВ, млн.т.н.э.
С3
2.3
С2
16.4
С1
7.6 2.1
С1 С3
0.3
С2
1.0
Resource potential, production profile (Orenburg)
5
4
3
2
1
0
2030
2.1 2.6
2025
3.4
2020
4.6
2015
3.3
2011
Oil+Condensate
Gas
Добыча УВ, млн.т.н.э. С2
0.5
С1
97.6
С2
2.1
С1
51.1
С2
0.1
С1
9.8
Crude oil, MMTonnes Gas, bcm Gas, bcm Dissolved gas, bcm
2011 2015
0.6 1
0
2030
0.1 0.1
2025
0.2
2020
0.3 0.4
Oil+Condensate
Gas
Добыча УВ, млн.т.н.э.
С2
0.4
С1
4.8
С2
0.1
С1
2.4
Key results for 2012
Plans for 2013
1Q13 2Q13 3Q13 4Q13
January February March April May June July August September October November December
Results of second pilot
project at Orenburg field
Feb 2013
• Y2012, 16 side tracks
• Completed first pilot project of drilling (Orenburg field) and started pilot reservoir pressure maintenance project
• Decreased time and costs of well construction (from 120 days to 75 days, from RUB 124 mln. to RUB 104 mln.)
• Started injection at the pilot site of pilot reservoir pressure maintenance; in plans the start up of high pressure compressor
Recoverable reserves (Jan 1,2012) Recoverable reserves (Jan 1, 2012) Recoverable reserves (Jan 1,2012) Crude oil, MMTonnes Crude oil, MMTonnes Dissolved gas, bcm
Hydrocarbon production, MMtoe Hydrocarbon production, MMtoe Hydrocarbon production, MMtoe
New project document
for Orenburg field
development
Apr 2013
Approved conceptual design of
development and geological
exploration at Tsarichanskoe
field
Jul 2013
conceptual design of
infrastructure development
for external transport at
Tsarichanskoe field
Oct 2013
Results of drilling at
Tsarichanskoe field (6 well
drilling)
Mar 2013
Results of geological
exploration at
Tsarichanskoe field (well
drilling №8П. 12Р)
Mar 2013
Launch of water
injection station at
Orenburg field
Nov 2013
GAZPROM NEFT INVESTOR DAY 32
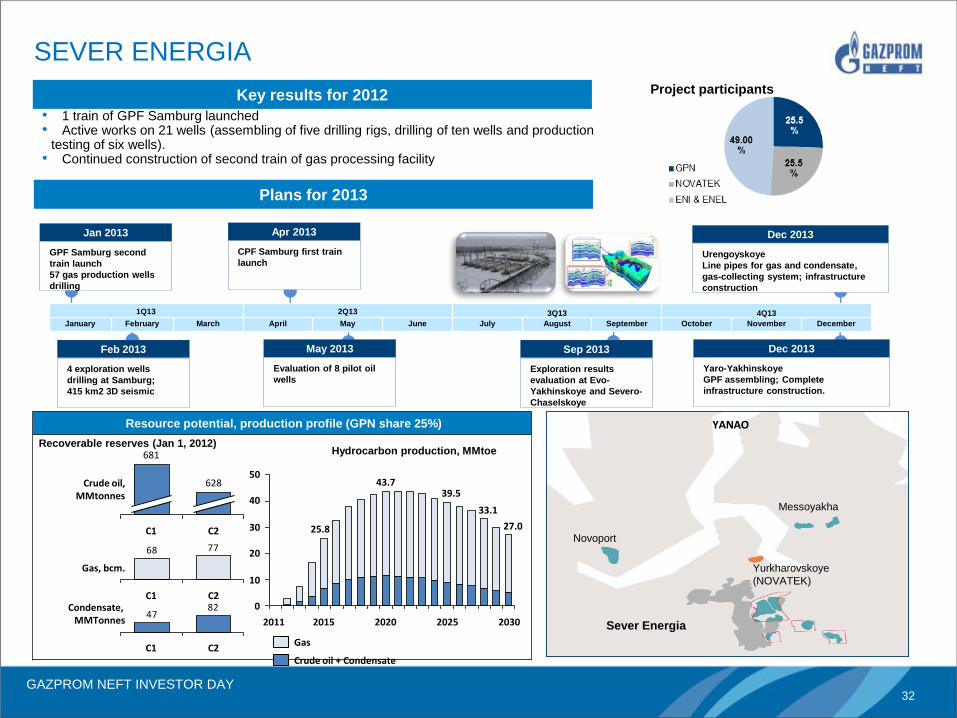
Resource potential, production profile (GPN share 25%)
• 1 train of GPF Samburg launched • Active works on 21 wells (assembling of five drilling rigs, drilling of ten wells and production
testing of six wells). • Continued construction of second train of gas processing facility
SEVER ENERGIA
30
20
10
0
2030
50
40
27.0
33.1
2025
39.5
2020
43.7
2015
25.8
2011
Crude oil + Condensate
Gas
Hydrocarbon production, MMtoe Recoverable reserves (Jan 1, 2012)
Crude oil, MMtonnes
С2
628
С1
681
7768
Gas, bcm.
С2 С1 82
47Condensate,
MMTonnes
С2 С1
Novoport
Yurkharovskoye
(NOVATEK)
Sever Energia
Messoyakha
YANAO
Key results for 2012
Plans for 2013
1Q13 2Q13 3Q13 4Q13
January February March April May June July August September October November December
GPF Samburg second
train launch
57 gas production wells
drilling
Jan 2013
CPF Samburg first train
launch
Apr 2013
Urengoyskoye
Line pipes for gas and condensate,
gas-collecting system; infrastructure
construction
Dec 2013
4 exploration wells
drilling at Samburg;
415 km2 3D seismic
Feb 2013
Evaluation of 8 pilot oil
wells
May 2013
Exploration results
evaluation at Evo-
Yakhinskoye and Severo-
Chaselskoye
Sep 2013
Yaro-Yakhinskoye
GPF assembling; Complete
infrastructure construction.
Dec 2013
Project participants
GAZPROM NEFT INVESTOR DAY 33
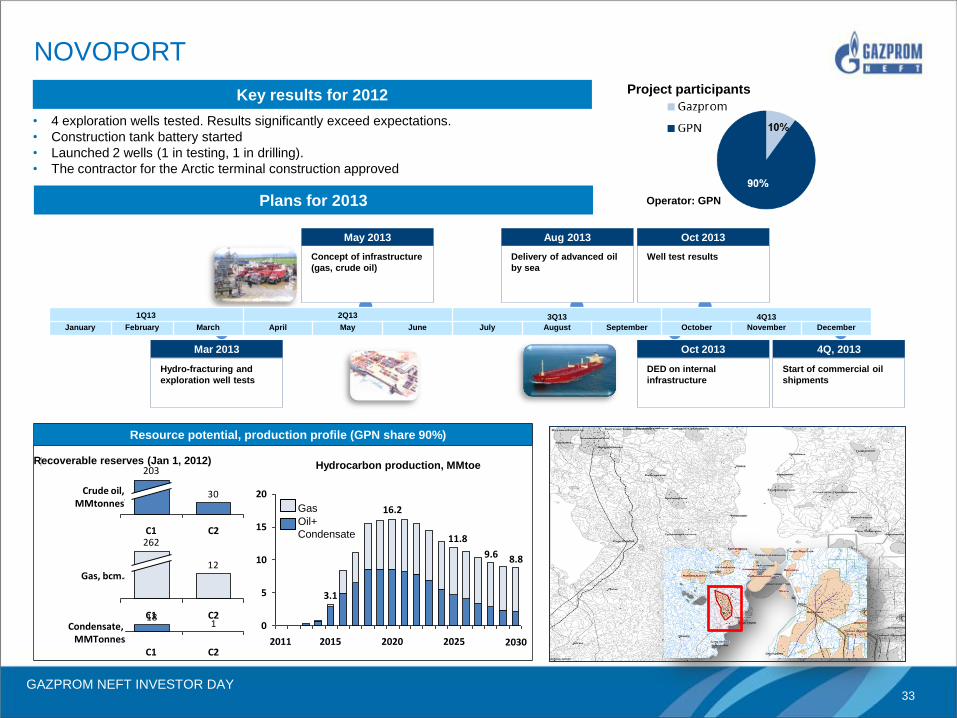
Resource potential, production profile (GPN share 90%)
• 4 exploration wells tested. Results significantly exceed expectations.
• Construction tank battery started
• Launched 2 wells (1 in testing, 1 in drilling).
• The contractor for the Arctic terminal construction approved
NOVOPORT
20
15
10
5
0
2030
8.8 9.6
2025
11.8
2020
16.2
2015
3.1
2011
Нефть +конденсат
Газ
Добыча УВ, млн.т.н.э. Извлекаемые запасы (01.01.12г.)
30Нефть, Млн. т.
С2 С1
203
Oil+
Condensate
Gas
12Газ, млрд. м3.
С2 С1
262
118
С2
Конденсат, Млн. т.
С1
Key results for 2012
Plans for 2013
Concept of infrastructure
(gas, crude oil)
May 2013
Hydrocarbon production, MMtoe
Crude oil, MMtonnes
Gas, bcm.
Condensate, MMTonnes
Recoverable reserves (Jan 1, 2012)
1Q13 2Q13 3Q13 4Q13
January February March April May June July August September October November December
Start of commercial oil
shipments
4Q, 2013
Hydro-fracturing and
exploration well tests
Mar 2013
Well test results
Oct 2013
Delivery of advanced oil
by sea
Aug 2013
DED on internal
infrastructure
Oct 2013
Project participants
Operator: GPN
GAZPROM NEFT INVESTOR DAY 34
Resource potential, production profile (GPN share 50%)
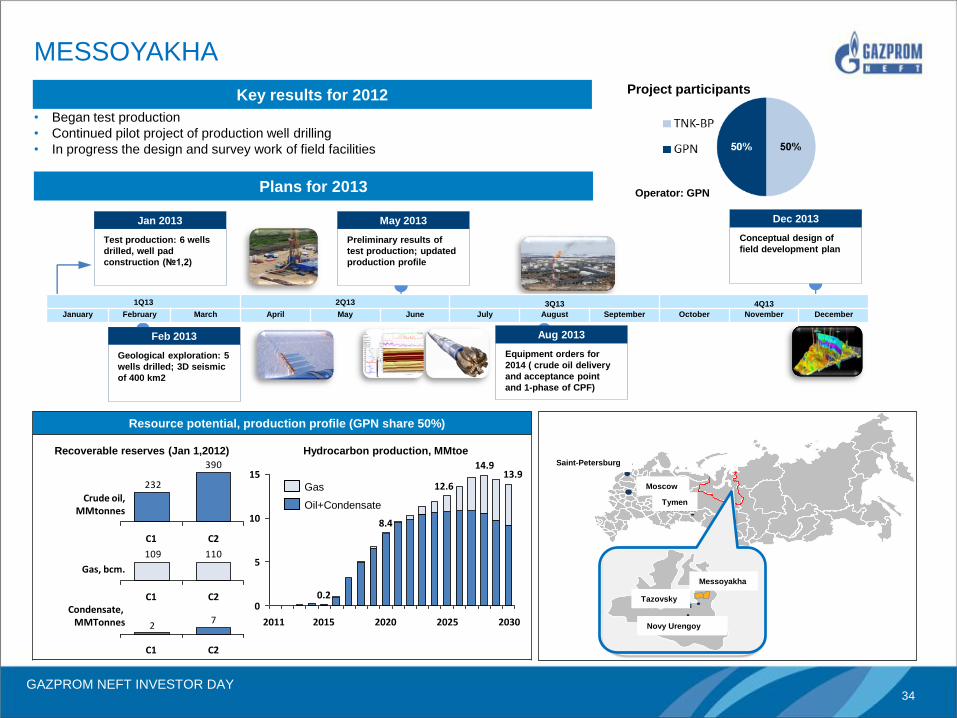
MESSOYAKHA
Тюмень
Москва
Мессояха
Новый-Уренгой
Тазовский
Санкт-Петербург
Project participants
Operator: GPN
15
10
5
0
2030
13.9 14.9
2025
12.6
2020
8.4
2015
0.2
2011
Oil+Condensate
Gas
Hydrocarbon production, MMtoe
390
232
Crude oil, MMtonnes
С2 С1
110109
С2 С1
Gas, bcm.
72
Condensate, MMTonnes
С2 С1
Key results for 2012
• Began test production
• Continued pilot project of production well drilling
• In progress the design and survey work of field facilities
Plans for 2013
1Q13 2Q13 3Q13 4Q13
January February March April May June July August September October November December
Recoverable reserves (Jan 1,2012) Saint-Petersburg
Messoyakha
Tazovsky
Novy Urengoy
Tymen
Moscow
Test production: 6 wells
drilled, well pad
construction (№1,2)
Jan 2013
Preliminary results of
test production; updated
production profile
May 2013
Conceptual design of
field development plan
Dec 2013
Geological exploration: 5
wells drilled; 3D seismic
of 400 km2
Feb 2013
Equipment orders for
2014 ( crude oil delivery
and acceptance point
and 1-phase of CPF)
Aug 2013
GAZPROM NEFT INVESTOR DAY 35
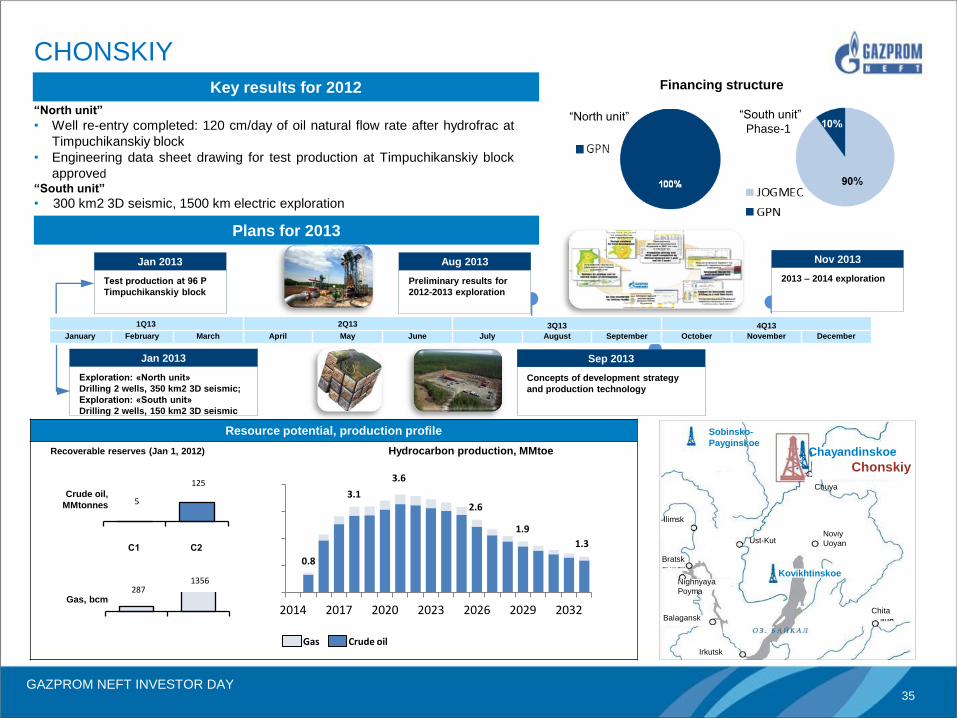
Resource potential, production profile
0
1000
2000
3000
4000
2014 2017 2020 2023 2026 2029 2032
―North unit‖
• Well re-entry completed: 120 cm/day of oil natural flow rate after hydrofrac at
Timpuchikanskiy block
• Engineering data sheet drawing for test production at Timpuchikanskiy block
approved
―South unit‖
• 300 km2 3D seismic, 1500 km electric exploration
CHONSKIY
―South unit‖
Phase-1
5
125
С2
Crude oil,
MMtonnes
С1
Gas, bcm 287
1356
Crude oil Gas
Hydrocarbon production, MMtoe
3.1
1.3
1.9
2.6
3.6
0.8
Key results for 2012
Plans for 2013
Recoverable reserves (Jan 1, 2012)
Financing structure
1Q13 2Q13 3Q13 4Q13
January February March April May June July August September October November December
Test production at 96 Р
Timpuchikanskiy block
Jan 2013
Concepts of development strategy
and production technology
Sep 2013
Preliminary results for
2012-2013 exploration
Aug 2013
Exploration: «North unit»
Drilling 2 wells, 350 km2 3D seismic;
Exploration: «South unit»
Drilling 2 wells, 150 km2 3D seismic
Jan 2013
2013 – 2014 exploration
Nov 2013
Chita
Irkutsk
Balagansk
Ilimsk
Ust-Kut Noviy
Uoyan
Bratsk
Nighnyaya
Poyma
Chuya
Chayandinskoe
Chonskiy
Sobinsko-
Payginskoe
Kovikhtinskoe
―North unit‖
GAZPROM NEFT INVESTOR DAY 36
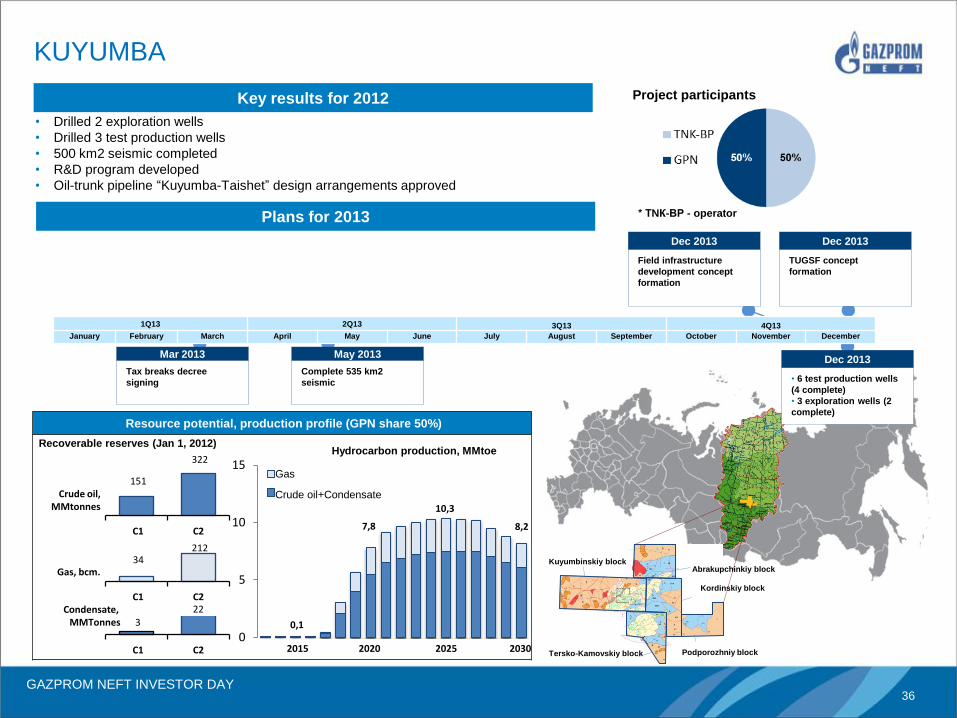
Resource potential, production profile (GPN share 50%)
• Drilled 2 exploration wells
• Drilled 3 test production wells
• 500 km2 seismic completed
• R&D program developed
• Oil-trunk pipeline ―Kuyumba-Taishet‖ design arrangements approved
KUYUMBA
Hydrocarbon production, MMtoe
151
322
Crude oil, MMtonnes
С2 С1
34 212
Gas, bcm.
С2
3 Condensate,
MMTonnes
С2 С1
50%
Kuyumbinskiy block
Kordinskiy block
Abrakupchinkiy block
Podporozhniy block Tersko-Kamovskiy block
50%
Crude oil + Condensate
22 С1
0
5
10
15 Газ
Нефть+конденсат
2030 2025
10,3
2020 2015
8,2 7,8
0,1
Key results for 2012
Plans for 2013
1Q13 2Q13 3Q13 4Q13
January February March April May June July August September October November December
Project participants
* ТNК-ВР - operator
Recoverable reserves (Jan 1, 2012)
Gas
Crude oil+Condensate
Field infrastructure
development concept
formation
Dec 2013
TUGSF concept
formation
Dec 2013
• 6 test production wells
(4 complete)
• 3 exploration wells (2
complete)
Dec 2013 Complete 535 km2
seismic
May 2013
Tax breaks decree
signing
Mar 2013
GAZPROM NEFT INVESTOR DAY 37
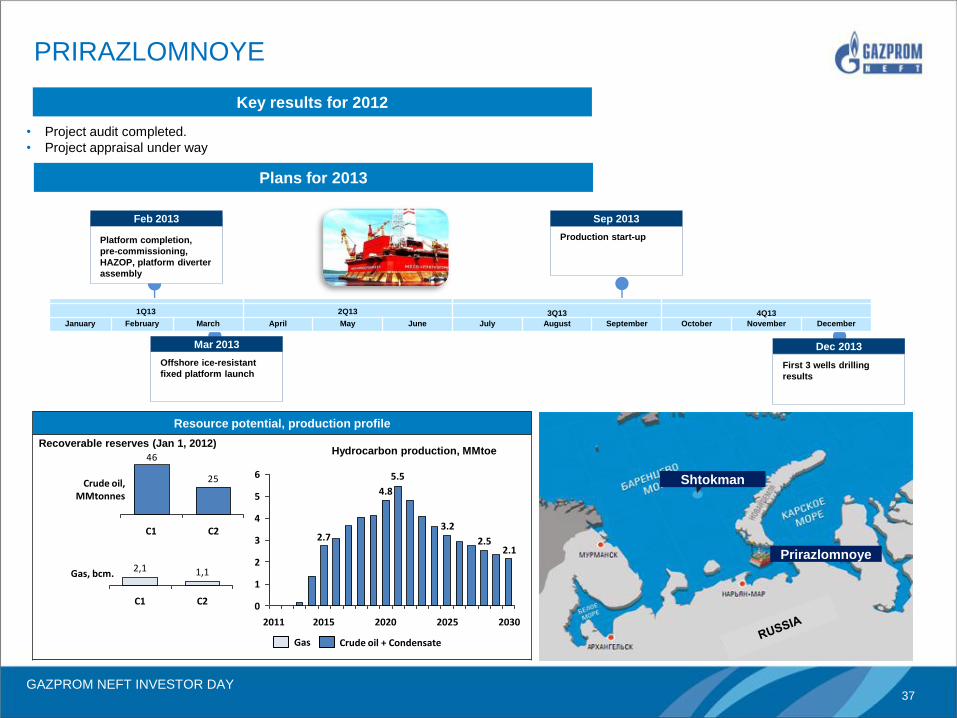
Resource potential, production profile
PRIRAZLOMNOYE
2025
3.2
5.5
2020
4.8
2015
2.7
2011
6
5
4
3
2
1
0
2030
2.1 2.5
Crude oil + Condensate Gas
Hydrocarbon production, MMtoe Recoverable reserves (Jan 1, 2012)
25
46
Crude oil, MMtonnes
С2 С1
Gas, bcm.
С2
1,1
С1
2,1
Key results for 2012
Plans for 2013
1Q13 2Q13 3Q13 4Q13
January February March April May June July August September October November December
Shtokman
Prirazlomnoye
• Project audit completed.
• Project appraisal under way
Offshore ice-resistant
fixed platform launch
Mar 2013
First 3 wells drilling
results
Dec 2013
Production start-up
Sep 2013
Platform completion,
pre-commissioning,
HAZOP, platform diverter
assembly
Feb 2013
1Q13 2Q13 3Q13 4Q13
January February March April May June July August September October November December
GAZPROM NEFT INVESTOR DAY 38
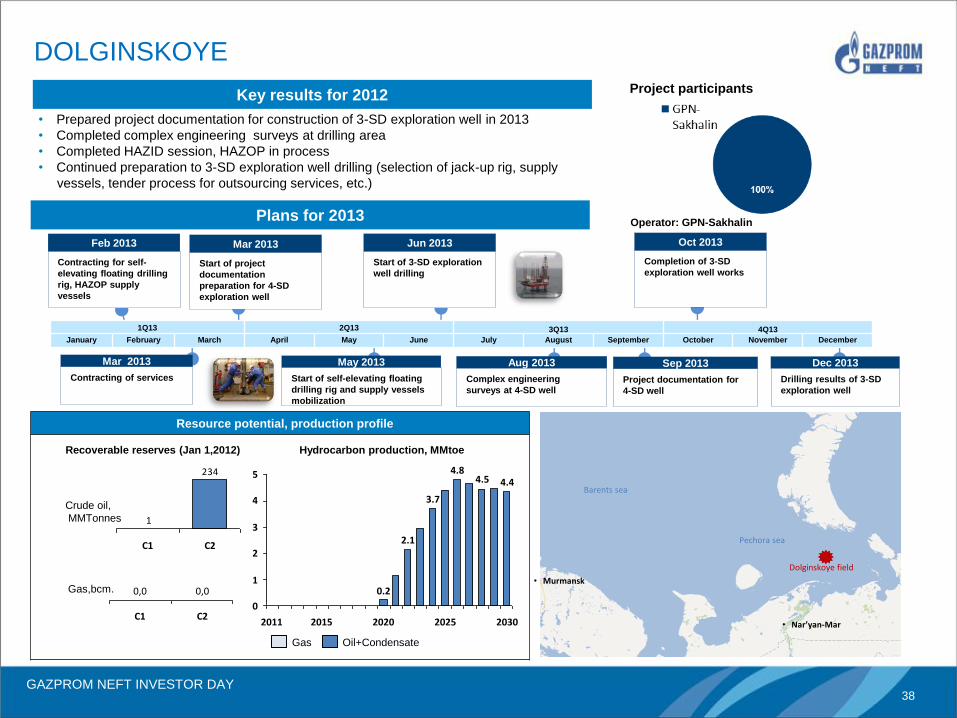
Resource potential, production profile
DOLGINSKOYE
4
3
2
1
0
2030
4.4 4.5 4.8
2025
3.7
2.1
2020
0.2
2015 2011
5
Oil+Condensate Gas
234
1
Crude oil,
MMTonnes
С2 С1
Gas,bcm.
С2
0,0
С1
0,0
• Nar’yan-Mar
Barents sea
Pechora sea
• Murmansk
Dolginskoye field
Key results for 2012
Plans for 2013
Project participants
Operator: GPN-Sakhalin
1Q13 2Q13 3Q13 4Q13
January February March April May June July August September October November December
• Prepared project documentation for construction of 3-SD exploration well in 2013
• Completed complex engineering surveys at drilling area
• Completed HAZID session, HAZOP in process
• Continued preparation to 3-SD exploration well drilling (selection of jack-up rig, supply
vessels, tender process for outsourcing services, etc.)
Hydrocarbon production, MMtoe Recoverable reserves (Jan 1,2012)
Contracting for self-
elevating floating drilling
rig, HAZOP supply
vessels
Feb 2013
Start of project
documentation
preparation for 4-SD
exploration well
Mar 2013
Start of 3-SD exploration
well drilling
Jun 2013
Completion of 3-SD
exploration well works
Oct 2013
Contracting of services
Mar 2013
Start of self-elevating floating
drilling rig and supply vessels
mobilization
May 2013
Complex engineering
surveys at 4-SD well
Aug 2013
Project documentation for
4-SD well
Sep 2013
Drilling results of 3-SD
exploration well
Dec 2013
GAZPROM NEFT INVESTOR DAY 39
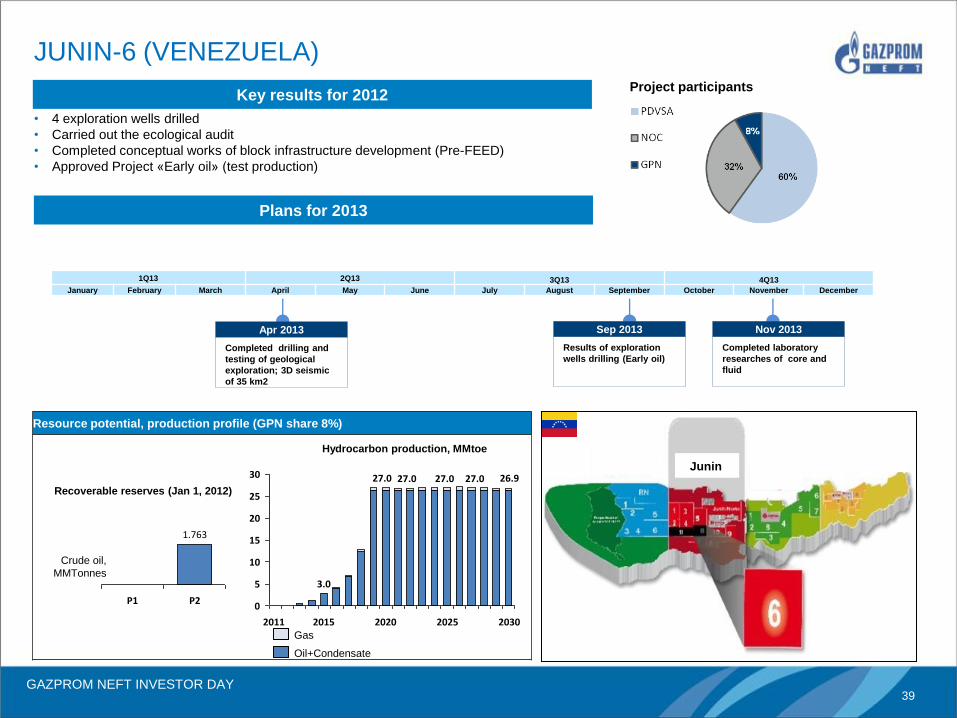
Resource potential, production profile (GPN share 8%)
• 4 exploration wells drilled
• Carried out the ecological audit
• Completed conceptual works of block infrastructure development (Pre-FEED)
• Approved Project «Early oil» (test production)
JUNIN-6 (VENEZUELA)
27.0
2020 2015 2025
30
25
20
15
10
5
0
2030
26.9
3.0
2011
Oil+Condensate
Gas
P1
1.763
Crude oil,
MMTonnes
P2
Key results for 2012
Plans for 2013
1Q13 2Q13 3Q13 4Q13
January February March April May June July August September October November December
Project participants
Completed drilling and
testing of geological
exploration; 3D seismic
of 35 km2
Apr 2013
Results of exploration
wells drilling (Early oil)
Sep 2013
Completed laboratory
researches of core and
fluid
Nov 2013
Recoverable reserves (Jan 1, 2012)
Hydrocarbon production, MMtoe
Junin 27.0 27.0 27.0
GAZPROM NEFT INVESTOR DAY 40
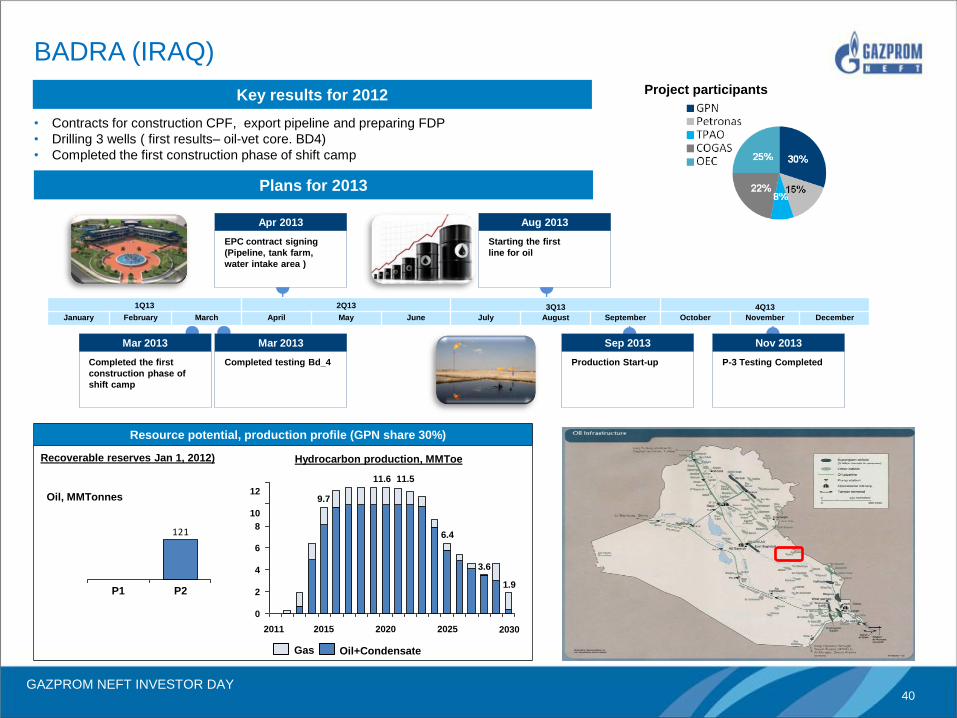
Resource potential, production profile (GPN share 30%)
121
• Contracts for construction CPF, export pipeline and preparing FDP
• Drilling 3 wells ( first results– oil-vet core. BD4)
• Completed the first construction phase of shift camp
BADRA (IRAQ)
4
12
8
10
6
0
2030
1.9
3.6
2025
6.4
11.5
2020
11.6
2015
9.7
2011
2
Gas Oil+Condensate
Hydrocarbon production, MMToe Recoverable reserves Jan 1, 2012)
Oil, MMTonnes
P2 P1
Key results for 2012
Plans for 2013
1Q13 2Q13 3Q13 4Q13
January February March April May June July August September October November December
P-3 Testing Completed
Nov 2013
Production Start-up
Sep 2013
Starting the first
line for oil
Aug 2013
EPC contract signing
(Pipeline, tank farm,
water intake area )
Apr 2013
Completed the first
construction phase of
shift camp
Mar 2013
Completed testing Bd_4
Mar 2013
Project participants
GAZPROM NEFT INVESTOR DAY 41
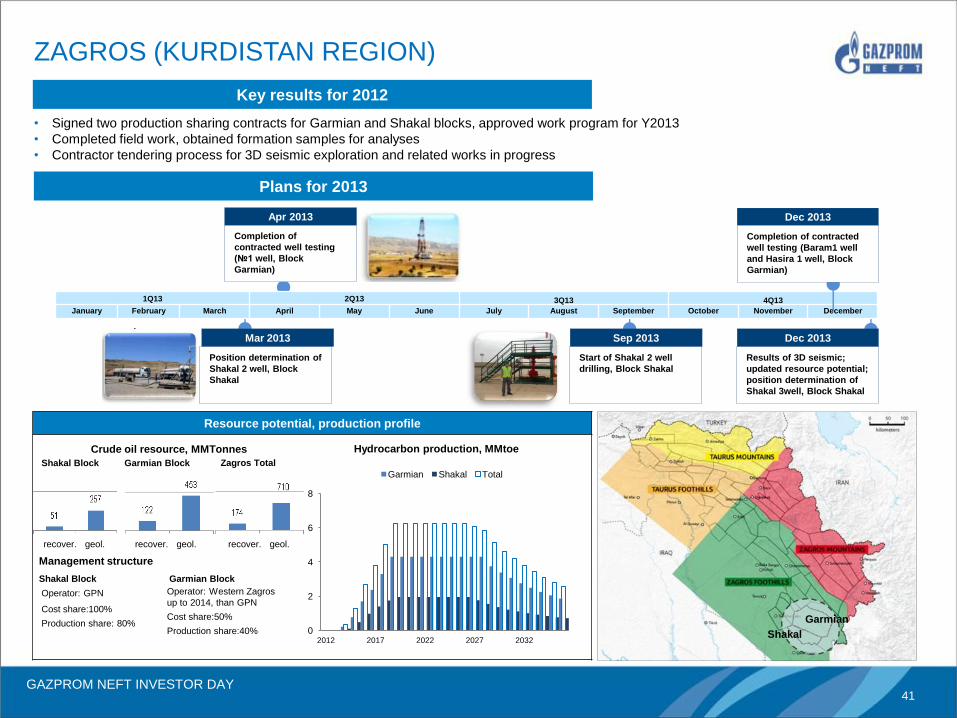
Position determination of
Shakal 2 well, Block
Shakal
Mar 2013
Resource potential, production profile
ZAGROS (KURDISTAN REGION)
Hydrocarbon production, MMtoe Crude oil resource, MMTonnes
1Q13 2Q13 3Q13 4Q13
January February March April May June July August September October November December
Management structure
Operator: GPN
Completion of
contracted well testing
(№1 well, Block
Garmian)
Apr 2013
23% 15%
30%
Shakal Block Garmian Block
0
2
4
6
8
2012 2017 2022 2027 2032
Garmian Shakal Total
Zagros Total
Shakal Block Garmian Block
Cost share:100%
Production share: 80% Garmian
Shakal
Key results for 2012
Completion of contracted
well testing (Baram1 well
and Hasira 1 well, Block
Garmian)
Dec 2013
Plans for 2013
Start of Shakal 2 well
drilling, Block Shakal
Sep 2013
Results of 3D seismic;
updated resource potential;
position determination of
Shakal 3well, Block Shakal
Dec 2013
Operator: Western Zagros
up to 2014, than GPN
Cost share:50%
Production share:40%
recover. geol. recover. geol. recover. geol.
• Signed two production sharing contracts for Garmian and Shakal blocks, approved work program for Y2013
• Completed field work, obtained formation samples for analyses
• Contractor tendering process for 3D seismic exploration and related works in progress
GAZPROM NEFT INVESTOR DAY 42
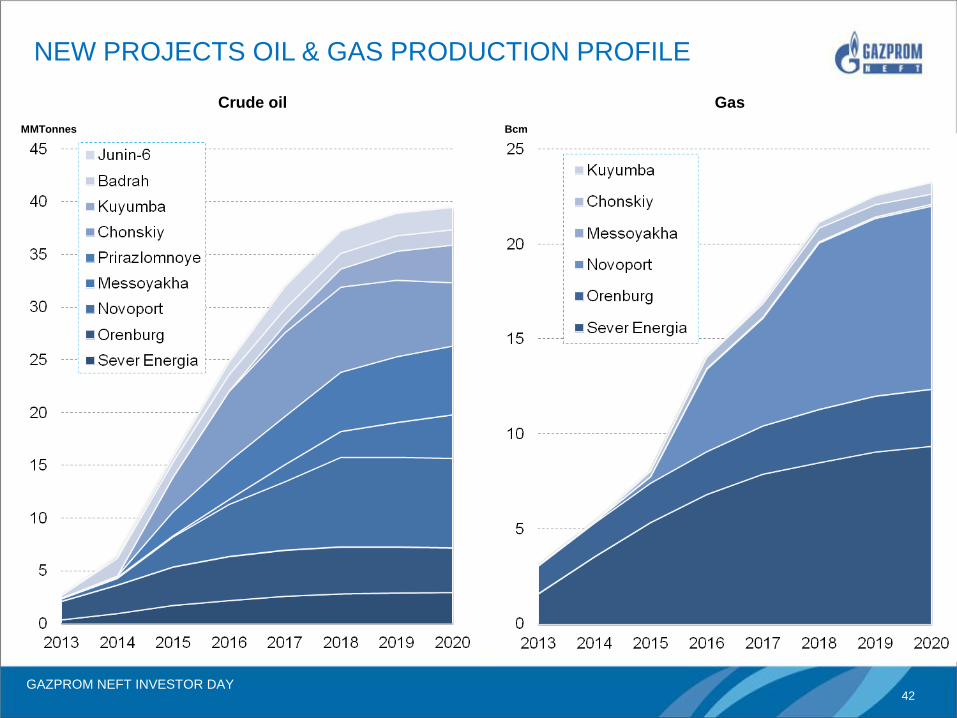
NEW PROJECTS OIL & GAS PRODUCTION PROFILE
MMTonnes Bcm
Crude oil Gas
GAZPROM NEFT INVESTOR DAY 43
Downstream
Anatoly Cherner
GAZPROM NEFT INVESTOR DAY 44
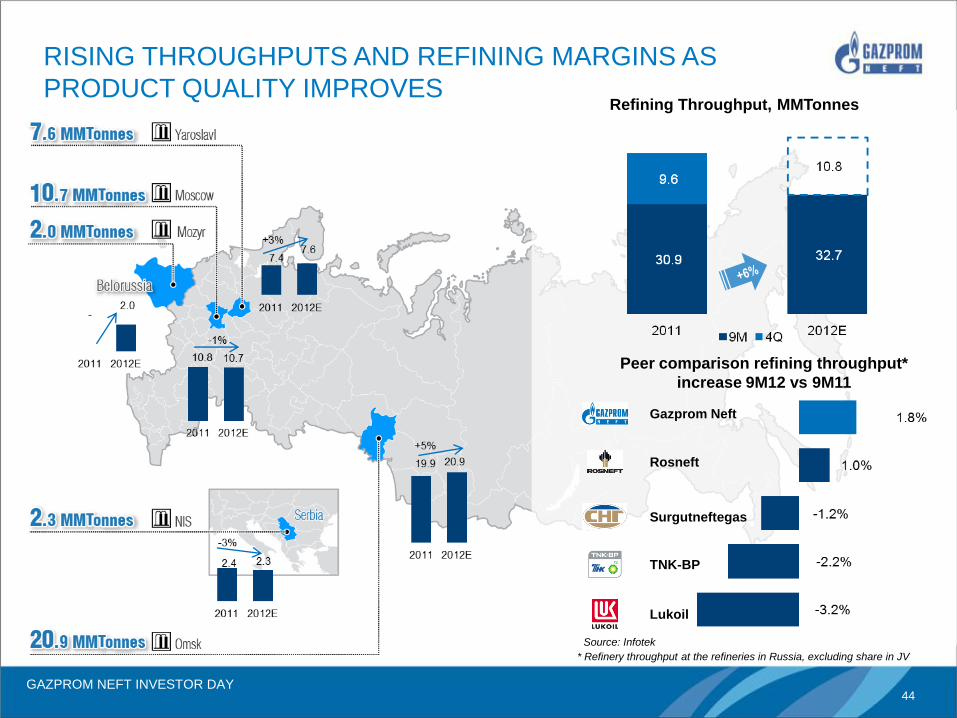
* Refinery throughput at the refineries in Russia, excluding share in JV
Peer comparison refining throughput*
increase 9M12 vs 9M11
Gazprom Neft
Rosneft
Surgutneftegas
TNK-BP
Lukoil
Source: Infotek
RISING THROUGHPUTS AND REFINING MARGINS AS
PRODUCT QUALITY IMPROVES Refining Throughput, MMTonnes
GAZPROM NEFT INVESTOR DAY 45
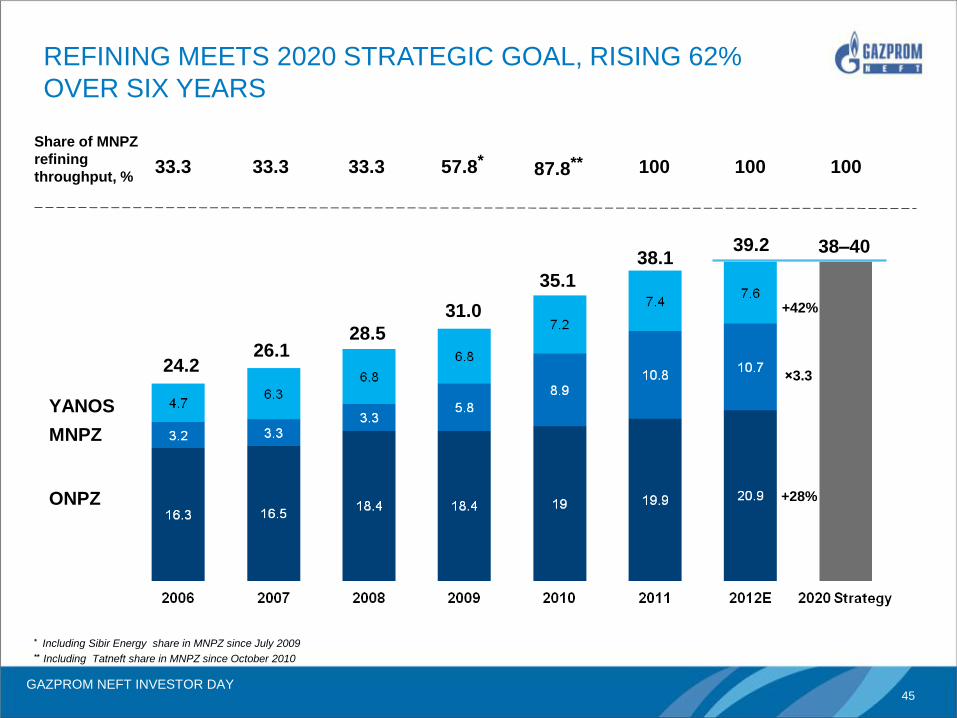
REFINING MEETS 2020 STRATEGIC GOAL, RISING 62%
OVER SIX YEARS
YANOS
MNPZ
ONPZ
Share of MNPZ
refining
throughput, % 33.3 33.3 33.3 57.8*
87.8** 100 100 100
24.2 26.1
28.5
31.0
35.1
38.1 39.2 38–40
+42%
×3.3
+28%
* Including Sibir Energy share in MNPZ since July 2009 ** Including Tatneft share in MNPZ since October 2010
GAZPROM NEFT INVESTOR DAY 46
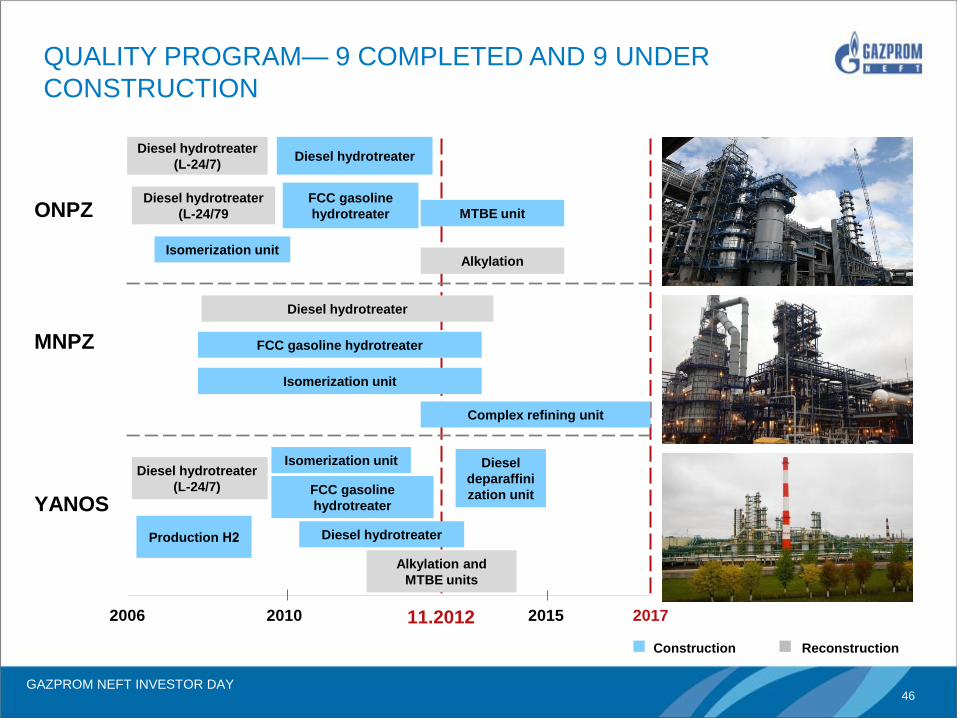
MNPZ
YANOS
ONPZ
2006 2017 2010 11.2012 2015
Diesel hydrotreater
(L-24/7)
Diesel hydrotreater
(L-24/79
Isomerization unit
Diesel hydrotreater
FCC gasoline hydrotreater
Isomerization unit
Complex refining unit
FCC gasoline
hydrotreater
Diesel hydrotreater
FCC gasoline
hydrotreater MTBE unit
Production Н2 Diesel hydrotreater
Alkylation and
MTBE units
Isomerization unit Diesel hydrotreater
(L-24/7)
Diesel
deparaffini
zation unit
Alkylation
QUALITY PROGRAM— 9 COMPLETED AND 9 UNDER
CONSTRUCTION
Construction Reconstruction
GAZPROM NEFT INVESTOR DAY 47
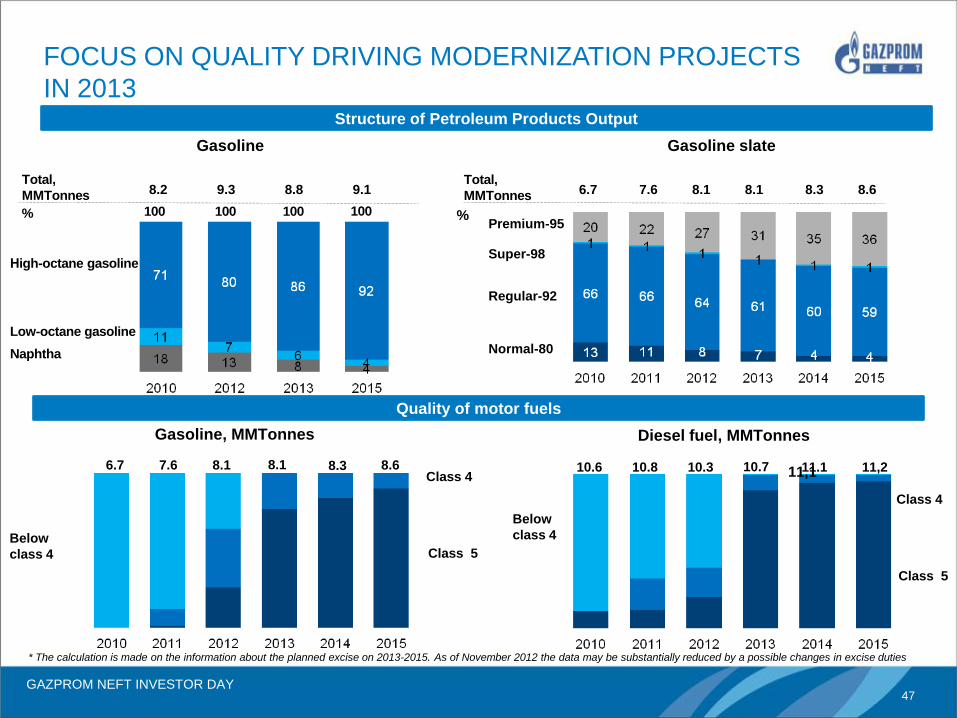
Structure of Petroleum Products Output
Super-98
Gasoline, MMTonnes
8.6 7.6 8.1 8.1 6.7 8.3 11,2 10.8 10.3 10.7 10.6 11,1
Diesel fuel, MMTonnes
Regular-92
Premium-95
Normal-80
8.3 7.6 8.1 8.1 6.7 8.6
Gasoline slate Gasoline
Class 5
Class 4
Below
class 4
* The calculation is made on the information about the planned excise on 2013-2015. As of November 2012 the data may be substantially reduced by a possible changes in excise duties
Total,
MMTonnes
% %
Нigh-octane gasoline
Low-octane gasoline
Naphtha
100 100 100 100
9.3 8.8 9.1 8.2 Total,
MMTonnes
Below
class 4 Class 5
Class 4 11.1
FOCUS ON QUALITY DRIVING MODERNIZATION PROJECTS
IN 2013
Quality of motor fuels
GAZPROM NEFT INVESTOR DAY 48
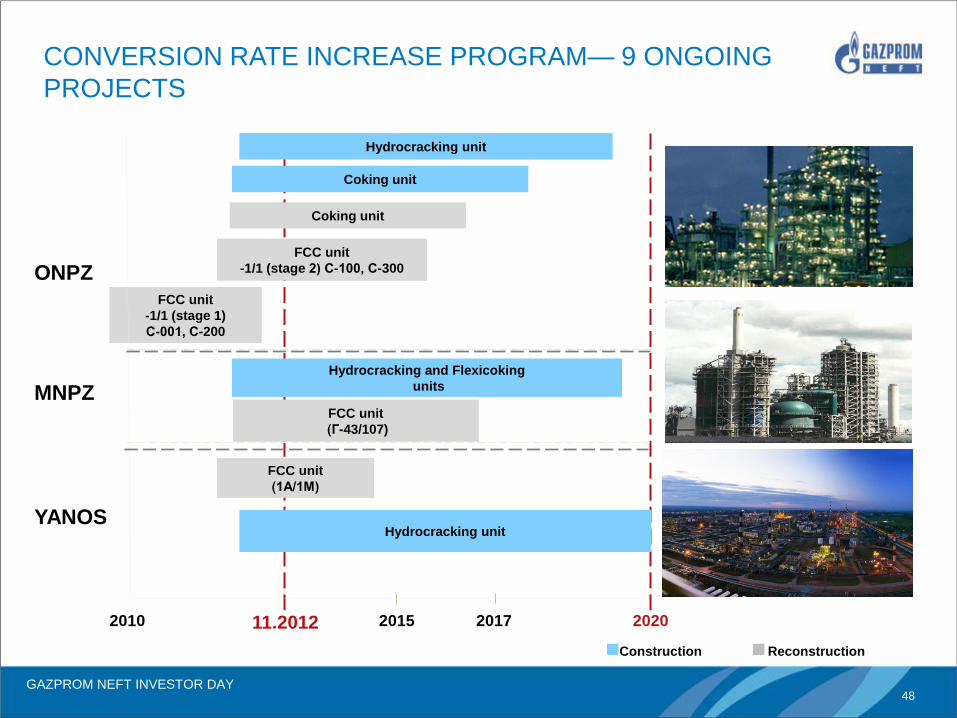
MNPZ
YANOS
ONPZ
Hydrocracking unit
Coking unit
Coking unit
FCC unit
-1/1 (stage 1)
С-001, С-200
FCC unit
-1/1 (stage 2) С-100, С-300
Hydrocracking and Flexicoking
units
FCC unit
(Г-43/107)
FCC unit
(1А/1М)
Hydrocracking unit
2010 2020 11.2012 2015 2017
Construction Reconstruction
CONVERSION RATE INCREASE PROGRAM— 9 ONGOING
PROJECTS
GAZPROM NEFT INVESTOR DAY 49
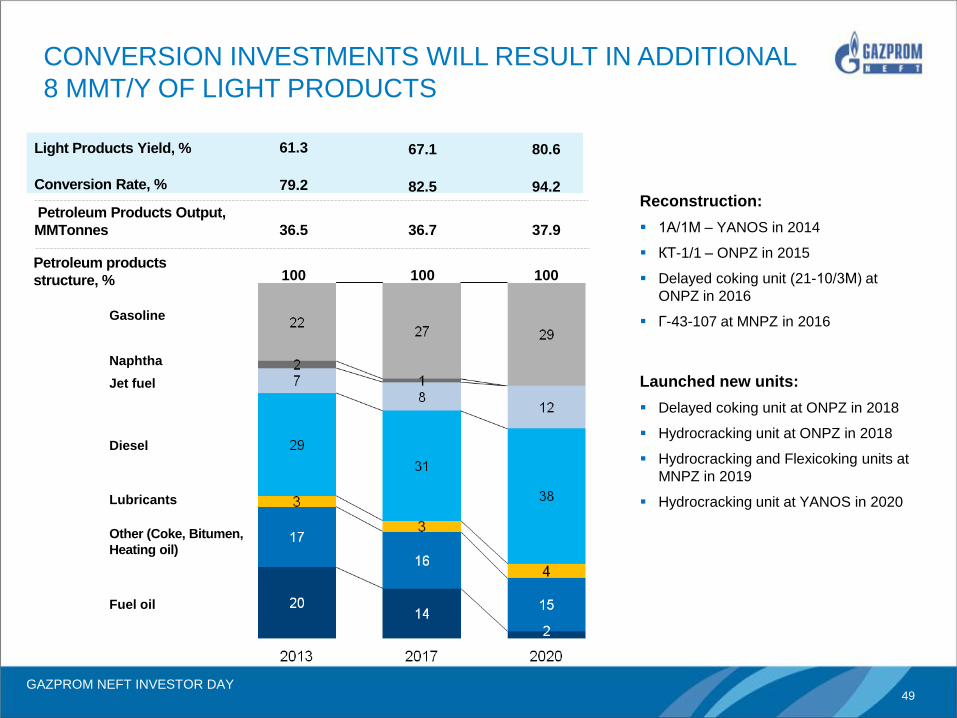
CONVERSION INVESTMENTS WILL RESULT IN ADDITIONAL
8 MMT/Y OF LIGHT PRODUCTS
Diesel
Lubricants
Other (Coke, Bitumen,
Heating oil)
Light Products Yield, %
Conversion Rate, %
Fuel oil
Naphtha
Gasoline
Jet fuel
Reconstruction:
1А/1М – YANOS in 2014
КТ-1/1 – ONPZ in 2015
Delayed coking unit (21-10/3М) at
ONPZ in 2016
Г-43-107 at MNPZ in 2016
Launched new units:
Delayed coking unit at ONPZ in 2018
Hydrocracking unit at ONPZ in 2018
Hydrocracking and Flexicoking units at
MNPZ in 2019
Hydrocracking unit at YANOS in 2020
Petroleum Products Output,
MMTonnes
79.2 82.5 94.2
36.5 36.7 37.9
61.3 67.1 80.6
100 100 100 Petroleum products
structure, %
GAZPROM NEFT INVESTOR DAY 50
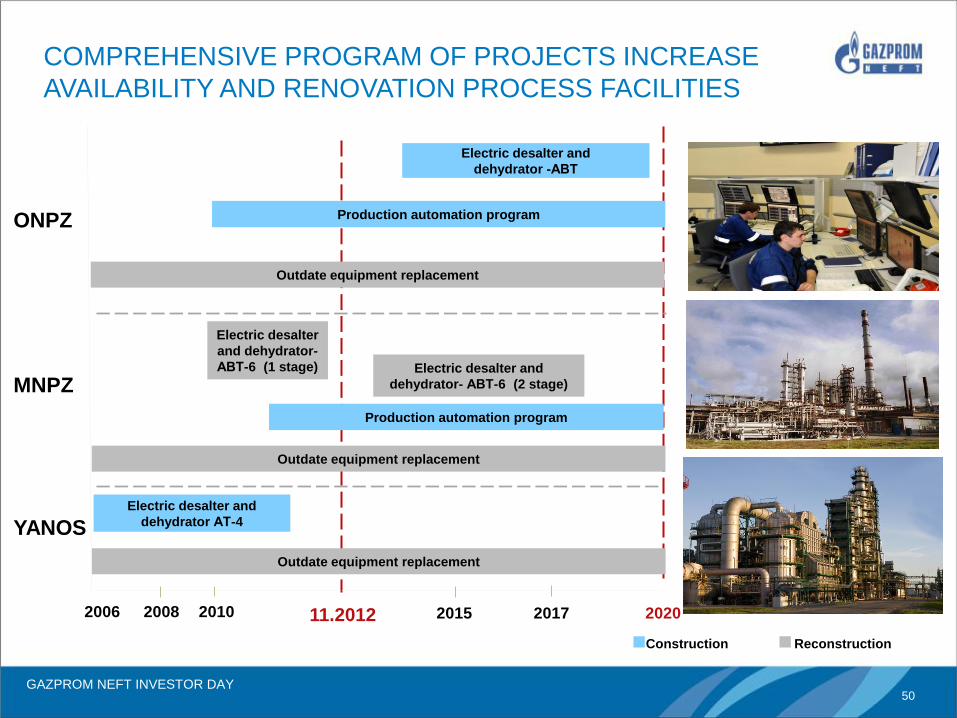
MNPZ
YANOS
ONPZ
Electric desalter and
dehydrator -АВТ
Production automation program
Outdate equipment replacement
Electric desalter
and dehydrator-
АВТ-6 (1 stage)
Electric desalter and
dehydrator АТ-4
2006 2020 11.2012 2015 2017
Electric desalter and
dehydrator- АВТ-6 (2 stage)
Production automation program
2008 2010
Outdate equipment replacement
Outdate equipment replacement
Construction Reconstruction
COMPREHENSIVE PROGRAM OF PROJECTS INCREASE
AVAILABILITY AND RENOVATION PROCESS FACILITIES
GAZPROM NEFT INVESTOR DAY 51
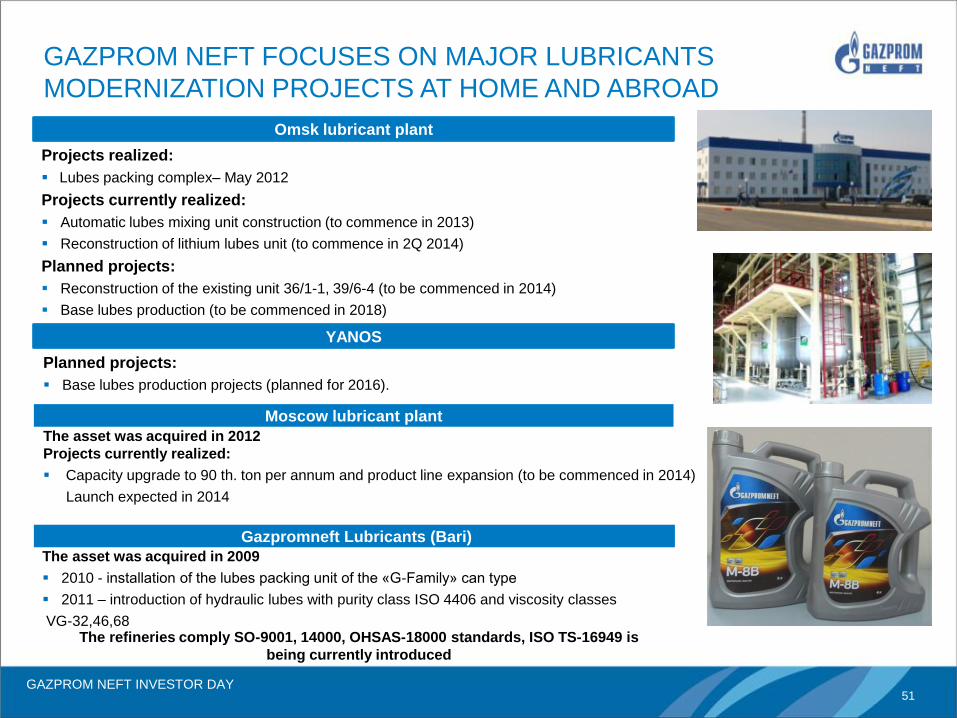
Omsk lubricant plant
YANOS
Moscow lubricant plant
Projects realized:
Lubes packing complex– May 2012
Projects currently realized:
Automatic lubes mixing unit construction (to commence in 2013)
Reconstruction of lithium lubes unit (to commence in 2Q 2014)
Planned projects:
Reconstruction of the existing unit 36/1-1, 39/6-4 (to be commenced in 2014)
Base lubes production (to be commenced in 2018)
The asset was acquired in 2012
Projects currently realized:
Capacity upgrade to 90 th. ton per annum and product line expansion (to be commenced in 2014)
Launch expected in 2014
Planned projects:
Base lubes production projects (planned for 2016).
Gazpromneft Lubricants (Bari)
The asset was acquired in 2009
2010 - installation of the lubes packing unit of the «G-Family» can type
2011 – introduction of hydraulic lubes with purity class ISO 4406 and viscosity classes
VG-32,46,68 The refineries comply SO-9001, 14000, OHSAS-18000 standards, ISO TS-16949 is
being currently introduced
GAZPROM NEFT FOCUSES ON MAJOR LUBRICANTS
MODERNIZATION PROJECTS AT HOME AND ABROAD
GAZPROM NEFT INVESTOR DAY 52
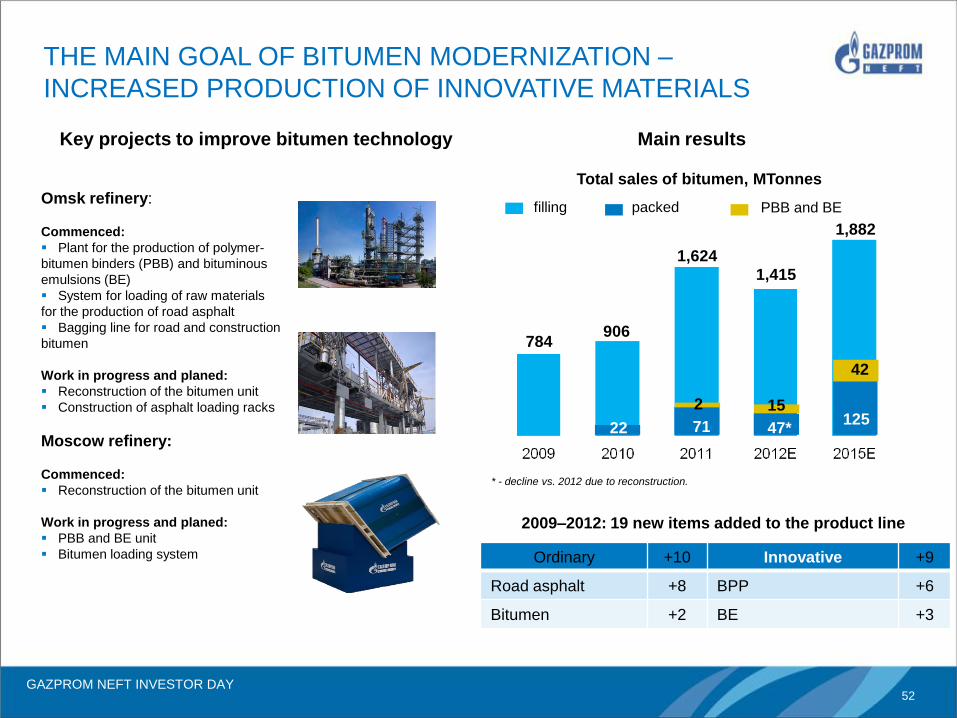
2009–2012: 19 new items added to the product line
Ordinary +10 Innovative +9
Road asphalt +8 BPP +6
Bitumen +2 BE +3
Total sales of bitumen, MTonnes
784 906
1,415
Key projects to improve bitumen technology
PBB and BE
15
47*
2
71 22
Main results
1,882
42
125
* - decline vs. 2012 due to reconstruction.
1,624
THE MAIN GOAL OF BITUMEN MODERNIZATION –
INCREASED PRODUCTION OF INNOVATIVE MATERIALS
packed filling Omsk refinery:
Commenced:
Plant for the production of polymer-
bitumen binders (PBB) and bituminous
emulsions (BE)
System for loading of raw materials
for the production of road asphalt
Bagging line for road and construction
bitumen
Work in progress and planed:
Reconstruction of the bitumen unit
Construction of asphalt loading racks
Moscow refinery:
Commenced:
Reconstruction of the bitumen unit
Work in progress and planed:
PBB and BE unit
Bitumen loading system
GAZPROM NEFT INVESTOR DAY 53
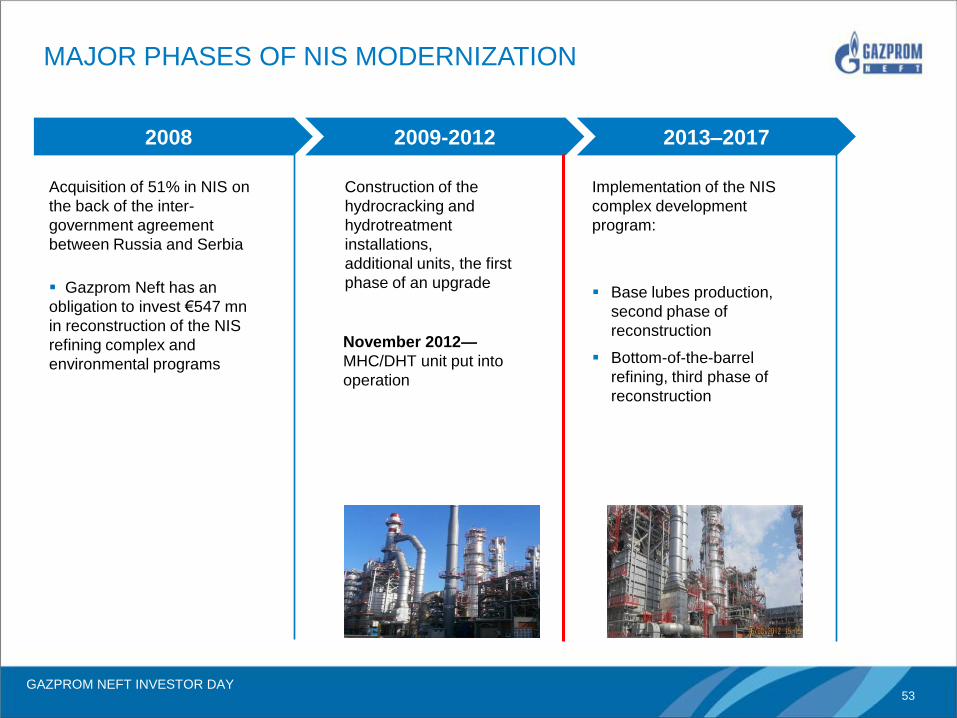
2008 2009-2012 2013–2017
Acquisition of 51% in NIS on
the back of the inter-
government agreement
between Russia and Serbia
Gazprom Neft has an
obligation to invest €547 mn
in reconstruction of the NIS
refining complex and
environmental programs
Construction of the
hydrocracking and
hydrotreatment
installations,
additional units, the first
phase of an upgrade
November 2012—
MHC/DHT unit put into
operation
Implementation of the NIS
complex development
program:
Base lubes production,
second phase of
reconstruction
Bottom-of-the-barrel
refining, third phase of
reconstruction
MAJOR PHASES OF NIS MODERNIZATION
GAZPROM NEFT INVESTOR DAY 54
Financial Outlook
Alexey Yankevich
GAZPROM NEFT INVESTOR DAY 55
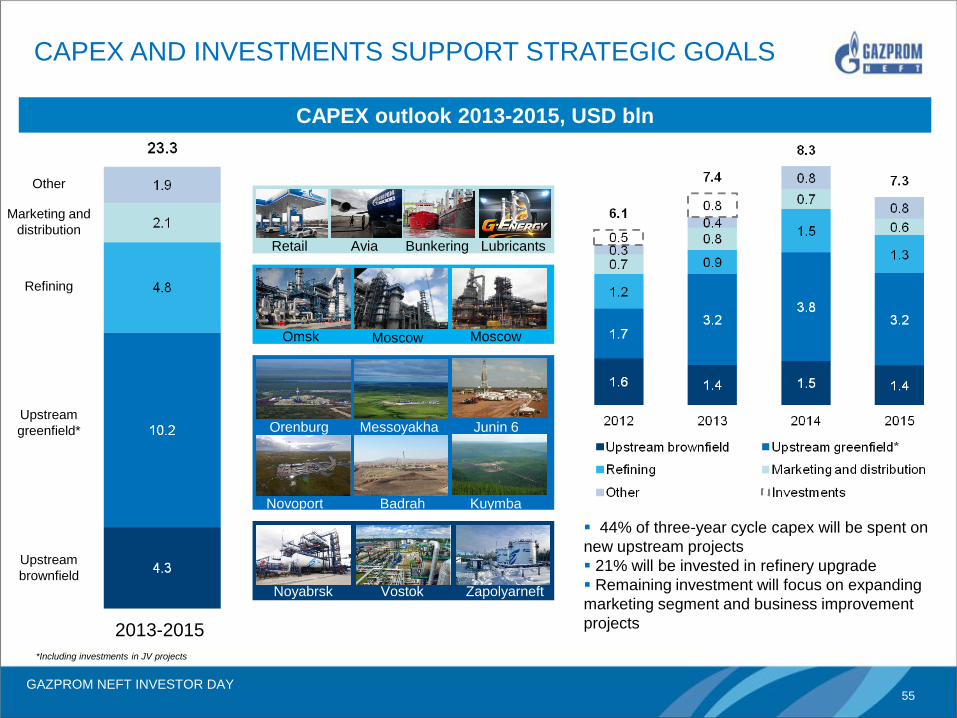
2013-2015
CAPEX outlook 2013-2015, USD bln
Upstream
brownfield
Upstream
greenfield*
Refining
Marketing and
distribution
Other
Badrah Novoport
Messoyakha Orenburg
Omsk Moscow Moscow
Junin 6
Retail Avia Bunkering Lubricants
Kuymba
CAPEX AND INVESTMENTS SUPPORT STRATEGIC GOALS
*Including investments in JV projects
Noyabrsk Vostok Zapolyarneft
44% of three-year cycle capex will be spent on
new upstream projects
21% will be invested in refinery upgrade
Remaining investment will focus on expanding
marketing segment and business improvement
projects
GAZPROM NEFT INVESTOR DAY 56
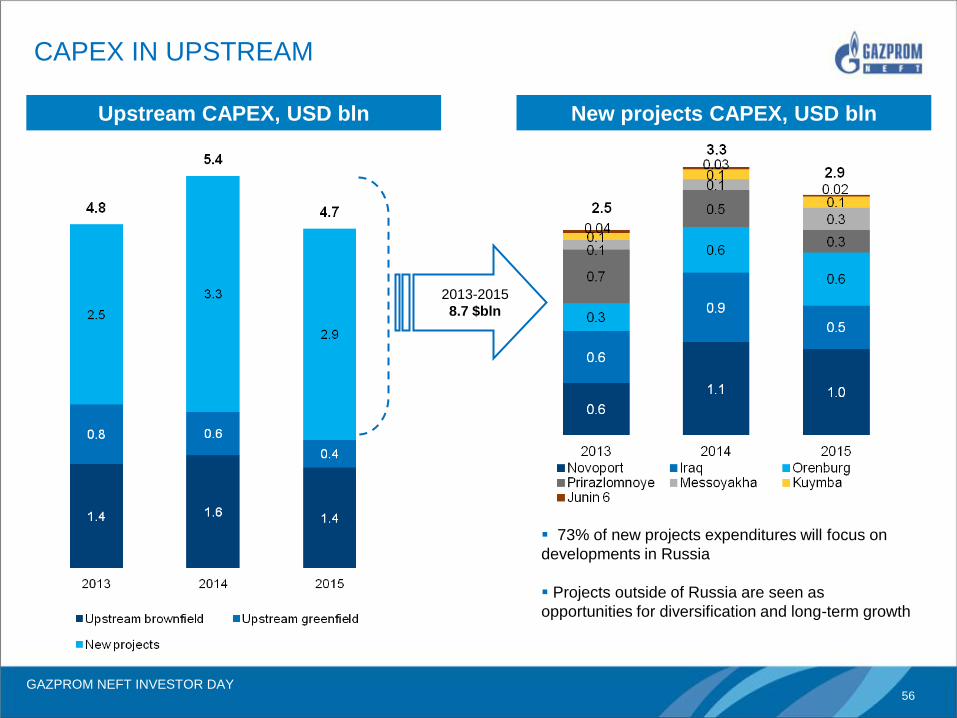
New projects CAPEX, USD bln Upstream CAPEX, USD bln
2013-2015
8.7 $bln
CAPEX IN UPSTREAM
73% of new projects expenditures will focus on
developments in Russia
Projects outside of Russia are seen as
opportunities for diversification and long-term growth
GAZPROM NEFT INVESTOR DAY 57
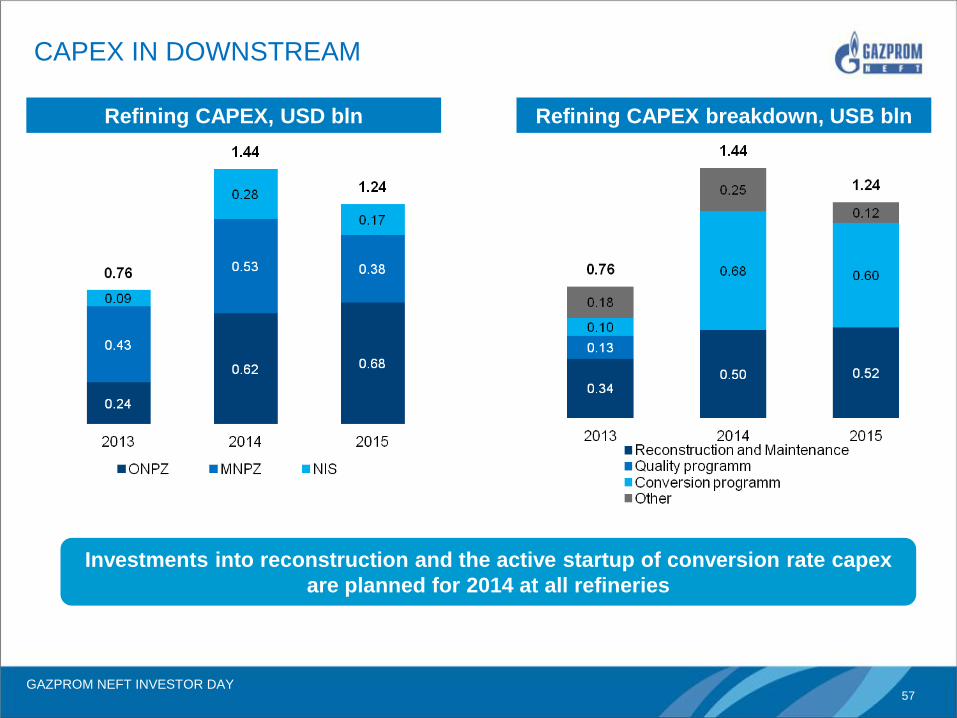
Refining CAPEX breakdown, USB bln Refining CAPEX, USD bln
CAPEX IN DOWNSTREAM
Investments into reconstruction and the active startup of conversion rate capex
are planned for 2014 at all refineries
GAZPROM NEFT INVESTOR DAY 58
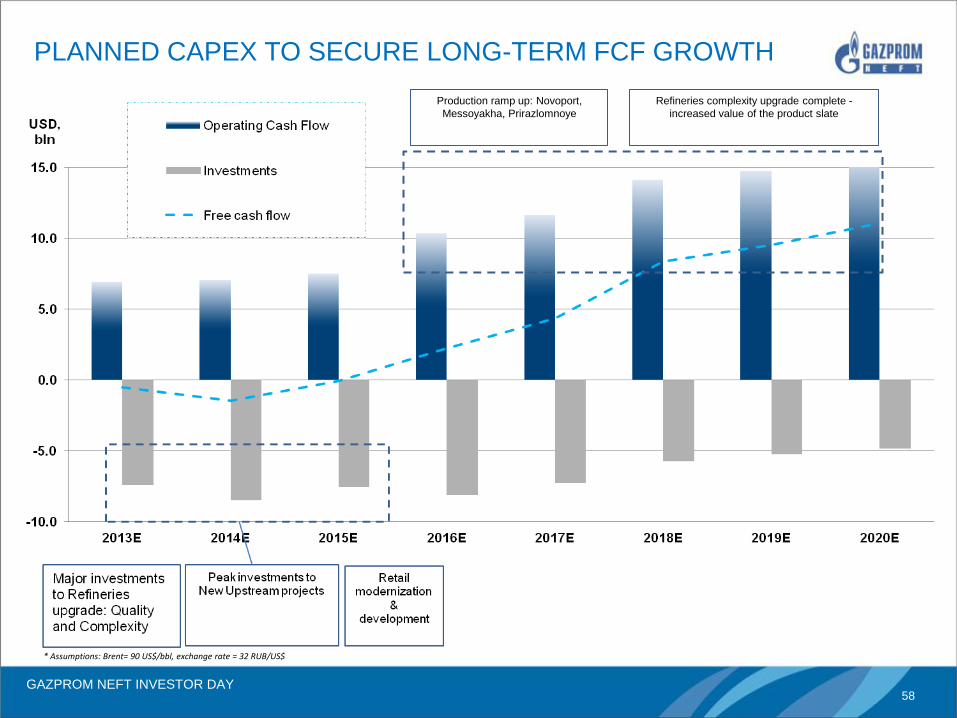
Production ramp up: Novoport,
Messoyakha, Prirazlomnoye
Refineries complexity upgrade complete -
increased value of the product slate
* Assumptions: Brent= 90 US$/bbl, exchange rate = 32 RUB/US$
PLANNED CAPEX TO SECURE LONG-TERM FCF GROWTH
GAZPROM NEFT INVESTOR DAY 59
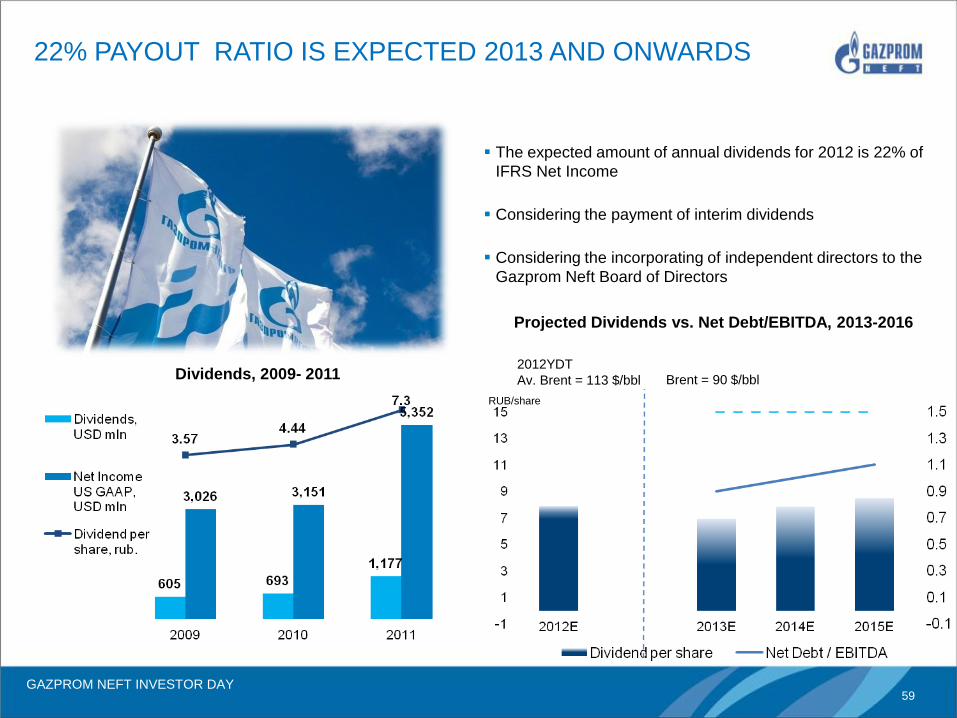
22% PAYOUT RATIO IS EXPECTED 2013 AND ONWARDS
Dividends, 2009- 2011
The expected amount of annual dividends for 2012 is 22% of
IFRS Net Income
Considering the payment of interim dividends
Considering the incorporating of independent directors to the
Gazprom Neft Board of Directors
2012YDT
Av. Brent = 113 $/bbl Brent = 90 $/bbl
RUB/share
Projected Dividends vs. Net Debt/EBITDA, 2013-2016
GAZPROM NEFT INVESTOR DAY 60
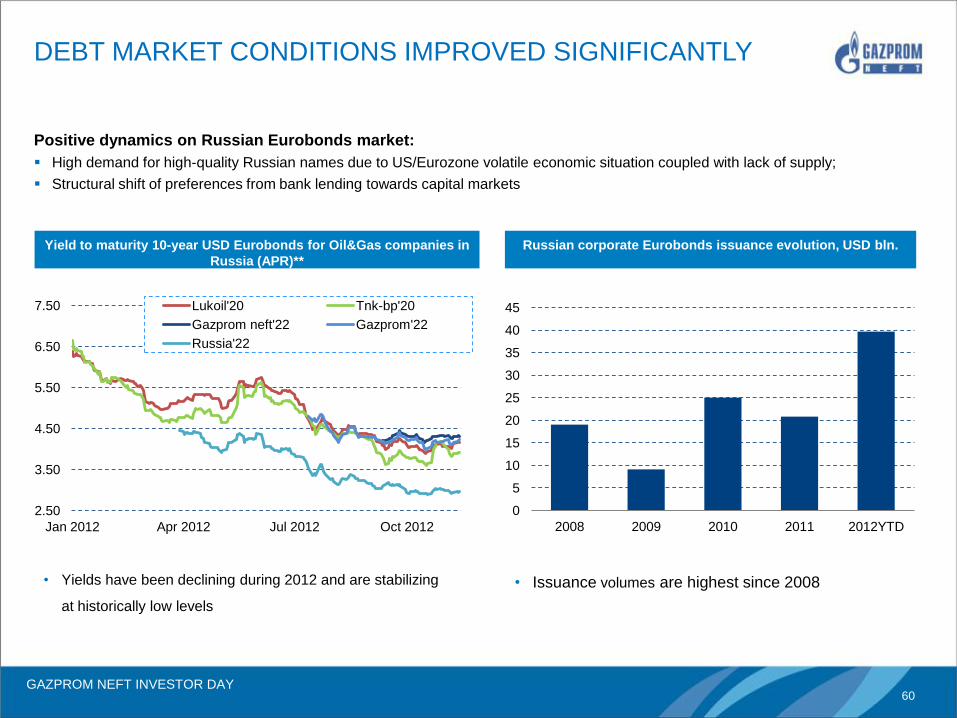
DEBT MARKET CONDITIONS IMPROVED SIGNIFICANTLY
Positive dynamics on Russian Eurobonds market:
High demand for high-quality Russian names due to US/Eurozone volatile economic situation coupled with lack of supply;
Structural shift of preferences from bank lending towards capital markets
Yield to maturity 10-year USD Eurobonds for Oil&Gas companies in
Russia (APR)**
2.50
3.50
4.50
5.50
6.50
7.50
Jan 2012 Apr 2012 Jul 2012 Oct 2012
Lukoil'20 Tnk-bp'20
Gazprom neft'22 Gazprom'22
Russia'22
Russian corporate Eurobonds issuance evolution, USD bln.
0
5
10
15
20
25
30
35
40
45
2008 2009 2010 2011 2012YTD
• Yields have been declining during 2012 and are stabilizing
at historically low levels
• Issuance volumes are highest since 2008
GAZPROM NEFT INVESTOR DAY 61
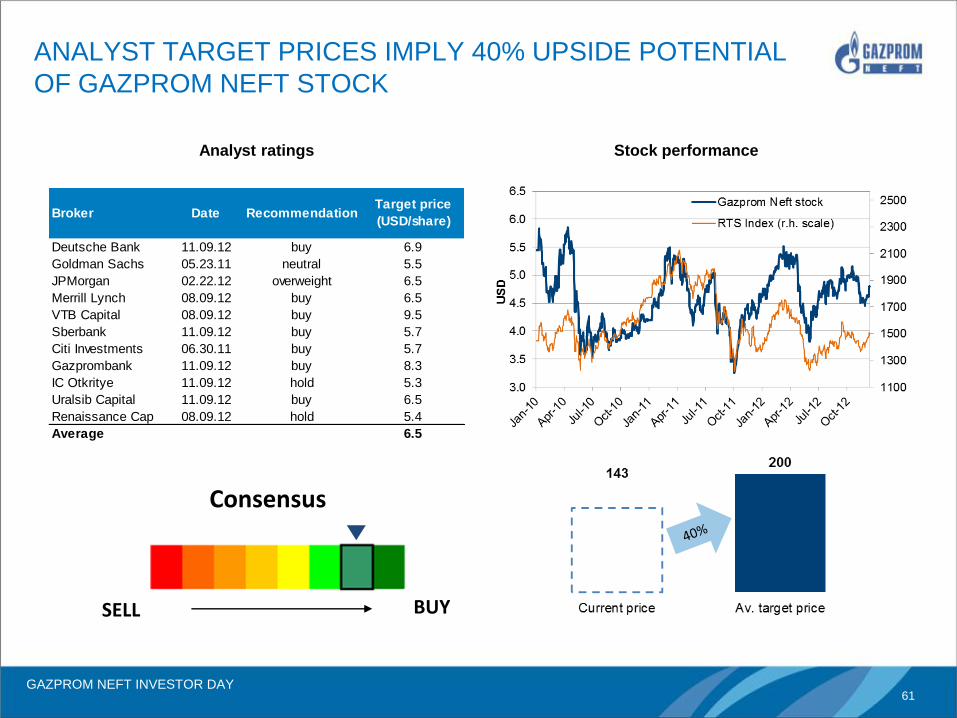
ANALYST TARGET PRICES IMPLY 40% UPSIDE POTENTIAL
OF GAZPROM NEFT STOCK
Consensus
SELL BUY
Analyst ratings Stock performance
Deutsche Bank 11.09.12 buy 6.9
Goldman Sachs 05.23.11 neutral 5.5
JPMorgan 02.22.12 overweight 6.5
Merrill Lynch 08.09.12 buy 6.5
VTB Capital 08.09.12 buy 9.5
Sberbank 11.09.12 buy 5.7
Citi Investments 06.30.11 buy 5.7
Gazprombank 11.09.12 buy 8.3
IC Otkritye 11.09.12 hold 5.3
Uralsib Capital 11.09.12 buy 6.5
Renaissance Cap 08.09.12 hold 5.4
Average 6.5
Broker Date RecommendationTarget price
(USD/share)
GAZPROM NEFT INVESTOR DAY 62
THANK YOU!
QUESTIONS&ANSWERS
GAZPROM NEFT INVESTOR DAY 63
APPENDIX
GAZPROM NEFT INVESTOR DAY 64
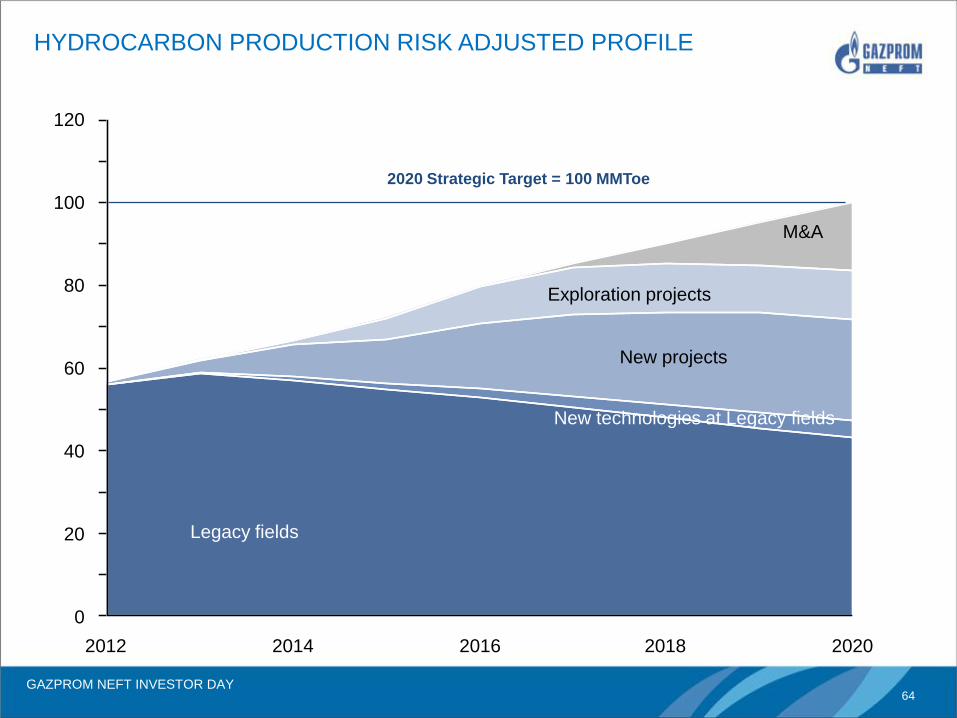
HYDROCARBON PRODUCTION RISK ADJUSTED PROFILE
0
20
120
100
80
60
40
2012 2018 2020 2014 2016
Exploration projects
New projects
New technologies at Legacy fields
M&A
Legacy fields
2020 Strategic Target = 100 MMToe