Embed Size (px)
Citation preview

GAZPROM IN FIGURES 2000 – 2004

Table of Contents
Preface..................................................................................................................................................................5
Role of Gazprom in the world gas industry ..........................................................................................................6
Gazprom and Russian Economy ........................................................................................................................11
Gazprom in Development, 2000 – 2004 ............................................................................................................13
Share Capital, Dividends, Financial and Market Indicators ..............................................................................13
Corporate structure ..........................................................................................................................................14
Resource Base ................................................................................................................................................16
Drilling ............................................................................................................................................................19
Production ......................................................................................................................................................20
Refining............................................................................................................................................................22
Transportation and Storage ............................................................................................................................23
Natural Gas Balance ........................................................................................................................................26
Gazprom’s Activities in the Russian Market ....................................................................................................27
Gazprom’s Activities in External Market ..........................................................................................................29
Capital Investments..........................................................................................................................................32
Debt Features ..................................................................................................................................................32
Financial Activities ..........................................................................................................................................33
Corporate Immovable Property........................................................................................................................34
Personnel ........................................................................................................................................................35
3GAZPROM IN FIGURES 2000 – 2004

PREFACE
Fact book «Gazprom in Figures 2000 – 2004» is a supplementary informational and statistical edition, preparedfor OAO «Gazprom» annual General shareholders meeting 2005. It is aimed at providing detailed and firsthandfigures about the company’s activities in gas business to shareholders and investors, allowing them prompt ori-entation in the large amount of information about Gazprom.
The Fact book is prepared on the basis of corporate reports and accounts of OAO «Gazprom», including figuresof earlier annual reports, the issuer’s quarterly reports, offering circulars, as well as on the basis of Russian andforeign industry hand-books and other sources of publicly disclosed information.
The information presented in the Fact book enlarges and broadens the figures of Gazprom’s production andfinancial activity, given in OAO «Gazprom» Annual report 2004. These figures are presented for the five-year peri-od. The information concerns main business sectors – resource base development, hydrocarbon production, gastransportation and storage, refining, as well as gas supplies to the Russian and external markets.
The Gazprom Group and OAO «Gazprom» activities are described in the Fact book by the figures based on man-agement reports data. When accounting (financial) statements figures are used it is specially noted with refer-ences (accounting (financial) reports of OAO «Gazprom» and consolidated accounting (financial) reports of theGazprom Group used in this Fact book are prepared in accordance with the Russian Accounting System).
All the terms, explanations, admissions and restrictions of OAO «Gazprom» Annual report 2004 are valid in thepresent Fact book. In particular, the term OAO «Gazprom» refers to the head company of the Group, i.e. to OpenJoint Stock Company «Gazprom». The Gazprom Group, the Group or Gazprom imply OAO «Gazprom», its sub-sidiaries and related companies taken as a whole.
5GAZPROM IN FIGURES 2000 – 2004
ROLE OF GAZPROM IN THE WORLD GAS INDUSTRY
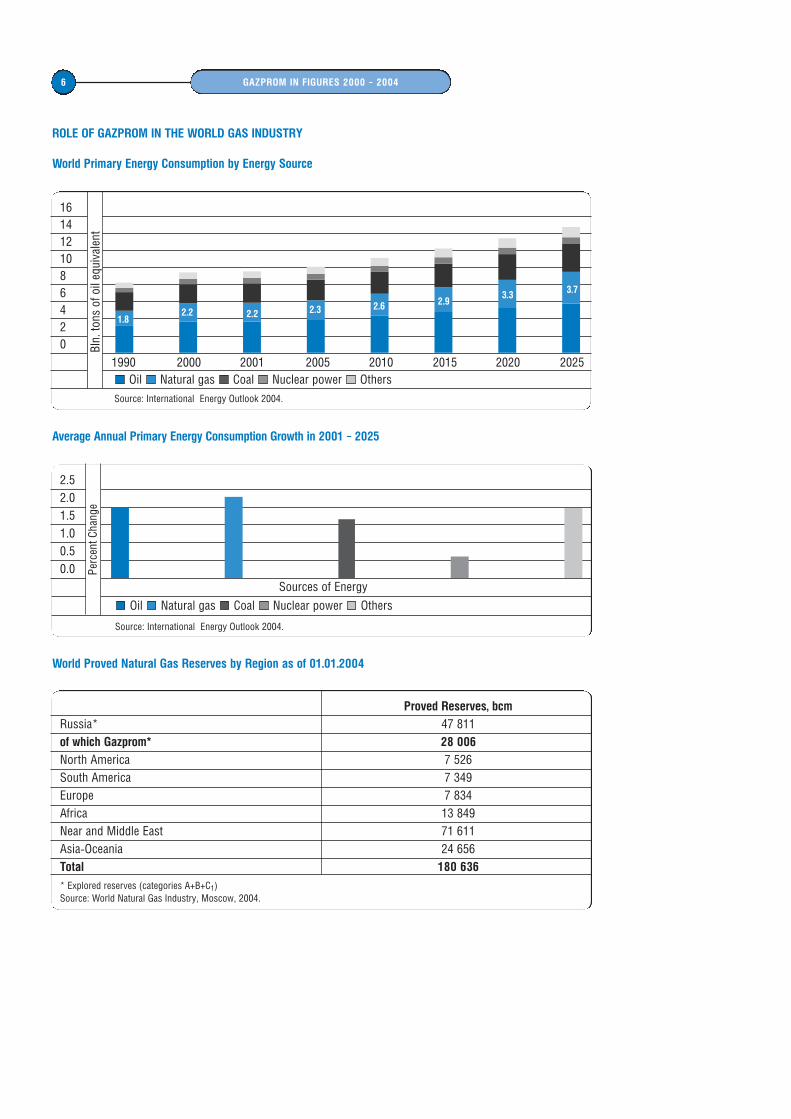
World Primary Energy Consumption by Energy Source
Average Annual Primary Energy Consumption Growth in 2001 – 2025
World Proved Natural Gas Reserves by Region as of 01.01.2004
6 GAZPROM IN FIGURES 2000 – 2004
1614121086420
1990 2000 2001 2005 2010 2015 2020 2025Oil Natural gas Coal Nuclear power Others
Source: International Energy Outlook 2004.
1.82.2 2.2 2.3 2.6 2.9
3.3 3.7
Bln.
tons
of o
il eq
uiva
lent
2.52.01.51.00.50.0
Sources of Energy
Oil Natural gas Coal Nuclear power Others
Source: International Energy Outlook 2004.
Perc
ent C
hang
e
Proved Reserves, bcm
Russia* 47 811of which Gazprom* 28 006
North America 7 526South America 7 349Europe 7 834Africa 13 849Near and Middle East 71 611Asia-Oceania 24 656Total 180 636
* Explored reserves (categories A+B+C1)Source: World Natural Gas Industry, Moscow, 2004.
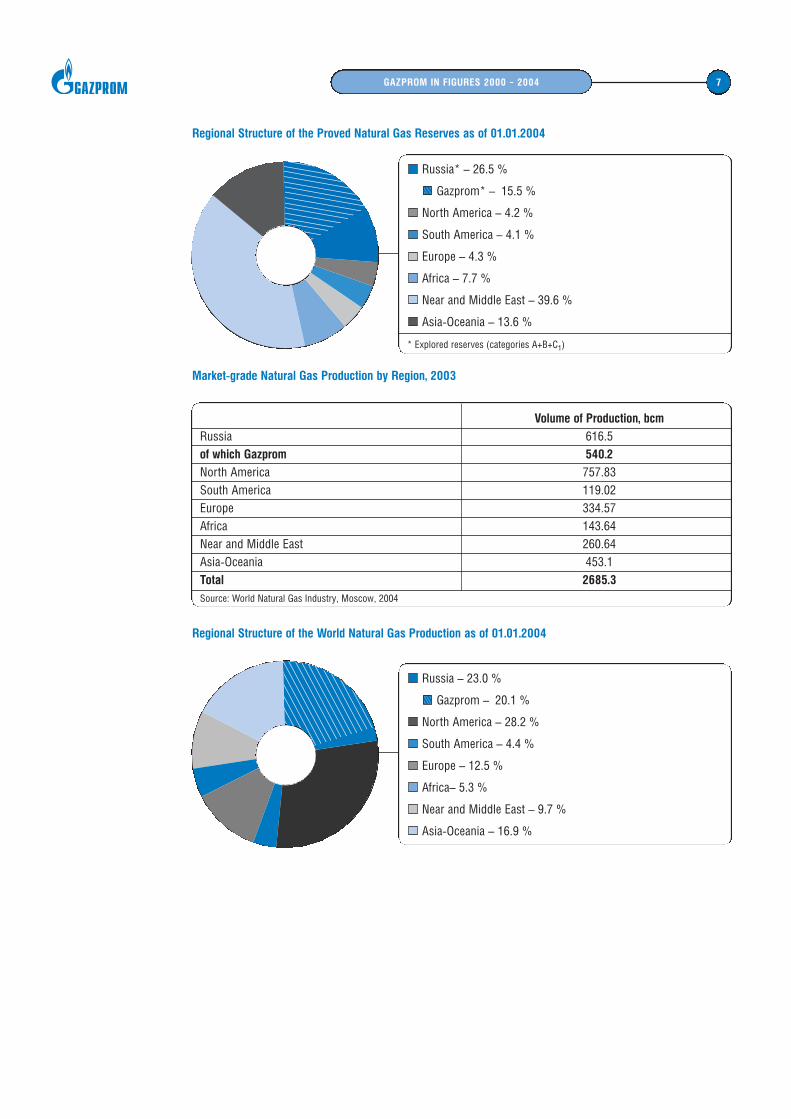
Regional Structure of the Proved Natural Gas Reserves as of 01.01.2004
Market-grade Natural Gas Production by Region, 2003
Regional Structure of the World Natural Gas Production as of 01.01.2004
7GAZPROM IN FIGURES 2000 – 2004
Volume of Production, bcm
Russia 616.5of which Gazprom 540.2
North America 757.83South America 119.02Europe 334.57Africa 143.64Near and Middle East 260.64Asia-Oceania 453.1Total 2685.3
Source: World Natural Gas Industry, Moscow, 2004
Russia* – 26.5 %
Gazprom* – 15.5 %
North America – 4.2 %
South America – 4.1 %
Europe – 4.3 %
Africa – 7.7 %
Near and Middle East – 39.6 %
Asia-Oceania – 13.6 %
* Explored reserves (categories A+B+C1)
Russia – 23.0 %
Gazprom – 20.1 %
North America – 28.2 %
South America – 4.4 %
Europe – 12.5 %
Africa– 5.3 %
Near and Middle East – 9.7 %
Asia-Oceania – 16.9 %
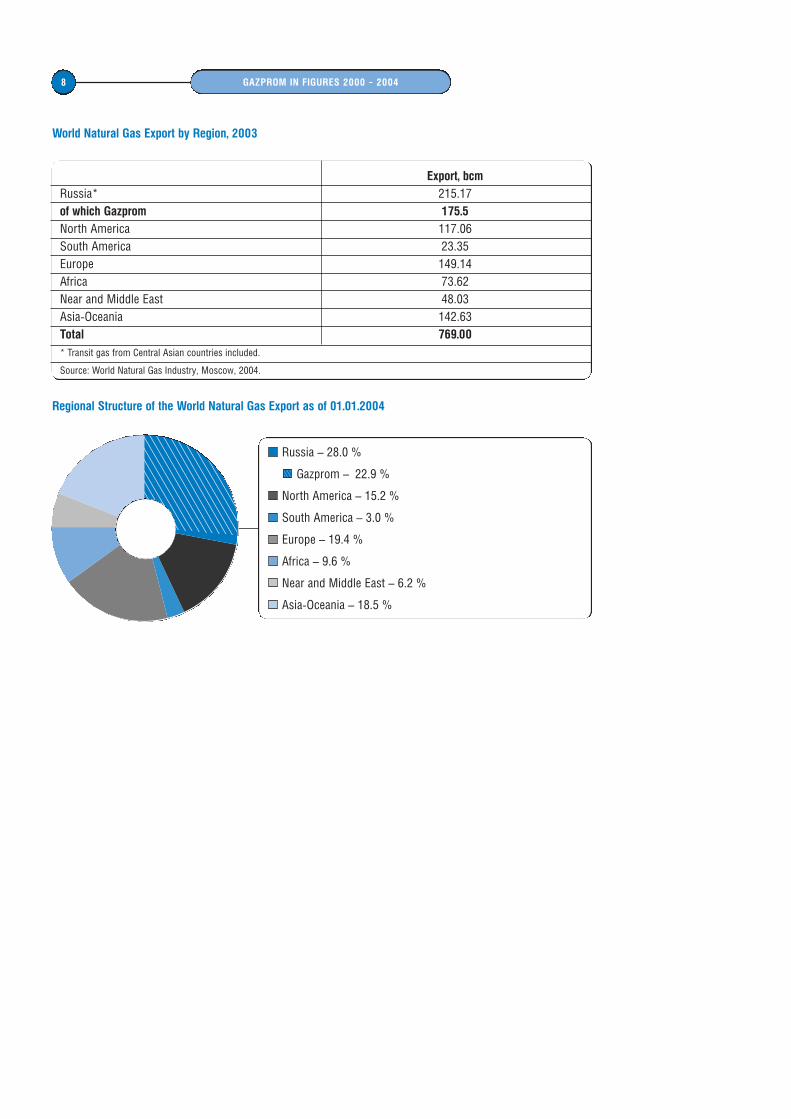
World Natural Gas Export by Region, 2003
Regional Structure of the World Natural Gas Export as of 01.01.2004
8 GAZPROM IN FIGURES 2000 – 2004
Export, bcm
Russia* 215.17of which Gazprom 175.5
North America 117.06South America 23.35Europe 149.14Africa 73.62Near and Middle East 48.03Asia-Oceania 142.63Total 769.00
* Transit gas from Central Asian countries included.
Source: World Natural Gas Industry, Moscow, 2004.
Russia – 28.0 %
Gazprom – 22.9 %
North America – 15.2 %
South America – 3.0 %
Europe – 19.4 %
Africa – 9.6 %
Near and Middle East – 6.2 %
Asia-Oceania – 18.5 %
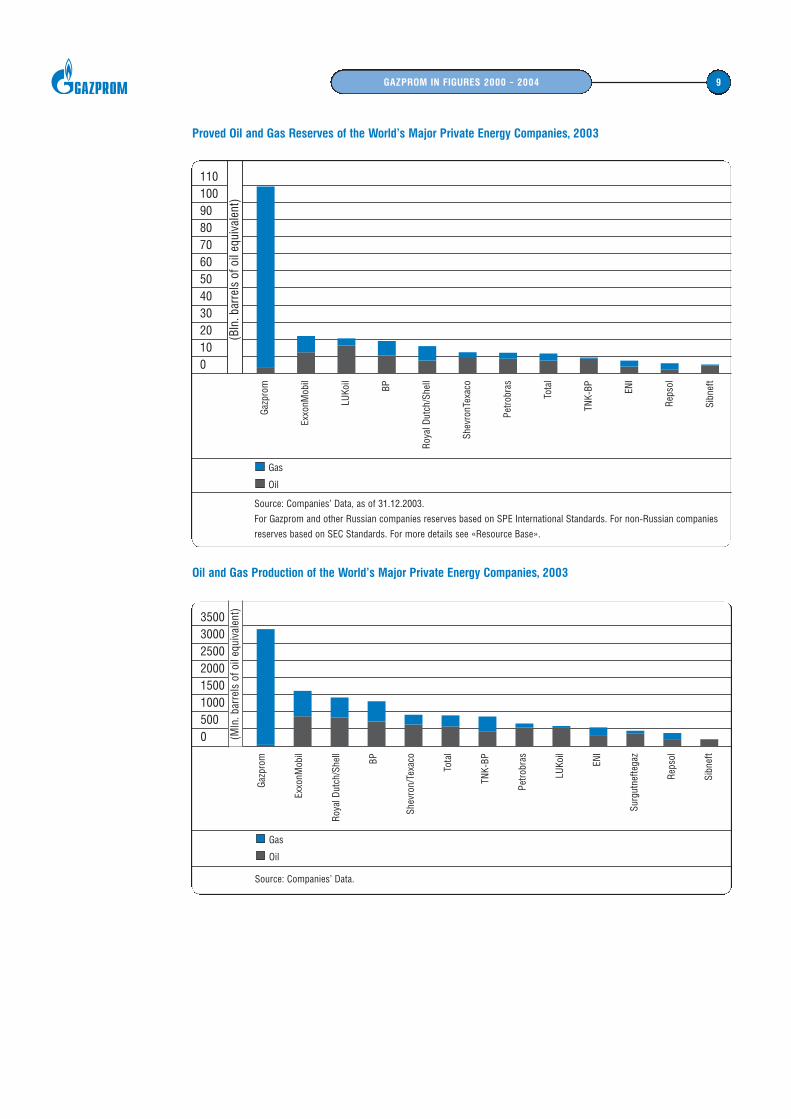
Proved Oil and Gas Reserves of the World’s Major Private Energy Companies, 2003
Oil and Gas Production of the World’s Major Private Energy Companies, 2003
9GAZPROM IN FIGURES 2000 – 2004
1101009080706050403020100
Gas
Oil
Source: Companies’ Data, as of 31.12.2003.
For Gazprom and other Russian companies reserves based on SPE International Standards. For non-Russian companies
reserves based on SEC Standards. For more details see «Resource Base».
(Bln
. bar
rels
of o
il eq
uiva
lent
)
Gazp
rom
Exxo
nMob
il
LUKo
il
BP
Roya
l Dut
ch/S
hell
Shev
ronT
exac
o
Petro
bras
Tota
l
TNK-
BP ENI
Reps
ol
Sibn
eft
3500300025002000150010005000
Gas
Oil
Source: Companies’ Data.
(Mln
. bar
rels
of o
il eq
uiva
lent
)
Gazp
rom
Exxo
nMob
il
Roya
l Dut
ch/S
hell
BP
Shev
ron/
Texa
co
Tota
l
TNK-
BP
Petro
bras
LUKo
il
ENI
Surg
utne
ftega
z
Reps
ol
Sibn
eft
10 GAZPROM IN FIGURES 2000 – 2004
Yam
burg
gazd
obyc
haU
reng
oiga
zpro
mAc
him
gaz
Nad
ymga
zpro
m Noy
abrs
kgaz
doby
cha
Surg
utga
zpro
m
Tom
sktra
nsga
z
Tyum
entra
nsga
z
Seve
rgaz
prom
KazR
osGa
z
Astra
khan
gazp
rom
Kasp
iyga
zpro
m
Arm
rosg
az
Kavk
aztra
nsga
z
Volg
ogra
dtra
nsga
z
Kuba
ngaz
prom
Turu
sgaz
,Bo
sfor
us G
as C
orpo
ratio
nPr
omet
heus
Gas
Tope
nerg
yO
verg
az
Prom
gazPa
nrus
gaz
Slov
rusg
azFr
agaz
Gazp
rom
(UK)
Tra
ding
Gazp
rom
Fin
ance
BV
WIE
H,
Win
gaz
Gasu
m, N
orth
Tra
nsga
s
EuRo
Pol G
AZ
Lent
rans
gaz
Eest
i Gaa
s
Latv
ias
Gaze
Stel
la V
itae,
Liet
uvos
Duj
os
Mos
trans
gaz Vo
lgot
rans
gaz
Yugt
rans
gaz
Perm
trans
gaz U
raltr
ansg
az
Ore
nbur
ggaz
prom
Sam
arat
rans
gaz
Tattr
ansg
azBa
shtra
nsga
z
Mol
dova
gaz
Gas
und
War
enha
ndel
sges
ells
chaf
tGa
s Tr
adin
gGa
z-In
vest
Balti
c LN
G,Ga
z Pr
ojec
t Dev
elop
men
t Cen
tral A
sia
Join
t ven
ture
s w
ith fo
reig
n pa
rtne
rs
100%
-ow
ned
subs
idia
ries
Gaz
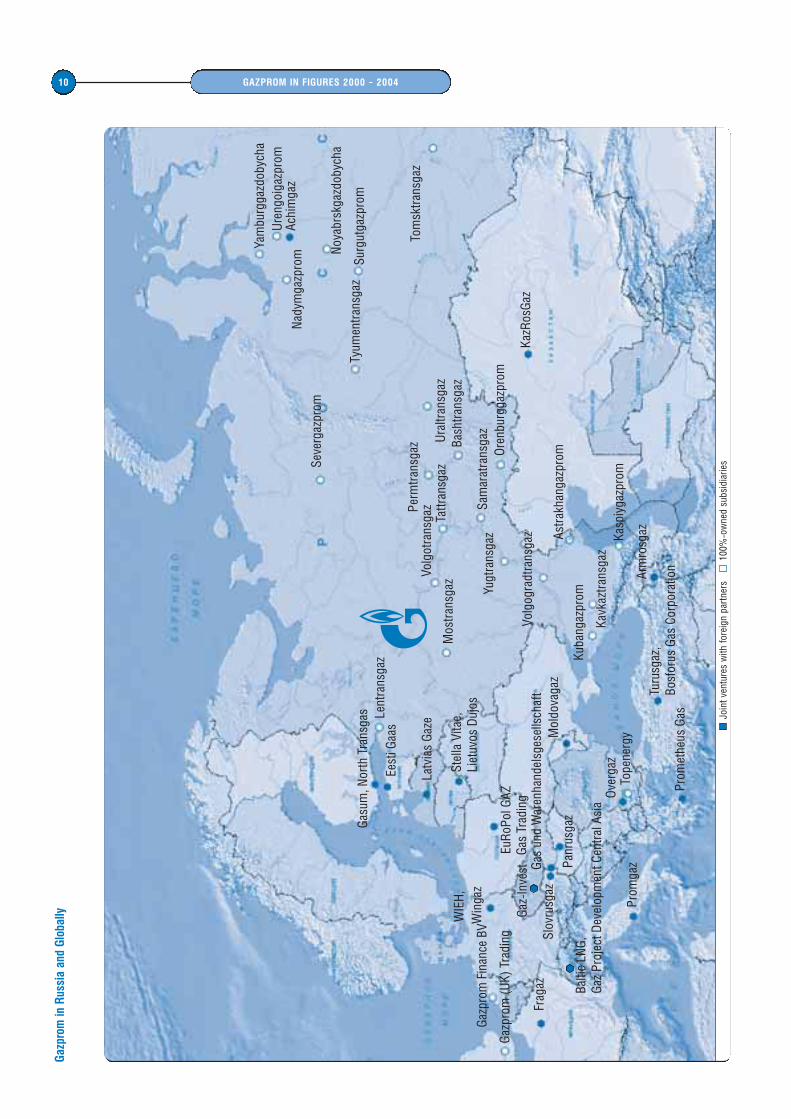
prom
in R
ussi
a an
d G
loba
lly
11GAZPROM IN FIGURES 2000 – 2004
GAZPROM AND RUSSIAN ECONOMY
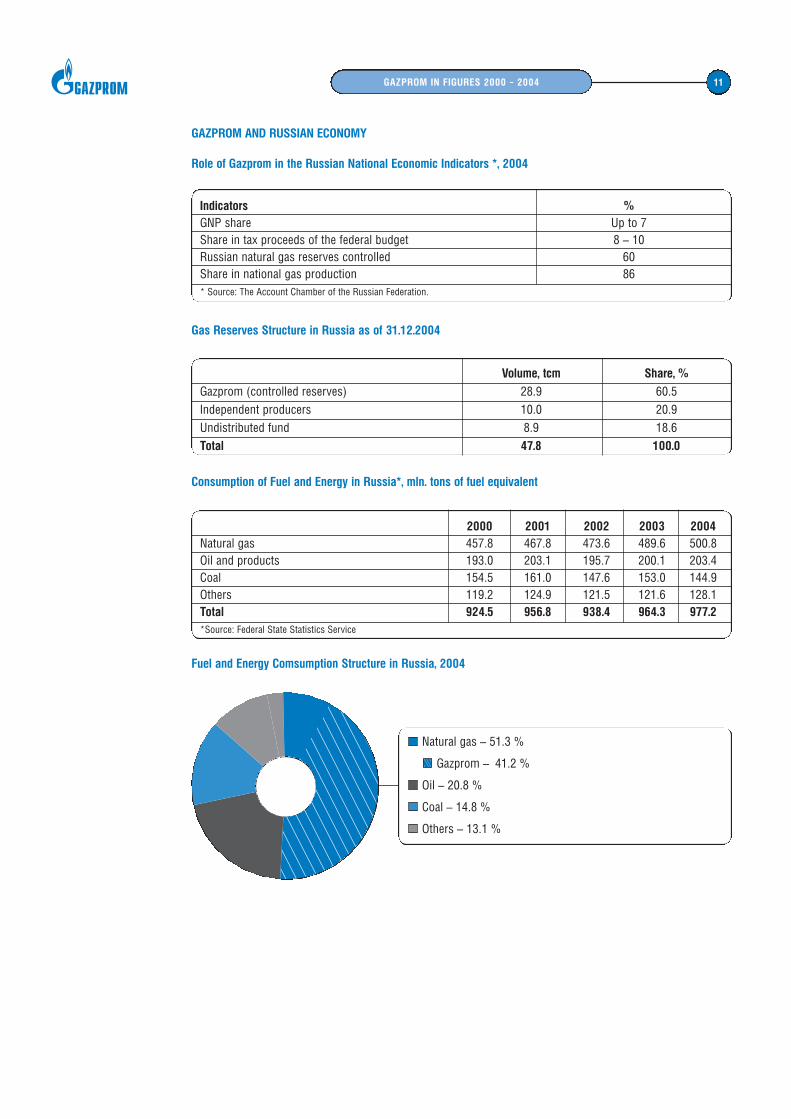
Role of Gazprom in the Russian National Economic Indicators *, 2004
Gas Reserves Structure in Russia as of 31.12.2004
Consumption of Fuel and Energy in Russia*, mln. tons of fuel equivalent
Fuel and Energy Comsumption Structure in Russia, 2004
Indicators %GNP share Up to 7Share in tax proceeds of the federal budget 8 – 10Russian natural gas reserves controlled 60Share in national gas production 86* Source: The Account Chamber of the Russian Federation.
Volume, tcm Share, %
Gazprom (controlled reserves) 28.9 60.5Independent producers 10.0 20.9Undistributed fund 8.9 18.6Total 47.8 100.0
2000 2001 2002 2003 2004Natural gas 457.8 467.8 473.6 489.6 500.8Oil and products 193.0 203.1 195.7 200.1 203.4Coal 154.5 161.0 147.6 153.0 144.9Others 119.2 124.9 121.5 121.6 128.1Total 924.5 956.8 938.4 964.3 977.2*Source: Federal State Statistics Service
Natural gas – 51.3 %
Gazprom – 41.2 %
Oil – 20.8 %
Coal – 14.8 %
Others – 13.1 %
12 GAZPROM IN FIGURES 2000 – 2004
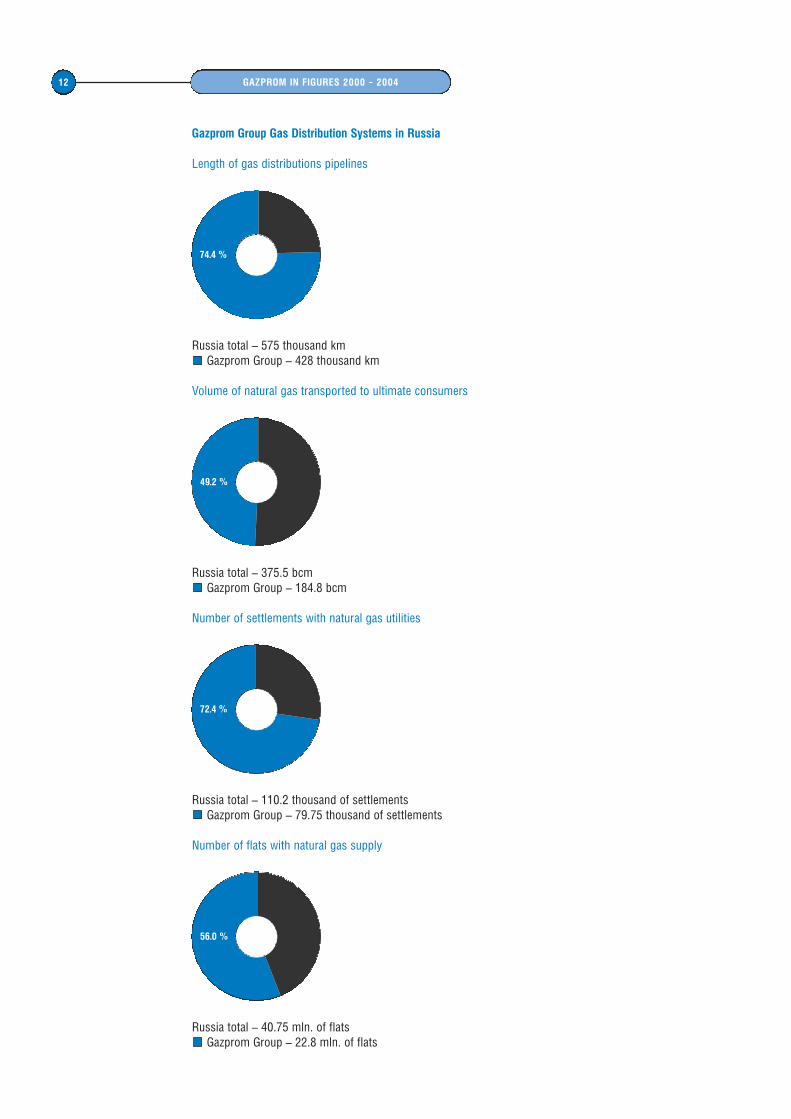
Gazprom Group Gas Distribution Systems in Russia
Length of gas distributions pipelines
Russia total – 575 thousand kmGazprom Group – 428 thousand km
Volume of natural gas transported to ultimate consumers
Russia total – 375.5 bcmGazprom Group – 184.8 bcm
Number of settlements with natural gas utilities
Russia total – 110.2 thousand of settlementsGazprom Group – 79.75 thousand of settlements
Number of flats with natural gas supply
Russia total – 40.75 mln. of flats Gazprom Group – 22.8 mln. of flats
74.4 %
49.2 %
72.4 %
56.0 %
13GAZPROM IN FIGURES 2000 – 2004
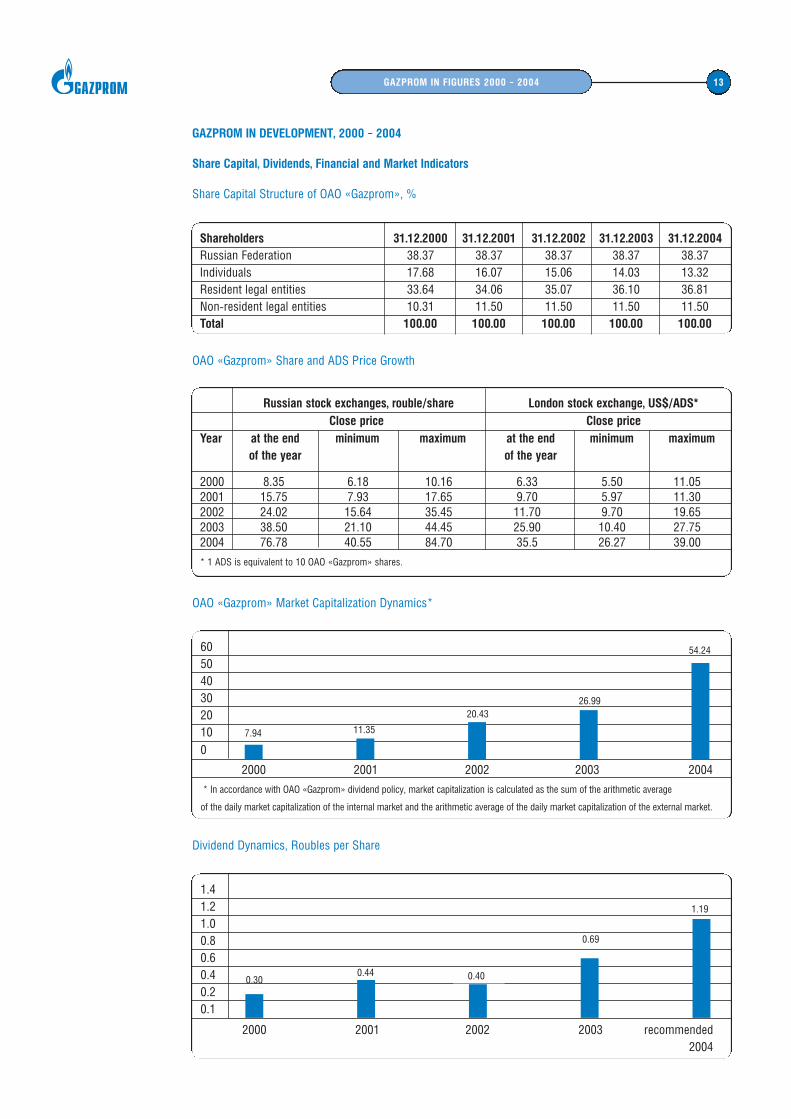
GAZPROM IN DEVELOPMENT, 2000 – 2004
Share Capital, Dividends, Financial and Market Indicators
Share Capital Structure of OAO «Gazprom», %
OAO «Gazprom» Share and ADS Price Growth
OAO «Gazprom» Market Capitalization Dynamics*
Dividend Dynamics, Roubles per Share
Shareholders 31.12.2000 31.12.2001 31.12.2002 31.12.2003 31.12.2004Russian Federation 38.37 38.37 38.37 38.37 38.37Individuals 17.68 16.07 15.06 14.03 13.32Resident legal entities 33.64 34.06 35.07 36.10 36.81Non-resident legal entities 10.31 11.50 11.50 11.50 11.50Total 100.00 100.00 100.00 100.00 100.00
Russian stock exchanges, rouble/share London stock exchange, US$/ADS*
Close price Close price
Year at the end minimum maximum at the end minimum maximumof the year of the year
2000 8.35 6.18 10.16 6.33 5.50 11.052001 15.75 7.93 17.65 9.70 5.97 11.302002 24.02 15.64 35.45 11.70 9.70 19.652003 38.50 21.10 44.45 25.90 10.40 27.752004 76.78 40.55 84.70 35.5 26.27 39.00
* 1 ADS is equivalent to 10 OAO «Gazprom» shares.
6050403020100
2000 2001 2002 2003 2004
* In accordance with OAO «Gazprom» dividend policy, market capitalization is calculated as the sum of the arithmetic average
of the daily market capitalization of the internal market and the arithmetic average of the daily market capitalization of the external market.
1.41.21.00.80.60.40.20.1
2000 2001 2002 2003 recommended2004
7.94 11.35
20.4326.99
54.24
1.19
0.69
0.300.44 0.40
14 GAZPROM IN FIGURES 2000 – 2004
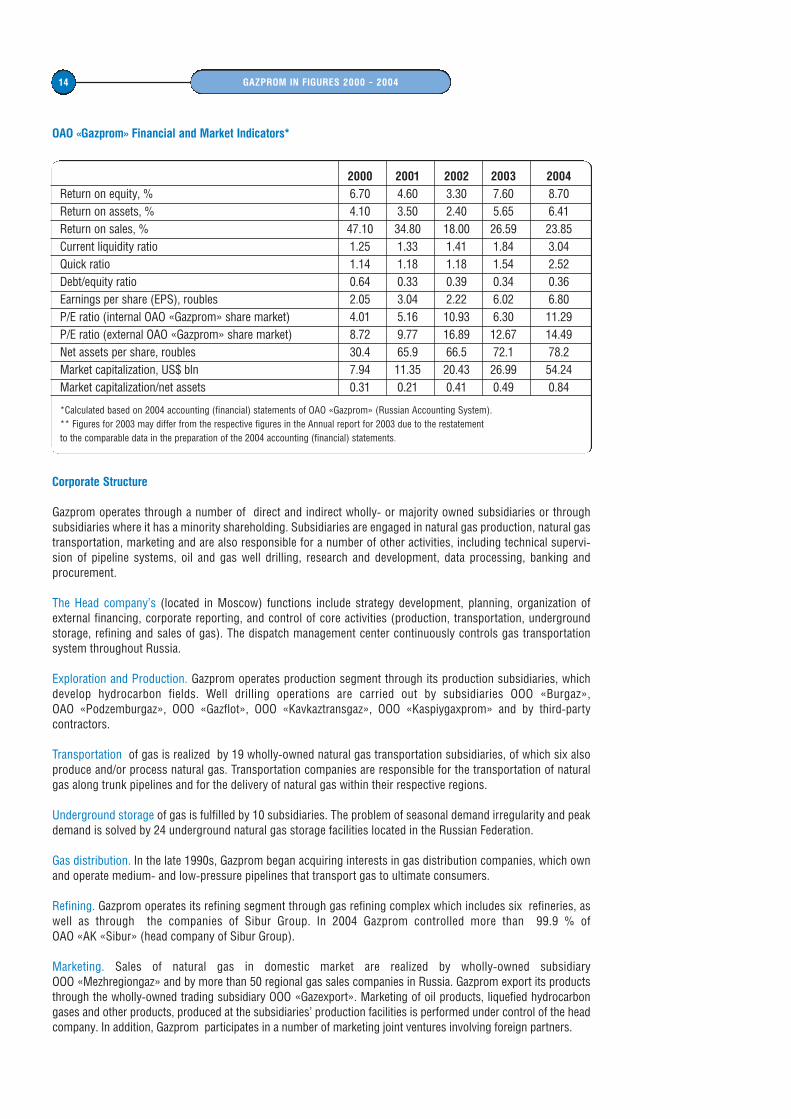
OAO «Gazprom» Financial and Market Indicators*
Corporate Structure
Gazprom operates through a number of direct and indirect wholly- or majority owned subsidiaries or throughsubsidiaries where it has a minority shareholding. Subsidiaries are engaged in natural gas production, natural gastransportation, marketing and are also responsible for a number of other activities, including technical supervi-sion of pipeline systems, oil and gas well drilling, research and development, data processing, banking andprocurement.
The Head company’s (located in Moscow) functions include strategy development, planning, organization ofexternal financing, corporate reporting, and control of core activities (production, transportation, undergroundstorage, refining and sales of gas). The dispatch management center continuously controls gas transportationsystem throughout Russia.
Exploration and Production. Gazprom operates production segment through its production subsidiaries, whichdevelop hydrocarbon fields. Well drilling operations are carried out by subsidiaries OOO «Burgaz», OAO «Podzemburgaz», OOO «Gazflot», OOO «Kavkaztransgaz», OOO «Kaspiygaxprom» and by third-party contractors.
Transportation of gas is realized by 19 wholly-owned natural gas transportation subsidiaries, of which six alsoproduce and/or process natural gas. Transportation companies are responsible for the transportation of naturalgas along trunk pipelines and for the delivery of natural gas within their respective regions.
Underground storage of gas is fulfilled by 10 subsidiaries. The problem of seasonal demand irregularity and peakdemand is solved by 24 underground natural gas storage facilities located in the Russian Federation.
Gas distribution. In the late 1990s, Gazprom began acquiring interests in gas distribution companies, which ownand operate medium- and low-pressure pipelines that transport gas to ultimate consumers.
Refining. Gazprom operates its refining segment through gas refining complex which includes six refineries, aswell as through the companies of Sibur Group. In 2004 Gazprom controlled more than 99.9 % of OAO «AK «Sibur» (head company of Sibur Group).
Marketing. Sales of natural gas in domestic market are realized by wholly-owned subsidiary OOO «Mezhregiongaz» and by more than 50 regional gas sales companies in Russia. Gazprom export its productsthrough the wholly-owned trading subsidiary OOO «Gazexport». Marketing of oil products, liquefied hydrocarbongases and other products, produced at the subsidiaries’ production facilities is performed under control of the headcompany. In addition, Gazprom participates in a number of marketing joint ventures involving foreign partners.
2000 2001 2002 2003 2004
Return on equity, % 6.70 4.60 3.30 7.60 8.70Return on assets, % 4.10 3.50 2.40 5.65 6.41Return on sales, % 47.10 34.80 18.00 26.59 23.85Current liquidity ratio 1.25 1.33 1.41 1.84 3.04Quick ratio 1.14 1.18 1.18 1.54 2.52Debt/equity ratio 0.64 0.33 0.39 0.34 0.36Earnings per share (EPS), roubles 2.05 3.04 2.22 6.02 6.80P/E ratio (internal OAO «Gazprom» share market) 4.01 5.16 10.93 6.30 11.29P/E ratio (external OAO «Gazprom» share market) 8.72 9.77 16.89 12.67 14.49Net assets per share, roubles 30.4 65.9 66.5 72.1 78.2Market capitalization, US$ bln 7.94 11.35 20.43 26.99 54.24Market capitalization/net assets 0.31 0.21 0.41 0.49 0.84
*Calculated based on 2004 accounting (financial) statements of OAO «Gazprom» (Russian Accounting System). ** Figures for 2003 may differ from the respective figures in the Annual report for 2003 due to the restatement to the comparable data in the preparation of the 2004 accounting (financial) statements.
15GAZPROM IN FIGURES 2000 – 2004
Other activities. The Gazprom Group is also engaged in various non-core activities that support the main busi-ness. These activities include technical supervision, maintenance and reconstruction of the Unified Gas SupplySystem, research and development, production of construction and telecommunications equipment. The Gazprom Group is also: the main shareholder of AB «Gazprombank» (ZAO), which meets most of our domes-tic banking needs (other than borrowings); the founder of NPF «Gazfund», the largest non-government pensionfund in Russia, which provides pension services to employees of Gazprom; the shareholder of insurance com-pany OAO «Sogaz». Gazprom also has shareholding in various other businesses that are not related to its coreoperations. These include Gazprom-Media, a holding company that owns various mass media assets, othermedia companies, agricultural, power, construction, medical care,and telecommunications activities.
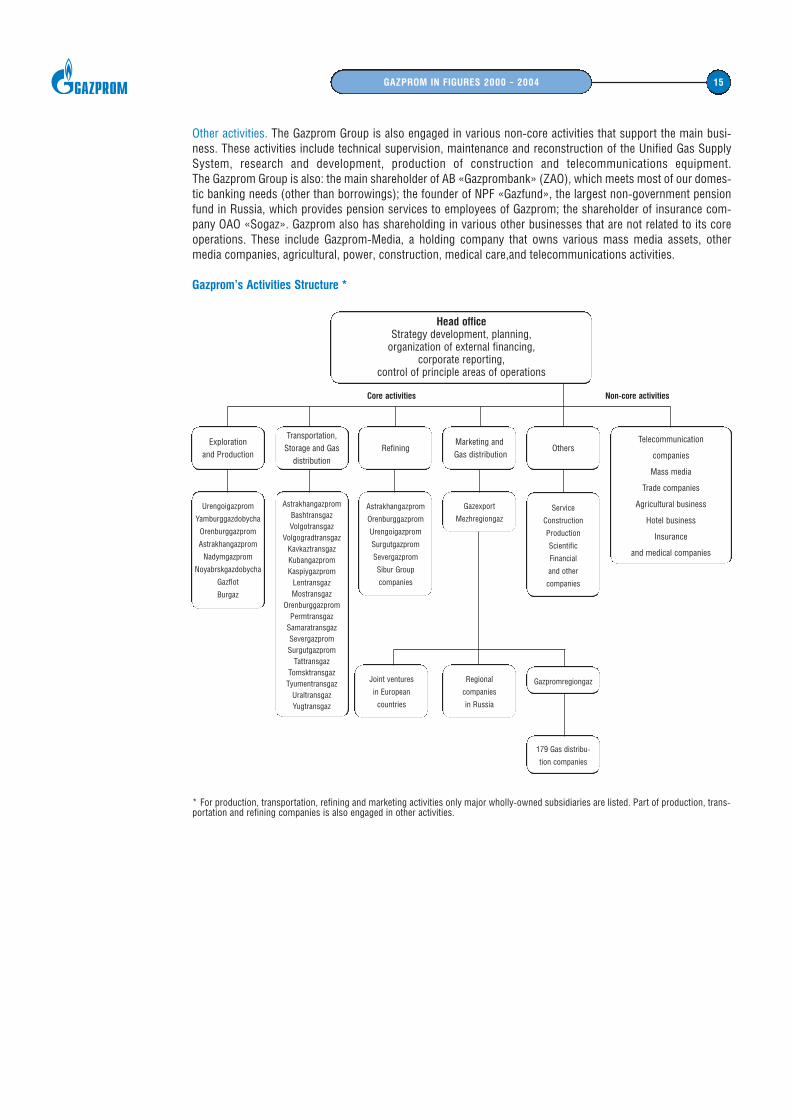
Gazprom’s Activities Structure *
Head officeStrategy development, planning,
organization of external financing, corporate reporting,
control of principle areas of operations
Urengoigazprom
Yamburggazdobycha
Orenburggazprom
Astrakhangazprom
Nadymgazprom
Noyabrskgazdobycha
Gazflot
Burgaz
AstrakhangazpromBashtransgazVolgotransgaz
VolgogradtransgazKavkaztransgazKubangazpromKaspiygazprom
LentransgazMostransgaz
OrenburggazpromPermtransgaz
SamaratransgazSevergazpromSurgutgazprom
TattransgazTomsktransgaz
TyumentransgazUraltransgazYugtransgaz
Gazexport
MezhregiongazService
Construction
Production
Scientific
Financial
and other
companies
Astrakhangazprom
Orenburggazprom
Urengoigazprom
Surgutgazprom
Severgazprom
Sibur Group
companies
Joint ventures
in European
countries
Regional
companies
in Russia
Gazpromregiongaz
179 Gas distribu-
tion companies
Telecommunication
companies
Mass media
Trade companies
Agricultural business
Hotel business
Insurance
and medical companies
Exploration and Production
Transportation,Storage and Gas
distributionRefining
Marketing andGas distribution
Others
Core activities Non-core activities
* For production, transportation, refining and marketing activities only major wholly-owned subsidiaries are listed. Part of production, trans-portation and refining companies is also engaged in other activities.
16 GAZPROM IN FIGURES 2000 – 2004
Resource Base
Main Differences Between Russian Reserves System and International Standards
Hydrocarbon reserves of the Gazprom Group are estimated using both the Russian reserves system and method-ologies developed by the Society of Petroleum Engineers («SPE International Standards»). Since 1997, DeGolyerand MacNaughton, an independent U.S. petroleum engineering consulting firm, has evaluated Gazprom reservesaccording to SPE International Standards.
The Russian reserves system differs significantly from the internationally accepted classifications in particularwith respect to the manner in which and the extent to which commercial factors are taken into account in calcu-lating reserves.
The Russian reserves system
The Russian reserves system is based solely on an analysis of the geological attributes of reserves and take intoconsideration the actual physical presence of hydrocarbons in geological formations or the probability of suchphysical presence. Explored reserves are represented by categories A, B, and C1; preliminary estimated reservesare represented by category C2; prospective resources are represented by category C3; and forecasted resourcesare represented by the categories D1 and D2.
Natural gas reserves in categories A, B and C1 are considered to be fully extractable. For reserves of oil and gascondensate, a predicted coefficient of extraction is calculated based on geological and technical factors.
Category A reserves are calculated on the part of a deposit drilled in accordance with an approved developmentproject for the oil or natural gas field. They represent reserves that have been analyzed in sufficient detail.
Category B represents the reserves of a deposit (or portion thereof), the oil or gas content of which has beendetermined on the basis of commercial flows of oil or gas obtained in wells at various hypsometric depths. Themain parameters and the major features of the deposit that determine the conditions of its development havebeen studied in sufficient detail to draw up a project to develop the deposit.
Category C1 represents the reserves of a deposit (or of a portion thereof), the oil or gas content of which hasbeen determined on the basis of commercial flows of oil or gas obtained in wells and positive results of geo-physical exploration of non-probed wells. Category C1 reserves are computed on the basis of results of geo-physical exploration work and production drilling and must have been studied in sufficient detail to yield datafrom which to draw up either a trial industrial development project in the case of a natural gas field or a techno-logical development scheme in the case of an oil field.
SPE International Standards
SPE International Standards take into account not only the probability that hydrocarbons are physically presentin a given geological formation but also the economic viability of recovering the reserves. Exploration and drillingcosts, ongoing production costs, transportation costs, taxes, prevailing prices for the products, and other fac-tors that influence the economic viability of a given deposit are taken into consideration.
Under SPE International Standards, reserves are classified as proved, probable and possible.
Proved reserves include reserves that are confirmed with a high degree of certainty through an analysis of thedevelopment history and/or volume method analysis of the relevant geological and engineering data. Provedreserves are those that have a better than 90 % chance of being produced.
Probable reserves are those reserves in which hydrocarbons have been located within the geological structurewith a lesser degree of certainty because fewer wells have been drilled and/or certain operational tests have notbeen conducted. Probable reserves are those reserves that have a better than 50 % chance of being produced.
17GAZPROM IN FIGURES 2000 – 2004
An evaluation of proved and probable natural gas reserves naturally involves multiple uncertainties. The accura-cy of any reserves evaluation depends on the quality of available information and engineering and geologicalinterpretation. Based on the results of drilling, testing and production after the audit date, reserves may be sig-nificantly restated upwards or downwards. Changes in the price of natural gas, gas condensate or oil may alsoaffect proved and probable reserves estimates, as well as estimates of future net revenues and present worth,because the reserves are evaluated, and the future net revenues and present worth are estimated, based on pricesand costs as of the audit date.
Besides SPE International Standards, American methodology of reserves evaluation is widely spread throughoutthe world, based on stricter standards of US Securities and Exchange Commission (SEC). Companies trading inNYSE should be consistent with SEC standards. The main difference between these two standards is that underSPE International Standards, proved reserves are projected to the economic production life of the evaluated fields,while under SEC Standards, oil and gas deposits may be classified as proved reserves only if they will be recov-ered before the expiration of a current license period. License period may be substantially shorter that produc-tion life of a field. Moreover, SEC Standards are stricter with respect to certainty of reserves existence.
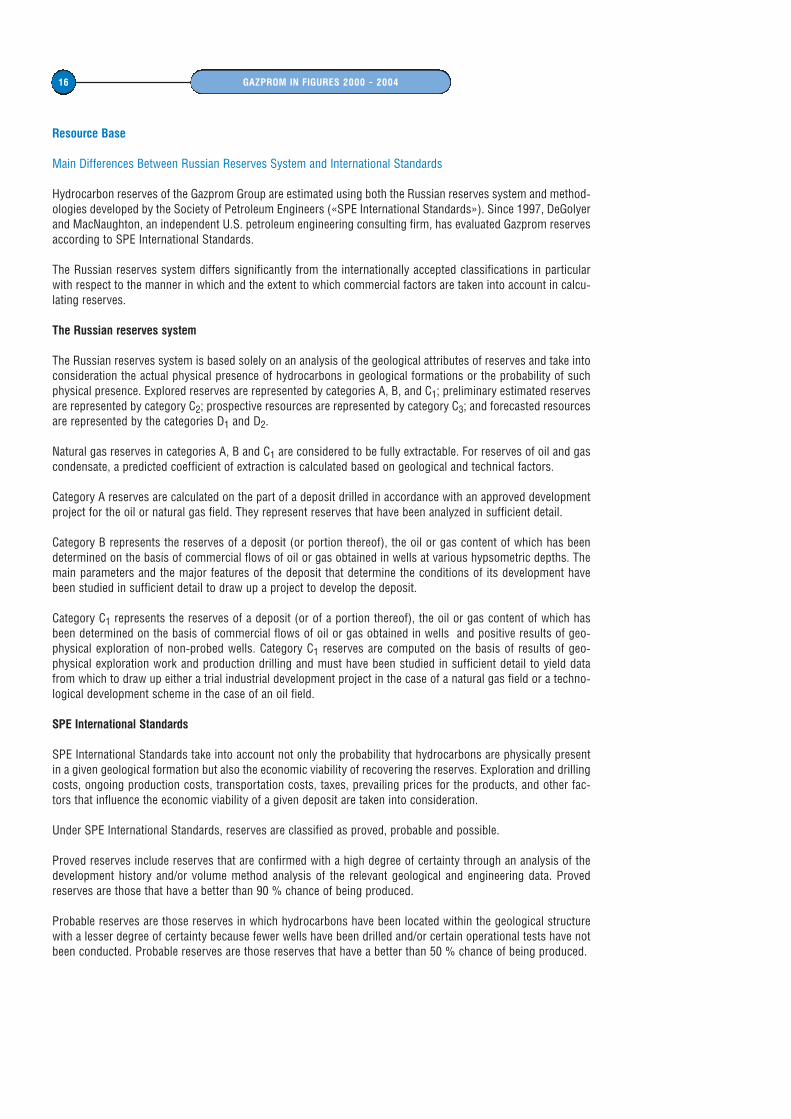
Gazprom Group Licenses as of 01.01.2005.
Type of licenseExploration, Exploration Exploration Totalassessment and production and assessment
and productionOAO Kubangazprom 3 35 1 39OAO Kavkaztransgaz 13 4 17OAO Nadymgazprom 6 5 11OAO Orenburggazprom 1 1 9 11OOO Severgazprom 4 7 11OAO Gazprom 2 7 9OAO Uralneftegazprom 6 6OAO Noyabrskgazdobycha 4 1 5ZAO Pechorneftegazprom 5 5OAO Tomskgazprom 5 5OAO Kaspiygazprom 4 4OOO Urengoigazprom 3 1 4OAO Krasnoyarskgazprom 2 1 3OOO Tyumentransgaz 3 3OOO Yamburggazdobycha 1 2 3OAO Astrakhangazprom 1 1 2ZAO Sevmorneftegaz 2 2OAO Serviceneftegaz 1 1 2OOO Surgutgazprom 1 1 2OAO Zapsibgazprom 1 1OOO Caspian NK 1 1OOO Nortgas 1 1ZAO Purgaz 1 1OAO Purgazdobycha 1 1OAO Severneftegazprom 1 1ZAO Stimul 1 1OAO Uralneft 1 1OOO Uraltransgaz 1 1OOO TsentrCaspNeftegaz 1 1Total 19 96 39 154
18 GAZPROM IN FIGURES 2000 – 2004
Gazprom’s Hydrocarbon Reserves (categories A+ B+ C1) *
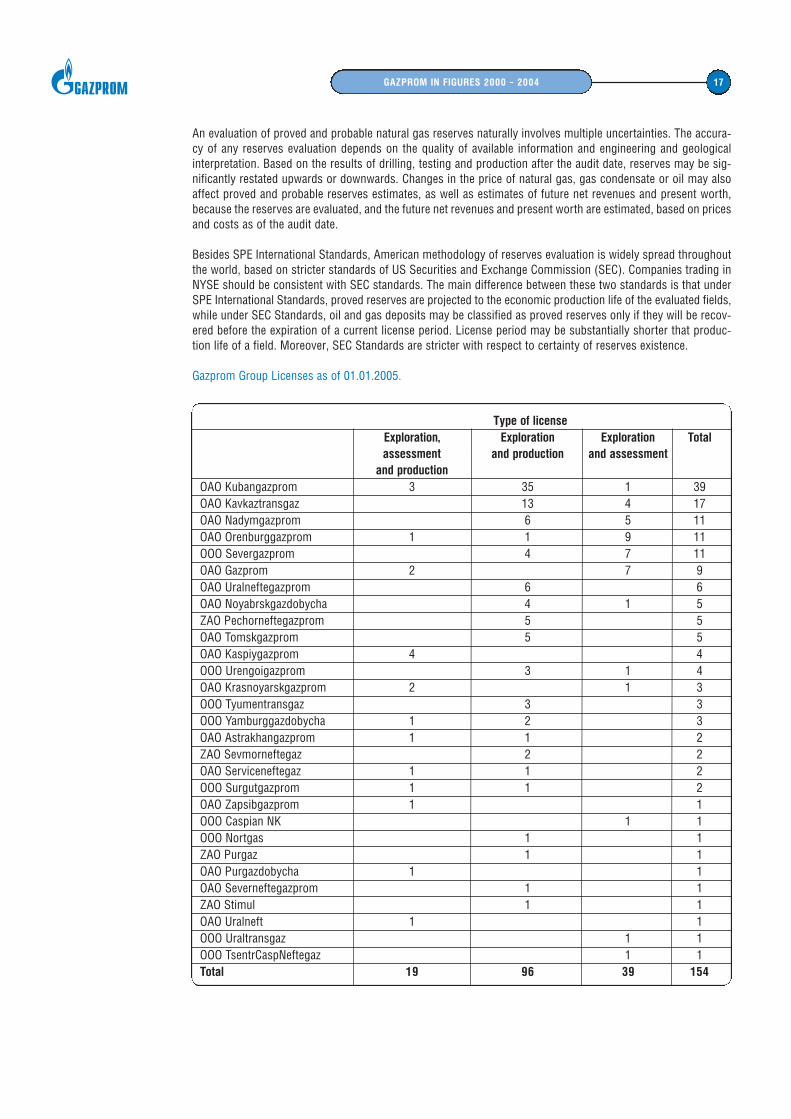
Location of Gas Reserves (categories A+ B+C1) by Russian Regions and Gazprom’s Major Gas Fields
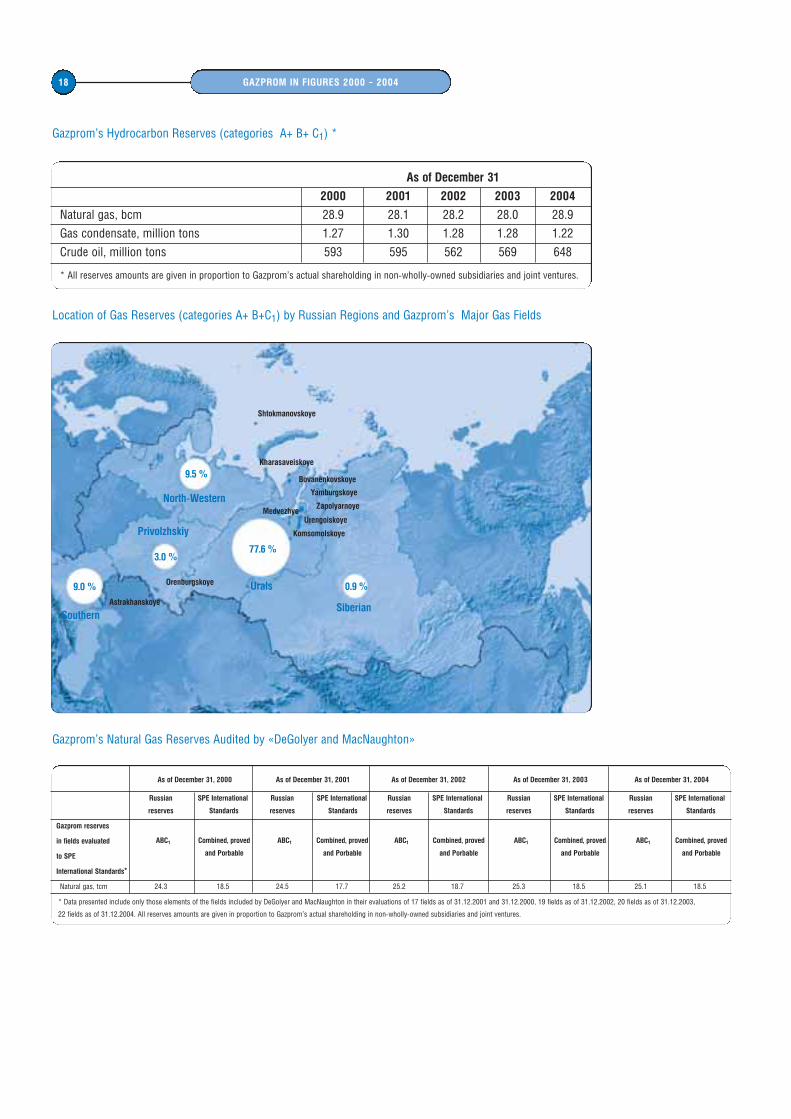
Gazprom’s Natural Gas Reserves Audited by «DeGolyer and MacNaughton»
As of December 31
2000 2001 2002 2003 2004
Natural gas, bcm 28.9 28.1 28.2 28.0 28.9
Gas condensate, million tons 1.27 1.30 1.28 1.28 1.22
Crude oil, million tons 593 595 562 569 648
* All reserves amounts are given in proportion to Gazprom’s actual shareholding in non-wholly-owned subsidiaries and joint ventures.
9.5 %
3.0 %
9.0 %
77.6 %
0.9 %
North-Western
Privolzhskiy
Urals
SiberianSouthern
Astrakhanskoye
Orenburgskoye
Komsomolskoye
Urengoiskoye
Zapolyarnoye
Yamburgskoye
Medvezhye
Bovanenkovskoye
Kharasaveiskoye
Shtokmanovskoye
As of December 31, 2000 As of December 31, 2001 As of December 31, 2002 As of December 31, 2003 As of December 31, 2004
Russian SPE International Russian SPE International Russian SPE International Russian SPE International Russian SPE International
reserves Standards reserves Standards reserves Standards reserves Standards reserves Standards
Gazprom reserves
in fields evaluated
to SPE
International Standards*
Natural gas, tcm 24.3 18.5 24.5 17.7 25.2 18.7 25.3 18.5 25.1 18.5
* Data presented include only those elements of the fields included by DeGolyer and MacNaughton in their evaluations of 17 fields as of 31.12.2001 and 31.12.2000, 19 fields as of 31.12.2002, 20 fields as of 31.12.2003,
22 fields as of 31.12.2004. All reserves amounts are given in proportion to Gazprom’s actual shareholding in non-wholly-owned subsidiaries and joint ventures.
АВC1 Combined, proved АВC1 Combined, proved АВC1 Combined, proved АВC1 Combined, proved АВC1 Combined, proved
and Porbable and Porbable and Porbable and Porbable and Porbable
19GAZPROM IN FIGURES 2000 – 2004
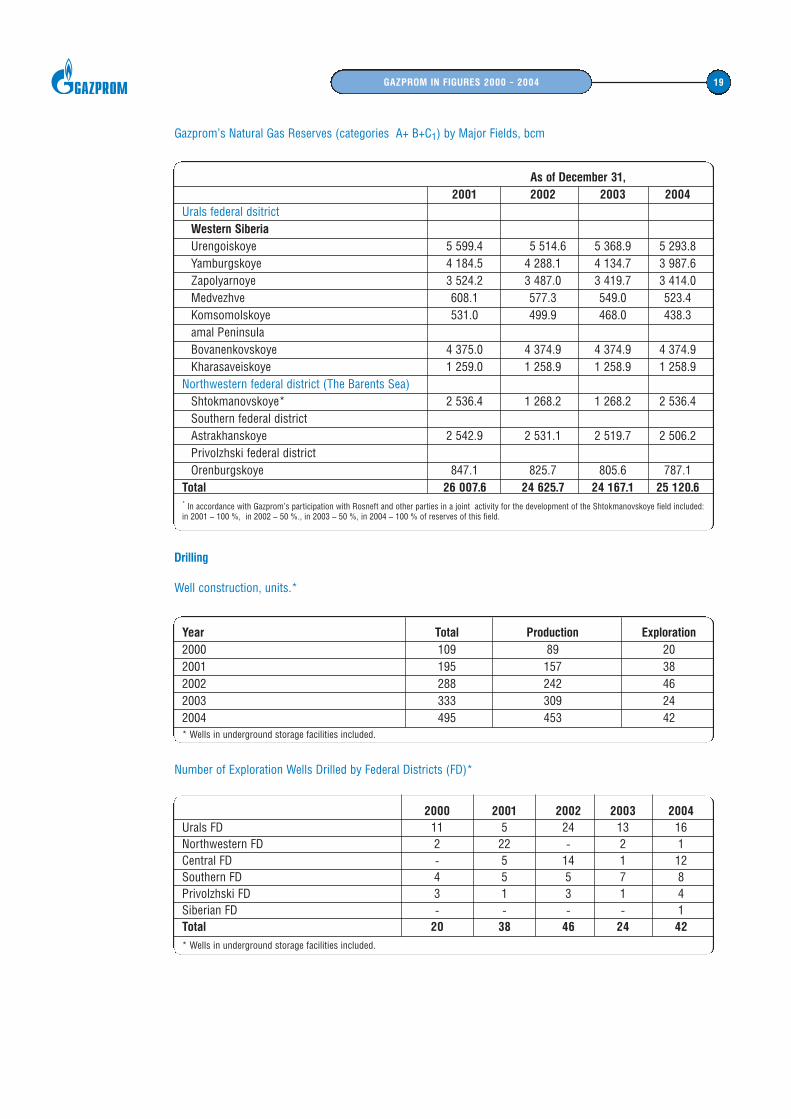
Gazprom’s Natural Gas Reserves (categories A+ B+C1) by Major Fields, bcm
Drilling
Well construction, units.*
Number of Exploration Wells Drilled by Federal Districts (FD)*
As of December 31,2001 2002 2003 2004
Urals federal dsitrictWestern SiberiaUrengoiskoye 5 599.4 5 514.6 5 368.9 5 293.8Yamburgskoye 4 184.5 4 288.1 4 134.7 3 987.6Zapolyarnoye 3 524.2 3 487.0 3 419.7 3 414.0Medvezhve 608.1 577.3 549.0 523.4Komsomolskoye 531.0 499.9 468.0 438.3amal PeninsulaBovanenkovskoye 4 375.0 4 374.9 4 374.9 4 374.9Kharasaveiskoye 1 259.0 1 258.9 1 258.9 1 258.9
Northwestern federal district (The Barents Sea)Shtokmanovskoye* 2 536.4 1 268.2 1 268.2 2 536.4Southern federal districtAstrakhanskoye 2 542.9 2 531.1 2 519.7 2 506.2Privolzhski federal district Orenburgskoye 847.1 825.7 805.6 787.1
Total 26 007.6 24 625.7 24 167.1 25 120.6* In accordance with Gazprom’s participation with Rosneft and other parties in a joint activity for the development of the Shtokmanovskoye field included: in 2001 – 100 %, in 2002 – 50 %., in 2003 – 50 %, in 2004 – 100 % of reserves of this field.
2000 2001 2002 2003 2004 Urals FD 11 5 24 13 16Northwestern FD 2 22 - 2 1Central FD - 5 14 1 12Southern FD 4 5 5 7 8Privolzhski FD 3 1 3 1 4Siberian FD - - - - 1Total 20 38 46 24 42
* Wells in underground storage facilities included.
Year Total Production Exploration2000 109 89 202001 195 157 382002 288 242 462003 333 309 242004 495 453 42* Wells in underground storage facilities included.
20 GAZPROM IN FIGURES 2000 – 2004
Production
Gazprom’s Production Segment Data*
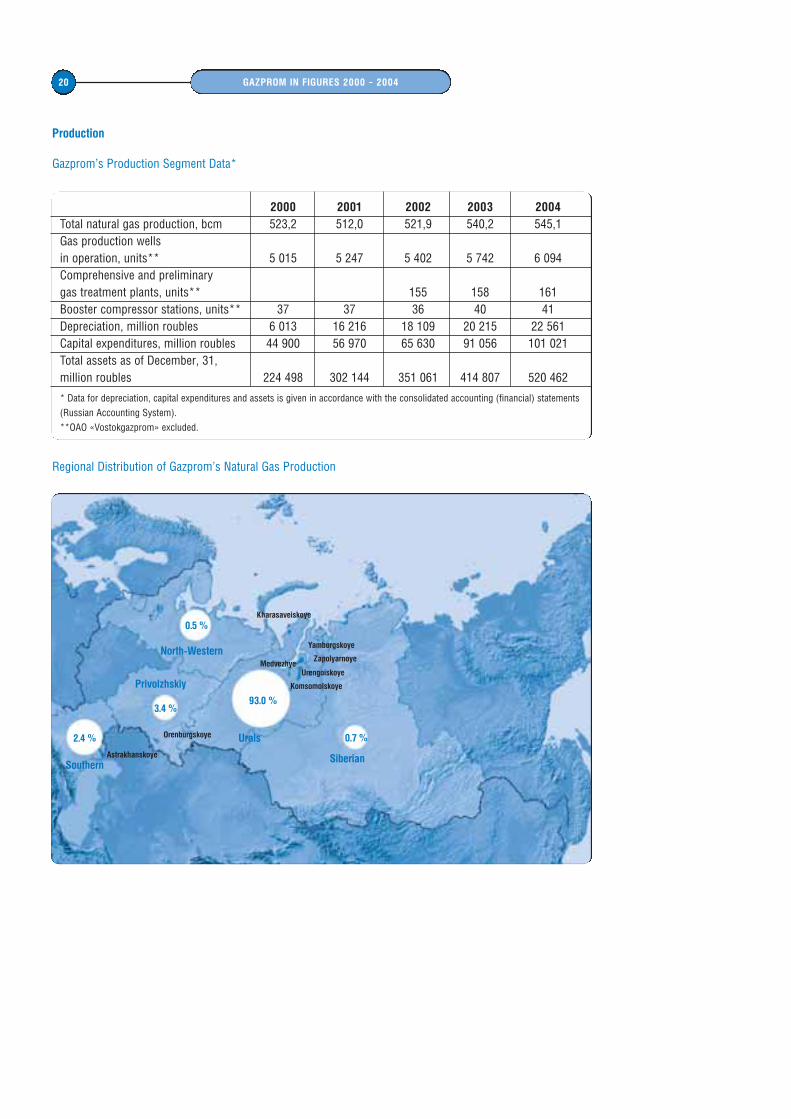
Regional Distribution of Gazprom’s Natural Gas Production
2000 2001 2002 2003 2004Total natural gas production, bcm 523,2 512,0 521,9 540,2 545,1Gas production wells in operation, units** 5 015 5 247 5 402 5 742 6 094Comprehensive and preliminary gas treatment plants, units** 155 158 161Booster compressor stations, units** 37 37 36 40 41Depreciation, million roubles 6 013 16 216 18 109 20 215 22 561Capital expenditures, million roubles 44 900 56 970 65 630 91 056 101 021Total assets as of December, 31,million roubles 224 498 302 144 351 061 414 807 520 462
* Data for depreciation, capital expenditures and assets is given in accordance with the consolidated accounting (financial) statements(Russian Accounting System).**OAO «Vostokgazprom» excluded.
0.5 %
3.4 %
2.4 %
93.0 %
0.7 %
North-Western
Privolzhskiy
Urals
SiberianSouthern
Astrakhanskoye
Orenburgskoye
Komsomolskoye
Urengoiskoye
Zapolyarnoye
Yamburgskoye
Medvezhye
Kharasaveiskoye
21GAZPROM IN FIGURES 2000 – 2004
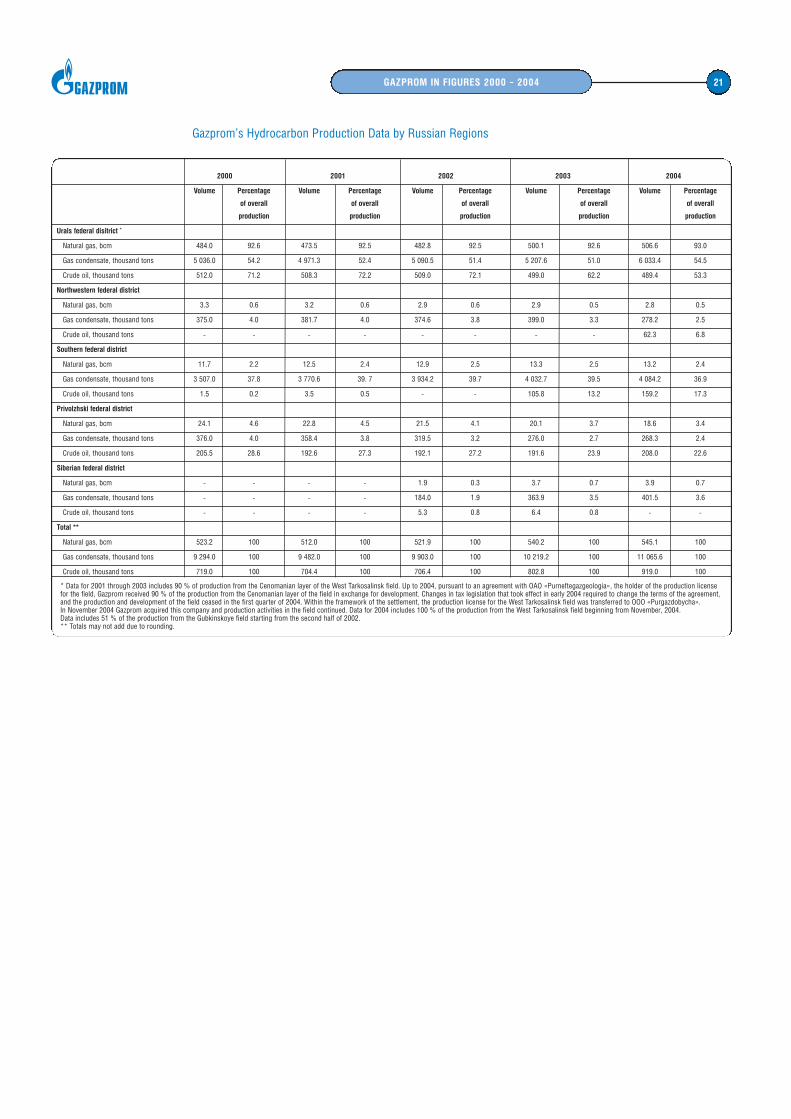
Gazprom’s Hydrocarbon Production Data by Russian Regions
2000 2001 2002 2003 2004
Volume Percentage Volume Percentage Volume Percentage Volume Percentage Volume Percentage
of overall of overall of overall of overall of overall
production production production production production
Urals federal disitrict *
Natural gas, bcm 484.0 92.6 473.5 92.5 482.8 92.5 500.1 92.6 506.6 93.0
Gas condensate, thousand tons 5 036.0 54.2 4 971.3 52.4 5 090.5 51.4 5 207.6 51.0 6 033.4 54.5
Crude oil, thousand tons 512.0 71.2 508.3 72.2 509.0 72.1 499.0 62.2 489.4 53.3
Northwestern federal district
Natural gas, bcm 3.3 0.6 3.2 0.6 2.9 0.6 2.9 0.5 2.8 0.5
Gas condensate, thousand tons 375.0 4.0 381.7 4.0 374.6 3.8 399.0 3.3 278.2 2.5
Crude oil, thousand tons - - - - - - - - 62.3 6.8
Southern federal district
Natural gas, bcm 11.7 2.2 12.5 2.4 12.9 2.5 13.3 2.5 13.2 2.4
Gas condensate, thousand tons 3 507.0 37.8 3 770.6 39. 7 3 934.2 39.7 4 032.7 39.5 4 084.2 36.9
Crude oil, thousand tons 1.5 0.2 3.5 0.5 - - 105.8 13.2 159.2 17.3
Privolzhski federal district
Natural gas, bcm 24.1 4.6 22.8 4.5 21.5 4.1 20.1 3.7 18.6 3.4
Gas condensate, thousand tons 376.0 4.0 358.4 3.8 319.5 3.2 276.0 2.7 268.3 2.4
Crude oil, thousand tons 205.5 28.6 192.6 27.3 192.1 27.2 191.6 23.9 208.0 22.6
Siberian federal district
Natural gas, bcm - - - - 1.9 0.3 3.7 0.7 3.9 0.7
Gas condensate, thousand tons - - - - 184.0 1.9 363.9 3.5 401.5 3.6
Crude oil, thousand tons - - - - 5.3 0.8 6.4 0.8 - -
Total **
Natural gas, bcm 523.2 100 512.0 100 521.9 100 540.2 100 545.1 100
Gas condensate, thousand tons 9 294.0 100 9 482.0 100 9 903.0 100 10 219.2 100 11 065.6 100
Crude oil, thousand tons 719.0 100 704.4 100 706.4 100 802.8 100 919.0 100
* Data for 2001 through 2003 includes 90 % of production from the Cenomanian layer of the West Tarkosalinsk field. Up to 2004, pursuant to an agreement with OAO «Purneftegazgeologia», the holder of the production license for the field, Gazprom received 90 % of the production from the Cenomanian layer of the field in exchange for development. Changes in tax legislation that took effect in early 2004 required to change the terms of the agreement, and the production and development of the field ceased in the first quarter of 2004. Within the framework of the settlement, the production license for the West Tarkosalinsk field was transferred to OOO «Purgazdobycha». In November 2004 Gazprom acquired this company and production activities in the field continued. Data for 2004 includes 100 % of the production from the West Tarkosalinsk field beginning from November, 2004.Data includes 51 % of the production from the Gubkinskoye field starting from the second half of 2002. ** Totals may not add due to rounding.
22 GAZPROM IN FIGURES 2000 – 2004
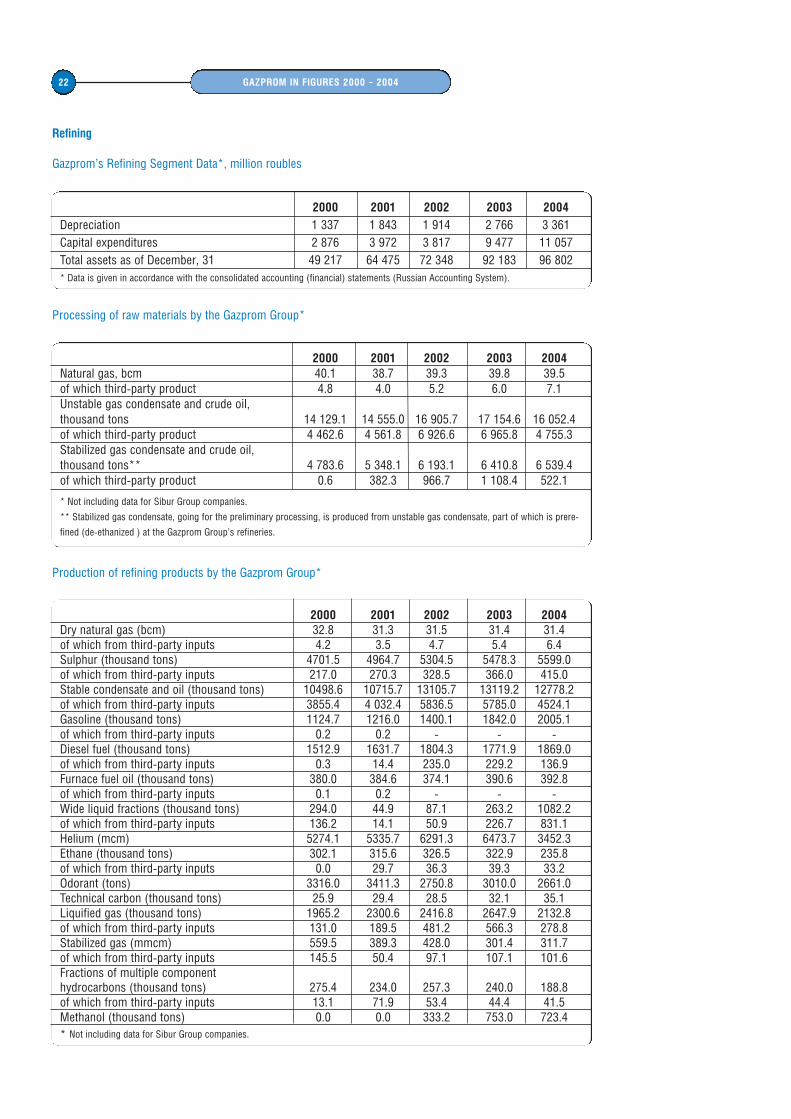
Refining
Gazprom’s Refining Segment Data*, million roubles
Processing of raw materials by the Gazprom Group*
Production of refining products by the Gazprom Group*
2000 2001 2002 2003 2004
Depreciation 1 337 1 843 1 914 2 766 3 361Capital expenditures 2 876 3 972 3 817 9 477 11 057Total assets as of December, 31 49 217 64 475 72 348 92 183 96 802* Data is given in accordance with the consolidated accounting (financial) statements (Russian Accounting System).
2000 2001 2002 2003 2004Natural gas, bcm 40.1 38.7 39.3 39.8 39.5of which third-party product 4.8 4.0 5.2 6.0 7.1Unstable gas condensate and crude oil, thousand tons 14 129.1 14 555.0 16 905.7 17 154.6 16 052.4of which third-party product 4 462.6 4 561.8 6 926.6 6 965.8 4 755.3Stabilized gas condensate and crude oil, thousand tons** 4 783.6 5 348.1 6 193.1 6 410.8 6 539.4of which third-party product 0.6 382.3 966.7 1 108.4 522.1
* Not including data for Sibur Group companies.
** Stabilized gas condensate, going for the preliminary processing, is produced from unstable gas condensate, part of which is prere-
fined (de-ethanized ) at the Gazprom Group’s refineries.
2000 2001 2002 2003 2004Dry natural gas (bcm) 32.8 31.3 31.5 31.4 31.4of which from third-party inputs 4.2 3.5 4.7 5.4 6.4Sulphur (thousand tons) 4701.5 4964.7 5304.5 5478.3 5599.0of which from third-party inputs 217.0 270.3 328.5 366.0 415.0Stable condensate and oil (thousand tons) 10498.6 10715.7 13105.7 13119.2 12778.2of which from third-party inputs 3855.4 4 032.4 5836.5 5785.0 4524.1Gasoline (thousand tons) 1124.7 1216.0 1400.1 1842.0 2005.1of which from third-party inputs 0.2 0.2 - - -Diesel fuel (thousand tons) 1512.9 1631.7 1804.3 1771.9 1869.0of which from third-party inputs 0.3 14.4 235.0 229.2 136.9Furnace fuel oil (thousand tons) 380.0 384.6 374.1 390.6 392.8of which from third-party inputs 0.1 0.2 - - -Wide liquid fractions (thousand tons) 294.0 44.9 87.1 263.2 1082.2of which from third-party inputs 136.2 14.1 50.9 226.7 831.1Helium (mcm) 5274.1 5335.7 6291.3 6473.7 3452.3Ethane (thousand tons) 302.1 315.6 326.5 322.9 235.8of which from third-party inputs 0.0 29.7 36.3 39.3 33.2Odorant (tons) 3316.0 3411.3 2750.8 3010.0 2661.0Technical carbon (thousand tons) 25.9 29.4 28.5 32.1 35.1Liquified gas (thousand tons) 1965.2 2300.6 2416.8 2647.9 2132.8of which from third-party inputs 131.0 189.5 481.2 566.3 278.8Stabilized gas (mmcm) 559.5 389.3 428.0 301.4 311.7of which from third-party inputs 145.5 50.4 97.1 107.1 101.6Fractions of multiple component hydrocarbons (thousand tons) 275.4 234.0 257.3 240.0 188.8of which from third-party inputs 13.1 71.9 53.4 44.4 41.5Methanol (thousand tons) 0.0 0.0 333.2 753.0 723.4* Not including data for Sibur Group companies.
23GAZPROM IN FIGURES 2000 – 2004
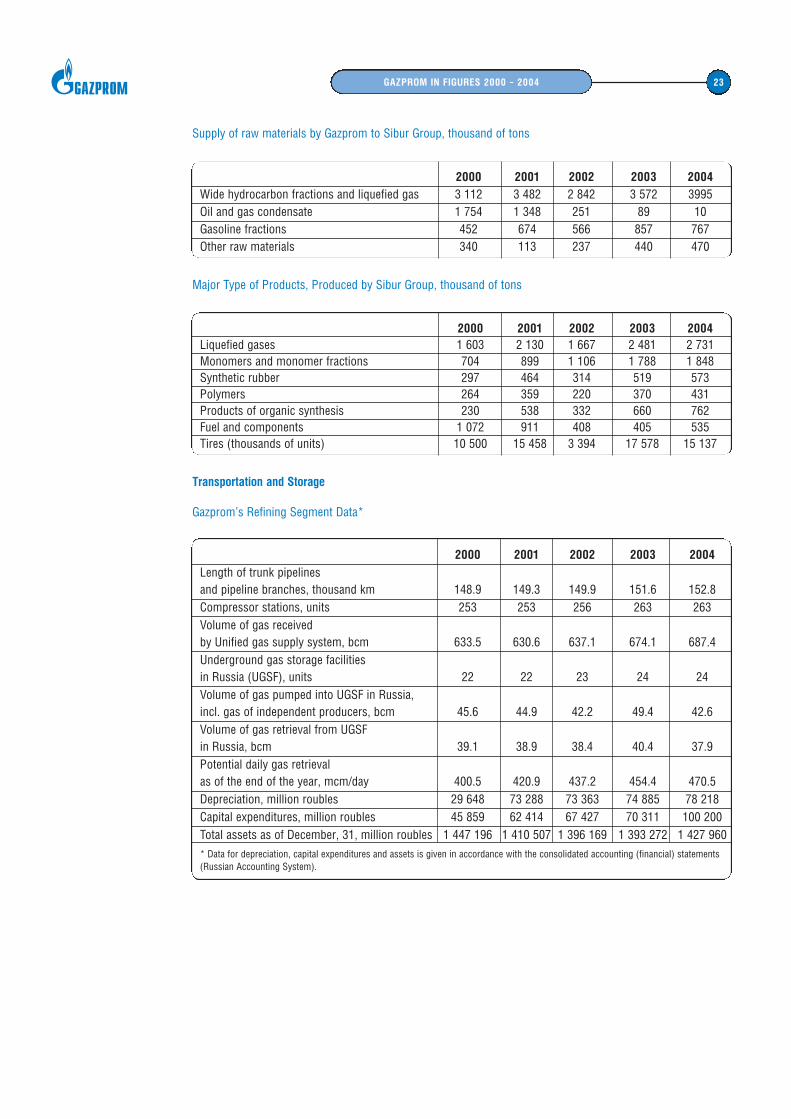
Supply of raw materials by Gazprom to Sibur Group, thousand of tons
Major Type of Products, Produced by Sibur Group, thousand of tons
Transportation and Storage
Gazprom’s Refining Segment Data*
2000 2001 2002 2003 2004Wide hydrocarbon fractions and liquefied gas 3 112 3 482 2 842 3 572 3995Oil and gas condensate 1 754 1 348 251 89 10Gasoline fractions 452 674 566 857 767Other raw materials 340 113 237 440 470
2000 2001 2002 2003 2004Liquefied gases 1 603 2 130 1 667 2 481 2 731Monomers and monomer fractions 704 899 1 106 1 788 1 848Synthetic rubber 297 464 314 519 573Polymers 264 359 220 370 431Products of organic synthesis 230 538 332 660 762Fuel and components 1 072 911 408 405 535Tires (thousands of units) 10 500 15 458 3 394 17 578 15 137
2000 2001 2002 2003 2004
Length of trunk pipelines and pipeline branches, thousand km 148.9 149.3 149.9 151.6 152.8Compressor stations, units 253 253 256 263 263Volume of gas received by Unified gas supply system, bcm 633.5 630.6 637.1 674.1 687.4Underground gas storage facilities in Russia (UGSF), units 22 22 23 24 24Volume of gas pumped into UGSF in Russia, incl. gas of independent producers, bcm 45.6 44.9 42.2 49.4 42.6Volume of gas retrieval from UGSF in Russia, bcm 39.1 38.9 38.4 40.4 37.9Potential daily gas retrieval as of the end of the year, mcm/day 400.5 420.9 437.2 454.4 470.5Depreciation, million roubles 29 648 73 288 73 363 74 885 78 218Capital expenditures, million roubles 45 859 62 414 67 427 70 311 100 200Total assets as of December, 31, million roubles 1 447 196 1 410 507 1 396 169 1 393 272 1 427 960
* Data for depreciation, capital expenditures and assets is given in accordance with the consolidated accounting (financial) statements(Russian Accounting System).
24 GAZPROM IN FIGURES 2000 – 2004
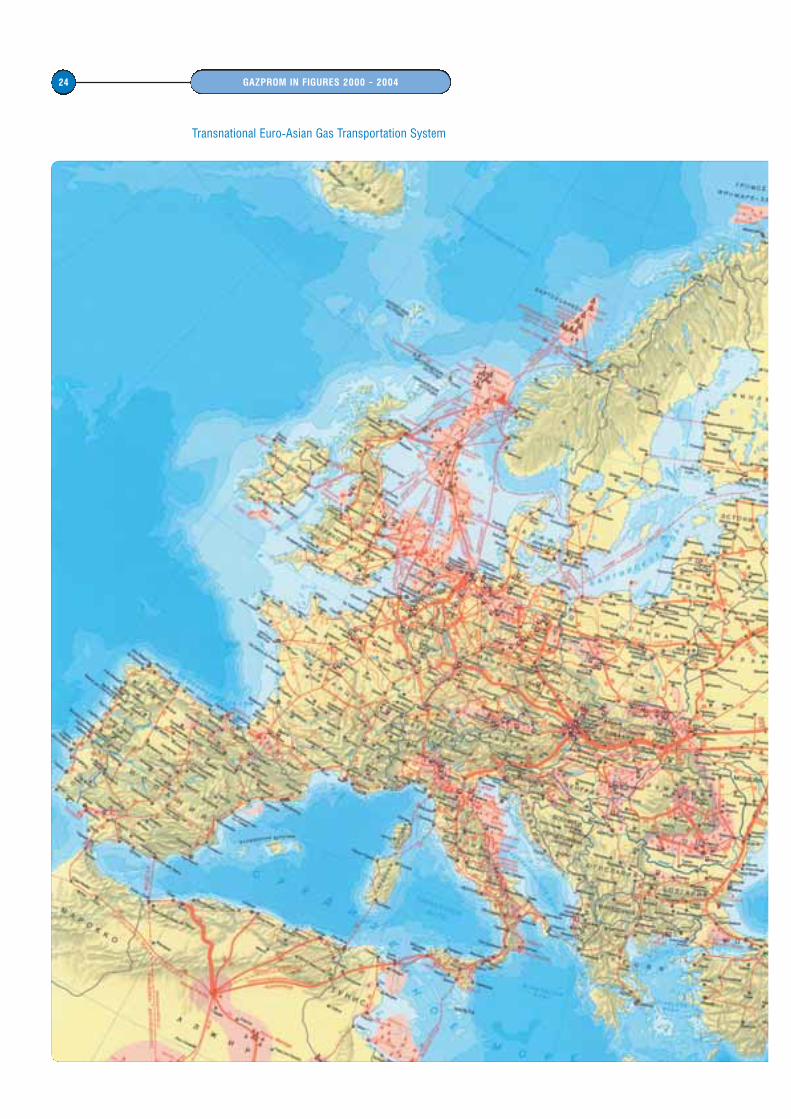
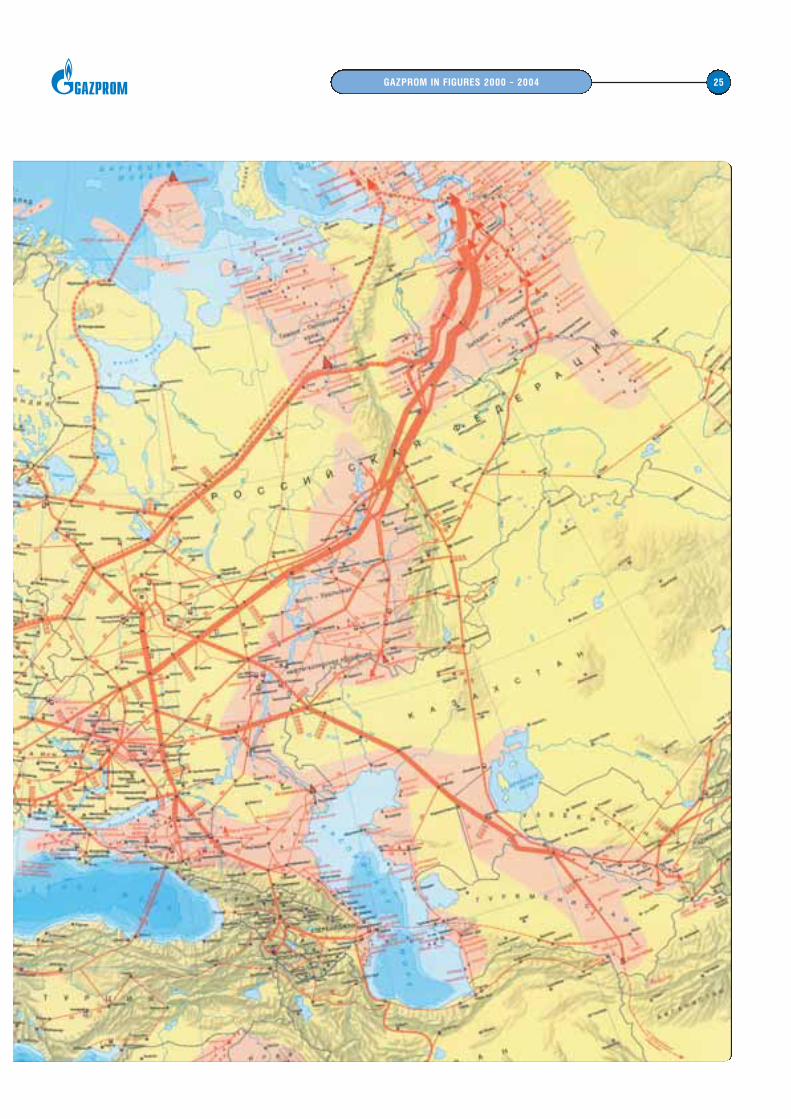
Transnational Euro-Asian Gas Transportation System
25GAZPROM IN FIGURES 2000 – 2004
26 GAZPROM IN FIGURES 2000 – 2004
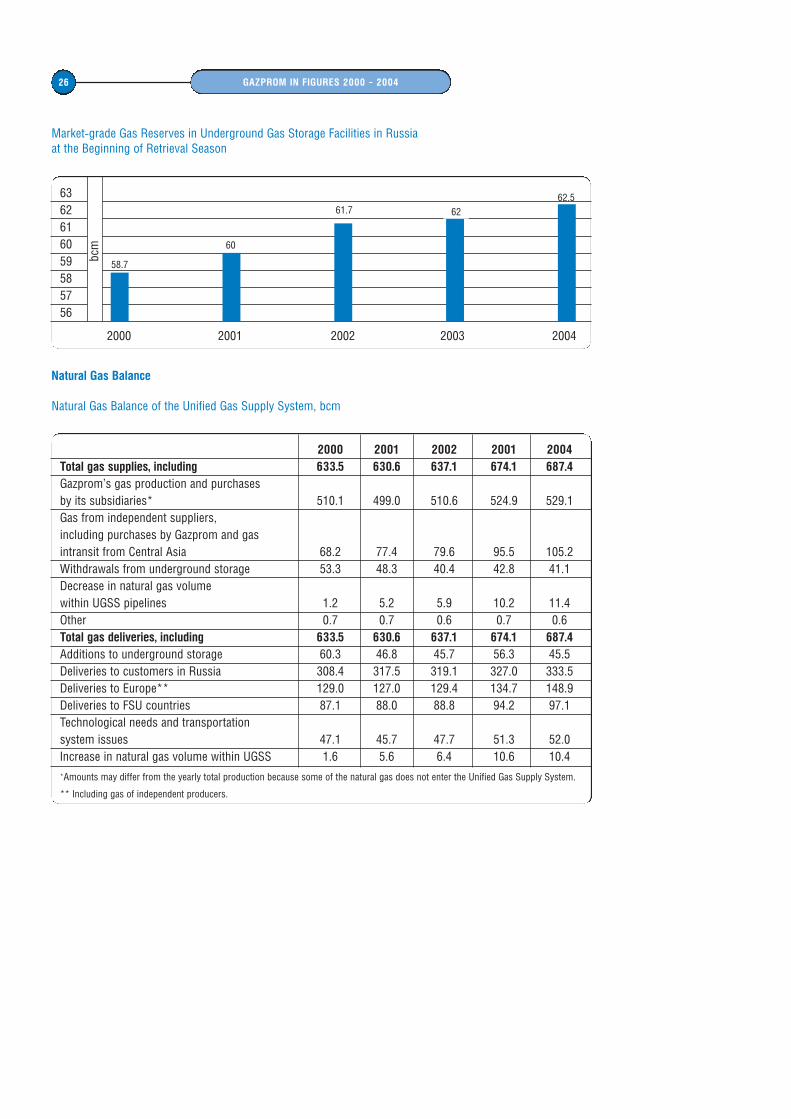
Market-grade Gas Reserves in Underground Gas Storage Facilities in Russia at the Beginning of Retrieval Season
Natural Gas Balance
Natural Gas Balance of the Unified Gas Supply System, bcm
6362616059585756
2000 2001 2002 2003 2004
bcm
2000 2001 2002 2001 2004Total gas supplies, including 633.5 630.6 637.1 674.1 687.4Gazprom’s gas production and purchases by its subsidiaries* 510.1 499.0 510.6 524.9 529.1Gas from independent suppliers, including purchases by Gazprom and gasintransit from Central Asia 68.2 77.4 79.6 95.5 105.2Withdrawals from underground storage 53.3 48.3 40.4 42.8 41.1Decrease in natural gas volumewithin UGSS pipelines 1.2 5.2 5.9 10.2 11.4Other 0.7 0.7 0.6 0.7 0.6Total gas deliveries, including 633.5 630.6 637.1 674.1 687.4Additions to underground storage 60.3 46.8 45.7 56.3 45.5Deliveries to customers in Russia 308.4 317.5 319.1 327.0 333.5Deliveries to Europe** 129.0 127.0 129.4 134.7 148.9Deliveries to FSU countries 87.1 88.0 88.8 94.2 97.1Technological needs and transportation system issues 47.1 45.7 47.7 51.3 52.0Increase in natural gas volume within UGSS 1.6 5.6 6.4 10.6 10.4*Amounts may differ from the yearly total production because some of the natural gas does not enter the Unified Gas Supply System.
** Including gas of independent producers.
58.7
61.7
60
6262.5
27GAZPROM IN FIGURES 2000 – 2004
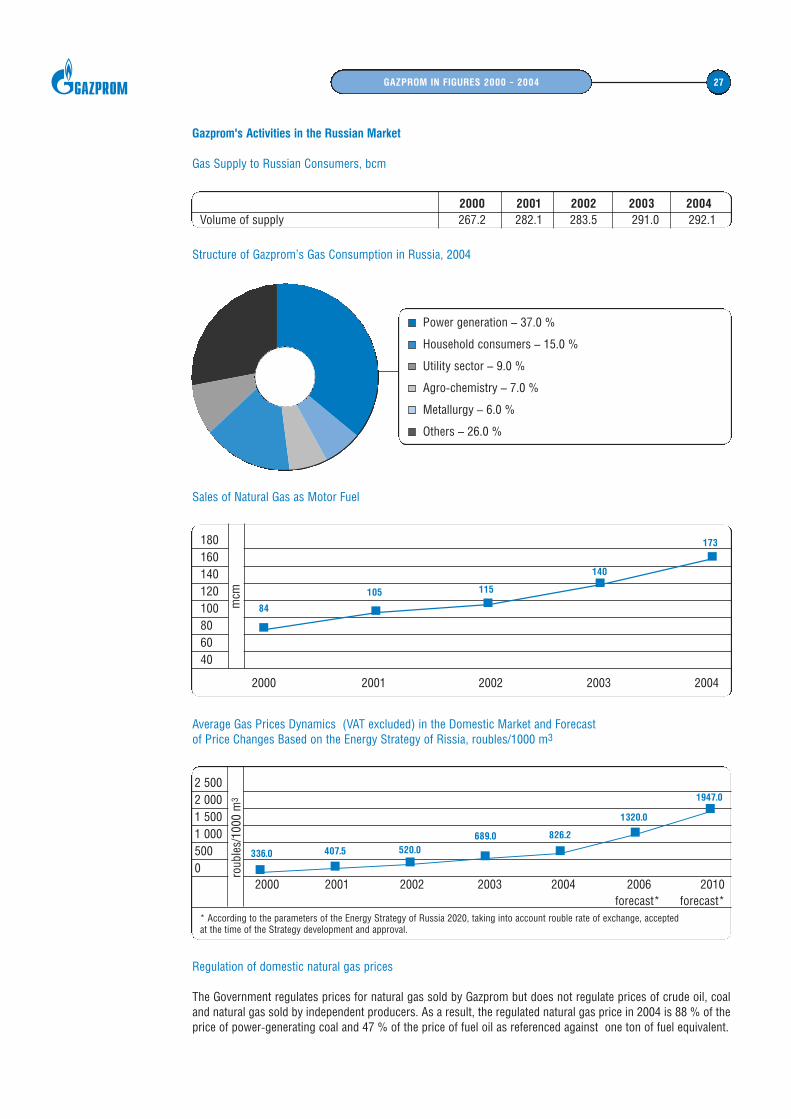
Gazprom's Activities in the Russian Market
Gas Supply to Russian Consumers, bcm
Structure of Gazprom’s Gas Consumption in Russia, 2004
Sales of Natural Gas as Motor Fuel
Average Gas Prices Dynamics (VAT excluded) in the Domestic Market and Forecast of Price Changes Based on the Energy Strategy of Rissia, roubles/1000 m3
Regulation of domestic natural gas prices
The Government regulates prices for natural gas sold by Gazprom but does not regulate prices of crude oil, coaland natural gas sold by independent producers. As a result, the regulated natural gas price in 2004 is 88 % of theprice of power-generating coal and 47 % of the price of fuel oil as referenced against one ton of fuel equivalent.
Power generation – 37.0 %
Household consumers – 15.0 %
Utility sector – 9.0 %
Agro-chemistry – 7.0 %
Metallurgy – 6.0 %
Others – 26.0 %
180160140120100806040
2000 2001 2002 2003 2004
84
105 115
140
173
2 5002 0001 5001 0005000
2000 2001 2002 2003 2004 2006 2010 forecast* forecast*
* According to the parameters of the Energy Strategy of Russia 2020, taking into account rouble rate of exchange, accepted at the time of the Strategy development and approval.
336.0 407.5 520.0689.0 826.2
1320.0
1947.0
mcm
roub
les/
1000
m3
2000 2001 2002 2003 2004Volume of supply 267.2 282.1 283.5 291.0 292.1
28 GAZPROM IN FIGURES 2000 – 2004
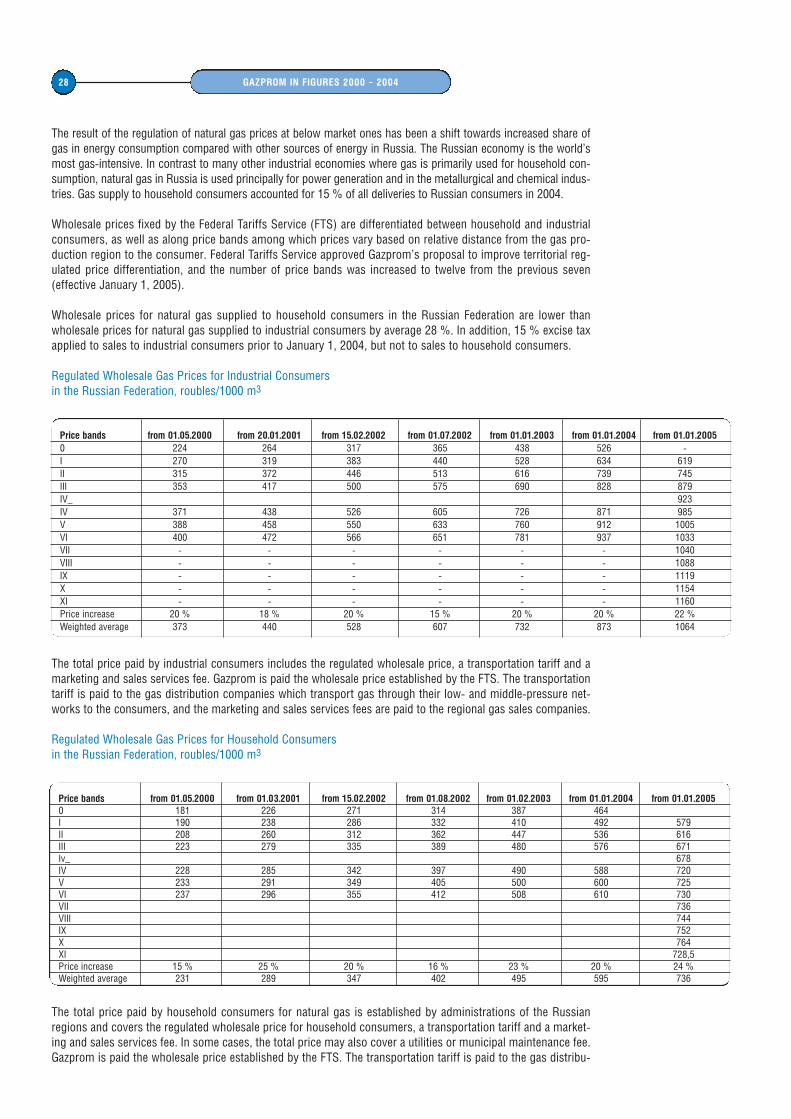
The result of the regulation of natural gas prices at below market ones has been a shift towards increased share ofgas in energy consumption compared with other sources of energy in Russia. The Russian economy is the world’smost gas-intensive. In contrast to many other industrial economies where gas is primarily used for household con-sumption, natural gas in Russia is used principally for power generation and in the metallurgical and chemical indus-tries. Gas supply to household consumers accounted for 15 % of all deliveries to Russian consumers in 2004.
Wholesale prices fixed by the Federal Tariffs Service (FTS) are differentiated between household and industrialconsumers, as well as along price bands among which prices vary based on relative distance from the gas pro-duction region to the consumer. Federal Tariffs Service approved Gazprom’s proposal to improve territorial reg-ulated price differentiation, and the number of price bands was increased to twelve from the previous seven(effective January 1, 2005).
Wholesale prices for natural gas supplied to household consumers in the Russian Federation are lower thanwholesale prices for natural gas supplied to industrial consumers by average 28 %. In addition, 15 % excise taxapplied to sales to industrial consumers prior to January 1, 2004, but not to sales to household consumers.
Regulated Wholesale Gas Prices for Industrial Consumers in the Russian Federation, roubles/1000 m3
The total price paid by industrial consumers includes the regulated wholesale price, a transportation tariff and amarketing and sales services fee. Gazprom is paid the wholesale price established by the FTS. The transportationtariff is paid to the gas distribution companies which transport gas through their low- and middle-pressure net-works to the consumers, and the marketing and sales services fees are paid to the regional gas sales companies.
Regulated Wholesale Gas Prices for Household Consumers in the Russian Federation, roubles/1000 m3
The total price paid by household consumers for natural gas is established by administrations of the Russianregions and covers the regulated wholesale price for household consumers, a transportation tariff and a market-ing and sales services fee. In some cases, the total price may also cover a utilities or municipal maintenance fee.Gazprom is paid the wholesale price established by the FTS. The transportation tariff is paid to the gas distribu-
Price bands from 01.05.2000 from 20.01.2001 from 15.02.2002 from 01.07.2002 from 01.01.2003 from 01.01.2004 from 01.01.20050 224 264 317 365 438 526 -I 270 319 383 440 528 634 619II 315 372 446 513 616 739 745III 353 417 500 575 690 828 879IV_ 923IV 371 438 526 605 726 871 985V 388 458 550 633 760 912 1005VI 400 472 566 651 781 937 1033VII - - - - - - 1040VIII - - - - - - 1088IX - - - - - - 1119X - - - - - - 1154XI - - - - - - 1160Price increase 20 % 18 % 20 % 15 % 20 % 20 % 22 %Weighted average 373 440 528 607 732 873 1064
Price bands from 01.05.2000 from 01.03.2001 from 15.02.2002 from 01.08.2002 from 01.02.2003 from 01.01.2004 from 01.01.20050 181 226 271 314 387 464I 190 238 286 332 410 492 579II 208 260 312 362 447 536 616III 223 279 335 389 480 576 671Iv_ 678IV 228 285 342 397 490 588 720V 233 291 349 405 500 600 725VI 237 296 355 412 508 610 730VII 736VIII 744IX 752X 764XI 728,5Price increase 15 % 25 % 20 % 16 % 23 % 20 % 24 %Weighted average 231 289 347 402 495 595 736
29GAZPROM IN FIGURES 2000 – 2004
tion companies which transport gas through their low- and middle-pressure networks to the consumers, and themarketing and sales services fees are paid to the regional gas sales companies. Pricing structure for householdconsumers is complicated by such factors as privilege categories of consumers (pensioners and war veteranspay reduced tariff), lack of metering devices on individual apartments (gas fees are generally calculated in accor-dance with established norms and not with the volume of actually consumed gas), impossibility to cut off cer-tain customers for non-payment because of legal and technical constraints.
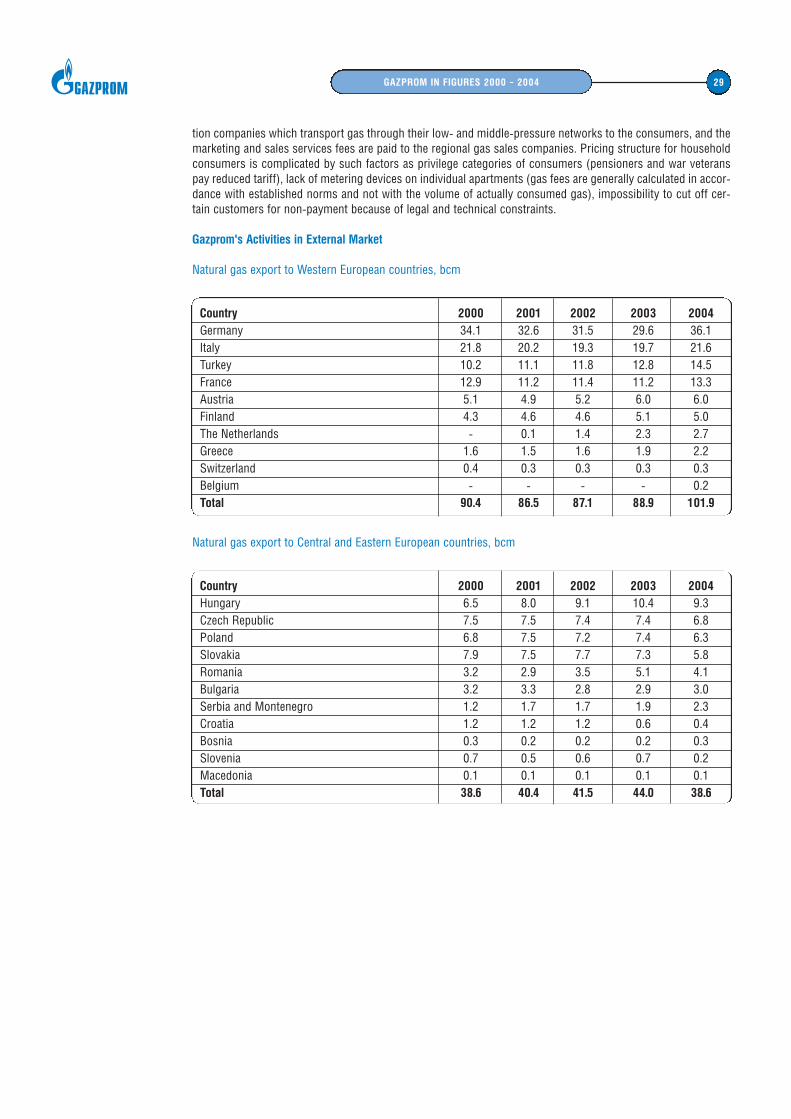
Gazprom's Activities in External Market
Natural gas export to Western European countries, bcm
Natural gas export to Central and Eastern European countries, bcm
Country 2000 2001 2002 2003 2004Germany 34.1 32.6 31.5 29.6 36.1Italy 21.8 20.2 19.3 19.7 21.6Turkey 10.2 11.1 11.8 12.8 14.5France 12.9 11.2 11.4 11.2 13.3 Austria 5.1 4.9 5.2 6.0 6.0Finland 4.3 4.6 4.6 5.1 5.0The Netherlands - 0.1 1.4 2.3 2.7Greece 1.6 1.5 1.6 1.9 2.2Switzerland 0.4 0.3 0.3 0.3 0.3 Belgium - - - - 0.2 Total 90.4 86.5 87.1 88.9 101.9
Country 2000 2001 2002 2003 2004Hungary 6.5 8.0 9.1 10.4 9.3Czech Republic 7.5 7.5 7.4 7.4 6.8 Poland 6.8 7.5 7.2 7.4 6.3Slovakia 7.9 7.5 7.7 7.3 5.8Romania 3.2 2.9 3.5 5.1 4.1Bulgaria 3.2 3.3 2.8 2.9 3.0Serbia and Montenegro 1.2 1.7 1.7 1.9 2.3Croatia 1.2 1.2 1.2 0.6 0.4 Bosnia 0.3 0.2 0.2 0.2 0.3Slovenia 0.7 0.5 0.6 0.7 0.2 Macedonia 0.1 0.1 0.1 0.1 0.1Total 38.6 40.4 41.5 44.0 38.6
30 GAZPROM IN FIGURES 2000 – 2004
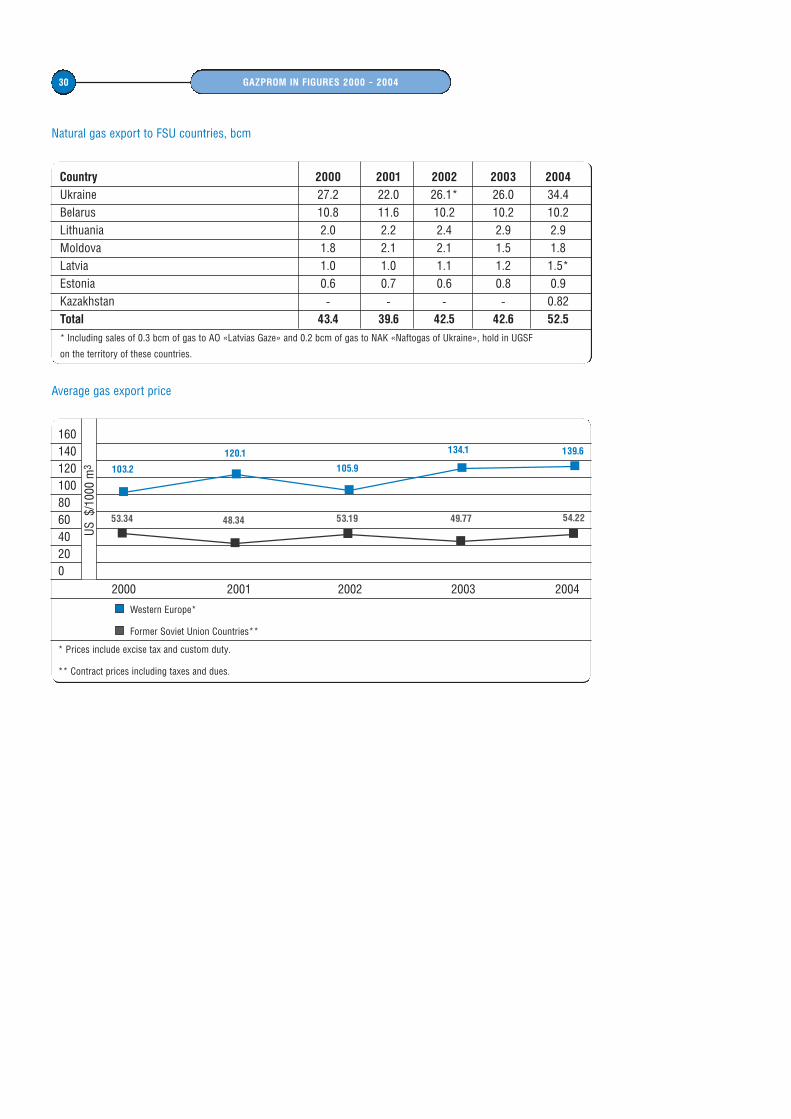
Natural gas export to FSU countries, bcm
Average gas export price
160140120100806040200
2000 2001 2002 2003 2004
Western Europe*
Former Soviet Union Countries**
* Prices include excise tax and custom duty.
** Contract prices including taxes and dues.
US
$/1
000
m3 103.2
53.34 48.34 53.19 49.77 54.22
120.1
105.9
134.1 139.6
Country 2000 2001 2002 2003 2004
Ukraine 27.2 22.0 26.1* 26.0 34.4Belarus 10.8 11.6 10.2 10.2 10.2Lithuania 2.0 2.2 2.4 2.9 2.9Moldova 1.8 2.1 2.1 1.5 1.8Latvia 1.0 1.0 1.1 1.2 1.5*Estonia 0.6 0.7 0.6 0.8 0.9Kazakhstan - - - - 0.82Total 43.4 39.6 42.5 42.6 52.5
* Including sales of 0.3 bcm of gas to AO «Latvias Gaze» and 0.2 bcm of gas to NAK «Naftogas of Ukraine», hold in UGSF
on the territory of these countries.
31GAZPROM IN FIGURES 2000 – 2004
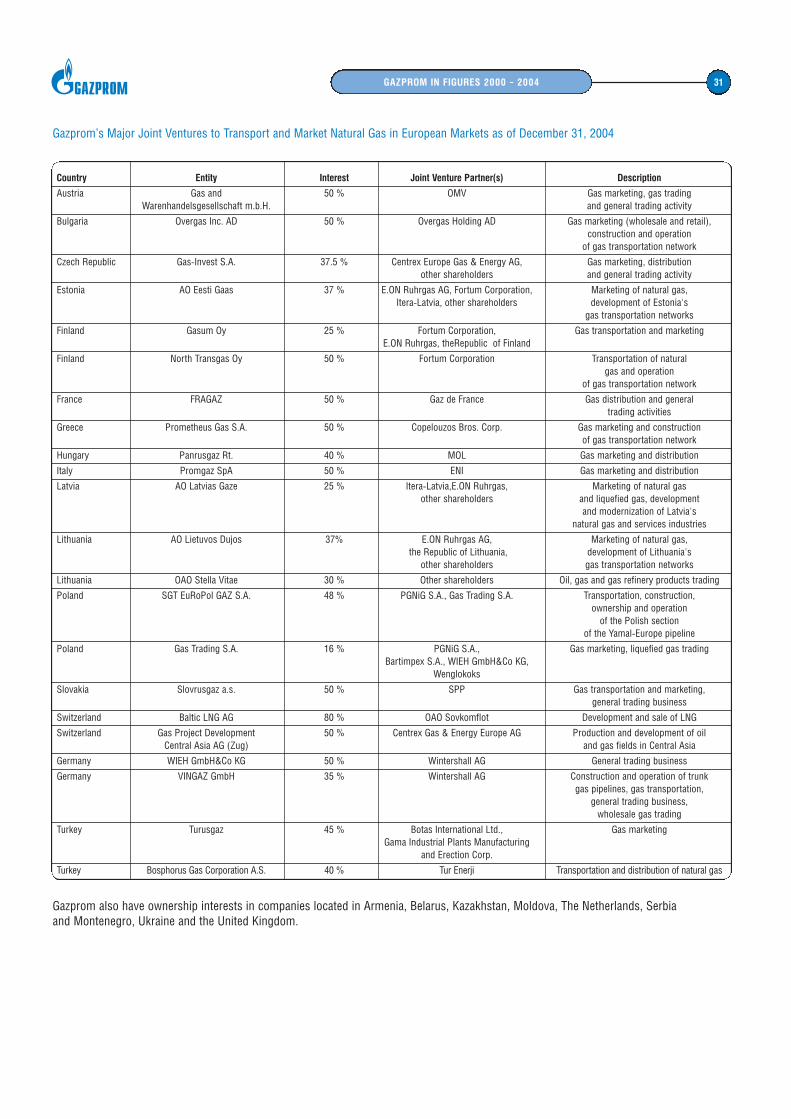
Gazprom’s Major Joint Ventures to Transport and Market Natural Gas in European Markets as of December 31, 2004
Gazprom also have ownership interests in companies located in Armenia, Belarus, Kazakhstan, Moldova, The Netherlands, Serbia and Montenegro, Ukraine and the United Kingdom.
Country Entity Interest Joint Venture Partner(s) Description
Austria Gas and 50 % OMV Gas marketing, gas trading Warenhandelsgesellschaft m.b.H. and general trading activity
Bulgaria Overgas Inc. AD 50 % Overgas Holding AD Gas marketing (wholesale and retail), construction and operation
of gas transportation network
Czech Republic Gas-Invest S.A. 37.5 % Centrex Europe Gas & Energy AG, Gas marketing, distribution other shareholders and general trading activity
Estonia AO Eesti Gaas 37 % E.ON Ruhrgas AG, Fortum Corporation, Marketing of natural gas, Itera-Latvia, other shareholders development of Estonia's
gas transportation networks
Finland Gasum Oy 25 % Fortum Corporation, Gas transportation and marketingE.ON Ruhrgas, theRepublic of Finland
Finland North Transgas Oy 50 % Fortum Corporation Transportation of natural gas and operation
of gas transportation network
France FRAGAZ 50 % Gaz de France Gas distribution and general trading activities
Greece Prometheus Gas S.A. 50 % Copelouzos Bros. Corp. Gas marketing and construction of gas transportation network
Hungary Panrusgaz Rt. 40 % MOL Gas marketing and distribution
Italy Promgaz SpA 50 % ENI Gas marketing and distribution
Latvia AO Latvias Gaze 25 % Itera-Latvia,E.ON Ruhrgas, Marketing of natural gas other shareholders and liquefied gas, development
and modernization of Latvia'snatural gas and services industries
Lithuania AO Lietuvos Dujos 37% E.ON Ruhrgas AG, Marketing of natural gas, the Republic of Lithuania, development of Lithuania's
other shareholders gas transportation networks
Lithuania OAO Stella Vitae 30 % Other shareholders Oil, gas and gas refinery products trading
Poland SGT EuRoPol GAZ S.A. 48 % PGNiG S.A., Gas Trading S.A. Transportation, construction, ownership and operation
of the Polish section of the Yamal-Europe pipeline
Poland Gas Trading S.A. 16 % PGNiG S.A., Gas marketing, liquefied gas tradingBartimpex S.A., WIEH GmbH&Co KG,
Wenglokoks
Slovakia Slovrusgaz a.s. 50 % SPP Gas transportation and marketing, general trading business
Switzerland Baltic LNG AG 80 % OAO Sovkomflot Development and sale of LNG
Switzerland Gas Project Development 50 % Centrex Gas & Energy Europe AG Production and development of oil Central Asia AG (Zug) and gas fields in Central Asia
Germany WIEH GmbH&Co KG 50 % Wintershall AG General trading business
Germany VINGAZ GmbH 35 % Wintershall AG Construction and operation of trunk gas pipelines, gas transportation,
general trading business, wholesale gas trading
Turkey Turusgaz 45 % Botas International Ltd., Gas marketingGama Industrial Plants Manufacturing
and Erection Corp.
Turkey Bosphorus Gas Corporation A.S. 40 % Tur Enerji Transportation and distribution of natural gas
32 GAZPROM IN FIGURES 2000 – 2004
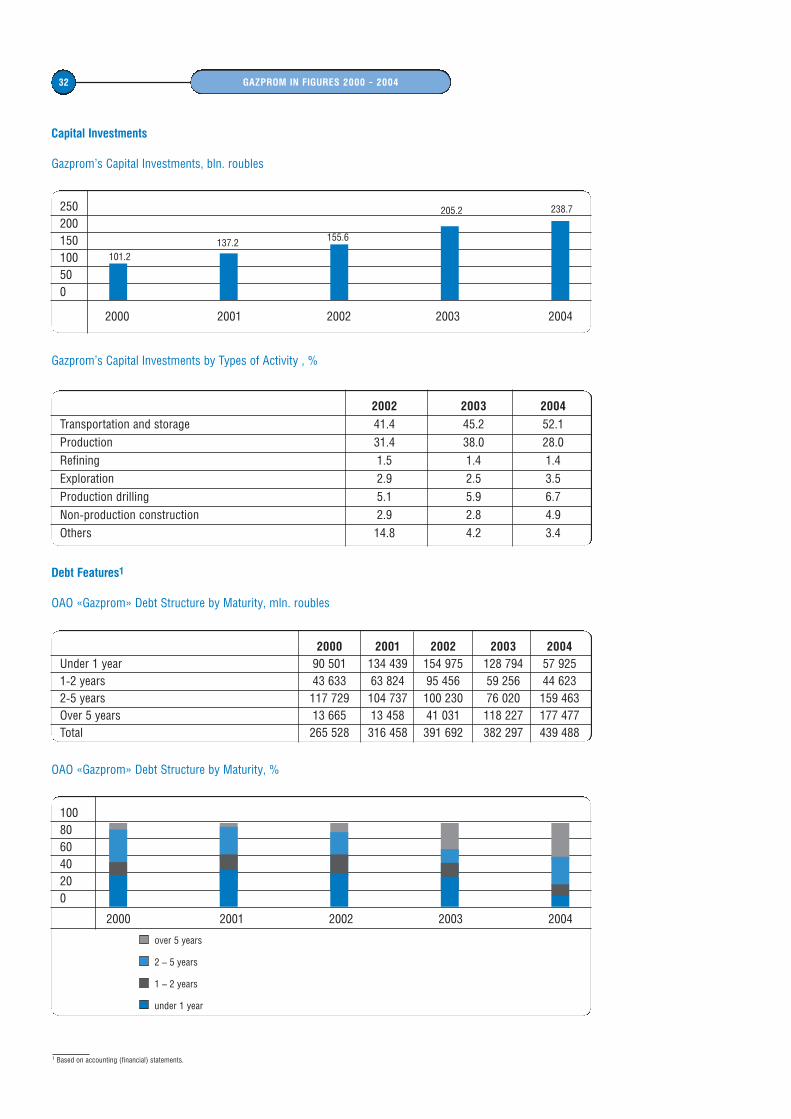
Capital Investments
Gazprom’s Capital Investments, bln. roubles
Gazprom’s Capital Investments by Types of Activity , %
Debt Features1
OAO «Gazprom» Debt Structure by Maturity, mln. roubles
OAO «Gazprom» Debt Structure by Maturity, %
250200150100500
2000 2001 2002 2003 2004
101.2137.2 155.6
205.2 238.7
2002 2003 2004
Transportation and storage 41.4 45.2 52.1Production 31.4 38.0 28.0Refining 1.5 1.4 1.4Exploration 2.9 2.5 3.5Production drilling 5.1 5.9 6.7Non-production construction 2.9 2.8 4.9Others 14.8 4.2 3.4
2000 2001 2002 2003 2004Under 1 year 90 501 134 439 154 975 128 794 57 9251-2 years 43 633 63 824 95 456 59 256 44 6232-5 years 117 729 104 737 100 230 76 020 159 463Over 5 years 13 665 13 458 41 031 118 227 177 477Total 265 528 316 458 391 692 382 297 439 488
100 80 60 40 20 0
2000 2001 2002 2003 2004
over 5 years
2 – 5 years
1 – 2 years
under 1 year
1 Based on accounting (financial) statements.
33GAZPROM IN FIGURES 2000 – 2004
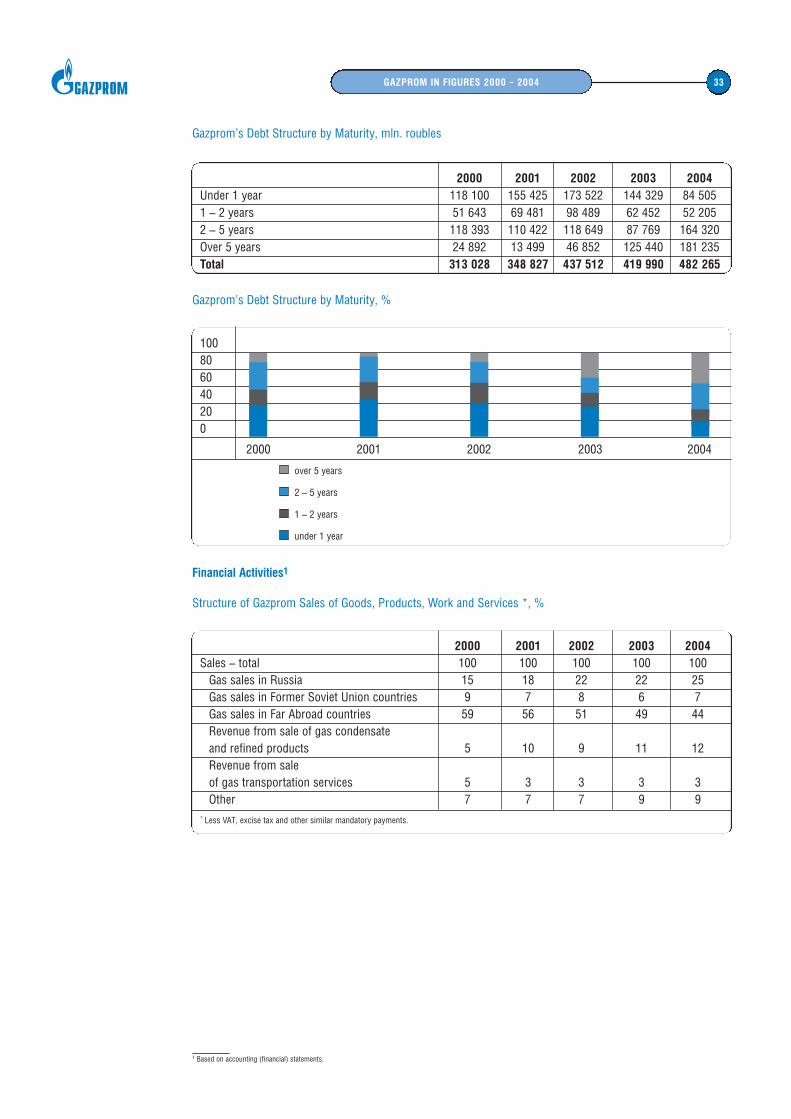
Gazprom’s Debt Structure by Maturity, mln. roubles
Gazprom’s Debt Structure by Maturity, %
Financial Activities1
Structure of Gazprom Sales of Goods, Products, Work and Services *, %
2000 2001 2002 2003 2004Sales – total 100 100 100 100 100
Gas sales in Russia 15 18 22 22 25Gas sales in Former Soviet Union countries 9 7 8 6 7Gas sales in Far Abroad countries 59 56 51 49 44Revenue from sale of gas condensate and refined products 5 10 9 11 12Revenue from sale of gas transportation services 5 3 3 3 3Other 7 7 7 9 9
* Less VAT, excise tax and other similar mandatory payments.
2000 2001 2002 2003 2004Under 1 year 118 100 155 425 173 522 144 329 84 5051 – 2 years 51 643 69 481 98 489 62 452 52 2052 – 5 years 118 393 110 422 118 649 87 769 164 320Over 5 years 24 892 13 499 46 852 125 440 181 235Total 313 028 348 827 437 512 419 990 482 265
100 80 60 40 20 0
2000 2001 2002 2003 2004
over 5 years
2 – 5 years
1 – 2 years
under 1 year
1 Based on accounting (financial) statements.
34 GAZPROM IN FIGURES 2000 – 2004
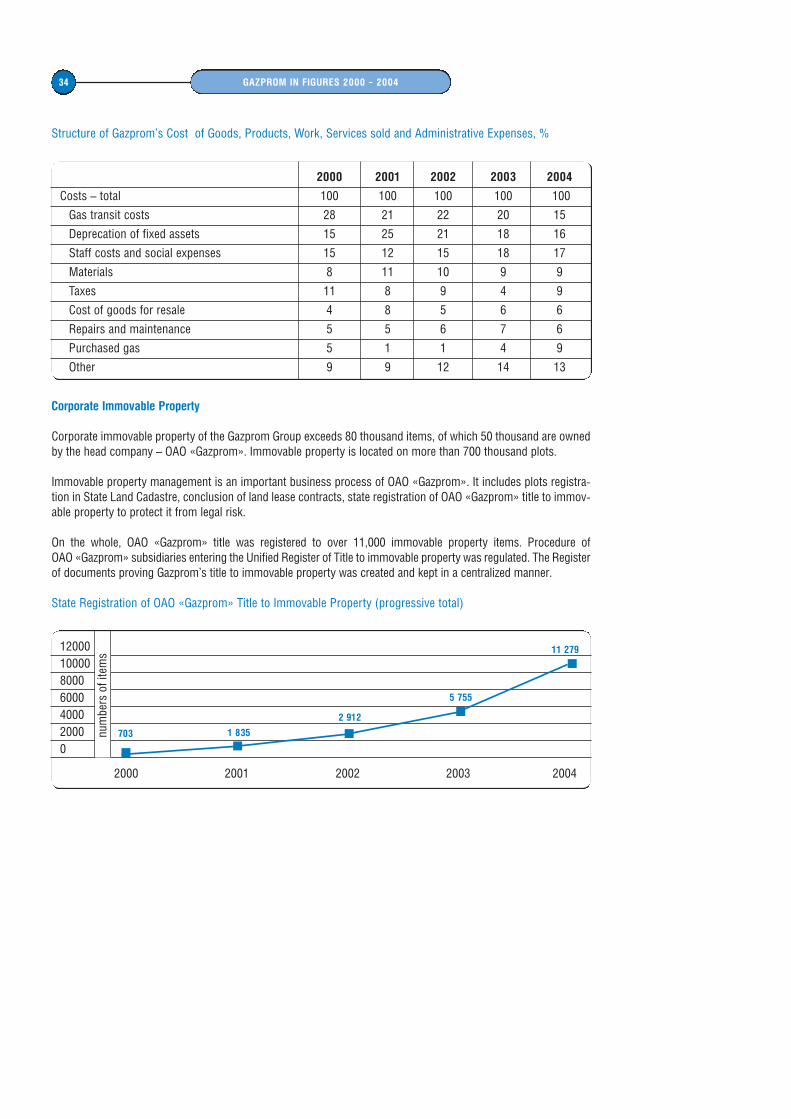
Structure of Gazprom’s Cost of Goods, Products, Work, Services sold and Administrative Expenses, %
Corporate Immovable Property
Corporate immovable property of the Gazprom Group exceeds 80 thousand items, of which 50 thousand are ownedby the head company – OAO «Gazprom». Immovable property is located on more than 700 thousand plots.
Immovable property management is an important business process of OAO «Gazprom». It includes plots registra-tion in State Land Cadastre, conclusion of land lease contracts, state registration of OAO «Gazprom» title to immov-able property to protect it from legal risk.
On the whole, OAO «Gazprom» title was registered to over 11,000 immovable property items. Procedure of OAO «Gazprom» subsidiaries entering the Unified Register of Title to immovable property was regulated. The Registerof documents proving Gazprom’s title to immovable property was created and kept in a centralized manner.
State Registration of OAO «Gazprom» Title to Immovable Property (progressive total)
2000 2001 2002 2003 2004
Costs – total 100 100 100 100 100
Gas transit costs 28 21 22 20 15
Deprecation of fixed assets 15 25 21 18 16
Staff costs and social expenses 15 12 15 18 17
Materials 8 11 10 9 9
Taxes 11 8 9 4 9
Cost of goods for resale 4 8 5 6 6
Repairs and maintenance 5 5 6 7 6
Purchased gas 5 1 1 4 9
Other 9 9 12 14 13
120001000080006000400020000
2000 2001 2002 2003 2004
num
bers
of i
tem
s
703 1 835
2 912
5 755
11 279
35GAZPROM IN FIGURES 2000 – 2004
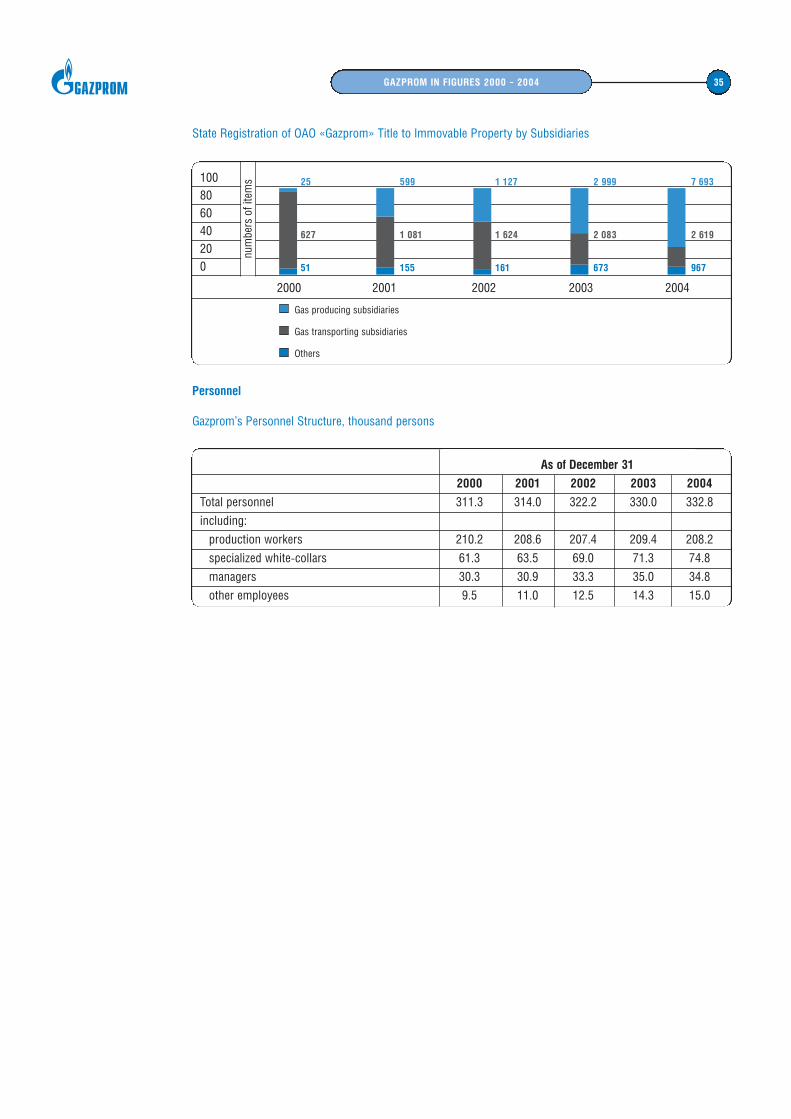
State Registration of OAO «Gazprom» Title to Immovable Property by Subsidiaries
Personnel
Gazprom’s Personnel Structure, thousand persons
100 80 60 40 20 0
2000 2001 2002 2003 2004
Gas producing subsidiaries
Gas transporting subsidiaries
Others
num
bers
of i
tem
s
51
627
25
155
1 081
599
161
1 624
1 127
673
2 083
2 999
967
2 619
7 693
As of December 31
2000 2001 2002 2003 2004
Total personnel 311.3 314.0 322.2 330.0 332.8
including:
production workers 210.2 208.6 207.4 209.4 208.2
specialized white-collars 61.3 63.5 69.0 71.3 74.8
managers 30.3 30.9 33.3 35.0 34.8
other employees 9.5 11.0 12.5 14.3 15.0