Embed Size (px)
Citation preview
The
Jour
nal o
f Exp
erim
enta
l Bio
logy
© 2014. Published by The Company of Biologists Ltd | The Journal of Experimental Biology (2014) 217, 3209-3220 doi:10.1242/jeb.097436
3209
ABSTRACTIn contrast to flying flies, walking flies experience relatively strongrotational gaze shifts, even during overall straight phases oflocomotion. These gaze shifts are caused by the walking apparatusand modulated by the stride frequency. Accordingly, even duringstraight walking phases, the retinal image flow is composed of bothtranslational and rotational optic flow, which might affect spatial vision,as well as fixation behavior. We addressed this issue for anorientation task where walking blowflies approached a black verticalbar. The visual stimulus was stationary, or either the bar or thebackground moved horizontally. The stride-coupled gaze shifts of flieswalking toward the bar had similar amplitudes under all visualconditions tested. This finding indicates that these shifts are aninherent feature of walking, which are not even compensated duringa visual goal fixation task. By contrast, approaching flies showed afrequent stop-and-go behavior that was affected by the stimulusconditions. As sustained image rotations may impair distanceestimation during walking, we propose a hypothesis that explainshow rotation-independent translatory image flow containing distanceinformation can be determined. The algorithm proposed workswithout requiring differentiation at the behavioral level of the rotationaland translational flow components. By contrast, disentangling bothhas been proposed to be necessary during flight. By comparing theretinal velocities of the edges of the goal, its rotational image motioncomponent can be removed. Consequently, the expansion velocity ofthe goal and, thus, its proximity can be extracted, irrespective ofdistance-independent stride-coupled rotational image shifts.
KEY WORDS: Insect, Vision, Blowfly, Gaze, Head movements,Goal-directed, Walking, Fixation, Expansion velocity, Spatial vision
INTRODUCTIONInsects, such as blowflies, use an active gaze strategy to facilitatethe processing of spatial information – during their flight, theyseparate phases of brief saccade-like rotations from intersaccadicphases of largely pure translations (Boeddeker et al., 2010;Egelhaaf et al., 2012; Land, 1973; Schilstra and van Hateren,1999; van Hateren and Schilstra, 1999). This separation isbeneficial from a computational perspective because only thetranslational component of retinal image flow contains spatialinformation that is essential for visually guided orientation(Koenderink, 1986). During the translational intersaccadic flightphases, rotational gaze shifts coupled to the wing beat cycle (vanHateren and Schilstra, 1999) are sufficiently small and their
RESEARCH ARTICLE
Department of Neurobiology and CITEC Center of Excellence CognitiveInteraction Technology, Bielefeld University, Universitätsstraße 25, 33615 Bielefeld,Germany.
*Author for correspondence ([email protected])
Received 23 September 2013; Accepted 18 June 2014
frequency is so high that they do not affect the responses of motionsensitive neurons (Kern et al., 2005).
By contrast, walking blowflies experience relatively large periodicbody rotations caused by the walking apparatus. When flies areforced to walk straight in a visually impoverished environment, thestride-coupled yaw rotations of head and body are very similar,whereas roll and pitch body rotations are compensated to someextent by counter-rotating the head. Hence, even straight-walkingflies experience relatively large rotational yaw gaze shifts ofapproximately 4 deg at a stride frequency of 12 to 15 Hz (Kress andEgelhaaf, 2012). The corresponding retinal image flow mightimpede spatial information processing and, thus, object-directedbehavior.
Whether walking flies experience stride-coupled image rotationsduring visual fixation tasks or compensate the rotations in such asituation has not yet been addressed. Most previous studies haveaimed to unravel the mechanisms of fixation behavior in flying andwalking flies by using flies that were each tethered at the thorax andhad their head fixed. Hence, stride-coupled gaze shifts wereprevented and, therefore, not considered to affect behavior (Aptekaret al., 2012; Bahl et al., 2013; Egelhaaf, 1987; Fox et al., 2014; Foxand Frye, 2014; Götz, 1975; Götz and Wenking, 1973; Kimmerle etal., 2000; Reichardt, 1973; Reichardt and Poggio, 1976; Virsik andReichardt, 1976; Wehrhahn and Hausen, 1980). Owing tomethodological limitations, the few studies that have analyzedobject fixation in freely walking flies could not resolve stride-coupled gaze shifts (Bülthoff et al., 1982; Götz, 1980; Horn, 1978;Horn and Fischer, 1978; Horn and Mittag, 1980; Kern and Egelhaaf,2000; Osorio et al., 1990; Schuster et al., 2002; Strauss et al., 1997).
Similar to most previous studies on object fixation, we relied inour experiments on the natural affinity of flies for salient verticalobjects, but we improved the techniques to allow for a more preciseanalysis of gaze behavior. We initially analyzed the fixation behaviortoward a vertical bar in a stationary environment where the onlyretinal image displacements were self-induced. We then challengedthe fly with external disturbances by moving either the bar or itsbackground to assess the limitations of the fixation system. Theseexternal disturbances might lead to a conflict between goal fixationand the optomotor following responses to background motion, ashas been tested previously on tethered flying Drosophila (Fox andFrye, 2014; Fox et al., 2014). We addressed three specific questionsconcerning walking blowflies – (1) are stride-coupled gaze shiftscompensated during object-induced fixation tasks? (2) What are thefunctional implications of potential stride-coupled gaze shifts for thefixation performance? (3) What information about the distance tothe goal is contained in the retinal input during object-inducedapproach behavior?
RESULTSWe monitored the gaze behavior of walking blowflies, Calliphoravicina (Robineau-Desvoidy 1830) by using two high-speed cameras,
Gaze characteristics of freely walking blowflies Calliphora vicinain a goal-directed taskDaniel Kress* and Martin Egelhaaf
The
Jour
nal o
f Exp
erim
enta
l Bio
logy
3210
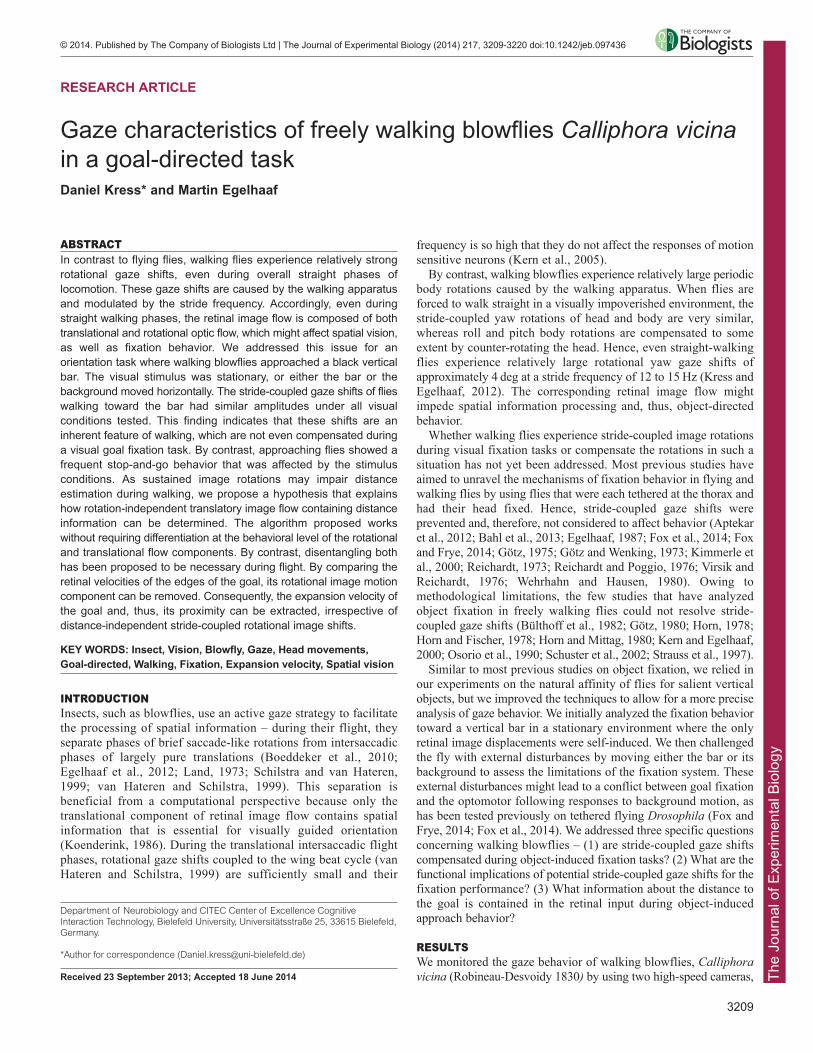
while the flies approached a black vertical bar representing the‘goal’. One wall of the walking arena consisted of a projectionscreen for the visual stimulus that was composed of the bar and arandom checkerboard background pattern (Fig. 1A). When the barand background were stationary (‘stationary condition’), the retinalimage was only displaced by the self-motion of the fly. Oscillatingeither the bar (‘moving bar condition’) or the background (‘movingbackground condition’) allowed us to analyze the consequences ofexternal disturbances on approach and gaze behavior. Wedetermined the position and gaze orientation of the fly by automatictracking of marker points attached to the fly (Fig. 1B) andreconstructed the position of the bar on the retina (Fig. 1C).
Flies were able to approach the bar, even if it oscillated at largeamplitudes of 10 cm and with speeds of 5 cm s−1. When the bar wasmoving, the approaching fly had to continually adjust its walking
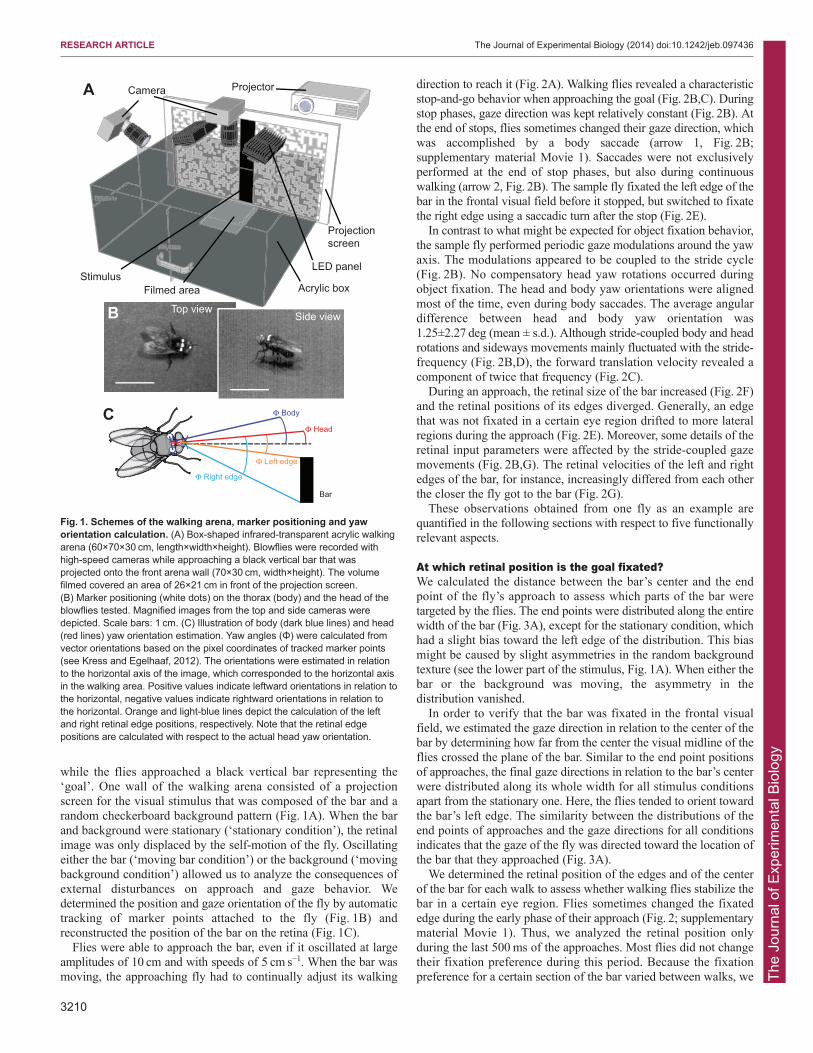
direction to reach it (Fig. 2A). Walking flies revealed a characteristicstop-and-go behavior when approaching the goal (Fig. 2B,C). Duringstop phases, gaze direction was kept relatively constant (Fig. 2B). Atthe end of stops, flies sometimes changed their gaze direction, whichwas accomplished by a body saccade (arrow 1, Fig. 2B;supplementary material Movie 1). Saccades were not exclusivelyperformed at the end of stop phases, but also during continuouswalking (arrow 2, Fig. 2B). The sample fly fixated the left edge of thebar in the frontal visual field before it stopped, but switched to fixatethe right edge using a saccadic turn after the stop (Fig. 2E).
In contrast to what might be expected for object fixation behavior,the sample fly performed periodic gaze modulations around the yawaxis. The modulations appeared to be coupled to the stride cycle(Fig. 2B). No compensatory head yaw rotations occurred duringobject fixation. The head and body yaw orientations were alignedmost of the time, even during body saccades. The average angulardifference between head and body yaw orientation was1.25±2.27 deg (mean ± s.d.). Although stride-coupled body and headrotations and sideways movements mainly fluctuated with the stride-frequency (Fig. 2B,D), the forward translation velocity revealed acomponent of twice that frequency (Fig. 2C).
During an approach, the retinal size of the bar increased (Fig. 2F)and the retinal positions of its edges diverged. Generally, an edgethat was not fixated in a certain eye region drifted to more lateralregions during the approach (Fig. 2E). Moreover, some details of theretinal input parameters were affected by the stride-coupled gazemovements (Fig. 2B,G). The retinal velocities of the left and rightedges of the bar, for instance, increasingly differed from each otherthe closer the fly got to the bar (Fig. 2G).
These observations obtained from one fly as an example arequantified in the following sections with respect to five functionallyrelevant aspects.
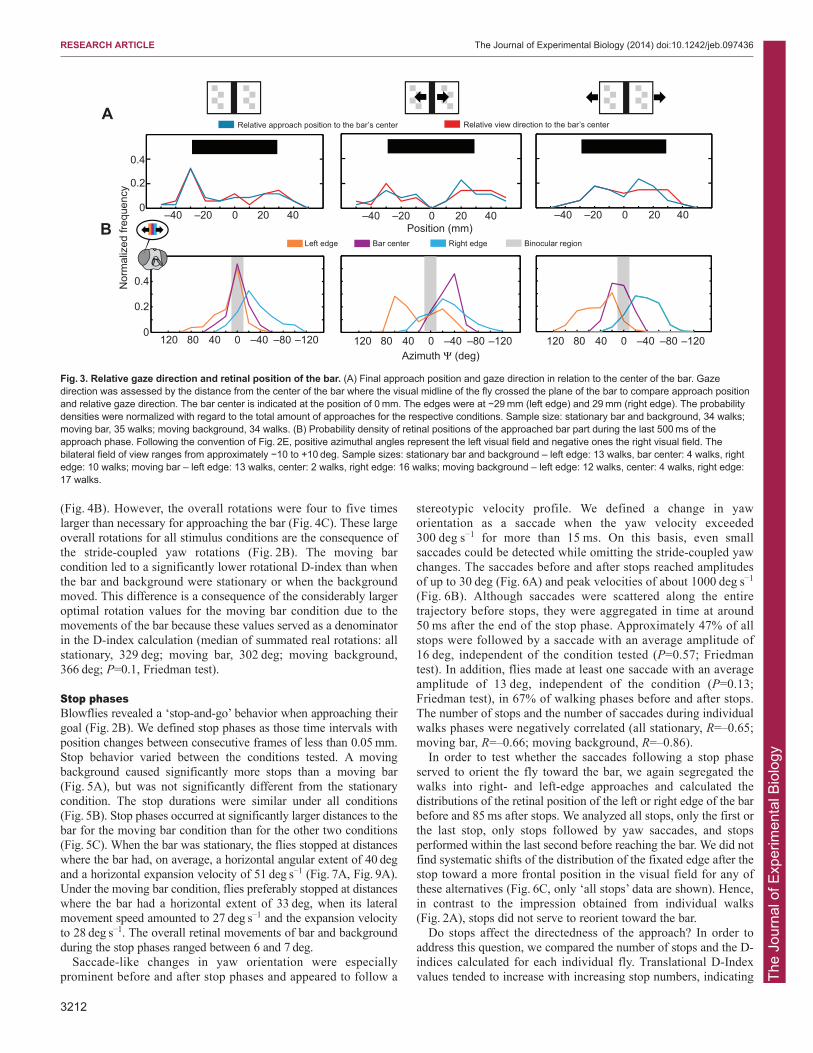
At which retinal position is the goal fixated?We calculated the distance between the bar’s center and the endpoint of the fly’s approach to assess which parts of the bar weretargeted by the flies. The end points were distributed along the entirewidth of the bar (Fig. 3A), except for the stationary condition, whichhad a slight bias toward the left edge of the distribution. This biasmight be caused by slight asymmetries in the random backgroundtexture (see the lower part of the stimulus, Fig. 1A). When either thebar or the background was moving, the asymmetry in thedistribution vanished.
In order to verify that the bar was fixated in the frontal visualfield, we estimated the gaze direction in relation to the center of thebar by determining how far from the center the visual midline of theflies crossed the plane of the bar. Similar to the end point positionsof approaches, the final gaze directions in relation to the bar’s centerwere distributed along its whole width for all stimulus conditionsapart from the stationary one. Here, the flies tended to orient towardthe bar’s left edge. The similarity between the distributions of theend points of approaches and the gaze directions for all conditionsindicates that the gaze of the fly was directed toward the location ofthe bar that they approached (Fig. 3A).
We determined the retinal position of the edges and of the centerof the bar for each walk to assess whether walking flies stabilize thebar in a certain eye region. Flies sometimes changed the fixatededge during the early phase of their approach (Fig. 2; supplementarymaterial Movie 1). Thus, we analyzed the retinal position onlyduring the last 500 ms of the approaches. Most flies did not changetheir fixation preference during this period. Because the fixationpreference for a certain section of the bar varied between walks, we
RESEARCH ARTICLE The Journal of Experimental Biology (2014) doi:10.1242/jeb.097436
A
C
Top view
Camera Projector
StimulusAcrylic box
Bar
Filmed area
LED panel
Projectionscreen
Side view
Φ Body
Φ Head
Φ Left edge
Φ Right edge
B
Fig. 1. Schemes of the walking arena, marker positioning and yaworientation calculation. (A) Box-shaped infrared-transparent acrylic walkingarena (60×70×30 cm, length×width×height). Blowflies were recorded withhigh-speed cameras while approaching a black vertical bar that wasprojected onto the front arena wall (70×30 cm, width×height). The volumefilmed covered an area of 26×21 cm in front of the projection screen.(B) Marker positioning (white dots) on the thorax (body) and the head of theblowflies tested. Magnified images from the top and side cameras weredepicted. Scale bars: 1 cm. (C) Illustration of body (dark blue lines) and head(red lines) yaw orientation estimation. Yaw angles (Φ) were calculated fromvector orientations based on the pixel coordinates of tracked marker points(see Kress and Egelhaaf, 2012). The orientations were estimated in relationto the horizontal axis of the image, which corresponded to the horizontal axisin the walking area. Positive values indicate leftward orientations in relation tothe horizontal, negative values indicate rightward orientations in relation tothe horizontal. Orange and light-blue lines depict the calculation of the leftand right retinal edge positions, respectively. Note that the retinal edgepositions are calculated with respect to the actual head yaw orientation.
The
Jour
nal o
f Exp
erim
enta
l Bio
logy
subdivided them into three classes, depending on whether the fliestended to fixate on the left edge, the center of the bar or the rightedge. The classification was based on the criterion that the barsection with the lowest average retinal velocity was assumed to bethe section that was fixated. On this basis, we identified 38 left-edgewalks, 10 center walks and 43 right-edge walks. Of all the walks, 12could not be classified unambiguously.
Irrespective of whether the center or one of the edges of the barwas approached, the distributions of the retinal bar position wererelatively broad (Fig. 3B). When the bar was stationary, fliespredominantly fixated the respective bar section in the binocular eyeregion. The distributions of the retinal positions were more displacedwith respect to each other for the moving bar condition (Fig. 3B).This characteristic was presumably a consequence of the morecurved approaches that were necessary to reach the bar under thiscondition (Fig. 2; supplementary material Movie 1). When thebackground moved, retinal fixation positions were also slightlydisplaced compared with those under the stationary condition, butnot as much as for the moving bar.
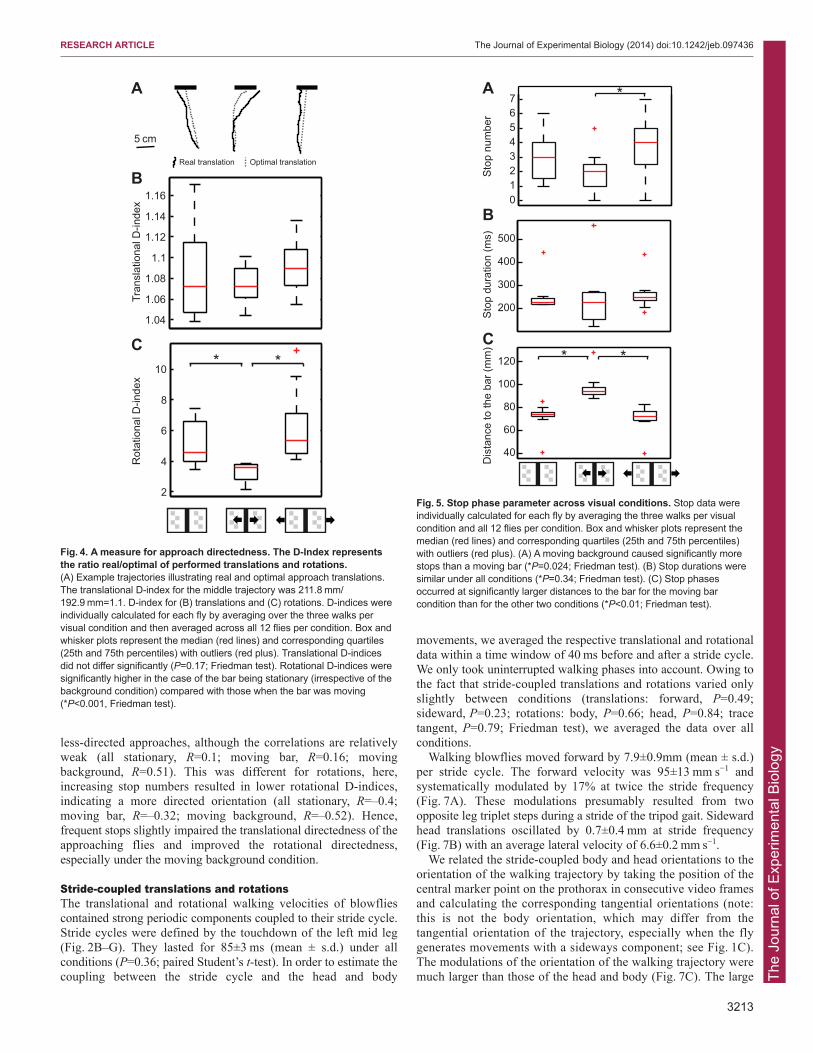
Directedness of approachesIn order to assess whether object or background motion affectedhow directly the goal was approached, we estimated the ratiobetween the length from the actual trajectory to the goal and theshortest possible trajectory (translation D-index=real translation/optimal translation; Fig. 4A) and the ratio between the sum of actualrotations and the minimal rotation that is required to orient towardthe bar (rotation D-index=real rotation/optimal rotation). A D-indexvalue of 1 indicates optimal behavior, and suboptimal behavioryields a D-index >1 (an example calculation is given in the captionof Fig. 4).
If the bar was stationary, a straight translation toward the barwould be optimal, whereas a slightly curved trajectory would beoptimal if the bar was moving. Then, the calculated optimal tracewas determined as a sequence of translations directed to the centerof the bar. For each point in time of an approach (5 ms intervals),we calculated a translation step towards the center of the bar.Because the position of the bar center changed over time, theoptimal approach trajectory had a curved shape. Optimal rotationbehavior corresponds to the minimum rotation required to reach thecenter of the bar from the starting orientation. To obtain this optimalrotation angle, we summated all yaw angle changes that wererequired if the fly oriented along the calculated optimal trajectoryduring its approach to the bar.
Walking flies approached the bar on a near-optimal path withrespect to translation, even if the bar or background were moving
3211
RESEARCH ARTICLE The Journal of Experimental Biology (2014) doi:10.1242/jeb.097436
Fig. 2. Individual walk toward the moving bar. (A) Approach trajectory tothe black bar. The head positions (dots) and yaw orientations (lines)measured every 100 ms of the approach are plotted. Dot and line colorindicate the position of the bar center. Warm colors code a position left of itscentral position in the arena, cold colors code a right position of its centralposition in the arena. Greenish colors code a central position in the arena.The black bar represents the bar position at the end of the approach. Theblack dashed line illustrates the textured background. (B) Head (red) andbody (blue) yaw orientation in relation to a horizontal axis in the walk area.Positive values indicate a leftward orientation, whereas negative valuesindicate a rightward orientation in relation to a horizontal axis in the walkarea. Black arrows indicate saccades after a stop phase (arrow 1) and duringcontinuous walking (arrow 2). Difference angles between body and head yaworientation are indicated by the green line. (C) Forward head velocity(walking speed) of the approaching fly. (D) Lateral head velocity of theapproaching fly. (E) The azimuthal position of the bar in relation to the headyaw orientation of the fly (left edge, orange line; right edge, light-blue line; barcenter, purple line). The dotted lines represent the movement direction of thebar: a positive slope stands for leftward motion, whereas a negative sloperepresents rightward motion. (F) Angular horizontal extent of the bar in thefield of view of the fly. (G) Horizontal retinal edge velocities (left edge, orangeline; right edge, light-blue line). In B–G, the vertical gray lines depict thetouch down time of the left mid leg and, thus, represent the stride cycletiming.
0
500
0
–500
100150
0
50
1Time (s)
deg
s–1
deg
–100
100
0
deg Ψ
–4
20
–2cm s
–1
–40
20
0
–20deg
0
10
cm s
–1
2
Right edgeLeft edge
Right edgeBar center
Body Head Body-head
Left edge
B
A
C
D
E
F
G
Bar movement direction
x 50 mm
y 50
mm
Cen
ter
Left
Rig
ht
1.2.
Top trace
The
Jour
nal o
f Exp
erim
enta
l Bio
logy
3212
(Fig. 4B). However, the overall rotations were four to five timeslarger than necessary for approaching the bar (Fig. 4C). These largeoverall rotations for all stimulus conditions are the consequence ofthe stride-coupled yaw rotations (Fig. 2B). The moving barcondition led to a significantly lower rotational D-index than whenthe bar and background were stationary or when the backgroundmoved. This difference is a consequence of the considerably largeroptimal rotation values for the moving bar condition due to themovements of the bar because these values served as a denominatorin the D-index calculation (median of summated real rotations: allstationary, 329 deg; moving bar, 302 deg; moving background,366 deg; P=0.1, Friedman test).
Stop phasesBlowflies revealed a ‘stop-and-go’ behavior when approaching theirgoal (Fig. 2B). We defined stop phases as those time intervals withposition changes between consecutive frames of less than 0.05 mm.Stop behavior varied between the conditions tested. A movingbackground caused significantly more stops than a moving bar(Fig. 5A), but was not significantly different from the stationarycondition. The stop durations were similar under all conditions(Fig. 5B). Stop phases occurred at significantly larger distances to thebar for the moving bar condition than for the other two conditions(Fig. 5C). When the bar was stationary, the flies stopped at distanceswhere the bar had, on average, a horizontal angular extent of 40 degand a horizontal expansion velocity of 51 deg s−1 (Fig. 7A, Fig. 9A).Under the moving bar condition, flies preferably stopped at distanceswhere the bar had a horizontal extent of 33 deg, when its lateralmovement speed amounted to 27 deg s−1 and the expansion velocityto 28 deg s−1. The overall retinal movements of bar and backgroundduring the stop phases ranged between 6 and 7 deg.
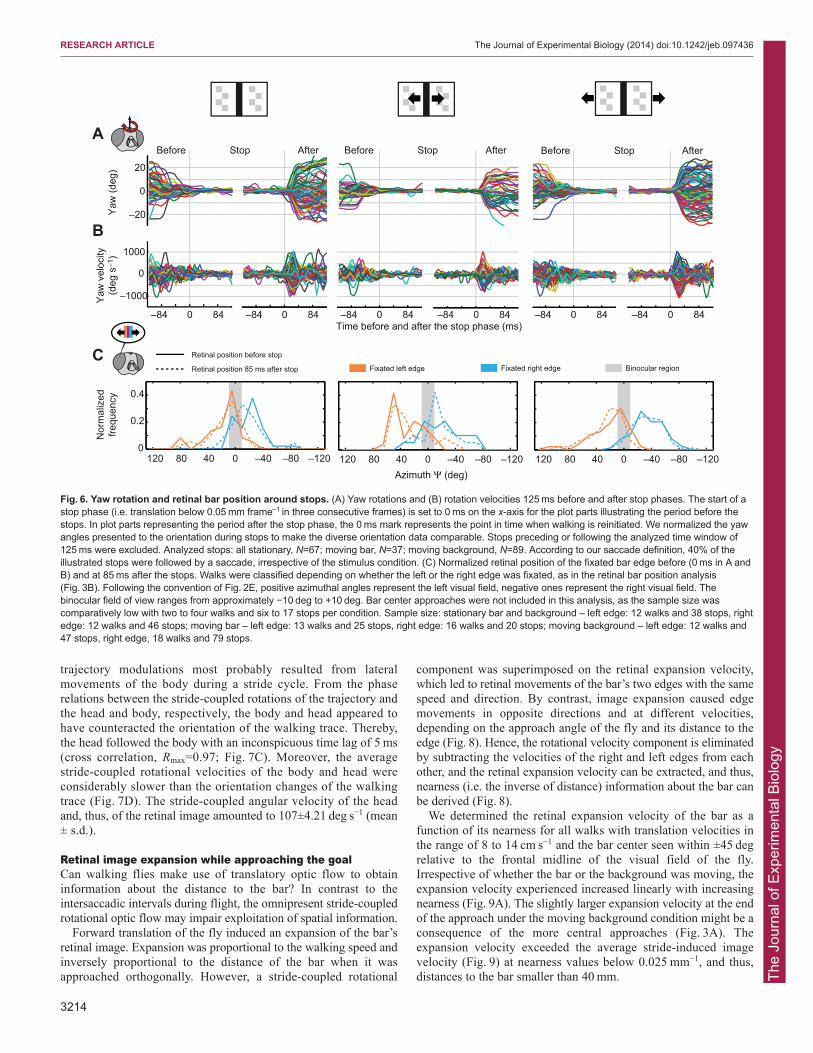
Saccade-like changes in yaw orientation were especiallyprominent before and after stop phases and appeared to follow a
stereotypic velocity profile. We defined a change in yaworientation as a saccade when the yaw velocity exceeded300 deg s−1 for more than 15 ms. On this basis, even smallsaccades could be detected while omitting the stride-coupled yawchanges. The saccades before and after stops reached amplitudesof up to 30 deg (Fig. 6A) and peak velocities of about 1000 deg s−1
(Fig. 6B). Although saccades were scattered along the entiretrajectory before stops, they were aggregated in time at around50 ms after the end of the stop phase. Approximately 47% of allstops were followed by a saccade with an average amplitude of16 deg, independent of the condition tested (P=0.57; Friedmantest). In addition, flies made at least one saccade with an averageamplitude of 13 deg, independent of the condition (P=0.13;Friedman test), in 67% of walking phases before and after stops.The number of stops and the number of saccades during individualwalks phases were negatively correlated (all stationary, R=–0.65;moving bar, R=–0.66; moving background, R=–0.86).
In order to test whether the saccades following a stop phaseserved to orient the fly toward the bar, we again segregated thewalks into right- and left-edge approaches and calculated thedistributions of the retinal position of the left or right edge of the barbefore and 85 ms after stops. We analyzed all stops, only the first orthe last stop, only stops followed by yaw saccades, and stopsperformed within the last second before reaching the bar. We did notfind systematic shifts of the distribution of the fixated edge after thestop toward a more frontal position in the visual field for any ofthese alternatives (Fig. 6C, only ‘all stops’ data are shown). Hence,in contrast to the impression obtained from individual walks(Fig. 2A), stops did not serve to reorient toward the bar.
Do stops affect the directedness of the approach? In order toaddress this question, we compared the number of stops and the D-indices calculated for each individual fly. Translational D-Indexvalues tended to increase with increasing stop numbers, indicating
RESEARCH ARTICLE The Journal of Experimental Biology (2014) doi:10.1242/jeb.097436
–120–80–40040801200
0.2
0.4
Azimuth Ψ (deg)
Nor
mal
ized
freq
uenc
y
–120–80–4004080120 –120–80–4004080120
Right edgeBar centerLeft edge
–40 –20 0 20 400
0.2
0.4
Position (mm)–40 –20 0 20 40–40 –20 0 20 40
Relative approach position to the bar’s center Relative view direction to the bar’s centerA
BBinocular region
Fig. 3. Relative gaze direction and retinal position of the bar. (A) Final approach position and gaze direction in relation to the center of the bar. Gazedirection was assessed by the distance from the center of the bar where the visual midline of the fly crossed the plane of the bar to compare approach positionand relative gaze direction. The bar center is indicated at the position of 0 mm. The edges were at −29 mm (left edge) and 29 mm (right edge). The probabilitydensities were normalized with regard to the total amount of approaches for the respective conditions. Sample size: stationary bar and background, 34 walks;moving bar, 35 walks; moving background, 34 walks. (B) Probability density of retinal positions of the approached bar part during the last 500 ms of theapproach phase. Following the convention of Fig. 2E, positive azimuthal angles represent the left visual field and negative ones the right visual field. Thebilateral field of view ranges from approximately −10 to +10 deg. Sample sizes: stationary bar and background – left edge: 13 walks, bar center: 4 walks, rightedge: 10 walks; moving bar – left edge: 13 walks, center: 2 walks, right edge: 16 walks; moving background – left edge: 12 walks, center: 4 walks, right edge:17 walks.
The
Jour
nal o
f Exp
erim
enta
l Bio
logy
less-directed approaches, although the correlations are relativelyweak (all stationary, R=0.1; moving bar, R=0.16; movingbackground, R=0.51). This was different for rotations, here,increasing stop numbers resulted in lower rotational D-indices,indicating a more directed orientation (all stationary, R=–0.4;moving bar, R=–0.32; moving background, R=–0.52). Hence,frequent stops slightly impaired the translational directedness of theapproaching flies and improved the rotational directedness,especially under the moving background condition.
Stride-coupled translations and rotationsThe translational and rotational walking velocities of blowfliescontained strong periodic components coupled to their stride cycle.Stride cycles were defined by the touchdown of the left mid leg(Fig. 2B–G). They lasted for 85±3 ms (mean ± s.d.) under allconditions (P=0.36; paired Student’s t-test). In order to estimate thecoupling between the stride cycle and the head and body
movements, we averaged the respective translational and rotationaldata within a time window of 40 ms before and after a stride cycle.We only took uninterrupted walking phases into account. Owing tothe fact that stride-coupled translations and rotations varied onlyslightly between conditions (translations: forward, P=0.49;sideward, P=0.23; rotations: body, P=0.66; head, P=0.84; tracetangent, P=0.79; Friedman test), we averaged the data over allconditions.
Walking blowflies moved forward by 7.9±0.9mm (mean ± s.d.)per stride cycle. The forward velocity was 95±13 mm s−1 andsystematically modulated by 17% at twice the stride frequency(Fig. 7A). These modulations presumably resulted from twoopposite leg triplet steps during a stride of the tripod gait. Sidewardhead translations oscillated by 0.7±0.4 mm at stride frequency(Fig. 7B) with an average lateral velocity of 6.6±0.2 mm s−1.
We related the stride-coupled body and head orientations to theorientation of the walking trajectory by taking the position of thecentral marker point on the prothorax in consecutive video framesand calculating the corresponding tangential orientations (note:this is not the body orientation, which may differ from thetangential orientation of the trajectory, especially when the flygenerates movements with a sideways component; see Fig. 1C).The modulations of the orientation of the walking trajectory weremuch larger than those of the head and body (Fig. 7C). The large
3213
RESEARCH ARTICLE The Journal of Experimental Biology (2014) doi:10.1242/jeb.097436
1.04
1.06
1.08
1.1
1.12
1.14
1.16
Tran
slat
iona
l D-in
dex
2
4
6
8
10
Rot
atio
nal D
-inde
x
A
C
B
* *
5 cm
Real translation Optimal translation
Fig. 4. A measure for approach directedness. The D-Index representsthe ratio real/optimal of performed translations and rotations.(A) Example trajectories illustrating real and optimal approach translations.The translational D-index for the middle trajectory was 211.8 mm/192.9 mm=1.1. D-index for (B) translations and (C) rotations. D-indices wereindividually calculated for each fly by averaging over the three walks pervisual condition and then averaged across all 12 flies per condition. Box andwhisker plots represent the median (red lines) and corresponding quartiles(25th and 75th percentiles) with outliers (red plus). Translational D-indicesdid not differ significantly (P=0.17; Friedman test). Rotational D-indices weresignificantly higher in the case of the bar being stationary (irrespective of thebackground condition) compared with those when the bar was moving(*P<0.001, Friedman test).
01234567
Sto
p nu
mbe
r
40
60
80
100
120
Dis
tanc
e to
the
bar (
mm
)
200
300
400
500
Sto
p du
ratio
n (m
s)
A
B
C*
*
*
Fig. 5. Stop phase parameter across visual conditions. Stop data wereindividually calculated for each fly by averaging the three walks per visualcondition and all 12 flies per condition. Box and whisker plots represent themedian (red lines) and corresponding quartiles (25th and 75th percentiles)with outliers (red plus). (A) A moving background caused significantly morestops than a moving bar (*P=0.024; Friedman test). (B) Stop durations weresimilar under all conditions (*P=0.34; Friedman test). (C) Stop phasesoccurred at significantly larger distances to the bar for the moving barcondition than for the other two conditions (*P<0.01; Friedman test).
The
Jour
nal o
f Exp
erim
enta
l Bio
logy
3214
trajectory modulations most probably resulted from lateralmovements of the body during a stride cycle. From the phaserelations between the stride-coupled rotations of the trajectory andthe head and body, respectively, the body and head appeared tohave counteracted the orientation of the walking trace. Thereby,the head followed the body with an inconspicuous time lag of 5 ms(cross correlation, Rmax=0.97; Fig. 7C). Moreover, the averagestride-coupled rotational velocities of the body and head wereconsiderably slower than the orientation changes of the walkingtrace (Fig. 7D). The stride-coupled angular velocity of the headand, thus, of the retinal image amounted to 107±4.21 deg s−1 (mean± s.d.).
Retinal image expansion while approaching the goalCan walking flies make use of translatory optic flow to obtaininformation about the distance to the bar? In contrast to theintersaccadic intervals during flight, the omnipresent stride-coupledrotational optic flow may impair exploitation of spatial information.
Forward translation of the fly induced an expansion of the bar’sretinal image. Expansion was proportional to the walking speed andinversely proportional to the distance of the bar when it wasapproached orthogonally. However, a stride-coupled rotational
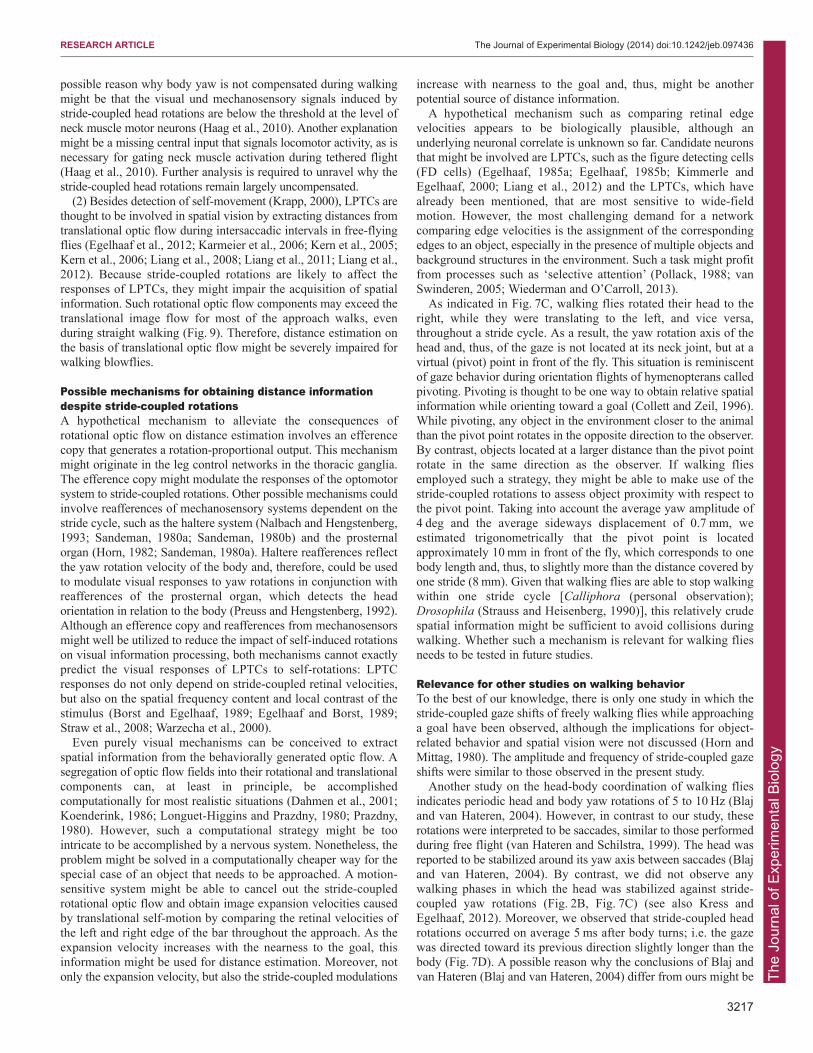
component was superimposed on the retinal expansion velocity,which led to retinal movements of the bar’s two edges with the samespeed and direction. By contrast, image expansion caused edgemovements in opposite directions and at different velocities,depending on the approach angle of the fly and its distance to theedge (Fig. 8). Hence, the rotational velocity component is eliminatedby subtracting the velocities of the right and left edges from eachother, and the retinal expansion velocity can be extracted, and thus,nearness (i.e. the inverse of distance) information about the bar canbe derived (Fig. 8).
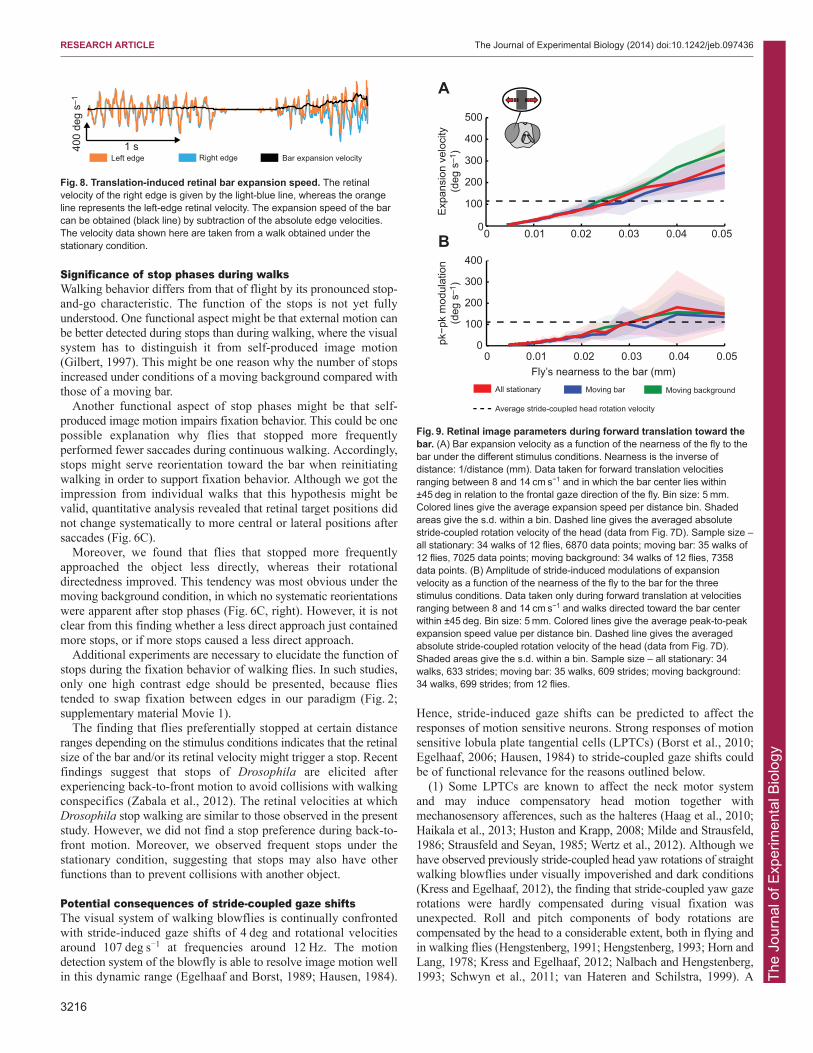
We determined the retinal expansion velocity of the bar as afunction of its nearness for all walks with translation velocities inthe range of 8 to 14 cm s−1 and the bar center seen within ±45 degrelative to the frontal midline of the visual field of the fly.Irrespective of whether the bar or the background was moving, theexpansion velocity experienced increased linearly with increasingnearness (Fig. 9A). The slightly larger expansion velocity at the endof the approach under the moving background condition might be aconsequence of the more central approaches (Fig. 3A). Theexpansion velocity exceeded the average stride-induced imagevelocity (Fig. 9) at nearness values below 0.025 mm−1, and thus,distances to the bar smaller than 40 mm.
RESEARCH ARTICLE The Journal of Experimental Biology (2014) doi:10.1242/jeb.097436
–20
0
20
Yaw
(deg
)
–84 0 84
–1000
0
1000
Yaw
vel
ocity
(deg
s–1
)
Time before and after the stop phase (ms)
F
A
–84 0 84 –84 0 84 –84 0 84 –84 0 84 –84 0 84
B
C
StopBefore After StopBefore After StopBefore After
Azimuth Ψ (deg)
Fixated right edgeFixated left edge Binocular regionRetinal position 85 ms after stop
Retinal position before stop
–120–80–40040801200
0.2
0.4
Nor
mal
ized
frequ
ency
–120–80–4004080120 –120–80–4004080120
Fig. 6. Yaw rotation and retinal bar position around stops. (A) Yaw rotations and (B) rotation velocities 125 ms before and after stop phases. The start of astop phase (i.e. translation below 0.05 mm frame–1 in three consecutive frames) is set to 0 ms on the x-axis for the plot parts illustrating the period before thestops. In plot parts representing the period after the stop phase, the 0 ms mark represents the point in time when walking is reinitiated. We normalized the yawangles presented to the orientation during stops to make the diverse orientation data comparable. Stops preceding or following the analyzed time window of125 ms were excluded. Analyzed stops: all stationary, N=67; moving bar, N=37; moving background, N=89. According to our saccade definition, 40% of theillustrated stops were followed by a saccade, irrespective of the stimulus condition. (C) Normalized retinal position of the fixated bar edge before (0 ms in A andB) and at 85 ms after the stops. Walks were classified depending on whether the left or the right edge was fixated, as in the retinal bar position analysis(Fig. 3B). Following the convention of Fig. 2E, positive azimuthal angles represent the left visual field, negative ones represent the right visual field. Thebinocular field of view ranges from approximately −10 deg to +10 deg. Bar center approaches were not included in this analysis, as the sample size wascomparatively low with two to four walks and six to 17 stops per condition. Sample size: stationary bar and background – left edge: 12 walks and 38 stops, rightedge: 12 walks and 46 stops; moving bar – left edge: 13 walks and 25 stops, right edge: 16 walks and 20 stops; moving background – left edge: 12 walks and47 stops, right edge, 18 walks and 79 stops.
The
Jour
nal o
f Exp
erim
enta
l Bio
logy
The expansion flow experienced did not increase monotonically,but was modulated in a stride-coupled manner (Fig. 8). Thesemodulations became larger the nearer the fly got to the bar. In orderto quantify these translation-based modulations of the image flow,we estimated their amplitudes within a time window between 40 msbefore and after the reference point of a stride cycle and thecorresponding nearness of the fly to the bar for the same walks, asanalyzed for Fig. 9A. We omitted stride cycles immediately beforeand after a stop phase. Stride-induced modulations of expansionvelocity were similar for all stimulus conditions tested (Fig. 9B) androse with the increasing nearness to the bar up to a nearness of0.03 mm−1, corresponding to a distance of 33 mm. Stride-inducedmodulations were scaled with the overall increase of expansionvelocity and, irrespective of the nearness, amounted to 58% of theoverall expansion velocity. Hence, the amplitude of stride-coupled
optic flow modulations may be another cue of distance informationin relation to a goal.
DISCUSSIONWalking flies orienting toward a goal experienced relatively strongrotational yaw gaze shifts of approximately 4 deg, even duringstraight phases of locomotion. These gaze shifts were modulatedat a stride frequency of approximately 12 Hz. This situation differsgreatly from flying flies, where rotations and translations arelargely segregated by an active gaze strategy (Boeddeker et al.,2010; Braun et al., 2010; Egelhaaf et al., 2012; Schilstra and vanHateren, 1999; van Hateren and Schilstra, 1999). Becausetranslations were superimposed with stride-induced rotationalretinal image shifts at all times in walking flies, the acquisition ofspatial information might be impaired. Consequently, flies arelikely to use different computational strategies to obtain distanceinformation during flight and walking. The translational flowvelocity exceeded the rotational one and might be used by the flyfor distance estimation only if flies were closer to the bar than40 mm. On the basis of our findings, whether walking blowfliesreally make use of the retinal expansion velocity or the amplitudeof its stride-coupled modulations cannot be assessed (Fig. 9).However, a previous study has indicated that translation-inducededge motion is used by walking Drosophila as a distance cue(Schuster et al., 2002).
Given that optomotor-following responses were found tocounteract retinal wide-field motion (Götz, 1975; Hengstenberg,1993), it was unexpected that the directedness of object-inducedwalks in our walking experiments did not deteriorate when eitherthe object or the background was moved. Moreover, wide-fieldmotion caused externally only slightly changed the retinal fixationposition (Fig. 3B). Hence, the gain of the optomotor system may bereduced during fixation behavior, potentially in a manner similar tothat which has been concluded for tethered flying Drosophila in afixation paradigm (Fox et al., 2014) and free-flying male blowflieschasing after a moving female-like target (Trischler et al., 2010).Moreover, consistent with our results on walking blowflies, it couldbe shown that tethered flying Drosophila do not track movingobjects by head movements, but rather follow the backgroundmotion. Nevertheless, they are able to approach the object (Fox andFrye, 2014).
3215
RESEARCH ARTICLE The Journal of Experimental Biology (2014) doi:10.1242/jeb.097436
–4
–2
0
2
4
deg
cm s
–1cm
s–1
–40 –20 0 20 40
–400
–200
0
200
400
deg
s–1
Time round stride (ms)
9.0
9.5
10
2
0
2
Velocity
Body yaw Head yaw Trace tangent yaw
A
B
C
D
Fig. 7. Averaged translations and rotations within a stride cycle (80 ms).Colored lines represent the averaged head data across conditions. Shadedareas represent the s.d. between conditions. The vertical line at the 0 msmark indicates the stride cycle start or end, i.e. in the case of all six legsperforming a step. (A) Averaged forward translation velocity of the headwithin a stride cycle. The horizontal red line represents the average forwardvelocity during walking. (B) Averaged lateral velocity of the head within astride cycle. Positive velocities indicate left shifts, negative ones indicate rightshifts. Averaged steps for the analysis of stride-coupled translations: allstationary=451; moving bar=542; moving background=439; from 12 flies.(C) Averaged yaw angles of the head (red), the body (blue) and the tracetangent (green) within a stride cycle. Trace tangent: tangential orientation ofthe time-dependent position trace of the central marker point on theprothorax. Positive angles indicate an orientation to the left, whereasnegative ones indicate an orientation to the right in relation to a horizontalaxis in the walk area. The individual mean orientations were subtracted toallow averaging over different walks. (D) Averaged yaw rotation velocities ofthe head (red), the body (blue) and the trace tangent (green) within a stridecycle. Positive velocities indicate left turns, negative ones indicate right turns.Averaged steps for the analysis of stride-coupled rotations: all stationary=273steps from seven flies; moving bar=333 steps from seven flies; movingbackground=338 steps from eight flies.
The
Jour
nal o
f Exp
erim
enta
l Bio
logy
3216
Significance of stop phases during walksWalking behavior differs from that of flight by its pronounced stop-and-go characteristic. The function of the stops is not yet fullyunderstood. One functional aspect might be that external motion canbe better detected during stops than during walking, where the visualsystem has to distinguish it from self-produced image motion(Gilbert, 1997). This might be one reason why the number of stopsincreased under conditions of a moving background compared withthose of a moving bar.
Another functional aspect of stop phases might be that self-produced image motion impairs fixation behavior. This could be onepossible explanation why flies that stopped more frequentlyperformed fewer saccades during continuous walking. Accordingly,stops might serve reorientation toward the bar when reinitiatingwalking in order to support fixation behavior. Although we got theimpression from individual walks that this hypothesis might bevalid, quantitative analysis revealed that retinal target positions didnot change systematically to more central or lateral positions aftersaccades (Fig. 6C).
Moreover, we found that flies that stopped more frequentlyapproached the object less directly, whereas their rotationaldirectedness improved. This tendency was most obvious under themoving background condition, in which no systematic reorientationswere apparent after stop phases (Fig. 6C, right). However, it is notclear from this finding whether a less direct approach just containedmore stops, or if more stops caused a less direct approach.
Additional experiments are necessary to elucidate the function ofstops during the fixation behavior of walking flies. In such studies,only one high contrast edge should be presented, because fliestended to swap fixation between edges in our paradigm (Fig. 2;supplementary material Movie 1).
The finding that flies preferentially stopped at certain distanceranges depending on the stimulus conditions indicates that the retinalsize of the bar and/or its retinal velocity might trigger a stop. Recentfindings suggest that stops of Drosophila are elicited afterexperiencing back-to-front motion to avoid collisions with walkingconspecifics (Zabala et al., 2012). The retinal velocities at whichDrosophila stop walking are similar to those observed in the presentstudy. However, we did not find a stop preference during back-to-front motion. Moreover, we observed frequent stops under thestationary condition, suggesting that stops may also have otherfunctions than to prevent collisions with another object.
Potential consequences of stride-coupled gaze shiftsThe visual system of walking blowflies is continually confrontedwith stride-induced gaze shifts of 4 deg and rotational velocitiesaround 107 deg s−1 at frequencies around 12 Hz. The motiondetection system of the blowfly is able to resolve image motion wellin this dynamic range (Egelhaaf and Borst, 1989; Hausen, 1984).
Hence, stride-induced gaze shifts can be predicted to affect theresponses of motion sensitive neurons. Strong responses of motionsensitive lobula plate tangential cells (LPTCs) (Borst et al., 2010;Egelhaaf, 2006; Hausen, 1984) to stride-coupled gaze shifts couldbe of functional relevance for the reasons outlined below.
(1) Some LPTCs are known to affect the neck motor system and may induce compensatory head motion together withmechanosensory afferences, such as the halteres (Haag et al., 2010;Haikala et al., 2013; Huston and Krapp, 2008; Milde and Strausfeld,1986; Strausfeld and Seyan, 1985; Wertz et al., 2012). Although wehave observed previously stride-coupled head yaw rotations of straightwalking blowflies under visually impoverished and dark conditions(Kress and Egelhaaf, 2012), the finding that stride-coupled yaw gazerotations were hardly compensated during visual fixation wasunexpected. Roll and pitch components of body rotations arecompensated by the head to a considerable extent, both in flying andin walking flies (Hengstenberg, 1991; Hengstenberg, 1993; Horn andLang, 1978; Kress and Egelhaaf, 2012; Nalbach and Hengstenberg,1993; Schwyn et al., 2011; van Hateren and Schilstra, 1999). A
RESEARCH ARTICLE The Journal of Experimental Biology (2014) doi:10.1242/jeb.097436
Right edgeLeft edge Bar expansion velocity1 s40
0 de
g s–
1
Fig. 8. Translation-induced retinal bar expansion speed. The retinalvelocity of the right edge is given by the light-blue line, whereas the orangeline represents the left-edge retinal velocity. The expansion speed of the barcan be obtained (black line) by subtraction of the absolute edge velocities.The velocity data shown here are taken from a walk obtained under thestationary condition.
Exp
ansi
on v
eloc
ity(d
eg s
–1)
Fly’s nearness to the bar (mm)
pk−p
k m
odul
atio
n(d
eg s
–1)
All stationary Moving bar
Average stride-coupled head rotation velocity
Moving background
A
B 0 0.01 0.02 0.03 0.04 0.050
100
200
300
400
500
0 0.01 0.02 0.03 0.04 0.050
100
200
300
400
Fig. 9. Retinal image parameters during forward translation toward thebar. (A) Bar expansion velocity as a function of the nearness of the fly to thebar under the different stimulus conditions. Nearness is the inverse ofdistance: 1/distance (mm). Data taken for forward translation velocitiesranging between 8 and 14 cm s−1 and in which the bar center lies within±45 deg in relation to the frontal gaze direction of the fly. Bin size: 5 mm.Colored lines give the average expansion speed per distance bin. Shadedareas give the s.d. within a bin. Dashed line gives the averaged absolutestride-coupled rotation velocity of the head (data from Fig. 7D). Sample size –all stationary: 34 walks of 12 flies, 6870 data points; moving bar: 35 walks of12 flies, 7025 data points; moving background: 34 walks of 12 flies, 7358data points. (B) Amplitude of stride-induced modulations of expansionvelocity as a function of the nearness of the fly to the bar for the threestimulus conditions. Data taken only during forward translation at velocitiesranging between 8 and 14 cm s−1 and walks directed toward the bar centerwithin ±45 deg. Bin size: 5 mm. Colored lines give the average peak-to-peakexpansion speed value per distance bin. Dashed line gives the averagedabsolute stride-coupled rotation velocity of the head (data from Fig. 7D).Shaded areas give the s.d. within a bin. Sample size – all stationary: 34walks, 633 strides; moving bar: 35 walks, 609 strides; moving background:34 walks, 699 strides; from 12 flies.
The
Jour
nal o
f Exp
erim
enta
l Bio
logy
possible reason why body yaw is not compensated during walkingmight be that the visual und mechanosensory signals induced bystride-coupled head rotations are below the threshold at the level ofneck muscle motor neurons (Haag et al., 2010). Another explanationmight be a missing central input that signals locomotor activity, as isnecessary for gating neck muscle activation during tethered flight(Haag et al., 2010). Further analysis is required to unravel why thestride-coupled head rotations remain largely uncompensated.
(2) Besides detection of self-movement (Krapp, 2000), LPTCs arethought to be involved in spatial vision by extracting distances fromtranslational optic flow during intersaccadic intervals in free-flyingflies (Egelhaaf et al., 2012; Karmeier et al., 2006; Kern et al., 2005;Kern et al., 2006; Liang et al., 2008; Liang et al., 2011; Liang et al.,2012). Because stride-coupled rotations are likely to affect theresponses of LPTCs, they might impair the acquisition of spatialinformation. Such rotational optic flow components may exceed thetranslational image flow for most of the approach walks, evenduring straight walking (Fig. 9). Therefore, distance estimation onthe basis of translational optic flow might be severely impaired forwalking blowflies.
Possible mechanisms for obtaining distance informationdespite stride-coupled rotationsA hypothetical mechanism to alleviate the consequences ofrotational optic flow on distance estimation involves an efferencecopy that generates a rotation-proportional output. This mechanismmight originate in the leg control networks in the thoracic ganglia.The efference copy might modulate the responses of the optomotorsystem to stride-coupled rotations. Other possible mechanisms couldinvolve reafferences of mechanosensory systems dependent on thestride cycle, such as the haltere system (Nalbach and Hengstenberg,1993; Sandeman, 1980a; Sandeman, 1980b) and the prosternalorgan (Horn, 1982; Sandeman, 1980a). Haltere reafferences reflectthe yaw rotation velocity of the body and, therefore, could be usedto modulate visual responses to yaw rotations in conjunction withreafferences of the prosternal organ, which detects the headorientation in relation to the body (Preuss and Hengstenberg, 1992).Although an efference copy and reafferences from mechanosensorsmight well be utilized to reduce the impact of self-induced rotationson visual information processing, both mechanisms cannot exactlypredict the visual responses of LPTCs to self-rotations: LPTCresponses do not only depend on stride-coupled retinal velocities,but also on the spatial frequency content and local contrast of thestimulus (Borst and Egelhaaf, 1989; Egelhaaf and Borst, 1989;Straw et al., 2008; Warzecha et al., 2000).
Even purely visual mechanisms can be conceived to extractspatial information from the behaviorally generated optic flow. Asegregation of optic flow fields into their rotational and translationalcomponents can, at least in principle, be accomplishedcomputationally for most realistic situations (Dahmen et al., 2001;Koenderink, 1986; Longuet-Higgins and Prazdny, 1980; Prazdny,1980). However, such a computational strategy might be toointricate to be accomplished by a nervous system. Nonetheless, theproblem might be solved in a computationally cheaper way for thespecial case of an object that needs to be approached. A motion-sensitive system might be able to cancel out the stride-coupledrotational optic flow and obtain image expansion velocities causedby translational self-motion by comparing the retinal velocities ofthe left and right edge of the bar throughout the approach. As theexpansion velocity increases with the nearness to the goal, thisinformation might be used for distance estimation. Moreover, notonly the expansion velocity, but also the stride-coupled modulations
increase with nearness to the goal and, thus, might be anotherpotential source of distance information.
A hypothetical mechanism such as comparing retinal edgevelocities appears to be biologically plausible, although anunderlying neuronal correlate is unknown so far. Candidate neuronsthat might be involved are LPTCs, such as the figure detecting cells(FD cells) (Egelhaaf, 1985a; Egelhaaf, 1985b; Kimmerle andEgelhaaf, 2000; Liang et al., 2012) and the LPTCs, which havealready been mentioned, that are most sensitive to wide-fieldmotion. However, the most challenging demand for a networkcomparing edge velocities is the assignment of the correspondingedges to an object, especially in the presence of multiple objects andbackground structures in the environment. Such a task might profitfrom processes such as ‘selective attention’ (Pollack, 1988; vanSwinderen, 2005; Wiederman and O’Carroll, 2013).
As indicated in Fig. 7C, walking flies rotated their head to theright, while they were translating to the left, and vice versa,throughout a stride cycle. As a result, the yaw rotation axis of thehead and, thus, of the gaze is not located at its neck joint, but at avirtual (pivot) point in front of the fly. This situation is reminiscentof gaze behavior during orientation flights of hymenopterans calledpivoting. Pivoting is thought to be one way to obtain relative spatialinformation while orienting toward a goal (Collett and Zeil, 1996).While pivoting, any object in the environment closer to the animalthan the pivot point rotates in the opposite direction to the observer.By contrast, objects located at a larger distance than the pivot pointrotate in the same direction as the observer. If walking fliesemployed such a strategy, they might be able to make use of thestride-coupled rotations to assess object proximity with respect tothe pivot point. Taking into account the average yaw amplitude of4 deg and the average sideways displacement of 0.7 mm, weestimated trigonometrically that the pivot point is locatedapproximately 10 mm in front of the fly, which corresponds to onebody length and, thus, to slightly more than the distance covered byone stride (8 mm). Given that walking flies are able to stop walkingwithin one stride cycle [Calliphora (personal observation);Drosophila (Strauss and Heisenberg, 1990)], this relatively crudespatial information might be sufficient to avoid collisions duringwalking. Whether such a mechanism is relevant for walking fliesneeds to be tested in future studies.
Relevance for other studies on walking behaviorTo the best of our knowledge, there is only one study in which thestride-coupled gaze shifts of freely walking flies while approachinga goal have been observed, although the implications for object-related behavior and spatial vision were not discussed (Horn andMittag, 1980). The amplitude and frequency of stride-coupled gazeshifts were similar to those observed in the present study.
Another study on the head-body coordination of walking fliesindicates periodic head and body yaw rotations of 5 to 10 Hz (Blajand van Hateren, 2004). However, in contrast to our study, theserotations were interpreted to be saccades, similar to those performedduring free flight (van Hateren and Schilstra, 1999). The head wasreported to be stabilized around its yaw axis between saccades (Blajand van Hateren, 2004). By contrast, we did not observe anywalking phases in which the head was stabilized against stride-coupled yaw rotations (Fig. 2B, Fig. 7C) (see also Kress andEgelhaaf, 2012). Moreover, we observed that stride-coupled headrotations occurred on average 5 ms after body turns; i.e. the gazewas directed toward its previous direction slightly longer than thebody (Fig. 7D). A possible reason why the conclusions of Blaj andvan Hateren (Blaj and van Hateren, 2004) differ from ours might be
3217
RESEARCH ARTICLE The Journal of Experimental Biology (2014) doi:10.1242/jeb.097436
The
Jour
nal o
f Exp
erim
enta
l Bio
logy
3218
that they attached coils to the head and body of the fly and that theirflies were walking significantly slower than those in ourexperiments. The slower walking style in combination with theweight of the magnetic coils might have changed the gaze behaviorof the flies. Moreover, their study did not provide stride data and,hence, was unable to assess how the stride cycle and the orientationof head and body might be coupled (for a more detailed discussion,see Kress and Egelhaaf, 2012).
Hence, we are confident that the stride-coupled gaze rotationsobserved here are genuine and that they are likely to haveconsequences for spatial vision, because walking flies do notgenerate relatively pure translational optic flow in contrast to flyingones. This conclusion is corroborated by a recent study that usednovel leg and body tracking techniques to analyze gaitcharacteristics in Drosophila (Mendes et al., 2013). Although thispoint is not explicitly made in this study, we can infer fromscrutinizing the data that Drosophila also experience stride-coupledmodulations of body translations and rotations similar to the onesthat we describe here.
MATERIALS AND METHODSFlies and preparationWe used female blowflies, Calliphora vicina, from our laboratory stock1–3 days post eclosion. We briefly anesthetized the flies with CO2 andplaced a drop of melted beeswax on each wing base to prevent them fromflying.
We placed one marker point of nontoxic acrylic paint (Hobby Line, C.Kreul, Hallerndorf, Germany) on the head and three points on the thorax forthe automatic tracking of head and body position and orientation (Fig. 1B)(Kress and Egelhaaf, 2012).
Experimental setupWe recorded the walking flies using two infrared-sensitive cameras (CR 600,Optronis GmbH, Kehl, Germany), equipped with DG MACRO 24–70 mmlenses (SIGMA GmbH, Roedermark, Germany) at 200 frames s–1. Thewalking arena consisted of an infrared-transparent acrylic box with a rearprojection screen (Studio®, Gerriets GmbH, Umkirch, Germany) as the front wall. It was placed in a dark room (Fig. 1A). The left-side wall of thearena was covered with white cardboard containing a hole of a diameter of7 cm for the side camera. The opposite side wall was equally textured,including a dummy camera hole to keep the arena appearance symmetrical.The arena floor was covered with black cardboard. The acrylic walls werespecially coated to allow only light of wavelengths larger than 700 nm topass through the walls (LUXACRYL-IR, TTV GmbH, Geretsried,Germany).
We used four custom-built LED panels as light sources. Two panelsconsisted of infrared (IR) LEDs with a peak emission of λ=890 nm, and theother two consisted of IR LEDs with a peak emission of λ=850 nm (GaAIAsDouble Hetero, VISHAY Electronic GmbH, Selb, Germany). All panelsemitted light at wavelengths far beyond the sensitive range of flyphotoreceptors (Hardie, 1979). This led to an illuminance of 60 lx in thecenter of the recording area (recorded using an IL 1700 radiometer,International Light, Newburyport, USA).
The IR light sources and IR-sensitive cameras in combination with thespecially coated acrylic walking arena guaranteed that the projection screendisplaying the visual stimulus was the only perceivable light source for theflies tested.
Visual stimuliWe used an LCD projector with a refresh rate of 85 Hz and a resolution of1280×720 pixels (PT-AX200E, Panasonic® Deutschland, Hamburg,Germany) for stimulus presentation. We ensured in preliminary experimentsthat this refresh rate was sufficient to elicit object fixation behavior, asestablished in earlier studies (Pick, 1976; Virsik and Reichardt, 1976).
Visual stimulation was controlled by custom-written scripts of thePsychophysics Toolbox Version 3 (PTB-3, http://psychtoolbox.org/
HomePage) in MATLAB (The MathWorks, Natick, MA, USA). The visualstimuli consisted of a background pattern and a centrally positioned verticalblack bar (‘stimulus’ in Fig. 1A). The background consisted of a randompattern of gray and white squares of 1 cm edge length and an angular extentof 2.9 deg at a distance of 20 cm. The Michelson contrast was 0.34(luminance: gray squares, 32±3 cd m–2; white squares: 65±6 cd m–2). The barwas positioned in the center of the screen in front of the background. It had asize of 5.8×30 cm, corresponding to 16×56 deg at a distance of 20 cm. The bar(luminance: 1.4±0.2 cd m–2) had a Michelson contrast of 0.96 with the whitesquares of the background and of 0.91 with the gray squares of thebackground. Even at the initial distance of 20 cm, the bar and backgroundelements already covered several neighboring ommatidia, given theinterommatidial angle of 1.2 deg in the frontal visual field (Petrowitz et al.,2000).
Three types of stimulus condition were used. (1) Stationary condition: thebar and the background were stationary (‘stimulus’ in Fig.1A). Perceivedstimulus motion solely resulted from self-movement of the fly. (2) Movingbar condition: the bar was oscillating around its central position in front ofthe stationary background at a constant velocity of 5 cm s−1 and a frequencyof 0.25 Hz, resulting in movement of 5 cm to each side. (3) Movingbackground condition: while the vertical bar was stationary, the backgroundwas oscillating horizontally with the same movement parameters as the barunder the moving bar condition.
We installed two phototransistors above the walking arena facing theprojection screen, which monitored the brightness changes resulting fromthe moving patterns to obtain positional information about the moving barand the moving background. Each of the phototransistors was connected toan IR-LED, which signaled the pattern movement and was visible for theside camera. In this way, the timing of the texture movement could bemonitored precisely.
Experimental procedureMarked flies were released at the rear of the recording area while facing theprojection screen. The synchronized cameras started recording and storedthe images in a ring buffer (maximal recording time of 8 s). After the fly hadreached the bar, we stopped recording and transferred the recorded walk tothe computer.
We presented the different stimulus conditions in pseudorandom order andrecorded three walks per condition for each of 12 flies. As the animals didnot always walk toward the target after release into the arena, we defined amaximal trial duration of 2 min. If the fly had not reached the target duringthis time, we caught it and released it again at the rear of the recording area.
Video analysisFly position tracking and orientation calculations were conducted using the‘2D method’, as previously explained (Kress and Egelhaaf, 2012). In short,the centroid of the white marker points on the head and body of the blowflywere automatically tracked frame by frame by the open source softwareivTrace (http://opensource.cit-ec.de/projects/ivtools; Fig. 1B). Custom-written MATLAB scripts extracted the position and yaw orientation of thehead and body from the marker coordinates. Orientation data were obtainedfrom the vector orientation between the marker point coordinates (Fig. 1C)(Kress and Egelhaaf, 2012). Moreover, we estimated the retinal positions ofthe bar’s edges from the positions of the bar and the fly’s head orientation(Fig. 1C). The retinal position of the center of the bar was inferred from thebar edge positions.
Tracked marker coordinates were filtered with a Gaussian-like filter(window size, 35 ms; σ, 1) to reduce digital jitter. The orientation errors weregenerally smaller than 1 pixel (maximum 3 deg).
Marker positions differed only minimally between animals. Hence, theestimated orientations of head and body yaw of different individuals mightbe afflicted with an offset. We corrected these systematic differences byadding the difference angle between calculated orientation and actual headand body orientation in a reference image. The corrected angles were within±6 deg.
The 3D position of the head of the fly was determined by stereotriangulation of the head marker positions in the corresponding stereocamera images (Kress and Egelhaaf, 2012). We estimated the mean
RESEARCH ARTICLE The Journal of Experimental Biology (2014) doi:10.1242/jeb.097436
The
Jour
nal o
f Exp
erim
enta
l Bio
logy
reconstruction error to be 0.3 mm (one-tenth of the head width). Stride cycletiming (McNeill, 2003) was manually registered by monitoring thetouchdown time of the left mid leg.
AcknowledgementsWe thank R. Kern and J. P. Lindemann for comments on the manuscript and K.Runte for his help in data acquisition. In addition, we would like to thank ouranonymous reviewers for their extremely helpful comments and suggestions, aswell as P. Moeller-Reusch for editing the manuscript and P. Saunders for proofreading.
Competing interestsThe authors declare no competing financial interests.
Author contributionsD.K. designed the setup, executed the experiments and analyzed the data. D.K.and M.E. interpreted the data and wrote the paper.
FundingThe study was supported by the Human Frontier Science Program (HFSP) andDeutsche Forschungsgemeinschaft (DFG).
Supplementary materialSupplementary material available online athttp://jeb.biologists.org/lookup/suppl/doi:10.1242/jeb.097436/-/DC1
ReferencesAptekar, J. W., Shoemaker, P. A. and Frye, M. A. (2012). Figure tracking by flies is
supported by parallel visual streams. Curr. Biol. 22, 482-487. Bahl, A., Ammer, G., Schilling, T. and Borst, A. (2013). Object tracking in motion-
blind flies. Nat. Neurosci. 16, 730-738. Blaj, G. and van Hateren, J. H. (2004). Saccadic head and thorax movements in
freely walking blowflies. J. Comp. Physiol. A 190, 861-868.Boeddeker, N., Dittmar, L., Stürzl, W. and Egelhaaf, M. (2010). The fine structure of
honeybee head and body yaw movements in a homing task. Proc. R. Soc. B 277,1899-1906.
Borst, A. and Egelhaaf, M. (1989). Principles of visual motion detection. TrendsNeurosci. 12, 297-306.
Borst, A., Haag, J. and Reiff, D. F. (2010). Fly motion vision. Annu. Rev. Neurosci. 33,49-70.
Braun, E., Geurten, B. and Egelhaaf, M. (2010). Identifying prototypical componentsin behaviour using clustering algorithms. PLoS ONE 5, e9361.
Bülthoff, H., Götz, K. G. and Herre, M. (1982). Recurrent inversion of visualorientation in the walking fly, Drosophila melanogaster. J. Comp. Physiol. A 148,471-481.
Collett, T. and Zeil, J. (1996). Flights of learning. Curr. Dir. Psychol. Sci. 5, 149-155. Dahmen, H., Franz, M. O. and Krapp, H. G. (2001). Extracting egomotion from optic
flow: limits of accuracy and neural matched filters. In Motion Vision. Computational,Neural, and Ecological Constraints (ed. J. M. Zanker and J. Zeil), pp. 143-168.Berlin; Heidelberg: Springer Publishing House.
Egelhaaf, M. (1985a). On the neuronal basis of figure-ground discrimination by relativemotion in the visual system of the fly. I. Behavioural constraints imposed on theneuronal network and the role of the optomotor system. Biol. Cybern. 52, 123-140.
Egelhaaf, M. (1985b). On the neuronal basis of figure-ground discrimination by relativemotion in the visual system of the fly. II. Figure-detection cells, a new class of visualinterneurones. Biol. Cybern. 52, 195-209.
Egelhaaf, M. (1987). Dynamic properties of two control systems underlying visuallyguided turning in house-flies. J. Comp. Physiol. A 161, 777-783.
Egelhaaf, M. (2006). The neural computation of visual motion. In Invertebrate Vision(ed. E. Warrant and D.-E. Nilsson), pp. 399-461. Cambridge: Cambridge UniversityPress.
Egelhaaf, M. and Borst, A. (1989). Transient and steady-state response properties ofmovement detectors. J. Opt. Soc. Am. A 6, 116-127.
Egelhaaf, M., Boeddeker, N., Kern, R., Kurtz, R. and Lindemann, J. P. (2012).Spatial vision in insects is facilitated by shaping the dynamics of visual input throughbehavioral action. Front. Neural Circuits 6, 108.
Fox, J. L. and Frye, M. A. (2014). Figure-ground discrimination behavior inDrosophila. II. Visual influences on head movement behavior. J. Exp. Biol. 217, 570-579.
Fox, J. L., Aptekar, J. W., Zolotova, N. M., Shoemaker, P. A. and Frye, M. A. (2014).Figure-ground discrimination behavior in Drosophila. I. Spatial organization of wing-steering responses. J. Exp. Biol. 217, 558-569.
Gilbert, C. (1997). Visual control of cursorial prey pursuit by tiger beetles(Cicindelidae). J. Comp. Physiol. A 181, 217-230.
Götz, K. G. (1975). The optomotor equilibrium of the Drosophila navigation system. J.Comp. Physiol. A 99, 187-210.
Götz, K. G. (1980). Visual guidance in Drosophila. Basic Life Sci. 16, 391-407.Götz, K. G. and Wenking, H. (1973). Visual control of locomotion in the walking fruitfly
Drosophila. J. Comp. Physiol. A 85, 235-266. Haag, J., Wertz, A. and Borst, A. (2010). Central gating of fly optomotor response.
Proc. Natl. Acad. Sci. USA 107, 20104-20109.
Haikala, V., Joesch, M., Borst, A. and Mauss, A. S. (2013). Optogenetic control of flyoptomotor responses. J. Neurosci. 33, 13927-13934.
Hardie, R. C. (1979). Electrophysiological analysis of fly retina. I: Comparativeproperties of R1-6 and R 7 and 8. J. Comp. Physiol. A 129, 19-33.
Hausen, K. (1984). The lobula-complex of the fly: structure, function and significancein visual behaviour. In Photoreception and Vision in Invertebrates (ed. M. A. Ali), pp.523-559. New York, NY: Springer Publishing House.
Hengstenberg, R. (1991). Gaze control in the blowfly Calliphora: a multisensory, two-stage integration process. Seminars in Neuroscience 3, 19-29.
Hengstenberg, R. (1993). Multisensory control in insect oculomotor systems. Rev.Oculomot. Res. 5, 285-298.
Horn, E. (1978). The mechanism of object fixation and its relation to spontaneouspattern preferences in Drosophila melanogaster. Biol. Cybern. 31, 145-158.
Horn, E. (1982). Gravity reception in the walking fly, Calliphora erythrocephala: Tonicand modulatory influences of leg afferents on the head position. J. Insect Physiol.28, 713-721.
Horn, E. and Fischer, M. (1978). Fixation-sensitive areas in the eyes of the walking fly,Calliphora erythrocephala. Biol. Cybern. 31, 159-162.
Horn, E. and Lang, H.-G. (1978). Positional head reflexes and the role of the prosternalorgan in the walking fly, Calliphora erythrocephala. J. Comp. Physiol. A 126, 137-146.
Horn, E. and Mittag, J. (1980). Body movements and retinal pattern displacementswhile approaching a stationary object in the walking fly, Calliphora erythrocephala.Biol. Cybern. 39, 67-77.
Huston, S. J. and Krapp, H. G. (2008). Visuomotor transformation in the fly gazestabilization system. PLoS Biol. 6, e173.
Karmeier, K., van Hateren, J. H., Kern, R. and Egelhaaf, M. (2006). Encoding ofnaturalistic optic flow by a population of blowfly motion-sensitive neurons. J.Neurophysiol. 96, 1602-1614.
Kern, R. and Egelhaaf, M. (2000). Optomotor course control in flies with largelyasymmetric visual input. J. Comp. Physiol. A 186, 45-55.
Kern, R., van Hateren, J. H., Michaelis, C., Lindemann, J. P. and Egelhaaf, M.(2005). Function of a fly motion-sensitive neuron matches eye movements duringfree flight. PLoS Biol. 3, e171.
Kern, R., van Hateren, J. H. and Egelhaaf, M. (2006). Representation ofbehaviourally relevant information by blowfly motion-sensitive visual interneuronsrequires precise compensatory head movements. J. Exp. Biol. 209, 1251-1260.
Kimmerle, B. and Egelhaaf, M. (2000). Performance of fly visual interneurons duringobject fixation. J. Neurosci. 20, 6256-6266.
Kimmerle, B., Eickermann, J. and Egelhaaf, M. (2000). Object fixation by the blowflyduring tethered flight in a simulated three-dimensional environment. J. Exp. Biol.203, 1723-1732.
Koenderink, J. J. (1986). Optic flow. Vision Res. 26, 161-179. Krapp, H. G. (2000). Neuronal matched filters for optic flow processing in flying
insects. In Neuronal Processing of Optic Flow, International Review of Neurobiology,Vol. 44. (ed. M. Lappe), pp. 93-120. San Diego, CA: Academic Press.
Kress, D. and Egelhaaf, M. (2012). Head and body stabilization in blowflies walkingon differently structured substrates. J. Exp. Biol. 215, 1523-1532.
Land, M. F. (1973). Head movements of flies during visually guided flight. Nature 243,299-300.
Liang, P., Kern, R. and Egelhaaf, M. (2008). Motion adaptation enhances object-induced neural activity in three-dimensional virtual environment. J. Neurosci. 28,11328-11332.
Liang, P., Kern, R., Kurtz, R. and Egelhaaf, M. (2011). Impact of visual motionadaptation on neural responses to objects and its dependence on the temporalcharacteristics of optic flow. J. Neurophysiol. 105, 1825-1834.
Liang, P., Heitwerth, J., Kern, R., Kurtz, R. and Egelhaaf, M. (2012). Objectrepresentation and distance encoding in three-dimensional environments by a neuralcircuit in the visual system of the blowfly. J. Neurophysiol. 107, 3446-3457.
Longuet-Higgins, H. C. and Prazdny, K. (1980). The interpretation of a moving retinalimage. Proc. R. Soc. B 208, 385-397.
McNeill, R. A. (2003). Principles of Animal Locomotion. Princeton, NJ: PrincetonUniversity Press.
Mendes, C. S., Bartos, I., Akay, T., Márka, S. and Mann, R. S. (2013). Quantificationof gait parameters in freely walking wild type and sensory deprived Drosophilamelanogaster. eLife e00231.
Milde, J. and Strausfeld, N. (1986). Visuo-motor pathways in arthropods.Naturwissenschaften 73, 151-154.
Nalbach, G. and Hengstenberg, R. (1993). The halteres of the blowfly Calliphora. J.Comp. Physiol. A 175, 695-708.
Osorio, D., Srinivasan, M. V. and Pinter, R. B. (1990). What causes edge fixation inwalking flies? J. Exp. Biol. 149, 281-292.
Petrowitz, R., Dahmen, H., Egelhaaf, M. and Krapp, H. G. (2000). Arrangement ofoptical axes and spatial resolution in the compound eye of the female blowflyCalliphora. J. Comp. Physiol. A 186, 737-746.
Pick, B. (1976). Visual pattern discrimination as an element of the fly’s orientationbehaviour. Biol. Cybern. 23, 171-180.
Pollack, G. S. (1988). Selective attention in an insect auditory neuron. J. Neurosci. 8,2635-2639.
Prazdny, K. (1980). Egomotion and relative depth map from optical flow. Biol. Cybern.36, 87-102.
Preuss, T. and Hengstenberg, R. (1992). Structure and kinematics of the prosternalorgans and their influence on head position in the blowfly Calliphora erythrocephalaMeig. J. Comp. Physiol. A 171, 483-493.
Reichardt, W. (1973). Musterinduzierte flugorientierung. Naturwissenschaften 60, 122-138.
3219
RESEARCH ARTICLE The Journal of Experimental Biology (2014) doi:10.1242/jeb.097436
The
Jour
nal o
f Exp
erim
enta
l Bio
logy
3220
Reichardt, W. and Poggio, T. (1976). Visual control of orientation behaviour in the fly.Part I. A quantitative analysis. Q. Rev. Biophys. 9, 311-375, 428-438.
Sandeman, D. (1980a). Head movements in flies (Calliphora) produced by deflexion ofthe halteres. J. Exp. Biol. 85, 43-60.
Sandeman, D. (1980b). Angular acceleration, compensatory head movements and thehalteres of flies (Lucilia serricata). J. Comp. Physiol. A 136, 361-367.
Schilstra, C. and van Hateren, J. H. (1999). Blowfly flight and optic flow. I. Thoraxkinematics and flight dynamics. J. Exp. Biol. 202, 1481-1490.
Schuster, S., Strauss, R. and Götz, K. G. (2002). Virtual-reality techniques resolvethe visual cues used by fruit flies to evaluate object distances. Curr. Biol. 12, 1591-1594.
Schwyn, D. A., Heras, F. J. H., Bolliger, G., Parsons, M. M., Krapp, H. G. andTanaka, R. J. (2011). Interplay between feedback and feedforward control in fly gazestabilization. Proc. 18th IFAC World Congress 18, 9674-9679.
Strausfeld, N. J. and Seyan, H. S. (1985). Convergence of visual, haltere andprosternal inputs at neck motor neurons of Calliphora erythmocephala. Cell TissueRes. 240, 601-615.
Strauss, R. and Heisenberg, M. (1990). Coordination of legs during straight walkingand turning in Drosophila melanogaster. J. Comp. Physiol. A 167, 403-412.
Strauss, R., Schuster, S. and Götz, K. G. (1997). Processing of artificial visualfeedback in the walking fruit fly Drosophila melanogaster. J. Exp. Biol. 200, 1281-1296.
Straw, A. D., Rainsford, T. and O’Carroll, D. C. (2008). Contrast sensitivity of insectmotion detectors to natural images. J. Vis. 8, 32.
van Swinderen, B. (2005). The remote roots of consciousness in fruit-fly selectiveattention? Bioessays 27, 321-330.
Trischler, C., Kern, R. and Egelhaaf, M. (2010). Chasing behavior and optomotorfollowing in free-flying male blowflies: flight performance and interactions of theunderlying control systems. Front. Behav. Neurosci. 4, 20.
van Hateren, J. H. and Schilstra, C. (1999). Blowfly flight and optic flow. II. Headmovements during flight. J. Exp. Biol. 202, 1491-1500.
Virsik, R. P. and Reichardt, W. (1976). Detection and tracking of moving objects bythe fly Musca domestica. Biol. Cybern. 23, 83-98.
Warzecha, A. K., Kretzberg, J. and Egelhaaf, M. (2000). Reliability of a fly motion-sensitive neuron depends on stimulus parameters. J. Neurosci. 20, 8886-8896.
Wehrhahn, C. and Hausen, K. (1980). How is tracking and fixation accomplished inthe nervous system of the fly? Biol. Cybern. 38, 179-186.
Wertz, A., Haag, J. and Borst, A. (2012). Integration of binocular optic flow in cervicalneck motor neurons of the fly. J. Comp. Physiol. A 198, 655-668.
Wiederman, S. D. and O’Carroll, D. C. (2013). Selective attention in an insect visualneuron. Curr. Biol. 23, 156-161.
Zabala, F., Polidoro, P., Robie, A., Branson, K., Perona, P. and Dickinson, M. H.(2012). A simple strategy for detecting moving objects during locomotion revealed byanimal-robot interactions. Curr. Biol. 22, 1344-1350.
RESEARCH ARTICLE The Journal of Experimental Biology (2014) doi:10.1242/jeb.097436


![Optical(Coherence(Tomography:(Age(estimation(of(Calliphora ......Introduction(Pupae,)a)sedentary)and)long]lasting)stage)of)the)blowfly)lifecycle,)are)often)reported)at)crime)scenes)](https://img.pdfslide.us/doc/110x75/60b54e2575eeff0dad7cccb6/opticalcoherencetomographyageestimationofcalliphora-introductionpupaeasedentaryandlonglastingstageoftheblowflylifecycleareoftenreportedatcrimescenes.jpg)